the Creative Commons Attribution 4.0 License.
the Creative Commons Attribution 4.0 License.
Validation of GEMS tropospheric NO2 columns and their diurnal variation with ground-based DOAS measurements
Kezia Lange
Andreas Richter
Tim Bösch
Bianca Zilker
Miriam Latsch
Lisa K. Behrens
Chisom M. Okafor
Hartmut Bösch
John P. Burrows
Alexis Merlaud
Gaia Pinardi
Caroline Fayt
Martina M. Friedrich
Ermioni Dimitropoulou
Michel Van Roozendael
Steffen Ziegler
Simona Ripperger-Lukosiunaite
Leon Kuhn
Bianca Lauster
Thomas Wagner
Hyunkee Hong
Donghee Kim
Lim-Seok Chang
Kangho Bae
Chang-Keun Song
Jong-Uk Park
Hanlim Lee
Instruments for air quality observations on geostationary satellites provide multiple observations per day and allow for the analysis of the diurnal variation in important air pollutants such as nitrogen dioxide (NO2). The South Korean instrument GEMS (Geostationary Environmental Monitoring Spectrometer), launched in February 2020, is the first geostationary instrument that is able to observe the diurnal variation in NO2. The measurements have a spatial resolution of 3.5 km × 8 km and cover a large part of Asia.
This study compares 1 year of tropospheric NO2 vertical column density (VCD) observations from the operational GEMS L2 product, the scientific GEMS IUP-UB (Institute of Environmental Physics at the University of Bremen) product, the operational TROPOspheric Monitoring Instrument (TROPOMI) product, and ground-based differential optical absorption spectroscopy (DOAS) measurements in South Korea. The GEMS L2 tropospheric NO2 VCDs overestimate the ground-based tropospheric NO2 VCDs with a median relative difference of +61 % and a correlation coefficient of 0.76. The median relative difference is −2 % for the GEMS IUP-UB product and −16 % for the TROPOMI product, with correlation coefficients of 0.83 and 0.89, respectively. The scatter in the GEMS products can be reduced when observations are limited to the TROPOMI overpass time.
Diurnal variations in tropospheric NO2 VCDs differ by the pollution level of the analyzed site but with good agreement between the GEMS IUP-UB and ground-based observations. Low-pollution sites show weak or almost no diurnal variation. In summer, the polluted sites show a minimum around noon, indicating the large influence of photochemical loss. Most variation is seen in spring and autumn, with increasing NO2 in the morning, a maximum close to noon, and a decrease towards the afternoon. Winter observations show rather flat or slightly decreasing NO2 throughout the day. Winter observations under low-wind-speed conditions at high-pollution sites show enhancements of NO2 throughout the day. This indicates that under calm conditions, dilution and the less effective chemical loss in winter do not balance the accumulating emissions. Diurnal variation observed at a low-pollution site follows seasonal wind patterns.
A weekday–weekend effect analysis shows good agreement between the different products. However, the GEMS L2 product, while agreeing with the other data sets on weekdays, shows significantly less reduction on weekends.
The influence of the stratospheric contribution and the surface reflectivity product on the satellite tropospheric NO2 VCD products is investigated. While the TM5 model's stratospheric VCDs, used in the TROPOMI product, are too high, resulting in tropospheric NO2 VCDs that are too low and even negative, when used in the GEMS IUP-UB retrieval, the GEMS L2 stratospheric VCD is too low. Surface reflectivity comparisons indicate that the GEMS L2 reflectivity makes a large contribution to the observed overestimation and scatter.
- Article
(18760 KB) - Full-text XML
- BibTeX
- EndNote
Nitrogen oxides, in particular nitrogen monoxide (NO) and nitrogen dioxide (NO2), collectively referred to as NOx, are among the most important air pollutants and strongly impact tropospheric chemistry. NOx is emitted into the atmosphere by natural sources such as lightning and soil microbial processes, but the primary source is anthropogenic activities. Anthropogenic emissions result from fossil fuel combustion, mainly for transportation, the industry and energy sectors, and residential heating (Seinfeld and Pandis, 2006; Wallace and Hobbs, 2006). High concentrations of NOx are a health hazard and of growing importance for environmental legislation, since most anthropogenic sources are concentrated in urban areas with high population densities (Faustini et al., 2014).
Tropospheric NOx is mainly emitted as NO, which is rapidly converted to NO2 by reaction with tropospheric ozone (O3). Due to their short atmospheric lifetimes, on the order of a few hours in the boundary layer during the daytime (Beirle et al., 2011), and the heterogeneous distribution of sources and variations in meteorological conditions, tropospheric NO2 shows high spatial and temporal variability. Monitoring and understanding this variability are necessary to better understand the contributions of emissions, tropospheric chemistry, and transport effects, especially in urban areas with large and heterogeneous NOx sources combined with high population densities.
To resolve this spatial and temporal variation in tropospheric NO2, measurements with good spatial and temporal resolution are needed. NO2 can be remotely observed using the DOAS (differential optical absorption spectroscopy) technique (Platt and Perner, 1980). DOAS measurements of NO2 have been performed from different platforms, including ground-based stations; moving platforms such as cars, ships, or aircraft; and environmental satellites, with advantages and disadvantages regarding spatial and temporal resolution.
Stationary ground-based instruments such as multi-axis DOAS (MAX-DOAS; see, for example, Hönninger et al., 2004; Wittrock et al., 2004; Herman et al., 2009) provide several observations of NO2 column densities per hour at a given location. These data sets are commonly continuous and are valuable for the validation of satellite data products, among other applications (e.g., Pinardi et al., 2020; Verhoelst et al., 2021).
Mobile car DOAS measurements enable the observation of the spatial distribution in addition to its temporal evolution and are an additional valuable source for the validation of satellite trace gas data products (e.g., Wagner et al., 2010). They fill a gap between stationary ground-based and satellite observations by mapping the variability within the satellite pixel and quantifying errors for satellite and stationary ground-based comparisons.
The advantage of measurements from environmental satellites in polar sun-synchronous low earth orbit (LEO) is that they can provide global coverage. The spatial resolution of satellite observations making use of the DOAS method has increased strongly since the first mission using the method, from a ground footprint of 320 km × 40 km for the Global Ozone Monitoring Experiment (GOME) in 1995 (Burrows et al., 1999) to the recent TROPOspheric Monitoring Instrument (TROPOMI) with a spatial resolution of 5.5 km × 3.5 km (Veefkind et al., 2012). TROPOMI measurements offer the possibility of deconvolving sources of NOx, such as individual power plants, and of quantifying their emissions (e.g., Beirle et al., 2019a). Satellite measurements also enable the seasonal variations in NO2 to be observed globally. This has been done, for example, using SCIAMACHY (Bovensmann et al., 1999) observations to disentangle the sources of NOx (van der A et al., 2008) or using TROPOMI observations to analyze the seasonality of NOx emissions and lifetimes (Lorente et al., 2019; Lange et al., 2022).
Instruments in low earth orbits usually provide at best only one measurement per day and location in low and middle latitudes. Combining observations from several satellites with different overpass times provides some information about the diurnal variation in NO2. Several studies have applied this method, based on the morning overpasses of the SCIAMACHY or GOME-2 (Munro et al., 2006) instrument and the early-afternoon observation of the Ozone Monitoring Instrument (OMI; Levelt et al., 2006); see, for example, Boersma et al. (2008, 2009) and Penn and Holloway (2020). Boersma et al. (2008) used SCIAMACHY and OMI observations to estimate the diurnal variation in NO2. Over urban regions, they found up to 40 % reduced NO2 columns in the OMI afternoon overpass compared to the SCIAMACHY morning overpass. They explained this by photochemical loss, modulated by the diurnal cycle of anthropogenic emissions. Over biomass burning regions, they detected an increase from the morning to the afternoon overpass, which is consistent with fire counts from the geostationary satellites. Analyzing the differences between SCIAMACHY and OMI tropospheric NO2 columns from Israeli cities, Boersma et al. (2009) found again a 40 % reduction for NO2 columns in the afternoon compared to the morning overpass during summer and nearly no differences in winter with only slightly higher NO2 in the afternoon. Penn and Holloway (2020) found around 1.5–2 times higher NO2 columns for the morning compared to the afternoon overpass for large urban areas in the USA using GOME-2 and OMI observations.
To analyze the diurnal variation in NOx in more detail, remote sensing instruments on satellites in geostationary orbit are essential (Burrows et al., 2004). The South Korean instrument GEMS (Geostationary Environmental Monitoring Spectrometer; Kim et al., 2020) was launched in February 2020 and is the first instrument in geostationary orbit from which hourly daytime air quality data products, including NO2, are retrieved. Positioned over the Equator at a longitude of 128.2° E, GEMS takes measurements with a spatial resolution of about 3.5 km × 8 km over a large part of Asia. With up to 10 observations per day, GEMS data products offer a unique opportunity to investigate the diurnal variation in NO2 and other trace gases. NASA's TEMPO (Zoogman et al., 2017) launched in April 2023 and ESA's Sentinel-4 (Ingmann et al., 2012) planned for launch in summer 2025 will provide similar observations over North America and Europe, respectively.
A study by Kim et al. (2023) evaluated GEMS L2 v1.0 total NO2 vertical column density (VCD) from November 2020 to January 2021 with four ground-based Pandora instruments, all located in Seosan, South Korea. They found correlation coefficients of 0.62–0.78 and an underestimation of the ground-based NO2 measurements by the GEMS data set. Even though these four sites are relatively close together, they show different diurnal variations in NO2, indicating that local transport or emissions have a significant influence. Zhang et al. (2023) evaluated their scientific POMINO–GEMS tropospheric NO2 VCD product with nine ground-based MAX-DOAS sites based on data from June–August 2021. The POMINO–GEMS product shows a modest correlation of 0.66 with the MAX-DOAS observations and reasonable agreement between the diurnal variations in the two data products but cannot achieve the much better correlation of 0.83 of the POMINO–TROPOMI product and the MAX-DOAS observations. Oak et al. (2024) showed that the main reason for differences between the operational GEMS L2 v2.0 and the operational TROPOMI NO2 product is the incorrect use of the vertical coordinates in the NO2 profiles for the GEMS air mass factor (AMF) computation. GEMS and TROPOMI products, both based on the same NO2 vertical profile shapes, are in close agreement. Drivers of the diurnal variation in NO2 observed by GEMS during winter and summer over Beijing and Seoul have been investigated by Yang et al. (2024). They used their own AMF and based their analysis on total NO2 VCDs. With this, they found good agreement between the diurnal variations in total NO2 VCDs in Pandora, GEMS, and GEOS-Chem. They used GEOS-Chem to interpret the observed variations and found that due to high emissions at the two urban sites, NO2 accumulates throughout the day, which is offset by losses from chemistry and transport depending on the season and wind speed. Edwards et al. (2024) used the GEMS L2 v2.0 tropospheric NO2 VCD retrieval in combination with a chemical transport model to examine the NO2 diurnal variation. Similarly to Yang et al. (2024), they indicate different drivers for the diurnal variation on regional and local scales. Additionally, the model simulations show a high sensitivity to the assumed diurnal emission profile, especially on the local scale. A detailed analysis of the impacts from diverse chemical transport model simulations and different underlying NOx emissions on the GEMS NO2 product has been conducted by Seo et al. (2024).
In this study, 1 year of tropospheric NO2 VCDs from the operational GEMS L2 v2.0 product, the scientific GEMS IUP-UB (Institute of Environmental Physics at the University of Bremen) v1.0 product, the operational TROPOMI product, and 11 ground-based DOAS instruments in South Korea are compared. Evaluating the GEMS tropospheric NO2 VCD is important to assess and quantify its accuracy for use in surface concentration and emissions applications (e.g., Xu et al., 2023; Q. Yang et al., 2023). The 11 ground-based observation sites are located in different pollution regimes in South Korea, which provides the opportunity to observe and analyze different diurnal variations in NO2. Including the TROPOMI product in the comparisons adds an already well-validated reference data set around noon. ECMWF reanalysis v5 (ERA5) wind data at 10 m altitude give valuable insights into the influence of transport effects on the diurnal variation. Using a full year of data allows us to analyze the influence of seasonality and the weekday–weekend effect on the GEMS tropospheric NO2 VCD. The scientific GEMS IUP-UB NO2 retrieval gives the possibility of changing a priori assumptions such as the surface reflectivity and investigating their influence. Also the influence of different stratospheric corrections on the tropospheric NO2 products is investigated.
The instruments and data sets included in this study are described in Sect. 2. After a first comparison of 1 month of averaged GEMS L2 v2.0, GEMS IUP-UB v1.0, and TROPOMI v02.04.00 tropospheric NO2 VCD maps in Sect. 3, 1 year of satellite tropospheric NO2 VCDs is evaluated by comparisons with the tropospheric NO2 VCD data set of the ground-based network distributed within South Korea (see Sect. 4.2) and car DOAS observations (see Sect. 4.3). In Sect. 5 the diurnal variations in the GEMS IUP-UB NO2 VCDs and the ground-based observations are analyzed. Factors such as seasonality, wind speed, transport processes, and the weekday–weekend effect that influence the tropospheric NO2 VCD are investigated to better understand the origin of the observed diurnal variations. Possible reasons for deviations between GEMS and ground-based observations, such as the stratospheric correction, the surface reflectivity, and viewing geometry, are discussed in Sect. 5.4. A summary and conclusions are provided in Sect. 6.
In this study, data from two measurement campaigns in South Korea are used: the GEMS Map of Air Pollution (GMAP) 2021 and the Satellite Integrated Joint Monitoring of Air Quality (SIJAQ) 2022 campaigns (https://www.sijaq.org, last access: 23 October 2024). The main campaign periods took place from October 2021 to November 2021 and May 2022 to August 2022. Some instruments were also operated between the main campaign periods and beyond. Analyses of this study focus on measurements taken between October 2021 and October 2022. One key aspect of these campaigns was to gather measurements for the validation and improvement of GEMS data to better understand uncertainties and error sources in the satellite products, to support further improvement of the satellite retrieval algorithms, and to apply GEMS data for the characterization of air pollution.
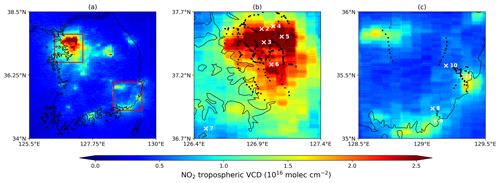
Figure 1Maps of monthly mean NO2 tropospheric VCDs for South Korea. Panel (a) shows GEMS IUP-UB v1.0 observations in October 2021 around 13:45 Korean standard time (KST) (04:45 UTC). Panel (b) is zoomed in to the Seoul Metropolitan Area (SMA), indicated by the upper red rectangle in panel (a). Panel (c) is zoomed into the southeast, indicated by the lower red rectangle in panel (a). The white crosses show the locations of the ground-based measurement sites. The different instruments are listed together with the number given in Table 1. Black dots indicate locations of car DOAS observations used for GEMS validation.
Table 1List of instruments included in this study with location, observation geometry, VCD retrieval information, and period of observation. The MAX-DOAS BIRA Seoul (4) and MAX-DOAS BIRA Suwon (6) sites use the same instrument, which was moved from Suwon to Seoul in December 2021. See the main text for the definition of abbreviations.
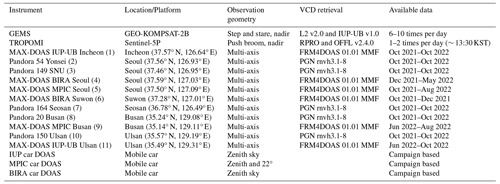
Instruments from several teams participated in the campaigns. Measurements were delivered by stationary MAX-DOAS and Pandora instruments, as well as mobile car DOAS instruments. More details about the different instruments are provided below in Sect. 2.3 and 2.4. During the GMAP 2021 campaign, measurements were focused on the Seoul Metropolitan Area (SMA); with a population of 26 million, it is one of the largest and most polluted metropolitan regions worldwide. During the SIJAQ 2022 campaign, measurements were additionally performed in the southern part of South Korea. This region includes Busan, the second largest city in South Korea, and Ulsan, an important industrial center. Figure 1 shows GEMS observations of tropospheric NO2 VCDs over South Korea, indicating several pollution hot spots and the locations of the stationary instruments. The combination of stationary and mobile measurements makes a comprehensive validation of GEMS data possible. The stationary MAX-DOAS measurements are located in different pollution regimes and provide daily measurements with a high temporal resolution but are restricted in spatial coverage to the area around the site where each instrument is located. The car DOAS measurements lack temporal resolution but are operated such that they make measurements within several satellite ground pixels in different regions. This enables a variety of pollution levels and thus air quality conditions to be investigated. Table 1 lists all the instruments involved in this study.
2.1 Geostationary Environmental Monitoring Spectrometer (GEMS)
GEMS is a step-and-stare UV–visible imaging spectrometer on board the satellite GK-2B (Geostationary Korea Multi-Purpose Satellite 2B, also shortened to GEO-KOMPSAT-2B), launched into geostationary orbit on 18 February 2020. It is the first geostationary mission to monitor air quality hourly during the daytime. With its location at a longitude of 128.2° E over the Equator, GEMS covers a large part of Asia (5–45° S and 75–145° E). The ground pixels have a nominal resolution of approximately 3.5 km × 8 km over Seoul. GEMS is operated in four scan modes and allows up to 10 observations per day over the eastern part of the covered area, which includes South Korea. Due to shorter days, the number of possible observations is reduced to eight in March and October and is further limited to a maximum of six observations in winter. The GEMS spectrometer covers the wavelength range of 300–500 nm and has a spectral resolution of 0.6 nm. The measurements yield column amounts of O3, NO2, SO2, HCHO, and CHOCHO and also aerosol and cloud information (Kim et al., 2020). We use the tropospheric NO2 VCD of the operational GEMS L2 v2.0 product and the scientific GEMS IUP-UB v1.0 product, which are described below.
2.1.1 Operational GEMS L2 tropospheric NO2 VCD product v2.0
The operational GEMS L2 tropospheric NO2 VCD product v2.0 was reprocessed for the entire mission and is distributed by the National Institute of Environmental Research (NIER, 2024). Data are available from 2021 onwards. GEMS irradiance data are wavelength-calibrated using the pre-launch spectral response function. A single wavelength calibration is applied across all rows. NO2 slant column densities (SCDs) are retrieved from Level 1 spectra using a DOAS fit in the fitting window of 432–450 nm. Using a lookup table of altitude-dependent AMFs and model-based vertical profile shapes, the NO2 SCDs are converted into NO2 VCDs. In v2.0, the WRF-Chem + CAM-Chem model used in v1.0 (Lee et al., 2020) was replaced with the GEOS-Chem model, which has a spatial resolution of 0.25° × 0.3125°. The altitude-dependent AMFs from the radiative transfer model VLIDORT (Spurr, 2006) are tabulated as a function of the solar zenith angle (SZA), the viewing zenith angle (VZA), the relative azimuth angle (RAA), surface albedo, terrain height, temperature and pressure profiles, and aerosol parameters. The aerosol optical depth (AOD), the single-scattering albedo (SSA), and the aerosol layer height (ALH) are taken from GEMS L2 data. Since v2.0, the surface albedo has been based on GEMS L2 surface reflectance data instead of the OMI climatology. The cloud correction of the AMF uses a linear combination of a clear-sky and a cloudy AMF, weighted by the cloud radiance fraction. The separation of the total NO2 VCD into its stratospheric and tropospheric parts is based on Bucsela et al. (2013), using GEOS-Chem model data for the tropospheric NO2 column a priori and to mask high-pollution regions.
To remove problematic retrievals and cloudy scenes, we use only GEMS data with a final algorithm flag of 0 and a cloud fraction < 0.3. The product provides the “root_mean_square_error” resulting from the NO2 fit but does not include errors from other retrieval aspects. Therefore, we estimate the tropospheric NO2 VCD error based on the assessment done for the TROPOMI product with a typical value over continental polluted areas of ±25 %, which is dominated by the uncertainties in the AMF calculation (van Geffen et al., 2022).
2.1.2 Scientific GEMS IUP-UB tropospheric NO2 VCD product v1.0
As part of the preparation for the European geostationary instrument on the satellite Sentinel-4, a scientific GEMS NO2 product has been developed at the Institute of Environmental Physics at the University of Bremen (IUP-UB). The GEMS L1 spectra are analyzed using the DOAS technique in a larger fitting window from 405–485 nm, and in comparison to the operational GEMS L2 product, data are corrected for instrument polarization sensitivity and scene inhomogeneity and are de-striped. This results in less noise and a reduction in scatter, and it improves the consistency with other products (TROPOMI, GOME-2) using similarly large fitting windows. The retrieved SCDs are corrected for the stratospheric contribution based on the STRatospheric Estimation Algorithm from Mainz (STREAM; Beirle et al., 2016). Tropospheric SCDs are converted into tropospheric VCDs with NO2 a priori profile shapes from the TM5 chemical transport model (Williams et al., 2017) and a lookup table of altitude-dependent AMFs computed with the radiative transfer model SCIATRAN (Rozanov et al., 2014). The TM5 model has a spatial resolution of 1° × 1°. The altitude-dependent AMFs are tabulated as a function of SZA, VZA, RAA, surface albedo, and surface height. The surface albedo is based on the TROPOMI Lambertian equivalent reflectivity (LER) climatology (Tilstra et al., 2024). To evaluate the influence of the surface albedo, an additional version was created using the GEMS L2 surface reflectance data. The AMF cloud correction is based on the independent pixel approximation and uses recalculated cloud fractions and the cloud pressure from the GEMS L2 cloud product. The cloud fractions were computed from recalculated GEMS top-of-atmosphere (TOA) reflectances based on GEMS radiances and recalibrated irradiances by comparison with TOA reflectances modeled by SCIATRAN. In the current version of the algorithm, no aerosol correction is included. More details about the scientific GEMS IUP-UB tropospheric NO2 v1.0 retrieval will be provided in an upcoming publication by Richter et al. (2024).
Problematic retrievals and cloudy scenes with cloud radiance fractions of more than 50 % are removed using only observations with a quality assurance value (qa_value) above 0.75. The quality flagging system is similar to that used in the operational TROPOMI product. However, the GEMS IUP-UB product does not yet have full error propagation and contains the variable “nitrogendioxide_tropospheric_vertical_column_density_uncertainty_random”, which, as in the operational product, only contains the random error from the fit. The tropospheric NO2 VCD error is estimated based on the same ±25 % assumption.
2.2 TROPOspheric Monitoring Instrument (TROPOMI)
TROPOMI is a hyperspectral imaging spectrometer on board the sun-synchronous near-polar-orbiting satellite Sentinel-5P (S5P), launched in October 2017 (Veefkind et al., 2012). With its measurements in the UV, visible, and IR spectral regions, TROPOMI can monitor several atmospheric trace gases as well as clouds and aerosols. We use the tropospheric NO2 VCD product retrieved from measurements in the visible channel (400–496 nm). The ground pixel sizes are approximately 3.5 km × 5.5 km in the middle of the swath. With orbit times of around 100 min and a wide swath of approximately 2600 km, TROPOMI has nearly global coverage and usually one to two overpasses per day in the mid-latitudes. Over the campaign region, TROPOMI provides observations between 12:28 and 14:40 Korean standard time (KST).
2.2.1 TROPOMI tropospheric NO2 VCD product v02.04.00
The latest TROPOMI tropospheric NO2 product, reprocessed for the entire mission, uses processor version 02.04.00. The v02.04.00 product was generated operationally from 17 June 2022 to 12 March 2023. We are using the offline (OFFL) as well as the reprocessed (RPRO) data of this version, which are freely available (Copernicus Sentinel-5P, 2021). The subsequent processor versions had only minor bug fixes and have not yet been applied to the full data set (Eskes and Eichmann, 2023). The Level 1b version 2.1 spectra are analyzed with the DOAS technique in a fitting window of 405–465 nm to retrieve NO2 SCDs. The retrieved SCDs are separated into their stratospheric and tropospheric parts with NO2 vertical profile information from the 1° × 1° TM5 global chemistry transport model and a data assimilation system that assimilates TROPOMI SCDs. Using a lookup table of altitude-dependent AMFs and actual daily TM5 NO2 vertical profile shapes, the resulting tropospheric SCDs are converted into tropospheric VCDs. The altitude-dependent AMFs are a function of SZA, VZA, RAA, surface albedo, surface pressure, and (mid-level) atmospheric pressure. Since v02.04.00, the surface albedo in the NO2 spectral fitting window and in the cloud pressure retrieval has been based on the TROPOMI directionally dependent LER (DLER) climatology (Tilstra et al., 2024). The cloud radiance fraction is retrieved from the NO2 spectral region at 440 nm. The cloud pressure retrieval is based on the FRESCO-wide algorithm in the NIR spectral range. In the AMF, both clouds and, indirectly, aerosol loads are accounted for using a linear combination of a clear-sky and a cloudy AMF, weighted by the cloud radiance fraction (van Geffen et al., 2022).
To remove problematic retrievals, we are using only observations with the recommended qa_value above 0.75. This also removes scenes with cloud radiance fractions in the NO2 window of more than 50 % (Eskes and Eichmann, 2023). The TROPOMI NO2 product contains the data field “nitrogendioxide_tropospheric_column_precision”, which provides the error estimate originating from the NO2 fit and other retrieval aspects that are dominated by the uncertainty in the tropospheric AMF of 25 %.
2.3 MAX-DOAS observations and data sets
The satellite tropospheric NO2 VCDs are compared to co-located MAX-DOAS tropospheric NO2 VCDs. We use data from MAX-DOAS instruments at six sites in South Korea. Four sites were located in the northern campaign region and two in the southeastern campaign region (see Table 1). Not all of them were operated over the whole year of measurements. The data availability for the satellite validation can be seen in the Appendix, Fig. A8. The ground-based MAX-DOAS instruments measure the UV–visible scattered sunlight in several azimuthal directions and at several elevations. The tropospheric NO2 VCDs used in this study were retrieved by applying the Mexican MAX-DOAS Fit (MMF; Friedrich et al., 2019) inversion algorithm using the FRM4DOAS (v01.01, https://frm4doas.aeronomie.be/, last access: 23 October 2024) settings and setup (Hendrick et al., 2016). The product is quality-filtered using only data with a recommended “qa_flag_no2” of 0 or 1. This quality flag additionally uses the Mainz profile algorithm (MAPA; Beirle et al., 2019b) data in the quality check. Details about the implemented algorithms and quality flagging approaches will be provided in an upcoming publication by Van Roozendael et al. (2024). To ensure comparability between the MAX-DOAS instruments from different institutes, an intercomparison period was conducted at the beginning of the campaign. During this period, all instruments, except for the MAX-DOAS IUP-UB Ulsan, were operated at the same location. The comparisons show very good correlations between the instruments. The intercomparison results are presented in Van Roozendael et al. (2024).
The Pandonia Global Network (PGN; https://www.pandonia-global-network.org, last access: 23 October 2024) is a network of ground-based UV–visible spectrometers called Pandora, which focuses on total column observations from direct sun measurements but also provides tropospheric column observations when operated in multi-axis mode. We use data from the five Pandora instruments located in South Korea that are operated in multi-axis mode. Three of them are located in the northern campaign region, and two are in the southeastern region. Data are processed as part of the PGN (Pandonia Global Network, 2023). All data are retrieved by the processor version 1.8 and retrieval version nvh3. We filter out data which are flagged as unusable (20, 21, and 22) and additionally those with wrms (normalized rms of fitting residuals weighted with independent uncertainty) larger than 0.002. Details on the retrieval of the tropospheric NO2 VCD and the respective uncertainty can be found in Cede (2021).
2.4 Car DOAS instruments and data sets
During the GMAP 2021 and SIJAQ 2022 main campaign periods, mobile car DOAS measurements were performed by instruments of the IUP-UB, the Max Planck Institute for Chemistry in Mainz (MPIC), and the Royal Belgian Institute for Space Aeronomy (BIRA). To achieve high spatial resolution over the covered area, the majority of measurements were taken in zenith-sky geometry with some off-zenith measurements. Instruments were operated in both campaign regions and were synchronized to the GEMS schedule to cover several GEMS observations throughout the day. Compared to the stationary data, the car measurements have the advantage of covering larger and more diverse areas. The car DOAS data analysis was done independently by the operating institutes. More details about the car DOAS instruments and the tropospheric NO2 VCD retrieval can be found in Lange et al. (2023).
Before comparing the satellite tropospheric NO2 VCD products with ground-based measurements, an assessment of the three products based on maps of monthly averaged tropospheric NO2 VCDs provides a first assessment of the differences between the two GEMS NO2 products and the TROPOMI product. Figure 2 shows maps of the tropospheric NO2 VCDs for South Korea from GEMS L2 v2.0 (Fig. 2a), GEMS IUP-UB v1.0 (Fig. 2b), and TROPOMI v02.04.00 (Fig. 2c) observations in October 2021. For better comparison, the two GEMS data sets are averaged only for the 13:45 KST (04:45 UTC) observation, which is close to the TROPOMI overpass between 12:28 and 14:37 KST. Data are sampled at 0.01° resolution. As the AMF of the GEMS L2 v2.0 NO2 product is not interpolated in space, the map of the tropospheric NO2 VCDs (Fig. 2a) shows box structures with boxes of the same size as the spatial resolution of the GEOS-Chem model.

Figure 2Maps of NO2 tropospheric VCD for South Korea from GEMS L2 v2.0 (a), GEMS IUP-UB v1.0 (b), and TROPOMI v02.04.00 (c) observations in October 2021. The GEMS data sets are averaged for the 13:45 KST (04:45 UTC) observation close to the TROPOMI overpass. All data sets are cloud- and quality-filtered.
All three maps show elevated NO2 concentrations centered over the SMA and several smaller elevated-NO2 regions with Danyang County, including Jecheon and a mining area in the mid-north; Donghae on the east coast; Gwangyang in the south; and Daegu, Pohang, Ulsan, and Busan in the southeast. These regions of elevated NO2 show the highest values in the GEMS L2 tropospheric NO2 VCD product, especially over the SMA, followed by the GEMS IUP-UB product and with the lowest values in the TROPOMI product. Additionally, we note that the background NO2 is similar in the TROPOMI and GEMS IUP-UB products but significantly higher in the GEMS L2 product. This difference in the background NO2 can be caused by the different stratospheric corrections used in the three products (GEOS-Chem with GEMS data assimilation, STREAM, and TM5 with TROPOMI data assimilation). These are discussed further in Sect. 5.4. The influence of the stratospheric correction is visible most prominently in the evaluation with the ground-based data for stations located in low-pollution regions such as Pandora Ulsan, which is located at the Ulsan National Institute of Science and Technology, several kilometers outside the city and industrial area of Ulsan, or Pandora Seosan (instruments 10 and 7; see Fig. 1). The map of the TROPOMI NO2 product appears the most smoothed, caused by the orbital cycle of 16 d and the resulting oversampling. Since GEMS maintains a constant ground pixel pattern for each of the four scan modes, there is no oversampling and smoothing, which makes the sampling pattern visible in the GEMS averages. Missing data in the GEMS L2 v2.0 NO2 product, mainly visible in coastal regions, are caused by the product's quality filter.
4.1 Co-location criteria – method
Stationary ground-based tropospheric NO2 VCDs are averaged within ±20 min of the satellite overpass and compared to the closest satellite pixels extracted within a radius of 5 km around the station sites. Other criteria for co-location were tested, e.g., including larger areas, area averaging, and considering the ground-based instruments' viewing azimuth angle (VAA) during the satellite overpass. Some of the results are shown in Fig. A3 in the Appendix. The results are either slightly worse or not significantly better than the nearest-pixel approach. This is in contrast to Dimitropoulou et al. (2020), who showed significant improvements in slope and correlation when considering the directional dependency for a comparison of TROPOMI and MAX-DOAS observations in Uccle, Belgium. Therefore, further investigations into why the comparisons in South Korea behave differently are required. All linear regression statistics in this study are calculated with orthogonal distance regression (ODR) to take into account the error in both evaluated and reference measurements. The correlation between the evaluated and reference measurements is described by the Pearson correlation coefficient (r). Additionally, the median relative difference (mrd) is calculated by the following convention:
The evaluated measurements are the satellite tropospheric NO2 VCDs. The reference measurements are either the stationary ground-based or the mobile car DOAS tropospheric NO2 VCDs in Sect. 4.3.
4.2 Evaluating satellite tropospheric NO2 VCD with MAX-DOAS and Pandora
The large data set of ground-based instruments distributed in South Korea is used to evaluate the satellite tropospheric NO2 VCD product. Scatterplots of all coincident satellite and stationary ground-based measurements are shown in Fig. 3 for the GEMS L2 (Fig. 3a), the GEMS IUP-UB (Fig. 3b), and the TROPOMI (Fig. 3c) NO2 tropospheric VCD products. Since all 6–10 observations per day are considered in the comparisons of the GEMS products to the ground-based data set, there are 8388 coincident measurements for the GEMS L2 and 12 959 for the GEMS IUP-UB product, which are many more than the 1703 for the TROPOMI product. A comparison limited to the TROPOMI overpass time between 12:28 and 14:37 KST is shown in the Appendix, Fig. A1. The difference in the number of coincident measurements between the GEMS L2 and the GEMS IUP-UB product is mainly caused by the stricter quality filter of the GEMS L2 product. Limiting the filter processing of the GEMS L2 product to the cloud filter only results in a more comparable number of data points.

Figure 3Scatterplots of GEMS L2 (a), GEMS IUP-UB (b), and TROPOMI (c) NO2 tropospheric VCDs vs. co-located ground-based NO2 tropospheric VCDs. The ground-based observations are considered co-located if they are taken within ±20 min of the satellite observation. Measurements within this period are averaged and matched to the closest satellite observation within a radius of 5 km around the station site. The error bars represent the tropospheric NO2 VCD error. Points are colored according to the corresponding ground-based instrument. The dashed gray line indicates the 1 : 1 line. The solid black line represents the orthogonal distance regression.
The GEMS L2 and ground-based tropospheric NO2 VCDs have a Pearson correlation coefficient of r = 0.76, with a slope of 1.28, a median relative bias of +61 %, and an offset of 2.28×10¹⁵ molec. cm−2. This overestimation is in contrast to the underestimation visible in the GEMS IUP-UB and TROPOMI NO2 products. Potential explanations for this different bias, such as the surface reflectivity used for the AMF determination, the stratospheric correction, and the consideration of aerosol parameters, are further discussed in Sect. 5.4. The GEMS IUP-UB product and the TROPOMI product show a slight underestimation, with slopes of 0.80 and 0.79, respectively, and a median bias of −2 % and −16 %, respectively. A similar magnitude of underestimation of satellite tropospheric NO2 VCDs relative to ground-based observations has been observed in many validation studies for satellite data sets (e.g., Ma et al., 2013; Verhoelst et al., 2021) and is often explained by local NO2 hot spots that are not resolved in the satellite data and the a priori fields used for the AMF calculations. Another reason is the missing aerosol correction in these satellite products. When binning the median relative differences in the GEMS IUP-UB and MAX-DOAS comparison by the AOD, determined in the FRM4DOAS MAX-DOAS analysis, an increasing bias is observed with an increase in the AOD (see the Appendix, Fig. A2). This was similarly observed for a comparison of tropospheric NO2 VCDs of MAX-DOAS and TROPOMI (Lambert et al., 2023).
The GEMS IUP-UB product, considering all observations per day, has a good correlation with a coefficient of 0.83 but is more scattered than the TROPOMI product, which is limited to its noon observation time. To investigate whether the better correlation of the TROPOMI product is attributed to the data themselves or to the timing of the satellite overpass, all data sets were limited to the period corresponding to TROPOMI overpasses; see the Appendix, Fig. A1. For both the GEMS L2 and the GEMS IUP-UB product, the time limit increases the slope and median bias slightly and reduces the scatter. This indicates larger deviations between the GEMS and ground-based tropospheric NO2 VCDs in the morning and/or afternoon, which will be further analyzed by comparing the diurnal variation in Sect. 5.

Figure 4Box-and-whisker plots summarizing the bias and spread of the difference between (a) GEMS L2, (b) GEMS IUP-UB, and (c) TROPOMI and the individual ground-based tropospheric NO2 VCDs. Stations are ordered from bottom to top by increasing median ground-based tropospheric VCD. The orange line inside the box represents the median relative difference. Box bounds mark the 25 % and 75 % quantiles. Whiskers represent the 5 % and 95 % quantiles. The red-shaded area represents a bias of ±50 %.
When separating the comparison of the satellite and ground-based observation into the individual sites, some notable differences can be observed between the individual sites. Figure 4 shows box-and-whisker plots for the three satellite NO2 products and all stations, summarizing the bias and spread of the differences. For the GEMS L2 product, differences between the individual sites are even larger due to the dependence on the AMF box in which the station is located (see Fig. 2). The large negative bias for the MAX-DOAS MPIC Busan site is visible in all product comparisons and is possibly caused by its location close to the coast (< 500 m) and associated inhomogeneities. The sea–land breeze circulation can create complex horizontal and vertical gradients in atmospheric composition which are difficult to resolve in a priori profiles used for satellite retrievals (e.g., Souri et al., 2023). Furthermore, the measurements of this instrument are performed in an azimuth direction of 253°, which crosses the port of Busan, a local source of NOx. In general, there is a slight tendency towards larger biases for more polluted sites while less polluted sites show differences closer to 0. These findings are similar to the validation results from Verhoelst et al. (2021) performed on TROPOMI NO2 data. The positive bias in the GEMS IUP-UB product for the Pandora Ulsan and Pandora Seosan sites, both less polluted sites, could indicate an underestimation of the stratospheric contribution at these sites.
The overall bias (median of all satellite and station pair differences) is 61 % (13 % to 137 % interquartile range) for the GEMS L2 product, −2 % (−28 % to 37 %) for the GEMS IUP-UB product, and −16 % (−34 % to 7 %) for the TROPOMI product. A comparison by Lambert et al. (2023) based on tropospheric NO2 VCDs of Network for the Detection of Atmospheric Composition Change (NDACC) MAX-DOAS data from 29 stations and TROPOMI v2.4.0 and v2.5.0 data from May 2018 to November 2023 shows a median bias of −28 % and, for a subset of eight MAX-DOAS stations in the TROPOMI Validation Data Analysis Facility Automated Validation Server (VDAF-AVS), of −17.5 %, which is somewhat larger than for the data set analyzed here. For the GEMS IUP-UB and the TROPOMI products, the overall and the individual biases, except for those of the MAX-DOAS MPIC Busan site, are within the typical mission requirement of a maximum bias of 50 % (van Geffen et al., 2022). In general, the GEMS IUP-UB product and the TROPOMI product show good agreement in their individual biases, which is improved when limiting the GEMS IUP-UB product comparisons to the TROPOMI overpass time. Scatterplots of the satellite products vs. the co-located ground-based data for the 11 individual stations can be found in the Appendix (Figs. A4, A5, A6).
4.3 Comparison of GEMS IUP-UB and car DOAS observations
The car DOAS tropospheric NO2 VCDs are used, in addition to the stationary ground-based observations, to evaluate the GEMS IUP-UB tropospheric NO2 VCDs. The IUP, MPIC, and BIRA car DOAS instruments were operated in the two campaign regions. Considering that the car DOAS data used for this comparison were analyzed independently by the different groups and with only partly harmonized retrieval methods with different assumptions, the data show good agreement and provide an additional data set for the evaluation of GEMS data. The locations of the car DOAS observations are displayed in Fig. 1. Compared to the stationary data, they can cover larger and more diverse areas, which is reflected in the large range of NO2 values shown in Fig. 5. The scatterplot shows GEMS IUP-UB tropospheric NO2 VCDs vs. co-located car DOAS NO2 tropospheric VCDs. The car DOAS data are compared to the GEMS pixel in which they were measured, averaged ± 20 min around the GEMS observation. In total, 1146 pairs of coincident measurements are considered, of which 272 were taken during the TROPOMI overpass time window. The comparison between the GEMS IUP-UB and the car DOAS data shows a good correlation with a correlation coefficient of 0.87. The slope of 0.7 and a median relative bias of −30 % indicate a larger negative bias than the comparison with the stationary ground-based data set. This larger underestimation of the GEMS IUP-UB product may be caused by the bias of the larger proportion of high NO2 tropospheric VCDs, which was already visible from the evaluation by individual stations for the more polluted sites. Horizontal bars indicate the 10th and 90th percentiles of car DOAS observations within the GEMS pixel and ±20 min time intervals to illustrate the spatiotemporal variability. These bars can become relatively large, indicating the considerable temporal and spatial variability in tropospheric NO2 even within the GEMS pixel. Further investigations based on the car DOAS observations could provide more insights into the representativeness of observations and the natural variability in NO2.
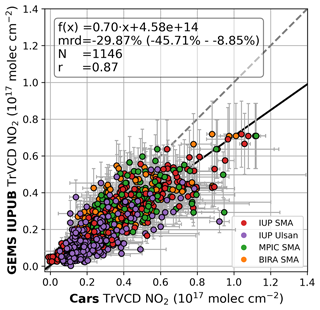
Figure 5Scatterplot of GEMS IUP-UB tropospheric NO2 VCDs vs. co-located car DOAS NO2 tropospheric VCDs. The car DOAS observations are considered co-located if they are taken ±20 min around the time of the GEMS measurement within the satellite pixel. Each point is colored by the respective car DOAS instrument. Vertical bars represent the tropospheric NO2 VCD error. Horizontal bars are the 10th and 90th percentiles.
GEMS is the first geostationary instrument able to observe the diurnal variation in NO2. We assess the agreement between the diurnal variation observed by GEMS and that observed by the ground-based instruments. Interpreting the observed diurnal variations and their differences is difficult as they are driven by emissions, the chemistry of NOx, and transport processes. These factors vary with season, wind speed, transport processes, and weekday–weekend effects and are analyzed in more detail in the following sections.
5.1 Seasonality
Figure 6 shows the observed diurnal variation divided into winter (DJF), spring (MAM), summer (JJA), and autumn (SON) from the GEMS IUP-UB and the station's data sets for those stations which were operated over the whole year, 6 out of the 11 stations. At the sites within the SMA (Incheon, Yonsei, Seoul), mean tropospheric NO2 VCDs are larger than at the other sites, and the diurnal variation can be quite different between the individual sites (see also Chong et al., 2018) and differ additionally between the seasons. However, the overall behavior of the GEMS IUP-UB and the ground-based data is very similar. The low-pollution sites, Pandora Seosan and Pandora Ulsan, show little diurnal variation and a high bias in the GEMS IUP-UB tropospheric NO2 VCD, which is relatively stable throughout the day. For the Pandora Seoul site, the GEMS IUP-UB product overestimates the station columns in autumn, but both data sources show very similar diurnal variation. The other sites show the best agreement around noon from around 11:00 to 14:00 KST. Several stations show deviations in the morning and late afternoon, where the GEMS IUP-UB product often underestimates the station values, which is for example visible prominently for the MAX-DOAS IUP-UB Incheon site in summer and autumn and for the Pandora Yonsei site in summer. For the Pandora Busan site, the underestimation of the GEMS IUP-UB product is strongest in the late afternoon, especially during spring and summer. These deviations during the morning and late-afternoon observations are also visible for the GEMS L2 product (see the Appendix, Fig. A7) but are less pronounced as it is generally biased high. These differences for observations at larger SZAs can be explained by a lower sensitivity and more uncertain AMFs for these scenes, which are amplified for larger aerosol loads and low boundary layer heights in combination with a lack of knowledge of the tropospheric aerosol in the AMF calculation for the GEMS IUP-UB product. This is further discussed in Sect. 5.4.
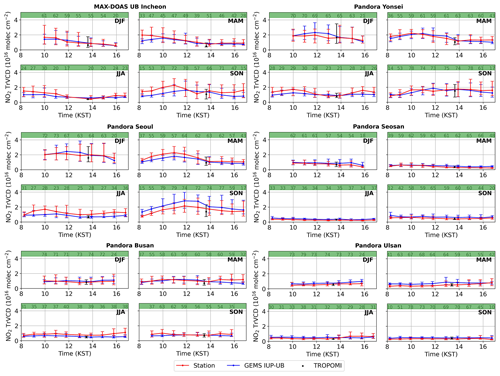
Figure 6Diurnal variation in median tropospheric NO2 VCDs from the GEMS IUP-UB product (blue) and ground-based stations (red) for the individual seasons (DJF, MAM, JJA, SON). The TROPOMI observation is added in black. Station names can be found in the individual titles. Vertical bars represent the 25 % and 75 % quantiles of the MAX-DOAS and GEMS observations. Numbers in the green bar represent the number of contributed observations. Plots for the GEMS L2 product can be found in the Appendix, Fig. A7.
During the summer months (JJA), the polluted stations (MAX-DOAS IUP-UB Incheon, Pandora Yonsei, Pandora Seoul) show a minimum in the NO2 VCDs around 13:00 KST. Similar consistent results were found by Yang et al. (2024) and Edwards et al. (2024). This observation would fit the expectation that chemical loss is relatively rapid around noon, especially in summer, and significantly influences the diurnal variation in NO2. However, this summer noon minimum is more pronounced in the stationary observations than in the GEMS IUP-UB columns, which show a smaller diurnal variation. Due to low data availability during the summer months for the GEMS L2 product after quality and cloud filtering, it is difficult to determine if this behavior is also present in the GEMS L2 observations.
Based on the reduced chemical loss of NO2 during wintertime and expected higher emissions, one would expect an accumulation of NO2 and increasing tropospheric NO2 VCDs throughout the day. This was also seen by Yang et al. (2024) for total column observations of GEMS, for the Pandora site in Beijing and Pandora Seoul but not for Pandora Yonsei. However, this is not visible for the six sites analyzed here. On the contrary, the observed tropospheric NO2 VCDs tend to decrease throughout the day. This is also visible for the GEMS L2 product in the Appendix, Fig. A7.
The largest diurnal variations in tropospheric NO2 VCDs are observed in spring and autumn. During these seasons, the polluted stations in the SMA show quite similar diurnal variation, with increasing NO2 in the morning, a maximum close to noon at around 11:00–12:00 KST, and a decrease towards the evening. This agrees with previous studies, which found up to a 40 % reduction in NO2 columns in the OMI afternoon overpass compared to the SCIAMACHY morning overpass over urban regions (Boersma et al., 2008, 2009) and similar reductions using GOME-2 morning and OMI afternoon observations over large urban regions in the USA (Penn and Holloway, 2020). Edwards et al. (2024) also showed that GEMS tropospheric NO2 VCD variation can be large, especially in polluted environments (> 50 % of the tropospheric VCD). However, the GEMS observations reveal that for the SMA, the morning observations of SCIAMACHY and GOME-2 are in a period where tropospheric NO2 is increasing, while the afternoon observations of OMI are in the period where the tropospheric NO2 VCD is decreasing, and the maximum of NO2 in the SMA around noon is in between and is not captured by previous missions.
If observations are averaged for a full year, the diurnal variation is distorted by the early and late data coming from the summer observations only because there are no scans in winter during these times. Deviations are largest in the early-morning and late-afternoon observations, which are available only from April to September for South Korea. The diurnal variation in the median relative differences for the different seasons is shown in the Appendix, Fig. A9. The diurnal variation in the deviations is similar over the seasons. However, the GEMS IUP-UB summer observations show a larger negative bias. Due to the limited number of sites and observations available in summer, further investigation is needed The median relative differences at the individual sites are also summarized in a heatmap time series plot in the Appendix, Fig. A8. In general, no overall seasonality of the biases is visible. For the Pandora Seoul site, the discussed positive bias is visible for the autumn observations and needs to be further investigated.
5.2 Effects of wind speed and transport processes
Figures 7 and 8 illustrate the sensitivity of the diurnal variation in the tropospheric NO2 VCDs to wind speed. Observations are separated into calm (wind speeds < 3 m s−1, Fig. 7) and windy (wind speeds ≥ 3 m s−1, Fig. 8) conditions based on ERA5 10 m wind data (Hersbach et al., 2023), temporally and spatially interpolated to the GEMS observations. Due to reduced data availability after the separation, only selected sites are shown. The diurnal variation is quite different for calm and windy conditions for some of the shown sites and seasons but consistent for the GEMS IUP-UB and the ground-based data. However, the agreement is better for windy conditions than for low wind speeds, which can be explained by increased dispersion under windy conditions, resulting in fewer inhomogeneities. For calm conditions, the tropospheric NO2 VCDs are generally larger due to the accumulation of local emissions (see also Chong et al., 2018). For windy conditions, the observations show much less variation throughout the day because emissions are dispersed quickly. Differences between calm and windy conditions are smaller for the less polluted sites.
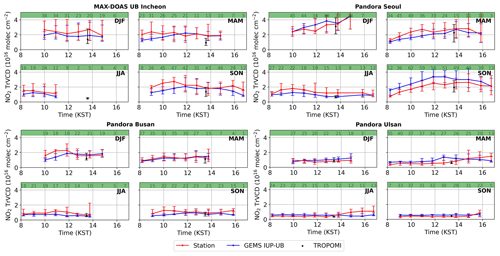
Figure 7The same as Fig. 6 but only including tropospheric NO2 VCDs with wind speeds < 3 m s−1 for selected sites that still have good data availability.
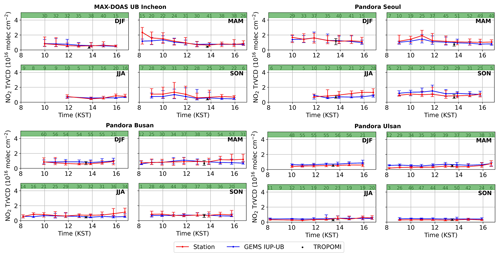
Figure 8The same as Fig. 6 but only including tropospheric NO2 VCDs with wind speeds ≥ 3 m s−1 for selected sites that still have good data availability.
At the Busan site, the Pandora data show an increase in NO2 during the afternoon in spring and summer for windy conditions (Fig. 8), which is not captured by GEMS and is not visible during calm conditions. This increase might be explained by local transport effects, which move NO2 into the line of sight of the Pandora instrument with the wind changing to southerly directions in the afternoon (see Fig. 9).
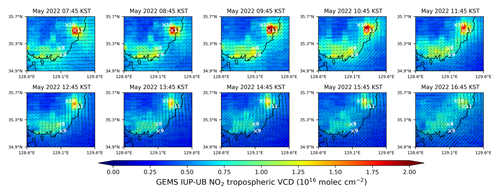
Figure 9Maps of GEMS IUP-UB tropospheric NO2 VCDs for the 10 observations per day averaged for May 2022 and overlaid with ERA5 10 m wind data. Arrow lengths indicate wind speed, and their orientation represents wind direction. Maps show the southeast of South Korea, including the sites of Pandora Busan (8), MAX-DOAS MPIC Busan (9), Pandora Ulsan (10), and MAX-DOAS Ulsan (11). Hourly monthly averaged maps for the SMA are shown in the Appendix, Fig. A10.
The largest differences between calm and windy conditions and between the seasons are found for the Pandora Seoul site, the most polluted site of the four. During calm days in winter, the NO2 shows a strong increase throughout the day. This can be attributed to the less effective chemical loss in winter and the accumulation of emissions that cannot be balanced by dilution on calm days. This increase throughout the day in winter was also shown based on GEMS total NO2 columns by Yang et al. (2024). Yang et al. (2024) saw this increase for all winter data even without a wind filter, which is not visible in our tropospheric NO2 VCD data set. After filtering for only low-wind-speed conditions, they observed an even stronger increase. For spring and autumn, the NO2 increases in the morning, starts decreasing again around noon, and flattens out in the afternoon. During summer, when the chemical loss is more effective, the minimum is around noon, but in general, there is less variation.
A significant increase is visible in the tropospheric NO2 VCDs for the Pandora Ulsan site in spring under low-wind-speed conditions; this was also similarly found during the summer but, in this case, was not captured by GEMS. The increase does not happen throughout the whole day but starts around noon or slightly later for the station data. This increase can be explained by transport effects, as illustrated by Fig. 9. Chong et al. (2018) observed similar transport effects for other remote Pandora sites close to emission sources during the Megacity Air Pollution Studies-Seoul (MAPS-Seoul) campaign from May to June 2015. These kinds of transport effects can now be better followed and understood by the hourly maps of tropospheric NO2 VCD observation provided by GEMS observations. Figure 9 shows maps of GEMS IUP-UB tropospheric NO2 VCDs averaged for May 2022 for each of the 10 observations per day. Overlaid are the interpolated ERA5 10 m wind data. The maps show the southeast of South Korea, including the sites of Pandora Busan, MAX-DOAS MPIC Busan, Pandora Ulsan, and MAX-DOAS Ulsan. The GEMS IUP-UB NO2 columns are highest in the late-morning observations and decrease towards the evening. The location of the NO2 maximum varies throughout the day, which is clearly visible along the coastline and from its location relative to the station sites. In the early morning, the NO2 is mainly located at the MAX-DOAS IUP-UB Ulsan site. With the wind turning from mainly westerly in the morning to mainly southerly around noon, the NO2 moves northwards. Therefore, the NO2 moves closer to the Pandora Ulsan site, which can explain the increase starting around noon visible in the spring diurnal-variation plot. Hourly monthly averaged maps for the SMA showing the NO2 buildup during the morning and transport throughout the day are shown in the Appendix, Fig. A10.
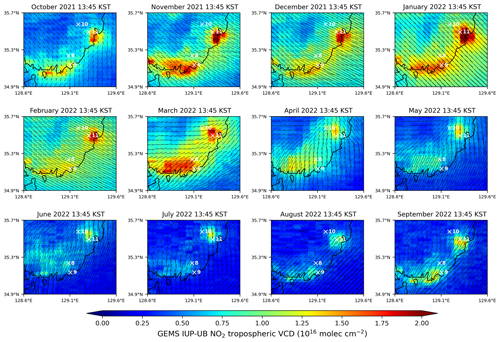
Figure 10Maps of monthly averaged GEMS IUP-UB tropospheric NO2 VCDs for the 13:45 KST observation from October 2021 to September 2022 overlaid with averaged ERA5 10 m wind data. Arrow lengths indicate wind speed, and their orientation represents wind direction. Maps show the southeast of South Korea, including the sites of Pandora Busan (8), MAX-DOAS MPIC Busan (9), Pandora Ulsan (10), and MAX-DOAS Ulsan (11).
In addition to the diurnal variation in transport effects due to changing wind direction, Fig. 10 illustrates the seasonal variability. Shown are maps of monthly averaged GEMS IUP-UB tropospheric NO2 VCDs for the 13:45 KST observation from October 2021 to September 2022 for the southeast of South Korea, with overlaid ERA5 10 m wind data. The GEMS IUP-UB NO2 columns are highest from late autumn to early spring and have their minimum during the summer months. From September to January, with a mainly northwesterly wind direction, a large part of the NO2 is located over the ocean and mostly south of the ground-based stations. During spring, when the wind is changing from northwest to mostly southwest, the NO2 moves northwards.
The described influences of wind speed, causing dispersion or accumulation, and transport effects due to varying wind directions throughout the day and the year complicate the interpretation of observed diurnal variations in tropospheric NO2 VCDs in terms of emissions and chemistry.
5.3 Weekday–weekend effect
Another influence on the diurnal variation in NO2 is the difference between emissions on working days and those on weekends (e.g., Beirle et al., 2003; Stavrakou et al., 2020). Figure 11 shows the tropospheric NO2 VCDs of the days of the week normalized with the mean NO2 from Monday to Friday for the GEMS L2, the GEMS IUP-UB, and the TROPOMI observations with the co-located station observations. GEMS observations are averaged over all available observations per day. TROPOMI observations are only available once or twice a day in cloud-free conditions. Therefore, some deviations between the TROPOMI and GEMS tropospheric NO2 VCD are explained by the reduced data availability and the timing effect. Due to different sampling between the three satellite products, each has its own coincident stationary data set.
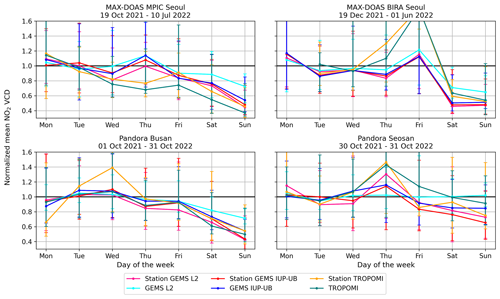
Figure 11Plots of normalized weekday tropospheric NO2 VCDs for co-located station observations with the GEMS L2 (cyan), GEMS IUP-UB (blue), and TROPOMI (turquoise) observations. The corresponding station measurements are marked in pink for the GEMS L2 product, in red for the GEMS IUP-UB product, and in yellow for the TROPOMI product. Station names and operation periods can be found in the individual titles. More sites are shown in the Appendix, Fig. A11.
Generally, there is good agreement between the respective satellite products and their corresponding ground-based measurements. Similarly, there is good agreement among the different NO2 products, with a few exceptions, mainly caused by the sparse TROPOMI observations. During the weekdays, from Mondays to Fridays, most normalized VCDs are close to 1. On Saturdays, the NO2 is already reduced compared to the weekdays. On Sundays, the NO2 is reduced by between around 20 % and 50 % compared to the average observed on weekdays. This reduction is significantly larger than the 10 %–20 % found in studies based on OMI and GOME data over Seoul (Beirle et al., 2003; Stavrakou et al., 2020). The smallest decline over the weekend is observed in Seosan, a more remote site with less influence of traffic emissions. MAX-DOAS BIRA Seoul and MAX-DOAS MPIC Seoul, both located in Seoul, still show some differences. NO2 at the MAX-DOAS BIRA Seoul site peaks on Fridays and shows similarly strong reductions on Saturdays and Sundays, while at MAX-DOAS MPIC Seoul, NO2 peaks on Thursdays and reductions start on Fridays and are strongest on Sundays. This could be due not only to local differences but also to the slightly different months in which the stations are operated and from which the data were analyzed. Large differences in the TROPOMI observations compared to the GEMS observations, e.g., Fridays for the MAX-DOAS BIRA Seoul site, can be explained by the different sampling, with observations between 12:28 and 14:37 KST possibly being biased towards certain weeks or months because of cloud cover.
The GEMS L2 product shows a distinct deviation on the weekend. The agreement with the other data sets is very good on weekdays, but on Saturday and Sunday, there is less reduction compared to the average observed on weekdays than for the other products. One possible explanation is the higher background NO2 values in the GEMS L2 product, which do not have a weekly cycle.
5.4 Discussion of GEMS and ground-based deviations
The agreement between the GEMS and the ground-based tropospheric NO2 VCDs is promising. However, possible explanations for observed differences have to be discussed.
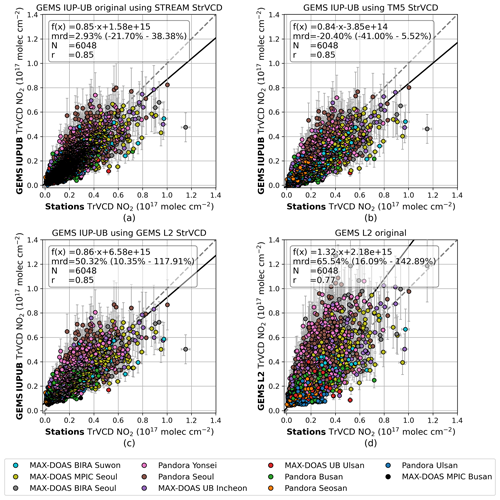
Figure 12Scatterplots of satellite vs. co-located ground-based NO2 tropospheric VCDs for (a) the original GEMS IUP-UB product using the STREAM-based stratospheric VCDs, (b) GEMS IUP-UB using the TM5 stratospheric VCDs, (c) GEMS IUP-UB using the GEMS L2 stratospheric VCDs, and (d) the original GEMS L2 product.
One potential reason for deviations between the GEMS and ground-based observations could be a poor stratospheric correction. Since the contribution of the stratosphere is small with column densities on the order of 1015 molec. cm−2, especially compared to the typically observed tropospheric NO2 VCDs in the range of up to 1×10¹⁷ molec. cm−2, the influence is not very large. However, under some conditions, the operational GEMS product has a large bias in the stratospheric columns, and in such situations, the stratospheric correction can be a significant source of error. To investigate the influence of the different stratospheric VCD products, subversions of the GEMS IUP-UB product, using different stratospheric column products, were created. Figure 12 shows scatterplots of coincident satellite and ground-based tropospheric NO2 VCDs for (a) the original GEMS IUP-UB product using the STREAM-based stratospheric VCDs, (b) GEMS IUP-UB using the TM5 stratospheric VCDs, (c) GEMS IUP-UB using the GEMS L2 stratospheric VCDs, and (d) the original GEMS L2 product. Replacing the STREAM-based stratospheric VCDs with the TM5 stratospheric VCDs increases the bias from 3 % (−22 % to 38 %) to −20 % (−41 % to 5 %) and changes the offset from to molec. cm−2. This illustrates that the TM5 model stratospheric VCDs are too large, resulting in tropospheric NO2 VCDs in the GEMS IUP-UB retrieval that are too low and even negative. Using the GEMS L2 stratospheric VCDs for the GEMS IUP-UB product increases the bias and the offset, illustrating that the GEMS L2 stratospheric VCD product is too low. This results in an overestimation of the GEMS IUP-UB tropospheric NO2 VCD compared to the station data. The correlation stays constant for both subversions as there is little correlation between the stratospheric NO2 columns and the tropospheric NO2 variations at the stations. The larger scatter in the operational GEMS L2 product is discussed in the following text. The diurnal variation in the stratospheric NO2 VCD products is shown in the Appendix, Fig. A12. As expected, the TM5 model stratospheric VCDs, which are used for the TROPOMI product, agree well with the TROPOMI stratospheric NO2 VCD value. The GEMS IUP-UB STREAM-based stratospheric columns show a very similar diurnal evolution to the TM5 data but are slightly lower. The GEMS L2 product shows similar but slightly less variation throughout the day and is lower by a factor of around 2.5 when compared to the TM5 and GEMS IUP-UB stratospheric columns.

Figure 13Scatterplots of satellite vs. co-located ground-based NO2 tropospheric VCDs for (a) the GEMS L2 product using the GEMS L2 reflectivity in the AMF calculation, (b) the GEMS IUP-UB product using the TROPOMI LER reflectivity, and (c) the GEMS IUP-UB product using the GEMS L2 reflectivity.
Another explanation for deviations between the GEMS and ground-based observations could be the effect of the bidirectional reflectance distribution function (BRDF), especially for the observations of diurnal evolution. However, although the GEMS L2 product considers the BRDF influence using GEMS reflectivity data, the discrepancy with the ground-based data remains. To investigate the BRDF effect on the GEMS IUP-UB product, we replaced the TROPOMI LER product, used in the GEMS IUP-UB product, with the GEMS L2 reflectivity. Figure 13 shows the scatterplots of (a) the GEMS L2 product using the GEMS L2 reflectivity in the AMF calculation and (b) the GEMS IUP-UB product using the TROPOMI LER reflectivity, both analyzed before, and (c) the modified GEMS IUP-UB product using the GEMS L2 reflectivity. The modified GEMS IUP-UB product shows more scatter than the original version and an overestimation similar to that of the GEMS L2 product, indicating that the GEMS reflectivity causes a large part of the overestimation and scatter.
Discrepancies between the MAX-DOAS and GEMS IUP-UB observations could be explained by the model profiles used. With its resolution of 1° × 1°, the TM5 model has a rather poor spatial resolution compared to the GEMS pixel size and the spatial variability in NO2. Furthermore, it should be noted that the TM5 model has no specific focus on the GEMS region. L. H. Yang et al. (2023) demonstrate that an updated version of the GEOS-Chem standard model with a resolution of 0.25° × 0.3125° reproduces diurnal variation in NO2 vertical mixing observed during the KORUS-AQ campaign well. This could be further investigated by considering MAX-DOAS profiles and the GEMS averaging kernels. However, car DOAS measurements show that sometimes there can be large fluctuations within individual satellite pixels, and station measurements may be located in sub-pixel regions that are not representative of the entire pixel.
Another already-mentioned aspect, which possibly contributes to the differences, especially at larger SZAs, is the lack of knowledge of tropospheric aerosol in the calculation of the AMF for the GEMS IUP-UB product. However, the L2 product considers aerosol parameters from GEMS observations in the AMF determination and should be correct in terms of their influence. The expected improvement is not reflected in the comparisons.
Due to less sensitivity at higher SZAs (and VAAs), AMFs are expected to be more uncertain for these scenes. This uncertainty is further enhanced for larger aerosol loads and with low boundary layer heights in the morning and evening.
In this study we evaluated tropospheric NO2 VCDs of the operational GEMS L2 v2.0 product, the scientific GEMS IUP-UB v1.0 product, and the operational TROPOMI v02.04.00 product with ground-based DOAS observations from 11 stationary and additional mobile car DOAS instruments in South Korea. GEMS is the first instrument in geostationary orbit that has enabled the observation of diurnal variations in NO2 over a large part of Asia. With its location centered over South Korea, GEMS provides up to 10 observations during the daytime. The GEMS IUP-UB and the ground-based observations are used together with ERA5 10 m wind data to interpret the diurnal variation in tropospheric NO2 VCDs.
Maps of tropospheric NO2 VCDs from the GEMS L2, the GEMS IUP-UB, and the TROPOMI products, all around the time of the TROPOMI overpass, show large NO2 hot spots over the SMA and smaller urban agglomerations. These hot spots, especially that above the SMA, show the highest values in the GEMS L2 product. The lowest values are found in the TROPOMI product. The background tropospheric NO2 VCD is similar for the TROPOMI and the GEMS IUP-UB products but is significantly higher in the GEMS L2 product, presumably because of the different approaches used for the stratospheric correction. Due to a missing interpolation of the AMF, the GEMS L2 product shows box structures with the spatial resolution of the GEOS-Chem model.
The evaluation of the GEMS L2 v2.0 tropospheric NO2 VCD product with the ground-based DOAS measurements indicates an overestimation, with a slope of 1.28, a median relative difference of +61 %, and a correlation of 0.76. The evaluation results of the GEMS IUP-UB and the operational TROPOMI products show that both are biased low and have less scatter than the GEMS L2 product. The slope and median relative difference are 0.80 and −2 % for the GEMS IUP-UB product and 0.79 and −16 % for the TROPOMI product. The correlation of the GEMS products with the ground-based observations improves when observations are limited to the TROPOMI overpass time, indicating larger deviations in coinciding morning and/or afternoon observations. The separate comparison of the satellite and ground-based tropospheric NO2 VCDs for the 11 individual sites illustrates some differences between the sites. Biases are larger for more polluted sites, while less polluted sites show differences closer to zero. The positive bias for the two least polluted sites is probably related to the stratospheric correction in the GEMS IUP-UB product. In general, the GEMS IUP-UB product and the TROPOMI product show good agreement in the individual biases. Mobile car DOAS observations serve as an additional data set to evaluate the GEMS observations and support the results obtained from the comparisons with stationary ground-based data.
Due to the locations of the stations in different pollution regimes, the observed diurnal variations in the tropospheric NO2 VCDs from the GEMS IUP-UB and the ground-based data sets show different characteristics. Urban sites often show a maximum of NO2 of varying degrees in the late morning, while more rural sites show nearly no diurnal variation. For both cases, we find good agreement between the diurnal variation in the GEMS IUP-UB and the ground-based NO2 data. The largest differences are visible in the morning and late-afternoon observation, where the GEMS IUP-UB product often underestimates the station values. During summer, the polluted sites show a minimum in the tropospheric NO2 VCDs around noon (13:00 KST), indicating the larger influence of chemical loss in summer. However, this summer noon minimum is less pronounced in the GEMS observations than in the stationary observations. Winter observations show, in general, higher NO2 values with rather flat or slightly decreasing NO2 throughout the day, which is well captured in both data sets. We see no increase throughout the day, as reported by other studies using total NO2 columns in Seoul and Beijing. Most diurnal variation is found at polluted sites in spring and autumn, with an increase during the morning, a maximum late in the morning or around noon, and a decrease towards the afternoon.
Diurnal variation differs significantly between low-wind-speed and high-wind-speed conditions in both the GEMS IUP-UB and the ground-based data set. However, there is better agreement under windy conditions, likely due to increased dispersion and reduced inhomogeneities. The influence of dispersion in windy conditions results in observations displaying less diurnal variation. Observations under low-wind-speed conditions show NO2 increases throughout the day but only at the most polluted sites, especially during winter. This suggests that, under calm conditions, the reduced dilution and less effective chemical loss in winter are insufficient to offset the accumulating emissions. For a more rural site, the diurnal variation with increasing NO2 values following mean wind patterns for specific seasons and times reveals the impact of transported NO2. Due to a location-specific change in wind direction around noon, which is characteristic of these months, NO2 pollution from an industrial area is transported close to the station. This is also observed in other areas and on a seasonal basis.
When analyzing the weekday–weekend effect, good agreement is found between the different tropospheric NO2 VCD products. Depending on the station, the NO2 columns are 20 % to 50 % lower on Sundays compared to the weekday average. However, the GEMS L2 product, which agrees with the other data sets on weekdays, shows significantly less reduction on weekends, presumably caused by the generally higher NO2 background values in the GEMS L2 product, which do not have a weekly cycle.
Significant impacts of both the stratospheric correction and the surface reflectivity on the GEMS tropospheric NO2 VCD products were found. While the GEMS L2 stratospheric VCD is too low, resulting in tropospheric NO2 VCDs that are too high, the TM5 model's stratospheric VCDs, used in the TROPOMI product, are too high, resulting in tropospheric NO2 VCDs that are too low when implemented in the GEMS IUP-UB retrieval. Surface reflectivity comparisons indicate that the GEMS L2 reflectivity is a major contributor to the observed overestimation and scattering in the GEMS L2 tropospheric NO2 VCD product.
Deviations between GEMS and ground-based observations at larger SZAs might be explainable by a lower sensitivity and more uncertain AMFs for these scenes, which are amplified for larger aerosol loads and low boundary layer heights in combination with a lack of knowledge of the tropospheric aerosol in the AMF calculation for the GEMS IUP-UB product. This shows the increasing importance of having good aerosol information and including it in the AMF calculations.
Overall, our analyses revealed significant diurnal variation in NO2. This variation is strongly site-dependent, differs between polluted and less polluted sites, and has location-specific and seasonal characteristics. GEMS IUP-UB and ground-based observations are in good agreement. This is promising for the extension of the analysis of diurnal variation in tropospheric NO2 using the extensive GEMS data set in other parts of Asia. The observed diurnal variation in NO2 offers unique insights into the chemistry and emission of NOx as well as transport processes, but it needs to be carefully interpreted. Our analysis shows significant impacts of both the stratospheric correction and the surface reflectivity data on the GEMS tropospheric NO2 VCD products. These analyses can also help in the analysis of the upcoming data sets of the follow-up geostationary air quality missions such as TEMPO over North America and Sentinel-4 over Europe.
The comparison of satellite and ground-based observations was investigated for different spatial co-location criteria: the closest pixels within a radius of 5 km and 10 km, respectively, around the station sites and considering the ground-based instruments viewing azimuth angle (VAA) during the satellite overpass. To investigate the VAA dependence, the GEMS pixels VCDsat are weighted according to their contribution along the line of sight d of the ground-based instruments.
We consider the line of sight within 5 km of the station site. The comparison is only included in the analysis when more than 75 % of the line of sight is covered by satellite pixels. Measurements taken in the same VAA within the ±20 min of the satellite observation, overlapping with the same GEMS pixels, are averaged.

Figure A1The same as Fig. 3 but GEMS L2 and GEMS IUP-UB observations are limited to the TROPOMI overpass time between 12:28 and 14:37 KST.
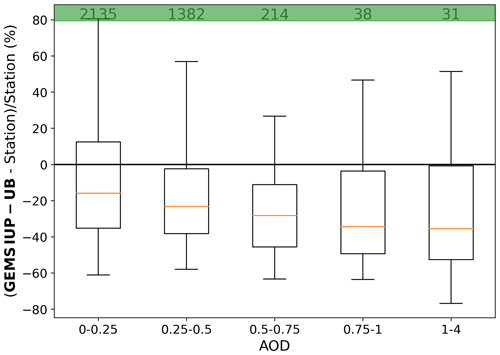
Figure A2Median relative differences between GEMS IUP-UB and MAX-DOAS tropospheric NO2 columns as a function of AOD retrieved within the FRM4DOAS MAX-DOAS NO2 analysis. Numbers in the green bar represent the number of observations contributed to the bin.
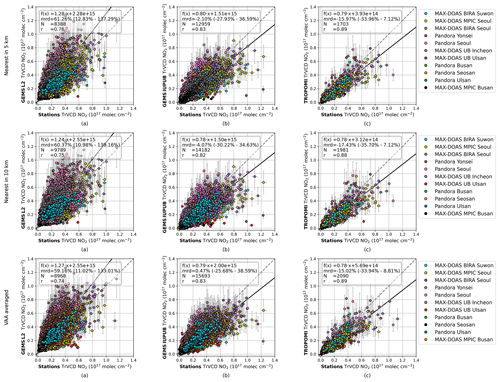
Figure A3Scatterplots of GEMS L2 (a), GEMS IUP-UB (b), and TROPOMI (c) NO2 tropospheric VCDs vs. co-located ground-based NO2 tropospheric VCDs for different co-location criteria. The time constraint is ±20 min around the time of the satellite measurement. First row: ground-based measurements within this period averaged and matched to the closest satellite observation within 5 km around the station site. Second row: the same as the first row but matched to the closest satellite observation within 10 km. Third row: satellite pixels weighted according to their contribution along the line of sight of the ground-based instruments within 5 km of the station.
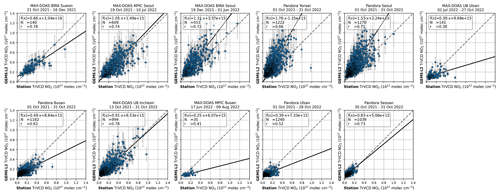
Figure A4Scatterplots of GEMS L2 tropospheric NO2 VCDs vs. co-located ground-based NO2 tropospheric VCDs for the 11 individual sites. Station names and measurement periods can be found in the titles. Co-location criteria are within ±20 min and within the nearest 5 km, the same as in Fig. 3.
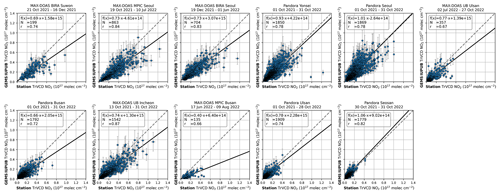
Figure A5The same as Fig. A4 but for GEMS IUP-UB tropospheric NO2 VCDs vs. co-located ground-based NO2 tropospheric VCDs.
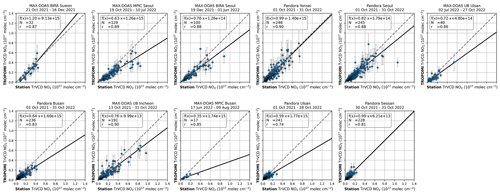
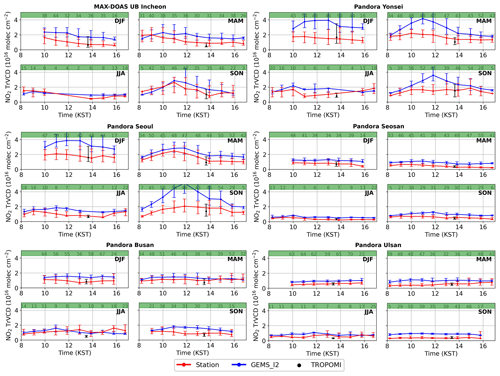
Figure A7The same as Fig. 6 but for GEMS L2. Diurnal variation in median tropospheric NO2 VCDs from the GEMS L2 product (blue) and ground-based stations (red) for the individual seasons (DJF, MAM, JJA, SON). The TROPOMI observation is added in black. Station names can be found in the individual titles. Vertical bars represent the 25 % and 75 % quantiles of the MAX-DOAS and GEMS observations. Due to low data availability for the GEMS L2 product in summer, observations are displayed starting at 5 instead of 10 available observations; see the green bar.
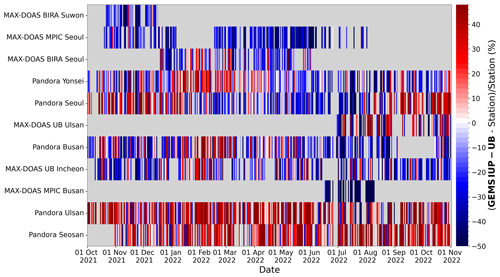
Figure A8Time series of the median relative differences at the different ground-based sites from 1 October 2021 to 31 October 2022. The stations are ordered from bottom to top by increasing median ground-based tropospheric VCD.
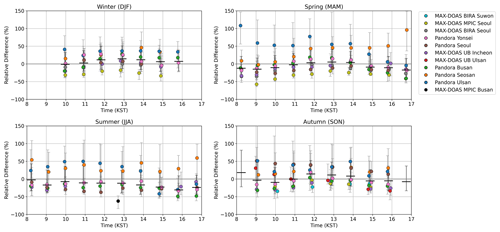
Figure A9Diurnal variation in the median relative differences in the GEMS IUP-UB NO2 product and the individual ground-based stations for the different seasons. Stations are color-coded. The median, including the differences of all sites, is shown as black bars. Error bars represent the 25 % and 75 % quantiles. Results are only included if more than 20 observations are available per time bin and station.
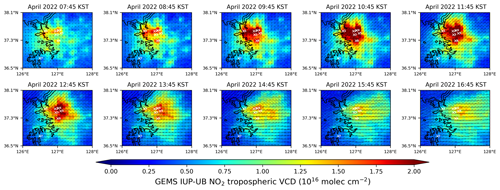
Figure A10Maps of GEMS IUP-UB tropospheric NO2 VCDs for the 10 observations per day averaged for April 2022 overlaid with ERA5 10 m wind data. Arrow lengths indicate wind speed, and their orientation represents wind direction. Maps show the SMA, including the sites of MAX-DOAS IUP-UB Incheon (1), Pandora Yonsei (2), Pandora Seoul (3), MAX-DOAS BIRA Seoul (4), MAX-DOAS MPIC Seoul (5), MAX-DOAS BIRA Suwon (6), and Pandora Seosan (7).
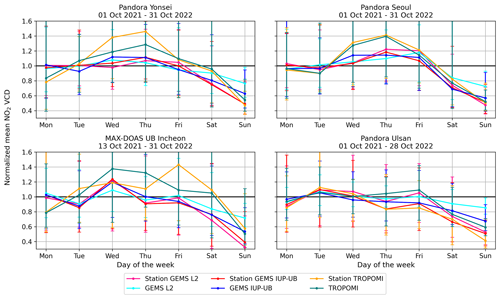
Figure A11Remaining sites not shown in Fig. 11. Plots of normalized weekday NO2 VCDs for the co-located station observations with the GEMS IUP-UB, the GEMS L2, and the TROPOMI observations.
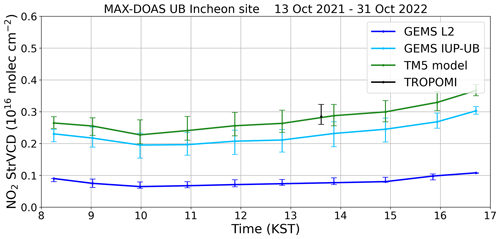
Figure A12Diurnal variation in median stratospheric NO2 VCDs for the GEMS L2 product based on the method from Bucsela et al. (2013) in dark blue; the GEMS IUP-UB STREAM-based product in light blue; and the TM5 model stratospheric VCDs in green, used for the TROPOMI product, which is shown in black.
GEMS L2 NO2 data can be accessed at https://nesc.nier.go.kr/en/html/datasvc/index.do# (NIER, 2024). The GEMS IUP-UB NO2 product is available on request. TROPOMI NO2 data are freely available via https://doi.org/10.5270/S5P-9bnp8q8 (Copernicus Sentinel-5P, 2021). The data of Pandora instruments are freely available from the PGN data archive (https://data.pandonia-global-network.org/Cologne/, Pandonia Global Network, 2024a; https://data.pandonia-global-network.org/Juelich/, Pandonia Global Network, 2024b). The FRM4DOAS MAX-DOAS data are available on request. The ERA5 wind data are freely available from the Copernicus Climate Change Service (C3S) Climate Data Store (CDS; https://doi.org/10.24381/cds.adbb2d47, Hersbach et al., 2023).
All co-authors contributed to the campaign as participants and instrument operators and/or during campaign preparation. AR provided the GEMS IUP-UB NO2 data product. HL and HH provided information about the GEMS L2 NO2 data product. CF and MMF performed the MAX-DOAS data analysis. The campaign was prepared by HH, LSC, and CKS. KL performed the final data analysis and interpreted the results together with AR. KL wrote the paper with feedback and contributions from all other co-authors.
At least one of the (co-)authors is a member of the editorial board of Atmospheric Measurement Techniques. The peer-review process was guided by an independent editor, and the authors also have no other competing interests to declare.
Publisher's note: Copernicus Publications remains neutral with regard to jurisdictional claims made in the text, published maps, institutional affiliations, or any other geographical representation in this paper. While Copernicus Publications makes every effort to include appropriate place names, the final responsibility lies with the authors.
This article is part of the special issue “GEMS: first year in operation (AMT/ACP inter-journal SI)”. It is not associated with a conference.
We thank the National Institute of Environmental Research of South Korea for providing GEMS data and for the excellent organization of the GMAP 2021 and SIJAQ 2022 field campaigns. We thank all participants of the GMAP 2021 and SIJAQ 2022 field campaigns. Copernicus Sentinel-5P Level 2 NO2 data are used in this study. Sentinel-5 Precursor is a European Space Agency (ESA) mission on behalf of the European Commission (EC). The TROPOMI payload is a joint development by ESA and the Netherlands Space Office (NSO). The Sentinel-5 Precursor ground-segment development has been funded by the ESA and with national contributions from the Netherlands, Germany, Belgium, and the UK. We thank PGN instrument PIs and support staff and acknowledge PGN funding for establishing and maintaining the Pandora sites used in this investigation. The PGN is a bilateral project supported with funding from NASA and ESA. We thank Robert Spurr for the free use of VLIDORT.
This research has been supported by the Deutsches Zentrum für Luft- und Raumfahrt (grant no. 50 EE 2204) and the National Institute of Environmental Research of South Korea (grant no. NIER-2022-04-02-037).
The article processing charges for this open-access publication were covered by the University of Bremen.
This paper was edited by Rokjin Park and reviewed by two anonymous referees.
Beirle, S., Platt, U., Wenig, M., and Wagner, T.: Weekly cycle of NO2 by GOME measurements: a signature of anthropogenic sources, Atmos. Chem. Phys., 3, 2225–2232, https://doi.org/10.5194/acp-3-2225-2003, 2003. a, b
Beirle, S., Boersma, K. F., Platt, U., Lawrence, M. G., and Wagner, T.: Megacity emissions and lifetimes of nitrogen oxides probed from space, Science, 333, 1737–1739, https://doi.org/10.1126/science.1207824, 2011. a
Beirle, S., Hörmann, C., Jöckel, P., Liu, S., Penning de Vries, M., Pozzer, A., Sihler, H., Valks, P., and Wagner, T.: The STRatospheric Estimation Algorithm from Mainz (STREAM): estimating stratospheric NO2 from nadir-viewing satellites by weighted convolution, Atmos. Meas. Tech., 9, 2753–2779, https://doi.org/10.5194/amt-9-2753-2016, 2016. a
Beirle, S., Borger, C., Dörner, S., Li, A., Hu, Z., Liu, F., Wang, Y., and Wagner, T.: Pinpointing nitrogen oxide emissions from space, Science Advances, 5, eaax9800, https://doi.org/10.1126/sciadv.aax9800, 2019a. a
Beirle, S., Dörner, S., Donner, S., Remmers, J., Wang, Y., and Wagner, T.: The Mainz profile algorithm (MAPA), Atmos. Meas. Tech., 12, 1785–1806, https://doi.org/10.5194/amt-12-1785-2019, 2019b. a
Boersma, K. F., Jacob, D. J., Eskes, H. J., Pinder, R. W., Wang, J., and van der A, R. J.: Intercomparison of SCIAMACHY and OMI tropospheric NO2 columns: Observing the diurnal evolution of chemistry and emissions from space, J. Geophys. Res.-Atmos., 113, D16S26, https://doi.org/10.1029/2007jd008816, 2008. a, b, c
Boersma, K. F., Jacob, D. J., Trainic, M., Rudich, Y., DeSmedt, I., Dirksen, R., and Eskes, H. J.: Validation of urban NO2 concentrations and their diurnal and seasonal variations observed from the SCIAMACHY and OMI sensors using in situ surface measurements in Israeli cities, Atmos. Chem. Phys., 9, 3867–3879, https://doi.org/10.5194/acp-9-3867-2009, 2009. a, b, c
Bovensmann, H., Burrows, J., Buchwitz, M., Frerick, J., Noël, S., Rozanov, V., Chance, K., and Goede, A.: SCIAMACHY: Mission objectives and measurement modes, J. Atmos. Sci., 56, 127–150, 1999. a
Bucsela, E. J., Krotkov, N. A., Celarier, E. A., Lamsal, L. N., Swartz, W. H., Bhartia, P. K., Boersma, K. F., Veefkind, J. P., Gleason, J. F., and Pickering, K. E.: A new stratospheric and tropospheric NO2 retrieval algorithm for nadir-viewing satellite instruments: applications to OMI, Atmos. Meas. Tech., 6, 2607–2626, https://doi.org/10.5194/amt-6-2607-2013, 2013. a, b
Burrows, J., Bovensmann, H., Bergametti, G., Flaud, J., Orphal, J., Noël, S., Monks, P., Corlett, G., Goede, A., von Clarmann, T., Steck, T., Fischer, H., and Friedl-Vallon, F.: The geostationary tropospheric pollution explorer (GeoTROPE) mission: objectives, requirements and mission concept, Adv. Space Res., 34, 682–687, https://doi.org/10.1016/j.asr.2003.08.067, 2004. a
Burrows, J. P., Weber, M., Buchwitz, M., Rozanov, V., Ladstätter-Weißenmayer, A., Richter, A., DeBeek, R., Hoogen, R., Bramstedt, K., Eichmann, K.-U., Eisinger, M., and Perner, D.: The Global Ozone Monitoring Experiment (GOME): Mission Concept and First Scientific Results, J. Atmos. Sci., 56, 151–175, https://doi.org/10.1175/1520-0469(1999)056<0151:TGOMEG>2.0.CO;2, 1999. a
Cede, A.: Manual for Blick Software Suite 1.8, Tech. rep., https://www.pandonia-global-network.org/home/documents/manuals/ (last access: 23 October 2024), 2021. a
Chong, H., Lee, H., Koo, J.-H., Kim, J., Jeong, U., Kim, W., Kim, S.-W., Herman, J. R., Abuhassan, N. K., Ahn, J.-Y., Park, J.-H., Kim, S.-K., Moon, K.-J., Choi, W.-J., and Park, S. S.: Regional Characteristics of NO2 Column Densities from Pandora Observations during the MAPS-Seoul Campaign, Aerosol Air Qual. Res., 18, 2207–2219, https://doi.org/10.4209/aaqr.2017.09.0341, 2018. a, b, c
Copernicus Sentinel-5P: TROPOMI Level 2 Nitrogen Dioxide tropospheric column products, Version 02, processed by ESA, European Space Agency [data set], https://doi.org/10.5270/S5P-9bnp8q8, 2021. a, b
Dimitropoulou, E., Hendrick, F., Pinardi, G., Friedrich, M. M., Merlaud, A., Tack, F., De Longueville, H., Fayt, C., Hermans, C., Laffineur, Q., Fierens, F., and Van Roozendael, M.: Validation of TROPOMI tropospheric NO2 columns using dual-scan multi-axis differential optical absorption spectroscopy (MAX-DOAS) measurements in Uccle, Brussels, Atmos. Meas. Tech., 13, 5165–5191, https://doi.org/10.5194/amt-13-5165-2020, 2020. a
Edwards, D. P., Martínez-Alonso, S., Jo, D. S., Ortega, I., Emmons, L. K., Orlando, J. J., Worden, H. M., Kim, J., Lee, H., Park, J., and Hong, H.: Quantifying the diurnal variation in atmospheric NO2 from Geostationary Environment Monitoring Spectrometer (GEMS) observations, Atmos. Chem. Phys., 24, 8943–8961, https://doi.org/10.5194/acp-24-8943-2024, 2024. a, b, c
Eskes, H. and Eichmann, K.: S5P MPC Product Readme Nitrogen Dioxide, Tech. rep., https://sentinels.copernicus.eu/documents/247904/3541451/Sentinel-5P-Nitrogen-Dioxide-Level-2-Product-Readme-File (last access: 14 December 2023), 2023. a, b
Faustini, A., Rapp, R., and Forastiere, F.: Nitrogen dioxide and mortality: review and meta-analysis of long-term studies, Eur. Respir. J., 44, 744–753, https://doi.org/10.1183/09031936.00114713, 2014. a
Friedrich, M. M., Rivera, C., Stremme, W., Ojeda, Z., Arellano, J., Bezanilla, A., García-Reynoso, J. A., and Grutter, M.: NO2 vertical profiles and column densities from MAX-DOAS measurements in Mexico City, Atmos. Meas. Tech., 12, 2545–2565, https://doi.org/10.5194/amt-12-2545-2019, 2019. a
Hendrick, F., Pinardi, G., Van Roozendael, M., Apituley, A., Piters, A., Richter, A., Wagner, T., Kreher, K., Friess, U., and Lampel, J.: Fiducial Reference Measurements for Ground-Based DOAS Air-Quality Observations, Deliverable D13 ESA Contract No.4000118181/16/I-EF, https://frm4doas.aeronomie.be/ProjectDir/Deliverables/FRM4DOAS_D13_Campaign_Planning_Document_20161021_final.pdf (last access: 14 July 2022), 2016. a
Herman, J., Cede, A., Spinei, E., Mount, G., Tzortziou, M., and Abuhassan, N.: NO2 column amounts from ground‐based Pandora and MFDOAS spectrometers using the direct‐sun DOAS technique: Intercomparisons and application to OMI validation, J. Geophys. Res.-Atmos., 114, D13307, https://doi.org/10.1029/2009jd011848, 2009. a
Hersbach, H., Bell, B., Berrisford, P., Biavati, G., Horányi, A., Muñoz Sabater, J., Nicolas, J., Peubey, C., Radu, R., Rozum, I., Schepers, D., Simmons, A., Soci, C., Dee, D., and Thépaut, J.-N.: ERA5 hourly data on single levels from 1940 to present, Copernicus Climate Change Service (C3S) Climate Data Store (CDS) [data set], https://doi.org/10.24381/cds.adbb2d47, 2023. a, b
Hönninger, G., von Friedeburg, C., and Platt, U.: Multi axis differential optical absorption spectroscopy (MAX-DOAS), Atmos. Chem. Phys., 4, 231–254, https://doi.org/10.5194/acp-4-231-2004, 2004. a
Ingmann, P., Veihelmann, B., Langen, J., Lamarre, D., Stark, H., and Courrèges-Lacoste, G. B.: Requirements for the GMES Atmosphere Service and ESA's implementation concept: Sentinels-4/-5 and -5p, Remote Sens. Environ., 120, 58–69, https://doi.org/10.1016/j.rse.2012.01.023, 2012. a
Kim, J., Jeong, U., Ahn, M.-H., Kim, J. H., Park, R. J., Lee, H., Song, C. H., Choi, Y.-S., Lee, K.-H., Yoo, J.-M., Jeong, M.-J., Park, S. K., Lee, K.-M., Song, C.-K., Kim, S.-W., Kim, Y. J., Kim, S.-W., Kim, M., Go, S., Liu, X., Chance, K., Miller, C. C., Al-Saadi, J., Veihelmann, B., Bhartia, P. K., Torres, O., Abad, G. G., Haffner, D. P., Ko, D. H., Lee, S. H., Woo, J.-H., Chong, H., Park, S. S., Nicks, D., Choi, W. J., Moon, K.-J., Cho, A., Yoon, J., kyun Kim, S., Hong, H., Lee, K., Lee, H., Lee, S., Choi, M., Veefkind, P., Levelt, P. F., Edwards, D. P., Kang, M., Eo, M., Bak, J., Baek, K., Kwon, H.-A., Yang, J., Park, J., Han, K. M., Kim, B.-R., Shin, H.-W., Choi, H., Lee, E., Chong, J., Cha, Y., Koo, J.-H., Irie, H., Hayashida, S., Kasai, Y., Kanaya, Y., Liu, C., Lin, J., Crawford, J. H., Carmichael, G. R., Newchurch, M. J., Lefer, B. L., Herman, J. R., Swap, R. J., Lau, A. K. H., Kurosu, T. P., Jaross, G., Ahlers, B., Dobber, M., McElroy, C. T., and Choi, Y.: New Era of Air Quality Monitoring from Space: Geostationary Environment Monitoring Spectrometer (GEMS), B. Am. Meteorol. Soc., 101, E1–E22, https://doi.org/10.1175/BAMS-D-18-0013.1, 2020. a, b
Kim, S., Kim, D., Hong, H., Chang, L.-S., Lee, H., Kim, D.-R., Kim, D., Yu, J.-A., Lee, D., Jeong, U., Song, C.-K., Kim, S.-W., Park, S. S., Kim, J., Hanisco, T. F., Park, J., Choi, W., and Lee, K.: First-time comparison between NO2 vertical columns from Geostationary Environmental Monitoring Spectrometer (GEMS) and Pandora measurements, Atmos. Meas. Tech., 16, 3959–3972, https://doi.org/10.5194/amt-16-3959-2023, 2023. a
Lambert, J.-C., Keppens, A., Compernolle, S., Eichmann, K.-U., de Graaf, M., Hubert, D., Langerock, B., Ludewig, A., Sha, M., Verhoelst, T., Wagner, T., Ahn, C., Argyrouli, A., Balis, D., Chan, K., Coldewey-Egbers, M., Smedt, I. D., Eskes, H., Fjæraa, A., Garane, K., Gleason, J., Goutail, F., Granville, J., Hedelt, P., Ahn, C., Heue, K.-P., Jaross, G., Kleipool, Q., Koukouli, M., Lutz, R., Velarte, M. M., Michailidis, K., Nanda, S., Niemeijer, S., Pazmiño, A., Pinardi, G., Richter, A., Rozemeijer, N., Sneep, M., Zweers, D. S., Theys, N., Tilstra, G., Torres, O., Valks, P., van Geffen, J., Vigouroux, C., Wang, P., and Weber, M.: Quarterly Validation Report of the Copernicus Sentinel-5 Precursor Operational Data Products: April 2018–November 2023, Tech. rep., https://mpc-vdaf.tropomi.eu/ProjectDir/reports//pdf/S5P-MPC-IASB-ROCVR-21.01.00.pdf (last access: 29 February 2024), 2023. a, b
Lange, K., Richter, A., and Burrows, J. P.: Variability of nitrogen oxide emission fluxes and lifetimes estimated from Sentinel-5P TROPOMI observations, Atmos. Chem. Phys., 22, 2745–2767, https://doi.org/10.5194/acp-22-2745-2022, 2022. a
Lange, K., Richter, A., Schönhardt, A., Meier, A. C., Bösch, T., Seyler, A., Krause, K., Behrens, L. K., Wittrock, F., Merlaud, A., Tack, F., Fayt, C., Friedrich, M. M., Dimitropoulou, E., Van Roozendael, M., Kumar, V., Donner, S., Dörner, S., Lauster, B., Razi, M., Borger, C., Uhlmannsiek, K., Wagner, T., Ruhtz, T., Eskes, H., Bohn, B., Santana Diaz, D., Abuhassan, N., Schüttemeyer, D., and Burrows, J. P.: Validation of Sentinel-5P TROPOMI tropospheric NO2 products by comparison with NO2 measurements from airborne imaging DOAS, ground-based stationary DOAS, and mobile car DOAS measurements during the S5P-VAL-DE-Ruhr campaign, Atmos. Meas. Tech., 16, 1357–1389, https://doi.org/10.5194/amt-16-1357-2023, 2023. a
Lee, H., Park, J., and Hong, H.: Geostationary Environment Monitoring Spectrometer (GEMS), Algorithm Theoretical Basis Document, NO2 Retrieval Algorithm, Tech. rep., Environmental Satellite Center, National Institute of Environmental Research, Ministry of Environment, Issue 1.1, https://nesc.nier.go.kr/en/html/satellite/doc/doc.do (last access: 23 February 2024), 2020. a
Levelt, P. F., van den Oord, G. H., Dobber, M. R., Malkki, A., Visser, H., de Vries, J., Stammes, P., Lundell, J. O., and Saari, H.: The ozone monitoring instrument, IEEE T. Geosci. Remote, 44, 1093–1101, https://doi.org/10.1109/TGRS.2006.872333, 2006. a
Lorente, A., Boersma, K., Eskes, H., Veefkind, J., Van Geffen, J., de Zeeuw, M., van der Gon, H. D., Beirle, S., and Krol, M.: Quantification of nitrogen oxides emissions from build-up of pollution over Paris with TROPOMI, Sci. Rep., 9, 1–10, https://doi.org/10.1038/s41598-019-56428-5, 2019. a
Ma, J. Z., Beirle, S., Jin, J. L., Shaiganfar, R., Yan, P., and Wagner, T.: Tropospheric NO2 vertical column densities over Beijing: results of the first three years of ground-based MAX-DOAS measurements (2008–2011) and satellite validation, Atmos. Chem. Phys., 13, 1547–1567, https://doi.org/10.5194/acp-13-1547-2013, 2013. a
Munro, R., Eisinger, M., Anderson, C., Callies, J., Corpaccioli, E., Lang, R., Lefebvre, A., Livschitz, Y., and Albinana, A. P.: GOME-2 on MetOp, in: Proc. of The 2006 EUMETSAT Meteorological Satellite Conference, Helsinki, Finland, 12–16 June 2006, EUMETSAT, vol. 1216, p. 48, ISBN 92-9110-076-5, 2006. a
National Institute of Environmental Research (NIER): GEMS L2 products, National Institute of Environmental Research [data set], https://nesc.nier.go.kr/en/html/datasvc/index.do#, last access: 23 October 2024. a, b
Oak, Y. J., Jacob, D. J., Balasus, N., Yang, L. H., Chong, H., Park, J., Lee, H., Lee, G. T., Ha, E. S., Park, R. J., Kwon, H.-A., and Kim, J.: A bias-corrected GEMS geostationary satellite product for nitrogen dioxide using machine learning to enforce consistency with the TROPOMI satellite instrument, Atmos. Meas. Tech., 17, 5147–5159, https://doi.org/10.5194/amt-17-5147-2024, 2024. a
Pandonia Global Network: PGN data archive, Pandonia Global Network [data set], http://data.pandonia-global-network.org/, last access: 4 February 2023. a
Pandonia Global Network: PGN data archive: Cologne, Pandonia Global Network [data set], https://data.pandonia-global-network.org/Cologne/, last access: 23 October 2024a. a
Pandonia Global Network: PGN data archive: Juelich, Pandonia Global Network [data set], https://data.pandonia-global-network.org/Juelich/, last access: 23 October 2024b. a
Penn, E. and Holloway, T.: Evaluating current satellite capability to observe diurnal change in nitrogen oxides in preparation for geostationary satellite missions, Environ. Res. Lett., 15, 034038, https://doi.org/10.1088/1748-9326/ab6b36, 2020. a, b, c
Pinardi, G., Van Roozendael, M., Hendrick, F., Theys, N., Abuhassan, N., Bais, A., Boersma, F., Cede, A., Chong, J., Donner, S., Drosoglou, T., Dzhola, A., Eskes, H., Frieß, U., Granville, J., Herman, J. R., Holla, R., Hovila, J., Irie, H., Kanaya, Y., Karagkiozidis, D., Kouremeti, N., Lambert, J.-C., Ma, J., Peters, E., Piters, A., Postylyakov, O., Richter, A., Remmers, J., Takashima, H., Tiefengraber, M., Valks, P., Vlemmix, T., Wagner, T., and Wittrock, F.: Validation of tropospheric NO2 column measurements of GOME-2A and OMI using MAX-DOAS and direct sun network observations, Atmos. Meas. Tech., 13, 6141–6174, https://doi.org/10.5194/amt-13-6141-2020, 2020. a
Platt, U. and Perner, D.: Direct measurements of atmospheric CH2O, HNO2, O3, NO2, and SO2 by differential optical absorption in the near UV, J. Geophys. Res.-Oceans, 85, 7453–7458, https://doi.org/10.1029/JC085iC12p07453, 1980. a
Richter, A., Lange, K., Burrows, J., Bösch, H., Kim, S.-W., Seo, S., Kim, K.-M., Hong, H., Lee, H., and Park, J.: An improved tropospheric NO2 retrieval for GEMS, in preparation, 2024. a
Rozanov, V., Rozanov, A., Kokhanovsky, A., and Burrows, J.: Radiative transfer through terrestrial atmosphere and ocean: Software package SCIATRAN, J. Quant. Spectrosc. Ra., 133, 13–71, https://doi.org/10.1016/j.jqsrt.2013.07.004, 2014. a
Seinfeld, J. H. and Pandis, S. N.: Atmospheric Chemistry and Physics, John Wiley & Sons Inc., Hoboken, New Jersey, ISBN 978-0-471-72018-8, 2006. a
Seo, S., Kim, S.-W., Kim, K.-M., Richter, A., Lange, K., Burrows, J. P., Park, J., Hong, H., Lee, H., Jeong, U., and Kim, J.: Diurnal variations of NO2 tropospheric vertical column density over the Seoul Metropolitan Area from the Geostationary Environment Monitoring Spectrometer (GEMS): seasonal differences and impacts of varying a priori NO2 profile data, Atmos. Meas. Tech. Discuss. [preprint], https://doi.org/10.5194/amt-2024-33, in review, 2024. a
Souri, A. H., Kumar, R., Chong, H., Golbazi, M., Knowland, K. E., Geddes, J., and Johnson, M. S.: Decoupling in the vertical shape of HCHO during a sea breeze event: The effect on trace gas satellite retrievals and column-to-surface translation, Atmos. Environ., 309, 119929, https://doi.org/10.1016/j.atmosenv.2023.119929, 2023. a
Spurr, R. J.: VLIDORT: A linearized pseudo-spherical vector discrete ordinate radiative transfer code for forward model and retrieval studies in multilayer multiple scattering media, J. Quant. Spectrosc. Ra., 102, 316–342, https://doi.org/10.1016/j.jqsrt.2006.05.005, 2006. a
Stavrakou, T., Müller, J.-F., Bauwens, M., Boersma, K., and van Geffen, J.: Satellite evidence for changes in the NO2 weekly cycle over large cities, Sci. Rep., 10, 1–9, https://doi.org/10.1038/s41598-020-66891-0, 2020. a, b
Tilstra, L. G., de Graaf, M., Trees, V. J. H., Litvinov, P., Dubovik, O., and Stammes, P.: A directional surface reflectance climatology determined from TROPOMI observations, Atmos. Meas. Tech., 17, 2235–2256, https://doi.org/10.5194/amt-17-2235-2024, 2024. a, b
van der A, R. J., Eskes, H. J., Boersma, K. F., van Noije, T. P. C., Van Roozendael, M., De Smedt, I., Peters, D. H. M. U., and Meijer, E. W.: Trends, seasonal variability and dominant NOx source derived from a ten year record of NO2 measured from space, J. Geophys. Res.-Atmos., 113, D04302, https://doi.org/10.1029/2007JD009021, 2008. a
van Geffen, J., Eskes, H., Boersma, K., and Veefkind, J.: TROPOMI ATBD of thetotal and tropospheric NO2 data products, Tech. rep., 5P-KNMI-L2-0005-RP, Issue 2.4.0, https://sentinel.esa.int/documents/247904/2476257/sentinel-5p-tropomi-atbd-no2-data-products (last access: 18 December 2022), 2022. a, b, c
Van Roozendael, M., Hendrick, F., Friedrich, M., Fayt, C., Bais, A., Beirle, S., Bösch, T., Navarro Comas, M., Friess, U., Kariagkiozidis, D., Kreher, K., Merlaud, A., Pinardi, G., Piters, A., Puentedura, O., Prados-Roman, C., Reischmann, L., Richter, A., Tirpitz, J.-L., Wagner, T., Yela, M., and Ziegler, S.: Fiducial Reference Measurements for Air Quality monitoring using ground-based MAX-DOAS instruments (FRM4DOAS), Remote Sens., submitted, 2024. a, b
Veefkind, J., Aben, I., McMullan, K., Förster, H., de Vries, J., Otter, G., Claas, J., Eskes, H., de Haan, J., Kleipool, Q., van Weele, M., Hasekamp, O., Hoogeveen, R., Landgraf, J., Snel, R., Tol, P., Ingmann, P., Voors, R., Kruizinga, B., Vink, R., Visser, H., and Levelt, P.: TROPOMI on the ESA Sentinel-5 Precursor: A GMES mission for global observations of the atmospheric composition for climate, air quality and ozone layer applications, Remote Sens. Environ., 120, 70–83, https://doi.org/10.1016/j.rse.2011.09.027, 2012. a, b
Verhoelst, T., Compernolle, S., Pinardi, G., Lambert, J.-C., Eskes, H. J., Eichmann, K.-U., Fjæraa, A. M., Granville, J., Niemeijer, S., Cede, A., Tiefengraber, M., Hendrick, F., Pazmiño, A., Bais, A., Bazureau, A., Boersma, K. F., Bognar, K., Dehn, A., Donner, S., Elokhov, A., Gebetsberger, M., Goutail, F., Grutter de la Mora, M., Gruzdev, A., Gratsea, M., Hansen, G. H., Irie, H., Jepsen, N., Kanaya, Y., Karagkiozidis, D., Kivi, R., Kreher, K., Levelt, P. F., Liu, C., Müller, M., Navarro Comas, M., Piters, A. J. M., Pommereau, J.-P., Portafaix, T., Prados-Roman, C., Puentedura, O., Querel, R., Remmers, J., Richter, A., Rimmer, J., Rivera Cárdenas, C., Saavedra de Miguel, L., Sinyakov, V. P., Stremme, W., Strong, K., Van Roozendael, M., Veefkind, J. P., Wagner, T., Wittrock, F., Yela González, M., and Zehner, C.: Ground-based validation of the Copernicus Sentinel-5P TROPOMI NO2 measurements with the NDACC ZSL-DOAS, MAX-DOAS and Pandonia global networks, Atmos. Meas. Tech., 14, 481–510, https://doi.org/10.5194/amt-14-481-2021, 2021. a, b, c
Wagner, T., Ibrahim, O., Shaiganfar, R., and Platt, U.: Mobile MAX-DOAS observations of tropospheric trace gases, Atmos. Meas. Tech., 3, 129–140, https://doi.org/10.5194/amt-3-129-2010, 2010. a
Wallace, J. M. and Hobbs, P. V.: Atmospheric science: an introductory survey, vol. 92, Elsevier, ISBN 0-12-732951-X, https://www.ebook.de/de/product/4444872/john_m_university_of_washington_seattle_u_s_a_wallace_peter_v_university_of_washington_seattle_u_s_a_hobbs_atmospheric_science.html (last access: 28 October 2024), 2006. a
Williams, J. E., Boersma, K. F., Le Sager, P., and Verstraeten, W. W.: The high-resolution version of TM5-MP for optimized satellite retrievals: description and validation, Geosci. Model Dev., 10, 721–750, https://doi.org/10.5194/gmd-10-721-2017, 2017. a
Wittrock, F., Oetjen, H., Richter, A., Fietkau, S., Medeke, T., Rozanov, A., and Burrows, J. P.: MAX-DOAS measurements of atmospheric trace gases in Ny-Ålesund – Radiative transfer studies and their application, Atmos. Chem. Phys., 4, 955–966, https://doi.org/10.5194/acp-4-955-2004, 2004. a
Xu, T., Zhang, C., Xue, J., Hu, Q., Xing, C., and Liu, C.: Estimating Hourly Nitrogen Oxide Emissions over East Asia from Geostationary Satellite Measurements, Environ. Sci. Technol. Lett., 11, 122–129, https://doi.org/10.1021/acs.estlett.3c00467, 2023. a
Yang, L. H., Jacob, D. J., Colombi, N. K., Zhai, S., Bates, K. H., Shah, V., Beaudry, E., Yantosca, R. M., Lin, H., Brewer, J. F., Chong, H., Travis, K. R., Crawford, J. H., Lamsal, L. N., Koo, J.-H., and Kim, J.: Tropospheric NO2 vertical profiles over South Korea and their relation to oxidant chemistry: implications for geostationary satellite retrievals and the observation of NO2 diurnal variation from space, Atmos. Chem. Phys., 23, 2465–2481, https://doi.org/10.5194/acp-23-2465-2023, 2023. a
Yang, L. H., Jacob, D. J., Dang, R., Oak, Y. J., Lin, H., Kim, J., Zhai, S., Colombi, N. K., Pendergrass, D. C., Beaudry, E., Shah, V., Feng, X., Yantosca, R. M., Chong, H., Park, J., Lee, H., Lee, W.-J., Kim, S., Kim, E., Travis, K. R., Crawford, J. H., and Liao, H.: Interpreting Geostationary Environment Monitoring Spectrometer (GEMS) geostationary satellite observations of the diurnal variation in nitrogen dioxide (NO2) over East Asia, Atmos. Chem. Phys., 24, 7027–7039, https://doi.org/10.5194/acp-24-7027-2024, 2024. a, b, c, d, e, f
Yang, Q., Kim, J., Cho, Y., Lee, W.-J., Lee, D.-W., Yuan, Q., Wang, F., Zhou, C., Zhang, X., Xiao, X., Guo, M., Guo, Y., Carmichael, G. R., and Gao, M.: A synchronized estimation of hourly surface concentrations of six criteria air pollutants with GEMS data, npj Climate and Atmospheric Science, 6, 94, https://doi.org/10.1038/s41612-023-00407-1, 2023. a
Zhang, Y., Lin, J., Kim, J., Lee, H., Park, J., Hong, H., Van Roozendael, M., Hendrick, F., Wang, T., Wang, P., He, Q., Qin, K., Choi, Y., Kanaya, Y., Xu, J., Xie, P., Tian, X., Zhang, S., Wang, S., Cheng, S., Cheng, X., Ma, J., Wagner, T., Spurr, R., Chen, L., Kong, H., and Liu, M.: A research product for tropospheric NO2 columns from Geostationary Environment Monitoring Spectrometer based on Peking University OMI NO2 algorithm, Atmos. Meas. Tech., 16, 4643–4665, https://doi.org/10.5194/amt-16-4643-2023, 2023. a
Zoogman, P., Liu, X., Suleiman, R., Pennington, W., Flittner, D., Al-Saadi, J., Hilton, B., Nicks, D., Newchurch, M., Carr, J., Janz, S., Andraschko, M., Arola, A., Baker, B., Canova, B., Chan Miller, C., Cohen, R., Davis, J., Dussault, M., Edwards, D., Fishman, J., Ghulam, A., González Abad, G., Grutter, M., Herman, J., Houck, J., Jacob, D., Joiner, J., Kerridge, B., Kim, J., Krotkov, N., Lamsal, L., Li, C., Lindfors, A., Martin, R., McElroy, C., McLinden, C., Natraj, V., Neil, D., Nowlan, C., O'Sullivan, E., Palmer, P., Pierce, R., Pippin, M., Saiz-Lopez, A., Spurr, R., Szykman, J., Torres, O., Veefkind, J., Veihelmann, B., Wang, H., Wang, J., and Chance, K.: Tropospheric emissions: Monitoring of pollution (TEMPO), J. Quant. Spectrosc. Ra., 186, 17–39, https://doi.org/10.1016/j.jqsrt.2016.05.008, 2017. a
- Abstract
- Introduction
- Instruments and data sets
- Satellite tropospheric NO2 product comparison
- Evaluating satellite tropospheric NO2 VCD with ground-based data
- Diurnal variation in GEMS and ground-based tropospheric NO2 VCDs
- Summary and conclusions
- Appendix A
- Data availability
- Author contributions
- Competing interests
- Disclaimer
- Special issue statement
- Acknowledgements
- Financial support
- Review statement
- References


