the Creative Commons Attribution 4.0 License.
the Creative Commons Attribution 4.0 License.
An advanced spatial coregistration of cloud properties for the atmospheric Sentinel missions: application to TROPOMI
Athina Argyrouli
Diego Loyola
Fabian Romahn
Víctor Molina García
Pascal Hedelt
Klaus-Peter Heue
Richard Siddans
The retrieval of cloud parameters from the atmospheric Sentinel missions requires Earth reflectance measurements from a set of spectral bands. The ground pixels of the involved spectral bands should be fully aligned, but when they are not, special treatment is required within the operational algorithms. This so-called inter-band spatial misregistration of passive spectrometers is present when the Earth reflectance measurements in different spectral bands are captured by different spectrometers. The cloud retrieval algorithm requires reflectance measurements in the UV(ultraviolet)–VIS (visible) band, where the first cloud parameter (i.e., radiometric cloud fraction) is retrieved from OCRA (Optical Cloud Recognition Algorithm). In addition, Earth reflectances in the NIR (near-infrared) band are needed for the retrieval of two additional cloud parameters (i.e., cloud height and cloud albedo or cloud-top height and optical thickness) from the ROCINN (Retrieval of Cloud Information using Neural Networks) algorithm. In the former TROPOMI (TROPOspheric Monitoring Instrument)/S5P (Sentinel-5 Precursor) retrieval, a coregistration scheme of the derived cloud parameters from the source band to the target band based on pre-calculated mapping weights from UV–VIS to NIR and vice versa is applied. In this paper we present a new scheme for the coregistration of the TROPOMI cloud parameters using collocated VIIRS (Visible Infrared Imaging Radiometer Suite)/SNPP (Suomi National Polar-orbiting Partnership) information. The new coregistration scheme based on the VIIRS data improves the TROPOMI cloud product quality and allows the addition of cloud information for the first (westernmost) TROPOMI UVIS ground pixel. In practice, the latter means that a significant number of valid data points are included in the TROPOMI cloud, total ozone, SO2 and HCHO product since 26 November 2023 (orbit 31705), when the new coregistration scheme became operational. From a comparison analysis between the two techniques, we found that the largest differences mainly appear for inhomogeneous scenes. From a validation exercise of TROPOMI against VIIRS in the across-track direction, we found that the old coregistration scheme tends to smooth out cloud structures along the scan line, whereas such structures can be maintained with the new scheme. The need to implement a similar inter-band spatial coregistration scheme is foreseen for the Sentinel-4/MTG-S (Meteosat Third Generation – Sounder) and Sentinel-5/MetOp-SG (Meteorological Operational Satellite – Second Generation) missions. In the case of the Sentinel-4 instrument, the external cloud information will originate from collocated data captured by the FCI (Flexible Combined Imager) on board the MTG-I (Meteosat Third Generation – Imager) satellite.
- Article
(11087 KB) - Full-text XML
- BibTeX
- EndNote
The operational algorithms for the retrieval of cloud parameters from the atmospheric Sentinel missions make use of Earth-shine reflectance measurements in the spectral windows of the UV (ultraviolet), VIS (visible) and NIR (near-infrared) bands. Often those reflectances are captured by different spectrometers. For instance, the TROPOMI (TROPOspheric Monitoring Instrument) payload on board Sentinel-5 Precursor covers four distinct spectrometers (see Table 1), and each spectrometer is split electronically into two bands, i.e., the UV spectrometer is split into BD1 and BD2, the UVIS spectrometer is split into BD3 and BD4, the NIR spectrometer is split into BD5 and BD6, and the shortwave infrared (SWIR) spectrometer is split into BD7 and BD8 (see Veefkind et al., 2012). Using different spectrometers leads to different ground pixels for several bands that are not perfectly aligned, which is called inter-band spatial misregistration. Although it is much smaller than between different spectrometers, misalignment between ground pixels can also occur within the same spectrometer (Kleipool et al., 2018). The ground pixel misalignment is interconnected with the across-flight spatial resolution of UVIS–NIR TROPOMI measurements, which are equal to 3.5 km2 in the center of the swath and in a large area around it.
The TROPOMI Optical Cloud Recognition Algorithm (OCRA)/Retrieval of Cloud Information using Neural Networks (ROCINN) (Loyola et al., 2018) has a long-standing heritage and has already been applied operationally to a large number of instruments starting with GOME (Global Ozone Monitoring Experiment) on ERS-2 (European Remote Sensing Satellite) (Loyola et al., 2010). OCRA/ROCINN, described in Sect. 2, has been adapted for several follow-up missions, including SCIAMACHY (SCanning Imaging Absorption spectroMeter for Atmospheric CartograpHY) on ENVISAT (ENVIromental SATellite) (Loyola, 2004); the GOME-2 instruments on board MetOp-A/B/C (Meteorological Operational satellite) (Lutz et al., 2016); and the EPIC (Earth Polychromatic Imaging Camera) instrument on the DSCOVR (Deep Space Climate Observatory) satellite, located at the Lagrangian point L1 (Molina García, 2022). Furthermore, OCRA/ROCINN will be applied operationally to the Sentinel-4 instrument.
The operational processing of cloud products under German Aerospace Center (DLR) responsibility is performed using the UPAS (Universal Processor for Atmospheric Spectrometers) system. The two-step algorithm used for the UPAS cloud processing makes possible the simultaneous retrieval of three cloud properties as described in Loyola et al. (2018). The first step is to derive the radiometric cloud fraction fc in the UV–VIS spectral region. The OCRA algorithm retrieves the cloud fraction from the total measured reflectance by considering that the measured reflectance contains two contributions: one from the cloud-free background and a second one from the clouds. OCRA requires the clear-sky reflectance maps obtained from the same instrument (Lutz et al., 2016). The main assumption of the OCRA algorithm is wavelength independence of the cloudy spectrum reflectance over the considered wavelength ranges. This means that the reflectance for a fully cloudy pixel is equal for all OCRA colors considered, resulting in a white scene when the reflectances are transferred to color space. The second step is to retrieve two additional cloud parameters within the O2 A-band window (Schuessler et al., 2014) using the ROCINN algorithm. Using the independent pixel approximation (IPA) concept (Cahalan et al., 1994; Chambers et al., 1997), the sun-normalized radiances can be expressed as the summation of two components for the cloud-free and cloudy part of the pixel using the OCRA cloud fraction retrieved (see Eqs. 1 and 2). Several atmospheric conditions, with and without clouds, are simulated using LIDORT (Linearized Discrete Ordinate Radiative Transfer) radiances (Spurr, 2006). For the cloudy skies, the simulations are performed for two different cloud models. The Clouds-as-Reflecting-Boundaries (CRB) model is a simplistic approach that assumes that the cloud performs as a Lambertian reflector. The retrieved cloud parameters from the CRB model are the cloud albedo Ac and the cloud height Zc. Provided that this model contains a cloud that behaves like a simple reflecting boundary and does not have any geometrical extent, the retrieved height should not be considered the height of the cloud top but the height at the radiometric middle of the cloud. A more sophisticated approach called Clouds-As-Layers (CAL), parameterizes the cloud as a layer of liquid water particles with their scattering properties derived from the Mie theory (Van de Hulst, 1957; Bohren and Huffman, 1983). In this model, the cloud has a predefined geometrical thickness. The retrieved quantities are the cloud-top height Zct and the cloud optical thickness (COT) τc. The following mathematical expressions refer to the simulated CRB and CAL sun-normalized radiances, with Rs being the radiance from the ground and Rc the radiance from the cloud at the wavelength λ:
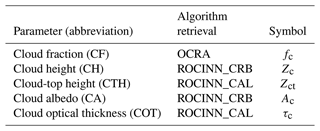
where Zs is the surface height; As the surface albedo; θ the path geometry; and Zcb the cloud-bottom height, which is fixed at 1 km below the cloud-top height. Table 2 summarizes the retrieved parameters from the operational cloud algorithm with the usual abbreviation notation and the corresponding mathematical symbols.
The cloud fraction, estimated by OCRA using image analysis, is a radiometric cloud fraction and does not necessarily match in all situations with a geometric cloud fraction as defined in the standard IPA. Since OCRA determines the cloud fraction based on how much the top-of-atmosphere (TOA) reflectances differ from the expected TOA reflectances under clear-sky conditions, it is not possible under all circumstances to discern whether the TOA reflectance discrepancy is caused by a fully cloudy scene with small COT or a partially cloudy scene with high COT. For limit cases with low COT (), it can be observed that the OCRA radiometric cloud fraction tends to be much lower than the geometric cloud fraction, and this discrepancy tends to be compensated for in ROCINN by retrieving a higher COT value.
Table 2List of cloud parameters, abbreviations and mathematical symbols referring to the operational cloud algorithm.
In the UPAS environment, LIDORT simulations are parameterized using neural networks (NNs) in order to speed up the forward-model simulations and to be able to process in near-real time (NRT) the large data volume of TROPOMI. For each input parameter (Zct, τc, etc.), a range is predefined and a large number of samples is generated using the smart sampling technique (Loyola et al., 2016). Then, the training set for the NN is generated by computing simulated radiances for all the sampling sets. This part is the most computationally expensive as it requires line-by-line LIDORT calculations, but it is only done once and offline. The accuracy of the NN is assessed by comparing the forward-model simulations with samples not used in the NN training.
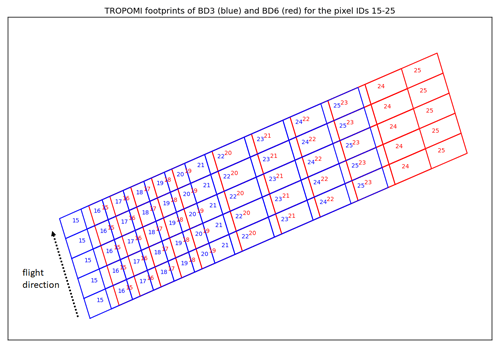
Figure 1TROPOMI ground pixels for the UVIS and NIR spectrometers. The band IDs for TROPOMI are described in Table 1: BD3 (blue) refers to the UVIS spectrometer and BD6 (red) refers to the NIR spectrometer.
The OCRA/ROCINN algorithm is the operational algorithm for the TROPOMI L2 cloud product within the Sentinel-5 Precursor (S5P) mission. This section describes the old coregistration approach and introduces the new approach that is implemented in addition to the old coregistration scheme for the operational S5P cloud algorithm. The misalignment of TROPOMI ground pixels from the UVIS and NIR spectrometers is illustrated in Fig. 1. Ground pixels 15–25 are shown for five continuous scan lines. Each TROPOMI scan line contains 450 pixels in BD3 and 448 pixels in BD6. In general, the BD6 ground pixels appear shifted towards the east with regard to the BD3 ground pixels. The spatial misalignment in the across-track direction is not a fixed number, but instead it depends on the position in the swath since the ground pixels at nadir are different in size than those at the swath edges. The ground pixel size is 3.5 km in the center of the swath and in a large area around it, but it becomes larger towards the edges of the swath due to the Earth's curvature and the instrument's large swath angle. The so-called binning factors are selected to optimize the signal-to-noise ratio per pixel with the aim of minimizing the difference in ground pixel sizes in the across-track direction. For the TROPOMI radiance measurements in BD3, BD4 and BD6, which are inputs to OCRA/ROCINN, a binning factor of 2 is used in the center and in a large region around it, resulting in a ground pixel size of 3.5 km. At the edges of the swath, the binning factor is reduced from 2 to 1 in order to keep the ground pixel size at a reasonable value. Due to optical limitations of the instrument and the curvature of the Earth, the ground pixel size at the edges of the swath is about 15 km (KNMI, 2022). The smallest misplacement in the across-track direction is found at the center of the swath, and it is about half a detector pixel, which is translated to about 1.75 km at nadir. Higher misalignment between BD3 and BD6 ground pixels, which can reach up to about 4 km, is present at the eastern edge of the swath. The coregistration needs to be performed in the across-track direction since there is no mismatch in the in-flight direction. The complementary instrument, which is used for the treatment of the spatial misregistration of TROPOMI, is VIIRS (Visible Infrared Imaging Radiometer Suite) on board the Suomi National Polar-orbiting Partnership (SNPP). The S5P satellite is located at a low-Earth orbit (LEO) and crosses the Equator in an ascending node at 13.30 mean local solar time. This facilitates the so-called loose formation operation with the SNPP spacecraft, with only a 3 to 5 min time difference from S5P. The spatial resolution of VIIRS at nadir is 750 m. The VIIRS cloud products are re-gridded to the TROPOMI ground pixels as part of the S5P-NPP cloud processor (Siddans, 2016). The pioneer methodology to improve the existing coregistration scheme from the UV–VIS to NIR and the NIR to UV–VIS using collocated imager data is presented in Sect. 3.3.1 and 3.3.2, respectively.
3.1 Previous treatment of the spatial misregistration in the operational UPAS system
Due to the spatial misregistration between the TROPOMI BD3 and BD6 bands, the operational cloud product contains a flag called the cloud coregistration inhomogeneity flag (CCIF). This flag is raised after the cloud coregistration inhomogeneity parameter (CCIP) has been elevated, which is defined as the weighted averaged gradient of cloud fractions,
where the weights wij correspond to the coregistration mapping values between UVIS bands (source, index i) and the NIR band (target, index j). The wij weights and the fcj cloud fraction in the NIR grid are estimated with the use of the mapping tables from Sneep (2015), as described below. The CCIF is raised if the CCIP is larger than 0.4. The aforementioned threshold has been selected based on tests from the VIIRS cloud product re-sampled to the TROPOMI spatial grid.
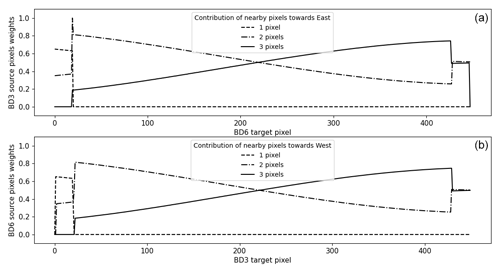
Since UPAS version 2.0, the coregistration method is based on pre-calculated mapping weights (Sneep, 2015) between BD3 and BD6, as illustrated in Fig. 2. This method for combining information from different bands is based on the fractions of overlapping areas between the source and target pixels. The weights sum up to a total of 1.0, and the most common situation is that 2 source pixels contribute to the target pixel with very few exceptions, which are discussed later in Sect. 3.3.1 and 3.3.2. When the coregistration is done from BD3 to BD6, the BD6 target pixels have a difference of 1, 2 or 3 pixels towards the east. When the coregistration is done from BD6 to BD3, the BD3 target pixels have a difference of 1, 2 or 3 pixels towards the west.
3.2 Evaluation of OCRA/ROCINN cloud properties for the TROPOMI instrument
Recent validation studies of the TROPOMI cloud properties against other sensors, i.e., the satellite-based VIIRS, OMI (Ozone Monitoring Instrument) and MODIS (Moderate Resolution Imaging Spectroradiometer) and the ground-based CloudNet network, discussed the similarities and differences between VIIRS and TROPOMI cloud parameters (Compernolle et al., 2021). The VIIRS geometrical cloud fraction is usually higher than the OCRA radiometric cloud fraction because of the different definitions, but there is an analogy between the two cloud fractions. One exception to the positive differences between the VIIRS and OCRA cloud fractions is the sun-glint region, where the dark ocean is perceived as a bright surface and very often misinterpreted as clouds. The magnitude of the sun-glint effect and the affected area depend on the smoothness of the ocean, which is determined by the wind properties over the ocean surface (Cox and Munk, 1954). The operational S5P cloud products include a flag indicating the occurrence of sun glint. Similarly, the cloud height derived from TROPOMI is usually below the cloud-top height from VIIRS because the infrared bands from VIIRS are more sensitive to clouds than the UV–VIS–NIR (UVN) bands from TROPOMI.
The need to handle the spatial misregistration between TROPOMI UVIS and NIR bands with a more dynamic and advanced approach was highlighted after the evaluation of OCRA/ROCINN cloud properties for the TROPOMI instrument. Recent intercomparison studies between TROPOMI cloud products, with the focus on cloud properties needed for trace gas retrievals, showed that the coregistration has an impact along the cloud edges (Latsch et al., 2022). The proper coregistration of the cloud properties is required for not only the improvement of the operational TROPOMI cloud product itself but also the direct impact that clouds have on the accurate retrieval of trace gases, including total ozone (Spurr et al., 2022), tropospheric ozone (Heue et al., 2018), HCHO (De Smedt et al., 2018) and SO2 (Theys et al., 2017).
3.3 Advancement in the coregistration approach with the synergistic use of VIIRS cloud data
VIIRS has a much finer spatial resolution than TROPOMI, which is 750 m at nadir. With this high spatial resolution, VIIRS captures small-scale cloud structures. VIIRS collects measurements in several spectral windows: the VIS–NIR band, mid-IR and LW (longwave) IR, which makes its cloud product more sensitive to optically thin ice clouds.
The VIIRS cloud products are re-gridded to the TROPOMI ground pixels as part of the S5P-NPP cloud processor (Siddans, 2016). An auxiliary product, which contains cloud information relevant to each TROPOMI ground pixel, can be derived from observations captured by the VIIRS instrument. This operational L2 auxiliary product is called the S5P-NPP cloud product and was developed by the Rutherford Appleton Laboratory (Siddans, 2016). In this work, we present how the S5P-NPP cloud data are used for the coregistration of the cloud product from BD3 to BD6 and vice versa. The S5P-NPP cloud product accepts as inputs a set of cloud-related VIIRS EDRs (environmental data records): (a) the CloudMask that is necessary for the coregistration of OCRA cloud fraction, (b) the CloudHeight EDR mandatory for the coregistration of ROCINN cloud height and (c) the CloudDCOMP (daytime cloud optical and microphysical properties) EDR for the coregistration of ROCINN cloud albedo/optical thickness.
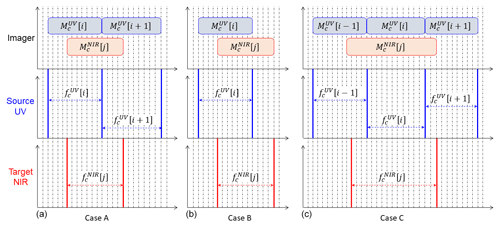
Figure 3Coregistration of OCRA cloud fraction from UV–VIS to NIR: the UV–VIS ground pixels are denoted by the blue boxes and the NIR ground pixels by the red boxes. The dashed vertical lines compose a grid for illustration purposes. Case A (a) shows the typical situation of 2 source pixels contributing to the target pixel. (b) Case B shows the exception of 1 source pixel contributing to the target pixel. (c) Case C shows the exception of 3 source pixels contributing to the target pixel.
The VIIRS enterprise cloud mask (ECM) describes the area of the Earth's horizontal surface that is masked by the vertical projection of detectable clouds (Heidinger and Straka, 2020). The ECM combines spectral and spatial tests to produce a 4-level classification of cloudiness of the ECM cloud mask , where X is any of the following categories: confidently clear, probably clear, probably cloudy, or confidently cloudy. Apart from solar reflectances in the VIS, the ECM makes use of spectral channels in the IR that are more sensitive to clouds. The retrieval method is based on a naive Bayesian approach as part of a library of machine learning (ML) methods, already successfully applied within Pathfinder Atmospheres Extended (PATMOS-x) (Heidinger et al., 2012).
For the coregistration of the TROPOMI cloud fraction, an equivalent VIIRS cloud fraction Mc can be calculated as the number of confidently cloudy pixels divided by the sum of all four cloudiness classes:
The expression of the VIIRS cloud fraction Mc has been also calculated by considering the sum of confidently and probably cloudy classes in the nominator. The difference was minor compared to the definition of Eq. (4), and therefore, the latter mathematical expression was considered most appropriate.
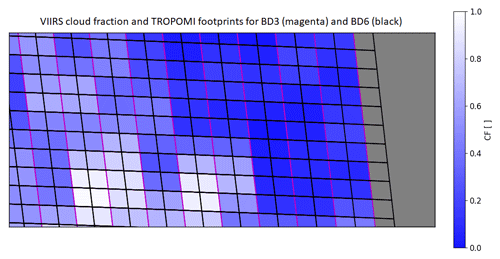
Figure 4TROPOMI ground pixels for bands 3 and 6 at the eastern edge of the orbit. Provided that the mismatch is only in the across-track direction, the horizontal magenta lines of BD3 overlap with the horizontal black lines of BD6.
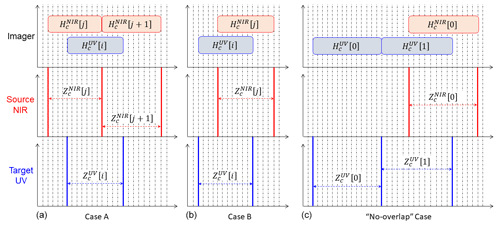
Figure 5Coregistration of ROCINN cloud height from NIR to UV–VIS: the NIR ground pixels are denoted by the red boxes and the UV–VIS ground pixels by the blue boxes. The dashed vertical lines compose a grid for illustration purposes. Case A (a) shows the typical situation of 2 source pixels contributing to the target pixel. (b) Case B shows the exception of 1 source pixel contributing to the target pixel. (c) The no-overlap case shows the special situation of the zeroth BD3 target pixel present in TROPOMI.
VIIRS cloud-top height is defined for each cloud-covered Earth location as the set of heights above mean sea level of the tops of the cloud layers overlaying the location (Heidinger et al., 2020). The cloud height algorithm (ACHA) has already been applied for the retrieval of the cloud height property from several sensors like MODIS and the GOES-16/17 (US Geostationary Operational Environmental Satellite R-series) ABI (Advanced Baseline Imager). ACHA makes use of only infrared channels in order to provide consistent products for both daytime and nighttime, as well as the terminator conditions. It uses an analytical radiative transfer model embedded in an optimal estimation retrieval approach (Rodgers, 2000). The primary retrieved cloud property is the cloud-top temperature, and, at a later step, the cloud-top pressure and cloud-top height are derived from the atmospheric temperature profile based on the numerical weather prediction (NWP) data. For the coregistration of ROCINN CRB cloud height and ROCINN CAL cloud-top height, the cloud-top-height variable in the EDR CloudHeight can be directly used. VIIRS cloud-top height is denoted as in the UVIS ground pixel and in the NIR ground pixel.
VIIRS cloud optical thickness is defined as the optical thickness of the atmosphere due to cloud droplets per unit cross section, integrated over every distinguishable cloud layer and all distinguishable cloud layers in aggregate, in a vertical column above a horizontal cell on the Earth's surface (Walther and Straka, 2020). The COT together with the effective particle size and liquid/ice water path are the cloud properties retrieved from the daytime cloud and optical and microphysical properties (DCOMP) algorithm (Walther and Heidinger, 2012). The DCOMP algorithm works for not only VIIRS but also more sensors with observations in VIS and NIR. So far, it has been applied to the geostationary satellites SEVIRI (Spinning Enhanced Visible and InfraRed Imager), the GOES R-series, MTSAT (Multifunctional Transport Satellites) and HIMAWARI and to the polar-orbiting satellites of the NOAA-AVHRR (Advanced Very High-Resolution Radiometer) series and MODIS. The retrieval approach is based on solving the radiative transfer equation for a single-layered, plane-parallel homogeneously distributed cloud. The retrieval originates from earlier methods that also retrieve cloud optical depth and cloud effective radius from the visible and near-infrared wavelengths (King, 1987; Nakajima and King, 1990a, b).
For the coregistration of ROCINN CAL cloud optical thickness, the COT variable in the EDR CloudDCOMP can be used directly. For the coregistration of the cloud albedo, the following approximation conversion formula is used to bring the VIIRS cloud optical thickness (τc) to an equivalent cloud albedo (Ac) (Loyola, 2013; Kokhanovsky and Mayer, 2003):
with fg being the constant for water clouds equal to 0.85, and the other constant numbers derived from semi-empirical formulas (Kokhanovsky and Mayer, 2003). Similar conversion is required for the regridding of VIIRS cloud optical thickness to the TROPOMI ground pixels within the S5P-NPP cloud processor, but there the cloud optical thickness is converted to an effective transmission (see Eq. 29 in Siddans, 2016) target pixel.
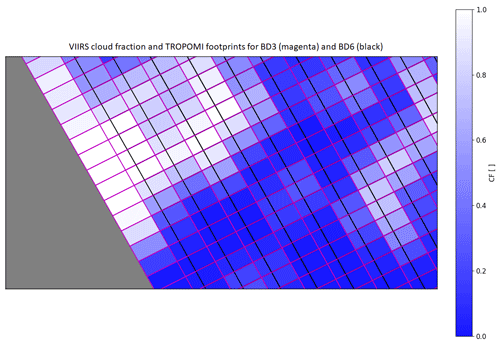
Figure 6TROPOMI ground pixels for bands 3 and 6 at the western edge of the orbit. Provided that the mismatch is only in the across-track direction, the horizontal magenta lines of BD3 overlap with the horizontal black lines of BD6.
3.3.1 New scheme for the coregistration of OCRA cloud fraction from UV–VIS to NIR
OCRA uses the reflectances from the UV–VIS spectral region, and the coregistration is therefore done from the UV–VIS source band to the NIR target band. We denote with index j the row in the NIR grid and with index i the row in UV–VIS grid.
The most common situation is that two UV–VIS source pixels contribute to the NIR target pixel, as demonstrated in case A in Fig. 3. When those UV–VIS pixels from the imager have different cloud fraction values, the weight (γ) for the jth target pixel is calculated according to the following mathematical formulation:
with the cloud fraction Mc derived from Eq. (4). Then, the cloud fraction at the jth target pixel is computed as
In the case that the neighboring UV–VIS pixels from the imager have equal cloud fraction values, the weight calculation is simplified as
Special treatment needs to be considered for cases with only partial overlap between the source and target bands. For example, in TROPOMI there is only partial overlap between the source and target bands at the eastern edge of the swath, as shown in Fig. 4. Therefore, the last target pixel of every scan line has the contribution of a single source pixel, as illustrated in case B in Fig. 3. The weight calculation for this pixel is done similarly to Eq. (8), and the coregistered cloud fraction is then expressed as
Other exceptions might refer to pixels affected by a binning change, where the binning factor changes from 2 to 1 (see Sect. 3). For TROPOMI, the binning change at the eastern edge of the swath, which occurs at target pixel number 19 of every scan line, creates a special case of 3 BD3 pixels contributing to the target BD6 pixel. Case C in Fig. 3 demonstrates this special situation, where the calculation of two weighting factors is required; one between the (i−1)th and ith pixel defined as γ1 and a second one between the ith and (i+1)th pixel defined as γ2.
with the final coregistered cloud fraction at the target NIR pixel expressed as the following:
The binning factor change at the western edge of the swath does not create any exceptions (see Fig. 2) but falls into the typical case A of two BD3 source pixels contributing to the BD6 target pixel.
Note that the cloud fraction coregistration using VIIRS input is applicable to cloud scenes where contains different values in the adjacent contributing pixels, as the weight computation from Eq. (6) is numerically impossible in scenes where . This precludes the applicability of the new approach to fully cloudy VIIRS scenes. Due to this limitation, the calculation of independent weighting factors for each cloud parameter based on different VIIRS input is required. The coregistration of the ROCINN cloud height becomes possible also under fully cloudy scenes if the respective γ factor is computed from VIIRS cloud-top height inputs.
3.3.2 New scheme for the coregistration of ROCINN cloud parameters from NIR to UV–VIS
ROCINN retrieves the additional cloud parameters in the oxygen A-band of NIR (source band with index j). However, the trace gases are derived in a different band and need the cloud information in UV–VIS (target band with index i). When the coregistration takes place from NIR to UV–VIS, the most frequent scenario is that 2 source pixels contribute to the target pixel, as shown in case A in Fig. 5. Following Eq. (6), the weight for the ith UV–VIS target pixel is then calculated as
Then, the cloud-top height at the target pixel is expressed as
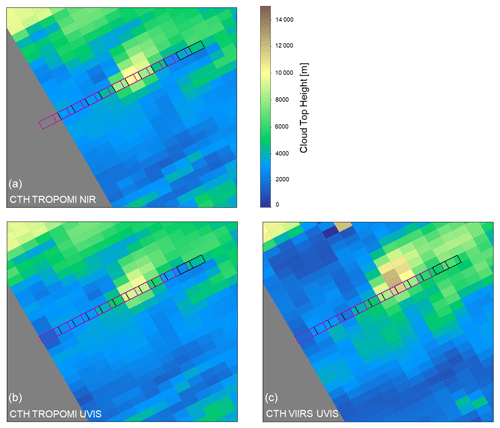
Figure 7Coregistration of ROCINN cloud height from BD6 to BD3 using the VIIRS first pixel: example scene. Ground pixels in the source NIR band are indicated by the black frames and the UVIS ground pixels by the magenta frames. Note that (a) the CTH TROPOMI NIR (original parameter) does not contain values in the first magenta ground pixel, and (b) the coregistered CTH TROPOMI UVIS and the original CTH TROPOMI NIR maps are very similar, demonstrating that the new coregistration scheme does not introduce inconsistencies. Compare visually the CTH TROPOMI and CTH VIIRS in UVIS and observe that the cloud-top height values can be very different in absolute numbers, but the new coregistration scheme does not alter the original cloud structures.
The upper mathematical expressions are valid along the scan line. However, for every sensor there might be exceptions and thus adaptations. For TROPOMI, such exceptions can be spotted in Fig. 2 at (a) BD3 target pixel 21, which is fully covered by BD6 source pixel 19 (see also Fig. 1); (b) BD3 target pixel 1, where there is partial overlap with BD6 source pixel 0; and (c) BD3 target pixel 0, where there is no overlap with any source pixel (see also Fig. 6). The first two exceptions fall into case B in Fig. 5 and follow the mathematical formulations from Eqs. (8) and (9):
The last exception to the BD3 target pixel 0 has been treated independently since there is lack of overlap between the BD6 source and BD3 target pixels. A graphical illustration of this scenario is shown in the no-overlap case in Fig. 5. The cloud information from the VIIRS imager can be used for the reconstruction of the cloud parameters at the S5P BD3 target pixel 0. The basic principle is that VIIRS and TROPOMI cloud data are interconnected, and therefore, each point from the VIIRS dataset can be mapped to the respective TROPOMI point. The adjacent 15 pairs are used to create the mapping function:
The mapping function for the cloud-top height can be approximated well with a linear regression model. Therefore, first the mapping function is found for each scan line and then the value at the target pixel 0 is estimated as . One example scene for TROPOMI BD3 target pixel 0 is shown in Fig. 7, where it is shown that the no-overlap approach does not introduce inconsistencies or outliers. Note that since this additional information for TROPOMI BD3 target pixel 0 originates from the VIIRS instrument but is scaled to TROPOMI values, the quality of the data depends on how accurately the VIIRS/TROPOMI mapping functions have been constructed. This particularity is built into the QA (quality assurance) value scheme by adding a penalty for the first TROPOMI BD3 ground pixel (Loyola et al., 2023).
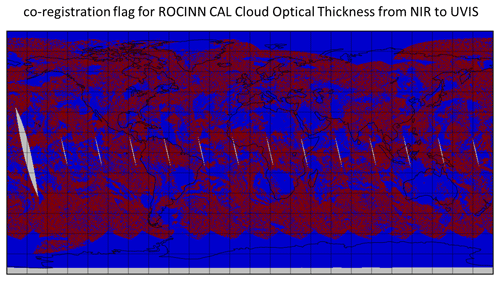
Figure 8RB color global maps presenting the coregistration flag of 9 September 2018 for ROCINN CAL cloud optical thickness: red shows the coregistration with the use of VIIRS data, and blue shows the coregistration with the fallback. The new scheme is applicable for ROCINN CAL cloud optical thickness for about 55 % of the total pixels.
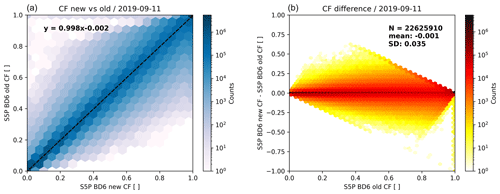
Figure 9The coregistered cloud fraction for the new versus the old scheme: the analysis refers to 2.262591×107 pixels without applying any filtering for 11 September 2019. The CF scatterplot (a) shows the coregistered new in the x axis versus the coregistered old in the y axis. The CF difference scatterplot (b) shows the CF difference in the x axis versus the old cloud fraction in the y axis.
The coregistration of the other ROCINN parameters at target pixel 0 is possible after finding the mapping functions and for the cloud albedo and cloud optical thickness, respectively. Those functions are approximated with the use of one linear and one logarithmic model (Loyola et al., 2023).
The new approach has been evaluated using several means of comparison and validation. The VIIRS product has been re-gridded to the TROPOMI ground pixels for the following 6 test days: 9 September 2018 (orbits 04691–04704), 11 September 2019 (orbits 09898–09911), 11 September 2020 (orbits 15091–15104), 26 September 2020 (orbits 15303–15316), 11 April 2021 (orbits 18098–18111) and 11 September 2021 (orbits 20269–20282).
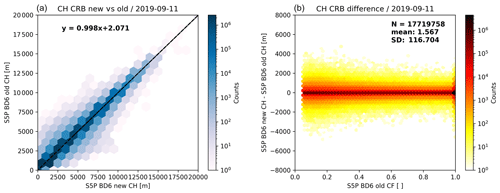
Figure 10The coregistered ROCINN CRB cloud height for the new versus the old scheme: the analysis refers to 1.7719758×107 pixels without applying any filtering for 11 September 2019. The CH CRB scatterplot (a) shows the coregistered new in the x axis versus the coregistered old in the y axis. The CH CRB difference scatterplot (b) shows the CH difference – in the x axis versus the old cloud fraction in the y axis. Notice that there are no data points below , as this is considered the lower threshold for ROCINN CRB triggering.
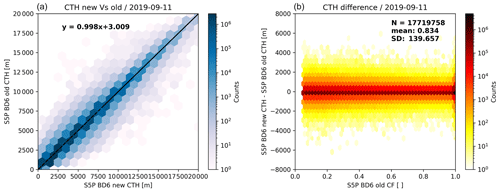
Figure 11The coregistered ROCINN CAL cloud-top height for the new versus the old scheme: the analysis refers to 1.7719758×107 pixels without applying any filtering for 11 September 2019. The CTH scatterplot (a) shows the coregistered new in the x axis versus the coregistered old in the y axis. The CTH difference scatterplot (b) shows the CTH difference – in the x axis versus the old cloud fraction in the y axis. Notice that there are no data points below , as this is considered the lower threshold for ROCINN CAL triggering.
4.1 Evaluation of the new approach
The new approach has been applied in addition to the old scheme to ensure that the coregistration is still performed with the static mapping tables when there are no VIIRS data available. The new scheme is in principle not applicable to the following situations: (a) when TROPOMI or VIIRS pixels contain fill values; (b) when the neighboring VIIRS pixels contain equal values, leading to numerical errors at the weight calculations; and (c) when the weight calculation results in values outside the expected range. Another special case where the new approach for the CF coregistration is not applicable is when all three VIIRS BD3 pixels are equal, , while S5P BD3 pixels are different, . The combination of both schemes ensures that the cloud product contains as much data as possible.
4.1.1 Overview of comparisons between the two schemes
Note that the OCRA cloud fraction must be coregistered to NIR with the fallback for VIIRS fully cloudy scenes (i.e., when the VIIRS cloud fraction at both BD3 and BD6 is equal to 1). Therefore, the VIIRS-based scheme is expected to be used for the coregistration of the OCRA cloud fraction at about 30 % frequency. The average frequency differs slightly from day to day, but it can be considered rather stable when there is VIIRS data availability. The coregistration from NIR to UVIS for the ROCINN parameters is performed with the new scheme with an average frequency of about 70 % for the ROCINN CAL cloud-top height (same applies to ROCINN CRB cloud height) and with an average frequency of about 55 % for the ROCINN CAL cloud optical thickness (same applies to ROCINN CRB cloud albedo). As seen from the coregistration flag of the ROCINN CAL cloud optical thickness in Fig. 8 (same applies to ROCINN CRB cloud albedo), the new scheme is only applicable up to a certain latitude, and the pixels around the poles are coregistered with the fallback. The only reason for this limitation is that the VIIRS cloud optical thickness originates from the CloudDCOMP EDR (see Sect. 3.3), which does not contain valid points at high latitudes.
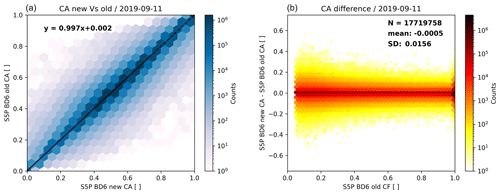
Figure 12The coregistered ROCINN CRB cloud albedo for the new versus the old scheme: the analysis refers to 1.7719758×107 pixels without applying any filtering for 11 September 2019. The CA scatterplot (a) shows the coregistered new in the x axis versus the coregistered old in the y axis. The CA difference scatterplot (b) shows the CA difference – in the x axis versus the old cloud fraction in the y axis. Notice that there are no data points below , as this is considered the lower threshold for ROCINN CRB triggering.
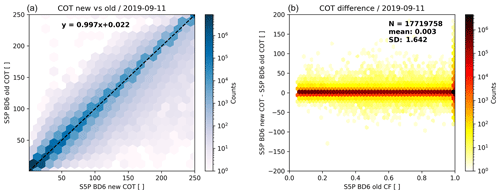
Figure 13The coregistered ROCINN CAL cloud optical thickness for the new versus the old scheme: the analysis refers to 1.7719758×107 pixels without applying any filtering for 11 September 2019. The COT scatterplot (a) shows the coregistered new in the x axis versus the coregistered old in the y axis. The COT difference scatterplot (b) shows the COT difference – in the x axis versus the old cloud fraction in the y axis. Notice that there are no data points below , as this is considered the lower threshold for ROCINN CAL triggering.
Figures 9, 10, 11, 12 and 13 present the scatter between the old and new approach for the coregistered parameters, after the mapping and without any filtering, for 1 of the days. High correlation coefficients are found for all cloud parameters. For the cloud fraction in Fig. 9, we find that there is less scatter below the identity line than above the identity line. Pixels from fully cloudy conditions (i.e., with cloud fraction 1) in the old scheme have been differentiated in several cases; the cloud fraction obtains lower values with the new scheme, as shown in the scatterplot of the CF differences (see Fig. 9b). This means that outliers have been completely or partially removed. For the partly cloudy pixels (i.e., ), some symmetry in the Δfc differences is observed. The cloud height CRB and cloud-top height CAL are scattered symmetrically around the identity line, as can be seen in Figs. 10 and 11, respectively. Note that the density of data points above 15 km for CH CRB is significantly reduced compared to the respective CTH from the ROCINN CAL model. This is expected due to the different cloud model definitions (i.e., ROCINN CRB versus ROCINN CAL), and it is still maintained with the new coregistration. The largest ΔZc differences are observed for the small cloud fractions. Likewise for the CA shown in Fig. 12, symmetry around the identity line is observed in the CA scatterplot, and the largest ΔAc differences are observed for the small cloud fractions. On the contrary, some asymmetry is observed in the cloud optical thickness in Fig. 13, with the scatter below the identity line being much higher than the scatter above the line. The respective analysis for the rest of the days leads to similar findings.
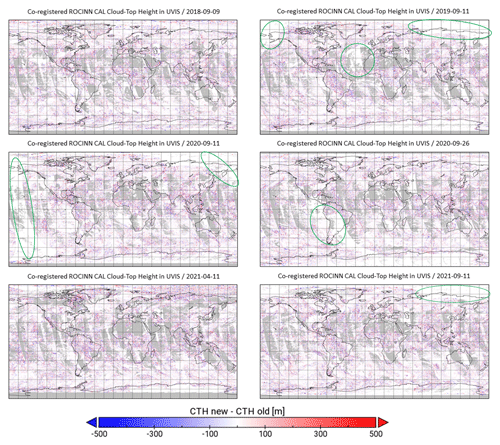
Figure 14Daily global maps with comparisons between the two coregistration schemes: the ROCINN CAL absolute differences ΔZct in the UVIS grid are shown for the 6 available days.
The ROCINN CAL absolute differences ΔZct between the two coregistration schemes at a global scale are shown in Fig. 14. The differences are exactly zero when VIIRS data are not available because the coregistration is done with the fallback. Examples of VIIRS data unavailability (i.e., missing granules or entire orbits) are shown in green ellipsoids on the map. The global maps for the differences in the other cloud parameters further support the following conclusions.
-
The differences are not systematically present in certain regions but are rather spread everywhere.
-
There is no latitudinal dependence.
-
Viewing geometry dependencies are not present.
4.1.2 The first westernmost UVIS TROPOMI ground pixel
The use of VIIRS data made the reconstruction of cloud information possible for the first (westernmost) TROPOMI ground pixels in the UVIS grid (see the no-overlap case in Fig. 5). The benefit of making use of the VIIRS cloud information to fill in the first UVIS ground pixel is 2-fold: (a) the apparent advantage of reducing the gap between two adjacent orbits by one ground pixel and (b) the actual retrieval of tropospheric and stratospheric trace gases, which requires the knowledge of cloud parameters. The data gaps between two adjacent orbits are expected around the Equator because the Earth has its maximum circumference there. The effect is a combination of the limitations of TROPOMI swath width together with the inclination and altitude of the S5P satellite orbit. With the new coregistration scheme, those gaps are decreased by approximately 15 km after the addition of meaningful cloud data in the first UVIS ground pixel (see Fig. 15). The approach seems to work smoothly for all cloud types since the cloud heights of the first UVIS ground pixels are harmonized well with the neighboring ones. Similar conclusions can be drawn for all the remaining cloud parameters.
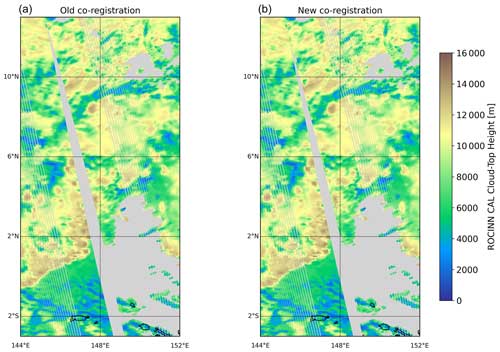
Figure 15Two adjacent orbits displaying the coregistered cloud-top height at the UVIS grid using the static lookup tables (LUTs) (a: old coregistration) versus using VIIRS data (b: new coregistration). The gaps between the adjacent orbits are reduced with the addition of meaningful cloud data at the first UVIS ground pixels.
The air mass factor (AMF) calculation was evaluated for the total vertical column densities (VCDs) of formaldehyde (HCHO), ozone (O3) and sulfur dioxide (SO2) in the first UVIS ground pixel. The plot in Fig. 16 depicts the total vertical column of ozone, where in most cases we see an additional column of O3 data, and the data agree very well with the neighboring column. This smooth transition is found for all cloud fractions, as shown in Fig. 17. In the selected area, there are cloudy and cloud-free pixels, as well as partly cloudy pixels. Even in the partly cloudy pixels, the O3 columns agree well with the neighboring ones. For HCHO and SO2 retrievals, the VCDs look smooth and reasonable for this additional row. For SO2, the detection algorithm was even able to identify elevated VCDs in the first row and flag them as being of volcanic origin. In Fig. 18, we can see the SO2 column densities after the Sierra Negra volcanic eruption. In the selected area, the pixels from the additional first row highlighted with a red frame have been automatically flagged as volcanic.
4.2 Further evaluation in the across-track flight direction
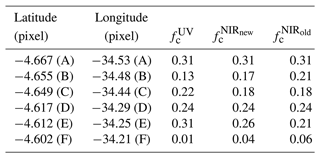
An extensive investigation of the coregistration scheme impact on the cloud fraction in the across-flight direction has been performed. As expected, the major improvements have been identified at heterogeneous scenes in the vicinity of local minima and maxima. Usually, the coregistered value is closer to the one retrieved at the original band when using the new scheme. So far, we have seen that the coregistration process with the static mapping tables tends to smooth out structure that appears initially at the original band. When the coregistration is done based on the VIIRS data, the cloud structure is maintained simply because it is captured by the VIIRS-based weighting factors. The coregistration impact can be larger in inhomogeneous scenes with relatively small cloud fractions; a small fluctuation in the cloud fraction at a low cloud fraction results in a large fractional difference. An example of a single scan line in longitude range 34.7–34.1° W is presented in Fig. 19. The improvement with the new scheme is shown in points A–C around longitude 34.5° W. The OCRA cloud fraction at the original BD3 has the same value at BD6 after the coregistration at point A. In other words, both coregistration schemes agree with the value obtained at the original band. However, the drop of the cloud fraction at point B demonstrates the importance of the coregistration scheme selection. The coregistered value obtained with the new scheme at point B is closer to the original one from BD3 than with the old scheme. In Table 3, an absolute difference of 0.04 is found between the two schemes, which at first does not seem significant. However, due to the low original cloud fraction of 0.13, a fractional difference of 30 % seems to be introduced simply by the use of a different coregistration. Another important aspect at point B is that the cloud fraction decreases below 0.2 with the new scheme. A cloud fraction of 0.2 is usually considered the cutoff threshold for clear skies versus partially cloudy to obtain the clear-sky series of tropospheric trace-gas concentrations (Liu et al., 2021). The cloud fraction with the old coregistration was 0.21, which means that trace-gas retrieval for point B will be triggered with the new coregistration scheme. Similar improvement is found at points D–F in the longitude range 34.3–34.2° W. At point D, both coregistered cloud fractions are equal to the original one. But at point E, the new coregistered cloud fraction is 16 % lower than the original value. At point E when coregistration is done with the old scheme, the fractional difference is 32 %. Even more interesting is the situation at point F where the original value is extremely low (0.01). There, the selection of the coregistration scheme will determine the activation of the ROCINN algorithm. The new coregistered value is still below 0.05, which is the threshold currently used to continue with the ROCINN retrievals of the remaining cloud parameters. Therefore, the use of VIIRS in the cloud coregistration process can act as a tool to remove existing cloud outliers.
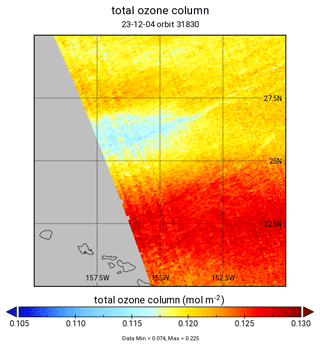
Figure 16The total ozone column for the scene in Fig. 17. The total ozone column for the first row looks smooth w.r.t. the adjacent rows.
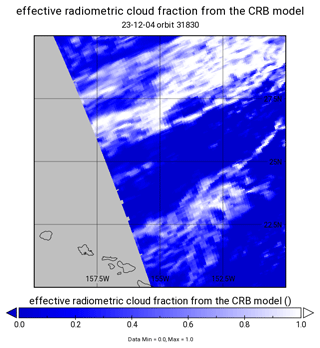
Figure 17The radiometric cloud fraction from the ROCINN CRB model is used as an input parameter for the cloud correction in the ozone offline (OFFL) algorithm.
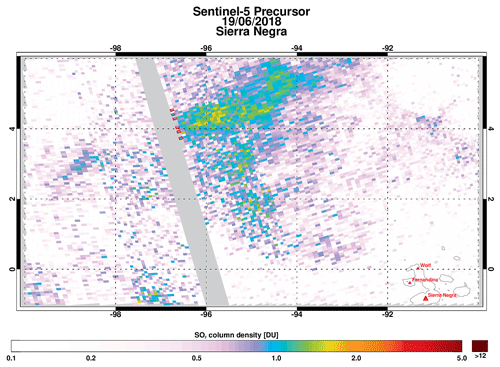
Figure 18The SO2 column density for a scene of the Sierra Negra volcanic eruption. Pixels highlighted with the red frames are detected as being of volcanic origin. The detection algorithm for volcanic SO2 seems to work well for the additional first UVIS ground pixels, as some of them are flagged as volcanic.
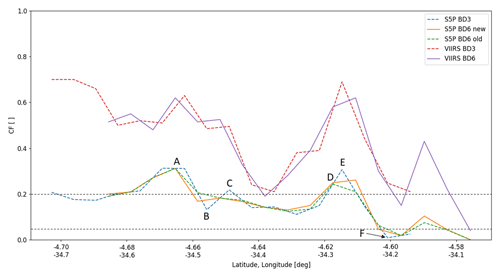
Figure 19Inhomogeneous scene with low TROPOMI cloud fraction: the new coregistration scheme has a considerable positive effect at local minimum (e.g., points B and F) or maximum (e.g., point E). The data refer to 11 September 2020, orbit 15099, scan line 1820, pixels 268–285.
Table 3Cloud fraction values at the original BD3 and the coregistered BD6 using both new and old techniques. The latitudes (first column) and longitudes (second column) refer to points A–F in Fig. 19.
A second interesting scene with scattered clouds close to the Brazilian coastline is presented in Fig. 20. At around longitude -36.10° W, the cloud fraction obtained in BD3 was equal to 0.96. This is a scene over ocean with the effect of sun glint. An enhanced TROPOMI cloud fraction is generally expected under sun-glint geometry, and this is a possible reason that the OCRA cloud fraction is larger than that of VIIRS; VIIRS gives a cloud fraction of 0.72 in both bands. The old coregistration scheme moves the cloud fraction closer to VIIRS. Nevertheless, the new coregistration seems to reflect the original BD3 cloud fraction of 0.96 better versus a 0.94 BD6 cloud fraction.
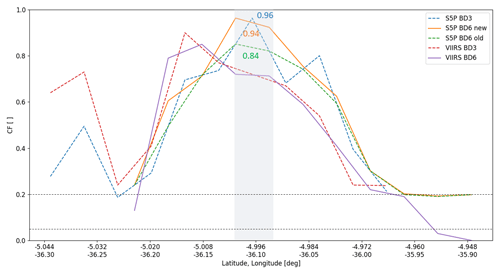
Figure 20Inhomogeneous scene with high TROPOMI cloud fraction but with small horizontal extent. This could be considered a single-cloud scene where the new coregistration is preferable at local maximum because the S5P BD6 new cloud fraction agrees better with the S5P BD3 cloud fraction. The data refer to 11 September 2020, orbit 15099, scan line 1820, pixels 219–230.
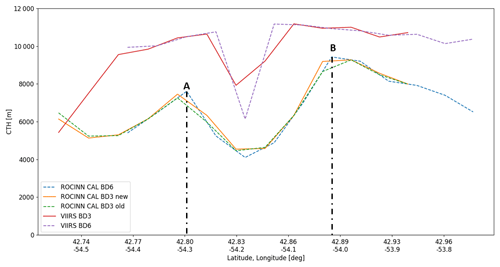
Investigation of the coregistration scheme impact on the cloud-top height in the across-flight direction has been done too. In general, similar to the cloud fraction, the largest impact is shown on the inhomogeneous scenes at the local maxima and minima. At first, the new coregistered cloud-top height is closer to the one obtained with ROCINN CAL at the original BD6 band. Two examples are shown in Fig. 21 at points A and B, with the new coregistered cloud-top height being approximately 300 m higher than the old coregistered value and in both cases closer to the original values. The cloud-top heights at the original BD6 were 7600 and 9400 m at points A and B, respectively. After the coregistration, we approximated the BD3 cloud-top height at point A by taking into account the two contributing pixels: with the old scheme it was approximately 6600 m (the contributing pixels had CTH values of about 7200 and 6000 m), and with the new scheme it was about 6900 m (the contributing pixels had CTH values of about 7500 and 6300 m). At point B, the coregistered CTH at BD3 with the new scheme was approximately 9300 m (both contributing pixels had CTH values of about 9300 m), and with the old scheme it was about 9000 m (contributing pixels had values of about 8700 and 9300 m). We see that the advantage of using the VIIRS re-gridded data for the ROCINN cloud height coregistration is that small-scale cloud structures can be introduced back into the TROPOMI UVIS CTHs, while with the old coregistration approach they were smoothed out.
4.3 Evaluation in the along-track flight direction: comparisons against CALIPSO overpasses
The evaluation of the new coregistration scheme in the along-track direction for the cloud-top height parameter was done using the independent instrument CALIOP (Cloud-Aerosol Lidar with Orthogonal Polarization), which is part of the CALIPSO (Cloud-Aerosol Lidar and Infrared Pathfinder Satellite Observations) payload. The CALIPSO satellite was launched in April 2006 in formation with the CloudSat satellite as part of the A-Train constellation of satellites (Winker et al., 2003, 2004, 2007). For 12 years, it maintained a sun-synchronous orbit with an altitude of 705 km and inclination of 98.2°, crossing the Equator each day at around 13:30 solar time. After September 2018, it was moved to a lower orbit together with CloudSat, part of the C-train approximately 688 km above the Earth's surface (Atkinson, 2018). CALIOP was a two-wavelength (i.e., operating at 532 and 1064 nm) polarization-sensitive lidar that provided high-resolution vertical profiles of aerosols and clouds. CALIOP was able to identify cloud and aerosol layers down to the level at which the lidar signal was totally attenuated. Frequently, the atmosphere contained multilayer clouds limiting the lidar capabilities and making the cloud retrievals in such conditions more challenging (Liu et al., 2020). Even though CALIOP was able to provide the cloud information with the fine spatial resolution of 1 km, in this study the spatial resolution of 5 km in the Level 2 cloud layer information (Version 4) was used.
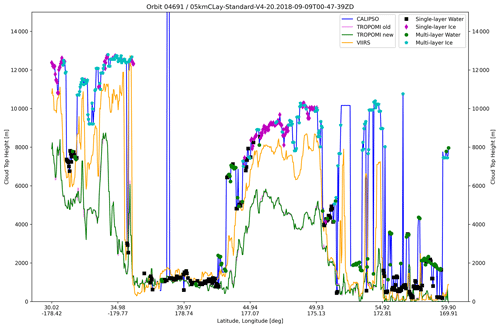
Figure 22Comparison of the CTH for TROPOMI, VIIRS and CALIPSO for midlatitudes in the Northern Hemisphere over the Pacific Ocean. TROPOMI orbit 04691 for 9 September 2018 is collocated with the CALIPSO measurements from the 2018-09-09T00-47-39ZD overpass.
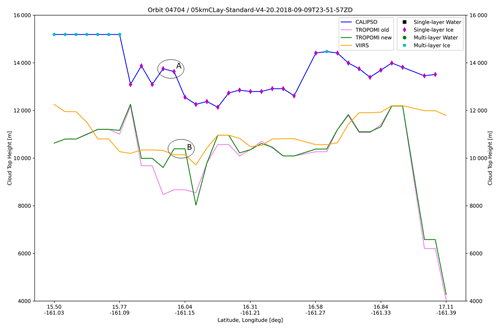
Figure 23Comparison of the CTH for TROPOMI, VIIRS and CALIPSO for the tropics in the Northern Hemisphere over the Pacific Ocean. TROPOMI orbit 04704 for 9 September 2018 is collocated with the CALIPSO measurements from the 2018-09-09T23-51-57ZD overpass.
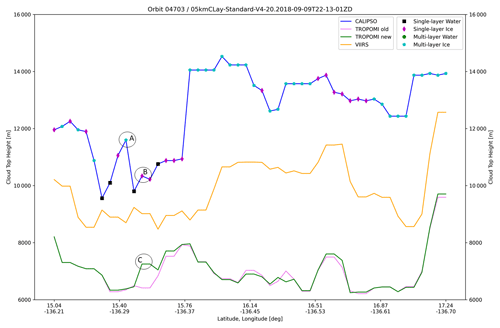
Figure 24Comparison of the CTH for TROPOMI, VIIRS and CALIPSO for the tropics in the Northern Hemisphere over the Pacific Ocean. TROPOMI orbit 04703 for 9 September 2018 is collocated with the CALIPSO measurements from the 2018-09-09T22-13-01ZD overpass.
CALIPSO overpasses have been collocated with the TROPOMI orbits. The TROPOMI/CALIPSO collocation method is described in Appendix A. An example comparison at the midlatitudes of the Northern Hemisphere over the Pacific Ocean is presented in Fig. 22. This is quite representative of the comparison between the three instruments. Good agreement between all three is seen for the low maritime clouds with a cloud-top height lower than 2 km. For medium and high clouds, we observe differences between TROPOMI and CALIPSO, while those differences should also depend on the phase of the detected clouds. The ice clouds are not well represented in the forward model of TROPOMI, and some bias could originate from the incorrect treatment of clouds with a liquid water scattering model. Moreover, in TROPOMI we do not have any special treatment for the scenes with multilayer clouds, and this is another source of expected differences. Nevertheless, the focus of this study is on the improvements that could arise from the new coregistration scheme alone. Two cases are presented in Figs. 23 and 24. In general, the differences due to the coregistration (comparison between green and pink lines) are small. The largest improvement is seen when the cloud structure introduced by the use of VIIRS data results in better agreement with CALIPSO. In Fig. 23, the small peak (highlighted by circle A) appearing in the CALIPSO data is seen in the TROPOMI data only when the new coregistration is used. The pink line is flat around 16° N, meaning that the old coregistration smooths this cloud structure, and the impact on the CTH is an absolute difference of about 2 km compared to the new scheme. Similarly, in another example shown in Fig. 24, there are two peaks (A and B) around 15.5° N in the CALIPSO data. None of them are present in the TROPOMI data with the old coregistration (pink line). When the new scheme is used, peak C appears at approximately the same latitude as CALIPSO peak B. At point C, the absolute difference between the two coregistration methods is approximately 800 m.
The existence of collocated cloud information from VIIRS allowed the improvement of TROPOMI cloud properties through better treatment of the spatial misalignment between UVIS and NIR ground pixels. The new scheme is applied in addition to the old static mapping tables. The improvement in the TROPOMI data quality together with the optimizations of the coregistration scheme are summarized in the following points.
-
From the daily scatterplots, we saw that under fully cloudy conditions (i.e., with cloud fraction 1 in the old scheme) the coregistered cloud fraction obtains lower values with the new coregistration scheme. Moreover, several partly cloudy pixels have been characterized as cloud-free with the new coregistration scheme. Therefore, the new scheme can be effective in removing some outliers. The ROCINN CRB cloud height and CAL cloud-top height are scattered symmetrically around the identity line, while some asymmetry is observed at the cloud optical thickness, with the scatter below the identity line being much higher than the scatter above the line.
-
The largest cloud height differences between the two coregistration schemes were found for the lower cloud fractions over inhomogeneous scenes.
-
From the daily global maps showing the differences between the two schemes, we excluded systematic differences present in certain geographical regions. In addition, we have not found any latitudinal or viewing geometry dependency.
-
The cloud information from the complementary sensor (e.g., VIIRS for the TROPOMI coregistration) allows the reconstruction of the ROCINN-retrieved parameters on the first westernmost UVIS ground pixel. The addition of this first pixel primarily reduced the existing gaps between two adjacent orbits around the Equator. Moreover, column information of UVIS trace gases is successfully retrieved for this first pixel, with a positive initial feedback for the accuracy of those retrievals for total ozone and tropospheric SO2. An example scene in a day with a volcanic eruption showed that the detection algorithm for flagging SO2 pixels with volcanic origin seems to work well for the additional first ground pixels.
-
From the validation of TROPOMI against VIIRS in the across-track flight direction, the general conclusion is that the old coregistration scheme tends to smooth out local maxima and minima along the scan line. This is quite an important finding because the original cloud parameter loses some structure that could be re-constructed through the use of the VIIRS data. This finding is valid for the cloud fraction and the cloud-top height.
-
We identified cases where the coregistered value agrees better with the original value at the source band when the new technique is used. This is true for the coregistration of the cloud fraction from UVIS to NIR but also for the cloud-top height coregistered from NIR to UVIS.
-
From the validation exercise of TROPOMI against CALIPSO, we found cases with better agreement with CALIPSO when using the new coregistration scheme. The agreement refers exclusively to the CTH structure in a qualitative manner. Quantitative comparison against CALIPSO CTHs would not be appropriate because there is a systematic bias in the TROPOMI CTH associated with the lack of ice cloud parameterization in the forward cloud model and the treatment of multilayer clouds.
The new coregistration scheme has been incorporated into the operational processing system for S5P. The latest UPAS processor (version 2.6) has been effective starting 26 November 2023, orbit 31705. Once Sentinel-4 has been launched, a similar approach will be used for the treatment of the spatial misregistration, using collocated FCI data.
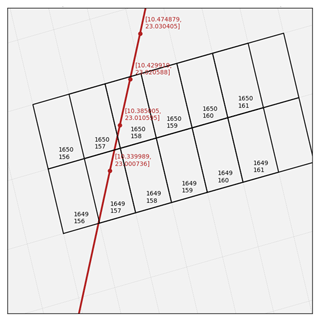
Figure A1TROPOMI ground pixels at BD3 grid (black color) and CALIPSO overpass measurements (red color). One or even two CALIPSO data points can fall into the TROPOMI BD3 ground pixel. Every TROPOMI ground pixel contains two numbers: the first refers to the scan line and the second to the pixel id. The CALIPSO measurements are identified directly using the geographic coordinates.
Figure A1 visualizes the CALIPSO overpass measurements within the TROPOMI ground pixels in the BD3 grid. The TROPOMI/CALIPSO collocation method is based on finding the smallest distance dmin between a CALIPSO measurement and the center of the TROPOMI ground pixel in the vicinity of the CALIPSO measurement. The following computational steps are performed.
-
The CALIPSO latitude (ϕC) and longitude (λC) coordinates define the search grid with a step of 0.1° in the latitude dimension and 0.05° in the longitude dimension.
-
For every TROPOMI ground pixel within the search window [ϕC−0.1, ϕC+0.1], [λC−0.05, λC+0.05], the distances dC between the CALIPSO geographic coordinates and the center coordinates of each TROPOMI ground pixel (ϕT, λC) are calculated based on Eq. (A1).
where R is the Earth's radius ( m at the Equator). Δϕ=rad(ϕT−ϕC) and Δλ=rad(λT−λC) define the differences in geographic coordinates between TROPOMI and CALIPSO. Then, the α parameter of Eq. (A1) can be calculated as
-
Finally, the TROPOMI ground pixel with the smallest distance dmin=min(|dC|) w.r.t. the CALIPSO measurement is accepted as the most successful collocation between the two instruments.
The S5P L2 cloud product refers to UPAS Version 2.4 and can be accessed from the Copernicus Data Space Ecosystem search tool (https://dataspace.copernicus.eu/, Copernicus, 2024). The SNPP VIIRS data mapped to the TROPOMI grids for bands 3, 6 and 7 are also available from the Copernicus Data Space Ecosystem search tool. The re-gridded S5P-NPP cloud data in BD3 and BD6 for the test days are not publicly available since this dataset was explicitly built to support the development of the new coregistration scheme. The L2 cloud layer CAL_LID_L2_05kmCLay-Standard-V4-20 Version 4.20 data product has been used (NASA/LARC/SD/ASDC, 2018). Data generation and distribution of this V4.20 product ended on 1 July 2020 to support a change in the operating system of the CALIPSO production clusters. The V4.21 data product covers 1 July 2020 to 30 June 2023.
AA, RL and DL developed the conceptual approach of the new coregistration scheme. AA implemented the coregistration prototype algorithm in Python. FR incorporated the prototype algorithm into the operational UPAS system. For TROPOMI, RL was responsible for the development of the prototype OCRA algorithm. AA and VMG were responsible for the development of the prototype ROCINN cloud retrieval algorithm. RS developed the S5P-NPP processor and provided the VIIRS regridded data. AA performed the analysis of the impact of the new algorithm on the cloud parameters based on the comparison of the available datasets from VIIRS and CALIPSO. KPH and PH studied the impact of the new scheme on total ozone column and SO2, respectively. AA prepared the paper with contributions from all co-authors.
The authors have the following competing interests: one of the (co-)authors is a member of the editorial board of Atmospheric Measurement Techniques.
Publisher's note: Copernicus Publications remains neutral with regard to jurisdictional claims made in the text, published maps, institutional affiliations, or any other geographical representation in this paper. While Copernicus Publications makes every effort to include appropriate place names, the final responsibility lies with the authors.
We would like to thank Rob Spurr for his continuous support on LIDORT. In addition, we thank our colleagues from the Royal Belgian Institute for Space Aeronomy (BIRA-IASB) Michel Van Roozendael, Jeroen Van Gent and Nicolas Theys for their support on the O3 GODFit and SO2 data. Moreover, we thank all the former and current DLR colleagues who contributed to the algorithm development of the UPAS system. We also acknowledge DLR internal S5P project (KTR 2472046) for financing the algorithm development and the ESA ATM-MPC and ESA S5P PDGS projects for financing the operational implementation.
This research has been supported by the European Space Agency (grant no. CCN5 to 4000117151/16/I-LG).
The article processing charges for this open-access publication were covered by the German Aerospace Center (DLR).
This paper was edited by Joanna Joiner and reviewed by two anonymous referees.
Atkinson, J.: Sister Satellites, Briefly Separated, Working Together Again, https://www.nasa.gov/feature/langley/sister-satellites-briefly-separated-working-together-again (last access: 13 March 2023), 2018. a
Bohren, C. F. and Huffman, D. R.: Absorption and scattering by small particles, Wiley, NY, 530 pp., https://doi.org/10.1002/9783527618156, 1983. a
Cahalan, R. F., Ridgway, W., Wiscombe, W. J., Gollmer, S., and Harshvardhan: Independent Pixel and Monte Carlo Estimates of Stratocumulus Albedo, J. Atmos. Sci., 51, 3776–3790, https://doi.org/10.1175/1520-0469(1994)051<3776:IPAMCE>2.0.CO;2, 1994. a
Chambers, L. H., Wielicki, B. A., and Evans, K. F.: Accuracy of the independent pixel approximation for satellite estimates of oceanic boundary layer cloud optical depth, J. Geophys. Res.-Atmos., 102, 1779–1794, https://doi.org/10.1029/96JD02995, 1997. a
Compernolle, S., Argyrouli, A., Lutz, R., Sneep, M., Lambert, J.-C., Fjæraa, A. M., Hubert, D., Keppens, A., Loyola, D., O'Connor, E., Romahn, F., Stammes, P., Verhoelst, T., and Wang, P.: Validation of the Sentinel-5 Precursor TROPOMI cloud data with Cloudnet, Aura OMI O2–O2, MODIS, and Suomi-NPP VIIRS, Atmos. Meas. Tech., 14, 2451–2476, https://doi.org/10.5194/amt-14-2451-2021, 2021. a
Copernicus: Copernicus Data Space Ecosystem on Earth, Copernicus, https://dataspace.copernicus.eu/, 2024. a
Cox, C. S. and Munk, W. H.: Measurement of the Roughness of the Sea Surface from Photographs of the Sun’s Glitter, J. Opt. Soc. Am., 44, 838–850, 1954. a
De Smedt, I., Theys, N., Yu, H., Danckaert, T., Lerot, C., Compernolle, S., Van Roozendael, M., Richter, A., Hilboll, A., Peters, E., Pedergnana, M., Loyola, D., Beirle, S., Wagner, T., Eskes, H., van Geffen, J., Boersma, K. F., and Veefkind, P.: Algorithm theoretical baseline for formaldehyde retrievals from S5P TROPOMI and from the QA4ECV project, Atmos. Meas. Tech., 11, 2395–2426, https://doi.org/10.5194/amt-11-2395-2018, 2018. a
Heidinger, A. and Straka, W.: Algorithm Theoretical Basis Document For NOAA Enterprise Cloud Mask, Version1.2, https://www.star.nesdis.noaa.gov/goesr/documents/ATBDs/Enterprise/ATBD_Enterprise_Cloud_Mask_v1.2_2020_10_01.pdf (last access: 22 October 2024), 2020. a
Heidinger, A., Li, Y., and Wanzong, S.: Algorithm Theoretical Basis Document For Enterprise AWG Cloud Height Algorithm (ACHA), Version 3.4, https://www.star.nesdis.noaa.gov/jpss/documents/ATBD/ATBD_EPS_Cloud_ACHA_v3.4.pdf (last access: 22 October 2024), 2020. a
Heidinger, A. K., Evan, A. T., Foster, M. J., and Walther, A.: A Naive Bayesian Cloud-Detection Scheme Derived from CALIPSO and Applied within PATMOS-x, J. Appl. Meteorol. Climatol., 51, 1129–1144, https://doi.org/10.1175/JAMC-D-11-02.1, 2012. a
Heue, K.-P., Eichmann, K., and Valks, P.: TROPOMI/S5P ATBD of tropospheric ozone data products, Tech. Rep. S5P-L2-IUP-ATBD-400C, issue 1.6, Deutsches Zentrum fur Luft- und Raumfahrt e.V. in der Helmholtz Gemeinschaft and Institute for Environmental Physics (IUP), https://sentinels.copernicus.eu/documents/247904/2476257/Sentinel-5P-ATBD-TROPOMI-Tropospheric-Ozone/d2106102-b5c3-4d28-b752-026e3448aab2?version=1.2 (last access: 22 October 2024), 2018. a
King, M. D.: Determination of the Scaled Optical Thickness of Clouds from Reflected Solar Radiation Measurements, J. Atmos. Sci., 44, 1734–1751, https://doi.org/10.1175/1520-0469(1987)044<1734:DOTSOT>2.0.CO;2, 1987. a
Kleipool, Q., Ludewig, A., Babić, L., Bartstra, R., Braak, R., Dierssen, W., Dewitte, P.-J., Kenter, P., Landzaat, R., Leloux, J., Loots, E., Meijering, P., van der Plas, E., Rozemeijer, N., Schepers, D., Schiavini, D., Smeets, J., Vacanti, G., Vonk, F., and Veefkind, P.: Pre-launch calibration results of the TROPOMI payload on-board the Sentinel-5 Precursor satellite, Atmos. Meas. Tech., 11, 6439–6479, https://doi.org/10.5194/amt-11-6439-2018, 2018. a
KNMI: S5P/TROPOMI Algorithm theoretical basis document for the TROPOMI L01b data processor, S5P-KNMI-L01B-0009- SD, issue 10.0.0, https://sentinel.esa.int/documents/247904/2476257/Sentinel-5P-TROPOMI-Level-1B-ATBD (last access: 22 October 2024), 2022. a
Kokhanovsky, A. A. and Mayer, B.: Light reflection and transmission by non-absorbing turbid slabs: simple approximations, J. Opt. A, 5, 43–46, https://doi.org/10.1088/1464-4258/5/1/306, 2003. a, b
Latsch, M., Richter, A., Eskes, H., Sneep, M., Wang, P., Veefkind, P., Lutz, R., Loyola, D., Argyrouli, A., Valks, P., Wagner, T., Sihler, H., van Roozendael, M., Theys, N., Yu, H., Siddans, R., and Burrows, J. P.: Intercomparison of Sentinel-5P TROPOMI cloud products for tropospheric trace gas retrievals, Atmos. Meas. Tech., 15, 6257–6283, https://doi.org/10.5194/amt-15-6257-2022, 2022. a
Liu, C.-Y., Chiu, C.-H., Lin, P.-H., and Min, M.: Comparison of cloud-top property retrievals from Advanced Himawari Imager, MODIS, CloudSat/CPR, CALIPSO/CALIOP, and radiosonde, J. Geophys. Res.-Atmos., 125, e2020JD032683, https://doi.org/10.1029/2020JD032683, 2020. a
Liu, S., Valks, P., Pinardi, G., Xu, J., Chan, K. L., Argyrouli, A., Lutz, R., Beirle, S., Khorsandi, E., Baier, F., Huijnen, V., Bais, A., Donner, S., Dörner, S., Gratsea, M., Hendrick, F., Karagkiozidis, D., Lange, K., Piters, A. J. M., Remmers, J., Richter, A., Van Roozendael, M., Wagner, T., Wenig, M., and Loyola, D. G.: An improved TROPOMI tropospheric NO2 research product over Europe, Atmos. Meas. Tech., 14, 7297–7327, https://doi.org/10.5194/amt-14-7297-2021, 2021. a
Loyola, D.: Methodologies for solving Satellite Remote Sensing Problems using Neuro Computing Techniques, Ph.D. thesis, Technische Universität München, verlag Dr. Hut, ISBN 978-3-8439-1068-2, 2013. a
Loyola, D., Lutz, R., Argyrouli, A., and Spurr, R.: S5P/TROPOMI Algorithm Theoretical Basis Document Cloud Products, S5PDLR-L2-ATBD-400I, issue 2.6.1, https://sentinel.esa.int/documents/d/sentinel/s5p-l2-dlr-atbd-400i_clouds_2-6-1_20112023_signed (last access: 22 October 2024), 2023. a, b
Loyola, D. G.: Automatic cloud analysis from polar-orbiting satellites using neural network and data fusion techniques, in: IGARSS 2004. 2004 IEEE International Geoscience and Remote Sensing Symposium, Vol. 4, 2530–2533 pp., https://doi.org/10.1109/IGARSS.2004.1369811, 2004. a
Loyola, D. G., Thomas, W., Spurr, R., and Mayer, B.: Global patterns in daytime cloud properties derived from GOME backscatter UV-VIS measurements, Int. J. Remote Sens., 31, 4295–4318, https://doi.org/10.1080/01431160903246741, 2010. a
Loyola, D. G., Pedergnana, M., and Gimeno García, S.: Smart sampling and incremental function learning for very large high dimensional data, Neural Netw., 78, 75–87, https://doi.org/10.1016/j.neunet.2015.09.001, special Issue on “Neural Network Learning in Big Data”, 2016. a
Loyola, D. G., Gimeno García, S., Lutz, R., Argyrouli, A., Romahn, F., Spurr, R. J. D., Pedergnana, M., Doicu, A., Molina García, V., and Schüssler, O.: The operational cloud retrieval algorithms from TROPOMI on board Sentinel-5 Precursor, Atmos. Meas. Tech., 11, 409–427, https://doi.org/10.5194/amt-11-409-2018, 2018. a, b
Lutz, R., Loyola, D., Gimeno García, S., and Romahn, F.: OCRA radiometric cloud fractions for GOME-2 on MetOp-A/B, Atmos. Meas. Tech., 9, 2357–2379, https://doi.org/10.5194/amt-9-2357-2016, 2016. a, b
Molina García, V.: Retrieval of cloud properties from EPIC/DSCOVR, Ph.D. thesis, Technische Universität München, https://mediatum.ub.tum.de/node?id=1662361 (last access: 22 October 2024), 2022. a
Nakajima, T. and King, M. D.: Determination of the optical thickness and effective particle radius of clouds from reflected solar radiation measurements. I – Theory, J. Atmos. Sci., 47, 1878–1893, https://doi.org/10.1175/1520-0469(1990)047<1878:DOTOTA>2.0.CO;2, 1990a. a
Nakajima, T. and King, M. D.: Asymptotic theory for optically thick layers: application to the discrete ordinates method, Appl. Opt., 31, 7669–7683, https://doi.org/10.1364/AO.31.007669, 1990b. a
NASA/LARC/SD/ASDC: CALIPSO Lidar Level 2 5 km Cloud Layer, V4-20 [data set], https://doi.org/10.5067/CALIOP/CALIPSO/LID_L2_05KMCLAY-STANDARD-V4-20, 2018. a
Rodgers, C. D.: Inverse Methods for Atmospheric Sounding: Theory and Practice, Vol. 2 of, Atmospheric, Oceanic and Planetary Physics, World Scientific, https://doi.org/10.1142/3171, 2000. a
Schuessler, O., Loyola, D. G., Doicu, A., and Spurr, R. J. D.: Information Content in the Oxygen A-Band for the Retrieval of Macrophysical Cloud Parameters, IEEE Trans. Geosci. Remote Sens., 52, 3246–3255, https://doi.org/10.1109/TGRS.2013.2271986, 2014. a
Siddans, R.: S5P-NPP Cloud Processor ATBD, Tech. Rep. S5P-NPPC-RAL-ATBD-0001, issue 1.0.0, https://sentinel.esa.int/documents/247904/2476257/Sentinel-5P-NPP-ATBD-NPP-Clouds (last access: 22 October 2024), 2016. a, b, c, d
Sneep, M.: S5P-KNMI-L2-0129-TN – Sentinel 5 precursor interband 2015 – 4.0.0, https://sentiwiki.copernicus.eu/__attachments/1673595/S5P-KNMI-L2-0129-TN - Sentinel 5 precursor interband 2015 - 4.0.0.pdf?inst-v=7071b3cb-abd4-4add-b2c2-d6e89a0d956a (last access: 22 October 2024), 2015. a, b, c
Spurr, R. J. D.: VLIDORT: A linearized pseudo-spherical vector discrete ordinate radiative transfer code for forward model and retrieval studies in multilayer multiple scattering media, J. Quant. Spectrosc. Ra., 102, 316–342, https://doi.org/10.1016/j.jqsrt.2006.05.005, 2006. a
Spurr, R. J. D., Loyola, D., Heue, K.-P., Van Roozendael, M., and Lerot, C.: S5P/TROPOMI Total Ozone ATBD, Tech. Rep. S5P-L2-DLR-ATBD-400A, issue 2.4, Deutsches Zentrum fur Luft- und Raumfahrt e.V. in der Helmholtz Gemeinschaft and Royal Belgian Institute for Space Aeronomy (BIRA-IASB), https://sentinel.esa.int/documents/247904/2476257/Sentinel-5P-TROPOMI-ATBD-Total-Ozone (last access: 22 October 2024), 2022. a
Theys, N., De Smedt, I., Yu, H., Danckaert, T., van Gent, J., Hörmann, C., Wagner, T., Hedelt, P., Bauer, H., Romahn, F., Pedergnana, M., Loyola, D., and Van Roozendael, M.: Sulfur dioxide retrievals from TROPOMI onboard Sentinel-5 Precursor: algorithm theoretical basis, Atmos. Meas. Tech., 10, 119–153, https://doi.org/10.5194/amt-10-119-2017, 2017. a
Van de Hulst, H. C.: Light scattering by small particles, Wiley, NY, 1957. a
Veefkind, J., Aben, I., McMullan, K., Förster, H., de Vries, J., Otter, G., Claas, J., Eskes, H., de Haan, J., Kleipool, Q., van Weele, M., Hasekamp, O., Hoogeveen, R., Landgraf, J., Snel, R., Tol, P., Ingmann, P., Voors, R., Kruizinga, B., Vink, R., Visser, H., and Levelt, P.: TROPOMI on the ESA Sentinel-5 Precursor: A GMES mission for global observations of the atmospheric composition for climate, air quality and ozone layer applications, Remote Sens. Environ., 120, 70–83, https://doi.org/10.1016/j.rse.2011.09.027, 2012. a
Walther, A. and Heidinger, A. K.: Implementation of the Daytime Cloud Optical and Microphysical Properties Algorithm (DCOMP) in PATMOS-x, J. Appl. Meteorol. Climatol., 51, 1371–1390, https://doi.org/10.1175/JAMC-D-11-0108.1, 2012. a
Walther, A. and Straka, W.: Algorithm Theoretical Basis Document For Daytime Cloud Optical and Microphysical Properties (DCOMP), Version 1.2, https://www.star.nesdis.noaa.gov/jpss/documents/ATBD/ATBD_EPS_Cloud_DCOMP_v1.2.pdf (last access: 22 October 2024), 2020. a
Winker, D., Pelon, J., and Mccormick, M.: The CALIPSO mission: Spaceborne lidar for observation of aerosols and clouds, Proc. SPIE-Int. Soc. Opt. Eng., 4893, 1–11, https://doi.org/10.1117/12.466539, 2003. a
Winker, D., Hunt, W., and Hostetler, C.: Status and performance of the CALIOP lidar, P. SPIE – The International Society for Optical Engineering, 5575, 8–15 pp., https://doi.org/10.1117/12.571955, 2004. a
Winker, D. M., Hunt, W. H., and McGill, M. J.: Initial performance assessment of CALIOP, Geophys. Res. Lett., 34, 19, https://doi.org/10.1029/2007GL030135, 2007. a
- Abstract
- Introduction
- The operational cloud algorithm
- Special treatment of the misregistration within the OCRA/ROCINN algorithm tandem: application to existing mission
- Application to TROPOMI/S5P with collocated VIIRS/Suomi-NPP data
- Conclusions
- Appendix A: Collocation method for TROPOMI and CALIPSO
- Data availability
- Author contributions
- Competing interests
- Disclaimer
- Acknowledgements
- Financial support
- Review statement
- References


