the Creative Commons Attribution 4.0 License.
the Creative Commons Attribution 4.0 License.
Atmospheric propane (C3H8) column retrievals from ground-based FTIR observations in Xianghe, China
Minqiang Zhou
Pucai Wang
Bart Dils
Bavo Langerock
Geoff Toon
Christian Hermans
Weidong Nan
Qun Cheng
Martine De Mazière
Propane (C3H8) is an important trace gas in the atmosphere, as it is a proxy for oil and gas production and has a significant impact on atmospheric chemical reactions related to the hydroxyl radical and tropospheric ozone formation. In this study, solar direct absorption spectra near 2967 cm−1 recorded by a ground-based Fourier transform infrared spectrometer (FTIR) were applied to retrieve C3H8 total columns between June 2018 and July 2022 in Xianghe in north China. The systematic and random uncertainties of the C3H8 column retrieval are estimated to be 18.4 % and 18.1 %, respectively. The mean and standard deviation of the C3H8 columns derived from the FTIR spectra in Xianghe are 1.80 ± 0.81 (1σ) × 1015 molec. cm−2. Good correlations are found between C3H8 and other non-methane hydrocarbons, such as C2H6 (R=0.84) and C2H2 (R=0.79), as well as between C3H8 and CO (R=0.72). However, the correlation between C3H8 and CH4 is relatively weak (R=0.45). Moreover, the FTIR C3H8 measurements in Xianghe are also compared against MkIV measurements at several sites around the world. The new FTIR measurements in Xianghe provide us with insight into C3H8 column variations and the underlying processes in north China.
- Article
(2663 KB) - Full-text XML
- BibTeX
- EndNote
Methane (CH4) and non-methane hydrocarbons (NMHCs), such as ethane (C2H6), acetylene (C2H2), propane (C3H8), propene (C3H6), and isoprene (C5H8), are important trace gases that play significant roles in atmospheric chemical reactions related to hydroxyl radical (OH) abundance and tropospheric ozone (O3) formation (Sze, 1977; Donahue and Prinn, 1990; Tan et al., 2012; Lelieveld et al., 2015). Human activities contribute greatly to the emissions of CH4 and NMHCs, especially in urban areas (Bourtsoukidis et al., 2019; Saunois et al., 2020). Atmospheric C2H6 and C3H8 emissions are dominated by oil and gas sources, and they are co-emitted with CH4. Therefore, numerous studies used the ratio of C2H6 and/or C3H8 to CH4 to understand the CH4 trend (Kort et al., 2016; Franco et al., 2016; Rigby et al., 2017).
The major sink of C2H6 and C3H8 is the reaction with OH, and the lifetime of C3H8 and C2H6 is about 2–4 weeks in summer and 2 months in winter (Jacob, 1999; Xiao et al., 2008). Compared to CH4 with a lifetime on an order of 10 years (IPCC, 2013), the short-lived gases C2H6 and C3H8 are not well mixed on the global scale and are therefore more representative of regional pollution, as is carbon monoxide (CO) (Toon et al., 2021).
Atmospheric C3H8 concentrations at the surface are observed by National Oceanic and Atmospheric Administration (NOAA) Global Monitoring Laboratory (GML) flask sampling measurements at 12 sites (https://gml.noaa.gov/hats/gases/C3H8.html, last access: 29 October 2024). In addition, the HIAPER Pole-to-Pole Observations (HIPPO), Atmospheric Tomography (ATom), and In-service Aircraft for a Global Observing System (IAGOS) aircraft campaigns provide in situ gas analyzer measurements of C3H8 with a wide latitudinal coverage, particularly in the Pacific Ocean, the Atlantic Ocean, Europe, and North America (Wofsy, 2011; Thompson et al., 2022; Li et al., 2022). Toon et al. (2021) demonstrated the use of C3H8 absorption lines in the mid-infrared region (Harrison et al., 2010) in solar absorption spectra from MkIV interferometers for retrieving the C3H8 total columns or vertical profiles at several locations in Sweden, the USA, and Antarctica. Solar absorption infrared spectra are also being collected by ground-based Fourier transform infrared (FTIR) spectrometers within the Network for the Detection of Atmospheric Composition Change – InfraRed Working Group (NDACC-IRWG) (De Mazière et al., 2018). Currently, there are more than 20 NDACC-IRWG global sites, with a good global latitudinal coverage from 78° S to 80° N (https://www2.acom.ucar.edu/irwg/sites, last access: 29 October 2024). However, to our knowledge, no site has reported C3H8 retrievals from spectra observed by a Bruker 125HR spectrometer within the NDACC-IRWG.
Xianghe (39.75° N, 116.96° E) is located in north China, about 50 km east of the megacity Beijing (Yang et al., 2020). According to the Emissions Database for Global Atmospheric Research (EDGAR) v6.0 (Crippa et al., 2020) and the Multi-resolution Emission Inventory for China (MEIC) (Wang et al., 2015; Li et al., 2017), there is a large CH4 emission source in north China coming from fuel exploitation and oil refineries. Therefore, we expect that the C2H6 and C3H8 concentrations are relatively high in this region. In June 2018, a Bruker IFS 125HR spectrometer, compliant with the NDACC-IRWG protocol, started recording solar absorption spectra in the mid-infrared spectral range. The spectra have been used to retrieve several atmospheric components, e.g., O3, CH4, CO, C2H2, C2H6, HCN, and H2CO (Ji et al., 2020; Zhou et al., 2020, 2021, 2023; Vigouroux et al., 2020; Sha et al., 2021). In this study, we investigate the C3H8 retrieval from ground-based FTIR spectra in Xianghe and discuss the C3H8 column variation in north China, based on these new FTIR measurements.
The remainder of this paper is organized as follows. Section 2 describes the Xianghe FTIR site and C3H8 retrieval method, and Sect. 3 presents the C3H8 variations and correlations with other species. Moreover, the C3H8 measurements in Xianghe are compared to ground-based MkIV measurements in other places. Finally, Sect. 4 draws a conclusion.
2.1 Xianghe FTIR spectra measurement
The Xianghe FTIR measurement system started in June 2018 and has been described well in previous studies (Yang et al., 2020; Zhou et al., 2021, 2023). Briefly, the FTIR measurement system contains three parts: a solar tracker system, a weather station, and a Bruker IFS 125HR Fourier transform infrared (FTIR) spectrometer. Shortwave infrared (SWIR) and near-infrared (NIR) spectra (4000–11 000 cm−1) with a spectral resolution of 0.02 cm−1 are recorded with an InGaAs detector, and these spectra are used to derive greenhouse gases' total column abundances as a contribution to the Total Carbon Column Observing Network (TCCON). Mid-infrared (MIR) spectra (1800–4500 cm−1), with a spectral resolution of 0.0035–0.0070 cm−1, are recorded with an InSb detector. To enhance the signal-to-noise ratio (SNR) of the spectra, we add specific optical filters into the light path when recording each MIR spectrum as recommended by NDACC-IRWG (Blumenstock et al., 2021; Zhou et al., 2023). A typical MIR spectrum, with a spectral resolution of 0.0051 cm−1, used for C3H8 retrieval is shown in Fig. 1. Note that we only operate the FTIR measurement during the daytime and under clear-sky conditions, as the sun is the light source. In general, we carry out 4 to 10 MIR spectral measurements of this type per day for about 200 d yr−1. Each spectrum takes about 10 min to record. The spectra taken between June 2018 and July 2022 (about 4 years) are used in this study.
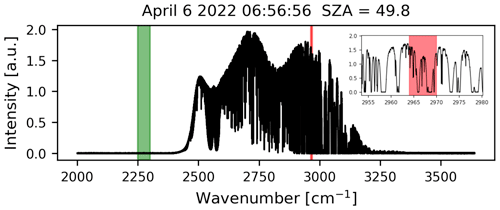
Figure 1A typical MIR spectrum observed in Xianghe on 6 April 2022 with a solar zenith angle of 49.8°. The red and green windows indicate the micro-windows used for the C3H8 retrieval and for calculating the noise (Eq. 5), respectively. The inset in the right-hand corner shows a zoomed-in view of the retrieval micro-window.
2.2 Retrieval method
To derive C3H8 mole fractions from the observed spectra, we follow the optimal estimation methodology (Rodgers, 2000). The forward model (F) simulates the absorption spectra (y) observed by the FTIR system. It includes modeling of the solar spectra at the top of the atmosphere (TOA), the physics of the radiative transfer from the TOA to the ground-based FTIR, and the FTIR spectrometer instrument line shape function (ILS). Then, the observed spectra (y) can be written as
where x is the state vector (retrieved parameters); b is the forward model parameters (not retrieved); and ϵ is the error, including the measurement noise and forward model errors. We wish to find the optimal state (x) that minimizes the cost function (J(x)), given by
where Sϵ is the measurement error covariance matrix, SR is the regularization matrix, and xa is the a priori state vector. The Levenberg–Marquardt (LM) method is used to iteratively solve the above equation:
where K is the Jacobian matrix, and γ is a parameter to adjust the regularization of a priori information in each iteration step (Rodgers, 2000). Upon convergence, the final state is called xr, which can be related to the true state (xt):
where A is the averaging kernel matrix, representing the sensitivity of the retrieved parameters to the true parameter, and ε is the retrieval uncertainty propagated from Eq. (1).
2.3 Retrieval strategy
In this study, we use the SFIT4 v1.0 retrieval algorithm (Pougatchev et al., 1995; Hase et al., 2004) to perform the forward model simulation as well as the LM inversion. The well-established SFIT4 code has been used extensively to retrieve total/partial column of atmospheric species in the NDACC-IRWG community (Zhou et al., 2016; De Mazière et al., 2018; Ortega et al., 2019).
Table 1The retrieval window, interfering species, spectroscopy, and fitting parameters for C3H8 in Xianghe.

The key C3H8 retrieval parameters used in this study are listed in Table 1. The retrieval window is set to 2964.5–2970.0 cm−1, where we have the strongest C3H8 absorption line (Harrison et al., 2010). Apart from C3H8, several interfering gases (H2O, CH4, O3, C2H6, and HDO) also have absorption lines in this window as shown in Fig. 2. To reduce the impact of uncertainties about the abundances of these species, CH4, O3, C2H6, and HDO columns are retrieved along with the target gas mole fractions. For these three species, their profile shapes are fixed, and only the scaling factors are retrieved. As H2O absorption lines are strong (Table 1) and H2O variability are relatively large in the atmosphere, we perform a profile retrieval for H2O. The state vector includes CH4, O3, C2H6, and HDO columns, as well as 47 layers' C3H8 and H2O mole fractions.
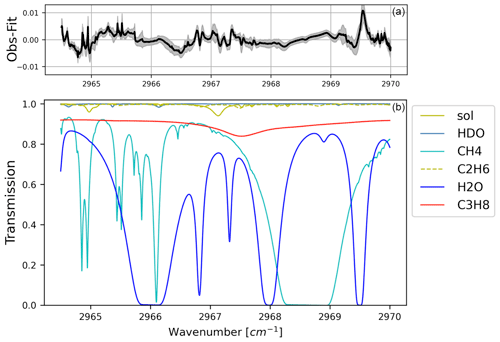
Figure 2The transmittances of main species and solar lines (b), as well as the fitting residual (a) mean (black line) and standard deviation (grey shadow) from all 2783 FTIR C3H8 retrievals in Xianghe between June 2018 and July 2022. The mean RMSE is 0.317 %.
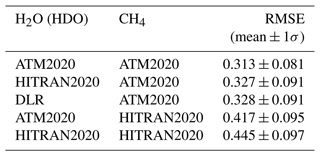
The chosen spectroscopic parameters are crucial in the remote sensing technique. In this study, we have tested several line lists, particularly for H2O (HDO) and CH4 (see Table 2), including DLR2016 (Loos et al., 2017), HITRAN2020 (Gordon et al., 2022), and ATM2020 (https://mark4sun.jpl.nasa.gov/pseudo.html, last access: 29 October 2024). The ATM2020 line list is created by Geoff Toon (NASA, JPL) based on HITRAN2020, together with some additional atmospheric and laboratory measurements. For C3H8, we use pseudo-linelists (PLLs), which are also created by Geoff Toon based on laboratory cross section measurements by Harrison et al. (2010). For C2H6, we use PLLs as well. We tested more than 1000 spectra recorded in 2019 in Xianghe, and we observed that the lowest root-mean-square error (RMSE) of the fitting residual is obtained when the ATM2020 spectral database is used for CH4 and H2O. Table 1 lists the spectral datasets finally used for each species in the C3H8 retrieval strategy.
Table 2The fitting RMSE of the retrieval window for all spectra in 2019 from several different line lists.
The a priori profiles for C3H8, C2H6, and CH4 are derived from the Whole Atmosphere Community Climate Model (WACCM) version 6. We use the averages of the monthly means between 1980 and 2040 (61 years) as the a priori profiles. Since the variations of temperature and humidity are quite large in the atmosphere, using fixed a priori profiles often results in a bad fitting, especially for the first iteration. To provide a better estimation of temperature and humidity profiles, for each measurement, the H2O (HDO) and temperature vertical profiles are derived from the closest 6-hourly NCEP reanalysis data (Saha et al., 2014) and linearly interpolated to the measurement time.
According to Eq. (2), the cost function J(x) is composed of the measurement and a priori information, each contracted with a weight matrix Sϵ and SR, respectively. In this study, the diagonal of the Sϵ is calculated as , and the non-diagonal values are set to 0. The SNR is calculated as
where is the max radiation intensity in the C3H8 retrieval window (2964.5–2970.0 cm−1; red window in Fig. 1), and is the standard deviation (SD) of the intensity in the noise window (2250.0–2300.0 cm−1; green window in Fig. 1). The Tikhonov L1 regularization method (Tikhonov, 1963) is applied to generate the SR, with
To determine the α value in Eq. (6), we apply the method of the degree of freedom for signal (DOF) proposed by Steck (2002). The trace of the averaging kernel matrix (A) is the DOF, indicating the pieces of independent information of the retrieval (Rodgers, 2000). First, we use the optimal estimation method (OEM) to get an estimated DOF. Using the OEM, , where Sa is the a priori covariance matrix, which is derived from a covariance matrix on the WACCM monthly means between 1980 and 2040 (; diagonal values), and the non-diagonal values are set as , where di,j is the vertical distance between layer i and layer j (in km). The DOF derived from the OEM is about 1.1, indicating that there is only column information for the C3H8 retrieval. Knowing that, we tune the α value in Eq. (6) to make the DOF derived from the Tikhonov method close to the DOF that is derived from the OEM; this approach results in setting α to 1000.
2.4 Retrieval uncertainty
The retrieval error (ϵ) of the FTIR C3H8 column contains three parts as follows:
where Gy is the contribution function, and bt and b are the true and used model inputs, respectively. Table 3 lists the systematic and random uncertainty of each component. The vertical distributions of the systematic and random uncertainties are shown in Fig. 3. For the smoothing error, we separate the contributions into target species (C3H8), interfering species (H2O, HDO, CH4, C2H6), and retrieved parameters (slope, phase, wavenumber shift, instrument line shape, solar intensity and shift). For the model parameter contributions, we calculate the C3H8 uncertainty contribution coming from spectroscopy, the solar zenith angle (SZA), the temperature profile, the curvature parameter, and the zero level shift (zshift). Since CH4 and H2O have stronger absorptions than C3H8, and their absorption lines are not perfectly fitted, the impact from the spectroscopy uncertainty of CH4 and H2O is calculated as well.
Table 3The systematic and random (sys/ran) retrieval uncertainties for the total columns of C3H8. The “–” means that the uncertainty is less than 0.1 %. 1σ of the target or interfering species is the SD derived from the WACCM model monthly means between 1980 and 2040. The relative SD in the bottom row is the average of daily SD of C3H8 columns on all days with at least three measurements, which is to represent the variability of the retrieval.
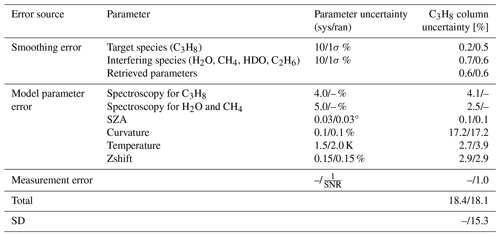
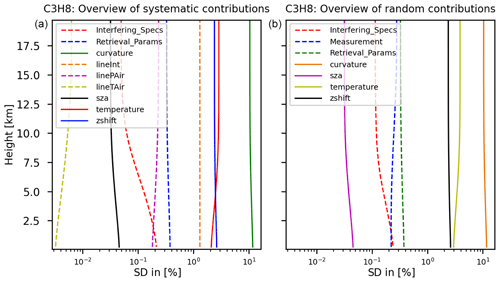
Figure 3The vertical profiles of the systematic (a) and random error (b) of the FTIR C3H8 retrieval from each component.
The systematic and random uncertainties of each parameter are also listed in Table 3. It is assumed that 10 % of the a priori profile is used to derive the diagonal values of the systematic covariance matrix , and the off-diagonal values of are calculated as (von Clarmann, 2014). The covariance matrix derived from the WACCM 61 years' monthly means is set to the random covariance matrix . Regarding the model parameter uncertainties in Table 3, the systematic–random Sb matrix is created by the mean and standard deviation of the differences between NCEP and ERA5 in Xianghe. The random deviation is about 2 K, and the systematic deviation is about 1.5 K for the whole vertical range. For the target spectroscopic parameters, the relative uncertainties of C3H8 are set to 4 % according to the pseudo-database. For the CH4 and H2O spectroscopy parameters, the relative uncertainty of 5 % is derived from the HITRAN2020 dataset (Gordon et al., 2022). Note that the spectroscopy uncertainty in Table 3 is the sum of the uncertainties from the line intensity, pressure-dependent parameter (linePAir), and temperature-dependent parameter (lineTAir). For the uncertainties of background curvature, zero offset (shift), and SZA, we use the default values provided by the SFIT4 algorithm (https://wiki.ucar.edu/display/sfit4/SFIT4+Version+1.0.xx+Release, last access: 29 October 2024), which are recommended by the NDACC-IRWG community.
Based on our uncertainty estimation, the total systematic uncertainty and random uncertainty of the C3H8 column are both about 18 %, and the dominating contribution is the uncertainty of the background curvature parameter in the forward model. To represent the variability of the C3H8, we select all days with at least three individual measurements each day and calculate the daily SD. The average of all the daily SDs is about 15.3 %, and it is close to our estimated random uncertainty.
3.1 FTIR C3H8 retrievals in Xianghe
Figure 4 shows the a priori profile and retrieved profiles of C3H8. The vertical profile of C3H8 from the WACCM model shows that the C3H8 mole fraction is high near the surface and decreases with increasing altitude. Such a vertical shape is expected as the C3H8 emissions are at the surface, and its atmospheric lifetime is too short to achieve a well-mixed troposphere. Although we perform a profile retrieval on C3H8, we only have about 1 DOF. In addition, the Tikhonov regularization matrix constrains the vertical shape when the DOF is typically close to 1.0. As a result, the retrieved C3H8 profiles have a very similar vertical shape to the a priori profile. However, the FTIR measurements show that the a priori column overestimates the C3H8 column concentration by about 100 %. The column averaging kernel indicates the sensitivity of the retrieved C3H8 column to the C3H8 partial column for each height. Figure 4 shows that the retrieved C3H8 column has good sensitivity to all the layers and slightly varies with SZA.
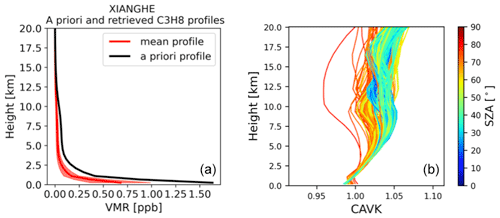
Figure 4The a priori and retrieved C3H8 profiles (a) and the column averaging kernel (CAVK) varying with SZA (b).

Figure 5Panel (a) shows the time series of FTIR a priori C3H8 columns (black dots), retrieved columns (grey dots), monthly means (yellow line), monthly SDs (yellow shade), periodic function fitting (red solid line), and the fitted offset (dashed red line). (b) The monthly box plot of the C3H8 columns. The bottom and top bars represent the 10 % and 90 % percentiles of the datasets, and the blue crosses are the extremely high values above 90 %.
The time series and seasonal variation of FTIR C3H8 column measurements are presented in Fig. 5. To better visualize the seasonal variation, the column measurements are fitted by a periodic function , where A0 is the offset, and A1 to A6 are the periodic amplitudes, representing the seasonal variation. The obtained mean and SD of C3H8 columns in Xianghe are 1.80 ± 0.81 × 10¹⁵ molec. cm−2. The C3H8 columns show a high mean value in July and a low value in October. The difference between the median values in July (maximum) and October (minimum) is 1.2 × 10¹⁵ molec. cm−2. Although the median values of C3H8 columns in June–August are larger than those in October–March, we notice that extremely high C3H8 columns often occur in the latter period.
3.2 Correlations with CO, CH4, C2H2, and C2H6 in Xianghe
As mentioned above, the infrared spectra observed by the Xianghe FTIR system have also been used to retrieve CO, CH4, C2H2, and C2H6 columns using NDACC-IRWG-recommended retrieval strategies (Ji et al., 2020; Zhou et al., 2023), which allows us to investigate the correlation between C3H8 and these species. We are particularly interested in the correlation on a regional scale. Therefore, to reduce the impact from the background, we calculate the Δgas (Δgas = gas − monthly median) for all these species. Figure 6 shows the correlation scatter plots between ΔC3H8 and ΔCH4, ΔCO, ΔC2H2, and ΔC2H6. High correlation coefficients (R) are found between ΔC3H8 and ΔC2H6 (R=0.84) and between ΔC3H8 and ΔC2H2 (R=0.79). It indicates that C2H2, C2H6, and C3H8 (NMHCs) are co-emitted in this region. The slope of ΔC2H6 and ΔC3H8 is 6.03 ± 0.03, which suggests a corresponding mixing ratio of C2H6 and C3H8 mole fractions during the production in north China. CO, as a pollutant tracer, also has a good correlation with C3H8 (R=0.72). According to the MEIC, both CO and NMHCs are emitted from the energy production, industry, residential, and transport sectors.
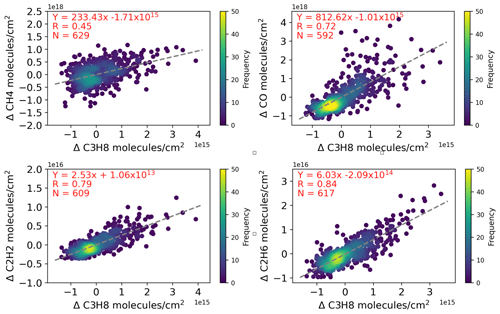
Figure 6The correlation plots between co-located ΔC3H8 and ΔCH4, ΔCO, ΔC2H2, and ΔC2H6 hourly means in Xianghe between June 2018 and July 2022. The dashed grey line is the linear fit, N is the number of the FTIR measurements, and R is the Pearson correlation coefficient.
The FTIR measurements show that the correlation between ΔC3H8 and ΔCH4 is relatively weak (R=0.45). Note that the variation of the CH4 column is also affected by the stratospheric partial column (Sepúlveda et al., 2014). The DOF of the FTIR CH4 retrieval is about 2.5, allowing us to derive the tropospheric and stratospheric CH4 partial columns separately (Zhou et al., 2018). However, even after eliminating the interference from the stratosphere, the tropospheric CH4 partial column still has a weak correlation with C3H8 (R=0.43). It is probably due to the fact that the CH4 major emissions in north China are from rice cultivation, waste, and animals instead of oil and gas production (Ji et al., 2020), and the CH4 measurements include the emissions from much farther away as compared to the C3H8 measurements because of its long lifetime (Callewaert et al., 2023).
To further investigate the ratio of ΔC2H6 to ΔC3H8, the time series of their ratios, together with the monthly correlation coefficients between both time series between June 2018 and June 2022, are illustrated in Fig. 7. The ratio of each month is derived from the linear fitting using all co-located ΔC2H6 and ΔC3H8 hourly measurements in that month. A relatively low correlation between these two species is found in summer as compared to other three seasons. The mean and SD of the ratios are 5.4 ± 2.1 for the whole period. The ratio is lowest in summer and highest in winter, with seasonal means of 6.6, 3.8, 5.4, and 8.3 in spring, summer, autumn, and winter, respectively.
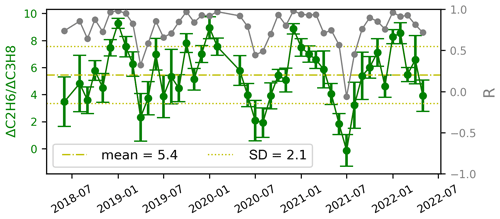
Figure 7The time series of the ratio of ΔC2H6 to ΔC3H8 monthly means and SDs (green, on the left-hand vertical axis scale), together with their monthly correlation coefficients (grey, on the right-hand vertical axis scale) between June 2018 and June 2022.
3.3 FTIR measurements in Xianghe against MkIV measurements
Here, the C3H8 and C2H6 columns derived from the FTIR measurements in Xianghe are compared to the ground-based MkIV C3H8 retrievals at six sites in Sweden and the USA (Fig. 8). MkIV data use the GFIT inverse retrieval code to derive the C3H8 columns from the MkIV observed spectra between 2964.5 and 2970 cm−1 with a spectral resolution of 0.5 cm−1. The mean uncertainties of the MkIV retrieved C3H8 and C2H6 column are estimated to be around 8 × 10¹⁵ and 7 × 10¹⁴ molec. cm−2, respectively (Toon et al., 2021). Note that the C3H8 and C2H6 retrievals from the MkIV spectrometers at 12 sites have been discussed in Toon et al. (2021), and we only select 6 sites as the measurements are very limited at the other 6 sites. The locations and measurement time coverage of sites used in this study are listed in Table 4.
Table 4The locations and data time coverages of the MkIV measurements at six sites, together with their mean C3H8 and C2H6 columns. The bottom row is the Xianghe FTIR measurements in this study.
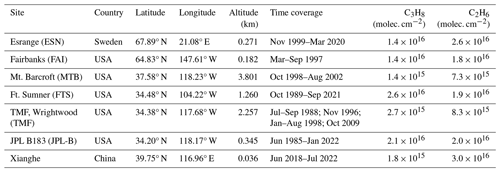
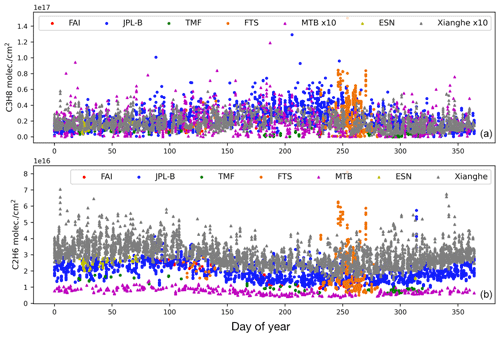
Figure 8 shows that the C2H6 column is the largest in Xianghe, apart from several extremely high values at JPL-B and FTS. The seasonal variations of C2H6 columns are similar at these sites, especially for JPL-B, MTB and Xianghe, with a high value in northern spring and a low value in northern autumn. Note that it is hard to derive the seasonal variation of C2H6 columns at ESN, FAI, TMF, and FTS because measurements were carried out in several months. The mean and SD of C2H6 columns at JPL-B are 1.96 ± 0.52 × 10¹⁶ molec. cm−2, which is about 25 % less than at Xianghe ((Xianghe − JPL) Xianghe × 100 %). Keep in mind that the C3H8 columns at MTB and Xianghe have been multiplied by 10 in Fig. 8. The C3H8 column at Xianghe is quite low as compared to other sites, which is only larger than that at MTB (mountain site) but much less than that at the mid-latitude sites. The mean and SD of C3H8 columns at JPL-B are 2.14 ± 1.33 × 10¹⁶ molec. cm−2, which is about 12 times larger than that in Xianghe. The seasonal variations of C3H8 columns are similar at JPL-B and Xianghe sites too, with a high value in northern summer and a low value in northern winter. The good correlations (R>0.6) between C3H8 and C2H6 columns at JPL-B and FTS have been demonstrated in Toon et al. (2021), which is similar to what we observe at the Xianghe site. However, the ratios of ΔC2H6 to ΔC3H8 at JPL-B and FTS are 0.16 ± 0.10 and 0.78 ± 0.10, respectively, which are much less than the ratio observed at the Xianghe site of 6.03 ± 0.03. It indicates that the emission of C3H8 is much larger in the Los Angeles basin, California, than in north China.
The Xianghe FTIR 125HR system measures the solar absorption spectra following the NDACC-IRWG guidance. For the first time, the FTIR MIR spectra in Xianghe are used for the C3H8 column retrieval, using the well-established SFIT4 code, between June 2018 and July 2022. In this study, the retrieval strategy, retrieval uncertainty, and retrieval information are presented and discussed. Due to the wide and weak absorption of C3H8, we only derive the C3H8 column instead of its vertical profile. The systematic and random uncertainties of the C3H8 retrieved column are estimated to be 18.4 % and 18.1 %, respectively. In the C3H8 retrieval window, CH4 and H2O absorption lines are not perfectly fitted, indicating there is still room left to improving the line lists of these two species.
The mean and SD of the C3H8 column derived from the FTIR measurements in Xianghe are 1.80 ± 0.81 × 10¹⁵ molec. cm−2. A month-to-month variation is observed with a high value in July and a low value in October. The difference between the median values in July (maximum) and October (minimum) is 1.2 × 10¹⁵ molec. cm−2. As C3H8 is co-emitted with CH4, CO, C2H2, and C2H6 during oil and gas production, we calculate the correlation between ΔC3H8 and these species in Xianghe. Good correlations are found between C3H8 and C2H6, between C3H8 and C2H2, and between C3H8 and CO. However, the correlation between C3H8 and CH4 is relatively weak, which is probably due to CH4 emission in north China being dominated by rice, cultivation, and waste, instead of oil and gas production and fossil fuel combustion. By comparing the C3H8 and C2H6 columns in Xianghe with six other sites around the world, provided by the ground-based MkIV spectrometers, we find that the C2H6 column in Xianghe is the largest. However, the C3H8 column in Xianghe is only larger than the columns observed at the mountain sites and polar sites, and it is much less than the C3H8 columns observed at mid-latitude sites in the USA. Currently, the reported uncertainty of MkIV C3H8 measurements is relatively large at about 8 × 10¹⁵ molec. cm−2, which is much larger than that of the mean FTIR C3H8 measurements in Xianghe. Further investigation is needed to understand the large difference between FTIR and MkIV C3H8 measurements.
In summary, we successfully retrieve C3H8 columns from the FTIR MIR spectra in Xianghe, which provides us with a new dataset to understand the variation of C3H8 in north China. The retrieval strategy of C3H8 in this study should work at other Bruker 125HR FTIR sites as well, especially those close to a city or oil and gas field, e.g., Paris, Toronto, and Boulder. Nevertheless, efforts are still needed within the NDACC-IRWG community to generate a global harmonized FTIR C3H8 column dataset.
The ground-based MkIV C3H8 and C2H6 retrievals are publicly available via https://mark4sun.jpl.nasa.gov/ground.html (Toon and Blavier, 2022). The FTIR C3H8 retrievals in Xianghe are available upon request. The WACCM model data are publicly available via https://www.acom.ucar.edu/waccm/download.shtml (registration required, WACCM model group, 2024).
PW and MZ designed the study and wrote the manuscript. MZ, BL, BD, and MDM investigated the SFIT4 retrieval strategy. WN, CH, and QC conducted the FTIR measurements in Xianghe. GT provided the MkIV measurements. All authors have read and commented on the manuscript.
The contact author has declared that none of the authors has any competing interests.
Publisher's note: Copernicus Publications remains neutral with regard to jurisdictional claims made in the text, published maps, institutional affiliations, or any other geographical representation in this paper. While Copernicus Publications makes every effort to include appropriate place names, the final responsibility lies with the authors.
The authors would like to thank the NDACC community for supporting the SFIT4 retrieval algorithm. We acknowledge all Xianghe site staff and Nicolas Kumps (BIRA-IASB) for the FTIR instrument maintenance.
This research has been supported by the National Key R&D Program (grant no. 2023YFC3705202) and the Shanghai Sailing Program (grant no. 22YF1442000).
This paper was edited by Meng Gao and reviewed by three anonymous referees.
Blumenstock, T., Hase, F., Keens, A., Czurlok, D., Colebatch, O., Garcia, O., Griffith, D. W. T., Grutter, M., Hannigan, J. W., Heikkinen, P., Jeseck, P., Jones, N., Kivi, R., Lutsch, E., Makarova, M., Imhasin, H. K., Mellqvist, J., Morino, I., Nagahama, T., Notholt, J., Ortega, I., Palm, M., Raffalski, U., Rettinger, M., Robinson, J., Schneider, M., Servais, C., Smale, D., Stremme, W., Strong, K., Sussmann, R., Té, Y., and Velazco, V. A.: Characterization and potential for reducing optical resonances in Fourier transform infrared spectrometers of the Network for the Detection of Atmospheric Composition Change (NDACC), Atmos. Meas. Tech., 14, 1239–1252, https://doi.org/10.5194/amt-14-1239-2021, 2021. a
Bourtsoukidis, E., Ernle, L., Crowley, J. N., Lelieveld, J., Paris, J.-D., Pozzer, A., Walter, D., and Williams, J.: Non-methane hydrocarbon (C2–C8) sources and sinks around the Arabian Peninsula, Atmos. Chem. Phys., 19, 7209–7232, https://doi.org/10.5194/acp-19-7209-2019, 2019. a
Callewaert, S., Zhou, M., Langerock, B., Wang, P., Wang, T., Mahieu, E., and De Mazière, M.: A WRF-Chem study on the variability of CO2, CH4 and CO concentrations at Xianghe, China supported by ground-based observations and TROPOMI, EGUsphere [preprint], https://doi.org/10.5194/egusphere-2023-2103, 2023. a
Crippa, M., Solazzo, E., Huang, G., Guizzardi, D., Koffi, E., Muntean, M., Schieberle, C., Friedrich, R., and Janssens-Maenhout, G.: High resolution temporal profiles in the Emissions Database for Global Atmospheric Research, Sci. Data, 7, 121, https://doi.org/10.1038/s41597-020-0462-2, 2020. a
De Mazière, M., Thompson, A. M., Kurylo, M. J., Wild, J. D., Bernhard, G., Blumenstock, T., Braathen, G. O., Hannigan, J. W., Lambert, J.-C., Leblanc, T., McGee, T. J., Nedoluha, G., Petropavlovskikh, I., Seckmeyer, G., Simon, P. C., Steinbrecht, W., and Strahan, S. E.: The Network for the Detection of Atmospheric Composition Change (NDACC): history, status and perspectives, Atmos. Chem. Phys., 18, 4935–4964, https://doi.org/10.5194/acp-18-4935-2018, 2018. a, b
Donahue, N. M. and Prinn, R. G.: Nonmethane hydrocarbon chemistry in the remote marine boundary layer, J. Geophys. Res.-Atmos., 95, 18387–18411, https://doi.org/10.1029/JD095iD11p18387, 1990. a
Franco, B., Mahieu, E., Emmons, L. K., Tzompa-Sosa, Z. A., Fischer, E. V., Sudo, K., Bovy, B., Conway, S., Griffin, D., Hannigan, J. W., Strong, K., and Walker, K. A.: Evaluating ethane and methane emissions associated with the development of oil and natural gas extraction in North America, Environ. Res. Lett., 11, 044010, https://doi.org/10.1088/1748-9326/11/4/044010, 2016. a
Gordon, I., Rothman, L., Hargreaves, R., Hashemi, R., Karlovets, E., Skinner, F., Conway, E., Hill, C., Kochanov, R., Tan, Y., Wcisło, P., Finenko, A., Nelson, K., Bernath, P., Birk, M., Boudon, V., Campargue, A., Chance, K., Coustenis, A., Drouin, B., Flaud, J., Gamache, R., Hodges, J., Jacquemart, D., Mlawer, E., Nikitin, A., Perevalov, V., Rotger, M., Tennyson, J., Toon, G., Tran, H., Tyuterev, V., Adkins, E., Baker, A., Barbe, A., Canè, E., Császár, A., Dudaryonok, A., Egorov, O., Fleisher, A., Fleurbaey, H., Foltynowicz, A., Furtenbacher, T., Harrison, J., Hartmann, J., Horneman, V., Huang, X., Karman, T., Karns, J., Kassi, S., Kleiner, I., Kofman, V., Kwabia–Tchana, F., Lavrentieva, N., Lee, T., Long, D., Lukashevskaya, A., Lyulin, O., Makhnev, V., Matt, W., Massie, S., Melosso, M., Mikhailenko, S., Mondelain, D., Müller, H., Naumenko, O., Perrin, A., Polyansky, O., Raddaoui, E., Raston, P., Reed, Z., Rey, M., Richard, C., Tóbiás, R., Sadiek, I., Schwenke, D., Starikova, E., Sung, K., Tamassia, F., Tashkun, S., Vander Auwera, J., Vasilenko, I., Vigasin, A., Villanueva, G., Vispoel, B., Wagner, G., Yachmenev, A., and Yurchenko, S.: The HITRAN2020 molecular spectroscopic database, J. Quant. Spectrosc. Ra., 277, 107949, https://doi.org/10.1016/j.jqsrt.2021.107949, 2022. a, b
Harrison, J. J., Allen, N. D., and Bernath, P. F.: Infrared absorption cross sections for ethane (C2H6) in the 3 µm region, J. Quant. Spectrosc. Ra., 111, 357–363, https://doi.org/10.1016/J.JQSRT.2009.09.010, 2010. a, b, c
Hase, F., Hannigan, J., Coffey, M., Goldman, A., Höpfner, M., Jones, N., Rinsland, C., and Wood, S.: Intercomparison of retrieval codes used for the analysis of high-resolution, ground-based FTIR measurements, J. Quant. Spectrosc. Ra., 87, 25–52, https://doi.org/10.1016/j.jqsrt.2003.12.008, 2004. a
IPCC: Climate Change 2013: The Physical Science Basis. Contribution of Working Group I to the Fifth Assessment Report of the Intergovernmental Panel on Climate Change, edited by: Stocker, T. F., Qin, D., Plattner, G.-K., Tignor, M., Allen, S. K., Boschung, J., Nauels, A., Xia, Y., Bex, V., and Midgley, P. M., Cambridge University Press, Cambridge, United Kingdom and New York, NY, USA, 1535 pp., https://www.ipcc.ch/report/ar5/wg1/ (last access: 5 November 2024), 2013. a
Jacob, D. J.: Introduction to Atmospheric Chemistry, Princeton University Press, http://www.jstor.org/stable/j.ctt7t8hg (last access: last access: 29 October 2024), 1999. a
Ji, D., Zhou, M., Wang, P., Yang, Y., Wang, T., Sun, X., Hermans, C., Yao, B., and Wang, G.: Deriving Temporal and Vertical Distributions of Methane in Xianghe Using Ground-based Fourier Transform Infrared and Gas-analyzer Measurements, Adv. Atmos. Sci., 37, 597–607, https://doi.org/10.1007/s00376-020-9233-4, 2020. a, b, c
Kort, E. A., Smith, M. L., Murray, L. T., Gvakharia, A., Brandt, A. R., Peischl, J., Ryerson, T. B., Sweeney, C., and Travis, K.: Fugitive emissions from the Bakken shale illustrate role of shale production in global ethane shift, Geophys. Res. Lett., 43, 4617–4623, https://doi.org/10.1002/2016GL068703, 2016. a
Lelieveld, J., Evans, J. S., Fnais, M., Giannadaki, D., and Pozzer, A.: The contribution of outdoor air pollution sources to premature mortality on a global scale, Nature, 525, 367–371, https://doi.org/10.1038/nature15371, 2015. a
Li, M., Liu, H., Geng, G., Hong, C., Liu, F., Song, Y., Tong, D., Zheng, B., Cui, H., Man, H., Zhang, Q., and He, K.: Anthropogenic emission inventories in China: a review, Natl. Sci. Rev., 4, 834–866, https://doi.org/10.1093/nsr/nwx150, 2017. a
Li, M., Pozzer, A., Lelieveld, J., and Williams, J.: Northern hemispheric atmospheric ethane trends in the upper troposphere and lower stratosphere (2006–2016) with reference to methane and propane, Earth Syst. Sci. Data, 14, 4351–4364, https://doi.org/10.5194/essd-14-4351-2022, 2022. a
Loos, J., Birk, M., and Wagner, G.: Measurement of air-broadening line shape parameters and temperature dependence parameters of H2O lines in the spectral ranges 1850–2280 cm−1 and 2390–4000 cm−1, J. Quant. Spectrosc. Ra., 203, 103–118, https://doi.org/10.1016/J.JQSRT.2017.03.033, 2017. a
Ortega, I., Buchholz, R. R., Hall, E. G., Hurst, D. F., Jordan, A. F., and Hannigan, J. W.: Tropospheric water vapor profiles obtained with FTIR: comparison with balloon-borne frost point hygrometers and influence on trace gas retrievals, Atmos. Meas. Tech., 12, 873–890, https://doi.org/10.5194/amt-12-873-2019, 2019. a
Pougatchev, N. S., Connor, B. J., and Rinsland, C. P.: Infrared measurements of the ozone vertical distribution above Kitt Peak, J. Geophys. Res., 100, 16689, https://doi.org/10.1029/95JD01296, 1995. a
Rigby, M., Montzka, S. A., Prinn, R. G., White, J. W. C., Young, D., O'Doherty, S., Lunt, M. F., Ganesan, A. L., Manning, A. J., Simmonds, P. G., Salameh, P. K., Harth, C. M., Mühle, J., Weiss, R. F., Fraser, P. J., Steele, L. P., Krummel, P. B., McCulloch, A., and Park, S.: Role of atmospheric oxidation in recent methane growth, P. Natl. Acad. Sci. USA, 114, 5373–5377, https://doi.org/10.1073/pnas.1616426114, 2017. a
Rodgers, C. D.: Inverse Methods for Atmospheric Sounding – Theory and Practice, Series on Atmospheric Oceanic and Planetary Physics, vol. 2, World Scientific Publishing Co. Pte. Ltd, Singapore, https://doi.org/10.1142/9789812813718, 2000. a, b, c
Saha, S., Moorthi, S., Wu, X., Wang, J., Nadiga, S., Tripp, P., Behringer, D., Hou, Y.-T., ya Chuang, H., Iredell, M., Ek, M., Meng, J., Yang, R., Mendez, M. P., van den Dool, H., Zhang, Q., Wang, W., Chen, M., and Becker, E.: The NCEP Climate Forecast System Version 2, J. Climate, 27, 2185–2208, https://doi.org/10.1175/JCLI-D-12-00823.1, 2014. a
Saunois, M., Stavert, A. R., Poulter, B., Bousquet, P., Canadell, J. G., Jackson, R. B., Raymond, P. A., Dlugokencky, E. J., Houweling, S., Patra, P. K., Ciais, P., Arora, V. K., Bastviken, D., Bergamaschi, P., Blake, D. R., Brailsford, G., Bruhwiler, L., Carlson, K. M., Carrol, M., Castaldi, S., Chandra, N., Crevoisier, C., Crill, P. M., Covey, K., Curry, C. L., Etiope, G., Frankenberg, C., Gedney, N., Hegglin, M. I., Höglund-Isaksson, L., Hugelius, G., Ishizawa, M., Ito, A., Janssens-Maenhout, G., Jensen, K. M., Joos, F., Kleinen, T., Krummel, P. B., Langenfelds, R. L., Laruelle, G. G., Liu, L., Machida, T., Maksyutov, S., McDonald, K. C., McNorton, J., Miller, P. A., Melton, J. R., Morino, I., Müller, J., Murguia-Flores, F., Naik, V., Niwa, Y., Noce, S., O'Doherty, S., Parker, R. J., Peng, C., Peng, S., Peters, G. P., Prigent, C., Prinn, R., Ramonet, M., Regnier, P., Riley, W. J., Rosentreter, J. A., Segers, A., Simpson, I. J., Shi, H., Smith, S. J., Steele, L. P., Thornton, B. F., Tian, H., Tohjima, Y., Tubiello, F. N., Tsuruta, A., Viovy, N., Voulgarakis, A., Weber, T. S., van Weele, M., van der Werf, G. R., Weiss, R. F., Worthy, D., Wunch, D., Yin, Y., Yoshida, Y., Zhang, W., Zhang, Z., Zhao, Y., Zheng, B., Zhu, Q., Zhu, Q., and Zhuang, Q.: The Global Methane Budget 2000–2017, Earth Syst. Sci. Data, 12, 1561–1623, https://doi.org/10.5194/essd-12-1561-2020, 2020. a
Sepúlveda, E., Schneider, M., Hase, F., Barthlott, S., Dubravica, D., García, O. E., Gomez-Pelaez, A., González, Y., Guerra, J. C., Gisi, M., Kohlhepp, R., Dohe, S., Blumenstock, T., Strong, K., Weaver, D., Palm, M., Sadeghi, A., Deutscher, N. M., Warneke, T., Notholt, J., Jones, N., Griffith, D. W. T., Smale, D., Brailsford, G. W., Robinson, J., Meinhardt, F., Steinbacher, M., Aalto, T., and Worthy, D.: Tropospheric CH4 signals as observed by NDACC FTIR at globally distributed sites and comparison to GAW surface in situ measurements, Atmos. Meas. Tech., 7, 2337–2360, https://doi.org/10.5194/amt-7-2337-2014, 2014. a
Sha, M. K., Langerock, B., Blavier, J.-F. L., Blumenstock, T., Borsdorff, T., Buschmann, M., Dehn, A., De Mazière, M., Deutscher, N. M., Feist, D. G., García, O. E., Griffith, D. W. T., Grutter, M., Hannigan, J. W., Hase, F., Heikkinen, P., Hermans, C., Iraci, L. T., Jeseck, P., Jones, N., Kivi, R., Kumps, N., Landgraf, J., Lorente, A., Mahieu, E., Makarova, M. V., Mellqvist, J., Metzger, J.-M., Morino, I., Nagahama, T., Notholt, J., Ohyama, H., Ortega, I., Palm, M., Petri, C., Pollard, D. F., Rettinger, M., Robinson, J., Roche, S., Roehl, C. M., Röhling, A. N., Rousogenous, C., Schneider, M., Shiomi, K., Smale, D., Stremme, W., Strong, K., Sussmann, R., Té, Y., Uchino, O., Velazco, V. A., Vigouroux, C., Vrekoussis, M., Wang, P., Warneke, T., Wizenberg, T., Wunch, D., Yamanouchi, S., Yang, Y., and Zhou, M.: Validation of methane and carbon monoxide from Sentinel-5 Precursor using TCCON and NDACC-IRWG stations, Atmos. Meas. Tech., 14, 6249–6304, https://doi.org/10.5194/amt-14-6249-2021, 2021. a
Steck, T.: Methods for determining regularization for atmospheric retrieval problems, Appl. Optics, 41, 1788–1797, https://doi.org/10.1364/AO.41.001788, 2002. a
Sze, N. D.: Anthropogenic CO Emissions: Implications for the Atmospheric CO-OH-CH4 Cycle, Science, 195, 673–675, https://doi.org/10.1126/science.195.4279.673, 1977. a
Tan, J.-H., Guo, S.-J., Ma, Y.-L., Yang, F.-M., He, K.-B., Yu, Y.-C., Wang, J.-W., Shi, Z.-B., and Chen, G.-C.: Non-methane Hydrocarbons and Their Ozone Formation Potentials in Foshan, China, Aerosol Air Qual. Res., 12, 387–398, https://doi.org/10.4209/aaqr.2011.08.0127, 2012. a
Thompson, C. R., Wofsy, S. C., Prather, M. J., Newman, P. A., Hanisco, T. F., Ryerson, T. B., Fahey, D. W., Apel, E. C., Brock, C. A., Brune, W. H., Froyd, K., Katich, J. M., Nicely, J. M., Peischl, J., Ray, E., Veres, P. R., Wang, S., Allen, H. M., Asher, E., Bian, H., Blake, D., Bourgeois, I., Budney, J., Bui, T. P., Butler, A., Campuzano-Jost, P., Chang, C., Chin, M., Commane, R., Correa, G., Crounse, J. D., Daube, B., Dibb, J. E., DiGangi, J. P., Diskin, G. S., Dollner, M., Elkins, J. W., Fiore, A. M., Flynn, C. M., Guo, H., Hall, S. R., Hannun, R. A., Hills, A., Hintsa, E. J., Hodzic, A., Hornbrook, R. S., Huey, L. G., Jimenez, J. L., Keeling, R. F., Kim, M. J., Kupc, A., Lacey, F., Lait, L. R., Lamarque, J.-F., Liu, J., McKain, K., Meinardi, S., Miller, D. O., Montzka, S. A., Moore, F. L., Morgan, E. J., Murphy, D. M., Murray, L. T., Nault, B. A., Neuman, J. A., Nguyen, L., Gonzalez, Y., Rollins, A., Rosenlof, K., Sargent, M., Schill, G., Schwarz, J. P., Clair, J. M. S., Steenrod, S. D., Stephens, B. B., Strahan, S. E., Strode, S. A., Sweeney, C., Thames, A. B., Ullmann, K., Wagner, N., Weber, R., Weinzierl, B., Wennberg, P. O., Williamson, C. J., Wolfe, G. M., and Zeng, L.: The NASA Atmospheric Tomography (ATom) Mission: Imaging the Chemistry of the Global Atmosphere, B. Am. Meteorol. Soc., 103, E761–E790, https://doi.org/10.1175/BAMS-D-20-0315.1, 2022. a
Tikhonov, A. N.: Solution of Incorrectly Formulated Problems and the Regularisation Method, Soviet. Math. Dokl., 4, 1035–1038, 1963. a
Toon, G. C. and Blavier, J.-F.: MkIV ground-based observations, JPL, NASA [data set], https://mark4sun.jpl.nasa.gov/ground.html, last access: 27 September 2022. a
Toon, G. C., Blavier, J.-F. L., Sung, K., and Yu, K.: Spectrometric measurements of atmospheric propane (C3H8), Atmos. Chem. Phys., 21, 10727–10743, https://doi.org/10.5194/acp-21-10727-2021, 2021. a, b, c, d, e
Vigouroux, C., Langerock, B., Bauer Aquino, C. A., Blumenstock, T., Cheng, Z., De Mazière, M., De Smedt, I., Grutter, M., Hannigan, J. W., Jones, N., Kivi, R., Loyola, D., Lutsch, E., Mahieu, E., Makarova, M., Metzger, J.-M., Morino, I., Murata, I., Nagahama, T., Notholt, J., Ortega, I., Palm, M., Pinardi, G., Röhling, A., Smale, D., Stremme, W., Strong, K., Sussmann, R., Té, Y., van Roozendael, M., Wang, P., and Winkler, H.: TROPOMI–Sentinel-5 Precursor formaldehyde validation using an extensive network of ground-based Fourier-transform infrared stations, Atmos. Meas. Tech., 13, 3751–3767, https://doi.org/10.5194/amt-13-3751-2020, 2020. a
von Clarmann, T.: Smoothing error pitfalls, Atmos. Meas. Tech., 7, 3023–3034, https://doi.org/10.5194/amt-7-3023-2014, 2014. a
WACCM model group: WACCM model data, UCAR [data set], https://www.acom.ucar.edu/waccm/download.shtml, last access: 27 March 2024. a
Wang, M., Shao, M., Chen, W., Lu, S., Liu, Y., Yuan, B., Zhang, Q., Zhang, Q., Chang, C.-C., Wang, B., Zeng, L., Hu, M., Yang, Y., and Li, Y.: Trends of non-methane hydrocarbons (NMHC) emissions in Beijing during 2002–2013, Atmos. Chem. Phys., 15, 1489–1502, https://doi.org/10.5194/acp-15-1489-2015, 2015. a
Wofsy, S. C.: HIAPER Pole-to-Pole Observations (HIPPO): fine-grained, global-scale measurements of climatically important atmospheric gases and aerosols, Philos. T. Roy. Soc. A, 369, 2073–2086, https://doi.org/10.1098/rsta.2010.0313, 2011. a
Xiao, Y., Logan, J. A., Jacob, D. J., Hudman, R. C., Yantosca, R., and Blake, D. R.: Global budget of ethane and regional constraints on U.S. sources, J. Geophys. Res.-Atmos., 113, D21306, https://doi.org/10.1029/2007JD009415, 2008. a
Yang, Y., Zhou, M., Langerock, B., Sha, M. K., Hermans, C., Wang, T., Ji, D., Vigouroux, C., Kumps, N., Wang, G., De Mazière, M., and Wang, P.: New ground-based Fourier-transform near-infrared solar absorption measurements of XCO2, XCH4 and XCO at Xianghe, China, Earth Syst. Sci. Data, 12, 1679–1696, https://doi.org/10.5194/essd-12-1679-2020, 2020. a, b
Zhou, M., Vigouroux, C., Langerock, B., Wang, P., Dutton, G., Hermans, C., Kumps, N., Metzger, J.-M., Toon, G., and De Mazière, M.: CFC-11, CFC-12 and HCFC-22 ground-based remote sensing FTIR measurements at Réunion Island and comparisons with MIPAS/ENVISAT data, Atmos. Meas. Tech., 9, 5621–5636, https://doi.org/10.5194/amt-9-5621-2016, 2016. a
Zhou, M., Langerock, B., Vigouroux, C., Sha, M. K., Ramonet, M., Delmotte, M., Mahieu, E., Bader, W., Hermans, C., Kumps, N., Metzger, J.-M., Duflot, V., Wang, Z., Palm, M., and De Mazière, M.: Atmospheric CO and CH4 time series and seasonal variations on Reunion Island from ground-based in situ and FTIR (NDACC and TCCON) measurements, Atmos. Chem. Phys., 18, 13881–13901, https://doi.org/10.5194/acp-18-13881-2018, 2018. a
Zhou, M., Wang, P., Langerock, B., Vigouroux, C., Hermans, C., Kumps, N., Wang, T., Yang, Y., Ji, D., Ran, L., Zhang, J., Xuan, Y., Chen, H., Posny, F., Duflot, V., Metzger, J.-M., and De Mazière, M.: Ground-based Fourier transform infrared (FTIR) O3 retrievals from the 3040 cm−1 spectral range at Xianghe, China, Atmos. Meas. Tech., 13, 5379–5394, https://doi.org/10.5194/amt-13-5379-2020, 2020. a
Zhou, M., Langerock, B., Vigouroux, C., Dils, B., Hermans, C., Kumps, N., Nan, W., Metzger, J.-M., Mahieu, E., Wang, T., Wang, P., and De Mazière, M.: Tropospheric and stratospheric NO retrieved from ground-based Fourier-transform infrared (FTIR) measurements, Atmos. Meas. Tech., 14, 6233–6247, https://doi.org/10.5194/amt-14-6233-2021, 2021. a, b
Zhou, M., Langerock, B., Wang, P., Vigouroux, C., Ni, Q., Hermans, C., Dils, B., Kumps, N., Nan, W., and De Mazière, M.: Understanding the variations and sources of CO, C2H2, C2H6, H2CO, and HCN columns based on 3 years of new ground-based Fourier transform infrared measurements at Xianghe, China, Atmos. Meas. Tech., 16, 273–293, https://doi.org/10.5194/amt-16-273-2023, 2023. a, b, c, d


