the Creative Commons Attribution 4.0 License.
the Creative Commons Attribution 4.0 License.
 | 26 Jan 2024
The Langley ratio method, a new approach for transferring photometer calibration from direct sun measurements
Antonio Fernando Almansa
África Barreto
Natalia Kouremeti
Ramiro González
Akriti Masoom
Carlos Toledano
Julian Gröbner
Rosa Delia García
Yenny González
Stelios Kazadzis
Stéphane Victori
Óscar Álvarez
Fabrice Maupin
Virgilio Carreño
Victoria Eugenia Cachorro
Emilio Cuevas
This article presents a new method for transferring calibration from a reference sun photometer, referred to as the “master”, to a secondary sun photometer, referred to as the “field”, using a synergetic approach when master and field instruments have different spectral bands. The method was first applied between a precision filter radiometer (denoted PFR) instrument from the World Optical Depth Research and Calibration Center (WORCC), considered the reference by the WMO (World Meteorological Organization), and a CE318-TS photometer (denoted Cimel), the standard photometer used by AERONET (AErosol RObotic NETwork). These two photometers have different optics, sun-tracking systems, and spectral bands. The Langley ratio (LR) method proposed in this study was used to transfer calibration to the closest spectral bands for 1 min synchronous data for air masses between 2 and 5, and it was compared to the state-of-the-art Langley calibration technique. The study was conducted at two different locations, Izaña Observatory (IZO) and Valladolid, where measurements were collected almost simultaneously over a 6-month period under different aerosol regimes. In terms of calibration aspects, our results showed very low relative differences and standard deviations in the calibration constant transferred in IZO from the PFR to the Cimel: up to 0.29 % and 0.46 %, respectively, once external factors such as different fields of view between photometers or the presence of calibration issues were considered. However, these differences were higher in the comparison performed at Valladolid (1.04 %) and in the shorter-wavelength spectral bands (up to 0.78 % in IZO and 1.61 % in Valladolid). Additionally, the LR method was successfully used to transfer calibrations between different versions of the CE318-T photometer, providing an accurate calibration transfer (0.17 % to 0.69 %) in the morning LRs, even when the instruments had differences in their central wavelengths (Δλ up to 91 nm). Overall, our results indicate that the LR method is a useful tool not only for transferring calibrations but also for detecting and correcting possible instrumental issues. This is exemplified by the temperature dependence of the signal on the two Cimel UV spectral bands, which was estimated by means of the LR method, resulting in a signal rate of change of approximately per degree in the case of 380 nm and approximately per degree in the case of 340 nm. This estimation allowed us to implement the first operative temperature correction on ultraviolet (UV) spectral bands.
- Article
(2708 KB) - Full-text XML
-
Supplement
(1087 KB) - BibTeX
- EndNote


Solar photometry is widely considered an accurate technique for determining aerosol properties in the atmosphere, as demonstrated by several studies (Schmid and Wehrli, 1995; Holben et al., 1998; Wehrli, 2000; Takamura et al., 2004; Nakajima et al., 2020; Kazadzis et al., 2018a, b, among others). Photometer networks operate worldwide to monitor atmospheric aerosols, with the AErosol RObotic NETwork (AERONET) (Holben et al., 1998; Giles et al., 2019), the Sky Radiometer Network (SKYNET) (Takamura et al., 2004; Campanelli et al., 2012) and the Global Atmosphere Watch Precision Filter Radiometer (GAW-PFR) (Wehrli, 2000, 2005) the most important due to their extensive coverage and high standardization levels. These global networks commonly provide spectral aerosol optical depth (AOD) data, which are considered the most comprehensive measure for estimating the columnar aerosol load and are also a crucial variable in radiative-forcing studies (Kazadzis et al., 2018a). In fact, spectral AOD is considered an “essential climate variable” by various organizations, such as the Global Climate Observing System (GCOS) World Meteorological Organization (WMO) program (Bojinski et al., 2014), the GAW program (WMO, 2003) or the European Space Agency Climate Change Initiative (Popp et al., 2016).
AERONET (https://aeronet.gsfc.nasa.gov, last access: 15 January 2024) is a federated network that comprises various national and regional networks. It was established in 1998 with the Cimel CE318 radiometer as the reference instrument (Holben et al., 1998; Giles et al., 2019). AERONET was created with the aim of validating satellite products and improving the global characterization of atmospheric aerosols and water vapor (Holben et al., 1998). With over 600 stations, AERONET is considered the largest photometer network in the world and provides long-term time series of aerosol properties (Nyeki et al., 2012; Cuevas et al., 2019; Nakajima et al., 2020; Karanikolas et al., 2022). It also provides near real time (NRT) products that are useful for satellite validation (Omar et al., 2013; Sayer et al., 2017, 2019; Sogacheva et al., 2020; Chen et al., 2022, among others), as well as routine and retrospective climate model validation and model assimilation (Rubin et al., 2017; Randles et al., 2017; Benedetti et al., 2018; Gueymard and Yang, 2020; Mortier et al., 2020). AERONET reference photometers are calibrated at two high-mountain sites: Izaña Observatory (Tenerife, Spain) and Mauna Loa Observatory (Hawaii, USA).
GAW-PFR (https://gawpfr.pmodwrc.ch, last access: 15 January 2024) is a network of PFR instruments (Wehrli, 2000, 2005, 2008a, b) that has been designated as the primary WMO reference center for AOD measurements through the World Optical Depth Research and Calibration Centre (WORCC) at the Physikalisch-Meteorologisches Observatorium Davos, World Radiation Center (PMOD/WRC) (WMO, 2005; Kazadzis et al., 2018b). Currently, more than 40 stations around the world operate within this network, providing long-term aerosol observations, with 12 of them designated as core GAW-PFR sites by the WMO Scientific Advisory Group for aerosols. There are other associated stations currently providing PFR data, as is the case of Valladolid data used in the present study. There is an overlap between some GAW and AERONET/SKYNET stations, which allows PMOD/WRC not only to provide reference observations with their uncertainty estimation to contribute to GAW and GCOS but also to develop a strategy to ensure the traceability of AOD between different networks and merge their aerosol observations into a global dataset. The GAW-PFR calibration chain, described in Kazadzis et al. (2018b), consists of a triad of instruments that continuously measure at PMOD/WRC, in addition to three portable transfer radiometers to guarantee traceability of AERONET with the world reference of the WORCC. These three radiometers operate in four sites: Mauna Loa, Izaña Observatory (IZO), Valladolid, and OHP (Observatoire de Haute-Provence, France), the last three lately as part of the ACTRIS (Aerosols, Clouds and Trace gases Research InfraStructure; https://www.actris.eu, last access: 15 January 2024) calibration of aerosol remote sensing collaboration on ACTRIS-WMO sun-photometer calibration links.
Although solar photometry is a mature technique for retrieving aerosol products from direct solar measurements, calibrating sun photometers still requires significant scientific effort in current photometric networks. Instrumental issues, such as decaying sensitivity of detectors and filters or temperature-dependent problems of detectors and filters, also play a crucial role in accurately monitoring AOD. However, as stated by Forgan (1994) and Kazadzis et al. (2018a), the most significant challenge in solar photometry is calibration, namely, the inability to relate sun-photometer observations accurately to irradiance standards (in the case of an absolute calibration method) or the uncertainty involved in estimating the exo-atmospheric signal or calibration constant (V0,λ) through the Langley extrapolation technique (Shaw, 1983). Recent efforts to address this issue have been presented by Kouremeti et al. (2022), focusing on linking AOD calibration standards to ones that are traceable by SI (Système International d'unités or International System of units). AOD calculation is highly sensitive to these factors, especially to calibration errors, since it is a small quantity that cannot be measured directly. As highlighted by Cachorro et al. (2008) and Kazadzis et al. (2014), among others, an error of 1 % in the calibration constant V0,λ leads to an error of 0.01 in AOD for an air mass equal to 1.
In this paper, we present a new methodology specifically designed to be applied when the calibration transference is carried out between two photometers with different spectral bands in terms of central wavelength (λc) or full width at half maximum (FWHM). The so-called Langley ratio (LR) method has been conceived as a robust calibration method, which is a mixture of the two most commonly used calibration techniques: the Langley and the ratio calibration techniques. The Langley calibration method involves performing photometric measurements under very stable atmospheric conditions to estimate the zero-air-mass voltage (or calibration constant, V0,λ) by extrapolation using the Bouguer–Lambert–Beer law. This is an accurate method, with calibration uncertainty expected to be ∼ 0.25 %–0.5 %, as stated in Toledano et al. (2018), which requires long observational periods (typically 1 or 2 months), usually performed at high-altitude stations. The ratio calibration method is a cross-calibration transference technique comparing at-ground voltage ratios between field and reference (master) instruments, normally performed around noon. This method assumes that the total optical depth of coincident measurements are equal, which only happens if the calibration is performed with instruments with quasi-coincident spectral bands. The ratio cross-calibration is a faster calibration method (it usually takes some weeks), but uncertainty in this case is higher, as the uncertainty depends on the uncertainty of the calibration transfer plus the calibration uncertainty of the master instrument (less than 1 % as stated in Holben et al., 1998; Giles et al., 2019). The LR method can be considered an extension of the ratio calibration technique by considering the effect of different spectral bands in terms of λc or FWHM of the two photometers. Therefore, the LR method is able to accomplish the calibration transference between different instruments (such as PFR and Cimel) but also between similar instruments with slight differences in some spectral bands. This is the case of the Cimel CE318-TS photometers, where variations in λc and FWHM between instruments can have a critical impact in the UV range, or in the calibration of the CE318-TV12-OC, a modified version of the standard model CE318-T for satellite ocean color (OC) validation (Zibordi et al., 2021). This issue was partially addressed by Fargion et al. (2001), who proposed a modified cross-calibration methodology within AERONET specifically for spectral bands centered at different wavelengths.
Coincident GAW-PFR and AERONET-Cimel photometric observations in the IZO GAW core station and in Valladolid (a PFR-associated station) have been used in this paper to analyze the performance of this new LR calibration method as well as its main advantages and disadvantages.
2.1 Cimel photometer CE318-T
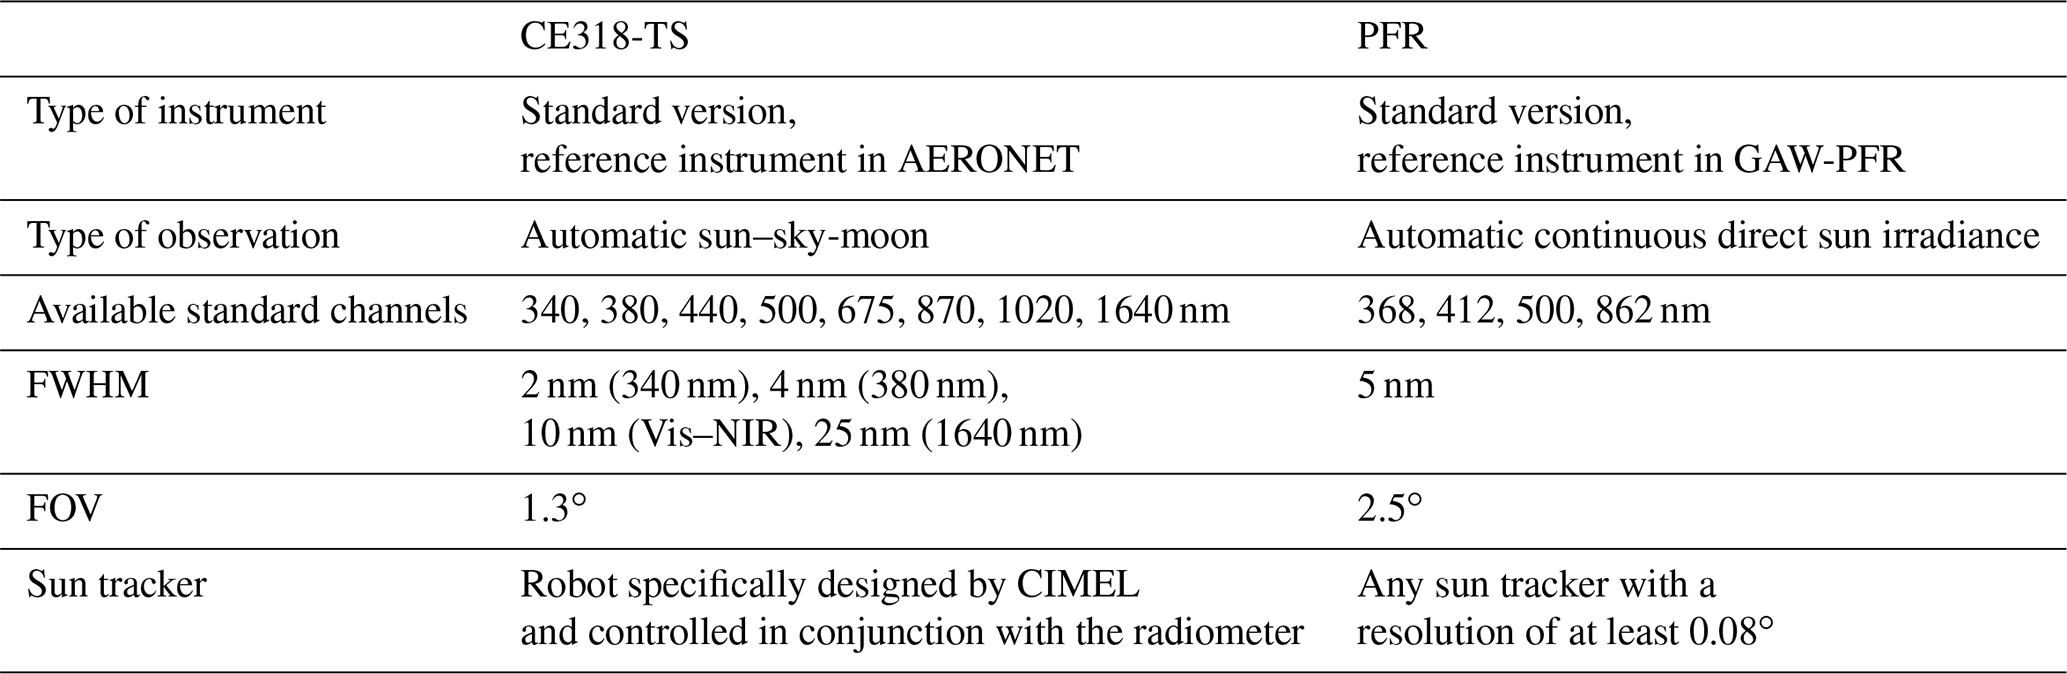
The Cimel CE318-TS (Tables 1 and 2) is the standard instrument in AERONET, a radiometer manufactured by Cimel Electronique that measures direct solar and lunar radiation together with sky radiance using a sensing head mounted on a two-axis tracker and a control unit (Holben et al., 1998; Barreto et al., 2016). The sensing head is equipped with two types of detectors: silicon photodiode and InGaAs (indium gallium arsenide) detectors. The radiation reaching the detectors is filtered by a set of optical bandpass filters with different wavelengths centered at 340, 380, 440, 500, 675, 870, 940, 1020, and 1640 nm, with a FWHM of 2 nm for 340 nm, 4 nm for 380 nm, 25 nm for 1640 nm, and 10 nm for the rest of the channels. The 1020 nm spectral band is measured twice, using two detectors, hereafter referred to as the 1020 and 1020i measurements. The tolerance interval for central wavelength and FWHM is ±0.5 nm, which means that the spectral response might vary between Cimel photometers, even in the case of those with the same version and model. The field of view (FOV) of the instrument is approximately 1.3∘ (Torres et al., 2013), and a removable collimator is used to minimize stray light, which is especially necessary for sky radiance measurements near the solar aureole.
Table 1Main features of the CE318-TS and CE318-TV12-OC sun photometers used in this study.
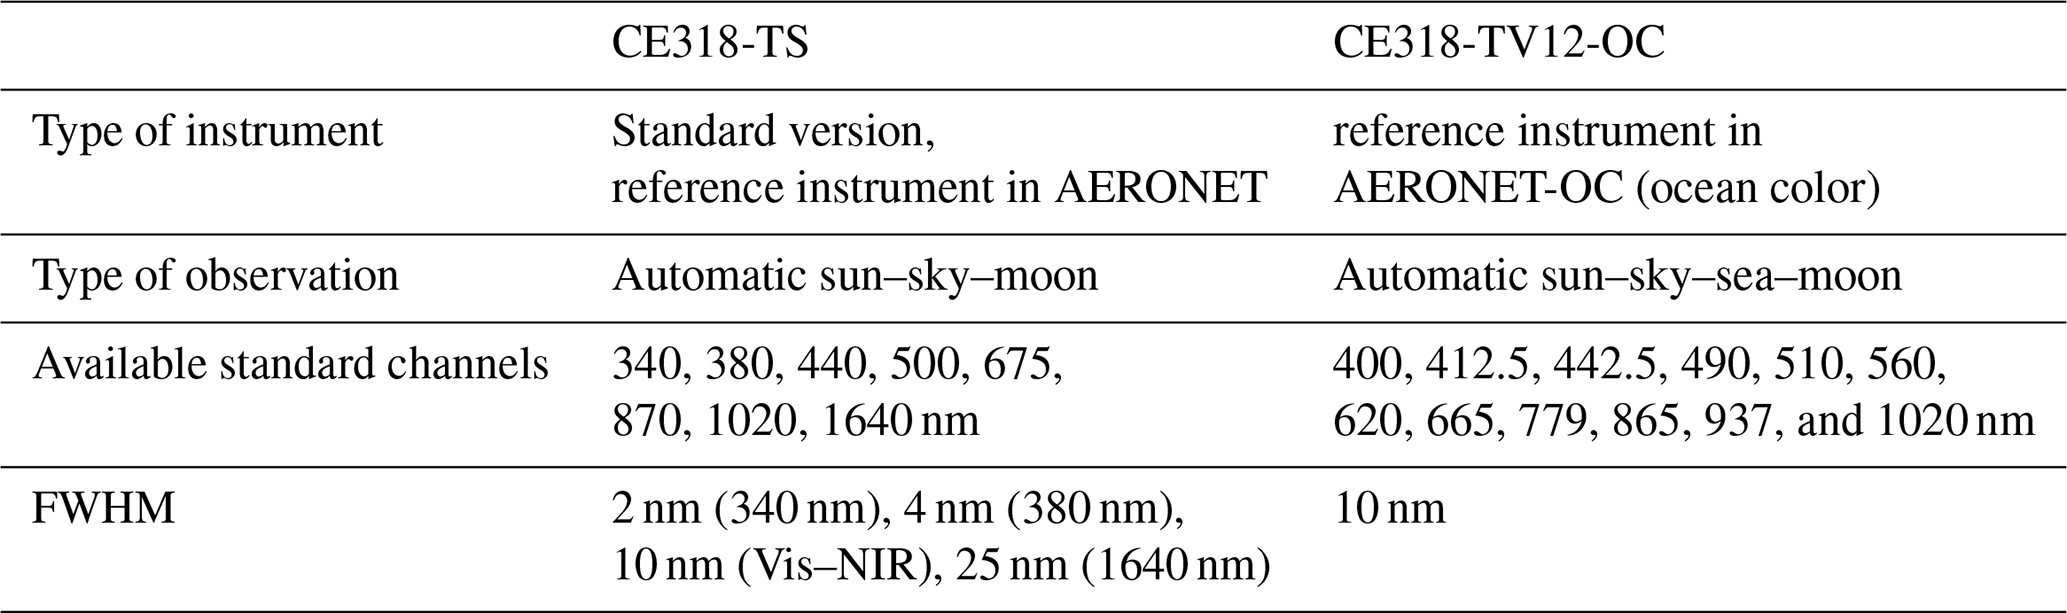
Table 2Main features of the CE318-TS and the GAW-PFR sun photometers used in this study.
Solar tracking is performed using time-based ephemerides, latitude, and longitude and is enhanced using a four-quadrant sensor present in the sensor head. According to Torres et al. (2013), the pointing error of the Cimel CE318 is less than 0.1∘. The measurements of direct solar radiation for all the current filters are performed in triplets, consisting of sequences of three measurements taken every 30 s, with a total duration of 1 min for each triplet. Direct solar/lunar measurements are performed every 5 min (this is the default value in the last firmware version, but it can be adjusted between 2 and 15 min) between 09:00 and 15:00 LT (local time), with a variable frequency depending on the air mass outside those hours. During periods when the radiometer is not in use, the tracker is positioned facing downwards, to minimize any potential damage to the optical filters from solar radiation. Microphysical and optical parameters of the aerosols can be retrieved with spectral radiance measurements together with the AOD; AERONET uses the code developed by Dubovik and King (2000), with some improvements introduced in Dubovik et al. (2002, 2006). Recently, new inversion methods have emerged, among which GRASP (Dubovik et al., 2014; Torres et al., 2017) stands out.
Typical uncertainties in AOD products for reference instruments are expected to range between 0.002 and 0.009 (Eck et al., 1999), which are higher for shorter wavelengths. Uncertainties in AOD values in the case of field instruments are expected to be higher, between 0.010 and 0.020, with higher values for UV spectral bands (Holben et al., 1998; Eck et al., 1999).
The CE318-TV12-OC (Table 1) is another version of the CE318-T photometer specifically designed for ocean color applications. Equipped with 12 optical filters centered at 400, 412.5, 442.5, 490, 510, 560, 620, 665, 779, 865, 937, and 1020 nm, this photometer is utilized by the AERONET Ocean Color (AERONET-OC) global network, installed on offshore platforms to measure the radiance emerging from the sea, a critical parameter for satellite ocean color validation (Zibordi et al., 2021).
Cimel data used in this study have been screened for clouds by matching our dataset with AERONET version 3 level-2.0 quality-assured data. This technique ensures that our data are free of clouds and are filtered for instrumental problems and that the final post-field instrument calibration has been applied.
2.2 PFR photometer
The PFR (Table 2) (Wehrli, 2000, 2005, 2008a, b) is an instrument manufactured by PMOD/WRC, consisting of a sensor head and a control unit. Unlike the Cimel CE318, it does not have its own tracker, and it is usually mounted on commercial trackers that always point towards the sun. The sensor head has four independent channels with bandpass optical filters centered at 368, 412, 500, and 862 nm, with a 5 nm FWHM and four 3-angled silicon photodiodes to avoid reflections between filters and detectors. The FOV of the PFR is determined by two diaphragms of 3 and 7 mm in diameter, separated by 160 mm, resulting in a FOV of 2.5∘. The system is hermetically sealed with a slightly pressurized internal atmosphere (2000 hPa) of dry nitrogen and temperature stabilized with a Peltier-type thermostat system that maintains the sensor head temperature at 20.0±0.5 ∘C for an ambient temperature range between −20.0 and 35.0 ∘C. This system eliminates the need for temperature corrections to the sensor signal and also prevents accelerated aging of the filters, ensuring the high stability of the PFR (Toledano et al., 2018). The detectors are only exposed for short periods of time, as an automatic shutter opens every minute for 10 s to take measurements of direct solar radiation, minimizing filter degradation related to exposure. The expected uncertainty in AOD depends on the uncertainty in the calibration and air mass (Kazadzis et al., 2018a). Wehrli (2000) estimated the uncertainty in the PFR calibration constant to be between 0.2 % (500 nm) and 1 % (368 nm), which leads to an uncertainty in the AOD between 0.002 and 0.01 for a relative air mass equal to 1.
Cloud flagging for PFRs follows some of the basic features that CIMEL uses as well as additional ones based on the high (1 min) measurement frequency of the PFR described in Kazadzis et al. (2018b).
3.1 Izaña Observatory (IZO)
IZO (Tenerife, Canary Islands, Spain; 28.309∘ N, 16.499∘ W; 2373 m a.s.l.) is a high-mountain subtropical station managed by the Izaña Atmospheric Research Center (IARC), belonging to the State Meteorological Agency of Spain (AEMET). This station predominantly represents the background atmospheric conditions of the subtropical lower troposphere due to its location above a strong, quasi-permanent layer of thermal inversion resulting from general subsidence processes in the troposphere (descending branch of the Hadley cell) and the presence of trade winds at lower levels (Carrillo et al., 2016; Cuevas et al., 2019, 2022; Barreto et al., 2022a). However, the proximity to the Sahara introduces an important influence of mineral dust in its aerosol climatology, making IZO a key location for dust transport monitoring (Rodríguez et al., 2011, 2015; Barreto et al., 2022a, b).
Aerosol characterization at the site is dominated by free-troposphere conditions throughout the year, with remarkably low aerosol loading (AOD500 nm of 0.03 or lower and average Ångström exponent, AE440−870 nm, values of 1.01) and a predominant impact of fine-mode aerosols (Barreto et al., 2022b). Dust-laden conditions are predominantly observed in summer, with AOD500 nm of 0.15 and AE440−870 nm of 0.54 (Barreto et al., 2022b). The predominance of extremely clean atmosphere throughout the year makes IZO a calibration site for GAW-PFR and AERONET-Cimel networks, providing an advantage when comparing the two instruments since it eliminates, to a great extent, the errors caused by turbidity or atmospheric instability.
IZO is an ACTRIS calibration facility, a member of ACTRIS/CARS (Center for Aerosol Remote Sensing), and is responsible for the QA/QC of the automatic sun/sky/moon photometer measurements.
3.2 Valladolid station
Valladolid station (Valladolid, Castilla Leon, Spain; 41.664∘ N, 4.706∘ W; 705 m a.s.l.) is an urban site located in the north-central part of the Iberian Peninsula. This site is characterized by a continental clean aerosol climatology (Román et al., 2014) with hot and dry summers and cold winters. However, Valladolid can be influenced by both local and regional sources of pollution. The high variability in temperature and humidity leads to a dynamic aerosol environment, with changes in sources and transport pathways over time.
Valladolid is an AERONET calibration center, providing accurate and precise AOD measurements for use in climate and air quality work. Several studies have shown that Valladolid has relatively low AOD values compared to other urban areas, likely due to the city's location and transport patterns with monthly mean AOD values (AOD440 nm) ranging from 0.10 to 0.24 and AE440−870 nm from 0.9 to 1.5 (Cachorro et al., 2016). However, the city experiences occasional episodes of elevated AOD associated with transported dust from North Africa and forest fires. For example, Cachorro et al. (2016) found that the highest AOD values in Valladolid occurred during dust episodes from the Sahara, with AOD440 nm above 0.3 and reaching values as high as 1–2. These dust events modulate the annual climatology of the aerosols in this area with a total contribution of about 11.5 % to the total AOD.
Valladolid station is also a member of ACTRIS CARS and is responsible for the QA/QC of the automatic sun/sky/moon photometer measurements.
The light traversing the atmosphere suffers attenuation from its interaction with the different atmospheric constituents. This attenuation can be quantified through the Bouguer–Lambert–Beer equation. If we express this equation in terms of the output voltage given by a photometer in a certain spectral band centered at λ, we have
where V0,λ is the calibration coefficient, the photometer output voltage obtained when measuring the sun irradiance at the top of the atmosphere, R is the earth–sun distance normalized to the mean distance, τλ is the total optical depth, and m is the optical air mass. Taking the natural logarithm of both sides of Eq. (1), we obtain
V0,λ can be therefore obtained as the extrapolated to zero-air-mass voltage by linear fitting the left-hand side of Eq. (2) against the optical air mass (usually for air masses ranging between 2 and 5). This is known as the Langley calibration method and is only applicable when the optical depth is very low and constant. In practice, these very stable atmospheric conditions are only met in high-altitude stations. The Langley calibration technique is an accurate method, with an expected calibration uncertainty of ∼ 0.25 %–0.5 %, requiring long observational periods (typically 1 or 2 months) to conduct the calibration of reference (master) instruments (Toledano et al., 2018). Due to the scarcity of locations with Langley conditions, the typically high costs associated with shipping equipment to such remote areas, and the long time required to conduct this calibration, alternative methods have been developed (Soufflet et al., 1992; Schmid et al., 1998; Holben et al., 1998; Fargion et al., 2001). Specifically, transferring calibration from a Langley-calibrated reference instrument , referred to as the “master”, to uncalibrated instruments , known as “field” instruments, conducted in more accessible facilities, offers a practical solution for calibrating multiple instruments simultaneously. In this regard, AERONET applies the method exposed by Holben et al. (1998) and extended by Fargion et al. (2001), where the calibration of the field instrument, , is determined by calculating the ratio between Eq. (1) applied to the field instrument and Eq. (1) applied to the master instrument for measurements that are both coincident in time and within the same spectral band. Consequently, this ratio can be expressed in terms of quasi-coincident ratios between raw direct solar measurements from the master and the field instrument as follows:
This method is commonly called the ratio calibration method and is a cross-calibration transference technique comparing at-ground atmospheric voltage ratios between field and master instruments (normally performed around noon) in the case of coincident measurements (time difference < 5 s). This is a faster calibration method (it usually takes some weeks) requiring less restrictive atmospheric conditions (AOD440 nm below 0.15 and cloud-free skies) compared to the Langley technique (Holben et al., 1998). Uncertainty, in this case, is higher (less than 1 % as stated in Holben et al., 1998; Giles et al., 2019), mainly because, in addition to the uncertainty associated with the standard Langley technique included in the calibration of the master, the instrumental uncertainties of each instrument are also added. Furthermore, the common ratio cross-calibration method itself is valid as long as the spectral bands for both photometers are very similar (i.e., Δλ∼ 0 and similar FWHM). However, this is not always valid, especially when two photometers measuring at different spectral ranges are compared (Δλ and FWHM differences are relevant). In this case, we propose extending the common ratio technique expressed in Eq. (3) to include the exponential decrease of each τλ in the two different sets of coincident photometric observations. Therefore, the ratio of coincident voltages between the field instrument and the master instrument can be expressed as follows:
where the total optical depth from the field photometer () and its calibration coefficient () are a priori not known. (the total optical depth from the master photometer) can be inferred since the reference instrument is assumed to be calibrated () by means of the Langley technique. Taking the natural logarithms on both sides of Eq. (4), we have
where . This is a critical term in the LR method because it contains the effect of coincident measurements performed in different spectral bands. Analogous to the standard Langley method, if we assume Δτ to be constant, we find that Eq. (5) corresponds to the equation of a straight line with slope Δτ and intersection . Therefore, the linear fit of the left-hand side of Eq. (5) with respect to the air mass allows us to obtain the field photometer calibration from the previously obtained master photometer calibration . In the same manner as the standard Langley method, we have restricted the optical air mass range from 2 to 5. This reduces the calibration time, especially in low-latitude areas, thereby minimizing the possibility of increased aerosol variability.
Unlike the standard Langley method, this method is less sensitive to atmospheric variations as and are expected to vary approximately in the same way. However, the variability of the different atmospheric components can be high enough to invalidate the assumption of constant Δτ, especially as the differences in central wavelengths increase and for shorter wavelengths where atmospheric extinction is more significant. This is particularly true for aerosols (τλ,a), as they can exhibit high variability in concentration and size, leading to significant changes in τλ,a, Ångström exponent (AE) values, and consequently Δτ. In order to mitigate the effect of such variability, we propose a modification to Eq. (5) as follows:
where Δτr represents the difference in Rayleigh optical depth, Δτg accounts for the difference in gas optical depth, Δτa symbolizes the difference in aerosol optical depth, and Δτ′ corresponds to the remaining optical depth difference not adequately accounted for by the other terms, particularly Δτa. Terms Δτg and Δτr can be calculated using the algorithms widely described in the literature (e.g., Holben et al., 1998; Giles et al., 2019; Cuevas et al., 2019, and references therein) once the corresponding gas concentration and atmospheric pressure are provided. Specifically, Δτa is calculated as follows:
where is estimated using the Ångström law (Ångström, 1929), with the Ångström exponent, α, calculated from the master AOD spectrum.
Coincident photometric measurements obtained from different instruments at various stations, affected by different aerosol conditions and processed using various calibration techniques, are compared in this section. We further evaluate the new LR calibration technique by comparing it to the reference standard Langley technique for transferring calibration from the GAW-PFR to the AERONET-Cimel (CE318-TS version) at IZO and Valladolid stations in Sect. 5.1. Additionally, we assess the effectiveness of the LR calibration technique when applied to the same instrument, including different Cimel versions (CE318-TS and CE318-TV12-OC), in Sect. 5.2 and the same CE318-TS version with slightly different spectral bands in Sect. 5.3. We also investigate in this section the use of the LR method for detecting and correcting possible instrumental issues in our photometers.
5.1 Calibration transfer from GAW-PFR to AERONET-Cimel
In this section, we present the results of transferring calibration from the GAW-PFR, which is considered the reference instrument for AOD measurements by the WMO, to an AERONET-Cimel (CE318-TS) photometer. Although the GAW-PFR and AERONET-Cimel have distinct characteristics such as different optics, sun-tracking systems, relatively different fields of view, and spectral bands with varying FWHMs and λc, several comparison studies have been carried out in the past to make these different datasets comparable (Kazadzis et al., 2014, 2018a; Cuevas et al., 2019, among others). For example, Cuevas et al. (2019) conducted an exhaustive, long-term comparison in terms of AOD, which showed excellent traceability of AERONET-Cimel AOD with the GAW-PFR AOD reference at the 440, 500, and 870 nm channels, with poorer traceability results in the UV range. These authors also showed the important effect that the different FOVs between the two photometers have on the AOD monitoring, with an important AOD underestimation in the case of PFR under the presence of coarse particles due to the enhanced forward aerosol scattering, especially at the shorter wavelengths.
Our study was conducted at two different locations, IZO and Valladolid, where co-located PFR and Cimel instruments were used to collect measurements almost simultaneously (within 1 min) over a period of 6 months. The time period encompassed measurements with the AERONET photometer no. 1089 between 1 July and 31 December 2021 in the case of IZO and with the AERONET photometer no. 904 between 1 July and 31 December 2022 in the case of Valladolid. The different aerosol regimes at these two sites allowed us to assess the new LR calibration method under different atmospheric conditions: one pristine high-altitude site, suitable for performing the standard Langley calibration, and an urban site with a moderate impact of aerosol variability, used in AERONET as a cross-calibration station. The 6-month period was chosen because it is the common recalibration interval of reference instruments in GAW-PFR and AERONET-Cimel networks (Kazadzis et al., 2018b; Giles et al., 2019). According to Sect. 2, these instruments have been quality assured, including two independent cloud screening steps (GAW-PFR and AERONET-Cimel level 2.0 algorithms). During the analysis period, the AOD at 500 nm (τ500,a) varied between 0.008 and 0.583 at IZO, with an average of 0.093, and between 0.017 and 0.845 at Valladolid, with an average of 0.123.
Daily V0,λ values retrieved with the LR method () over the 6-month period at the two sites were computed using the ratio (expressed as in Eq. 6) of coincident PFR () and Cimel () measurements (i.e., ) for an air mass range from 2 to 5, with two daily values associated with the morning and afternoon branches. We have considered the closest spectral bands between the two photometers, i.e., , , , , , , , , and . It means a Δλ between instruments (Cimel versus PFR) ranging from 778 nm (for Cimel 1640 nm spectral band) down to zero at 500 nm. The Cimel exo-atmospheric output voltage data obtained by using the standard Langley method for the no. 1089 and no. 904 Cimel photometers at IZO were used as a reference. The two values, one per photometer, were considered valid for the 6-month period of measurements used in the present study, considering the extraordinarily high temporal stability of Cimel masters found by Toledano et al. (2018). Figures 1 and 2 show the daily relative differences (in %) between and for the different CE318 spectral bands (except 937 nm) at the two sites, respectively.
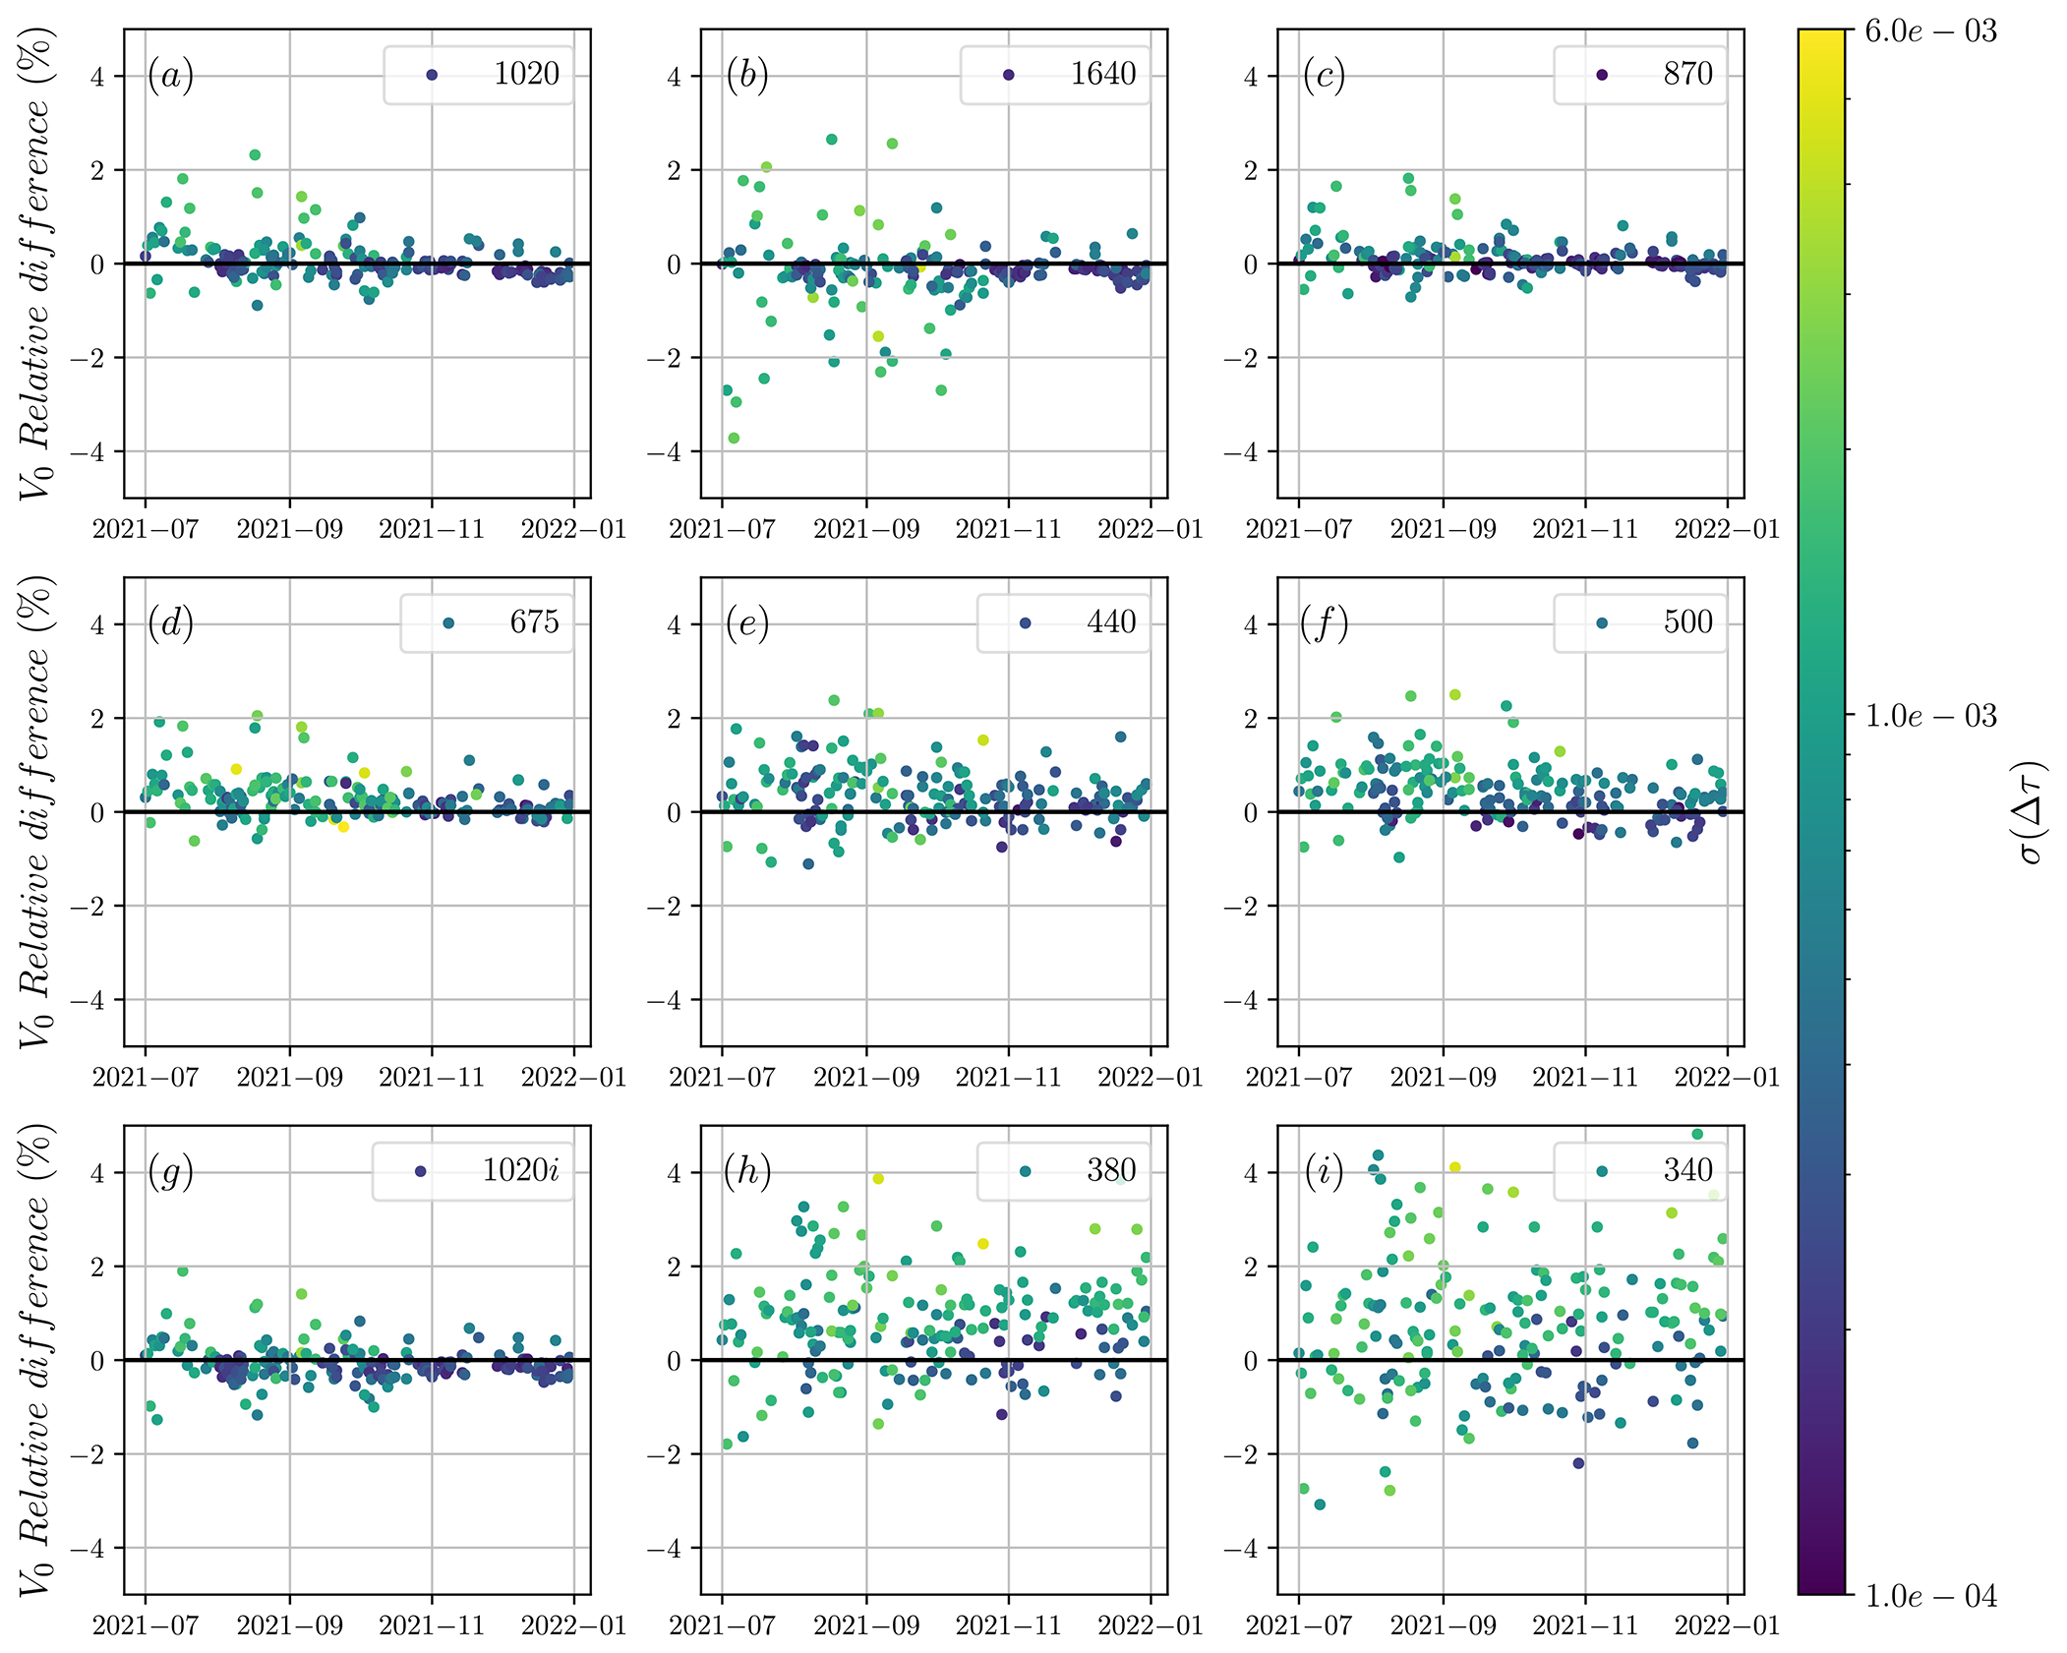
Figure 1Daily V0,λ relative differences (in %) between the calibration constant obtained by applying the standard Langley calibration () to the CE318-TS instrument no. 1089 at IZO and the calibration constant transferred to the Cimel from the PFR by applying the LR method () to daily observations at IZO. Each panel corresponds to the nine spectral bands of the CE318-TS, compared to the nearest PFR spectral band by means of the ratios () at , , , , , , , and . The color indicates the standard deviation of Δτ.
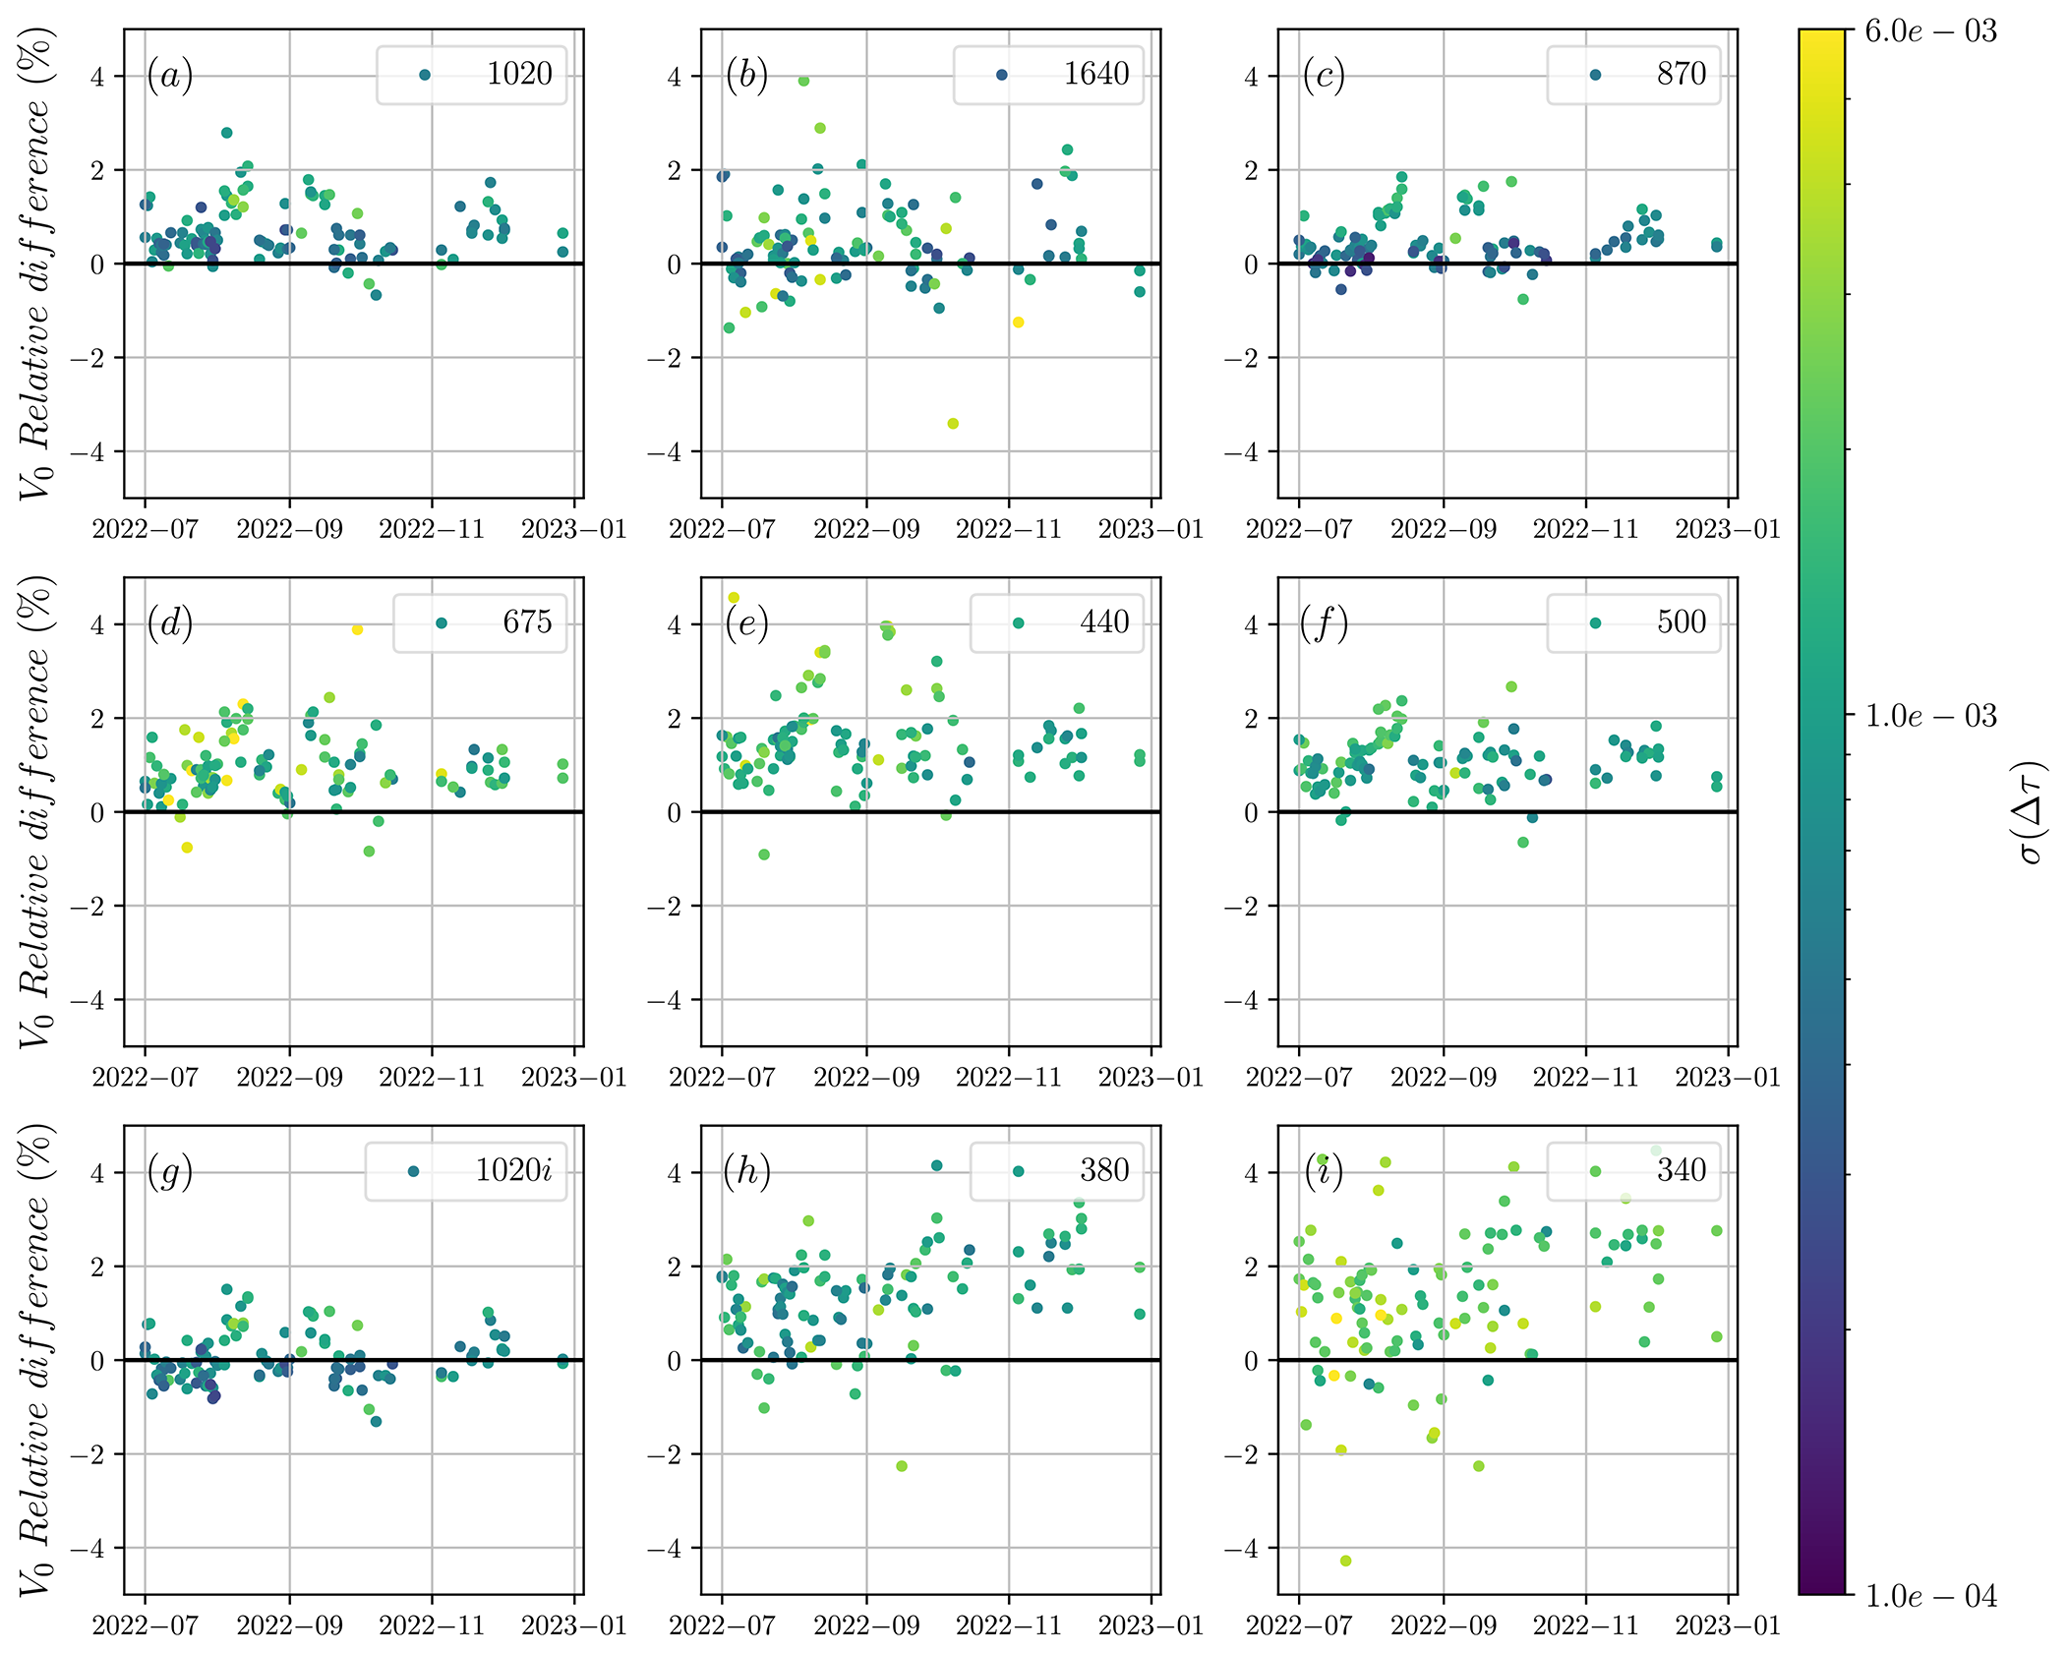
Figure 2Daily V0,λ relative differences (in %) between the calibration constant obtained by applying the standard Langley calibration () to the CE318-TS instrument no. 904 at IZO and the calibration constant transferred to the Cimel from the PFR by applying the LR method () to daily observations at Valladolid. Each panel corresponds to the nine spectral bands of the CE318-TS, compared to the nearest PFR spectral band by means of the ratios () at , , , , , , , and . The color indicates the standard deviation of Δτ.
At IZO, Fig. 1 and Table 3 show that, on average, the relative differences in the calibration constant retrieved by the standard Langley technique and the LR () and their standard deviation (σ(ΔV0)) are generally low for spectral bands outside the UV range: below 0.45 % and 0.77 %, respectively. The high σ(ΔV0) values observed at the 1640 nm spectral band (0.77 %) are attributed to the significant Δλ used in the LR, which employs the photometric information obtained by the master PFR at the spectral band centered at 862 nm to calibrate this Cimel spectral band in the NIR (Δλ of 778 nm). In the UV range, these values are found to be higher, up to 0.78 % for and 1.41 % for σ(ΔV0). It is well known that there are higher uncertainties and temperature dependence in the Cimel photometers in this spectral range (Giles et al., 2019). Although the CE318-TS signal is typically corrected in AERONET for temperature across most wavelengths using standard integrating spheres, such temperature calibration is not performed for the UV filters due to limited source power in this spectral range. These results are also consistent with the expected increase in variation in the Δτ term due to the more significant aerosol extinction in this spectral range. Looking at Fig. 1, two different time periods affecting the V0 differences can be observed, with more scatter and higher σ(Δτ) in the first period between July and September 2022. This period corresponds to the frequent dust outbreaks affecting IZO during summertime (Barreto et al., 2022a, b); therefore, there is more of an effect of dust forward scattering in AOD retrieval uncertainty due to the different instrument FOVs (Cuevas et al., 2019). The impact of circumsolar irradiance on the higher FOV of the PFR radiometer was already studied by Cuevas et al. (2019), who found an underestimation of AOD by PFR, which is more significant at lower wavelengths, depending on dust particle radius and AOD load and is considered non-negligible for τ500,a values >0.1. This effect will directly translate into the Δτ′ term in the slope of the LR analysis (Eq. 6).
Table 3Daily mean relative differences and standard deviation in V0,λ (in %) between the calibration constant obtained by applying the standard Langley calibration () to the reference GAW-PFR and the calibration constant transferred from the GAW-PFR to the AERONET-Cimel applying the LR method () to daily observations at IZO for the different CE318-TS spectral bands. Three different time periods have been included: the whole period (all data), the period between July to September 2022 (summertime period, denoted as the first period), and from October to December (denoted as the second period).
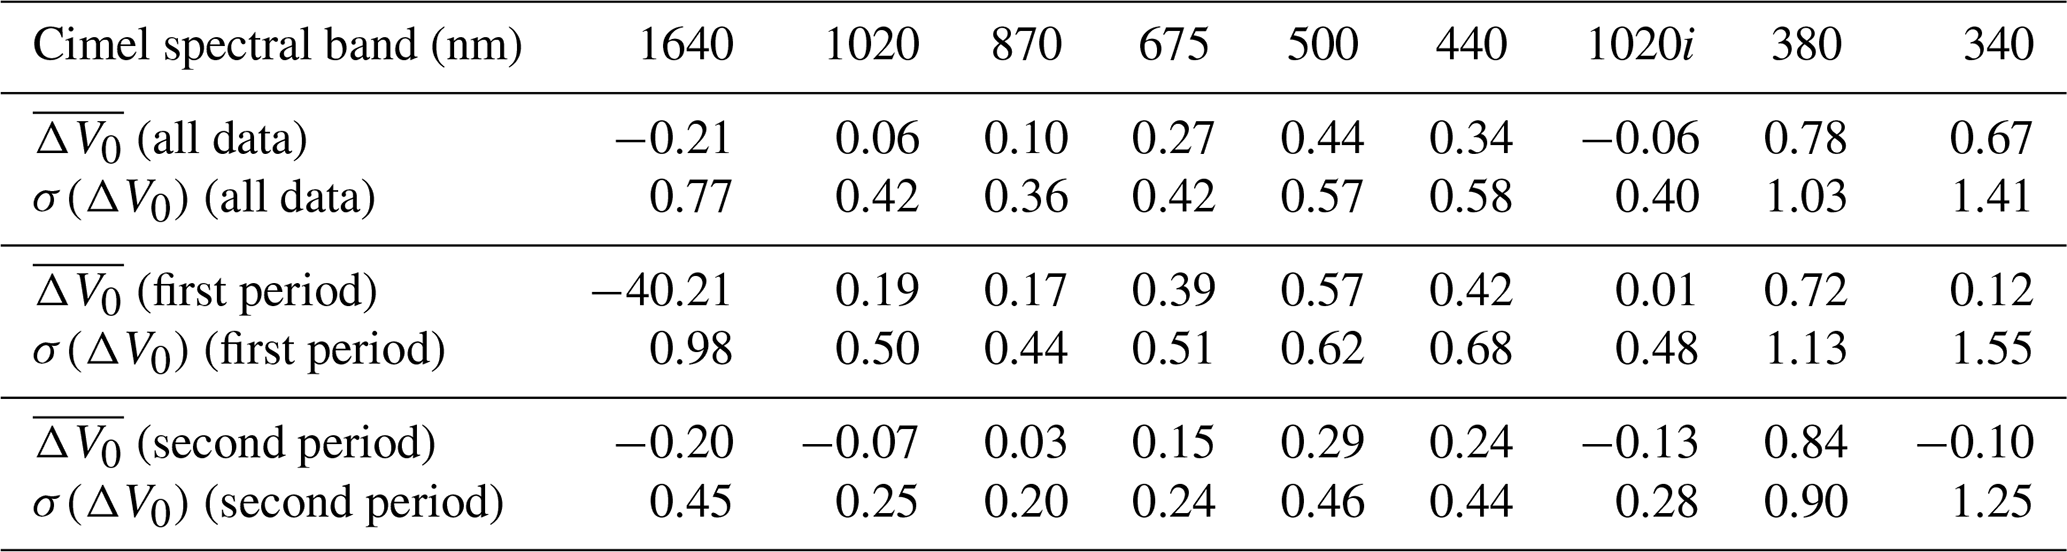
To investigate the performance of the LR method for different aerosol regimes, we included two different time periods in Table 3: the period from July to September 2022 (a summertime period with a significant amount of dust), denoted as the first period, and from October to December, denoted as the second period (which was expected to have clean conditions at the site). Mean τ500,a values of 0.12 (with a standard deviation of 0.09) and 0.03 (with a standard deviation of 0.03) were retrieved for these two periods, respectively. We found considerably lower and σ(ΔV0) values in the second period when the influence of mineral dust and the possible impact of the different FOV on the LR method through the term Δτ were minimized. Under these non-dusty conditions, we observed values between −0.20 % and 0.30 % and σ(ΔV0) values up to 0.46 % for spectral bands outside the UV range. In the UV range, and σ(ΔV0) values reached up to 0.84 % and 1.25 %, respectively, for the second period.
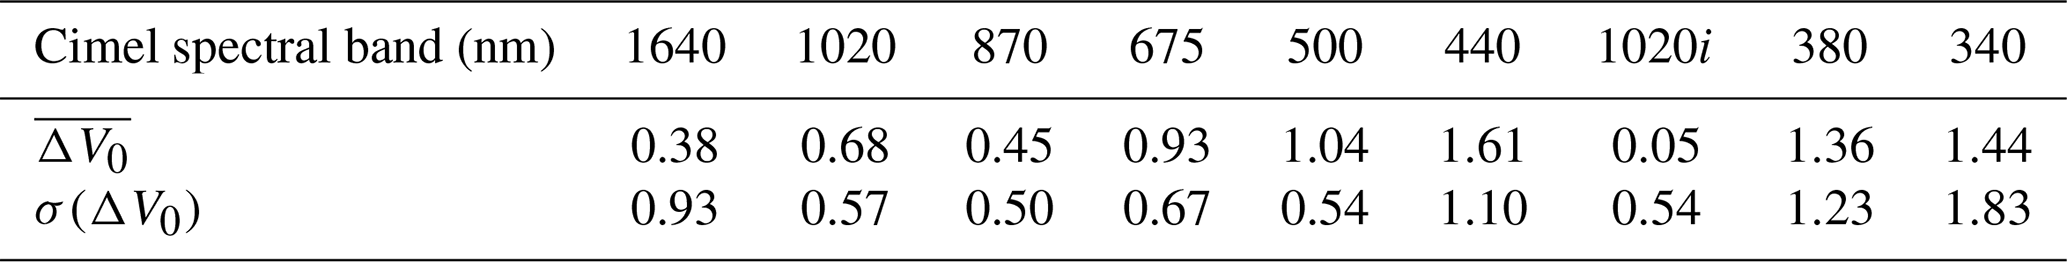
In the case of the Valladolid station, Fig. 2 and Table 4 depict the time evolution of ΔV0 and their mean and standard deviation values. A lack of ΔV0 seasonal dependence was found at this station, indicating a lower impact of aerosol seasonality at Valladolid in comparison to the IZO high-mountain station. However, some periods with higher ΔV0 values associated with higher values of σ(Δτ) can be observed in Fig. 2, especially at longer-wavelength spectral bands. These periods, observed in July and August and not related to the increase in AOD conditions, may be caused by instrumental issues such as calibration problems or dirtiness in one of the photometers. Additionally, an important bias in the ΔV0 values in the Cimel 675, 500, and 440 nm spectral bands (Fig. 2d, e, and f) was also observed, up to 1.61 %. This difference could also be due to possible instrumental problems. values up to 0.68 % were found in the longer wavelengths (1640–870 nm), with σ(ΔV0) ranging from 0.50 % to 0.93 % in 1640 nm due to the high wavelength difference between spectral bands involved in the LR method. Similarly to IZO, comparatively higher differences and standard deviations were found in the UV range (up to 1.44 % and 1.83 %, respectively).
Table 4Daily mean relative differences and standard deviation in V0,λ (in %) between the calibration constant obtained by applying the standard Langley calibration () to the reference GAW-PFR and the calibration constant transferred from the GAW-PFR to the Cimel applying the LR method () to daily observations at Valladolid for the different CE318-TS spectral bands.
The results from Figs. 1 and 2 show that the major differences in V0 are primarily due to variability in Δτ (σ(Δτ)), excluding different instrumental factors. As mentioned in Sect. 4, the variability in Δτ is mainly driven by the variability in the aerosol component Δτa. According to Eq. (7), Δτa depends on and α. To estimate the combined effect of these two variables on the V0 obtained with the LR method, a sensitivity study was conducted. This study is not explicitly presented in this section but is included as supplementary material in the Supplement. The study showed that a similar variation in both variables has a comparable influence on calibration, although α is more influential due to its greater variability. Finally, this study revealed that the LR method exhibits uncertainties greater than 1 % for and α≥1.0; therefore, it should not be applied under these conditions.
5.2 LR application between different CE318-T photometers
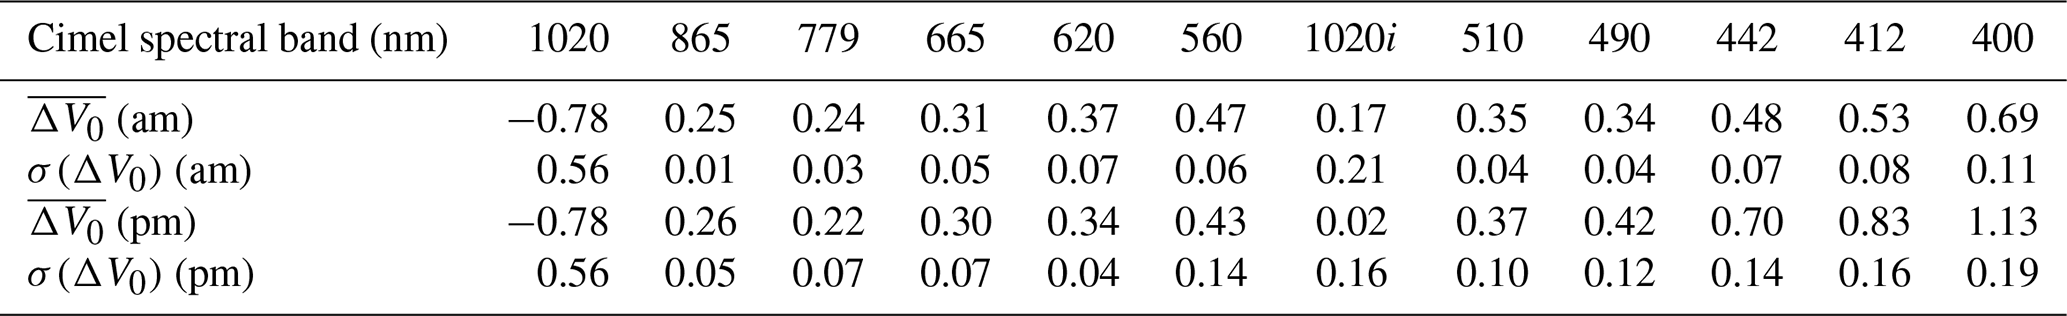
One important application of the LR method is its use in calibrating different versions of the CE318-T when the spectral bands between them are different. This is the case for the CE318-TS and CE318-TV12-OC photometers, which are standard instruments in AERONET and AERONET-OC, respectively. As in the previous section, each of the 12 spectral bands of the CE318-TV12-OC has been compared to the nearest CE318-TS spectral band using the ratios . This involves a comparison between , , , , , , , , , , , , with a Δλ up to 91 nm (at 779 nm). These two instruments were used to measure at IZO for a period of 20 d, from 9 to 29 January 2023. The reference calibration value in this case is the standard Langley calibration () of the CE318-TV12-OC photometer, which is compared to the daily values in Fig. 3 and Table 5. The temporal evolution of the V0,λ relative differences (in %) has been split into the morning (blue circles) and afternoon (orange circles). With the exception of 1020 (Fig. 3a), low and σ(ΔV0) values were obtained over the time period. The considerably higher differences in the 1020 nm spectral band measured with the silicon detector are related to the considerably important temperature dependence of the silicon detectors needed at this wavelength range (Holben et al., 1998) and the lack of temperature characterization of the CE318-TV12-OC photometers. In the rest of the spectral bands, ranged between 0.17 and 0.69 in the morning and between 0.02 and 1.13 during the afternoon, with minimum differences in the longest wavelength channel (1020i nm) and maximum in the shortest wavelength channel (400 nm). A similar behavior was observed for σ(ΔV0), with remarkably lower values ranging from 0.01 to 0.21 during the morning and slightly higher (0.04–0.19) in the afternoon excluding the 1020 filter. The difference between morning and afternoon in terms of variability is attributed to the effect of atmospheric turbulence during the afternoon period, while the mean differences observed at shorter wavelengths are attributed to the joint effect of Cimel tracking (no pointing refinement in the last measurements performed at shorter wavelengths) and optical differences between instruments.
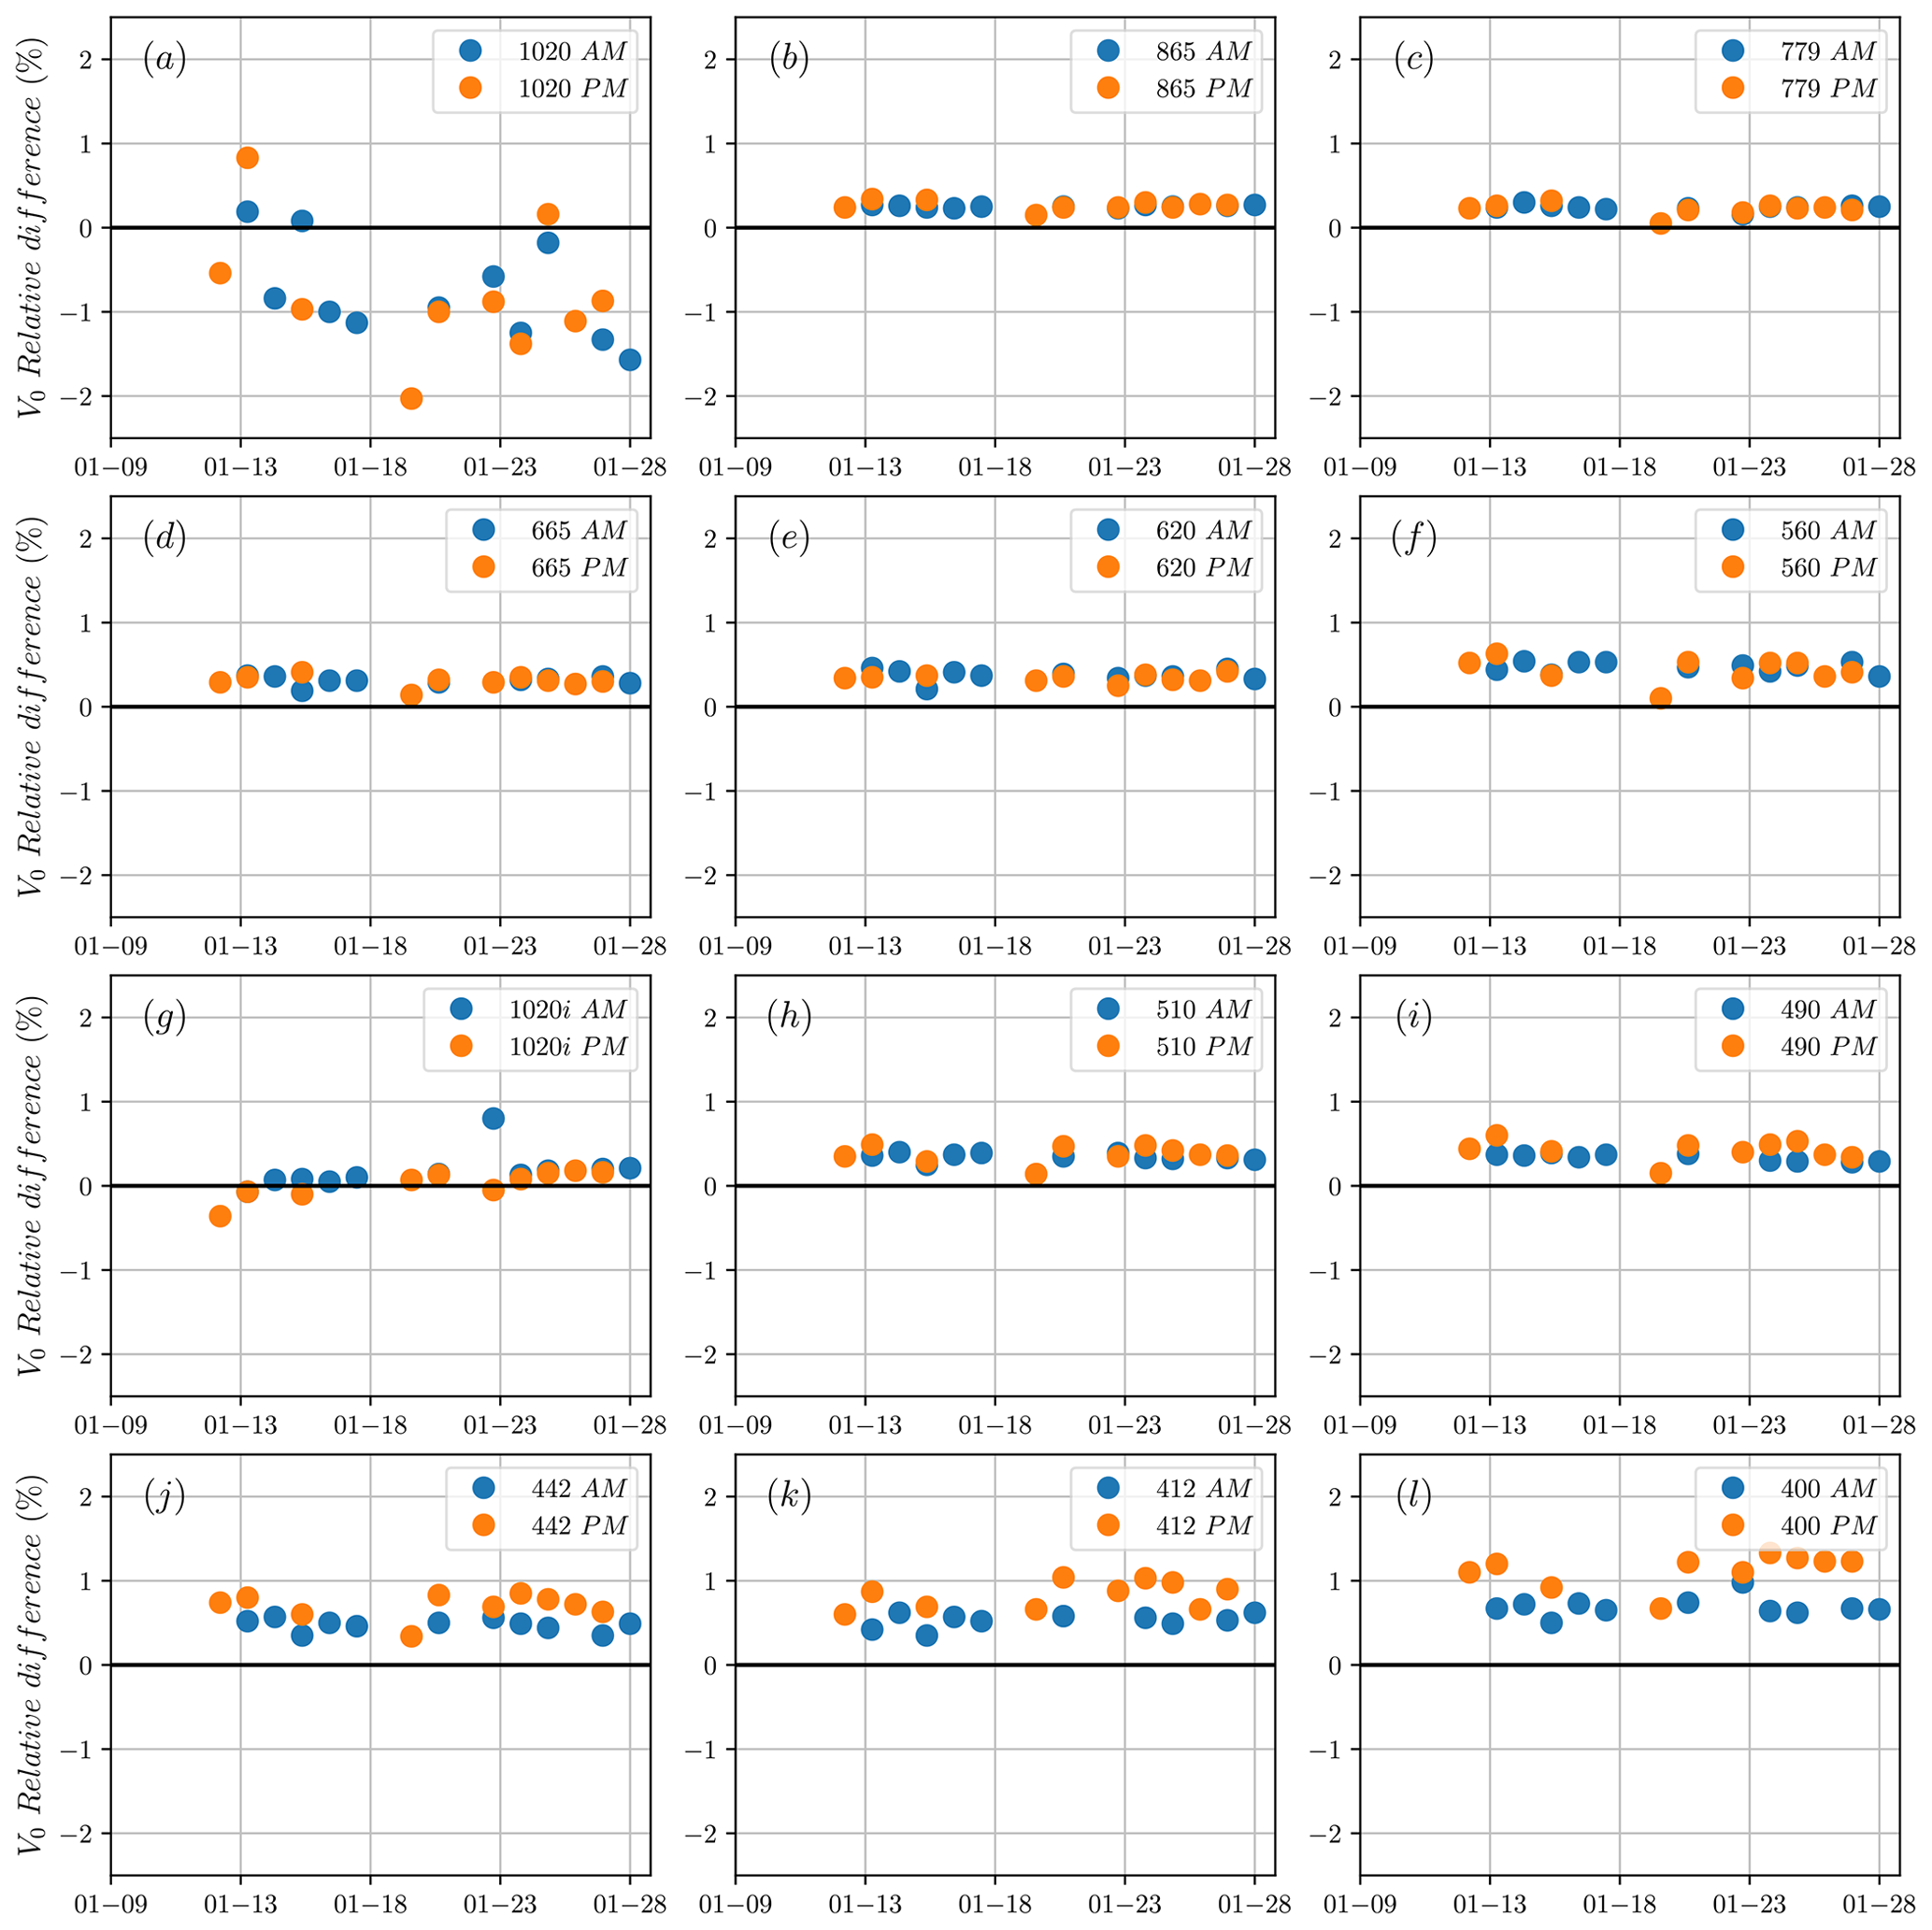
Figure 3Daily V0,λ relative differences (in %) between the calibration constant obtained by applying the standard Langley calibration () to the CE318-TV12-OC at IZO and the calibration constant transferred to the CE318-TV12-OC from the CE318-TS applying the LR method () to daily observations at IZO. Each panel corresponds to the 12 spectral bands of the CE318-TV12-OC, compared to the nearest CE318-TS spectral band by means of the ratios () at , , , , , , , , , , , . The blue circles represent relative differences in the morning, and the orange circles represent those in the afternoon.
Table 5Daily mean relative differences and standard deviation in V0,λ (in %) between the calibration constant obtained by applying the standard Langley calibration () to the CE318-TV12-OC, treated as the reference, and the calibration constant transferred to the CE318-TV12-OC from the CE318-TS applying the LR method () to daily observations at IZO for the different CE318-TV12-OC spectral bands.
5.3 Application of the LR method to detect and correct instrumental problems
In this section, we demonstrate the application of the LR method to detect and correct possible instrumental issues in our photometers. In Sect. 5.1 and 5.2, we demonstrated the suitability of the LR method to transfer the calibration between instruments with different spectral bands. However, we have not checked the calibration error that the use of the conventional ratio cross-calibration approach in these Δλ conditions can imply. We also observed the impact of different FOVs between instruments and possible instrumental issues such as calibration, temperature dependence in some spectral bands (1020 nm measured with the silicon detector and UV filters), and the joint effect of the lack of refinement during the Cimel tracking and the possible optics differences between similar spectral bands.
5.3.1 Error in the ratio calibration method and tracking errors in the UV
The current analysis has focused on the UV spectral region, which is affected by higher errors, and has been performed using two Cimel photometers of the same version (CE318-TS) to rule out any FOV impact. It is precisely in this spectral band that the errors are higher due to higher extinction, temperature dependence, and tracking limitations. Since these photometers have the same optics and spectral bands, the calibration could theoretically be transferred from the master to the field instrument by applying the common ratio cross-calibration method. In this sense, two AERONET-Cimel photometers, no. 904 and no. 942, have been selected due to the relatively high Δλ difference in the 340 nm spectral band. λc,340 nm is 340.92 nm in the case of photometer no. 904 and 339.48 nm in the case of no. 942, yielding a Δλ of 1.44 nm.
Figure 4 illustrates the results of the relative difference in V0 at 340 nm between a reference standard Langley calibration (), performed at IZO just before the analysis period, and the calibration retrieved through the common ratio cross-calibration method () without any temperature correction, shown as green crosses. We have also included in this analysis the comparison between the standard Langley and the LR method () without any temperature correction, shown as blue and orange crosses for morning and afternoon, respectively. This analysis was performed in Valladolid for the same 6-month period presented in Sect. 5.1, and it was also split into morning and afternoon data. In the plot, we can observe the presence of a significant bias (−1.6 %) at the beginning of the period between the standard Langley and ratio calibration techniques. This difference followed a seasonal dependence due to the presence of an appreciable Δλ that was not included in the analysis but was included in the LR method through the air mass term in Eq. (4). The seasonal difference is maximum (−3.8 %) at the end of December. The performance of the LR method in Fig. 4 shows relatively low and σ(ΔV0) values with no seasonal dependence. Morning/afternoon differences are also observed in this figure, with (σ(ΔV0)) values of 0.16 % (0.66) for morning data and −0.72 % (0.66) during the afternoon.
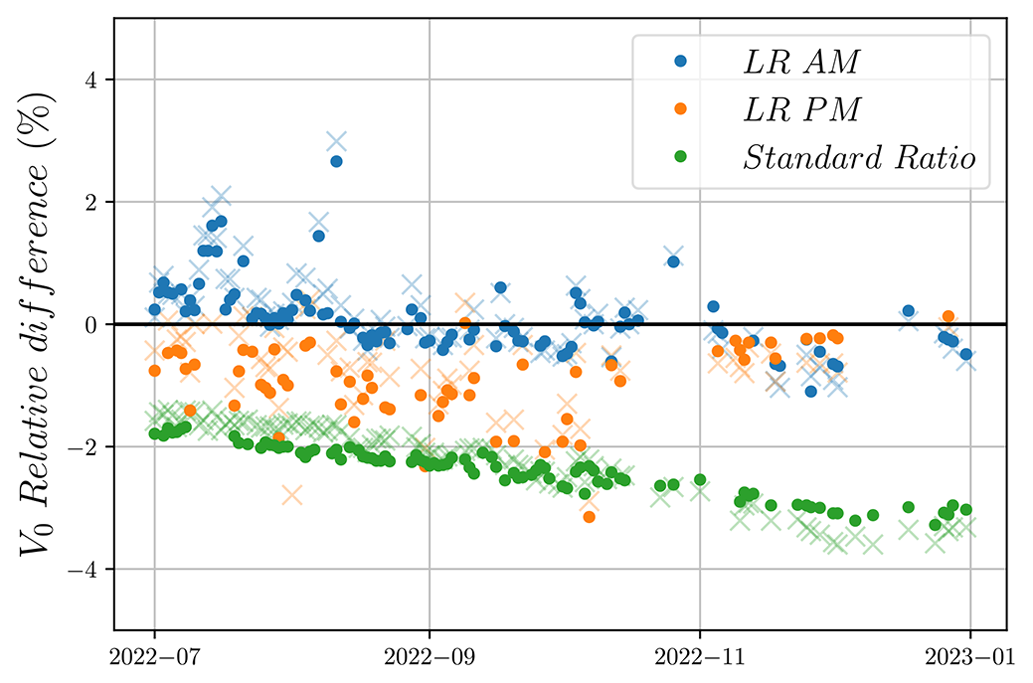
Figure 4Daily V0 relative differences (in %) between the calibration constant obtained by applying the standard Langley calibration () at IZO, used as the reference, and the calibration constant transferred between two CE318-TS instruments using the ratio method () and the LR method () to daily observations at IZO for 340 nm. Crosses indicate those results without temperature correction and circles once temperature correction was applied to this filter. Green crosses/circles represent relative differences between and , blue crosses/circles represent relative differences between and in the morning, and orange crosses/circles represent those in the afternoon.
We have delved into the origin of these daily differences by analyzing the impact of solar tracking of two test CE318-TS photometers at IZO. This was done over a sequence of 6 d (26–31 May 2021) to correct the pointing before each spectral measurement. This analysis has been performed in terms of ratio of voltages () with these two test instruments operating with a new firmware version which allowed them to perform a sequence of triplet measurements with the pointing correction, followed by a sequence without this correction. This correction compensates for the earth's rotational movement before each spectral Cimel measurement.
In Fig. 5, pointing-uncorrected ratios (blue circles) and pointing-corrected ratios (orange circles) for the 340 nm spectral band for 1 of the 6 d are shown. This figure demonstrates a significant reduction in the morning/afternoon dependence of the ratios (ratio asymmetry) after the implementation of the pointing refinement. The average ratios for morning and afternoon were 1.0925 and 1.0961 before the change in tracking and 1.0941 and 1.0948 after the change during the 6 d period. This translates to a percentage difference in morning/afternoon with average ratios of 0.33 % without correction and 0.06 % after correction. We have observed that the asymmetry between morning and afternoon measurements at shorter wavelengths (those measured at the end of the Cimel measurement routine) can be reduced by performing the tracking correction. This asymmetry depends on the instruments involved, and we have observed instruments with a ratio asymmetry of up to 2 %.
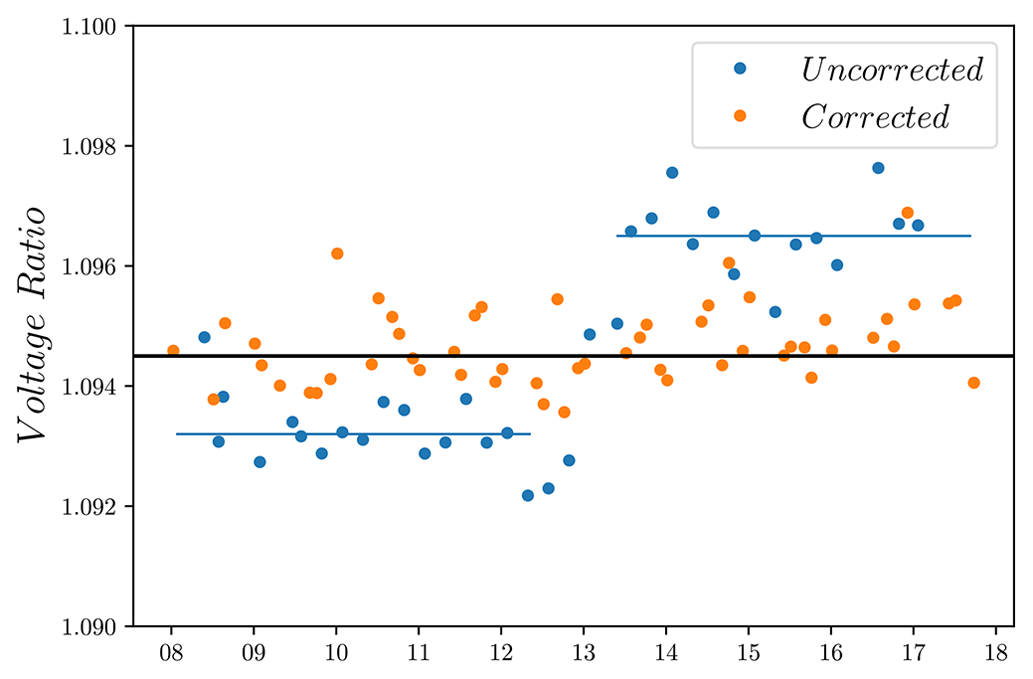
Figure 5Voltage ratios () of two instruments measuring 1 d (31 May 2021) at IZO at the 340 nm spectral band with the tracking correction (corrected, in orange) and without the tracking correction (uncorrected, in blue). The black horizontal line represents the mean value of corrected ratios. The two blue horizontal lines represent the average ratios during the morning and the afternoon.
5.3.2 Temperature dependence on UV filters
Another source of instrumental errors related to the Cimel photometers that is currently unaccounted for is the temperature dependence in the UV spectral bands. To address this issue, we have conducted an analysis using the LR technique to estimate the influence of temperature on UV measurements. Specifically, we have used two photometers at IZO: no. 904 and no. 942, the two photometers involved in the analysis displayed in Fig. 4 of the comparison performed at Valladolid. We selected photometric measurements at this high-altitude site in a 4-month period to transfer the calibration from a temperature-corrected CE318-TS filter (440 nm) to the UV filters (340 and 380 nm) using the LR technique. Figure 6 shows that the V0 relative difference varies linearly with the temperature, with an important decay in temperature of ∼ per degree in the case of 380 nm and ∼ per degree in the case of 340 nm. This equation can be used to roughly correct the temperature effect in these two spectral bands. We have verified this temperature correction by looking at the daily V0,λ relative differences displayed in Fig. 4 (closed circles). The new V0,λ relative differences have notably decreased in terms of and σ(ΔV0) during the morning, with a reduction of 31 % and 14 %, respectively. In the case of the LRs during the afternoon the reduction is only observed in the dispersion, with σ(ΔV0) −4.5 % lower.
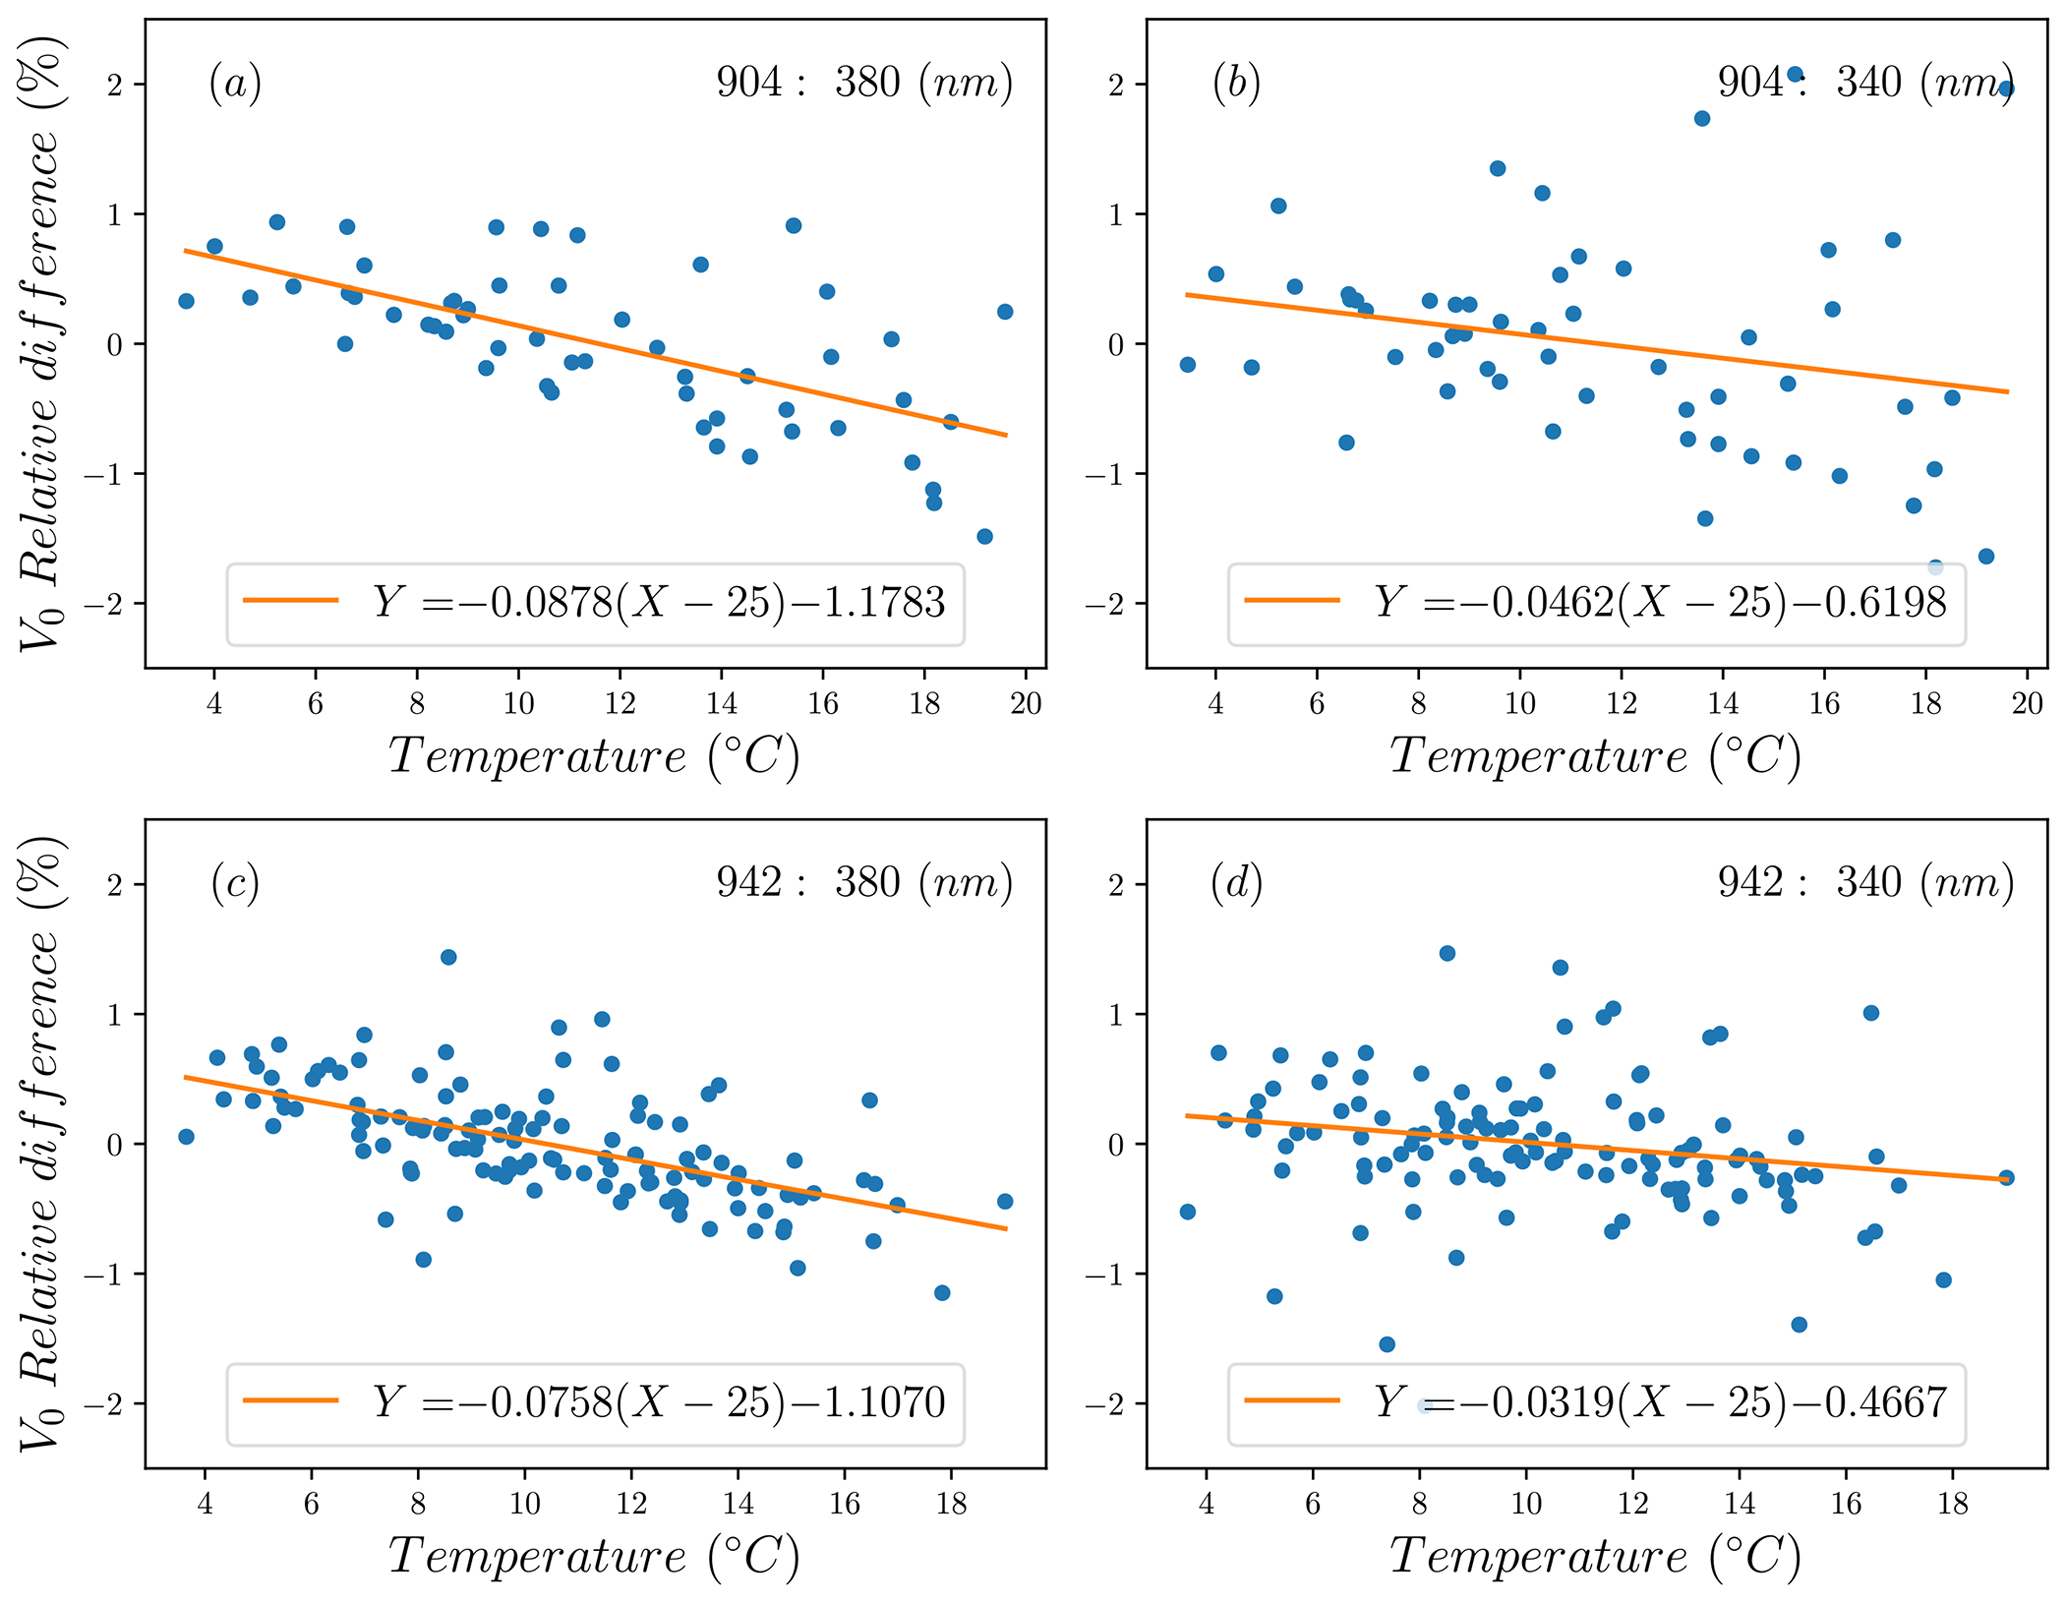
Figure 6Relative V0 difference between the daily and the average value in a 4-month period (March–June 2021 for no. 904 and January–April 2021 for no. 942) against temperature in IZO for two instruments at the two UV spectral bands: (a) for no. 904 at 380 nm, (b) for no. 904 at 340 nm, (c) for no. 942 at 380 nm, and (d) for no. 942 at 340 nm.
This paper applies sun-photometer synergies to improve calibration transference between different sun photometers and also enhance their quality assurance and quality control. Coincident PFR and CE318-T photometric observations from IZO (GAW core) and Valladolid (associated with GAW) stations, over a 6-month period, were used to analyze the performance of the new Langley ratio (LR) calibration method. This new method has been proven to be effective in transferring the calibration from reference instruments, which were calibrated using Langley calibration at IZO, to field instruments under different atmospheric conditions. Photometric information from the IZO high-mountain and Valladolid urban stations (Langley and cross-calibration sites in AERONET, respectively) revealed the presence of important external factors affecting the LR method, such as the different FOVs between photometers in dusty conditions at IZO or the probable presence of some calibration issues in Valladolid. Not considering these external factors, our results showed very low average V0,λs between Langley and LR, up to 0.29 %, with standard deviations of these V0,λs relative differences of up to 0.46 % for IZO. In the case of Valladolid, these average differences are up to 1.04 %, with standard deviations between 0.50 % and 0.93 % (in the case of the 1640 nm spectral band). Higher differences were observed in the shorter wavelengths (up to 0.84 % in IZO and 1.61 % in Valladolid), attributed to the higher errors affecting Cimel spectral bands (higher atmospheric extinction, temperature dependence on filters, and tracking issues).
A subsequent calibration transfer between the two reference instruments in AERONET and AERONET-OC (CE318-TS and CE318-TV12-OC) led us to conclude that the LR method is valid in the case of a Δλ of up to 91 nm, with relative V0,λ between Langley and LR ranging from 0.17 % to 0.69 % for LR calibrations performed in the morning and from 0.02 % to 1.13 % in the afternoon. Remarkably low standard deviations of V0,λ (0.01–0.21) were found during morning LRs, with higher dispersion (0.04–0.19) observed in the afternoon. Atmospheric turbulence is expected to be the cause of the difference between morning and afternoon LRs in terms of variability, while the joint effect of solar tracking and different optics between instruments is expected to be the reason for the high mean differences observed at shorter wavelengths. In this case, the results associated with the CE318-TV12-OC spectral band are worse due to the lack of temperature correction in the reference AERONET-OC instruments.
Our results revealed that the use of the common ratio cross-calibration technique in the case of two instruments with a significant Δλ between spectral bands can lead to calibration errors of up to −3.8 % in the UV spectral bands, and this error has a seasonal dependence due to not considering the exponential term of Eq. (4).
Finally, the LR method has been demonstrated to be a useful tool for detecting and correcting possible instrumental issues in our photometers. It was used to detect and estimate the effect of Cimel solar tracking and different optics on photometric Cimel information throughout the day (morning versus afternoon data). Average V0,λ differences of 0.16 % and −0.72 % were found for the Langley and LR comparison during the morning and afternoon, respectively. Regarding the temperature dependence on UV spectral bands, the LR method was used to roughly correct the temperature effect in these two spectral bands. Our results revealed an important decay of the signal with temperature, approximately per degree in the case of 380 nm and approximately per degree in the case of 340 nm. This equation can be used to implement, for the first time, a temperature correction in these two spectral bands.
In conclusion, this hybrid calibration technique between the Langley plot reference method and the faster and less accurate ratio cross-calibration method appears to be a suitable technique for transferring the calibration between instruments with different spectral bands. However, despite being less sensitive to aerosol variations compared to the standard Langley calibration method, the validity of LR relies on the assumption of moderate-to-low aerosol loads and a moderate-to-low Ångström exponent during the calibration period, making it unsuitable for cases where and α≥1.0.
The main datasets used in this study are available at the following Zenodo repository: https://doi.org/10.5281/zenodo.10522089 (Almansa et al., 2024). The AERONET data from IZO and Valladolid stations can be downloaded from the AERONET website: https://aeronet.gsfc.nasa.gov/ (NASA, 2024).
The supplement related to this article is available online at: https://doi.org/10.5194/amt-17-659-2024-supplement.
AFA, ÁB, NK, RG, and CT designed and wrote the structure and methodology of the paper. AFA performed the calculations required for this analysis. JG, RDG, YG, SK, SV and FM discussed the results and participated in the retrievals analysis. NK and AM performed the calibration of PFR photometers. ÓÁ and VC performed the maintenance and daily checks of the instrumentation at IZO. EC and VEC ensured the provision of funds for the aerosol measurement program at IZO and Valladolid, respectively. All authors discussed the results and contributed to the final paper.
The contact author has declared that none of the authors has any competing interests.
Publisher’s note: Copernicus Publications remains neutral with regard to jurisdictional claims made in the text, published maps, institutional affiliations, or any other geographical representation in this paper. While Copernicus Publications makes every effort to include appropriate place names, the final responsibility lies with the authors.
The activities have been developed within the framework of the World Meteorological Organization (WMO) Commission for Instruments and Methods of Observations (CIMO) Izaña Testbed for Aerosols and Water Vapour Remote Sensing Instruments. The authors acknowledge the support from the IZO staff for maintaining the instrumentation, thus ensuring the quality of the data.
This research has received financial support from the European Metrology Programme for Innovation and Research (EMPIR) within the joint research project EMPIR 19ENV04 MAPP. EMPIR is jointly funded by the participating countries within EURAMET and the European Union. Additional funding comes from the European Commission Research Infrastructure Action under the ACTRIS grant (grant no. 871115) and the Ministerio de Economía y Competitividad of Spain through the project SYNERA (grant no. PID2020-521-118793GA-I00).
This paper was edited by Omar Torres and reviewed by three anonymous referees.
Almansa, A. F., Barreto, Á., Kouremeti, N., González, R., Masoom, A., Toledano, C., Gröbner, J., García, R. D., González, Y., Kazadzis, S., Victori, S., Álvarez, Ó., Carreño, V., Cachorro, V. E., and Cuevas, E.: Signal data from photometers used in publication AMT-2023-108, Zenodo [data set], https://doi.org/10.5281/zenodo.10522089, 2024. a
Ångström, A.: On the Atmospheric Transmission of Sun Radiation and on Dust in the Air, Geogr. Ann., 11, 156–166, http://www.jstor.org/stable/519399 (last access: 15 January 2024), 1929. a
Barreto, Á., Cuevas, E., Granados-Muñoz, M.-J., Alados-Arboledas, L., Romero, P. M., Gröbner, J., Kouremeti, N., Almansa, A. F., Stone, T., Toledano, C., Román, R., Sorokin, M., Holben, B., Canini, M., and Yela, M.: The new sun-sky-lunar Cimel CE318-T multiband photometer – a comprehensive performance evaluation, Atmos. Meas. Tech., 9, 631–654, https://doi.org/10.5194/amt-9-631-2016, 2016. a
Barreto, Á., Cuevas, E., García, R. D., Carrillo, J., Prospero, J. M., Ilić, L., Basart, S., Berjón, A. J., Marrero, C. L., Hernández, Y., Bustos, J. J., Ničković, S., and Yela, M.: Long-term characterisation of the vertical structure of the Saharan Air Layer over the Canary Islands using lidar and radiosonde profiles: implications for radiative and cloud processes over the subtropical Atlantic Ocean, Atmos. Chem. Phys., 22, 739–763, https://doi.org/10.5194/acp-22-739-2022, 2022a. a, b, c
Barreto, Á., García, R. D., Guirado-Fuentes, C., Cuevas, E., Almansa, A. F., Milford, C., Toledano, C., Expósito, F. J., Díaz, J. P., and León-Luis, S. F.: Aerosol characterisation in the subtropical eastern North Atlantic region using long-term AERONET measurements, Atmos. Chem. Phys., 22, 11105–11124, https://doi.org/10.5194/acp-22-11105-2022, 2022b. a, b, c, d
Benedetti, A., Reid, J. S., Knippertz, P., Marsham, J. H., Di Giuseppe, F., Rémy, S., Basart, S., Boucher, O., Brooks, I. M., Menut, L., Mona, L., Laj, P., Pappalardo, G., Wiedensohler, A., Baklanov, A., Brooks, M., Colarco, P. R., Cuevas, E., da Silva, A., Escribano, J., Flemming, J., Huneeus, N., Jorba, O., Kazadzis, S., Kinne, S., Popp, T., Quinn, P. K., Sekiyama, T. T., Tanaka, T., and Terradellas, E.: Status and future of numerical atmospheric aerosol prediction with a focus on data requirements, Atmos. Chem. Phys., 18, 10615–10643, https://doi.org/10.5194/acp-18-10615-2018, 2018. a
Bojinski, S., Verstraete, M. M., Peterson, T. C., Richter, C. G., Simmons, A., and Zemp, M.: The Concept of Essential Climate Variables in Support of Climate Research, Applications, and Policy, B. Am. Meteorol. Soc., 95, 1431–1443, 2014. a
Cachorro, V., Toledano, C., Berjón, A., Frutos Baraja, A., Sorribas, M., and Laulainen, N.: An “in situ” calibration correction procedure (KCICLO) based on AOD diurnal cycle: Application to AERONET–El Arenosillo (Spain) AOD data series, J. Geophys. Res., 113, D12205, https://doi.org/10.1029/2007JD009673, 2008. a
Cachorro, V. E., Burgos, M. A., Mateos, D., Toledano, C., Bennouna, Y., Torres, B., de Frutos, Á. M., and Herguedas, Á.: Inventory of African desert dust events in the north-central Iberian Peninsula in 2003–2014 based on sun-photometer–AERONET and particulate-mass–EMEP data, Atmos. Chem. Phys., 16, 8227–8248, https://doi.org/10.5194/acp-16-8227-2016, 2016. a, b
Campanelli, M., Estelles, V., Smyth, T., Tomasi, C., Martìnez-Lozano, M., Claxton, B., Muller, P., Pappalardo, G., Pietruczuk, A., Shanklin, J., Colwell, S., Wrench, C., Lupi, A., Mazzola, M., Lanconelli, C., Vitale, V., Congeduti, F., Dionisi, D., Cardillo, F., Cacciani, M., Casasanta, G., and Nakajima, T.: Monitoring of Eyjafjallajökull volcanic aerosol by the new European Skynet Radiometers (ESR) network, Atmos. Environ., 48, 33–45, https://doi.org/10.1016/j.atmosenv.2011.09.070, 2012. a
Carrillo, J., Guerra, J. C., Cuevas, E., and Barrancos, J.: Characterization of the Marine Boundary Layer and the Trade-Wind Inversion over the Sub-tropical North Atlantic, Bound.-Layer Meteorol., 158, 311–330, https://doi.org/10.1007/s10546-015-0081-1, 2016. a
Chen, C., Dubovik, O., Schuster, G., Chin, M., Henze, D., Lapyonok, T., Derimian, Y., and Ying, Z.: Multi-angular polarimetric remote sensing to pinpoint global aerosol absorption and direct radiative forcing, Nat. Commun., 13, 7459, https://doi.org/10.1038/s41467-022-35147-y, 2022. a
Cuevas, E., Romero-Campos, P. M., Kouremeti, N., Kazadzis, S., Räisänen, P., García, R. D., Barreto, A., Guirado-Fuentes, C., Ramos, R., Toledano, C., Almansa, F., and Gröbner, J.: Aerosol optical depth comparison between GAW-PFR and AERONET-Cimel radiometers from long-term (2005–2015) 1 min synchronous measurements, Atmos. Meas. Tech., 12, 4309–4337, https://doi.org/10.5194/amt-12-4309-2019, 2019. a, b, c, d, e, f, g
Cuevas, E., Milford, C., Barreto, A., et al.: Izaña Atmospheric Research Center Activity Report 2019–2020, edited by: Cuevas, E., Milford, C., and Tarasova, O., State Meteorological Agency (AEMET), Madrid, Spain and World Meteorological Organization, Geneva, Switzerland, NIPO: 666-22-014-0, WMO/GAW Report No. 276, https://doi.org/10.31978/666-22-014-0, 2022. a
Dubovik, O. and King, M. D.: A flexible inversion algorithm for retrieval of aerosol optical properties from Sun and sky radiance measurements, J. Geophys. Res.-Atmos., 105, 20673–20696, https://doi.org/10.1029/2000JD900282, 2000. a
Dubovik, O., Holben, B. N., Lapyonok, T., Sinyuk, A., Mishchenko, M. I., Yang, P., and Slutsker, I.: Non-spherical aerosol retrieval method employing light scattering by spheroids, Geophys. Res. Lett., 29, 54-1–54-4, https://doi.org/10.1029/2001GL014506, 2002. a
Dubovik, O., Sinyuk, A., Lapyonok, T., Holben, B. N., Mishchenko, M., Yang, P., Eck, T. F., Volten, H., Muñoz, O., Veihelmann, B., van der Zande, W. J., Leon, J.-F., Sorokin, M., and Slutsker, I.: Application of spheroid models to account for aerosol particle nonsphericity in remote sensing of desert dust, J. Geophys. Res.-Atmos., 111, D11208, https://doi.org/10.1029/2005JD006619, 2006. a
Dubovik, O., Lapyonok, T., Litvinov, P., Herman, M., Fuertes, D., Ducos, F., Lopatin, A., Chaikovsky, A., Torres, B., Derimian, Y., Huang, X., Aspetsberger, M., and Federspiel, C.: GRASP: a versatile algorithm for characterizing the atmosphere, SPIE Newsroom, https://doi.org/10.1117/2.1201408.005558, 2014. a
Eck, T., Holben, b., Reid, J., Dubovik, O., Smirnov, A., Neill, Slutsker, I., and Kinne, S.: Wavelength dependence of the optical depth of biomass burning, urban, and desert dust aerosols, J. Geophys. Res.-Atmos., 104, 31333–31349, https://doi.org/10.1029/1999JD900923, 1999. a, b
Fargion, G., Barnes, R., and McClain, C.: In situ aerosol optical thickness collected by the SIMBIOS Program (1997–2000): protocols, and data QC and analysis. Chapter 3: Calibration of Sun Photometers and Sky Radiance Sensors, NASA/TM-2001-209982, Greenbelt, Maryland, https://seabass.gsfc.nasa.gov/wiki/System_Description/SIMBIOS-AOT-2000.pdf (last access: 15 January 2024), 2001. a, b, c
Forgan, B. W.: General method for calibrating Sun photometers, Appl. Optics, 33, 4841–4850, https://doi.org/10.1364/AO.33.004841, 1994. a
Giles, D. M., Sinyuk, A., Sorokin, M. G., Schafer, J. S., Smirnov, A., Slutsker, I., Eck, T. F., Holben, B. N., Lewis, J. R., Campbell, J. R., Welton, E. J., Korkin, S. V., and Lyapustin, A. I.: Advancements in the Aerosol Robotic Network (AERONET) Version 3 database – automated near-real-time quality control algorithm with improved cloud screening for Sun photometer aerosol optical depth (AOD) measurements, Atmos. Meas. Tech., 12, 169–209, https://doi.org/10.5194/amt-12-169-2019, 2019. a, b, c, d, e, f, g
Gueymard, C. A. and Yang, D.: Worldwide validation of CAMS and MERRA-2 reanalysis aerosol optical depth products using 15 years of AERONET observations, Atmos. Environ., 225, 117216, https://doi.org/10.1016/j.atmosenv.2019.117216, 2020. a
Holben, B. N., Eck, T. F., Slutsker, I., Tanré, D., Buis, J. P., Setzer, A., Vermote, E., Reagan, J. A., Kaufman, Y. J., Nakajima, T., Lavenu, F., Jankowiak, I., and Smirnov, A.: AERONET–A Federated Instrument Network and Data Archive for Aerosol Characterization, Remote Sens. Environ., 66, 1–16, https://doi.org/10.1016/S0034-4257(98)00031-5, 1998. a, b, c, d, e, f, g, h, i, j, k, l, m
Karanikolas, A., Kouremeti, N., Gröbner, J., Egli, L., and Kazadzis, S.: Sensitivity of aerosol optical depth trends using long-term measurements of different sun photometers, Atmos. Meas. Tech., 15, 5667–5680, https://doi.org/10.5194/amt-15-5667-2022, 2022. a
Kazadzis, S., Veselovskii, I., Amiridis, V., Gröbner, J., Suvorina, A., Nyeki, S., Gerasopoulos, E., Kouremeti, N., Taylor, M., Tsekeri, A., and Wehrli, C.: Aerosol microphysical retrievals from precision filter radiometer direct solar radiation measurements and comparison with AERONET, Atmos. Meas. Tech., 7, 2013–2025, https://doi.org/10.5194/amt-7-2013-2014, 2014. a, b
Kazadzis, S., Kouremeti, N., Diémoz, H., Gröbner, J., Forgan, B. W., Campanelli, M., Estellés, V., Lantz, K., Michalsky, J., Carlund, T., Cuevas, E., Toledano, C., Becker, R., Nyeki, S., Kosmopoulos, P. G., Tatsiankou, V., Vuilleumier, L., Denn, F. M., Ohkawara, N., Ijima, O., Goloub, P., Raptis, P. I., Milner, M., Behrens, K., Barreto, A., Martucci, G., Hall, E., Wendell, J., Fabbri, B. E., and Wehrli, C.: Results from the Fourth WMO Filter Radiometer Comparison for aerosol optical depth measurements, Atmos. Chem. Phys., 18, 3185–3201, https://doi.org/10.5194/acp-18-3185-2018, 2018a. a, b, c, d, e
Kazadzis, S., Kouremeti, N., Nyeki, S., Gröbner, J., and Wehrli, C.: The World Optical Depth Research and Calibration Center (WORCC) quality assurance and quality control of GAW-PFR AOD measurements, Geosci. Instrum. Method. Data Syst., 7, 39–53, https://doi.org/10.5194/gi-7-39-2018, 2018b. a, b, c, d, e
Kouremeti, N., Nevas, S., Kazadzis, S., Gröbner, J., Schneider, P., and Schwind, K. M.: SI-traceable solar irradiance measurements for aerosol optical depth retrieval, Metrologia, 59, 044001, https://doi.org/10.1088/1681-7575/ac6cbb, 2022. a
Mortier, A., Gliß, J., Schulz, M., Aas, W., Andrews, E., Bian, H., Chin, M., Ginoux, P., Hand, J., Holben, B., Zhang, H., Kipling, Z., Kirkevåg, A., Laj, P., Lurton, T., Myhre, G., Neubauer, D., Olivié, D., von Salzen, K., Skeie, R. B., Takemura, T., and Tilmes, S.: Evaluation of climate model aerosol trends with ground-based observations over the last 2 decades – an AeroCom and CMIP6 analysis, Atmos. Chem. Phys., 20, 13355–13378, https://doi.org/10.5194/acp-20-13355-2020, 2020. a
Nakajima, T., Campanelli, M., Che, H., Estellés, V., Irie, H., Kim, S.-W., Kim, J., Liu, D., Nishizawa, T., Pandithurai, G., Soni, V. K., Thana, B., Tugjsurn, N.-U., Aoki, K., Go, S., Hashimoto, M., Higurashi, A., Kazadzis, S., Khatri, P., Kouremeti, N., Kudo, R., Marenco, F., Momoi, M., Ningombam, S. S., Ryder, C. L., Uchiyama, A., and Yamazaki, A.: An overview of and issues with sky radiometer technology and SKYNET, Atmos. Meas. Tech., 13, 4195–4218, https://doi.org/10.5194/amt-13-4195-2020, 2020. a, b
NASA (National Aeronautics and Space Administration): AERONET (AErosol RObotic NETwork), NASA, Goddard Space Flight Center, https://aeronet.gsfc.nasa.gov/, last access: 17 January 2024. a
Nyeki, S., Halios, C. H., Baum, W., Eleftheriadis, K., Flentje, H., Gröbner, J., Vuilleumier, L., and Wehrli, C.: Ground-based aerosol optical depth trends at three high-altitude sites in Switzerland and southern Germany from 1995 to 2010, J. Geophys. Res.-Atmos., 117, D18202, https://doi.org/10.1029/2012JD017493, 2012. a
Omar, A. H., Winker, D. M., Tackett, J. L., Giles, D. M., Kar, J., Liu, Z., Vaughan, M. A., Powell, K. A., and Trepte, C. R.: CALIOP and AERONET aerosol optical depth comparisons: One size fits none, J. Geophys. Res.-Atmos., 118, 4748–4766, https://doi.org/10.1002/jgrd.50330, 2013. a
Popp, T., De Leeuw, G., Bingen, C., Brühl, C., Capelle, V., Chedin, A., Clarisse, L., Dubovik, O., Grainger, R., Griesfeller, J., Heckel, A., Kinne, S., Klüser, L., Kosmale, M., Kolmonen, P., Lelli, L., Litvinov, P., Mei, L., North, P., Pinnock, S., Povey, A., Robert, C., Schulz, M., Sogacheva, L., Stebel, K., Stein Zweers, D., Thomas, G., Tilstra, L. G., Vandenbussche, S., Veefkind, P., Vountas, M., and Xue, Y.: Development, Production and Evaluation of Aerosol Climate Data Records from European Satellite Observations (Aerosol_cci), Remote Sensing, 8, 421, https://doi.org/10.3390/rs8050421, 2016. a
Randles, C. A., da Silva, A. M., Buchard, V., Colarco, P. R., Darmenov, A., Govindaraju, R., Smirnov, A., Holben, B., Ferrare, R., Hair, J., Shinozuka, Y., and Flynn, C. J.: The MERRA-2 Aerosol Reanalysis, 1980 Onward. Part I: System Description and Data Assimilation Evaluation, J. Climate, 30, 6823–6850, https://doi.org/10.1175/JCLI-D-16-0609.1, 2017. a
Rodríguez, S., Alastuey, A., Alonso-Pérez, S., Querol, X., Cuevas, E., Abreu-Afonso, J., Viana, M., Pérez, N., Pandolfi, M., and de la Rosa, J.: Transport of desert dust mixed with North African industrial pollutants in the subtropical Saharan Air Layer, Atmos. Chem. Phys., 11, 6663–6685, https://doi.org/10.5194/acp-11-6663-2011, 2011. a
Rodríguez, S., Cuevas, E., Prospero, J. M., Alastuey, A., Querol, X., López-Solano, J., García, M. I., and Alonso-Pérez, S.: Modulation of Saharan dust export by the North African dipole, Atmos. Chem. Phys., 15, 7471–7486, https://doi.org/10.5194/acp-15-7471-2015, 2015. a
Román, R., Bilbao, J., and de Miguel, A.: Uncertainty and variability in satellite-based water vapor column, aerosol optical depth and Angström exponent, and its effect on radiative transfer simulations in the Iberian Peninsula, Atmos. Environ., 89, 556–569, https://doi.org/10.1016/j.atmosenv.2014.02.027, 2014. a
Rubin, J. I., Reid, J. S., Hansen, J. A., Anderson, J. L., Holben, B. N., Xian, P., Westphal, D. L., and Zhang, J.: Assimilation of AERONET and MODIS AOT observations using variational and ensemble data assimilation methods and its impact on aerosol forecasting skill, J. Geophys. Res.-Atmos., 122, 4967–4992, https://doi.org/10.1002/2016JD026067, 2017. a
Sayer, A. M., Hsu, N. C., Lee, J., Carletta, N., Chen, S.-H., and Smirnov, A.: Evaluation of NASA Deep Blue/SOAR aerosol retrieval algorithms applied to AVHRR measurements, J. Geophys. Res.-Atmos., 122, 9945–9967, https://doi.org/10.1002/2017JD026934, 2017. a
Sayer, A. M., Hsu, N. C., Lee, J., Kim, W. V., and Dutcher, S. T.: Validation, Stability, and Consistency of MODIS Collection 6.1 and VIIRS Version 1 Deep Blue Aerosol Data Over Land, J. Geophys. Res.-Atmos., 124, 4658–4688, https://doi.org/10.1029/2018JD029598, 2019. a
Schmid, B. and Wehrli, C.: Comparison of Sun photometer calibration by use of the Langley technique and the standard lamp, Appl. Optics, 34, 4500–4512, https://doi.org/10.1364/AO.34.004500, 1995. a
Schmid, B., Spyak, P. R., Biggar, S. F., Wehrli, C., Sekler, J., Ingold, T., Mätzler, C., and Kämpfer, N.: Evaluation of the applicability of solar and lamp radiometric calibrations of aprecision sun photometer operating between 300 and 1025 nm, Appl. Optics, 37, 3923–3941, https://doi.org/10.1364/AO.37.003923, 1998. a
Shaw, G. E.: Sun Photometry, B. Am. Meteorol. Soc., 64, 4–10, https://doi.org/10.1175/1520-0477(1983)064<0004:SP>2.0.CO;2, 1983. a
Sogacheva, L., Popp, T., Sayer, A. M., Dubovik, O., Garay, M. J., Heckel, A., Hsu, N. C., Jethva, H., Kahn, R. A., Kolmonen, P., Kosmale, M., de Leeuw, G., Levy, R. C., Litvinov, P., Lyapustin, A., North, P., Torres, O., and Arola, A.: Merging regional and global aerosol optical depth records from major available satellite products, Atmos. Chem. Phys., 20, 2031–2056, https://doi.org/10.5194/acp-20-2031-2020, 2020. a
Soufflet, V., Devaux, C., and Tanré, D.: Modified Langley plot method for measuring the spectral aerosol optical thickness and its daily variations, Appl. Optics, 31, 2154–2162, https://doi.org/10.1364/AO.31.002154, 1992. a
Takamura, T., Nakajima, T., and SKYNET community group: Overview of SKYNET and its Activities, Opt. Pura Apl., 37, 3303–3308, https://www.sedoptica.es/Menu_Volumenes/Pdfs/126.pdf (last access: 15 January 2024), 2004. a, b
Toledano, C., González, R., Fuertes, D., Cuevas, E., Eck, T. F., Kazadzis, S., Kouremeti, N., Gröbner, J., Goloub, P., Blarel, L., Román, R., Barreto, Á., Berjón, A., Holben, B. N., and Cachorro, V. E.: Assessment of Sun photometer Langley calibration at the high-elevation sites Mauna Loa and Izaña, Atmos. Chem. Phys., 18, 14555–14567, https://doi.org/10.5194/acp-18-14555-2018, 2018. a, b, c, d
Torres, B., Toledano, C., Berjón, A., Fuertes, D., Molina, V., Gonzalez, R., Canini, M., Cachorro, V. E., Goloub, P., Podvin, T., Blarel, L., Dubovik, O., Bennouna, Y., and de Frutos, A. M.: Measurements on pointing error and field of view of Cimel-318 Sun photometers in the scope of AERONET, Atmos. Meas. Tech., 6, 2207–2220, https://doi.org/10.5194/amt-6-2207-2013, 2013. a, b
Torres, B., Dubovik, O., Fuertes, D., Schuster, G., Cachorro, V. E., Lapyonok, T., Goloub, P., Blarel, L., Barreto, A., Mallet, M., Toledano, C., and Tanré, D.: Advanced characterisation of aerosol size properties from measurements of spectral optical depth using the GRASP algorithm, Atmos. Meas. Tech., 10, 3743–3781, https://doi.org/10.5194/amt-10-3743-2017, 2017. a
Wehrli, C.: Calibrations of filter radiometers for determination of atmospheric optical depth, Metrologia, 37, 419–422, https://doi.org/10.1088/0026-1394/37/5/16, 2000. a, b, c, d, e
Wehrli, C.: GAW-PFR: A Network of Aerosol Optical Depth Observations with Precision Filter Radiometers, in: WMO/GAW Experts Workshop on a Global Surface-Based Network for Long Term Observations of Column Aerosol Optical Properties, Davos, Switzerland, 8–10 March 2004, edited by: Baltensperger, U., Barrie, L., and Wehrli, C., WMO/GAW Report No. 162, Geneva, 2005. a, b, c
Wehrli, C.: Precision Filter Radiometer Documentation, ftp://ftp.pmodwrc.ch/pub/projects/worcc/PFRManual.pdf (last access: 15 January 2024), 2008a. a, b
Wehrli, C. J.: Remote Sensing of Aerosol Optical Depth in a global surface network, Doctoral thesis, ETH Zurich, Zurich, https://doi.org/10.3929/ethz-a-005659798, 2008b. a, b
WMO: WMO. Aerosol measurement procedures, guidelines and recommendations, Tech. Rep. GAW Report No. 153, WMO TD No. 1178, World Meteorological Organization, 2003. a
WMO: WMO/GAW Experts Workshop on a Global Surface-Based Network for Long Term Observations of Column Aerosol Optical Properties (8–10 March 2004; Davos, Switzerland), GAW Report No. 162, 2005. a
Zibordi, G., Holben, B. N., Talone, M., D’Alimonte, D., Slutsker, I., Giles, D. M., and Sorokin, M. G.: Advances in the Ocean Color Component of the Aerosol Robotic Network (AERONET-OC), J. Atmos. Ocean. Tech., 38, 725–746, https://doi.org/10.1175/JTECH-D-20-0085.1, 2021. a, b