the Creative Commons Attribution 4.0 License.
the Creative Commons Attribution 4.0 License.
The differences between remote sensing and in situ air pollutant measurements over the Canadian oil sands
Debora Griffin
Chris McLinden
Ralf Staebler
Cristian Mihele
Kevin Strawbridge
Jonathan Davies
Ihab Abboud
Sum Chi Lee
Alexander Cede
Martin Tiefengraber
Robert Swap
Ground-based remote sensing instruments have been widely used for atmospheric research, but applications for air quality monitoring remain limited. Compared to an in situ instrument that provides air quality conditions at the ground level, most remote sensing instruments (nadir viewing) are sensitive to a broad range of altitudes, often providing only integrated column observations. These column data can be more difficult to interpret and to relate to surface values and hence to “nose-height-level” health factors. This research utilized ground-based remote sensing and in situ air quality observations in Canada's Athabasca oil sands region to investigate some of their differences.
Vertical column densities (VCDs) of SO2 and NO2 retrieved by Pandora spectrometers located at the Oski-Otin site at Fort McKay (Alberta, Canada) from 2013–2019 were analyzed along with measurements of SO2 and NO2 surface concentrations and meteorological data. Aerosol optical depth (AOD) observations by a CIMEL sunphotometer were compared with surface PM2.5 data. The Oski-Otin site is surrounded by several large bitumen mining operations within the Athabasca oil sands region with significant NO2 emissions from the mining fleet. Two major bitumen upgraders that are 20 km south-east of the site have total SO2 and NO2 emissions of about 40 and 20 kt yr−1, respectively. It was demonstrated that remote sensing data from Pandora and CIMEL combined with high-vertical-resolution wind profiles can provide information about pollution sources and plume characteristics. Elevated SO2 VCDs were clearly observed for times with south and south-eastern winds, particularly at 200–300 m altitude (above ground level). High NO2 VCD values were observed from other directions (e.g., north-west) with less prominent impacts from 200–300 m winds. In situ ground observations of SO2 and NO2 show a different sensitivity to wind profiles, indicating they are less sensitive to elevated plumes than remote sensing instruments. In addition to measured wind data and lidar-observed boundary layer height (BLH), modelled wind profiles and BLH from ECMWF Reanalysis v5 (ERA5) have been used to further examine the correlation between column and surface observations. The results show that the height of emission sources (e.g., emissions from high stacks or near the surface) will determine the ratio of measured column and surface concentration values (i.e., could show positive or negative correlation with BLH). This effect will have an impact on the comparison between column observations (e.g., from the satellite or ground-based remote sensing instruments) with surface in situ measurements.
This study explores differences between remote sensing and in situ instruments in terms of their vertical, horizontal, and temporal sampling differences. Understanding and resolving these differences are critical for future analyses linking satellite, ground-based remote sensing and in situ observations in air quality monitoring and research.
- Article
(9914 KB) - Full-text XML
- BibTeX
- EndNote
© His Majesty the King in Right of Canada, as represented by the Minister of the Environment, 2024.
Satellite measurements have been widely used to analyze long-term changes and trends in atmospheric air pollutants such as sulfur dioxide (SO2) and nitrogen dioxide (NO2) (Barkley et al., 2017; Duncan et al., 2016; Krotkov et al., 2016; Liu et al., 2017; McLinden et al., 2016; Song and Yang, 2014; Wang et al., 2015) and to estimate the corresponding emission rates (Fioletov et al., 2011, 2015; de Foy et al., 2015; Lu et al., 2015; Streets et al., 2013). It is expected that satellite instruments will play an even bigger role in air quality monitoring in the future (new high-resolution geostationary missions such as TEMPO, Zoogman et al., 2017; Sentinel 4, Gulde et al., 2017; and GEMS, Kim et al., 2020). However, there is a major complication in applying satellite measurements to surface air quality applications. Most nadir-viewing satellite instruments are sensitive to the entire atmospheric column and hence derive vertical column densities (VCDs; vertically integrated number density of a given species from the bottom to top of the atmosphere), and their conversion to surface concentrations required by air quality applications is not straightforward.
Ground-based remote sensing observations of the same quantity help to both validate satellite observations and facilitate a better interpretation of satellite data and their links to surface concentration (Richter et al., 2013), keeping in mind the mismatch between satellite and ground-based remote sensing quantities that was widely reported (Herman et al., 2009; Judd et al., 2020; Kollonige et al., 2017; Zhao et al., 2020, 2022). Alternatively, a direct comparison of ground-based VCD observations with surface concentrations does not typically produce high correlations (Dieudonné et al., 2013). Taking the planetary boundary layer (PBL) height into account improves the agreement between in situ and VCD-derived surface mixing ratios for NO2 but not so much for SO2 (Knepp et al., 2015). Other efforts to convert ground-based VCD measurements to surface concentrations were made by researchers via various approaches, including applying conversion ratio factors (e.g., Kollonige et al., 2017; Zhao et al., 2019). However, due to some fundamental differences between ground-based remote sensing and in situ instruments (e.g., sampling difference in space and frequency), surface concentration estimates via these instruments still have non-negligible bias differences (e.g., surface NO2 derived from Pandora observations has about −7 % bias compared to in situ data; Zhao et al., 2019). One of the major challenges is the difficulty in modelling, measuring, or estimating the boundary layer conditions (e.g., boundary layer height (BLH), wind speed and direction profiles) that is critical to resolving the vertical structure of air pollutants (e.g., Zhao et al., 2019).
The mining and refinery operations in the Athabasca oil sands region are one of the largest sources of atmospheric pollutants in Canada. Environmental and health concerns associated with oil sands operations, including air quality and acid deposition, are well known (e.g., Kelly et al., 2010). SO2 and NO2 are at the top of the list of gaseous pollutants emitted from the oil sands, and highly elevated levels of these pollutants over the oil sands area have been detected (Simpson et al., 2010). Due to the large size of the oil sands operation area, satellite column measurements are an attractive method for air pollution monitoring in this region, and satellites have been used for monitoring SO2 and NO2 emissions and trends in this region (McLinden et al., 2012, 2014, 2016, 2020). The oil sands operation activities north and south of the Oski-Otin site at Fort McKay make the pollution conditions highly dependent on wind direction at certain altitudes.
To better establish the link between column and surface concentration observations, we examined 7 years of ground-based remote sensing column observations along with surface concentration measurements, vertical wind profile and BLH observations, and reanalysis model data at the Oski-Otin site. In this work, vertical columns of SO2 and NO2 are provided by the Pandora spectrometer (Fioletov et al., 2016; Herman et al., 2009); aerosol optical depths (AODs) are provided by a CIMEL sunphotometer (Holben et al., 2001; Sioris et al., 2017); and SO2, NO2, and PM2.5 surface concentration values are from a Thermo 43i, Thermo 42i, and Teledyne API T640, respectively. Collocated wind profiler and lidar instrumentation (Strawbridge et al., 2018) allows for examining the VCD dependence on the wind speed and direction at different altitudes and linking the VCDs to surface concentration ratios with observed BLH. Besides trace-gas pollutants, we also compared and studied the differences between surface PM2.5 observations with remote sensing AOD data. PM2.5 concentration is also one of the three indicators in the Canadian Air Quality Health Index (Stieb et al., 2008). Remote sensing observations of aerosols face more challenges than ozone and NO2 (e.g., Herman et al., 2009; Jeong et al., 2020).
In short, this study is focused on the difference between total column (measured using ground-based remote sensing technique) and surface/ground-level concentrations (by in situ observations) of air pollutants. Measurements of wind profiles and BLH were used to examine their impact on that difference. The possibility of using modern reanalysis-modelled data instead of direct measurements of wind profiles and BLH was also explored.
This paper is organized as follows: Sect. 2 describes the ground-based remote sensing observations and in situ measurements. In Sect. 3, the differences induced by the observation conditions (mainly weather) are evaluated. In Sect. 4, the vertical sampling differences between remote sensing and in situ measurements are evaluated by integrating the data with wind profiles. Section 5 shows the potential of using reanalysis meteorological data to help interpret the ground-based remote sensing observations. Conclusions are given in Sect. 6.
The Oski-Otin site at Fort McKay (57.184° N, 111.64° W) is equipped with various instruments for air quality measurements (e.g., Strawbridge, 2013; Fioletov et al., 2016; McLinden et al., 2020). Fort McKay is a small town (population of 600) surrounded by seven oil sand surface facilities and two in situ mining facilities to the north and south. Satellite maps for the observation site and surrounding oil sands areas are shown in Fig. 1. There are two major SO2 and NO2 sources located south of Fort McKay: the Syncrude Mildred Lake plant is located 16 km to the south of Fort McKay and the Suncor Millennium Plant is 23 km south-south-east. According to the National Pollutant Release Inventory (NPRI, https://www.canada.ca/en/services/environment/pollution-waste-management/national-pollutant-release-inventory.html, last access: 10 September 2023), the 2013–2019 annual mean emissions were about 26 kt (14 kt) and 17 kt (5.8 kt) SO2 (NO2) yr−1 from the Syncrude and Suncor facilities, respectively. McLinden et al. (2020) reported discrepancies in NPRI and the satellite-derived SO2 emissions in this region, peaking at 50 kt yr−1 around 2016 (i.e., NPRI underestimated the emissions; Pandora measurements showed agreement with satellite observations). There is also the Horizon Oil Sands processing plant and mine 18 km to the north, but the emissions from that source are smaller (4 kt SO2 yr−1 and 1.4 kt NO2 yr−1). For NO2, there are however many other small local sources. In addition, there are major NO2 emissions from local sources as well as from the mining areas caused by the off-road heavy vehicle fleet that excavates and transports bitumen from the mines to the on-site separation facilities. There are hundreds of kilometres of pristine boreal forests to the west and east of the Oski-Otin site with no SO2 and NO2 sources. Thus, the pollution level at the site is largely dependent on the wind direction. Therefore, the planning of communities close to industrial activities should consider regional climatology factors, such as prevailing wind directions.
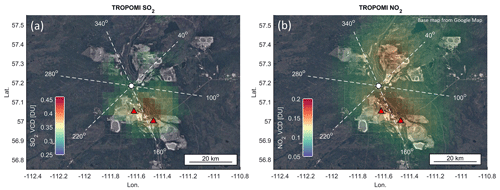
Figure 1Satellite maps (© Google Maps) of the Athabasca oil sands region masked with satellite observations. The Pandora spectrometer, sunphotometer, WindRASS, lidar, and in situ instrument were located at the observation site represented by a white circle. The two largest upgraders in the mining areas are shown by red triangles. The dashed white lines show the centre of the wind sectors. Maps are masked with pixel averaging of total column SO2 and tropospheric column NO2 (2018–2021) from the TROPOMI satellite instrument (McLinden et al., 2020).
2.1 Pandora
The Pandora spectrometer is a ground-based remote sensing instrument that measures solar and sky spectral radiation in the UV and visible part of the spectrum (Herman et al., 2009; Szykman et al., 2019). Direct-sun (DS) measurements are the main type of observations, although the instrument is also capable of operating in the zenith sky (ZS) and multi-axis differential optical absorption spectroscopy (MAX-DOAS) modes (e.g., Zhao et al., 2019; Kreher et al., 2020). In this work, vertical column densities of trace gases are derived from the DS-measured spectra. It has been demonstrated that Pandora can successfully observe total column ozone, NO2 (Herman et al., 2009, 2015; Tzortziou et al., 2012, 2015; Zhao et al., 2016, 2020), and SO2 (Fioletov et al., 2016). The integrated vertical column values of trace gases are reported in Dobson units (DU; 1 DU = 2.69×10¹⁶ molec. cm−2).
A detailed description of the Pandora spectrometer and its total column NO2 retrieval algorithm is given by Herman et al. (2009). To isolate tropospheric NO2 VCD from the total column VCD measured by Pandora, stratospheric NO2 partial columns were subtracted from Pandora measurements (following the method described in Zhao et al., 2019). For the observation period in the oil sands region, typically, stratospheric NO2 accounts for about 46 % of the total column (median value), with a standard deviation of 35 %. For convenience, we refer to this tropospheric NO2 VCD as simply “NO2 VCD”. Information about the instrument setup at the Oski-Otin site and the SO2 data and algorithms are available from Fioletov et al. (2016). For SO2 data, as the only sources are near the surface (as no comparable SO2 quantities were in the stratosphere during the analyzed period, i.e., no SO2 injection from volcanic eruptions), the retrieved total column SO2 (SO2 VCD from Pandora observations) was directly used in this study.
Pandora instrument no. 104 was deployed at the Oski-Otin site from 15 August 2013 to 14 November 2013. It was then redeployed on 21 August 2014 and was operational until late 2015 (Zhao et al., 2016). From September 2017 to 2020, Pandora no. 122 was deployed at the site. Pandora no. 122 was operated with multi-axis observations (in addition to DS and ZS) from 2018 onwards, but no SO2 or NO2 profile has been retrieved from these observations yet. The operation of Pandora at the site stopped in summer 2020.
2.2 CIMEL sunphotometer
CIMEL sunphotometers for measuring aerosol properties have been deployed at the Oski-Otin site since 2013 as a part of the AEROCAN network (Sioris et al., 2017). AEROCAN is the sub-network that consists of 26 sites across Canada within the Aerosol Robotic Network (AERONET, https://aeronet.gsfc.nasa.gov/, last access: 10 September 2023) that was established in the early 1990s (Holben et al., 2001). The sunphotometer measures AOD in direct-sun mode at eight wavelengths, typically 340, 380, 440, 500, 675, 870, 940, and 1020 nm. AOD is a unitless quantity representing the vertically integrated extinction of radiation due to scattering and absorption of particles. To better quantify fine- and coarse-mode components of the measured AOD, spectral deconvolution algorithm (SDA) products were developed by O'Neill et al. (2003) based on the AOD spectral dependence and higher-order spectral derivatives. Fine and coarse modes are essentially comprised of sub-micron and super-micron particle radii, respectively (O'Neill et al., 2001). At the Oski-Otin site, Sioris et al. (2017) reported that coarse-mode aerosol and PM2.5 only had low temporal correlation (as −0.02), while fine-mode aerosol and PM2.5 had much higher correlation (as 0.53). In this work, the fine-mode aerosol (SDA Level 2 version 4.1; quality assured) outputs are used, which are processed from an operational product of AERONET.
2.3 WindRASS
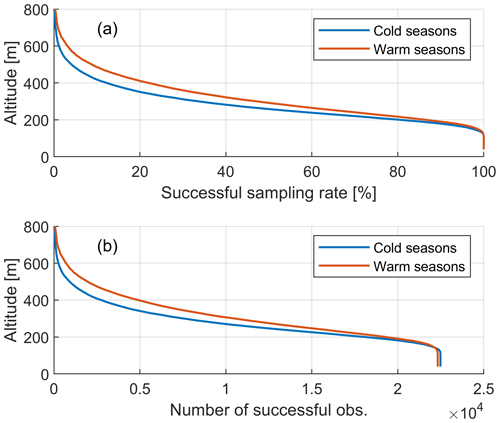
The radio acoustic sounding system (RASS) wind profiler (WindRASS; model MFAS, Scintec, Rottenburg, Germany) was another instrument installed at the Oski-Otin site (Gordon et al., 2018; Strawbridge et al., 2018). It reports wind speed and direction, as well as other meteorological parameters like 15 min averages, at 77 levels from 40 to up to 800 m above ground level (a.g.l.; 10 m vertical resolution). It is a monostatic 64-transducer sodar that emits sound pulses near 2000 Hz vertically and in the four cardinal directions (tilted at 22 and 29° from zenith). The radio antennas then emit electromagnetic waves (915 MHz) that are partially reflected by the sound waves as they propagate away into the atmosphere. Doppler analysis of the returning signal is used to reconstruct the temperature profile (based on the fact that the speed of sound is a function of the square root of the virtual temperature) as well as the 3-D wind vector. Note that the number of successful WindRASS observations depends on the altitude and that the vertical range varies from measurement to measurement as discussed in Appendix A.
2.4 Lidar
An autonomous lidar system that can be monitored remotely and operated continuously (except during precipitation events) has also been installed at the Oski-Otin site since 2013 (Strawbridge, 2013). The lidar simultaneously emits two wavelengths of laser light (1064 and 532 nm, Q-switch neodymium-doped yttrium aluminum garnet; see references in Strawbridge, 2013) at energies of approximately 150 mJ per pulse per wavelength and detects the backscatter signal at 1064 and 532 nm (and polarizations at 532 nm). In 2016, the lidar system was upgraded by adding an ozone differential absorption lidar to simultaneously measure the vertical profile of tropospheric ozone, aerosol (at 355, 532, and 1064 nm), and water vapour (through the addition of the 355 nm output channel to the aerosol lidar) from near the ground to 10 to 15 km (Strawbridge et al., 2018). The BLH was derived via the 532 nm aerosol lidar profile. Details on the BLH processing algorithm can be found in Strawbridge and Snyder (2004).
2.5 In situ measurements
In this study, we used the in situ measurements of SO2, NO2, PM2.5, NOx, and O3 as well as the wind speed and direction data provided by the Wood Buffalo Environmental Association (https://wbea.org/, last access: 10 September 2023). The list of analytical equipment that has been used can be found at https://wbea.org/wp-content/uploads/2021/03/Bertha-Ganter-Fort-McKay-Site-Documentation_2021.pdf (last access: 10 September 2023). Surface SO2 and NO2 were measured by Thermo Scientific 43i and 42i instruments with a precision of 1 and 0.4 ppbv (parts per billion by volume), respectively. PM2.5 were measured by a Teledyne API T640 instrument with a precision of 0.5 µg m−3. The SDA Level 2 data (hourly) that have undergone validation review are used in this work. Pandora spectrometer, CIMEL sunphotometer, and WindRASS data were averaged into hourly resolution to match with sampling rate of in situ SDA Level 2 data. The statistics of measured pollutants are summarized in Table 1.
2.6 ERA5 meteorological data
In this work, ECMWF Reanalysis v5 (ERA5) wind data (hourly, using model levels as the vertical co-ordinate) are utilized in addition to WindRASS observations. Several studies have verified that ERA5 wind data can facilitate remote-sensing-based emission estimations (e.g., Fioletov et al., 2015; McLinden et al., 2020), regional air quality monitoring (e.g., Liu et al., 2021; Tzortziou et al., 2022; Zhao et al., 2022), and wind-based satellite validation (Park et al., 2022; Zhao et al., 2020). To assess whether ERA5 wind can be a good replacement for near-surface to free-tropospheric vertical wind measurements, the ERA5 model-level data (Hersbach et al., 2020) were used (instead of its pressure-level data, which are more commonly used). It is worth noting that for ERA5 pressure-level wind data, there are only five wind layers from 900 to 1000 hPa (900, 925, 950, 975, and 1000 hPa). While using ERA5 model-level data, there are about 11 to 18 modelled wind layers from 900 to 1000 hPa for the Oski-Otin site. Thus, ERA5 model-level data can provide a much more detailed vertical wind field than pressure-level data. In addition to wind data, the boundary layer height from ERA5 has also been used to examine the correlation between column and surface observations.
Figure 2 shows the time series of observed column and surface concentrations of SO2, NO2, and aerosol at the Oski-Otin site. Compared to surface concentration observations that practically have no gaps, column data records have gaps due to instrumental issues and other operational changes as well as due to the clouds. Thus, only coincident (overlapped) observations from both the surface and column data were included in the analysis.
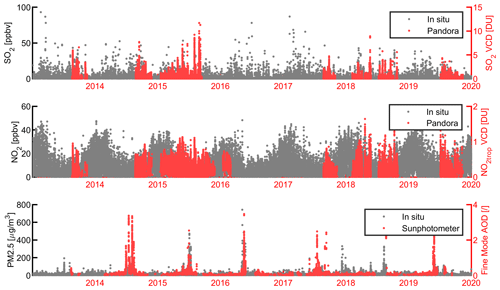
Figure 2Time series of remote sensing and in situ observations of SO2, NO2, and aerosol data at the Oski-Otin site.
In contrast to in situ instruments that can obtain 24 h of continuous observations, passive remote sensing instruments (i.e., using the sun as a light source) deliver data when direct solar light can reach the instruments. Figure 3 shows the coincident observations that have been averaged by the hour (local standard time – LST). Both SO2 and NO2 data show good agreement in variation patterns except in early morning. The prominent discrepancy in the morning could be related to larger changes in the mixing layer height and related vertical mixing conditions. For example, in cold seasons, with increased mixing layer height and vertical dynamics from the morning to noon, in situ SO2 shows a strong increase from 0.40 ppbv at 06:00 to 1.18 ppbv at 10:00 LST (see Fig. 3). In contrast, the Pandora observations show an opposite decreasing trend; the VCD of SO2 decreased from 0.32 DU at 06:00 to 0.01 DU at 10:00 LST. As discussed before, Pandora can sample the entire vertical column of SO2 molecules; thus the increase in surface SO2 concentration (from less than 0.5 ppbv at 06:00 to almost 1.5 ppbv at 10:00 LST) in the morning (see Fig. 3b, in the warm seasons) is not due to increased emission (SO2 VCD values are stable from 06:00 to 10:00 LST) but due to vertical mixing. Better vertical mixing conditions in the late morning to noon help the elevated SO2 plume to reach the surface level. With a well-mixed boundary layer after 10:00 LST, the variation pattern of surface and column values of SO2 shared a similar pattern.
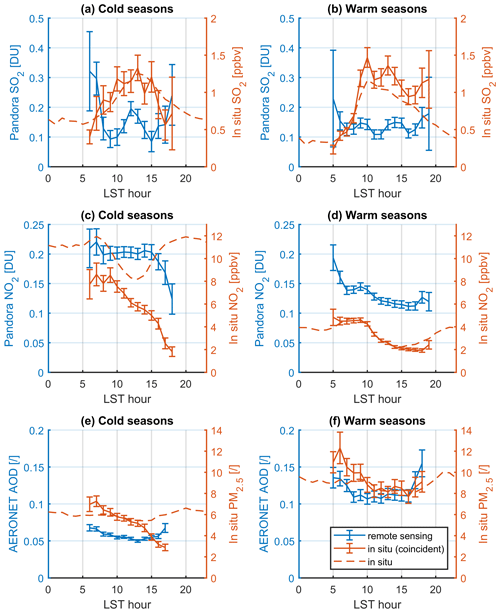
Figure 3Remote sensing and in situ observed SO2, NO2, and aerosol data (AOD and PM2.5) averaged by the hour of local standard time (LST). Remote sensing observation results are shown using the left axis (blue); in situ observation results are shown using the right axis (red). Solid red lines show in situ measurements that are coincident with remote sensing observations; dashed red lines show all in situ measurements. Results from warm seasons are shown in panels (a), (c), and (e); results from cold seasons are shown in panels (b), (d), and (f).
The conditions for NO2 are similar to those for SO2 but show stronger indications from photochemistry, i.e., generally decreased values of NO2 from morning to evening. Moreover, as there are strong NO2 sources near ground level, even the VCDs are stable from 08:00 to 15:00 LST (e.g., see Fig. 3b), while the surface value is decreasing. For aerosol comparison, both AOD and PM2.5 show clear U-shape changes over the day in warm seasons (see Fig. 3f). However, in the afternoons of cold seasons, PM2.5 shows a decreasing trend, while AOD has an increasing trend (see Fig. 3e). Thus, without detailed meteorological information (e.g., BLH and vertically resolved wind information), it is of no surprise that we could not find an easy and clear correlation between remote sensing and in situ diurnal variations.
In addition to data sampled at the time of measurements by remote sensing instruments, results based on all in situ measurements are plotted in Fig. 3 as dashed red lines. When comparing dashed red lines with solid red lines, the results from Fig. 3 show interesting and prominent features; i.e., when pairing in situ data with remote sensing data, sometimes, the diurnal patterns of in situ measurements are changed (e.g., see Fig. 3c, the different variations in the solid red and dashed red lines). The cause of such changes is due to the “sampling bias” from remote sensing measurements that are available under unobscured sun conditions only; in situ data have no major gaps. Although the local emissions conditions might not be different on sunny or rainy days, the difference in meteorological conditions can affect the pollutant monitoring results. For example, Fig. 4 shows the ERA5 boundary layer height data binned by hours of local standard time. The BLH data that are coincident with in situ SO2 measurements show clear seasonal difference (see blue lines in Fig. 4a and b); in cold seasons, the highest BLH data only reach 750 m, while in warm seasons they can reach 1500 m. The diurnal variations in BLH data show bell curves as in situ instruments perform sampling 24 h d−1 in all weather conditions. However, the BLH data that are coincident with remote sensing SO2 measurements (see red lines in Fig. 4a and b) show more skewed shapes, i.e., higher BLH values in afternoons. Especially, in the wintertime (Fig. 4a), BLH data that are coincident with remote sensing observations show a much stronger increase from 10:00 to 16:00 LST than their counterpart that is coincident with in situ measurements. Similar features can be seen for NO2 and aerosol data. Thus, remote sensing observations are biased to high BLH conditions, especially in afternoons. These results also explain why, when coincident with remote sensing observations, in situ diurnal patterns changed (see Fig. 3). For example, in cold seasons at 17:00 LST, by pairing PM2.5 data with AOD data, the corresponding BLH value increased from 500 to 1500 m (see Fig. 4e) and thus the PM2.5 values changed from 6.0 to 2.9 µg m−3 (see Fig. 3e). Such variation in diurnal patterns is not as obvious in warm seasons due to fewer BLH changes (due to coincident selection with remote sensing instrument) as in cold seasons. For instance, by selecting coincident measurements, measured NO2 surface values dropped from 11.3 to 2.5 ppbv in cold seasons at 17:00 LST (Fig. 3c), while the corresponding values only dropped from 2.5 to 2.0 ppbv in warm seasons (Fig. 3d). In other words, the sampling biases between remote sensing and in situ data are worse in cold seasons than warm seasons. When directly comparing coincident remote sensing and in situ observations, such weather-condition-biased sampling would not have been easily revealed. However, this clear-sky bias could lead to significant differences in long-term trend analysis.
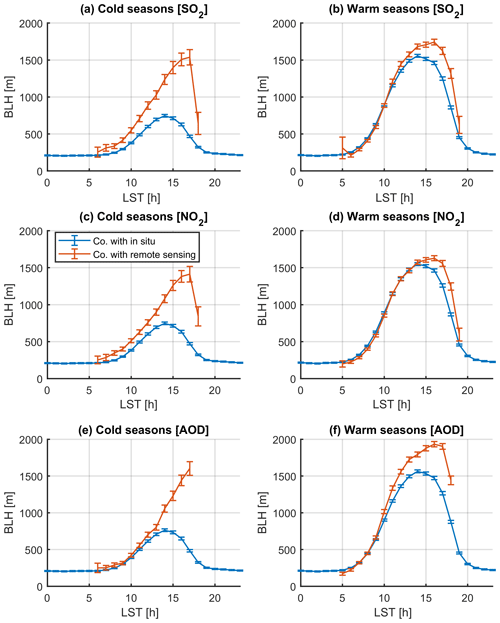
Figure 4Boundary layer height (BLH) data averaged by the hour of local standard time (LST). Blue lines show BLH mean values that are based on all data; red lines show BLH data that are coincident with remote sensing observations, i.e., when the Sun was not obscured. Results from cold seasons are shown in panels (a), (c), and (e); results from warm seasons are shown in panels (b), (d), and (f).
In short, Figs. 3 and 4 show that depending on the height of the emission sources, boundary layer dynamics can play important roles in the sampling differences between remote sensing and in situ instruments. The modelling of boundary layer conditions is also known to be a major difficulty for air quality modelling work (e.g., Zhao et al., 2019). This indicates a great need for improved boundary layer height observations from other remote sensing instruments (Szykman et al., 2019). This issue could be more prominent if the remote sensing air quality measurements are performed in the urban area, where rush hour air pollutants are often more serious on cold winter days. All these bring great challenges to utilizing remote sensing air quality observations for application to “noise-height” air quality monitoring, and more efforts are needed.
4.1 Sensitivity of SO2 observations to winds at different levels
For the Pandora instrument located at the Oski-Otin site, higher SO2 VCDs for southern wind directions were previously reported based on the surface winds (Fioletov et al., 2016). Utilizing SO2 VCD observations, various satellite-measured SO2 plume reconstructions work (e.g., McLinden et al., 2020) has been done to estimate the emissions (e.g., Fioletov et al., 2015, 2020). Typically, in those plume models, the vertical structure of the SO2 plume is not considered, as satellites measure the integrated column of the SO2. However, to link the surface and satellite observations, information of the vertical structure of the SO2 plume or other pollutants is critical. If the plume is elevated, it is not necessarily true that the direction of surface winds would be correlated with the VCDs; the wind direction at the plume height would be a more important factor. For the surface in situ instruments, this effect would not be prominent (i.e., in situ instruments are expected to be the most sensitive to near-surface wind). To test that, we calculated mean VCDs for data binned by the wind altitude and direction using the wind profiler data. If the mean SO2 VCD values are the same for all wind directions, then winds at that height do not affect SO2 transport. The larger the spread of the mean SO2 VCD values for different directions, the greater the impact from winds at that height is for SO2 transport. This information can be used to determine what wind directions and what altitudes have the largest impact on VCDs and thus pollutant transport.
The wind direction bins were selected to have one bin centred at 160° where the SO2 signals have a maximum from the two major upgraders (Fig. 1, see red triangles on the map). Elevated SO2 plumes from these upgrader stacks have also been observed and reported by a MAX-DOAS instrument in previous studies (e.g., Davis et al., 2020). The heights of these stacks are in the range of 76–183 m (Gordon et al., 2018). Davis et al. (2020) reported the retrieved SO2 plume can reach 30 ppbv concentration at 395 m height.
Figure 5a shows the mean SO2 VCD for data binned into 60° wide wind direction bins based on WindRASS wind data from each 10 m altitude level. In other words, Fig. 5a shows the results of binning measured SO2 VCDs with wind information from different vertical wind layers; Fig. 5a is not depicting actual vertical profiles of SO2 but an illustration of which layer of the measured wind profile has the highest impact on SO2 column and surface observations. The values are the highest for winds out of the south-south-east (SSE; 160°) at all altitudes. The mean values are close to zero for the 40, 280, and 340° sectors. This dependence of VCDs on the direction is very similar to that of surface winds (Fioletov et al., 2016). The magnitude of the mean SO2 VCD in both cold (November to April) and warm (May to October) seasons reaches its maximum of 0.39 DU at 200–300 m – about 38 % higher than the mean value for the same direction of surface or 40 m winds (0.25 DU). Thus, in the analyzed altitude range, the wind direction at 200–300 m has the largest impact on Pandora-measured SO2 VCD. In contrast, for the clean-air directions (280°) SO2 VCDs are the lowest regardless of the wind altitude. Also, wind data above 300 m (250 m for the cold season) were too intermittent to separate SO2 VCD signals, which indicates that the SO2 plumes were within this height (WindRASS vertical data recovery rate is shown in Fig. A1).
Compared to Pandora-measured SO2 VCDs, in situ SO2 surface concentrations show a similar but not identical picture (see Fig. 5b). The in situ SO2 observations show a similar increased sensitivity to winds at levels of 200–300 m with the same polluted and clean-air directions as 160 and 280°, respectively. However, the magnitude of the binned mean in situ SO2 reaches its maximum of 3.16 ppbv for wind levels at 200–300 m, which is only about 27 % higher than the mean value for the same direction at the surface-layer winds (2.32 ppbv). The results indicate the different characteristics between the two measurement techniques of SO2; i.e., VCD values are more sensitive to elevated plumes than surface values (i.e., the SO2 emitted from high stacks of refineries in this case; 38 % increased VCDs, while only 27 % increased surface concentrations when using 200–300 m wind). In other words, under conditions that winds at 200–300 m are from 160 °, on average, the observation yields the highest SO2 VCDs even if the plume is not fully vertically mixed to reach the ground level (see more discussion in Sect. 5.2).
As mentioned, the WindRASS wind profiler data have a different number of successful observations at different heights. The number of available successful measurements as a function of altitude declines almost linearly. Only about 75 % of all wind profiles reach 200 m and only 12 % reach 400 m (see Fig. A1). Thus, the vertical structure revealed in Fig. 5 shows increased uncertainties for high altitudes (e.g., see increased width of the 1σ envelopes for profiles). This leads to a bias of wind profile observations that reach 500 m of altitude towards low-wind-speed conditions. The wind profile data from WindRASS are used only if they have full coverage within 0–300 m for both the warm and cold seasons, thus minimizing the wind speed bias while retaining the most sensitivity to resolve air pollutant transport patterns in this region.
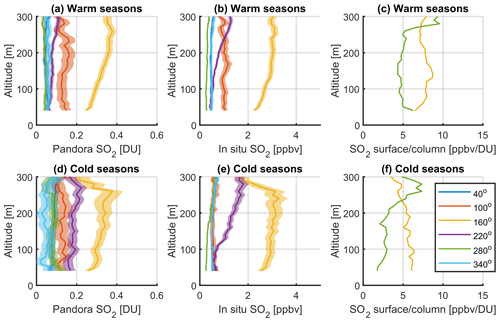
Figure 5The mean SO2 column (a, d) and surface (b, e) observations and their median ratios (c, f) binned by wind directions at different altitudes at Oski-Otin. Wind layer information (altitude and direction) was measured by WindRASS, SO2 column observations were from Pandora, and surface measurements were from the in situ instrument. Colour lines show the mean values of SO2 with 1σ envelopes. A sharp maximum can be found when the wind is from 160°, the direction to the upgraders. The wind direction bins were selected to have one bin centred at 160° where the SO2 signals have a maximum. Data were categorized by warm (May to October; a–c) and cold (November to April; d–f) seasons.
It is expected that the SO2 plume height will be affected by boundary layer dynamics that are reflected by temperature and other seasonal meteorological aspects. Thus, the sensitivity of SO2 VCD to the wind direction was categorized into warm (Fig. 5a and b) and cold seasons (Fig. 5d and e). Compared to the gradually decreasing sensitivity above “plume height” in warm seasons (i.e., 200–300 m), both remote sensing and in situ observations show their sensitivity to SO2 emissions decreased sharply after passing the plume height in cold seasons (Fig. 5d and e). The results may indicate that the vertical transport of SO2 is more refined within the boundary layer due to a lack of vertical mixing in cold temperatures. Note that, for warm and cold seasons, the median values of BLH from ERA5 are 390 and 208 m, respectively. Another interesting factor is the SO2 plume from 220° is more prominent for in situ data (see the purple line in Fig. 5e). However, there are no known strong SO2 emission sources from this direction, and this feature is not captured by Pandora.
Figure 5c and f show the ratio of observed surface concentration to column values (from 160 and 280°) grouped by the wind direction at different altitudes. For SO2, this surface-to-column ratio preserved the pattern discussed above. Compared to the clean-air directions (280°), such ratio values of the directions of the upgraders (160°) are much higher, indicating the SO2 pollutants from the upgraders are less vertically mixed than the background conditions. However, more detailed features can be revealed if the data are further analyzed with BLH information (more details will be discussed in Sect. 5.2).
4.2 Sensitivity of NO2 observations to winds at different levels
The analysis of NO2 data is shown in Fig. 6. Similar to SO2 VCD, the mean NO2 VCD (tropospheric column; see description in Sect. 2.1) values are also the lowest for the westerly winds (280°) and the highest for the south-south-easterly winds (160°). The absolute maximum in the mean NO2 VCD values is also observed for the 160° wind direction at 200–300 m, although this maximum is not as well-pronounced as in the case of SO2. This may suggest that the NO2 and SO2 are coming from the same source, although there are other NO2 sources in the area. Also, unlike SO2, NO2 VCD is also high from the 40° wind direction, i.e., from the north-eastern mining area (see Fig. 5b). Compared to the Pandora NO2 observations, the in situ NO2 data show more different results for its vertical sensitivity. Although the maximum NO2 amount is still from 160°, in situ data are more sensitive to the wind layer heights at 50–100 m (Fig. 6b, 160° result). A clear decreased sensitivity can be seen above 100 m with minimum values around 200–300 m. The results indicate Pandora is more sensitive to transported NO2 than in situ instruments, while the in situ instrument is more directly linked to preferred wind conditions (i.e., the near-surface wind must be from 160°). For the nearby source, i.e., 40°, both Pandora and in situ observations show similar straight vertical structures (see blue lines in Fig. 6). For the background observations (i.e., 280 and 340°, low-NO2 conditions), both Pandora and in situ observations show similar sensitivity to surface-layer winds.
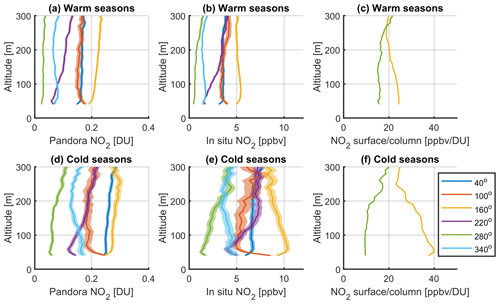
Figure 6The mean NO2 column (a, d) and surface (b, e) observations and their median ratios (c, f) binned by wind directions at different altitudes at Oski-Otin. Wind layer information (altitude and direction) was measured by WindRASS, NO2 column observations were from Pandora, and surface measurements were from the in situ instrument. Colour lines show the mean values of NO2 with 1σ envelopes. Data were categorized by warm (May to October; a–c) and cold (November to April; d–f) seasons.
An interesting feature that both in situ SO2 and NO2 analyses demonstrated is an enhanced sensitivity above 150 m in the 220° wind direction (Figs. 5b and 6b, purple lines). As the 220° wind bin covers the tailing-pond area and a large portion of the mining area (observations within 190–250° wind directions), it is likely the observed transported emissions were from these areas. Thus, such 60° wind bins might be too coarse to separate some sources (fine bins were used to reveal horizontal transport in Appendix B, and no prominent emission sources were identified in the 220° wind direction).
In general, by utilizing various ground-based remote sensing and in situ observations, such a vertical sensitivity analysis can reveal the characteristics of air pollutant sources more efficiently than using the in situ instrument only. When comparing the analysis results categorized by warm and cold seasons, the structures of vertical sensitivities show the changes due to different vertical dynamics. For example, in situ surface concentration data show more enhanced sensitivity to near-surface wind in cold seasons than in warm seasons (Fig. 6b and e). However, even in cold seasons, Pandora still preserved its sensitivity to transported emissions (200–300 m winds; compare yellow lines in Fig. 6d and e), as it measures the integrated vertical columns. When comparing Fig. 6c and f, the surface-to-column ratio at 70 m changes from 39 ppbv DU−1 in cold seasons to 24 ppbv DU−1 in warm seasons. The difference between polluted and clean air is also much larger in cold seasons, indicating a stronger inhomogeneity of tropospheric NO2.
4.3 Sensitivity of aerosol observations to winds at different levels
The sensitivity analysis of aerosol data to the wind profiles is shown in Fig. 7. In contrast to SO2 and NO2 data, observations of aerosol data show greater differences between AOD and in situ PM2.5 measurements when they are binned by the wind direction. Similar to the Pandora instruments, the sunphotometer samples the aerosol through a slant light path (i.e., direct-sun viewing geometry, sample the atmosphere constituents between the instrument and the sun) and reports the vertically integrated column property. However, establishing the link between the AOD and PM2.5 is more difficult (Sioris et al., 2017) compared to the work for trace-gas observations since the AOD additionally depends on aerosol composition, details of the size distribution, and even aerosol shape.
Similar to the SO2 and NO2 data analysis, the in situ PM2.5 data show maximum sensitivity to the winds from 160°, indicating that most fine particles were from the direction of upgraders. However, the spread between the aerosol values from different directions is noticeably less than that for SO2 and NO2. But the vertical structure of PM2.5 dependence on the 160° winds as a function of the wind height (Fig. 7b, orange line) is nearly the same from the surface to the 300 m layer. Thus, the PM2.5 concentration for the 160° wind direction was not sensitive to a particular layer of the wind. Comparing this to the profiles of in situ SO2 (elevated at 200–300 m; emissions from high stacks) and in situ NO2 (two peaks, one near the surface and one elevated at 200–300 m; emissions from both the near-surface mining fleet and high stacks) (see Figs. 5 and 6), the sources of PM2.5 from this direction could not easily be distinguished. Comparing Fig. 7a and b, AOD data show higher sensitivity to winds from 100°, while PM2.5 data show higher sensitivity to winds from 160°. These inconsistent results might be because the wind bins were selected based on our knowledge of SO2 and NO2 sources; i.e., 100° and/or 160° wind bins might be mixed with several different sources of aerosols in this region. The AOD and in situ observations are in better agreement for other wind directions; i.e., they both show clean air (low aerosol) was from 280°.
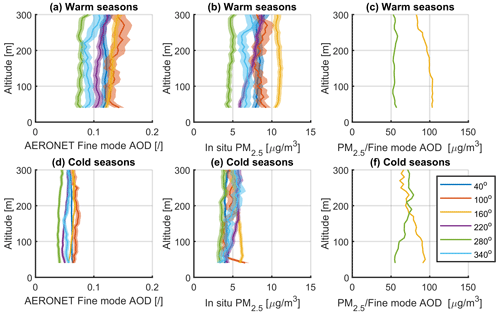
Figure 7The mean aerosol column (a, d) and surface (b, e) observations and their median ratios (c, f) binned by wind directions at different altitudes at Oski-Otin. Wind layer information (altitude and direction) was measured by WindRASS, aerosol column observations (AOD) were from sunphotometers, and surface measurements (PM2.5) were from the in situ instrument. Colour lines show the mean values of aerosol with 1σ envelopes. Data were categorized by warm (May to October; a–c) and cold (November to April; d–f) seasons.
In contrast to NO2 results, which have increased surface concentration values in cold seasons, aerosol results reflect opposite patterns. AODs are smaller in cold seasons from all wind directions compared to warm seasons (see Figs. 7a and d). In situ PM2.5 values also show a similar decrease from warm to cold seasons, especially from the pollution transport direction (i.e., 160°; see Fig. 7b and e). More importantly, no clear vertical structure changes were found for aerosol observations in different seasons. One reason could be that the vertical structure of aerosols does not change for different seasons in this area or that the instruments are not sensitive enough to reveal such changes (i.e., the precision of aerosol measurements and wind data). Another reason is that there are some high background aerosols that do not depend on the wind direction. In short, Fig. 7 reveals that the biases between AOD and PM2.5 data are different in different seasons. The surface-to-column ratio of aerosol data (see Fig. 7c and f) shows values higher than the background from the 160° direction for both cold and warm seasons. Such a ratio is lower in cold seasons (91 µg m−3 vs. 103 µg m−3 at 70 m in cold and warm seasons, respectively) and intersects with background conditions (green line) at 180 m (Fig. 7f), indicating the aerosol layers are less sensitive to winds above this height in cold seasons. More discussion and interpretation of such ratio values are provided in Sect. 5.2.
Section 4 demonstrated that vertical wind profiling information could play important roles in air quality monitoring and pollution transportation studies. However, such instruments (e.g., WindRASS) only provide limited coverage spatially (not many Pandora or other air quality monitoring instruments are co-located with wind profiling instruments) and vertically (as discussed in Appendix A, this WindRASS instrument only had good vertical coverage from 40 m to about 300 m a.g.l.). On the other hand, reanalysis meteorological data (e.g., ERA5) have been used extensively in many research applications (e.g., Hersbach et al., 2020); reanalysis wind data have quality acceptable for many applications and the advantage of good temporal coverage and global spatial coverage. For example, in our previous work, ERA5 winds from 1000 to 900 hPa were averaged to provide wind direction and speed information to facilitate satellite validation and regional air quality monitoring (Zhao et al., 2020, 2022). However, these wind layers may not always be optimal for different conditions (i.e., different species and/or emission source heights as illustrated in previous sections).
In this part, we present a similar analysis to that in Sect. 4, but instead of WindRASS observations, ERA5 model-level wind data are utilized (from ERA5 model levels 100 to 137; note level 137 is the bottom/ground level). This part of the study is to (1) verify if ERA5 winds can distinguish the pollution vertical and horizontal transport patterns as well as WindRASS and (2) provide knowledge on the optimal ERA5 wind layers that can be used for satellite-based pollutant emission estimations.
5.1 Wind analysis with ERA5 data
Figure 8 shows the vertically resolved sensitivity analysis for SO2 (first row), NO2 (second row), and aerosol (third row) observations (similar to the results in Sect. 4, but utilizing ERA5 wind data). To make the analysis comparable to the WindRASS data, the hourly ERA5 model-level wind data were interpolated to 100 m vertical resolution. The first two columns of Fig. 8 show the ERA5 model results that represent the 0 to 2000 m range (a.g.l) with only wind directions of 160 and 280°.
Figure 8a and b show that the SO2 VCD and surface concentration observations show similar sensitivity to certain wind layers when ERA5 winds are used instead of WindRASS data. For example, in warm seasons (see solid lines), both VCD and the surface concentration of SO2 show higher sensitivity to winds below 2 km, while in cold seasons, these observations of SO2 show higher sensitivity to winds only below 0.5 km (see dashed lines). This seasonal difference was also found when using WindRASS data (see Sect. 4.1). Note that a direct comparison between ERA5 winds and WindRASS observation results is challenging due to the limited spatial (0.25° × 0.25°, approximately 30 km × 15 km at Fort McKay) and vertical resolutions of ERA5 data (60–90 m below 500 m compared to 10 m for WindRASS).
In Fig. 8a and b, one major difference between ERA5 and WindRASS results is the maximum sensitivity height. For SO2 VCD observations, when using WindRASS, it has maximum sensitivity to winds from 250–300 m altitude (a.g.l; see Sect. 4.1). This could be due to the fact the WindRASS could not provide good sampling above this layer. When using ERA5, SO2 observations show a clear change in their maximum sensitivities to wind layers from 0–1400 m in warm seasons and down to 0–500 m in cold seasons. Gordon et al. (2018) and Davis et al. (2020) show the retrieved SO2 vertical profiles from MAX-DOAS and aircraft measurements, with plume heights potentially reaching 600 to 1000 m altitude. Note that WindRASS only provides good samplings for wind layers at altitudes below 400–500 m.
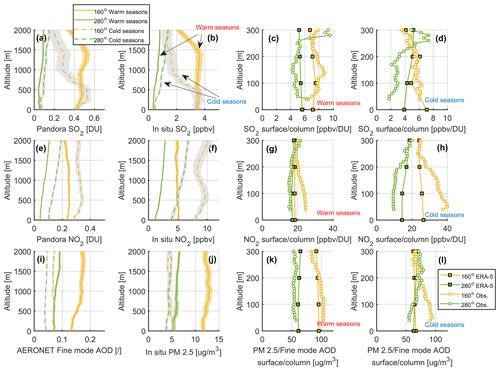
Figure 8The mean SO2, NO2, and aerosol as a function of the direction of winds (only 160 and 280°) at different altitudes from Pandora and in situ instruments at Oski-Otin. Other details of this figure are the same as Fig. 5, but the wind data are from ERA5 reanalysis data (first two columns) and not the WindRASS observations. The last two columns show the surface-to-column ratio for selected wind directions; solid lines with square symbols use wind data from ERA5 reanalysis, and lines with circle symbols use wind data from the WindRASS observations.
For NO2, Fig. 8e and f show that the largest NO2 source is from 160°, while the clean air is from the 280° wind direction, consistent with findings in Sect. 4.2. For cold seasons, the NO2 sensitivity height from the 160° direction is consistent with the SO2 results, indicating they were both emitted from similar high stacks from these directions.
When using ERA5 winds, the results for aerosol are also generally consistent with previous findings in Sect. 4.3. Figure 8i and j both confirm that there is a PM2.5 source from the 160° direction. Figure 8i and j show that this aerosol source can be better identified if using winds from the 500–1500 m layers. This feature is also partially reflected in Fig. 7a but is not as clear as Fig. 8i due to the low data availability of WindRASS for higher altitudes. In general, Fig. 8i and j show that both AOD and PM2.5 data do not have strong changes in their vertical sensitivity to different layers of winds; i.e., we find no clear “plume” height changes for aerosol, in contrast to what we saw for SO2 and NO2 results. This result indicates that the aerosol is better vertically mixed than SO2 and NO2 emissions from high stacks. More details of horizontal transport differences when using ERA5 winds are shown in Appendix C.
Regarding the surface-to-column ratios (0–300 m), the last two columns of Fig. 8 show a general agreement between the results based on WindRASS (see circle symbols) and reanalysis (see square symbols) data (i.e., the ratios are typically higher from polluted directions than clean-air directions), although the altitudinal dependence has some differences. For SO2, the higher surface-to-column ratios from the 160° direction in cold seasons (Fig. 8d) are generally preserved when using ERA5 winds. For example, in cold seasons, the highest surface-to-column ratios from the 160° direction are 7 ppbv DU−1 (at 0 m altitude) and 6 ppbv DU−1 (at 90 m altitude) using ERA5 and WindRASS measurements, respectively. Overall, for SO2, ERA5 results generally preserved the features of ratio changes. For NO2, the higher pollutant-to-clean ratio differences are found in cold seasons (Fig. 8g–h), which is similar to the results when using WindRASS measurements. However, the larger discrepancy is found near the surface, where WindRASS results show higher ratios from the 160° direction. These differences are mainly due to the coarse spatial and vertical resolution of ERA5 data (i.e., only four data points for this 0–300 m range) and sampling issues with WindRASS measurements. The results for aerosol are similar to NO2 and have better agreement in warm seasons.
5.2 Boundary layer height effect on the column-to-surface ratio
As shown in Sects. 4 and 5.1, for tropospheric pollutants, the surface-to-column concentration ratio can reveal some information about the vertical distribution. One important finding is that such ratios change with wind directions and also have seasonal patterns (e.g., see Fig. 8). The boundary layer height data from the lidar observations could provide critical information to help further interpret the difference between the vertical column and surface observations.
To better illustrate the effect of low-BLH conditions on the SO2 plume's vertical distribution, in this section, we plotted the column-to-surface ratio. For example, Fig. 9 shows the column-to-surface ratio binned by boundary layer height in warm seasons. Here the column values (SO2 and NO2 VCD, in units of DU; AOD is unitless) are from remote sensing observations, while SO2, NO2, and PM2.5 surface concentration values (SO2 and NO2 in units of ppbv; PM2.5 in units of µg m−3) are from in situ measurements and the BLH values are from lidar observations. Figure 9a, d, and g show the boxplots of all observations; Fig. 9b, e, and h show the results representing observations with winds from the second-largest NO2 sources (i.e., winds from 40 ± 30°; facilities of Syncrude, Shell Canada Limited, Canadian Natural Resources Limited, and Imperial Oil Resources); and Fig. 9c, f, and i represent winds from the largest SO2 and NO2 sources (i.e., winds from 160 ± 30°; facilities of Suncor and Syncrude). The results clearly show that, for the SO2 plume from upgraders (see Fig. 9c), the SO2 column-to-surface ratio is a monotonic declining function of BLH (with a Spearman correlation coefficient of −0.83). In other words, in low-BLH conditions, surface in situ and remote sensing observations will likely show more differences for such elevated plumes.
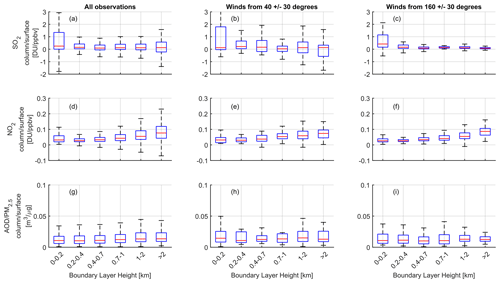
Figure 9Boxplots of SO2, NO2, and AOD / PM2.5 column-to-surface ratios binned by boundary layer height in warm seasons. Panels (a), (d), and (g) show all observations; panels (b), (e), and (h) show observations with winds from 40 ± 30° directions; and panels (c), (f), and (i) show observations with winds from 40 ± 30° directions. For SO2 and AOD, the wind data are from WindRASS observations at 250 m altitude. For NO2, the wind data is from WindRASS observations at 60 m altitude. The boundary layer height is measured with lidar. The SO2 and NO2 column observations are from Pandora, AOD observations are from sunphotometers, and all surface concentrations are from the in situ instrument. For each box, the central red mark indicates the median, and the bottom and top edges of the blue box indicate the 25th and 75th percentiles, respectively. The black whiskers extend to the most extreme data points not considered outliers.
In contrast, a similar analysis for NO2 observations shows different features (see Fig. 9d–f). This time, as NO2 has two major source directions (40 and 160° directions), Fig. 9e and f show clear and similar column-to-surface ratio patterns; i.e., this ratio is positively correlated with BLH (with a Spearman correlation coefficient of 0.94 and 1). This result indicates that the NO2 plumes have different vertical distributions from SO2 plumes (note that, different from SO2 emissions from high stacks, the truck fleet in the mining area is one of the main NOx emission sources).
When performing the same analysis for AOD (from sunphotometers) and PM2.5 (from in situ measurements) observations, the results are not clear in warm seasons (see Figs. 9g–i), similar to those in Sect. 4.3; i.e., no simple column-to-surface ratio correlations were found from 40 and 160° directions. Such results indicate the aerosol from two pollution sources (40 and 160° directions) are well-mixed, consistent with findings in Sect. 4.3 (i.e., no vertical sensitivity changes when using different wind layers). However, in cold seasons, there is a positive correlation between the AOD / PM2.5 ratio and BLH data from the 40° direction (see Fig. 10h; with a Spearman correlation coefficient of 1). Thus, in cold seasons, from this direction, the aerosol loads are closer to the surface than those vertically mixed. A table of detailed correlation coefficient values for Figs. 9 and 10 is provided in Appendix C.
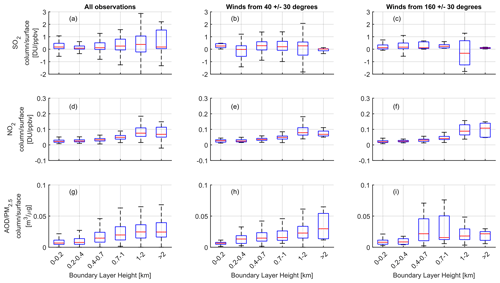
Figure 10Boxplots of SO2, NO2, and AOD / PM2.5 column-to-surface ratio binned by boundary layer height in cold seasons. Panels (a), (d), and (g) show all observations; panels (b), (e), and (h) show observations with winds from 40 ± 30° directions; and panels (c), (f), and (i) show observations with winds from 40 ± 30° directions. For SO2 and AOD, the wind data are from WindRASS observations at 250 m altitude. For NO2, the wind data are from WindRASS observations at 60 m altitude. The boundary layer height is measured with lidar. The SO2 and NO2 column observations are from Pandora, AOD observations are from sunphotometers, and all surface concentrations are from the in situ instrument.
However, as discussed, WindRASS or lidar observations are not typically available for Pandora or sunphotometer sites. As a result, such pollutants' vertical distribution information is hidden within Pandora and sunphotometer observed data. We tested this by replacing WindRASS and lidar observations with ERA5 modelled results (wind profiles and BLH) and repeated the analysis shown above. The results show ERA5 data could also assist the work in terms of separated pollutants' signal from different sources (see Figs. C2 and C3 and Table C1). In general, besides wind conditions (directions and speed) and BLH, there could be other meteorological factors playing a role in the difference between in situ and remote sensing measurements. For example, we examined combined meteorological factors, such as the ventilation coefficient (BLH × wind speed), which is also referred to as the normalized dilution rate (e.g., Gani et al., 2019). However, no improvement compared to BLH-based results was found likely due to the complexity of the pollution source distribution. More detailed high-resolution modelling work is needed to further understand the meteorological impacts to local observations.
This work analyzed the sampling differences (of SO2, NO2, and aerosol) between remote sensing and in situ instruments in the Athabasca oil sands region in terms of vertical, horizontal, and temporal dependency on wind speed, directions, altitude, and BLH. Results show that depending on the height of emission sources, remote sensing and in situ instruments could sample different parts of pollutant plumes due to their different vertical sensitivity ranges. For elevated pollutants (e.g., SO2 emission via high stacks), both remote sensing and in situ data show strong dependence on wind information above stack height level (i.e., around 250 m for this case). The magnitude of the SO2 VCD and surface concentrations reach their maximum for winds from 160 ± 30° directions at 200–300 m altitude. Note that, for warm and cold seasons, the median values of BLH are 390 and 208 m, respectively. In contrast, the NO2 emissions from 160 ± 30° directions are from both high stacks and the mining fleets. As a result, NO2 VCD shows a more uniform sensitivity to winds from near the surface to up to 300 m (peak value at 260–290 m altitude), while NO2 surface concentrations measured in situ show a strong sensitivity to near-surface winds (peak value at 60–70 m altitude). In cold seasons, the NO2 surface-to-column ratio from the 160° direction changes from 39 ppbv DU−1 at 70 m to 28 ppbv DU−1 at 200 m. Such key differences indicate the challenges in applying remote sensing observations in “breathing-height” air quality applications. In other words, although VCDs measured by remote sensing instruments represent integrated pollutants that are sensitive to both the surface and upper levels, the observations could not easily be separated or linked to localized surface values. On the other hand, while elevated air pollutants cannot be monitored at the surface via in situ measurements, they can still be captured by remote sensing instruments. Thus, these VCD observations could be more useful in quantifying total emissions than surface observations for such emission sources. Also, it is worth noting that elevated air pollutants, which do not affect the air quality immediately as they are above ground level, could still pose a health risk further downwind as the pollutants will eventually reach the surface via vertical mixing. Thus, remote sensing VCD observations could represent air quality conditions for a much larger area than localized surface in situ measurements.
Comparing AOD and surface PM2.5 measurements is complicated, as their vertical and horizontal patterns are not very alike. Such larger differences are expected as these two measurements (AOD and PM2.5) do not necessarily represent the same matter, not only due to the different sampling area but also due to the large seasonal cycle and high background. Comparisons are easier for, e.g., SO2, where remote-sensing-measured VCD (in DU) represents the SO2 within the entire vertical column; surface concentration (in ppbv) measured in situ represents the portion of SO2 within the air mass near the surface. Although many studies exist that directly compare these two measurements (AOD and PM2.5) and often reveal positive correlations, there are no simple methods that exist to directly connect or convert them (e.g., only empirical methods or via modelling means). Here we show that linking these two measurements could be even more complicated, as they have more sampling differences than observations of trace gases. On the positive side, both remote sensing and in situ observations show consistent uniform sensitivities to the wind speed and direction from near the surface to 300 m altitude, indicating the aerosol loads in this region are more uniformly mixed than SO2 and NO2.
This analysis also shows that ERA5 model-level winds produce results similar to those for direct wind measurements by WindRASS at this location and, therefore, can be a good tool to support ground-based remote sensing research to identify pollutant sources' directions and even their vertical structures. Using measured wind profiles and BLH, the work demonstrated that the column-to-surface ratio of pollutants could show positive or negative correlations with boundary layer heights depending on the height of emission sources. Further results show replacing measured wind profiles and BLH by ERA5 data could also preserve these features. Thus, these ERA5 data also can be utilized to reveal pollutants' vertical distribution and mixing conditions, which can be used as critical information when converting remote sensing column data to surface values. Current results also suggest that, for wind-rotation SO2 or NO2 emission models (e.g., Fioletov et al., 2016, 2022) and wind-rotation satellite data validation methods (Park et al., 2022; Zhao et al., 2020), different layers of ERA5 winds should be averaged, and some seasonal changes might be considered to improve the results.
This analysis of surface-to-column ratios also shows that the column values cannot be converted to surface ones by just one value of the ratio. Depending on the wind direction (and season), the ratio for directions related to the pollution sources could be a factor of 2 larger than these from “clean” directions.
The overall outcome of this work is to reveal and analyze the fundamental sampling differences between remote sensing and in situ observations via utilizing vertical wind observations and boundary layer conditions. Other aspects, such as sampling areas and clear-sky bias, still need further investigation. In particular, as remote sensing instruments discussed here are sunlight instruments and their observations are clear-sky-biased, these could lead to differences in long-term trend analysis done with in situ and remote sensing instruments alone. These ground-based remote sensing air quality observations (e.g., from Pandora spectrometer and CIMEL sunphotometer) cannot replace surface in situ monitoring but can play a key role in linking satellite air quality observations and surface in situ measurements.
Figure A1 shows WindRASS' successful sampling rate and number of successful observations as a function of altitude. The number of successful observations was nearly complete below 200 m but decreased quickly from 200 to 400 m (i.e., from about 80 % to about 20 %). Less than 5 % of observed vertical wind profiles reach altitudes above 600 m.
B1 SO2 transport observations
Information about the wind speed in addition to wind direction could further help to characterize the pollution sources.
In this section, the SO2 observations from Pandora and the in situ instrument are binned by the wind direction and speed data at a specific wind layer from WindRASS (i.e., SO2 data binned by wind directions using 20° bins and by wind speed using 1 m s−1 bins at a certain height). The SO2 data are plotted using polar coordinates, where the radius refers to the wind speed and angle refers to the wind direction. The colour of the shaded areas represents the VCD or surface concentration of SO2. For example, Fig. B1a shows the Pandora SO2 vertical column data displayed in such polar coordinates. The wind information for this plot was from WindRASS data at a height of 250 m, as indicated on the plot. The wind layer was chosen as both the remote sensing and in situ observations show maximum sensitivity to the SO2 plume at this layer (see Fig. 5). Figure 6a shows the pollutants (SO2 VCD) were transported from 130 to 190° wind directions and reached maximum values at a wind speed of about 7 m s−1. Low-wind-speed conditions (e.g., < 4 m s−1) within this direction range will have lower observed signals compared to higher wind speeds. In contrast, Fig. B1b shows that the in situ observations are sensitive to similar wind directions but elevated SO2 surface concentrations are less sensitive to the wind speed than VCDs.
Both Pandora and in situ instruments show the same behaviour with wind speed: high SO2 for relatively higher wind speed (4–8 m s−1) and low for low wind speed (< 1 m s−1). This is simply because there are no local SO2 sources in Fort McKay. The higher the wind speed, the less time the pollutants need to travel from the source to the measurement site. Since the upgraders are about 20 km away from the observation site, fast winds would be corresponding to a transit time of about 1 h, while slow winds would corresponding to about 6 h. As SO2 has a relatively short lifetime in the lower troposphere (of a few hours), the less time it takes to travel, the higher the observed VCD or surface concentrations are. If the wind speed is even higher (> 8 m s−1), the SO2 signal is low again since the pollutant is spread over a larger area, while its total mass, determined by the emission rate and the lifetime, remains constant (e.g., see SO2 VCD plume model from Fioletov et al., 2015).
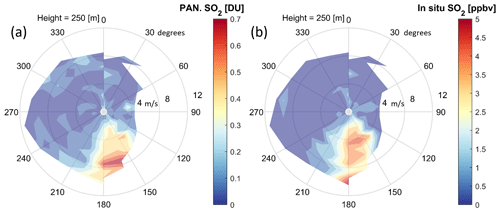
Figure B1SO2 horizontal transport pattern resolved by wind speed and direction. SO2 observations from (a) Pandora (SO2 VCD in DU) and (b) the in situ instrument (SO2 surface concentration in ppbv) at Oski-Otin. Wind information from WindRASS data at the 250 m layer where both Pandora and the in situ instrument show maximum sensitivity to wind from the pollution sources (from 160°). The polar plot bins the SO2 data (colour-coded shaded areas) by wind directions (angle values in degrees) and wind speed (radius values in m s−1).
B2 NO2 transport observations
For NO2, the data were analyzed at two different wind layer heights, i.e., wind data from the 250 m layer (same as Fig. B1, which has high sensitivity to the wind direction for SO2 data and remote sensing NO2 data) and 60 m layer (high sensitivity to in situ NO2 data, as shown in Fig. 6). In contrast to the single source direction for SO2 (160°), two distinct NO2 source directions were found at 40 and 160° (Fig. 6a and c). As shown in Fig. 1, the NO2 source from 40° is related to the mining area in the north-west direction of the observation site (NO2 emission mainly from mining fleet). The 160° direction has NO2 emissions from both stacks and the mining fleet (surface emissions > 50 %). The in situ instrument revealed the same source directions but with different sensitivities to wind speed and wind layers. Figure B2b shows that the 250 m wind layer is not good enough to isolate NO2 sources if using the in situ NO2 observations. When using the wind layer at 60 m, Fig. B2d shows that the in situ instrument has increased sensitivity to surface NO2 at low-wind-speed conditions (i.e., < 4 m s−1). The results confirmed that remote sensing and in situ instruments have different sensitivities to different layers of the pollutants; thus when comparing the results of their observations, extra caution should be given to account for such differences. Note that the directions of the winds with the highest NO2 values are somewhat different between the two layers, which may be related to vertical wind shear.
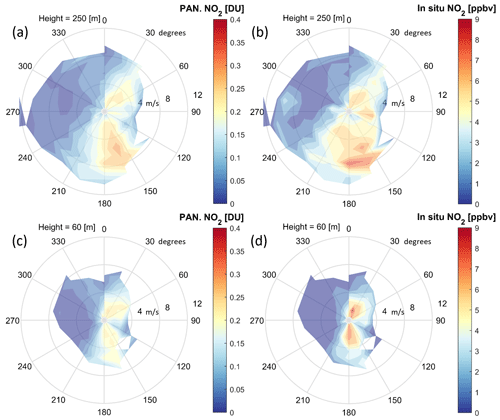
Figure B2NO2 horizontal transport pattern resolved by wind speed and direction. NO2 observations from (a, c) Pandora (NO2 VCD in DU) and (b, d) in situ instruments (NO2 surface concentration in ppbv) at Oski-Otin. Wind information from WindRASS data at 250 m layer (a, b) and 60 m layer (c, d). The polar plot bins the NO2 data (colour-coded shaded areas) by wind directions (angle values in degrees) and wind speed (radius values in m s−1).
B3 Aerosol transport observations
As illustrated in Fig. 7 and discussed in Sect. 4.3, there are larger differences between AOD and in situ measurements in determining the aerosol pollution directions. It is worth noting that there were no clear vertical structures that can be used to identify the optimal wind layers to separate and isolate potential aerosol sources. As a result, various wind layers and wind bins were examined. Not surprisingly, we did not find an optimal wind layer or wind bins that show agreement between remote sensing and in situ measurements (see Fig. B3, which shows only warm seasons, when the aerosol loads are high). However, some general patterns can still be observed. In situ data show a clear aerosol source at 160° and other sources from the north and north-east (see Fig. B3b and d; 250 and 60 m wind layers, respectively) but with slightly different patterns in terms of wind speed. The source in the north-east directions can be detected in high-wind-speed conditions (e.g., about 7 m s−1), whereas the source in south-east directions can be detected in almost all wind conditions. This could indicate different distances of the source of PM2.5 and the observation site; i.e., the south-east source is closer. It is also worth noting that remote sensing instruments revealed those two aerosol sources (e.g., Fig. 8a). However, the remote sensing observations demonstrate elevated AODs only for high-wind-speed conditions. A better explanation of such a difference between the sunphotometer's fine-mode AOD and the in situ instrument's PM2.5 observations is still needed.
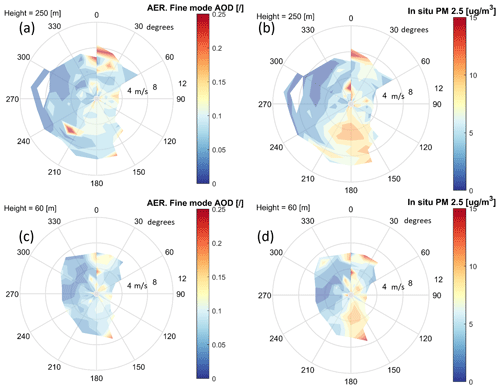
Figure B3Aerosol horizontal transport pattern resolved by wind speed and direction. Aerosol observations from (a, c) sunphotometer (fine-mode aerosol optical depth, unitless) and (b, d) the in situ instrument (PM2.5 surface concentration in µg m−3) at Oski-Otin. Wind information from WindRASS data at 250 m layer (a, b) and 60 m layer (c, d). The polar plot bins the aerosol data (colour-coded shaded areas) by wind directions (angle values in degrees) and wind speed (radius values in m s−1).
With the ERA5 wind data, horizontal transport patterns were also analyzed for SO2, NO2, and aerosol observations. For example, Fig. C1a and b confirmed that Pandora SO2 column data are more sensitive to high-wind-speed conditions than in situ surface SO2 data. Similarly, Fig. B1c and d identified two NO2 sources from expected directions. Also, Fig. C1d is consistent with Fig. B2d, both showing that the in situ NO2 data are more sensitive in low-wind-speed conditions. It is worth noting that, for the aerosol data, the AOD sources can be better identified and separated (see the discussion in Sect. 5.1) for higher-level winds (1000 m). In general, it was found that the optimized ERA5 wind layers for NO2 pollutant transport analysis in this region range from the surface to 900 hPa year-round (corresponding to the bottom 15 layers in ERA5 model-level data). As the SO2 emissions were from high stacks, in warm seasons, its optimized wind layers extended from the surface to 800 hPa (corresponding to the bottom 25 model layers), while in cold seasons, the optimized wind layers extended from the surface to only 900 hPa (the bottom 15 model layers).
With ERA5 wind and BLH data, the boundary layer height effect shown in Sect. 5.2 has been reproduced in Figs. B2 and B3 for warm and cold seasons, respectively.
Table C1Spearman correlation coefficients between median values of column-to-surface ratio and BLH height for Fig. 10.
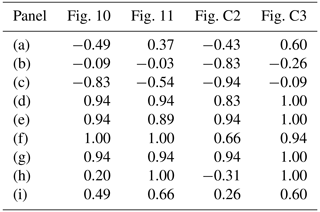
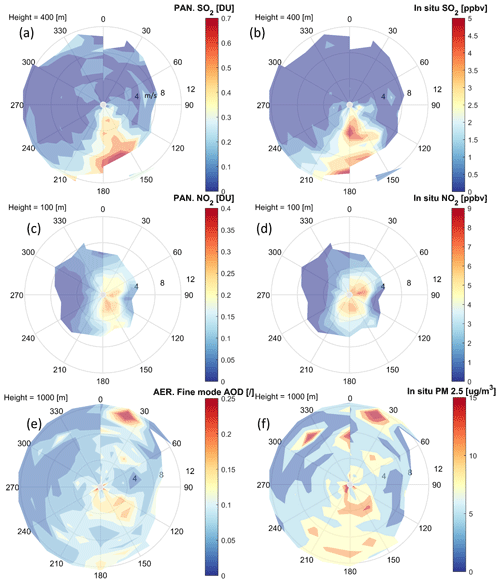
Figure C1SO2, NO2, and aerosol horizontal transport patterns were resolved by wind speed and direction using ERA5 wind data. Panels (a), (c), and (e) show the SO2, NO2, and aerosol column observations from Pandora and the sunphotometer (fine-mode aerosol optical depth, unitless), and panels (b), (d), and (f) show the in situ observations at Oski-Otin. Wind information from ERA5 data at the 400 m layer (a, b), 100 m layer (c, d), and 1000 m layer (e, f). The polar plot bins the observation data (colour-coded shaded areas) by wind directions (angle values in degrees) and wind speed (radius values in m s−1).
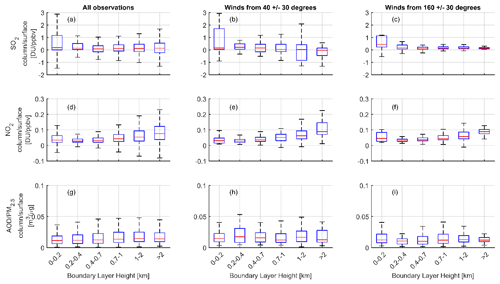
Figure C2Boxplots of SO2, NO2, and AOD / PM2.5 column-to-surface ratio binned by boundary layer height in warm seasons. Panels (a), (d), and (g) show all observations; panels (b), (e), and (h) show observations with winds from 40 ± 30° directions; and panels (c), (f), and (i) show observations with winds from 40 ± 30° directions. For SO2 and AOD, the wind data are from ERA5 at 300 m altitude. For NO2, the wind data are from ERA5 at 100 m altitude. The boundary layer height is from ERA5. The SO2 and NO2 column observations are from Pandora, AOD observations are from sunphotometers, and all surface concentrations are from the in situ instrument.
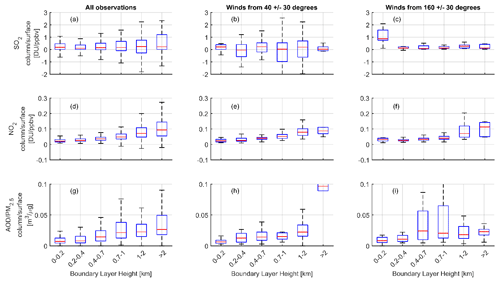
Figure C3Boxplots of SO2, NO2, and AOD / PM2.5 column-to-surface ratio binned by boundary layer height in cold seasons. Panels (a), (d), and (g) show all observations; panels (b), (e), and (h) show observations with winds from 40 ± 30° directions; and panels (c), (f), and (i) show observations with winds from 40 ± 30° directions. For SO2 and AOD, the wind data are from ERA5 at 300 m altitude. For NO2, the wind data are from ERA5 at 100 m altitude. The boundary layer height is from ERA5. The SO2 and NO2 column observations are from Pandora, AOD observations are from sunphotometers, and all surface concentrations are from the in situ instrument.
Pandora data are available from the Pandonia network (https://data.ovh.pandonia-global-network.org/, Pandonia Global Network, 2024). Sunphotometer data are available from https://aeronet.gsfc.nasa.gov/cgi-bin/data_display_aod_v3?site=Fort_McKay&nachal=2&level=3&place_code=10 (AERONET, 2024). WindRASS and lidar data are available from https://data-donnees.az.ec.gc.ca/data/air/monitor/ambient- air-quality-oil-sands-region/pollutant-transformation-ground- based-pollutant-monitoring-multi-parameters-validated-data-fort- mckay-oil-sands-region/?lang=en (ECCC, 2024). Any additional data may be obtained from Xiaoyi Zhao (xiaoyi.zhao@ec.gc.ca). The Wood Buffalo Environmental Association in situ observations data are available at https://wbea.org/network-and-data/monitoring-stations/ (WBEA, 2024). ERA5 data can be obtained from https://cds.climate.copernicus.eu/datasets/reanalysis-era5-pressure-levels?tab=overview (ECMWF, 2024).
XZ analyzed the data and prepared the manuscript, with significant conceptual input from VF and critical feedback from all co-authors. DG and CMc provided and supported the analysis of ERA5 model-level wind data. JD, VF, XZ, and SCL operated and managed the Canadian Pandora network. IA, VF, and SCL operated and managed AEROCAN. AC and MT operated the Pandonia Global Network (PGN) and provided critical technical support to the Canadian Pandora measurement program and subsequent data analysis. RSw managed the NASA Pandora project and supported Canadian Pandora measurements at the oil sands site. RSt provided WindRASS data products, and CMi provided in situ concentration and meteorological data. KS provided lidar data products.
The contact author has declared that none of the authors has any competing interests.
Publisher’s note: Copernicus Publications remains neutral with regard to jurisdictional claims made in the text, published maps, institutional affiliations, or any other geographical representation in this paper. While Copernicus Publications makes every effort to include appropriate place names, the final responsibility lies with the authors.
The authors would like to thank the Wood Buffalo Environmental Association for the provision of their in situ data. Pandora, sunphotometer, and WindRASS measurements were carried out as part of the Oil Sands Monitoring (OSM) program by the governments of Alberta and Canada. We thank Akira Ogyu and Reno Sit from Environment and Climate Change Canada, Daniel Santana Diaz from PGN, and Nader Abuhassan from NASA for their technical support of Pandora measurements. The PGN is a bilateral project supported with funding from NASA and ESA.
This paper was edited by Jian Xu and reviewed by two anonymous referees.
AERONET: AOD data, https://aeronet.gsfc.nasa.gov/cgi-bin/data_display_aod_v3?site=Fort_McKay&nachal=2&level=3&place_code=10, last access: 20 November 2024.
Barkley, M. P., González Abad, G., Kurosu, T. P., Spurr, R., Torbatian, S., and Lerot, C.: OMI air-quality monitoring over the Middle East, Atmos. Chem. Phys., 17, 4687–4709, https://doi.org/10.5194/acp-17-4687-2017, 2017.
Davis, Z. Y. W., Frieß, U., Strawbridge, K. B., Aggarwaal, M., Baray, S., Schnitzler, E. G., Lobo, A., Fioletov, V. E., Abboud, I., McLinden, C. A., Whiteway, J., Willis, M. D., Lee, A. K. Y., Brook, J., Olfert, J., O'Brien, J., Staebler, R., Osthoff, H. D., Mihele, C., and McLaren, R.: Validation of MAX-DOAS retrievals of aerosol extinction, SO2, and NO2 through comparison with lidar, sun photometer, active DOAS, and aircraft measurements in the Athabasca oil sands region, Atmos. Meas. Tech., 13, 1129–1155, https://doi.org/10.5194/amt-13-1129-2020, 2020.
de Foy, B., Lu, Z., Streets, D. G., Lamsal, L. N., and Duncan, B. N.: Estimates of power plant NOx emissions and lifetimes from OMI NO2 satellite retrievals, Atmos. Environ., 116, 1–11, https://doi.org/10.1016/j.atmosenv.2015.05.056, 2015.
Dieudonné, E., Ravetta, F., Pelon, J., Goutail, F., and Pommereau, J.-P.: Linking NO2 surface concentration and integrated content in the urban developed atmospheric boundary layer, Geophys. Res. Lett., 40, 1247–1251, https://doi.org/10.1002/grl.50242, 2013.
Duncan, B. N., Lamsal, L. N., Thompson, A. M., Yoshida, Y., Lu, Z., Streets, D. G., Hurwitz, M. M., and Pickering, K. E.: A space-based, high-resolution view of notable changes in urban NOx pollution around the world (2005–2014), J. Geophys. Res., 121, 976–996, https://doi.org/10.1002/2015JD024121, 2016.
ECCC (Environment and Climate Change Canada Data Catalogue): Wind and boundary layer height data, Canada.ca, https://data-donnees.az.ec.gc.ca/data/air/monitor/ ambient-air-quality-oil-sands-region/pollutant-transformation-ground-based-pollutant-monitoring-multi-parameters-validated- data-fort-mckay-oil-sands-region/?lang=en, last access: 20 November 2024.
ECMWF: Vertical wind profiles, https://cds.climate.copernicus.eu/datasets/reanalysis-era5-pressure-levels?tab=overview, last access: 20 November 2024.
Fioletov, V., McLinden, C. A., Griffin, D., Theys, N., Loyola, D. G., Hedelt, P., Krotkov, N. A., and Li, C.: Anthropogenic and volcanic point source SO2 emissions derived from TROPOMI on board Sentinel-5 Precursor: first results, Atmos. Chem. Phys., 20, 5591–5607, https://doi.org/10.5194/acp-20-5591-2020, 2020.
Fioletov, V., McLinden, C. A., Griffin, D., Krotkov, N., Liu, F., and Eskes, H.: Quantifying urban, industrial, and background changes in NO2 during the COVID-19 lockdown period based on TROPOMI satellite observations, Atmos. Chem. Phys., 22, 4201–4236, https://doi.org/10.5194/acp-22-4201-2022, 2022.
Fioletov, V. E., McLinden, C. A., Krotkov, N., Moran, M. D., and Yang, K.: Estimation of SO2 emissions using OMI retrievals, Geophys. Res. Lett., 38, L21811, https://doi.org/10.1029/2011GL049402, 2011.
Fioletov, V. E., McLinden, C. A., Krotkov, N., and Li, C.: Lifetimes and emissions of SO2 from point sources estimated from OMI, Geophys. Res. Lett., 42, 1969–1976, https://doi.org/10.1002/2015GL063148, 2015.
Fioletov, V. E., McLinden, C. A., Cede, A., Davies, J., Mihele, C., Netcheva, S., Li, S.-M., and O'Brien, J.: Sulfur dioxide (SO2) vertical column density measurements by Pandora spectrometer over the Canadian oil sands, Atmos. Meas. Tech., 9, 2961–2976, https://doi.org/10.5194/amt-9-2961-2016, 2016.
Gani, S., Bhandari, S., Seraj, S., Wang, D. S., Patel, K., Soni, P., Arub, Z., Habib, G., Hildebrandt Ruiz, L., and Apte, J. S.: Submicron aerosol composition in the world's most polluted megacity: the Delhi Aerosol Supersite study, Atmos. Chem. Phys., 19, 6843–6859, https://doi.org/10.5194/acp-19-6843-2019, 2019.
Gordon, M., Makar, P. A., Staebler, R. M., Zhang, J., Akingunola, A., Gong, W., and Li, S.-M.: A comparison of plume rise algorithms to stack plume measurements in the Athabasca oil sands, Atmos. Chem. Phys., 18, 14695–14714, https://doi.org/10.5194/acp-18-14695-2018, 2018.
Gulde, S. T., Kolm, M. G., Smith, D. J., Maurer, R., Courrèges-Lacoste, G. B., Sallusti, M., and Bagnasco, G.: Sentinel 4: a geostationary imaging UVN spectrometer for air quality monitoring: status of design, performance and development, in: International Conference on Space Optics – ICSO 2014, Tenerife, Canary Islands, Spain, 6–10 October 2014, SPIE, 1158–1166, https://doi.org/10.1117/12.2304099, 2017.
Herman, J., Cede, A., Spinei, E., Mount, G., Tzortziou, M., and Abuhassan, N.: NO2 column amounts from ground-based Pandora and MFDOAS spectrometers using the direct-sun DOAS technique: Intercomparisons and application to OMI validation, J. Geophys. Res., 114, D13307, https://doi.org/10.1029/2009JD011848, 2009.
Herman, J., Evans, R., Cede, A., Abuhassan, N., Petropavlovskikh, I., and McConville, G.: Comparison of ozone retrievals from the Pandora spectrometer system and Dobson spectrophotometer in Boulder, Colorado, Atmos. Meas. Tech., 8, 3407–3418, https://doi.org/10.5194/amt-8-3407-2015, 2015.
Hersbach, H., Bell, B., Berrisford, P., Hirahara, S., Horányi, A., Muñoz-Sabater, J., Nicolas, J., Peubey, C., Radu, R., Schepers, D., Simmons, A., Soci, C., Abdalla, S., Abellan, X., Balsamo, G., Bechtold, P., Biavati, G., Bidlot, J., Bonavita, M., De Chiara, G., Dahlgren, P., Dee, D., Diamantakis, M., Dragani, R., Flemming, J., Forbes, R., Fuentes, M., Geer, A., Haimberger, L., Healy, S., Hogan, R. J., Hólm, E., Janisková, M., Keeley, S., Laloyaux, P., Lopez, P., Lupu, C., Radnoti, G., de Rosnay, P., Rozum, I., Vamborg, F., Villaume, S., and Thépaut, J.-N.: The ERA5 global reanalysis, Q. J. Roy. Meteor. Soc., 146, 1999–2049, https://doi.org/10.1002/qj.3803, 2020.
Holben, B. N., Tanré, D., Smirnov, A., Eck, T. F., Slutsker, I., Abuhassan, N., Newcomb, W. W., Schafer, J. S., Chatenet, B., Lavenu, F., Kaufman, Y. J., Castle, J. V., Setzer, A., Markham, B., Clark, D., Frouin, R., Halthore, R., Karneli, A., O'Neill, N. T., Pietras, C., Pinker, R. T., Voss, K., and Zibordi, G.: An emerging ground-based aerosol climatology: Aerosol optical depth from AERONET, J. Geophys. Res., 106, 12067–12097, https://doi.org/10.1029/2001JD900014, 2001.
Jeong, U., Tsay, S.-C., Giles, D. M., Holben, B. N., Swap, R. J., Abuhassan, N., and Herman, J. R.: The SMART-s Trace Gas and Aerosol Inversions: I. Algorithm Theoretical Basis for Column Property Retrievals, J. Geophys. Res., 125, e2019JD032088, https://doi.org/10.1029/2019JD032088, 2020.
Judd, L. M., Al-Saadi, J. A., Szykman, J. J., Valin, L. C., Janz, S. J., Kowalewski, M. G., Eskes, H. J., Veefkind, J. P., Cede, A., Mueller, M., Gebetsberger, M., Swap, R., Pierce, R. B., Nowlan, C. R., Abad, G. G., Nehrir, A., and Williams, D.: Evaluating Sentinel-5P TROPOMI tropospheric NO2 column densities with airborne and Pandora spectrometers near New York City and Long Island Sound, Atmos. Meas. Tech., 13, 6113–6140, https://doi.org/10.5194/amt-13-6113-2020, 2020.
Kelly, E. N., Schindler, D. W., Hodson, P. V., Short, J. W., Radmanovich, R., and Nielsen, C. C.: Oil sands development contributes elements toxic at low concentrations to the Athabasca River and its tributaries, P. Natl. Acad. Sci. USA, 107, 16178–16183, https://doi.org/10.1073/pnas.1008754107, 2010.
Kim, J., Jeong, U., Ahn, M.-H., Kim, J. H., Park, R. J., Lee, H., Song, C. H., Choi, Y.-S., Lee, K.-H., Yoo, J.-M., Jeong, M.-J., Park, S. K., Lee, K.-M., Song, C.-K., Kim, S.-W., Kim, Y. J., Kim, S.-W., Kim, M., Go, S., Liu, X., Chance, K., Miller, C. C., Al-Saadi, J., Veihelmann, B., Bhartia, P. K., Torres, O., Abad, G. G., Haffner, D. P., Ko, D. H., Lee, S. H., Woo, J.-H., Chong, H., Park, S. S., Nicks, D., Choi, W. J., Moon, K.-J., Cho, A., Yoon, J., Kim, S., Hong, H., Lee, K., Lee, H., Lee, S., Choi, M., Veefkind, P., Levelt, P. F., Edwards, D. P., Kang, M., Eo, M., Bak, J., Baek, K., Kwon, H.-A., Yang, J., Park, J., Han, K. M., Kim, B.-R., Shin, H.-W., Choi, H., Lee, E., Chong, J., Cha, Y., Koo, J.-H., Irie, H., Hayashida, S., Kasai, Y., Kanaya, Y., Liu, C., Lin, J., Crawford, J. H., Carmichael, G. R., Newchurch, M. J., Lefer, B. L., Herman, J. R., Swap, R. J., Lau, A. K. H., Kurosu, T. P., Jaross, G., Ahlers, B., Dobber, M., McElroy, C. T., and Choi, Y.: New Era of Air Quality Monitoring from Space: Geostationary Environment Monitoring Spectrometer (GEMS), B. Am. Meteorol. Soc., 101, E1–E22, https://doi.org/10.1175/BAMS-D-18-0013.1, 2020.
Knepp, T., Pippin, M., Crawford, J., Chen, G., Szykman, J., Long, R., Cowen, L., Cede, A., Abuhassan, N., Herman, J., Delgado, R., Compton, J., Berkoff, T., Fishman, J., Martins, D., Stauffer, R., Thompson, A. M., Weinheimer, A., Knapp, D., Montzka, D., Lenschow, D., and Neil, D.: Estimating surface NO2 and SO2 mixing ratios from fast-response total column observations and potential application to geostationary missions, J. Atmos. Chem., 72, 261–286, https://doi.org/10.1007/s10874-013-9257-6, 2015.
Kollonige, D. E., Thompson, A. M., Josipovic, M., Tzortziou, M., Beukes, J. P., Burger, R., Martins, D. K., Zyl, P. G. van, Vakkari, V., and Laakso, L.: OMI Satellite and Ground-Based Pandora Observations and Their Application to Surface NO2 Estimations at Terrestrial and Marine Sites, J. Geophys. Res., 123, 1441–1459, https://doi.org/10.1002/2017JD026518, 2017.
Kreher, K., Van Roozendael, M., Hendrick, F., Apituley, A., Dimitropoulou, E., Frieß, U., Richter, A., Wagner, T., Lampel, J., Abuhassan, N., Ang, L., Anguas, M., Bais, A., Benavent, N., Bösch, T., Bognar, K., Borovski, A., Bruchkouski, I., Cede, A., Chan, K. L., Donner, S., Drosoglou, T., Fayt, C., Finkenzeller, H., Garcia-Nieto, D., Gielen, C., Gómez-Martín, L., Hao, N., Henzing, B., Herman, J. R., Hermans, C., Hoque, S., Irie, H., Jin, J., Johnston, P., Khayyam Butt, J., Khokhar, F., Koenig, T. K., Kuhn, J., Kumar, V., Liu, C., Ma, J., Merlaud, A., Mishra, A. K., Müller, M., Navarro-Comas, M., Ostendorf, M., Pazmino, A., Peters, E., Pinardi, G., Pinharanda, M., Piters, A., Platt, U., Postylyakov, O., Prados-Roman, C., Puentedura, O., Querel, R., Saiz-Lopez, A., Schönhardt, A., Schreier, S. F., Seyler, A., Sinha, V., Spinei, E., Strong, K., Tack, F., Tian, X., Tiefengraber, M., Tirpitz, J.-L., van Gent, J., Volkamer, R., Vrekoussis, M., Wang, S., Wang, Z., Wenig, M., Wittrock, F., Xie, P. H., Xu, J., Yela, M., Zhang, C., and Zhao, X.: Intercomparison of NO2, O4, O3 and HCHO slant column measurements by MAX-DOAS and zenith-sky UV–visible spectrometers during CINDI-2, Atmos. Meas. Tech., 13, 2169–2208, https://doi.org/10.5194/amt-13-2169-2020, 2020.
Krotkov, N. A., McLinden, C. A., Li, C., Lamsal, L. N., Celarier, E. A., Marchenko, S. V., Swartz, W. H., Bucsela, E. J., Joiner, J., Duncan, B. N., Boersma, K. F., Veefkind, J. P., Levelt, P. F., Fioletov, V. E., Dickerson, R. R., He, H., Lu, Z., and Streets, D. G.: Aura OMI observations of regional SO2 and NO2 pollution changes from 2005 to 2015, Atmos. Chem. Phys., 16, 4605–4629, https://doi.org/10.5194/acp-16-4605-2016, 2016.
Liu, F., Beirle, S., Zhang, Q., van der A, R. J., Zheng, B., Tong, D., and He, K.: NOx emission trends over Chinese cities estimated from OMI observations during 2005 to 2015, Atmos. Chem. Phys., 17, 9261–9275, https://doi.org/10.5194/acp-17-9261-2017, 2017.
Liu, S., Valks, P., Beirle, S., and Loyola, D. G.: Nitrogen dioxide decline and rebound observed by GOME-2 and TROPOMI during COVID-19 pandemic, Air Qual. Atmos. Hlth., 14, 1737–1755, https://doi.org/10.1007/s11869-021-01046-2, 2021.
Lu, Z., Streets, D. G., de Foy, B., Lamsal, L. N., Duncan, B. N., and Xing, J.: Emissions of nitrogen oxides from US urban areas: estimation from Ozone Monitoring Instrument retrievals for 2005–2014, Atmos. Chem. Phys., 15, 10367–10383, https://doi.org/10.5194/acp-15-10367-2015, 2015.
McLinden, C. A., Fioletov, V., Boersma, K. F., Krotkov, N., Sioris, C. E., Veefkind, J. P., and Yang, K.: Air quality over the Canadian oil sands: A first assessment using satellite observations, Geophys. Res. Lett., 39, L04804, https://doi.org/10.1029/2011GL050273, 2012.
McLinden, C. A., Fioletov, V., Boersma, K. F., Kharol, S. K., Krotkov, N., Lamsal, L., Makar, P. A., Martin, R. V., Veefkind, J. P., and Yang, K.: Improved satellite retrievals of NO2 and SO2 over the Canadian oil sands and comparisons with surface measurements, Atmos. Chem. Phys., 14, 3637–3656, https://doi.org/10.5194/acp-14-3637-2014, 2014.
McLinden, C. A., Fioletov, V., Krotkov, N. A., Li, C., Boersma, K. F., and Adams, C.: A Decade of Change in NO2 and SO2 over the Canadian Oil Sands As Seen from Space, Environ. Sci. Technol., 50, 331–337, https://doi.org/10.1021/acs.est.5b04985, 2016.
McLinden, C. A., Adams, C. L. F., Fioletov, V., Griffin, D., Makar, P. A., Zhao, X., Kovachik, A., Dickson, N., Brown, C., Krotkov, N., Li, C., Theys, N., Hedelt, P., and Loyola, D. G.: Inconsistencies in sulfur dioxide emissions from the Canadian oil sands and potential implications, Environ. Res. Lett., 16, 014012, https://doi.org/10.1088/1748-9326/abcbbb, 2020.
O'Neill, N. T., Dubovik, O., and Eck, T. F.: Modified Ångström exponent for the characterization of submicrometer aerosols, Appl. Optics, 40, 2368–2375, https://doi.org/10.1364/AO.40.002368, 2001.
O'Neill, N. T., Eck, T. F., Smirnov, A., Holben, B. N., and Thulasiraman, S.: Spectral discrimination of coarse and fine mode optical depth, J. Geophys. Res., 108, 4559, https://doi.org/10.1029/2002JD002975, 2003.
Pandonia Global Network (PGN): NO2 and SO2 column data, https://data.ovh.pandonia-global-network.org/, last access: 20 November 2024.
Park, J.-U., Park, J.-S., Diaz, D. S., Gebetsberger, M., Müller, M., Shalaby, L., Tiefengraber, M., Kim, H.-J., Park, S. S., Song, C.-K., and Kim, S.-W.: Spatiotemporal inhomogeneity of total column NO2 in a polluted urban area inferred from TROPOMI and Pandora intercomparisons, GISci. Remote Sens., 59, 354–373, https://doi.org/10.1080/15481603.2022.2026640, 2022.
Richter, A., Weber, M., Burrows, J. P., Lambert, J.-C., and van Gijsel, A.: Validation strategy for satellite observations of tropospheric reactive gases, Ann. Geophys.-Italy, 56, Fast Track 1, https://doi.org/10.4401/ag-6335, 2013.
Simpson, I. J., Blake, N. J., Barletta, B., Diskin, G. S., Fuelberg, H. E., Gorham, K., Huey, L. G., Meinardi, S., Rowland, F. S., Vay, S. A., Weinheimer, A. J., Yang, M., and Blake, D. R.: Characterization of trace gases measured over Alberta oil sands mining operations: 76 speciated C2–C10 volatile organic compounds (VOCs), CO2, CH4, CO, NO, NO2, NOy, O3 and SO2, Atmos. Chem. Phys., 10, 11931–11954, https://doi.org/10.5194/acp-10-11931-2010, 2010.
Sioris, C. E., Abboud, I., Fioletov, V. E., and McLinden, C. A.: AEROCAN, the Canadian sub-network of AERONET: Aerosol monitoring and air quality applications, Atmos. Environ., 167, 444–457, https://doi.org/10.1016/j.atmosenv.2017.08.044, 2017.
Song, H. and Yang, M.: Analysis on Effectiveness of SO2 Emission Reduction in Shanxi, China by Satellite Remote Sensing, Atmosphere, 5, 830–846, https://doi.org/10.3390/atmos5040830, 2014.
Stieb, D. M., Burnett, R. T., Smith-Doiron, M., Brion, O., Shin, H. H., and Economou, V.: A New Multipollutant, No-Threshold Air Quality Health Index Based on Short-Term Associations Observed in Daily Time-Series Analyses, J. Air Waste Manage., 58, 435–450, https://doi.org/10.3155/1047-3289.58.3.435, 2008.
Strawbridge, K. B.: Developing a portable, autonomous aerosol backscatter lidar for network or remote operations, Atmos. Meas. Tech., 6, 801–816, https://doi.org/10.5194/amt-6-801-2013, 2013.
Strawbridge, K. B. and Snyder, B. J.: Planetary boundary layer height determination during Pacific 2001 using the advantage of a scanning lidar instrument, Atmos. Environ., 38, 5861–5871, https://doi.org/10.1016/j.atmosenv.2003.10.065, 2004.
Strawbridge, K. B., Travis, M. S., Firanski, B. J., Brook, J. R., Staebler, R., and Leblanc, T.: A fully autonomous ozone, aerosol and nighttime water vapor lidar: a synergistic approach to profiling the atmosphere in the Canadian oil sands region, Atmos. Meas. Tech., 11, 6735–6759, https://doi.org/10.5194/amt-11-6735-2018, 2018.
Streets, D. G., Canty, T., Carmichael, G. R., de Foy, B., Dickerson, R. R., Duncan, B. N., Edwards, D. P., Haynes, J. A., Henze, D. K., Houyoux, M. R., Jacob, D. J., Krotkov, N. A., Lamsal, L. N., Liu, Y., Lu, Z., Martin, R. V., Pfister, G. G., Pinder, R. W., Salawitch, R. J., and Wecht, K. J.: Emissions estimation from satellite retrievals: A review of current capability, Atmos. Environ., 77, 1011–1042, https://doi.org/10.1016/j.atmosenv.2013.05.051, 2013.
Szykman, J., Swap, R. J., Lefer, B., Valin, L., Lee, S. C., Fioletov, V., Zhao, X., Davies, J., Williams, D., Abuhassan, N., Shalaby, L., Cede, A., Tiefengraber, M., Mueller, M., Kotsakis, A., Santos, F., and Robinson, J.: Connecting in-situ and Satellite Monitoring in Support of the Canada–U.S. Air Quality Agreement, EM: Air and Waste Management Association's Magazine for Environmental Managers, 7, 29–35, 2019.
Tzortziou, M., Herman, J. R., Cede, A., and Abuhassan, N.: High precision, absolute total column ozone measurements from the Pandora spectrometer system: Comparisons with data from a Brewer double monochromator and Aura OMI, J. Geophys. Res., 117, D16303, https://doi.org/10.1029/2012JD017814, 2012.
Tzortziou, M., Herman, J. R., Cede, A., Loughner, C. P., Abuhassan, N., and Naik, S.: Spatial and temporal variability of ozone and nitrogen dioxide over a major urban estuarine ecosystem, J. Atmos. Chem., 72, 287–309, https://doi.org/10.1007/s10874-013-9255-8, 2015.
Tzortziou, M., Kwong, C. F., Goldberg, D., Schiferl, L., Commane, R., Abuhassan, N., Szykman, J. J., and Valin, L. C.: Declines and peaks in NO2 pollution during the multiple waves of the COVID-19 pandemic in the New York metropolitan area, Atmos. Chem. Phys., 22, 2399–2417, https://doi.org/10.5194/acp-22-2399-2022, 2022.
Wang, S., Zhang, Q., Martin, R. V., Philip, S., Liu, F., Li, M., Jiang, X., and He, K.: Satellite measurements oversee China's sulfur dioxide emission reductions from coal-fired power plants, Environ. Res. Lett., 10, 114015, https://doi.org/10.1088/1748-9326/10/11/114015, 2015.
WBEA: Surface air pollutants, https://wbea.org/network-and-data/monitoring-stations/, last access: 20 November 2024.
Zhao, X., Fioletov, V., Cede, A., Davies, J., and Strong, K.: Accuracy, precision, and temperature dependence of Pandora total ozone measurements estimated from a comparison with the Brewer triad in Toronto, Atmos. Meas. Tech., 9, 5747–5761, https://doi.org/10.5194/amt-9-5747-2016, 2016.
Zhao, X., Griffin, D., Fioletov, V., McLinden, C., Davies, J., Ogyu, A., Lee, S. C., Lupu, A., Moran, M. D., Cede, A., Tiefengraber, M., and Müller, M.: Retrieval of total column and surface NO2 from Pandora zenith-sky measurements, Atmos. Chem. Phys., 19, 10619–10642, https://doi.org/10.5194/acp-19-10619-2019, 2019.
Zhao, X., Griffin, D., Fioletov, V., McLinden, C., Cede, A., Tiefengraber, M., Müller, M., Bognar, K., Strong, K., Boersma, F., Eskes, H., Davies, J., Ogyu, A., and Lee, S. C.: Assessment of the quality of TROPOMI high-spatial-resolution NO2 data products in the Greater Toronto Area, Atmos. Meas. Tech., 13, 2131–2159, https://doi.org/10.5194/amt-13-2131-2020, 2020.
Zhao, X., Fioletov, V., Alwarda, R., Su, Y., Griffin, D., Weaver, D., Strong, K., Cede, A., Hanisco, T., Tiefengraber, M., McLinden, C., Eskes, H., Davies, J., Ogyu, A., Sit, R., Abboud, I., and Lee, S. C.: Tropospheric and Surface Nitrogen Dioxide Changes in the Greater Toronto Area during the First Two Years of the COVID-19 Pandemic, Remote Sens., 14, 1625, https://doi.org/10.3390/rs14071625, 2022.
Zoogman, P., Liu, X., Suleiman, R. M., Pennington, W. F., Flittner, D. E., Al-Saadi, J. A., Hilton, B. B., Nicks, D. K., Newchurch, M. J., Carr, J. L., Janz, S. J., Andraschko, M. R., Arola, A., Baker, B. D., Canova, B. P., Chan Miller, C., Cohen, R. C., Davis, J. E., Dussault, M. E., Edwards, D. P., Fishman, J., Ghulam, A., González Abad, G., Grutter, M., Herman, J. R., Houck, J., Jacob, D. J., Joiner, J., Kerridge, B. J., Kim, J., Krotkov, N. A., Lamsal, L., Li, C., Lindfors, A., Martin, R. V., McElroy, C. T., McLinden, C., Natraj, V., Neil, D. O., Nowlan, C. R., O'Sullivan, E. J., Palmer, P. I., Pierce, R. B., Pippin, M. R., Saiz-Lopez, A., Spurr, R. J. D., Szykman, J. J., Torres, O., Veefkind, J. P., Veihelmann, B., Wang, H., Wang, J., and Chance, K.: Tropospheric emissions: Monitoring of pollution (TEMPO), J. Quant. Spectrosc. Ra., 186, 17–39, https://doi.org/10.1016/j.jqsrt.2016.05.008, 2017.
- Abstract
- Copyright statement
- Introduction
- Observation sites and datasets
- Integration period differences
- Vertical sampling differences between remote sensing and in situ observations
- Reanalysis meteorological data
- Conclusion
- Appendix A
- Appendix B
- Appendix C
- Data availability
- Author contributions
- Competing interests
- Disclaimer
- Acknowledgements
- Review statement
- References


