the Creative Commons Attribution 4.0 License.
the Creative Commons Attribution 4.0 License.
Dual-frequency (Ka-band and G-band) radar estimates of liquid water content profiles in shallow clouds
Juan M. Socuellamos
Raquel Rodriguez Monje
Matthew D. Lebsock
Ken B. Cooper
Pavlos Kollias
The profile of the liquid water content (LWC) in clouds provides fundamental information for understanding the internal structure of clouds, their radiative effects, propensity to precipitate, and degree of entrainment and mixing with the surrounding environment. In principle, differential absorption techniques based on coincident dual-frequency radar reflectivity observations have the potential to provide the LWC profile. Previous differential frequency radar reflectivity (DFR) efforts were challenged by the fact that the measurable differential attenuation for small quantities of LWC is usually comparable to the system measurement error. This typically renders the retrieval impractical, as the uncertainty can become many times greater than the retrieved value itself. Theoretically, this drawback can be mitigated following two interconnected approaches: (1) increasing the frequency separation between the dual-frequency radar system to measure greater differential attenuation and (2) increasing the radar operating frequency to reduce the instrument measurement random error. Our recently developed 239 GHz radar was deployed during the Eastern Pacific Cloud Aerosol Precipitation Experiment (EPCAPE) along with a variety of collocated remote sensing and in situ instruments. We have combined Ka-band (35 GHz) and G-band (239 GHz) observations to retrieve the LWC from more than 100 vertical profiles of shallow clouds with typical amounts of LWC smaller than 1 g m−3. We theoretically and experimentally demonstrate that the Ka-band and G-band pair of frequencies offers at least a 65 % relative improvement in the LWC retrieval sensitivity compared to previous works reported in the literature using lower-frequency radars. This new technique provides a missing capability to determine the LWC in the challenging low liquid water path (LWP) range (< 200 g m−2) and suggests a way forward to characterize microphysical and dynamical processes more precisely in shallow clouds.
- Article
(5892 KB) - Full-text XML
- BibTeX
- EndNote
Low-level stratiform clouds have extensive areal coverage over the subtropical oceans, especially near the western continental boundaries (Wood, 2012). These shallow cloud layers moderate the ocean–atmosphere radiative exchange, exerting a strong impact on the sea surface temperature and the cloud–climate feedback (Brient et al., 2016; Zelinka et al., 2016). Variability in the response of these clouds to anthropogenic warming remains a significant source of spread in climate change projections (Zelinka et al., 2020). Due to their extensive coverage and strong interaction with radiation, shallow clouds can significantly affect the weather on seasonal and shorter timescales (Fast et al., 2019). Understanding the thermodynamic behavior and structure of shallow clouds is therefore of major importance to improve the representation of the ocean–atmosphere interaction and generate more robust weather forecast models and climate predictions (Bony and Dufresne, 2005; Zelinka et al., 2020).
Given their characteristic thickness, shallow clouds are challenging to accurately represent in global-scale simulations. Incorporating additional experimental data can be of use to develop more appropriate parameterizations for climate models (Randall, 2013; Medeiros et al., 2023; Schneider et al., 2024). A key property that, in large part, describes the radiative impact of shallow clouds is their liquid water content (LWC). The vertical profile of the LWC provides valuable information about the cloud's internal structure, including the turbulent mixing within the cloud layer. Accurate retrievals of LWC in shallow clouds, however, remain a complex endeavor (Ebell et al., 2010). The usual small amounts of liquid water in shallow clouds (< 1 g m−3) are hard to measure and require very sensitive instruments and an accurate methodology.
Radiometer and single-frequency radar observations have been used in the past to estimate the LWC by relying on assumptions of the vertical LWC profile, the drop size distribution, or accurate absolute instrument calibration (Frisch et al., 1998; Löhnert et al., 2001; Matrosov et al., 2004; Illingworth et al., 2007; Küchler et al., 2018). A more direct technique consists of using a dual-frequency radar system (Atlas, 1954; Eccles and Mueller, 1971; Hogan et al., 2005; Ellis and Vivekanandan, 2011). The estimation of the LWC profile using the differential frequency radar reflectivity (DFR) technique does not depend on the assumptions made in single-frequency radar approaches. If gaseous attenuation is accounted for, the measured differential attenuation signal from a pair of radar frequencies is proportional to the amount of liquid water in the shallow cloud if drop size effects are negligible (Lhermitte, 1990). In addition, the signal attenuation due to liquid droplets becomes stronger as the operating frequency increases. While the differential technique is not affected by systematic errors, random measurement errors are inversely proportional to the signal frequency. Both facts suggest the use of high frequencies and large frequency pair separations to measure greater differential attenuation and facilitate the retrieval of small LWC values with improved accuracy (Hogan et al., 2005; Williams and Vivekanandan, 2007). This has been demonstrated over the last few decades, as the LWC retrieval accuracy has progressively improved when higher-frequency radars became available, with the most recent works using Ka-band (35 GHz) and W-band (94 GHz) frequencies (Hogan et al., 2005; Zhu et al., 2019).
G-band radar instruments represent a recently developed capability in atmospheric remote sensing research, offering new possibilities to probe clouds and precipitation and leading to novel measurement techniques (Battaglia et al., 2014, 2020). They have been recently used to profile water vapor content in clouds (Cooper et al., 2021) and to provide novel insight into the submillimeter drop size distribution through Doppler measurements (Courtier et al., 2022; Socuellamos et al., 2024a) and multifrequency radar observations (Lamer et al., 2021; Socuellamos et al., 2024b). The synergy of a G-band and a Ka-band radar brings several distinct advantages to the LWC retrieval compared to the W-band and Ka-band pair: (1) increased differential attenuation for submillimeter drop sizes, (2) reduction in the reflectivity measurement random error, and, consequently, (3) improved sensitivity in the LWC determination.
The US Department of Energy (DOE) Atmospheric Radiation Measurement (ARM) Mobile Facility (AMF) deployment in the context of the Eastern Pacific Cloud Aerosol Precipitation Experiment (EPCAPE; Russell et al., 2021) offered a convenient opportunity to study shallow clouds through the deployment of several instruments at the Scripps Pier in La Jolla, CA, USA. A ground-based prototype radar called CloudCube participated in EPCAPE for a 6-week period in March and April 2023 (Socuellamos et al., 2024b). CloudCube is a multifrequency (Ka-, W-, and G-band) profiling radar developed at the Jet Propulsion Laboratory (JPL) under the National Aeronautics and Space Administration Earth Science Technology Office (NASA-ESTO) Instrument Incubator Program (IIP) that includes a 239 GHz (G-band) Doppler module (Socuellamos et al., 2024a). For the analysis developed in this work, the Ka-band and W-band channels of CloudCube did not have the sensitivity needed to detect the cloud formations of interest. Therefore, we have complemented CloudCube's G-band data with observations from the ARM Ka-band Zenith-pointing Radar (KAZR; Kollias et al., 2016), as well as ceilometer (Morris, 2016), microwave radiometer (Cadeddu, 2024), and radiosonde measurements. Using the Ka-band and G-band DFR observations, more than 100 profiles of LWC, averaged over 60 s, have been retrieved for two cases on 2 different days.
The article starts with a brief description of the radar instruments and the data selected for the analysis (Sect. 2). This is followed in Sect. 3 by an explanation of the methodology developed to retrieve the LWC and a discussion of the results. Section 4 presents a reflectivity-based approach to retrieve the LWC. Vertically integrated LWC is used in Sect. 5 to validate the results against radiometer liquid water path (LWP) measurements. Finally, in Sect. 6 we perform an analysis of the adiabaticity of the retrieved LWC profiles, while Sect. 7 describes the benefits of using G-band frequencies for the LWC retrieval.
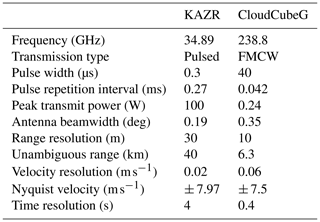
The LWC retrieval described in this article has benefited from the EPCAPE field campaign, which allowed different instruments to gather and operate simultaneously to enhance the scientific outcomes of the proposed research. The KAZR (Kollias et al., 2016) and the CloudCube G-band radar module (Socuellamos et al., 2024a) are the two main instruments used in this study. For simplicity, CloudCube's G-band module will be abbreviated as CloudCubeG in the following. KAZR and CloudCubeG operational parameters during the EPCAPE campaign are described in Table 1.
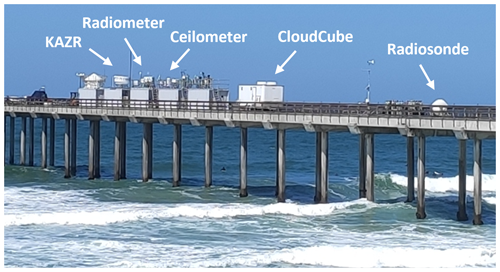
Besides both radars' data, which form the basis for the LWC retrieval, observational data from other instruments have also been used. In particular, we have worked with ceilometer data to identify the cloud base and have made use of microwave radiometer (MWR) measurements to validate our retrieval approach by comparing the integrated LWC, i.e., the liquid water path (LWP), with that derived by the radiometer. Additionally, radiosonde data have also been considered to input vertical profiles of temperature, pressure, and relative humidity into our model and to calculate the gaseous and liquid attenuation experienced by the radar signals. Figure 1 shows a picture of the location of all the instruments while deployed during the EPCAPE field campaign, also including the location from which the radiosondes were released. The distance between them was not larger than a few tens of meters.
We have selected two case studies on 2 different days for the analysis developed in this work. The first case, recorded on 17 April 2023 at 21:19:00 UTC starting time, lasts 100 min, while the second dataset, taken on 25 April 2023 at 13:12:00 UTC starting time, continues for 20 min. The radar data that have been used for the LWC retrieval consist of close to 18 000 and 1800 profiles of observed echo power at G-band and Ka-band, respectively, which have been averaged over 60 s to retrieve 120 LWC profiles. The data correspond to shallow stratocumulus formations with thickness between 120 and 360 m, containing characteristic LWC and LWP amounts smaller than 1 g m−3 and 200 g m−2, respectively. These cases, particularly challenging for the DFR technique, were chosen to demonstrate the advantages of the Ka-band and G-band proposed retrieval.
Numerous sources of uncertainty in the LWC retrieval have been identified related to the use of the dual-frequency radar technique (Williams and Vivekanandan, 2007), including different radar parameters and sampling mismatches between the radars, the presence of ice particles in the cloud volume, potential Mie scattering contamination, and errors in the differential absorption factors used as inputs in the retrieval model.
The KAZR and CloudCubeG operated with different spatiotemporal resolutions as well as different beamwidths, as shown in Table 1. While these mismatches can contribute to the inaccuracy of the LWC retrieval due to cloud inhomogeneity, we have taken various steps to minimize these errors. First, we have integrated CloudCubeG range resolution and interpolated KAZR time resolution to obtain data with a common spatiotemporal gate spacing, resulting in 30 m × 0.4 s range-time-resolution cells. Second, to mitigate possible errors originating from this artificial matching and the beamwidth mismatch, we have averaged the data along different range and time gates, as detailed in Sect. 3.1. Averaging over time and range has been proven to improve the errors due to illumination volume mismatch (Hogan et al., 2005; Williams and Vivekanandan, 2007).
Furthermore, to avoid errors due to the presence of ice particles, the analysis has been focused on full-liquid shallow clouds, identified after studying the radiosonde temperature vertical profile and the G-band radar Doppler spectra. To reduce Mie scattering contamination, we have excluded regions below the cloud base measured by the ceilometer.
Finally, the differential gaseous and liquid absorption parameters needed as inputs for the LWC retrieval have been calculated based on in situ measurements of pressure, temperature, and relative humidity from radiosondes released next to the radars. On 25 April 2023, we have used the data from a radiosonde released 15 min prior to the start of the observation period. For 17 April 2023, the observation did not coincide in time with a sonde release. However, we have compared the data recorded from two sondes that were released about 2 h before and after the selected observation period. The changes in temperature, pressure, and relative humidity between these two sondes were less than 0.5 K, 7 hPa, and 3 %, respectively, giving us confidence that these properties remained relatively stable during the observation period. Even if there had been a variation of 1 K, Hogan et al. (2005), as well as Williams and Vivekanandan (2007), claimed that the propagation error into the LWC retrieval would be smaller than 0.03 g m−3 using a Ka-band and W-band pair of radars and that for more widely spaced frequencies the error would decrease further.
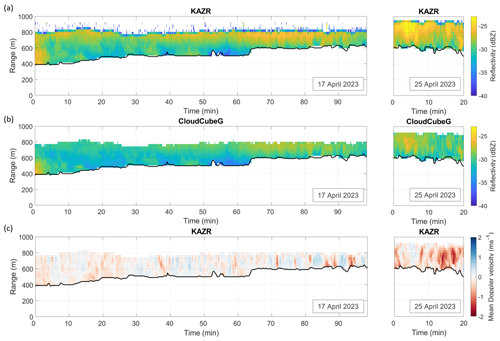
The reflectivity data obtained from KAZR and CloudCubeG as well as the mean Doppler velocity data from KAZR are plotted in Fig. 2. The black line describes the cloud base as measured by the internal ceilometer cloud-base detection algorithm (ceil data product; Morris, 2016) with temporal and range resolutions of 16 s and 30 m, respectively. Pixels below the cloud base have been removed for the analysis. The reflectivity shown in Fig. 2 has been corrected for gaseous attenuation computed following Rosenkranz (1998) using the radiosonde data. It is evident when comparing KAZR and CloudCubeG reflectivity plots that the reflectivity is larger at Ka-band than at G-band and that those differences appear to increase with height above cloud base, which is indicative of the differential attenuation signal used to derive the LWC profile. There is also some evidence for light drizzle sedimentation as observed by the non-monotonic increase in Ka-band reflectivity with height, especially when the cloud is several hundred meters thick. Finally, the Doppler velocity observation shows overturning cells with timescales on the order of 5 to 10 min, with a tendency for the scale of the overturning circulations to shorten as the cloud thickness decreases.
3.1 Dual-frequency reflectivity ratio derivation
The methodology developed in this article closely follows that proposed in Hogan et al. (2005) and later improved in Zhu et al. (2019), where the LWC retrieval can be performed based on the variation of the DFR across the cloud vertical column. This approach, when performed over a fine range resolution, has proven to be challenging, as the measurable DFR change is usually comparable to the uncertainty in the radar reflectivity measurement. One possible solution is to average across a few range gates in the vertical dimension and artificially increase the range resolution so that the DFR between consecutive range gates is increased and the uncertainty reduced. In shallow clouds, however, where the cloud thickness is only a few hundred meters, the procedure entails losing valuable information about the variability of the cloud vertical structure. Therefore, we have kept the 30 m original KAZR and integrated CloudCubeG resolution throughout the analysis. This has been possible thanks to the frequency separation between KAZR and CloudCubeG (the widest differential ever used in this kind of technique), which intensifies the differential attenuation in comparison with more narrowly spaced frequency pairs.
Once most systematic error sources are carefully accounted for, as described in Sect. 2, the main contributor to the uncertainty of the DFR observation is given by the random error of the reflectivity measurements (Hogan et al., 2005). The DFR is simply defined as
where the subscripts K and CCG refer to KAZR and CloudCubeG, respectively. Then, as derived in Hogan et al. (2005), reflectivity uncertainty can be described in terms of the radar parameters as
where c is the speed of light, and f and PRI are the frequency and pulse repetition interval of the radars, respectively, with values given in Table 1. The spectrum width (σw) and the signal-to-noise ratio (SNR) of the radar signal are supplementary observational data. N is the number of range gates averaged. For CloudCubeG, the range resolution has been increased from 10 to 30 m to match that of KAZR and is therefore NCCG=3. Since no further average in range has been performed, NK=1. Similarly, is the number of radar pulses contained within the temporal resolution bin. The temporal resolution of both KAZR and CloudCubeG has been matched at 0.4 s. However, to reduce the random dispersion of the measurements, we set the time step of the data to t = 60 s. This number was selected after carefully analyzing the resulting DFR data for different time steps. While a longer time step reduces the random error, the temporal variability of the LWC retrieval may be affected. A time step of 60 s offered an adequate compromise between eliminating evident incorrect artifacts in the data and keeping a relatively fine temporal resolution. In addition, for the rare cases (less than 1 % of the total data) where the difference between two consecutive DFR range bins was greater than 1 dB, presumably as a consequence of the artificial matching of the range resolutions, we applied a spatial filter that replaced the outlying point by a linear interpolation between the preceding and following bins.
We then calculated the DFR uncertainty as
The DFR, associated uncertainty, and relative uncertainty obtained from the observational data, after applying the pertinent time average and range filter, are presented in Fig. 3. The DFR near the cloud base can be seen to have values close to zero, which are expected under the Rayleigh scattering regime, even though these values might be subject to calibration errors (note that for the LWC retrieval, the technique is based on differential DFRs, where calibration errors cancel out). In addition, a DFR of about 4 dB at the cloud top can be observed at the beginning of the time window on 17 April 2023 and throughout 25 April 2023. Following a simplistic approach, we can assume a linear increase in the DFR within the cloud height. In that case, the expected two-way differential attenuation between the Ka and G-band frequencies is in the vicinity of 0.3 dB per 30 m. For 60 s temporal averaging, this value is larger than the DFR uncertainty error, as can be compared in Fig. 3b. This indicates that the variation of the DFR with range, i.e., DFR(r2)–DFR(r1), as needed for the LWC retrieval, could be estimated with a relative error lower than 25 % for most of the cases. This percentage, however, is still considerable and suggests the use of additional averaging in the next steps of the LWC retrieval.
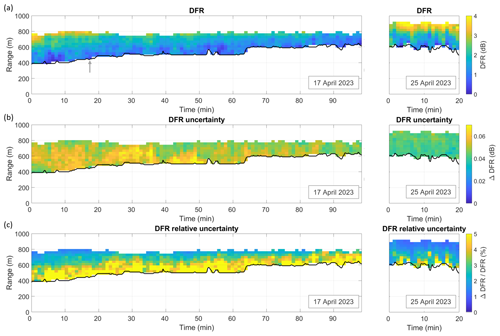
Figure 3(a) Dual-frequency reflectivity ratio, (b) associated uncertainty, and (c) relative uncertainty for the observation periods. The arrow at minute 18 in (a) points at the profile used in Fig. 4.
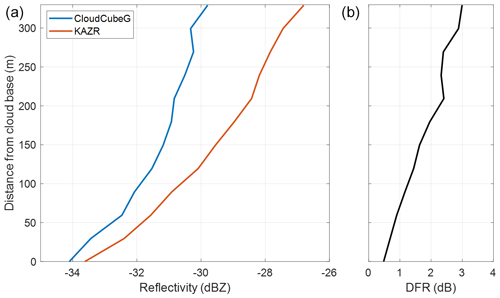
Figure 4Reflectivities for CloudCubeG and KAZR (a) and dual-frequency reflectivity ratio (b) at minute 18 on 17 April 2013.
Figure 4 shows a single DFR profile at minute 18 of the observation period as pointed out in Fig. 3a. Between 210 and 270 m above the cloud base, the DFR has a slightly negative increase, which will translate into a negative LWC value if the differential increase is applied directly to the retrieval methodology. Besides the additional averaging previously mentioned, this complication additionally hints at the use of alternative averaging techniques in the following stage.
3.2 Liquid water content retrieval
The possibility to retrieve the LWC using a dual-frequency radar system was first discussed in Atlas (1954) and a decade later demonstrated in Eccles and Mueller (1971). These early efforts were focused on rain and convective storm events, envisioning that the LWC could be later used to derive the rainfall rate. Nevertheless, the formulation developed therein is equally valid for low-level shallow clouds, such as the ones discussed in this article. If the radar signals are backscattered under the Rayleigh regime, then the signal attenuation is proportional to the amount of liquid water that the signals penetrate. The LWC at any range gate r can thus be written in terms of the variation of the DFR with range as
where Al (in ) and Ag (in dB km−1) are the two-way differential liquid and gaseous absorption coefficients, respectively. Based on radiosonde data, we calculated a temperature-dependent Al following Doviak and Zrnic (1993), and Ag was computed as discussed in Rosenkranz (1998).
The mean LWC in a cloud layer can be calculated by simply replacing the term in Eq. (4) by . However, to improve the accuracy of the retrieval, we followed the approach suggested in Zhu et al. (2019), motivated by studies related to the LWC profile shape (Küchler et al., 2018). We fit a portion of the DFR(r) profile to a second-order polynomial in such a way that follows a linear relationship with range that can be described as 2xr+y, where x and y are the fit parameters. In our case, the short profile of DFR(r) data is composed of six vertically consecutive DFR bins, for a group length of 180 m. Starting from the cloud base, the fit is performed along the full vertical extension of the cloud through consecutive sliding profiles that progressively increase the starting height by one range gate. When the starting bin for the profile approaches the cloud top and six data points are no longer available, the group length is progressively reduced until a minimum of 90 m or three range gates. Similarly, if the cloud thickness at a given time is shallower than 180 m, the number of bins to group and the fit to perform are adapted accordingly.
Due to the progressive nature of the DFR fitting technique, different numbers of short LWC profiles are generated depending on the range position. When more than one LWC profile is available at one range gate, these profiles are averaged to obtain a more accurate LWC. As an example, the first DFR bin at cloud base is only used to derive one LWC profile. The second DFR bin immediately after the cloud base serves as the second data point for the LWC profile starting at cloud base and also as the first data point for the LWC profile starting one range gate after. Therefore, the LWC value at the second range gate is obtained after averaging two LWC short profiles. This compounding effect continues until the group length is achieved and the number of short LWC profiles to average equals that of the number of range gates that form the group.
While this procedure assumes a linear DFR profile shape with height to perform the fit, the fact that the LWC is retrieved after averaging different LWC short profiles that start at consecutive range gates allows for the consideration of the vertical variability of the LWC. The choice of grouping six range gates has been determined to not compromise the vertical changes in the LWC. In addition, longer groups had little additional impact on the LWC retrieval accuracy. This range length is similar to the optimal length of 187.5 m determined in Zhu et al. (2019).
Hogan et al. (2005) provide an expression to estimate the LWC uncertainty in terms of the DFR random error and the range resolution, δr. We have adapted the equation to include the number of short LWC profiles averaged (n), which improves the accuracy of the final retrieved LWC by , also accounting for the autocorrelation among the distinct LWC short profiles, as
This expression is provided in Hogan et al. (2005) for mean retrievals within a cloud layer and does not consider the additional reduction in the uncertainty due to the fitting technique performed in this work. However, Zhu et al. (2019) estimate based on simulations that the improvement in the LWC accuracy due to the fitting technique could further reduce the uncertainty by a factor of 2.
The resulting LWC, uncertainty, and relative uncertainty profiles after completion of the retrieval procedure are shown in Fig. 5 for the observation period. As expected, since the number of short LWC profiles averaged is lower at the cloud base, the uncertainty and relative uncertainty are greatest there. Then they progressively improve towards the cloud interior, where more averages are performed. We can also see that there are negative LWC values shown in Fig. 5a (which are not physically correct). These values, however, are mostly located near the cloud base, precisely where the uncertainty is greater. In addition, more than 95 % of the negative numbers can become positive within the uncertainty limits. This was one of the criteria that led us to choose the temporal average of 60 s. If the average time is increased to 240 s, the negative values vanish entirely.
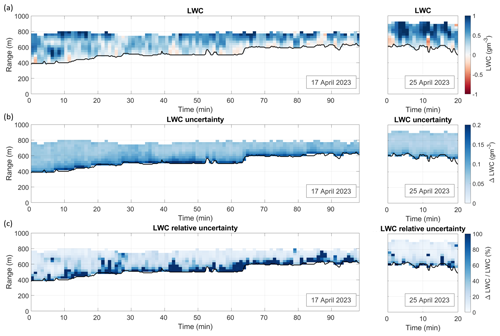
Figure 5(a) Retrieved liquid water content, (b) associated uncertainty, and (c) relative uncertainty for the duration of the observations on 17 and 25 April 2023.
At the cloud base, the maximum uncertainty found is 0.22 g m−3. At the cloud interior, the uncertainty gets as low as 0.05 g m−3. These numbers show that very small amounts of liquid water can be accurately determined deeper into the cloud boundaries from combining a Ka-band and G-band radar. Moreover, they show a substantial improvement compared to the previous limits found in Zhu et al. (2019) of 0.10–0.65 g m−3 using a Ka-band and W-band radar system.
In single-frequency radar systems, the LWC has traditionally been retrieved using an empirical relationship with the radar reflectivity. These relationships provide a straightforward approach to estimate the LWC and can also serve as a point of comparison for different techniques. Assuming a lognormal distribution of the drop population, this relationship is typically of the form LWC=aZb, where Z is the radar reflectivity in linear units and a and b are parameters that describe the drop size distribution (DSD) in terms of the total drop concentration, No, and the distribution width, σ (Atlas, 1954; Sauvegeout and Omar, 1987; Fox and Illingworth, 1997; Miles et al., 2000; Matrosov et al., 2004). Using a Ka-band radar, the coefficients a and b have been discussed to be a=2.4 (for maritime clouds) or a=4.6 (for continental clouds) and b=0.5 (Miles et al., 2000; Matrosov et al., 2004). The values derived in Atlas (1954), Sauvegeout and Omar (1987), and Fox and Illingworth (1997) provide similar results and have not been included in this analysis for simplicity.
Figure 6 shows the correspondence between KAZR and CloudCube reflectivity values with the retrieved LWC. A clear trend can be deduced, where the LWC increases for greater values of observed reflectivity. In addition, Fig. 6a includes the empirical curves for the two cases in Miles et al. (2000), which show a large systematic low bias of the reflectivity-based approach compared with the values retrieved from the DFR.
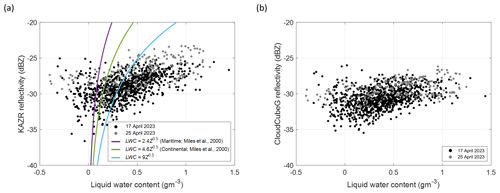
Figure 6Comparison of the retrieved liquid water content with (a) KAZR and (b) CloudCube reflectivities. Panel (a) includes the reflectivity-based empirical relationships from Miles et al. (2000) (purple and green lines) and Eq. (6) (light blue line).
While the parameter b is usually assumed to be constant and independent of the DSD characteristics, a can adopt a relatively broad range of values depending on No and σ. Using b=0.5 (as in Atlas, 1954, and Miles et al., 2000), , where ρ is the liquid water density (Matrosov et al., 2004). In Miles et al. (2000), the drop concentration was found to be 75 cm−3 for maritime clouds and 280 cm−3 for continental clouds, while the distribution width was 0.38 for both cases. A plausible explanation for the discrepancy between the retrieved LWC and the empirical curves may come from the fact that the cloud selected in our observation is formed by a high number of droplets of similar small sizes. This characteristic is typical of continental clouds, which can have drop concentrations close to 1000 cm−3 and narrower distribution widths (Squires, 1958; Sassen et al., 1999). Furthermore, recent analysis has shown that observed drop distributions narrow substantially as drop concentration increases (Lebsock and Witte, 2023), which was confirmed in a cloud chamber (Chandrakar et al., 2016). This natural correlation will tend to amplify the dependance of the parameter a on the droplet number concentration.
Figure 7 shows the possible range of values that the parameter a can cover for different drop concentrations and distribution widths. The parameter a approaches values of 16 for realistic concentrations of 1000 cm−3 with σ < 0.2.
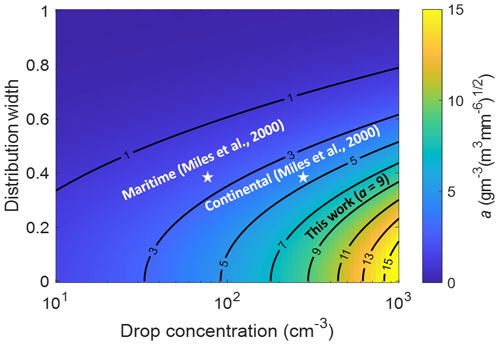
Figure 7Values for the parameter a in LWC=aZb for different drop concentrations and distribution widths.
Figure 8 shows the cloud droplet number concentration derived from the Moderate Resolution Imaging Spectroradiometer (MODIS) aboard the AQUA satellite during two overpasses at approximately 20:30:00 UTC on 17 and 25 April 2023. The cloud optical depth and effective radius derived from the 3.7 µm channel are used in the derivation following the approach described in Grosvenor et al. (2018). As seen in Fig. 8, drop concentrations were close to or higher than 300 cm−3 near the observation site for both days. Based on this information, even if the overpasses did not coincide in time with the radar measurements, we assume that droplet concentrations could have exceeded 300 cm−3 during our observation windows. For a combination of No > 300 cm−3 and σ < 0.35, a can become greater than 9. Taking this value as a reference, we can provide a new relationship for the reflectivity-based LWC retrieval:
The curve obtained by Eq. (6) is also included in Fig. 6a. This relationship provides a better fit with the retrieved LWC, which suggests that the reflectivity-based approach can provide a complementary result to the DFR technique and potentially constrain the drop concentration in addition to the LWC.
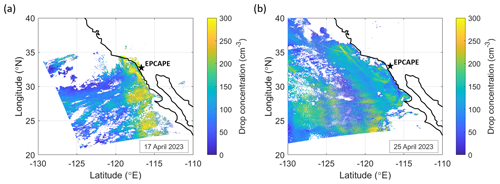
Figure 8Drop concentration over the EPCAPE site at approximately 20:30:00 UTC on (a) 17 April 2023 and (b) 25 April 2023.
An alternative method to account for the radar attenuation is based on the Hitschfeld and Bordan (1954) scheme, where the reflectivity would be corrected at each range gate prior to computing the LWC from a reflectivity-based relationship. For a range resolution of 30 m and LWC smaller than 1 g m−3, the attenuation by cloud liquid water at Ka-band is expected to be on the order of 0.01 dB per range gate as computed using ITU (2023). Even over the depth of a 300 m cloud, the cumulative attenuation at Ka-band would be on the order of 0.1 dB. Therefore, the reflectivity-based retrieval is not significantly affected by attenuation in this particular scene.
During the observation periods, a microwave radiometer (MWR) at the EPCAPE site recorded the liquid water path (LWP) among other environmental parameters (mwr3c data product; Cadeddu, 2024). The LWP retrieved by the radiometer has been used to validate the LWC retrieval technique by integrating the LWC across the cloud height.
Figure 9a shows the comparison between the radiometer and the radar-retrieved LWPs. In addition, we have included the adiabatic LWP, calculated assuming a linear increase in the LWC with range, as explained in Sect. 6. We have also added the LWP following the empirical relationships between the LWC and KAZR reflectivity, as discussed in Sect. 4. All LWP curves have been averaged over 60 s to match the time resolution of the radar LWP. The radar-reflectivity-based retrievals based on Miles et al. (2000) are again observed to be clear outliers here, with a systematic underestimate of the LWP relative to all other methods. On the other hand, the LWP calculated following Eq. (6) shows excellent correlation with the MWR retrieval. The estimated uncertainty in the MWR-derived LWP is 15 g m−2 (Cadeddu et al., 2020), while the estimated retrieval uncertainty of the DFR LWP is on the order of 10 g m−2. On 17 April 2023, the temporal trend of the radiometer LWP is well represented by the DFR retrieval, matching the progressive temporal decline of the LWP associated with a shallower cloud towards the end of the observation. Also on the same day, for both the DFR- and radiometer-retrieved LWP, the values are generally below the adiabatic curve for approximately the first 65 s of the observation window. Towards the end of the recording period, after 65 s, where the cloud becomes shallower, all three curves tend to match. This is an indication that the thermodynamic behavior of the cloud may be related to its thickness and is consistent with the observation that the thicker a cloud becomes, the greater its subadiabaticity (Albrecht et al., 1990; Rauber et al., 2007). A comprehensive analysis of the LWC and LWP adiabaticity is performed in Sect. 6.
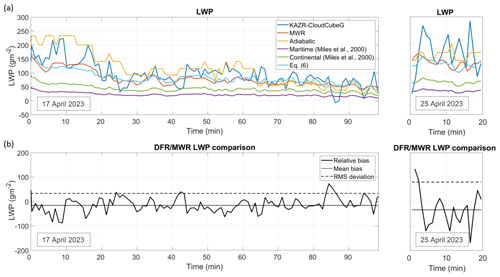
Figure 9(a) Retrieved liquid water path (LWP) from KAZR and CloudCubeG as well as from the microwave radiometer (MWR), along with the adiabatic LWP and empirical LWP relationships. (b) Comparison between the dual-radar system and the MWR-retrieved LWPs, including the relative bias, the mean bias, and the rms deviation.
Figure 9b shows a more detailed comparison of the KAZR–CloudCubeG DFR and the MWR-retrieved LWPs. Overall, the relative bias between the two retrievals shows large variability along both observation periods. The mean bias, represented as a dotted line in Fig. 9b, is −15.9 g m−2 on 17 April 2023 and −33.5 g m−2 on 25 April 2023, which indicates that the KAZR–CloudCubeG-retrieved LWP is, on average, greater than that retrieved by the MWR. This relatively low mean error suggests that a comparison with more temporal averaging will progressively improve the agreement between the two retrievals. The root mean square (rms) deviation, plotted with a dashed line in Fig. 9b, is 33.3 g m−2 on 17 April 2023 and 79.9 g m−2 on 25 April 2023, which are larger than what can be explained by the analytic uncertainty estimates in the radar (10 g m−2) and radiometer (15 g m−2) uncertainties. Given the disperse variability in the sign of the relative bias and the relatively large rms error, we speculate that there are random sources of uncertainty in the radar retrieval which have not been accounted for. Two likely causes could be radar–volume mismatches or an unidentified influence of drizzle drops on the DFR. However, following a similar validation approach, Hogan et al. (2005) compared the retrieved LWP from a Ka-band and W-band radar system with that from collocated MWRs. For similar amounts of LWP and the same time average as in this work, they found the rms deviation to be 40 and 70 g m−2 for two different cases and radar systems. While the Ka-band and W-band radars in Hogan et al. (2005) had different beamwidths, as with the KAZR and CloudCubeG here, the radars in that study were operated with the same range resolution. Furthermore, profiles with Mie scattering were identified, corresponding to differential Doppler velocities greater than 0.1 m s−1, and excluded from the analysis, which suggests minimal Mie scattering contamination. This speaks for the greater accuracy of the LWC retrieval using a Ka-band and G-band radar system. Even if radar–volume mismatches and Mie scattering contamination may be happening, the rms deviation shows similar agreement between the KAZR–CloudCubeG DFR and the MWR-retrieved LWPs compared to that reported in Hogan et al. (2005). If in future deployments better care was taken to match the volume sampling of the CloudCubeG and KAZR instruments, we suspect that a significant fraction of the unresolved scatter between the radiometer and the DFR retrieval would be eliminated.
To assess the thermodynamic behavior of the shallow cloud, we can compare the linearity of the LWC retrieval to the adiabatic case where the LWC increases linearly with range. In that scenario, the change in the adiabatic liquid water content, LWCad, is driven by the adiabatic lapse rate, Γad, as LWCad(r)=Γadr. Then the ratio between the retrieved LWC and the adiabatic LWCad describes the adiabatic behavior of the particular cloud layer analyzed, which is defined through the degree of adiabaticity, fad. There are three possibilities: (1) if fad=1, the LWC in the cloud parcel is exactly the same as if lifted adiabatically within the cloud range step, and therefore there is no exchange of energy with the environment; (2) if fad<1, the LWC is subadiabatic, indicating than the cloud layer is losing liquid water due to either mixing of warm dry air or sedimentation of drops; and (3) if fad>1, the LWC is superadiabatic, which can plausibly only be explained by sedimentation of small drizzle drops from above. The degree of adiabaticity is often summarized as a layer mean quantity. In such a case, the LWC is replaced by the LWP, and the degree of adiabaticity is equivalently defined as
To compute Γad, we followed Albrecht et al. (1990), using the temperature, pressure, and humidity measurements of the released radiosondes. Γad was found to have an average value of 2.85 g m−3km−1 within the cloud volumes on both days.
Figure 10 shows the LWC and the LWCad for the different cloud thicknesses measured along the observation period, which range from 120 to 360 m in steps of 30 m. For this representation, we took all the retrieved 60 s profiles that had the same cloud thickness and averaged them. We have also included the standard deviation of the averaged LWC profiles as shaded areas in Fig. 10. For all the cases except the one corresponding to 300 m on 17 April 2023, more than eight profiles were available. The first value at cloud base of the retrieved LWC curves was found, on average, to be biased high by approximately 0.1 g m−3, which could correspond to the LWP bias observed in Sect. 5. For a better visual comparison, we have shifted the retrieved LWC profiles in Fig. 10 so that they start exactly at 0 g m−3. This shift has not been applied to compute fad.
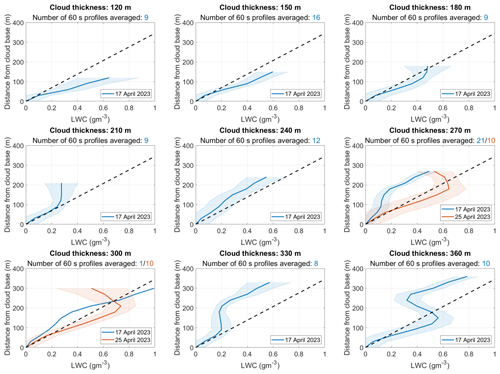
Figure 10Comparison between the retrieved liquid water content (LWC) on 17 April 2023 (blue) and 25 April 2023 (orange) for different cloud thickness (solid line) and the adiabatic LWC (dashed line). The shaded areas correspond to the standard deviation of the averaged LWC profiles.
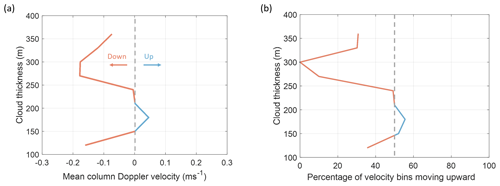
The degree of adiabaticity based on the LWPs is studied separately in Fig. 11. On 17 April 2023, fad is greater than 1 for clouds shallower than 200 m even within the uncertainty limits, manifesting a superadiabatic behavior of such clouds. While the uncertainty in the LWC retrieval is larger for shallower cloud sections, which may impact this outcome, this feature agrees with the results reported in Zhu et al. (2019) and has been speculated to be associated with lateral detrainment of cloud water from nearby convective elements (Miller et al., 1998). This analysis is supported by Fig. 12, which shows the mean column Doppler velocity and the predominant direction of the cloud profiles for the different cloud thicknesses on 17 April 2023. With the exception of the shallowest cloud section, which has the greatest uncertainty, the superadiabatic behavior is correlated with vertical updrafts, where the mixing of lifted air with humid air near the cloud top may be inducing the sedimentation of cloud droplets. On the other hand, clouds thicker than 200 m show subadiabatic behavior and negative Doppler velocity, suggesting that they sustain more acute mixing with a drier environment, presumably due to the evaporation of liquid water towards the cloud top or the loss of cloud water due to coalescence and sedimentation processes.
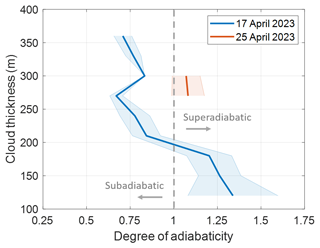
Figure 11Degree of adiabaticity (solid line) and standard deviation (shaded area) as a function of the cloud thickness on 17 April 2023 (blue) and on 25 April 2023 (orange).
As described throughout the previous sections, the use of CloudCube's 239 GHz radar has allowed us, to the best of our knowledge, to retrieve the LWC with improved accuracy in comparison to any other results reported in the literature. This is a direct product of the smaller random error in the reflectivity measurement and the use of a complementary lower-frequency radar, with more than 200 GHz of separation between the two frequencies of operation, that provides increased differential attenuation. To quantify the benefits of using a higher-frequency radar at G-band, we have theoretically compared the LWC uncertainty to a pair of radars where the lower-frequency one operates at either 35 or 94 GHz. To perform this analysis, we have used Eq. (5), keeping the same radar parameters for all the cases and only sweeping the frequency of operation. By taking a closer look at Eq. (5), we can infer that only the random error in the differential frequency reflectivity ratio, ΔDFR, and the differential liquid attenuation, Al, are frequency-dependent parameters. These are precisely the two parameters that will eventually change the LWC retrieval accuracy based on the operating frequency of the radars. To understand their behavior, Fig. 13 shows their relative improvement (meaning a decrease in ΔDFR and an increase in Al) with respect to the Ka-band and W-band pair for the two scenarios previously mentioned.
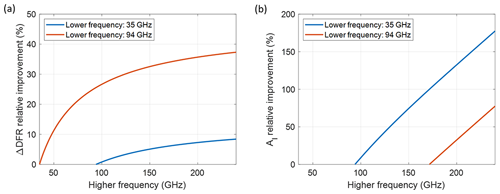
Figure 13Relative improvement in the (a) dual-frequency ratio uncertainty (ΔDFR) and (b) the differential liquid attenuation (Al) with respect to the Ka-band and W-band pair for two scenarios: when the higher-frequency radar is complemented with a radar at 35 GHz (blue line) or at 94 GHz (orange line).
These two parameters have an opposite effect depending on the lower radar frequency. The relative improvement of the DFR random error is greater if the lower radar frequency is 94 GHz. For the case where the higher-frequency radar operates at 239 GHz, as in this work, pairing with a 35 GHz radar offers an improvement of 8 %, while ΔDFR drops by 37 % if it is combined with a 94 GHz radar. This can be understood by bearing in mind that, for the same radar parameters, the lower frequency possesses a greater reflectivity random error that dominates the ΔDFR term (see Eq. 3). On the other hand, the differential attenuation between 35 and 239 GHz offers a substantial increase in comparison with the 35 and 94 GHz or 94 and 239 GHz pairs. In particular, the improvement in Al is about 175 % or 2.75 times with the former and about 60 % or 1.6 times with the latter.
While the use of a higher-frequency radar at 239 GHz clearly offers an improvement in the LWC retrieval accuracy with regard to the 35 and 94 GHz radar system, whether combining it with a lower-frequency radar at 35 or 94 GHz depends on how ΔDFR and Al modify the LWC uncertainty. The results for the LWC after introducing the variation shown in Fig. 13 are presented in Fig. 14. For any of the lower-frequency radars, the LWC retrieval accuracy is always substantially improved if the higher-frequency radar is at 239 GHz compared to the 35 and 94 GHz radar pair. Interestingly, both curves tend to meet as the higher frequency is increased. At 239 GHz, the relative improvement for both cases is around 65 %, meaning that the LWC can be theoretically retrieved to values 3 times smaller in comparison to the Ka-band and W-band radars.
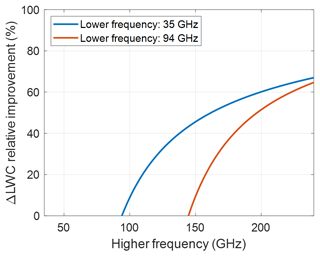
Figure 14Relative improvement in the liquid water content (LWC) retrieval accuracy with respect to the Ka-band and W-band pair for two scenarios: when the higher-frequency radar is complemented with a radar at 35 GHz (blue line) or at 94 GHz (orange line).
The proximity of both curves at 239 GHz also indicates that simultaneously retrieving the LWC from a triple-frequency radar system can be beneficial for the LWC retrieval. The Ka-band and W-band pair could be used at regions where the G-band signal suffers from Mie scattering, while combining Ka-band and G-band as well as W-band and G-band in Rayleigh scattering locations would provide two independent retrievals that could potentially improve the accuracy by a factor of . Furthermore, the triple-frequency system can be used to identify Mie scattering regions if Doppler is not available and to facilitate the removal of biases and isolate sporadic instrument artifacts.
Shallow warm clouds have extensive areal coverage over the tropical and subtropical oceans, and their strong radiative effects make them an important contributor to Earth's energy balance and hydrological cycle. The vertical profile of the liquid water content (LWC) in these warm clouds is key to better understanding their radiative properties, their ability to precipitate, and entrainment and mixing with free-tropospheric air.
Single- and dual-frequency radar techniques have been previously used to estimate the vertical profile of LWC in these shallow cloud systems. Single-frequency algorithms suffer from assumptions regarding the presence or absence of drizzle particles, while dual-frequency algorithms with radar frequencies up to W-band do not have the sensitivity needed to capture the fine structure of the LWC. The dual-frequency radar retrieval accuracy is intrinsically related to the frequencies of operation of the radar system, where higher frequencies contribute to reducing the measurement error and increasing the liquid water attenuation, then leading to more accurate retrievals. We have demonstrated in Sect. 3.2 that the synergy between a 35 and a 239 GHz radar offers distinct advantages to the LWC retrieval accuracy in comparison to a 35 and a 94 GHz radar, eventually allowing measurements of 3 times smaller liquid water amounts to LWC values as low as 0.05 g m−3 in the inner cloud structure and 0.22 g m−3 at the cloud base.
We have accomplished this by deploying the unique 239 GHz radar module of the CloudCube ground-based prototype instrument during the EPCAPE field campaign and taking advantage of simultaneous observations of the 35 GHz KAZR and a variety of additional instruments. In total, the analysis included 2 different days and more than 100 profiles of shallow clouds with typical amounts of LWC and liquid water path (LWP) smaller than 1 g m−3 and 200 g m−2, respectively, that were selected to demonstrate the benefits of the proposed technique in a particularly challenging scenario. After deriving the dual-frequency reflectivity ratio for a 60 s average time to reduce artifacts and errors, we retrieved the LWC across the cloud thickness after averaging a series of sliding and overlapping LWC short profiles. The dual-frequency radar reflectivity (DFR) technique was able to capture the vertical variability of the LWC, as demonstrated by the comparison of the LWC profiles for different cloud thicknesses with their adiabatic behavior. We found that clouds shallower than 200 m tend to be in a superadiabatic state, while clouds deeper than 200 m behave subadiabatically. On the other hand, we showed how a complementary reflectivity-based retrieval can be useful to constrain the cloud droplet concentration number in addition to the LWC. We compared the retrieved LWP to that measured by the collocated microwave radiometer (MWR). While the direct comparison of 60 s data points showed large variability, the consideration of the mean LWPs showed improved agreement, suggesting that longer average times would lead to better agreement although negatively affecting the temporal variability of the retrieval. The rms difference between the MWR- and DFR-derived LWP was 33 and 79 g m−2 for the 2 observation days, which is a few times larger than can be explained by the analytic uncertainty estimates in either retrieval. We speculate that small differences in the sample volume between the G-band and Ka-band radars are the root cause of this residual uncertainty and recommend more attention be paid to matching the radar sample volumes in future studies.
The development of G-band radars that are sensitive to smaller characteristic drop sizes is offering new possibilities within the atmospheric remote sensing field. We have proven that G-band radars are a valuable instrument for the LWC retrieval that, when complemented with a Ka-band or a W-band radar, can potentially determine very small amounts of liquid water content in low-level shallow clouds. These results can be useful to better understand the vertical structure of shallow clouds and how they interact with the surrounding atmosphere.
Future work will be devoted to testing, improving, and validating the results retrieved in this work. KAZR and CloudCubeG will be participating in the Cloud and Precipitation Experiment at Kennaook (CAPE-k), where close to 1 year of data will be available by the end of 2025. For CAPE-k, KAZR and CloudCubeG will be accompanied by the W-band ARM Cloud Radar (WACR), and we will exploit the availability of a triple-frequency radar system to benefit the LWC retrieval as described in Sect. 7. Finally, we intend to compare the results against a radiometer and single-frequency radar joint retrieval, as combining the radiometric observation of total optical depth with the radar capability of profiling can also be used to constrain the cloud LWC.
All datasets can be acquired online in the following references. CloudCube: Socuellamos et al. (2024c, https://doi.org/10.5281/zenodo.11043877). KAZR: Feng et al. (2024, https://doi.org/10.5439/1498936). Ceilometer: Zhang et al. (2024, https://doi.org/10.5439/1181954). Radiometer: Cadeddu et al. (2024, https://doi.org/10.5439/1025248). Radiosonde: Jensen et al. (2024, https://doi.org/10.5439/1350631).
MDL coordinated CloudCube's participation in EPCAPE. RRM managed CloudCube development. RRM, KBC, and JMS designed and built CloudCube's G-band radar. JMS, RRM, MDL, and KBC collectively contributed to preparing, installing, and operating CloudCube for and during EPCAPE. JMS processed CloudCube data. JMS and MDL developed the retrieval algorithm. PK provided guidance in the interpretation of the results. JMS composed the manuscript with contributions from the rest of the authors.
At least one of the (co-)authors is a member of the editorial board of Atmospheric Measurement Techniques. The peer-review process was guided by an independent editor, and the authors also have no other competing interests to declare.
Publisher's note: Copernicus Publications remains neutral with regard to jurisdictional claims made in the text, published maps, institutional affiliations, or any other geographical representation in this paper. While Copernicus Publications makes every effort to include appropriate place names, the final responsibility lies with the authors.
The authors acknowledge the financial support of the National Aeronautics and Space Administration Earth Science Technology Office (NASA ESTO). KAZR, ceilometer, radiometer, and radiosonde data were obtained from the Atmospheric Radiation Measurement (ARM) user facility, a US Department of Energy (DOE) Office of Science user facility managed by the Biological and Environmental Research Program.
This research was supported by the National Aeronautics and Space Administration Earth Science Technology Office (NASA ESTO) under the Instrument Incubator Program and carried out at the Jet Propulsion Laboratory, California Institute of Technology, under a contract with NASA (80NM0018D0004).
This paper was edited by Leonie von Terzi and reviewed by two anonymous referees.
Albrecht, B. A., Fairall, C. W., Thomson, D. W., and White, A. B.: Surface-based Remote Sensing of the Observed and the Adiabatic Liquid Water Content of Stratocumulus Clouds, Geophys. Res. Lett., 17, 89–92, https://doi.org/10.1029/GL017i001p00089, 1990.
Atlas, D.: The Estimation of Cloud Parameters by Radar, Atmos. Sci., 11, 309–317, https://doi.org/10.1175/1520-0469(1954)011<309:TEOCPB>2.0.CO;2, 1954.
Battaglia, A., Westbrook, C. D., Kneifel, S., Kollias, P., Humpage, N., Löhnert, U., Tyynelä, J., and Petty, G. W.: G band atmospheric radars: new frontiers in cloud physics, Atmos. Meas. Tech., 7, 1527–1546, https://doi.org/10.5194/amt-7-1527-2014, 2014.
Battaglia, A., Kollias, P., Dhillon, R., Roy, R., Tanelli, S., Lamer, K., Grecu, M., Lebsock, M., Watters, D., Mroz, K., Heymsfield, G., Li, L., and Furukawa, K.: Spaceborne cloud and precipitation radars: status, challenges, and ways forward, Rev. Geophys., 58, e2019RG000686, https://doi.org/10.1029/2019rg000686, 2020.
Bony, S. and Dufresne, J.: Marine boundary layer clouds at the heart of tropical cloud feedback uncertainties in climate models, Geophys. Res. Lett., 32, L20806, https://doi.org/10.1029/2005GL023851, 2005.
Brient, F., Schneider, T., Tan, Z., Bony, S., Qu, X., and Hall, A.: Shallowness of tropical low clouds as a predictor of climate models' response to warming, Clim. Dynam., 47, 433–449, https://doi.org/10.1007/s00382-015-2846-0, 2016.
Cadeddu, M., Gibler, G., Koontz, A., and Tuftedal, M.: Microwave Radiometer, 3 Channel (MWR3C), Atmospheric Radiation Measurement (ARM) User Facility [data set], https://doi.org/10.5439/1025248, 2024.
Cadeddu, M. P.: Microwave Radiometer – 3-Channel (MWR3C) Instrument Handbook, U. S. Department of Energy, Atmospheric Radiation Measurement user facility, Richland, Washington, DOE/SC-ARM-TR-300, https://www.arm.gov/publications/tech_reports/handbooks/doe-sc-arm-tr-300.pdf (last access: 13 September 2024), 2024.
Cadeddu, M. P., Ghate, V. P., and Mech, M.: Ground-based observations of cloud and drizzle liquid water path in stratocumulus clouds, Atmos. Meas. Tech., 13, 1485–1499, https://doi.org/10.5194/amt-13-1485-2020, 2020.
Chandrakar, K. K., Cantrell, W., Chang, K., Ciochetto, D., Niedermeier, D., Ovchinnikov, M., Shaw, R. A., and Yang, F.: Aerosol indirect effect from turbulence-induced broadening of cloud–droplet size distributions, P. Natl. Acad. Sci. USA, 113, 14243–14248, https://doi.org/10.1073/pnas.1612686113, 2016.
Cooper, K. B., Roy, R. J, Dengler, R., Rodriguez Monje, R., Alonso-Delpino, M., Siles, J. V., Yurduseven, O., Parashare, C., Millan, L., and Lebsock, M.: G-Band Radar for Humidity and Cloud Remote Sensing, IEEE T. Geosci. Remote, 59, 1106–1117, https://doi.org/10.1109/TGRS.2020.2995325, 2021.
Courtier, B. M., Battaglia, A., Huggard, P. G., Westbrook, C., Mroz, K., Dhillon, R. S., Walden, C. J., Howells, G., Wang, H., Ellison, B. N., Reeves, R., Robertson, D. A., and Wylde, R. J.: First Observations of G-band Radar Doppler Spectra, Geophys. Res. Lett., 49, e2021GL096475, https://doi.org/10.1029/2021GL096475, 2022.
Doviak, R. and Zrnic, D.: Doppler radar and weather observations academic, Academic Press, San Diego, CA, ISBN 978-0-12-221422-6, 1993.
Ebell, K., Lohnert, U., Crewell, S., and Turner, D. D.: On characterizing the error in a remotely sensed liquid water content profile, Atmos. Res., 98, 57–68, https://doi.org/10.1016/j.atmosres.2010.06.002, 2010.
Eccles, P. J. and Mueller, E. A.: X-band attenuation and liquid water content estimation by a dual-wavelength radar, J. Appl. Meteorol. Clim., 10, 1252–1259, https://doi.org/10.1175/1520-0450(1971)010<1252:XBAALW>2.0.CO;2, 1971.
Ellis, S. M. and Vivekanandan, J.: Liquid water content estimates using simultaneous S and Ka band radar measurements, Radio Sci., 46, RS2021, https://doi.org/10.1029/2010RS004361, 2011.
Fast, J. D., Berg, L. K., Alexander, L., Bell, D., D'Ambro, E., Hubbe, J., Kuang, C., Liu, J., Long, C., Matthews, A., Mei, F., Newsom, R., Pekour., Pinterich, T., Schmid, B., Schobesberger, S., Shilling, J., Smith, J. N., Springston, S., Suski, K., Thornton, J. A., Tomlinson, J., Wang, J., Xiao, H., and Zelenyuk, A.: Overview of the HI-SCALE Field Campaign: A New Perspective on Shallow Convective Clouds, B. Am. Meteorol. Soc., 100, 821–840, https://doi.org/10.1175/BAMS-D-18-0030.1, 2019.
Feng, Y.-C., Lindenmaier, I., Johnson, K., Matthews, A., Wendler, T., Melo de Castro, V., Deng, M., and Rocque, M.: Ka ARM Zenith Radar (KAZRCFRGE), Atmospheric Radiation Measurement (ARM) User Facility [data set], https://doi.org/10.5439/1498936, 2024.
Fox, N. I. and Illingworth A. J.: The retrieval of stratocumulus cloud properties by ground-based cloud radar, J. Appl. Meteorol. Clim., 36, 485–492, https://doi.org/10.1175/1520-0450(1997)036<485:TROSCP>2.0.CO;2, 1997.
Frisch, A., Feingold, G., Fairall, C., Uttal, T., and Snider, J.: On cloud radar and microwave radiometer measurements of stratus cloud liquid water profiles, J. Geophys. Res., 103, 195–197, https://doi.org/10.1029/98JD01827, 1998.
Grosvenor, D. P., Sourdeval, O., Zuidema, P., Ackerman, A., Alexandrov, M. D., Bennartz, R., Boers, R., Cairns, B., Chiu, J. C., Christensen, M., Deneke, H., Diamond, M., Feingold, G., Fridlind, A., Hünerbein, A., Knist, C., Kollias, P., Marshak, A., McCoy, D., Merk, D., Painemal, D., Rausch, J., Rosenfeld, D., Russchenberg, H., Seifert, P., Sinclair, K., Stier, P., van Diedenhoven, B., Wendisch, M., Werner, F., Wood, R., Zhang, Z., and Quaas, J.: Remote Sensing of Droplet Number Concentration in Warm Clouds: A Review of the Current State of Knowledge and Perspectives, Rev. Geophys., 56, 409–453, https://doi.org/10.1029/2017rg000593, 2018.
Hitschfeld, W. and Bordan, J.: Errors inherent in the radar measurement of rainfall at attenuating wavelengths, J. Atmos. Sci., 11, 58–67, https://doi.org/10.1175/1520-0469(1954)011<0058:EIITRM>2.0.CO;2, 1954.
Hogan, R. J., Gaussiat, N., and Illingworth, A. J.: Stratocumulus liquid water content from dual-wavelength radar, J. Atmos. Ocean. Tech., 22, 1207–1218, https://doi.org/10.1175/JTECH1768.1, 2005.
Illingworth, A., Hogan, R., O'connor, E., Bouniol, D., Brooks, M., Delanoe, J., Donovan, D. P., Eastment, J. D., Gaussiat, N., Goddard, W. F., Haeffelin, M., Klein, H., Krasnov, O. A., Pelon, J., Piriou, J., Protat, A., Russcheberg, H. W. J., Seifert, A., Tompkins, A. M., van Zadelhoff, G. J., Vinit, F., Willen, U., Wilson, D. R., and Wrench, C. L.: Cloudnet: Continuous evaluation of cloud profiles in seven operational models using ground-based observations, B. Am. Meteorol. Soc., 88, 883–898, https://doi.org/10.1175/BAMS-88-6-883, 2007.
ITU (International Communication Union): ITU-R P.840-9 Recommendation: Attenuation due to clouds and fog, ITUPublications, https://www.itu.int/dms_pubrec/itu-r/rec/p/R-REC-P.840-9-202308-I!!PDF-E.pdf (last access: 30 September 2024), 2023.
Jensen, M., Giangrande, S., Fairless, T., and Zhou, A.: Gridded Sonde VAP Product (GRIDDEDSONDE), Atmospheric Radiation Measurement (ARM) User Facility [data set], https://doi.org/10.5439/1350631, 2024.
Kollias, P., Clothiaux, E. E., Ackerman, T. P., Albrecht, B. A., Widener, K. B., Moran, K. P., Luke, E. P., Johnson, K. L., Bharadwaj, N., and Mead, J. B.: Development and applications of ARM millimeter-wavelength cloud radars, Meteor. Mon., 57, 17.11–17.19, 2016.
Küchler, N., Kneifel, S., Kollias, P., & Löhnert, U.: Revisiting liquid water content retrievals in warm stratified clouds: The modified Frisch, Geophys. Res. Lett., 45, 9323–9330, https://doi.org/10.1029/2018GL079845, 2018.
Lamer, K., Oue, M., Battaglia, A., Roy, R. J., Cooper, K. B., Dhillon, R., and Kollias, P.: Multifrequency radar observations of clouds and precipitation including the G-band, Atmos. Meas. Tech., 14, 3615–3629, https://doi.org/10.5194/amt-14-3615-2021, 2021.
Lebsock, M. D. and Witte, M.: Quantifying the dependence of drop spectrum width on cloud drop number concentration for cloud remote sensing, Atmos. Chem. Phys., 23, 14293–14305, https://doi.org/10.5194/acp-23-14293-2023, 2023.
Lhermitte, R.: Attenuation and scattering of millimeter wavelength radiation by clouds and precipitation, J. Atmos. Ocean. Tech., 7, 464–479, https://doi.org/10.1175/1520-0426(1990)007<464:AASOMW>2.0.CO;2, 1990.
Löhnert, U., Crewell, S., Simmer, C., and Macke, A.: Profiling cloud liquid water by combining active and passive microwave measurements with cloud model statistics, J. Atmos. Ocean. Tech., 18, 1354–1366, https://doi.org/10.1175/1520-0426(2001)018<1354:PCLWBC>2.0.CO;2, 2001.
Matrosov, S. Y., Uttal, T., and Hazen, D. A.: Evaluation of Radar Reflectivity-Based Estimates of Water Content in Stratiform Marine Clouds, J. Appl. Meteorol. Clim., 43, 405–419, https://doi.org/10.1175/1520-0450(2004)043<1405:EORREO>2.0.CO;2, 2004.
Medeiros, B., Shaw, J., Kay, J. E., and Davis, I.: Assessing clouds using satellite observations through three generations of global atmosphere models, Earth Space Sci., 10, e2023EA002918, https://doi.org/10.1029/2023EA002918, 2023.
Miles, N. L., Verlinde, J., and Clothiaux, E. E.: Cloud droplet size distributions in low-level stratiform clouds, J. Atmos. Sci., 57, 295–311, https://doi.org/10.1175/1520-0469(2000)057<0295:CDSDIL>2.0.CO;2, 2000.
Miller, M. A., Jensen, M. P., and Clothiaux, E. E.: Diurnal Cloud and Thermodynamic Variations in the Stratocumulus Transition Regime: A Case Study Using In Situ and Remote Sensors, J. Atmos. Sci., 55, 2294–2310, https://doi.org/10.1175/1520-0469(1998)055<2294:DCATVI>2.0.CO;2, 1998.
Morris, V. R.: Ceilometer Instrument Handbook, U. S. Department of Energy, Atmospheric Radiation Measurement user facility, Richland, Washington, DOE/SC-ARM-TR-020, https://www.arm.gov/publications/tech_reports/handbooks/ceil_handbook.pdf (last access: 13 September 2024), 2016.
Randall, D.: Beyond deadlock, Geophys. Res. Lett., 40, 5970–5976, https://doi.org/10.1002/2013GL057998, 2013.
Rauber, R. M., Stevens, B., Ochs, H. T., Knight, C., Albrecht, B. A., Blyth, A. M., et al.: Rain in Shallow Cumulus Over the Ocean: The RICO Campaign, B. Am. Meteorol. Soc., 88, 1912–1928, https://doi.org/10.1175/BAMS-88-12-1912, 2007.
Rosenkranz, P. W.: Water vapor microwave continuum absorption: A comparison of measurements and models, Radio Sci., 33, 919–928, https://doi.org/10.1029/98RS01182, 1998.
Russell, L. M., Lubin, D, Silber, I., Eloranta, E., Muelmenstaedt, J., Burrows, S., Aiken, A., Wang, D., Petters, M., Miller, M., Ackerman, A., Fridlind, A., Witte, M., Lebsock, M., Painemal, D., Chang, R., Liggio, J., and Wheeler, M.: Eastern Pacific Cloud Aerosol Precipitation Experiment (EPCAPE) Science Plan, U. S. Department of Energy, Office of Science, https://www.arm.gov/publications/programdocs/doe-sc-arm-21-009.pdf (last access: 29 February 2024), 2021.
Sassen, K., Mace G. G., Wang, Z., Poellot, M. R., Sekelsky, S. M., and McIntosh, R. E.: Continental Stratus Clouds: A Case Study Using Coordinated Remote Sensing and Aircraft measurements, J. Atmos. Sci., 56, 2345–2358, https://doi.org/10.1175/1520-0469(1999)056<2345:CSCACS>2.0.CO;2,1999.
Sauvegeout, H., and Omar, J.: Radar reflectivity of cumulus clouds, J. Atmos. Ocean. Techn., 4, 264–272, https://doi.org/10.1175/1520-0426(1987)004<0264:RROCC>2.0.CO;2, 1987.
Schneider, T., Leung, L. R., and Wills, R. C. J.: Opinion: Optimizing climate models with process knowledge, resolution, and artificial intelligence, Atmos. Chem. Phys., 24, 7041–7062, https://doi.org/10.5194/acp-24-7041-2024, 2024.
Socuellamos, J. M., Rodriguez Monje, R., Cooper, K. B., Lebsock, M. D., Nagaraja, P. M. S., Siles, J. V., Beauchamp, R. M., and Tanelli, S.: A G-band Doppler Radar for Atmospheric Profiling, IEEE T. Geosci. Remote, 62, 1–8, https://doi.org/10.1109/TGRS.2024.3398616, 2024a.
Socuellamos, J. M., Rodriguez Monje, R., Lebsock, M. D., Cooper, K. B., Beauchamp, R. M., and Umeyama, A.: Multifrequency radar observations of marine clouds during the EPCAPE campaign, Earth Syst. Sci. Data, 16, 2701–2715, https://doi.org/10.5194/essd-16-2701-2024, 2024b.
Socuellamos, J. M., Rodriguez Monje, R., Lebsock, M., Cooper, K., Beauchamp, R., and Umeyama, A.: Ka, W and G-band radar observations of clouds and light precipitation during the EPCAPE campaign in March and April 2023, Zenodo [data set], https://doi.org/10.5281/zenodo.11043877, 2024c.
Squires, P.: The Microstructure and Colloidal Stability of Warm Clouds: Part I-The Relation between Structure and Stability, Tellus, 10, 256–261, https://doi.org/10.3402/tellusa.v10i2.9229, 1958.
Williams, J. K., and Vivekanandan, J.: Sources of error in dual-wavelength radar remote sensing of cloud liquid water content, J. Atmos. Ocean. Tech., 24, 1317–1336, https://doi.org/10.1175/jtech2042.1, 2007.
Wood, R.: Stratocumulus Clouds, Rev. Arti. Mon. Weather Rev., 140, 2373–2423, https://doi.org/10.1175/MWR-D-11-00121.1, 2012.
Zelinka, M. D., Zhou, C., and Klein, S. A.: Insights from a refined decomposition of cloud feedbacks, Geophys. Res. Lett., 43, 9259–9269, https://doi.org/10.1002/2016GL069917, 2016.
Zelinka, M. D., Myers, T. A., McCoy, D. T., Po-Chedley, S., Caldwell, P. C., Klein, S. A., and Taylor, K. E.: Causes of Higher Climate Sensitivity in CMIP6 Models, Geophys. Res. Lett., 47, 1–12, https://doi.org/10.1029/2019GL085782, 2020.
Zhang, D., Ermold, B., and Morris, V.: Ceilometer (CEIL), Atmospheric Radiation Measurement (ARM) User Facility [data set], https://doi.org/10.5439/1181954, 2024.
Zhu, Z., Lamer, K., Kollias, P., and Clothiaux, E. E.: The Vertical Structure of Liquid Water Content in Shallow Clouds as Retrieved from Dual-Wavelength Radar Observations, J. Geophys. Res.-Atmos., 124, 184–197, https://doi.org/10.1029/2019JD031188, 2019.
- Abstract
- Introduction
- Instruments and data selection
- Liquid water content retrieval: methodology and results
- Reflectivity-based retrieval
- Liquid water path retrieval and validation
- Liquid water content adiabaticity
- Quantification of the improvement in the LWC retrieval accuracy by using a G-band radar
- Summary and conclusion
- Data availability
- Author contributions
- Competing interests
- Disclaimer
- Acknowledgements
- Financial support
- Review statement
- References


