the Creative Commons Attribution 4.0 License.
the Creative Commons Attribution 4.0 License.
Aeolus lidar surface return (LSR) at 355 nm as a new Aeolus Level-2A product
Lev D. Labzovskii
Gerd-Jan van Zadelhoff
David P. Donovan
Jos de Kloe
L. Gijsbert Tilstra
Ad Stoffelen
Damien Josset
Piet Stammes
The Atmospheric Laser Doppler Instrument (ALADIN) aboard Aeolus was the first spaceborne high-resolution lidar and measured vertical profiles of aerosol optical properties at 355 nm at an incidence angle of ∼ 35°. Although Aeolus was primarily developed to provide vertical profiles of wind speed, aerosols and cloud products, its lidar surface returns (LSRs) have been shown to contain useful information about ultraviolet (UV) surface reflectivity and have agreed well with passive remote sensing reflectance. With a focus on the process to incorporate the LSR algorithm into the Aeolus Level-2A product, we describe the methodology and evaluate the results of the adopted LSR retrieval. The algorithm combines attenuated backscattering parameters (Level-2 Aeolus Profile Processor Algorithm, L2 AEL-PRO, data) with information on the surface bin detection (Level-1 data) to produce attenuated LSR estimates (e.g., surface-integrated attenuated backscatter) for all bins where the ground was detected. The correction for producing final LSR estimates at the original Aeolus resolution is performed using the Aeolus L2 retrievals, namely, the aerosol optical depth (AOD) and Rayleigh optical depth, to ensure that LSRs are free of the effects of atmospheric attenuating features, such as optically thick clouds and thick aerosol conditions (AOD > 1.0). The evaluation shows that Aeolus LSR estimates produced using this approach agree well with the UV Lambertian-equivalent reflectivity (LER) from the Global Ozone Monitoring Experiment-2 (GOME-2; LERG) and TROPOspheric Monitoring Instrument (TROPOMI; LERT) climatologies at all spatial scales. For four reference orbits (10 September 2018, 30 November 2018, 11 January 2019 and 1 May 2019), all cloud and aerosol-free LSR estimates agree well with both LER references, with correlation coefficient (r) values varying from 0.55 to 0.71. For monthly scales, the agreement was moderate to high for the LSR–LERT comparison (r = 0.61–0.77 depending on the month) and weak to moderate for the LSR–LERG comparison (r = 0.44–0.64). Globally, the averaged 2.5° × 2.5° LSR estimates exhibit very high agreement with both the LERG (0.90) and LERT (0.92) references. With respect to reproducing the regional monthly dynamics, LSR and LER agree very well in snow- or ice-covered regions (r > 0.90), semiarid regions (r > 0.90), arid regions (r > 0.70), and some regions with mixed vegetation (like Australia; r = 0.94), whereas no agreement was found for ocean regions due to the Aeolus optical setup, which is favorable for the ocean subsurface but not for direct surface backscatter probing. We unveiled four reflectivity clusters of LSRs at the 2.5° × 2.5° grid scale, manifesting a transition from white to darker surfaces in descending LSR magnitude order: (1) ice, (2) snow, (3) surface without snow and (4) water. Regionally, the LSR–LER agreement can vary and yields the highest correlation values in regions where snow is present in winter, indicating the excellent sensitivity of Aeolus LSRs to white surfaces such as snow. This finding is corroborated by the very good agreement of LSRs with modeled snow cover that we demonstrated (r = 0.62–0.74 between these parameters in such regions), while the sensitivity to purely vegetation-driven changes in the surface is lower, as indicated by the comparison between LSRs and the normalized difference vegetation index (NDVI) without snow (r < 0.30 in the regional analysis). By demonstrating the usability of LSRs for scientific applications at non-nadir angles, our work deepens the knowledge about LSRs, which has mostly been based on nadir-looking Cloud–Aerosol Lidar and Infrared Pathfinder Satellite Observations (CALIPSO) studies in the past. Using experiences from both the nadir-looking CALIPSO and the highly non-nadir Aeolus mission, a framework for the effective LSR utilization using future lidar missions such as EarthCARE and Aeolus-2 can be effectively designed.
- Article
(15031 KB) - Full-text XML
-
Supplement
(1543 KB) - BibTeX
- EndNote
Most spaceborne nadir-looking lidars have been and are being developed for scientific applications focused on the atmosphere, given the ability of lidars to provide multiyear vertical profiles of aerosols and clouds (Winker et al., 2010), in the case of Cloud–Aerosol Lidar and Infrared Pathfinder Satellite Observations (CALIPSO), or the aforementioned parameters and the wind distribution, in the case of Aeolus (Lux et al., 2020). Besides these main applications, spaceborne lidars can register backscattered echoes that are formed after a lidar beam interacts with the land or water surface. Earlier lidar studies have suggestively demonstrated that backscatter reflectance coming from surfaces may strongly vary depending on the reflector under both laboratory (Kavaya et al., 1983) and field experimental conditions (Reagan and Zielinskie, 1991). Although most earlier studies were focused on the surface as a target for lidar calibration (Kavaya et al., 1983), later works have also turned their scientific interest toward lidar surface returns (hereafter LSRs) as a proxy for deriving the physical characteristics of land or ocean surfaces or the atmosphere (Josset et al., 2018). Such an opportunity has emerged due to the significantly stronger surface backscatter signals compared with the atmospheric signal registered at the lidar detector (Venkata and Reagan, 2016). In this research domain, studies that used CALIPSO information have extensively exploited ocean returns and have repeatedly demonstrated that, for visible and infrared wavelengths at nadir incidence, LSRs can be most effectively used to infer ocean surface (Josset et al., 2008) and subsurface (Lu et al., 2014) conditions. These findings further prompted a number of successful (mostly CALIPSO) application studies (e.g., Dmitrovic et al., 2024) focused on either the derivation of atmospheric characteristics (wind speed or aerosol) using ocean surface return parameterizations (Hu et al., 2008; Josset et al., 2008, 2010; He et al., 2016) or oceanic organic carbon chlorophyll using ocean subsurface return parameterizations (Lu et al., 2014, 2021; Behrenfeld et al., 2016). Moreover, there were initiatives to exploit CALIPSO surface reflectance signals from land (for instance, to use two identical reflectance tracks) to further infer atmospheric characteristics, such as the aerosol optical depth (Josset et al., 2018).
Most recent LSR-focused studies have been conducted for the recently decommissioned missions of CALIPSO and Aeolus. Overall, despite their considerable instrumental differences, both CALIPSO (Lu et al., 2018) and Aeolus (Labzovskii et al., 2023) were shown to be sensitive to surface reflectivity characteristics. These recent findings have opened an interesting research niche. It has become increasingly clear that spaceborne lidars can substantially complement our surface reflectivity knowledge, which had previously been based on the information from passive remote sensing instruments only, limited by daylight observations and suffering from large low-solar-angle-driven uncertainties at high latitudes (Tilstra et al., 2017, 2024). Despite these promising developments, our current knowledge about LSRs is still mostly based on numerous CALIPSO studies, while Aeolus works on LSRs have remained scanty. This knowledge gap has emerged due to the challenges involved with retrieving robust LSRs from Aeolus given its unique instrumental setup, including the incidence angle of ∼ 35° (the incidence angle of a satellite instrument is the angle between the satellite sensor and the normal to the surface of the target cell) and its 355 nm wavelength. The main challenges that we refer to include very weak backscatter signals from the water surface; the coarse lidar surface bins of Aeolus (Ehlers et al., 2022) that potentially contain subsurface, surface and atmospheric components; overall weak sensitivity; and the lower sensitivity of Aeolus surface backscattering, driven by the unique Aeolus setup. Most of these LSR-related challenges were briefly reported by Dionisi et al. (2024) and by preceding preliminary exploratory Aeolus studies (Dionisi et al., 2023; Jamet et al., 2023; Labzovskii et al., 2022) or were touched upon in Aeolus studies pointedly focused on atmospheric retrievals (Weiler et al., 2021). Potential roadblocks with respect to studying Aeolus LSRs had long been anticipated based on both theoretical considerations (Josset et al., 2010) and Aeolus prelaunch preparations, focused on the Aeolus airborne demonstrator, which was designed to be identical to the spaceborne ALADIN (Li et al., 2010; Weiler, 2017). Despite the physical constraints of Aeolus ocean surface returns, our previous study showed that Aeolus land LSRs agree with previous estimates of passive remote sensing surface reflectivity, with some differences in the way that reflectivity varies across different land types (Labzovskii et al., 2023). At the same time, our previous study did not describe nor document the methodological approach to derive useful Aeolus LSR estimates. It was also limited to seasonal dynamics of one region (the Sahara), while showing only a comparison of LSRs versus Lambertian-equivalent reflectivity (LER) references at gridded (2.5° × 2.5°) and regional (regional averages were compared) resolutions.
In this light, this paper has two main objectives: (1) the presentation of a detailed Aeolus LSR retrieval methodology that will be incorporated in the official Aeolus reprocessing chain (Level-2A) data and (2) the presentation of a very detailed LSR regional analysis that continues the effort of Labzovskii et al. (2023). In line with the availability of the latest reprocessing results, this study is performed for the Flight Mode-A (FM-A) period of Aeolus (September 2018–May 2019). The rest of the paper is organized as follows. Section 2 presents the data and methodology, while Sects. 3, 4 and 5 represent the results, discussion and conclusions, respectively.
This section describes the data and methodology applied in this study.
2.1 Data
2.1.1 Aeolus data
Aeolus was launched on 22 August 2018 to measure atmospheric wind profiles from the ground to the stratosphere at global scales and remained spaceborne until July 2023 (Stoffelen et al., 2006; Lux et al., 2020). Aeolus carried the Atmospheric Laser Doppler Instrument (ALADIN), a high-spectral-resolution ultraviolet (UV) lidar (355 nm) pointing at an incidence angle of ∼ 35°. The instrument provided information on the lowest ∼ 30 km of the atmosphere (0.25–2.00 km vertical resolution depending on the altitude) for 15.6 orbits per day with a 06:00 and 18:00 LST (local solar time) Equator overpass in a Sun-synchronous orbit. Aeolus was the first lidar instrument in space to measure the Doppler shift, using a high-spectral-resolution lidar (HSRL) technique, from both lidar channels (Mie and Rayleigh). In addition to wind information, Aeolus provided vertical information about aerosols and clouds (Flament et al., 2021; Ehlers et al., 2022) and surface backscattering echoes (Labzovskii et al., 2023), i.e., LSRs, that we examine in this study. For calculating LSRs, the following data are used: Aeolus Level-1B (L1B) (Reitebuch et al., 2018) and Aeolus AEL-PRO (Aeolus Profile Processor Algorithm) information (Donovan et al., 2022). For additional analysis over ocean that requires modeled wind information, we also ingest auxiliary meteorological data, from the Aeolus (AUX_MET data) ground segment, compiled using European Centre for Medium-Range Weather Forecasts (ECMWF) winds information (Lux et al., 2022).
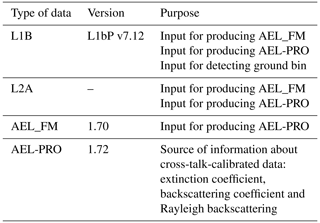
Table 1 illustrates the Aeolus data required to produce LSRs. This study uses Aeolus data including the Level-1B (L1B) reprocessing product no. 3 (baseline 14) to detect the surface at the highest spatiotemporal resolution of Aeolus sounding. The methodology relies on, although it does not precisely follow, the procedure described briefly in Labzovskii et al. (2023). A complete and explicit explanation of the current approach is provided in more detail in the following. The L1B data provide the basic Aeolus information required for calculating LSRs, including the measurement geolocation (longitude; latitude; altitude of lidar bin; width of the range gate; and, most importantly, the lidar bins in which the surface is located), and L2 AEL-PRO provides essential data about atmospheric optical characteristics (including attenuated particle backscatter, aerosol extinction and molecular backscatter; all provided alongside their associated uncertainties and scene classification) (Donovan et al., 2023). Note that L1B and L2A data types are both required to first produce AEL-FM (feature mask) data, originally developed for the Atmospheric Lidar (ATLID) instrument of the future EarthCARE mission (van Zadelhoff et al., 2023) to classify atmospheric features such as clouds that can critically attenuate our LSR estimates. All L1B, L2A and AEL_FM data are further used to produce AEL-PRO data, which represent a cornerstone dataset for retrieving robust LSR values, as shown earlier in our previous work (Labzovskii et al., 2023). We emphasize that AEL-PRO uses an optimal-estimation (Rodgers, 2000) forward-modeling inversion procedure, described in detail by Donovan et al. (2022, 2023).
Although this paper is focused on the entire FM-A period, we selected several orbits as illustrative examples for more detailed analysis of the underlying LSR data. Table 2 shows four reference orbits from 10 September 2018, 30 November 2018, 11 January 2019 and 1 May 2019 with the exact L1B and AEL-PRO files applied in the analysis. The orbits were selected to represent as different seasonal and geographic conditions as possible for such a narrow selection of orbits.
2.1.2 Data for validating LSRs from Aeolus: TROPOMI and GOME-2 LER
From a validation perspective, we followed the methodology from our previous paper (Labzovskii et al., 2023) and used Lambertian-equivalent reflectivity (LER) estimates from the TROPOspheric Monitoring Instrument (TROPOMI) and Global Ozone Monitoring Experiment-2 (GOME-2), referred to as LERT and LERG, respectively. Surface LER represents the reflectivity of the surface that was retrieved using the assumption of Lambertian surface reflection. In reality, most surfaces do not behave as a Lambertian reflector (Maignan et al., 2004). We acquired TROPOMI (minimum LER with snow/ice v2.0; accessed from https://www.temis.nl/surface/albedo/tropomi_ler.php, last access: 30 May 2024) and GOME-2 LER (mode LER, v4.0) at 354 nm (the closest wavelength to the 355 nm wavelength of Aeolus) monthly climatologies (Tilstra et al., 2017, 2024) with the highest spatial resolution available, 0.125° × 0.125° and 0.25° × 0.25°, respectively. The TROPOMI surface directionally dependent Lambertian-equivalent reflectivity (DLER) database comprises LER estimates for the Earth's surface across twenty-one 1 nm wide wavelength bands between 328 and 2314 nm. This contains the DLER of the surface, with an increased precision of the surface reflectance across a range of viewing angles due to the bidirectional reflectance distribution function (BRDF). This development is a considerable improvement for the reflectance, particularly within the longer wavelength bands. The latest version of LERT (2.0) is based on 60 months of TROPOMI data (02.01.00 L1B reprocessing data) with improved cloud filtering of scenes applied (Tilstra et al., 2024). Both LER estimates were resampled to 2.5° × 2.5°grids with the uncertainties as the standard deviation of LER during the month. LER was downloaded from the Tropospheric Emission Monitoring Internet Service (TEMIS) website. We used LER estimates reflecting snow-affected areas as well, as it is crucial to include snow or ice regions in the analysis to evaluate the sensitivity of Aeolus LSRs to the strongest white reflectors. As shown in our previous paper, the LER and LSRs reasonably represent Lambertian and unidirectional reflectivity characteristics, respectively (Labzovskii et al., 2023). While LER is the most suitable reference for global surface UV reflectivity, perfect linear agreement with LSRs is not expected.
2.1.3 Land-cover-related reference data
To verify our previous suggestion on the strong sensitivity of LSRs to snow cover and moderate sensitivity to vegetation type (Labzovskii et al., 2023), we used reference datasets including snow cover and the normalized difference vegetation index (NDVI). Snow cover data were taken from the Modern-Era Retrospective analysis for Research and Applications version 2 (MERRA-2) model, namely, from the M2TMNXGLC dataset, where the extent of snow or ice cover on the Earth's surface is used (the fractional amount of a land surface covered with snow and ice within a tile, ranging from 0 to 1). The NDVI is a measure used to gauge the health and density of vegetation on land surfaces. It is calculated as follows: NDVI = , where NIR is near-infrared radiation and VIS is visible-wavelength radiation. The NDVI ranges from 0 to 1, where higher NDVI values indicate healthier vegetation, whereas lower values suggest sparse or stressed vegetation, bare soil, or non-vegetated areas. Negative NDVI values occur in scenarios where the reflectance properties are not typical of vegetation, like water, but such areas are outside of the scope of our analysis. NDVI data also originate from the MERRA-2 records (M2TMNXLND). Note that both snow cover and NDVI data were taken from MERRA-2 version 5.12.4 (GMAO, 2015). They were accessed and downloaded using the Giovanni tool of the NASA Earthdata portal.
2.2 Methodology
2.2.1 Ground bin detection and calculation of LSRs
ALADIN was a unique spaceborne lidar instrument in that the range gate setting varied depending on the location (Reitebuch et al., 2018). Thus, one cannot simply select a fixed lidar bin number, corresponding to the surface intersection based on some orbit example. Due to this, our first Aeolus LSR-focused work (Labzovskii et al., 2023) followed the experience of pre-Aeolus lidar studies (Josset et al., 2018) and sought to obtain the minimum difference between the altitude at which the digital elevation model (DEM) is located according to the model implemented in Aeolus data and the respective Aeolus range gate (among 24 Aeolus bins). The current paper aligns the ground bin detection for LSR retrieval with the Aeolus official processing approach and uses information where the ground is located from L1 data, namely, from ground wind detection block (Lux et al., 2018). Hereafter, we refer to this approach as “official” for brevity. The official approach differs from the Labzovskii et al. (2023) ground bin detection method (Labzo-23 for brevity) as outlined in the following. The assumptions of the Labzo-23 approach are as follows: (1) the ground signal is present only in the Aeolus bin closest to the DEM; (2) under clear atmospheric conditions, the ground bin can always be detected, regardless the signal strength. The assumptions of the currently applied, official approach are different: (1) the surface signal can be distributed across several Aeolus bins; (2) sometimes, the ground signal cannot be detected (signal is too weak), which means that some Aeolus observations do not contain any surface signal (even over land). To understand the mechanism behind the official Aeolus ground detection algorithm, one must note that it uses the GTOPO30 global model containing DEM ACE v.2 information at high resolution (300 m × 300 m, 9 arcsec resolution). The height of the surface of the Earth with regard to the reference ellipsoid is used. Subsequently, the lower edge of each altitude bin is being looked for, where the height of the bin should be below the height of the DEM. In short, the Aeolus ground detection looks for signal drops going upwards (in terms of altitude) first and then looks for signal drops going downwards. If there are more than five ground bin candidates, the ground detection is not successful and, therefore, no ground bin is assigned for the respective observations (Lux et al., 2018).
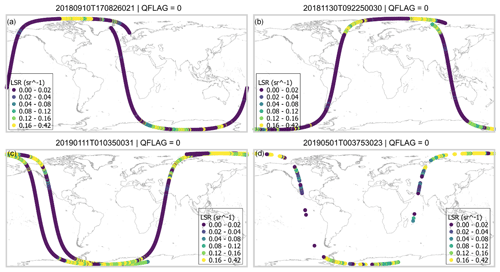
For illustration, we demonstrate the successfully detected ground bins and the cases without ground bin detected using the official algorithm for the reference orbits from Table 2. As seen in Fig. 1, the cases with detected ground bins constitute a minor fraction of each orbit; of all observations, 12 % (1638 cases), 23 % (3119 cases), 28 % (5961 cases) and 18 % (2314 cases) contain detected ground bins for the reference orbits from 10 September 2018, 30 November 2018, 11 January 2019 and 1 May 2019, respectively. However, most cases with no ground bin detected originate from ocean areas with very weak water returns, manifesting a signal of very low magnitude (potentially noise). According to our previous experience (Labzovskii et al., 2023), more detected cases in winter in the Northern Hemisphere are explained by the presence of sea ice over ocean. As we are interested in the land surface signal, we applied the surface flag mask. To this end, we adopted the “surface” parameter from the L1B data (see “ground_wind_detection/measurement_ground_wind_detection/mie_measuremenet_ground_wind_bin”) and recalculated the ground bin detection statistics for land LSRs only. Among land observations, 33 % (1039), 36 % (2581), 64 % (3438) and 32 % (1321) of profiles contain a ground bin signal for the same reference orbits from 10 September 2018, 30 November 2018, 11 January 2019 and 1 May 2019, respectively. More detailed statistics on the number of observations containing ground bins that are clear enough to be used for LSR retrieval are presented in Table S1 and Fig. S4 in the Supplement. According to the official Aeolus ground bin detection algorithm, the highest ground bin is taken from no. 21, no. 22, no. 23 or no. 24 lidar bin (counted from the lidar instrument to the ground) in most cases, depending on the local topography (see an example of these statistics in Fig. S2). We remind the reader that, in the Aeolus processing chain, the no. 1 bin is closest to the lidar detector, so the counting starts from the top in terms of the atmospheric vertical profile (Flament et al., 2021).
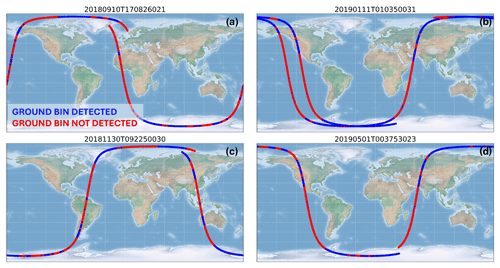
Figure 1Reference files used in this study to illustrate the methodology: (a) 10 September 2018, (b) 30 November 2018, (c) 11 January 2019 and (d) 1 May 2019.
In calculating the LSRs, we used all ground bin numbers marked as containing the surface (see “ground_bin_num” in Aeolus L1A data). As in Labzovskii et al. (2023), we took the attenuated backscatter (β, ) at range (z) from the L2 AEL-PRO data at the bins where ground was detected and multiplied it by the width of the surface range bin of Aeolus (Δrsurf, m). In this way, we obtained the uncorrected surface-integrated attenuated backscatter (SIAB′, sr−1) or, in terms of this paper, the uncorrected lidar surface returns (LSR′, sr−1), reflected as (γ′) in Eq. (1). The ground location was determined using the lowest bin where the ground is located (smin, m) and the highest bin where the ground is located (smax, m), according to the DEM information at the given range bin thickness that takes into account the Aeolus pointing angle. In the Supplement, more illustrative figures are provided (Figs. S1 and S2), demonstrating the magnitude and distribution of LSR′ calculated by Eq. (1).
2.2.2 Atmospheric correction of LSRs
While utilizing lidar surface backscatter, it is crucial to develop a methodology that maximizes the extraction of useful information on surface reflectivity properties from lidar signals while also considering the impact of atmospheric profile characteristics. Given the small field of view of ALADIN (Lux et al., 2018; Reitebuch et al., 2018), the LSR attenuation due to Rayleigh scattering can be simply corrected using Beer's law (i.e., single scattering). Within the atmospheric correction of the Rayleigh signal, we first obtained the Rayleigh extinction coefficient (αm) profiles from the Aeolus L2A data. In essence, these values are determined from the atmospheric density profile (derived from ECMWF forecast data). Equation (2) below describes the calculation of total Rayleigh optical depth (ODRay). Then, we integrated the Rayleigh extinction coefficient between the surface and the Aeolus top altitude while also accounting for the effects of a partially filled surface bin and optical depth above the Aeolus top bin that is not considered in the total optical depth initially calculated (e.g., the “missing part” of the optical we referred to in the Labzovskii et al., 2023, methodological description placed in the Supplement).
where z is the altitude, it is the top range index, is is the surface range index and Δr is the range bin thickness considering the Aeolus pointing angle. Note that k1 and k2 are two correction factors that need to be considered. The k1 factor accounts for the potential of underestimation in Eq. (2) due to the surface elevation situated above the lower boundary of the surface bin. This factor is calculated using the molecular extinction coefficient at the surface bin, the difference in the top boundary of the surface bin and the expected surface height according to the DEM information included in the Aeolus products used here. Secondly, the correction factor k2 is required to alleviate the difference between the highest top bin of the Aeolus profile and the top of the atmosphere (Stephens et al., 1994). We take into account the pressure at the top of the Aeolus profile (pt, mbar) and the highest range gate altitude (zt, km), the Aeolus wavelength of 355 nm (λ), and the given cosine of the Aeolus off-nadir pointing angle (μ; usually ∼ 35°). As the Aeolus off-nadir pointing angle may differ depending on the location, the angle estimate is directly taken from the “elevation angle” array of Aeolus data.
In addition to the molecular attenuation, the attenuating effects of aerosol and thin clouds must be taken into account to ensure the cleanest possible LSR statistics, manifesting ground returns only and removing all atmospheric effects. For this, we utilized the aerosol optical depth (AOD) corresponding to the aerosol and thin-cloud extinction profiles retrieved by AEL-PRO data (Donovan et al., 2023). As ALADIN was a high-spectral-resolution lidar (HSRL), an extinction profile can be retrieved directly without assuming the lidar extinction-to-backscatter ratio profile (Shipley et al., 1983). Unlike elastic-lidar-based techniques, this theoretically allows for the provision of more accurate extinction coefficients. AEL-PRO uses both the pure Rayleigh and Mie attenuated backscatters as input for its retrievals. By applying a cost function, the optimal-estimation approach determines the likelihood of measurements given a specific forward model and our expectations. In brief, both AOD and ODRay estimates are used here to calculate the corrected LSR signal (γ) at the original resolution of Aeolus (see Eq. 4 below).
Although this is not a technical paper that is exclusively dedicated to an LSR software description, we briefly illustrate the Aeolus LSR retrieval scheme below for the convenience of the reader (see Fig. S3). The errors in LSRs are calculated by using the instrumental uncertainties in the input parameters of the LSR equation (Eq. 4) in a simple error propagation formula. The idea is to understand how errors in LSR′ (the root sum square, RSS, e.g., of attenuated backscatter or instrumental uncertainties for lidar bins with ground) and total aerosol optical depth (RSS of extinction errors along all lidar bins over ground) propagate into final LSR uncertainties. To this end, we assume that uncertainties in the variables are independent and that the partial derivatives are evaluated at the mean values of the variables so that the contribution of both optical depth and LSR′ can be disentangled.
2.2.3 Additional processing of LSR data: quality flags and gridding
Our previous work has indicated that LSRs can be excessively weak due to the presence of strongly attenuating (or even obscuring) features like heavy aerosol loading and thin or thick clouds (Josset et al., 2008; Hu et al., 2008; He et al., 2016). Most crucially, as shown in Labzovskii et al. (2023), the strength of the Aeolus LSR signal varies depending on the surface reflectivity characteristics. Thus, it is imperative to ensure that LSRs come from the surface and that their magnitude is not altered by attenuation from unaccounted for atmospheric features, such as clouds or aerosols. Due to this, besides correcting the LSR′ for aerosol and molecular atmospheric extinction, the effects of atmospheric features that can weaken or completely attenuate the surface echo must be minimized (e.g., LSR signal-to-noise ratio is high). We repeated the quality control procedure based on the use of L2 AEL-PRO data (Donovan et al., 2023) that were employed earlier in the first Aeolus-LSR-focused study following Labzovskii et al. (2023). Specifically, we calculated the percentage of attenuating features above the ground bin (which contains either attenuation or water/tropospheric cloud) with respect to the total number of Aeolus bins. The attenuating features are all those cases marked with codes 1 (water cloud), 2 (ice cloud tropospheric), 101 (water cloud) and < 9999 (other attenuating features flag) from AEL-PRO. A table with the codes of each atmospheric feature is included in the Supplement (Table S2). This quality control parameter has been previously denoted for LSR purposes as the atmospheric quality flag (“qflag” for brevity). It ranges from 0 % (no attenuation features over the ground bin) to 100 % (all features over the ground bin are attenuated). We applied the most stringent filtering strategy by filtering out all LSR observations with qflag > 0. Finally, we filtered out all of the LSR observations with AOD > 1.0 (calculated from the AEL-PRO integrated profile of extinction coefficients), thereby ensuring that observations that are attenuated by excessively hazy conditions are not included in the analysis. We refer to these resultant observations that passed the threshold mentioned above as “clear” or “final” in this paper. The statistics on how many attenuating features have been filtered out are provided in the Supplement (see Fig. S4 and Table S2). In short, although the AOD = 1.0 threshold might seem arbitrary, additional analysis on how various AOD thresholds affect the final selection of LSR observations (and, therefore, the 2.5 × 2.5 gridded LSR maps that we describe below) yielded only very minor differences. This analysis is provided in the Supplement (see Figs. S5 and S6 alongside the corresponding paragraph).
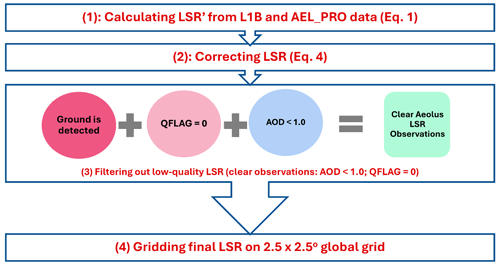
After filtering out high-AOD cases and clouds, we gridded the final selection of LSR observations. The gridded estimates are needed to (1) compare Aeolus LSR estimates to LER references at regional and global scales and (2) understand the prospects of the LSR product as a potential L3 climatology product. We averaged the LSR estimates for each month by creating 2.5° × 2.5° geographical grids and populating these with Aeolus observations. We further applied a spatial join operation using the geopandas.sjoin function from the geopandas package. In this way, we calculated monthly average estimates of LSRs for each grid cell with the associated uncertainties (as 1σ of LSRs during the month). We summarize all of the steps for calculating the scientific product from LSRs used in this paper in Fig. 2 (from the first to the last step, depicted from the top block to the bottom one). Note that the final LSRs on a 2.5° × 2.5° global grid are calculated for either 1-month or 1-year averages. In each case, we mention which average we refer to in the beginning of the respective paragraph or in the form of remark.
In the following, we show some examples using LSR vertical profiles from the reference orbits (Fig. 3). We plot vertical profiles of attenuated backscattering from Aeolus observations in Fig. 3, with markers signifying ground detection (see the red circles on the vertical profiles). All of these cases are taken from the reference orbits that we described previously, with the index of the observational point expressed at the top of each subplot. The methodological framework shown in Fig. 2 is based on two types of observations from an LSR standpoint: attenuated observations (quality flag > 0) and clear-sky observations (quality flag = 0). Attenuated cases are illustrated on the left-hand side of Fig. 3 (in the red frame), where attenuated backscattering peaks above the ground are either completely attenuated or weaker than the LSRs that we are interested in. Three attenuated cases over the (1) Arctic waters, (2) Northern Canada and (3) the Arctic islands in Russia in Fig. 3 exhibit some atmospheric peaks at ∼ 1500 m (qflag = 0 %), 4000–6000 m (qflag = 36 %) and ∼ 2200 m (qflag = 15 %) over the ground, respectively. Despite this, all ground detection bins have the highest signal peaks at lower altitudes, where ground was detected by the official detection algorithm. To ensure the clearest possible LSR statistics, all such potentially attenuated cases are filtered out of the final analysis, as these attenuating features would still weaken the surface echo. As mentioned, quality flags indicate how many attenuating features (in %) were detected over the ground bin/bins from the total number of lidar bins. It is worth noting that, despite having the highest quality flag (0 %), case 1 in Fig. 1 exhibits an attenuation peak around 2000 m. This example illustrates the importance of filtering out high-AOD cases, as performed in the step 3 of our methodology (shown in Fig. 2), that can otherwise remain unaccounted for. Among the unattenuated or clear cases included in our final analysis, one can notice profiles over (4) the Ural region, (5) the western US, (6) Antarctica and (7) the Indian Ocean in Fig. 3. As seen, all land cases exhibit very strong or strong ground returns at different altitudes with two bins detected over the western US (due to topography) and one ground bin detected in other cases. The altitude of the ground bin varies from ∼ 0 m in the Ural region and the Indian Ocean to > 2000 m in the high-altitude cases (western US and Antarctica). Unlike in the Labzo-23 method, clear LSR observations over oceans are scanty. The official ground detection algorithm is missing ground bins over oceans due to excessively weak signal, considered to be noise.
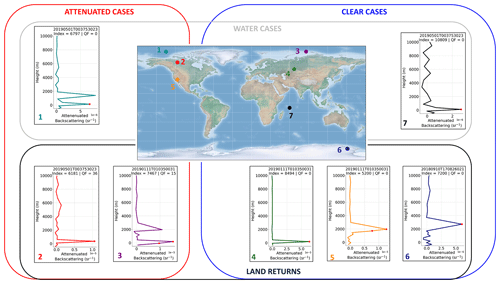
Figure 3Examples of vertical profiles of attenuated backscattering for four reference orbits selected for the paper. The red frame denotes attenuated cases (qflag > 0 % or AOD > 1.0), the blue frame denotes clear cases (qflag = 0 %), the gray frame denotes cases over ocean (surface flag indicates water) and the black frame denotes cases over land (surface flag indicates land). The numbers listed in the panels refer to the following regions: (1) Arctic waters (1 May 2019), (2) Northern Canada (1 May 2019), (3) Arctic islands in Russia (11 January 2019), (4) the Ural region (11 January 2019), (5) the western US (11 January 2019), (6) Antarctica (10 September 2018) and (7) the Indian Ocean (1 May 2019). Note that the term index above each panel stands for the respective orbit number of the Aeolus mission. The orbit reference (according to the L1B format) is provided as well.
Figure 4 illustrates the reference analysis and histograms of the LSR distribution depending on the surface type, namely, depending on the surface flag. It reflects the distribution of LSRs for every reference orbit selected earlier for three types of surfaces: land, water and water in low-latitude regions (black, blue and red colors in Fig. 4, respectively). We assume that waters between −35 and 35° should be ice-free, as no ice flag was included in the Aeolus L1B data. For the four selected orbits, the LSRs range from 0.0 to ∼ 0.6 sr−1. Plausibly, the maximum LSR values are limited by lower levels in the September orbit (low amount of snow in the Northern Hemisphere and low amount of ice in the Southern Ocean) with a maximum of ∼ 0.4 sr−1. All land LSR distributions are bimodal, with a weaker LSR peak at < 0.1 sr−1 and a stronger LSR peak at 0.2 sr−1. These differences are explained in Sect. 3. The water LSR peaks are either bimodal (e.g., September 2018) or unimodal, where the latter pattern is explained by the low returns from sea ice surfaces. As mentioned in Sect. 2.2.2 (in the text following Eq. 4), LSR errors were calculated using error propagation considerations accounting for the optical depth and uncorrected LSR estimates. The mean error estimates for the example orbits are 19 ± 9 % for 10 September 2018, 16 ± 5 % for 30 November 2018, 14 ± 5 % for 11 January 2019 and 21 ± 7 % for 1 May 2019. With respect to other orbits, errors are very similar (not shown here) and will be available upon publication of the official LSR dataset during the Aeolus Phase-F stage. Notably, once all higher-latitude regions are clipped for water surfaces (red bars), only a very low number of strong returns (< 100 cases) remain, compared with the land LSR statistics. Note that these errors are not reflected in Fig. 4, where only distributions are shown. This variation is explained by the difference in the way that the ground bin is detected using the official method, compared with the Labzo-23 method that we mentioned earlier.
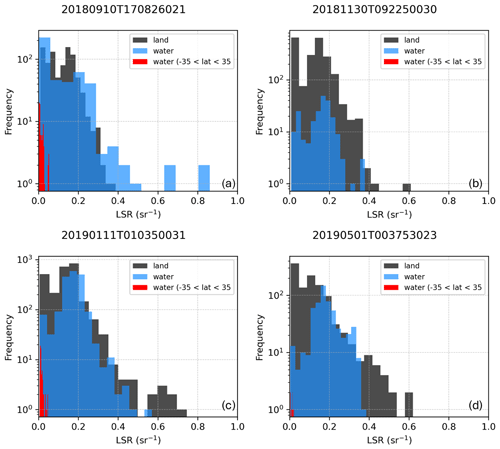
Figure 4LSR histogram distributions for four reference orbits on (a) 10 September 2018, (b) 30 November 2018, (c) 11 January 2019 and (d) 1 May 2019 showing land (black), water (blue) and water outside high-latitude regions assumingly without ice (red). The y axis is plotted using a logarithmic scale for better visibility (with respect to the red points).
Our analysis covers several aspects of the LSR retrieval, such an LSR evaluation versus LER references (GOME-2 and TROPOMI) for four reference orbits, for aggregated Aeolus orbits and for gridded levels. Further, we demonstrate the LSR distributions across four reference orbits, including an examination of the LSR global distribution at a 2.5 °× 2.5° gridded-average level. Moreover, we evaluate the sensitivity of Aeolus LSRs to land cover characteristics, such as snow and a vegetation cover proxy, thus examining the two hypotheses suggested earlier (Labzovskii et al., 2023) with respect to the strong sensitivity of LSRs to snow cover and the moderate sensitivity of LSRs to vegetation cover.
3.1 Evaluation of LSR retrievals versus LER references (TROPOMI and GOME-2)
First, we evaluate LSR retrievals versus the LER references. Our previous work had demonstrated unexpectedly high agreement between LSRs and reference UV reflectivity datasets, namely, LER climatologies from TROPOMI and GOME-2 (Labzovskii et al., 2023; Tilstra et al., 2017). As our analysis had been limited to the global comparison of gridded 2.5° × 2.5° mean estimates and regional averages across more than 30 arbitrarily selected regions, we extend the validation analysis further here.
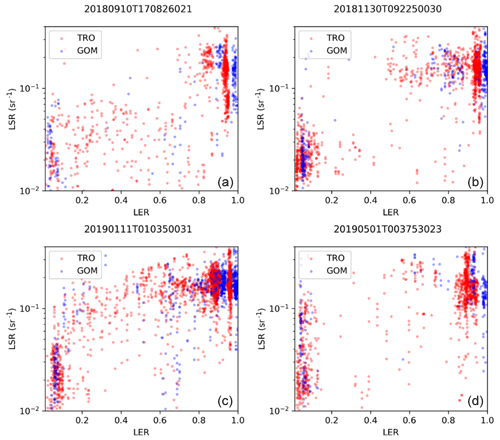
Figure 5Aeolus LSRs versus LERG (blue) and versus LERT (red) for the four reference orbits on (a) 10 September 2018, (b) 30 November 2018, (c) 11 January 2019 and (d) 1 May 2019. The LSR y axis is plotted using a logarithmic scale for better visibility (based on the experience of Labzovskii et al., 2023, who found that a logarithmic scale is better with respect to LSR visualization).
Table 3Correlation coefficients in the comparison between Aeolus LSRs (AEL) and reference LER estimates from GOME-2 (GOM) and TROPOMI (TRO) for all surfaces, land only (l) and water only (w). The second and third columns present all observations, columns with an “l” suffix present land, and columns a “w” suffix present ocean/waters.

3.1.1 LSR retrievals versus LER references for four selected orbits
First, we evaluated the agreement between LSR retrievals and reference LER estimates for the four reference orbits that we selected for the analysis earlier (as shown in Fig. 5 and Table 3): 10 September 2018, 30 November 2018, 11 January 2019 and 1 May 2019. We sampled LER values from multiyear climatologies for each Aeolus observation for each orbit of interest and unveiled the following agreement patterns. First, there are two distinct populations of LER values, including very weak reflectivity (< 0.2) and very strong reflectivity (> 0.8), dominating the statistics for every orbit (Fig. 5). Second, both LSR–LERG and LSR–LERT comparisons exhibit high agreement, with varying correlations for every orbit. This agreement varies depending on the orbit and whether we compared LSRs with TROPOMI or with GOME-2 estimates. In short, over all surfaces, the correlation coefficient (r) ranges from 0.55 in 1 May 2019 (LSR–LERG comparison) to 0.77 in 30 November 2018 (LSR–LERT comparison). The agreement between LSR and LER is driven by the agreement over land, except for during the 10 September 2018 orbit, as indicated in Table 3.
3.1.2 LSR retrievals versus LER references for monthly aggregated orbits during the entire FM-A period
We further analyzed the LSR–LER agreement for monthly aggregated orbits of Aeolus during the FM-A period. Here, monthly aggregated orbits refer to all clear LSR observations per month merged into one dataset for statistical analysis. For each clear LSR observation, we sampled corresponding LER climatology points from both TROPOMI and GOME-2. Figures 6 and 7 show the comparison of Aeolus LSRs versus two respective LER references: LSR–LERG and LSR–LERT. At this finest-scale observational level, we identified a weak to moderate agreement between LSR and LER estimates. In case of GOME-2, the highest agreement was found in September 2018 (r = 0.64), whereas the lowest agreement was found in February 2019 (r = 0.44), with no distinct seasonal patterns, as seen from Fig. 6a and f, respectively. Moreover, the LSR–LERT comparison yielded higher agreement (r > 0.60) for any month (with the highest agreement in September, r = 0.77, and the lowest agreement in November, r = 0.61). The lack of linear agreement at a regional level can be related to different factors. First, there is a sigmoid-like behavior of LSRs across different land types, with nearly exponential growth of LSRs towards the most strongly reflecting regions – snow-covered areas (Labzovskii et al., 2023). This effect can be seen by strong LSR “hot spots” in Figs. 6 and 7, which are elongated along the y axis, thereby indicating a higher sensitivity of Aeolus to various snow types and conditions. Second, this comparison is limited by a strongly bimodal distribution of LER, with most values either distributed within the low-UV-reflectivity range (< 0.20) or the high-reflectivity range (> 0.80).
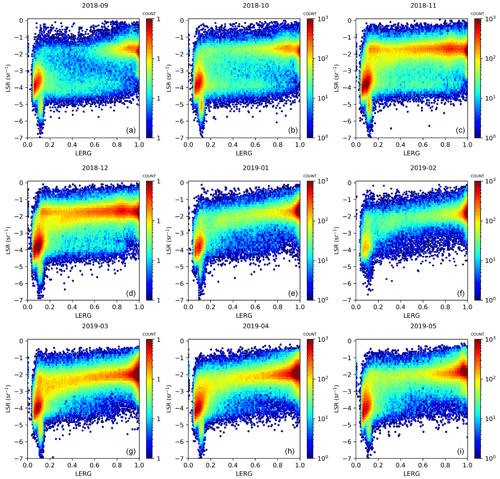
Figure 6Global LSR versus LER (GOME-2) density plots for each month of the study period at the observation scale.
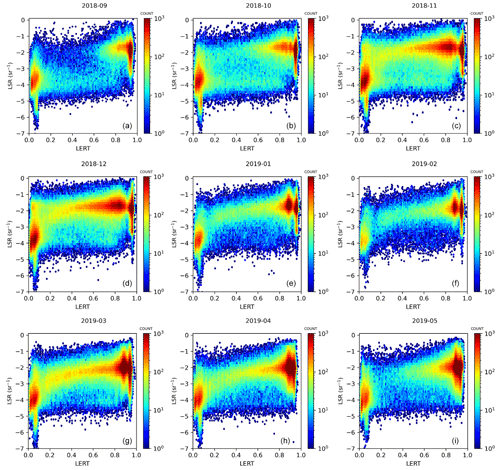
Figure 7Global LSR versus LER (TROPOMI) density plots for each month of the study period at the observation scale.
Indeed, the relationship between LSR and LER values is far from linear; therefore, the Pearson correlation agreement metrics would be inevitably skewed towards lower-agreement metrics. One can assume a linear association between LSR and LER values by seeking a correction factor. We performed such an experimental attempt by applying different power law functions to LSRs. Specifically, we applied different power law coefficients (l) in a simple power law equation (γl) by seeking the highest linear correlation between LSRs and LER. We found that, when correcting LSRs by applying γ0.1, we achieved the strongest positive correlation between LSR and LER values. In this case, the LSR–GOME-2 correlation is increased to r = 0.63–0.77 and the LSR–TROPOMI correlation is increased to r = 0.65–0.81 (depending on the month). Overall, given no prior indications that LSR–LER agreement should be precisely linear, such agreement can be deemed generally high and promising, but no conclusions on the physical relationship between these parameters can be made based on these statistics.
3.1.3 Global agreement between LER and LSRs
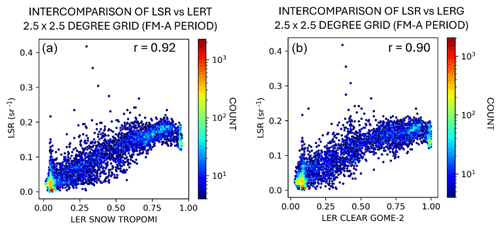
We further evaluated the ability of LSRs to represent the surface reflectivity characteristics in the UV at global scales. To this end, we compared 2.5° × 2.5° gridded-mean estimates of LSRs versus both LERG and LERT (Fig. 8). In particular, each point in Fig. 8 represents the averaged LSR (or LER) estimate, corresponding to one grid cell shown later in Fig. 13 (FM-A period). We found very good agreement between LSR and LER estimates for Aeolus–TROPOMI and Aeolus–GOME-2 comparisons, with correlation coefficients of r = 0.92 and r = 0.90, respectively. The very high agreement shows some improvement on the LSR–LER agreement, compared with our previous work (Labzovskii et al., 2023), where we had reported correlation coefficients of r = 0.89 and r = 0.62 with TROPOMI and GOME-2 for the FM-A period, respectively. As we used exactly the same dataset for LSRs and GOME-2 (TROPOMI LER was updated to version 2.0), this improvement can be explained by the changes in the methodology: (a) if the surface bin was detected (or not) for a certain observation and (b) the assumption regarding how many bins contain surface information. Most likely, as indicated by Figs. 7–9, the current official Aeolus ground bin detection methodology implies that not every observed profile contains surface backscatter returns. This results in many ocean surface returns, with the weakest LSR signals being filtered out of the analysis. This effect seemingly further improves the overall agreement between the datasets. This explanation is plausible, as it is already known that LSRs mostly agree well with LER over land but not over water (Labzovskii et al., 2023). We briefly discuss these differences later in the paper.
3.2 Examination of LSR regional patterns: orbits, monthly gridded estimates and seasonally gridded estimates
For illustration purposes, we demonstrate LSR distributions across the four mentioned orbits in Fig. 9. Note that only the clearest cases are shown (qflag = 0 %). Several patterns are visible. First, there are less observations that are deemed clear using this official ground bin detection method from oceans, compared with the Labzo-23 approach to detect surface bins. In many cases, the surface bin here is simply missing, whereas such bins were considered to have a very weak signal using the Labzo-23 method. However, there are some clear ocean surface returns, such as those over the eastern Pacific on 10 September 2018 (Fig. 9a), or several clear ground bins, such as those over the Indian Ocean on 1 May 2019 (Fig. 9d). As expected, the strongest and most continuous sets of LSR observations are retrieved over high latitudes, covered by white surfaces comprised of snow or ice (Tanskanen and Manninen, 2007; Weiler, 2017). The prevalence of LSRs from high-latitude regions using the official ground bin detection algorithm is plausible and has previously been mentioned by Weiler et al. (2021). Yellow-colored observations in Fig. 9, manifesting the strongest LSRs from snow or ice surfaces (> 0.16 sr−1) are visible over the Arctic and Antarctic regions in all four analyzed orbits. Over land outside of high-latitude regions, there are abundant LSR observations with a highly variable LSR magnitude. In most cases, land LSRs for these four referenced orbits vary from ∼ 0.05 to 0.16 sr−1, but more detailed statistics are described in this section.
As Aeolus LSRs have been previously shown to reasonably reflect several land-cover-related gradients on the map, such as water–land, vegetation–arid and no-snow–snow gradients, we used a clustering method to classify the LSR signal for better illustration purposes. To this end, we used natural-breaks-based clustering of LSR data for plotting (e.g., the Jenks, 1967, clustering method) to identify break points between different clusters of LSR data (Sadeghfam et al., 2016). The method minimizes the average deviation (e.g., the variance as well) of each class from its respective mean, concurrently maximizing the divergence of each class from the means characterizing the other classes (Jenks, 1967). Note that we simply applied this approach for clustering and visualization purposes without the intention of disentangling physical differences behind reflectivity patterns of different regions.
Figures 10–12 show the LSR distribution at two different resolutions, including the original Aeolus resolution (LSRs per sounding), shown in the left-hand panel of each figure, and the gridded-mean LSR estimates at a 2.5° × 2.5° grid cell resolution, shown in the right-hand panel of each figure. We plot not only gridded LSR estimates but also the observation-resolution LSR estimates to provide visual insight into the data abundance behind the gridded estimates. Figure 10 demonstrates that most signals with a detected surface according to the official algorithm were found over land in autumn. In line with Fig. 9 four-orbit statistics, the ocean bins were only detected for some regions, like the Pacific Ocean (September, October and November 2018), and some other scattered, less spatially distinct regions, like the central western Atlantic. As expected, in most cases, there is a distinct gradient between the strength of LSRs over water (shown in dark blue, reflecting LSRs < 0.018 sr−1) and land (in most cases > 0.018 sr−1). Moreover, agreeing with our first Aeolus-LSR-focused work (Labzovskii et al., 2023), the strength of the LSR signal is visibly enhanced over areas covered by snow and ice. Snow- and ice-covered areas are displayed using orange–red colors in Fig. 10 (LSRs > 0.121 sr−1), and this cluster plausibly moves southwards from September to the end of November in the Northern Hemisphere (see Northern Canada and Russia in Fig. 10d and f). In line with the Labzo-23 method, some LSR gradients discerned from the currently applied official ground bin detection algorithm are visible here, such as water–land and snow–no-snow gradients. Interestingly, the differences between arid and vegetated areas reported in our previous work are not salient here.
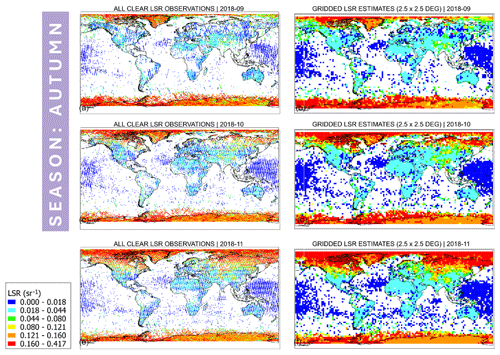
Figure 10All clear (qflag = 0, AOD < 1.0) LSR observations for (a) September, (c) October and (e) November 2018, respectively. Gridded LSR estimates at a 2.5° × 2.5° resolution based on the observations from panels (a), (c) and (e) for (b) September, (d) October and (f) November 2018, respectively.
Figure 11 illustrates the LSR distributions in the winter of the FM-A period. It is obvious that LSRs are very sensitive to snow cover changes in the Northern Hemisphere winter, whereas very strong LSRs are registered over major parts of Canada, northern Russia, Central Asia and the Himalayas. Moreover, large numbers of strong signals were discerned over water near Antarctica and the Arctic regions, indicating the presence of sea ice. Interestingly, the number of strong water returns is at their minimum in February 2019. Moreover, some regions like central West Africa or the Amazon are missing from the final gridded estimates. Some weakening of the LSR signal over these regions, especially over central West Africa, is attributed to a diminishing surface signal due to a high AOD (Labzovskii et al., 2023). Alternatively, this phenomenon could be caused by extremely weak LSRs, which, according to the official surface bin detection approach, are assumed to lack any surface signal. We underline that central West Africa and the Amazon are the most heavily influenced by biomass burning (Randerson et al., 2012) and tropical cloud convection processes (Chakraborty et al., 2020), among other geographic areas. Figure S4 indicates that such atmospheric conditions lead to a dearth of clear LSR observations over the region, even if one lifts the clear LSR threshold to AOD = 1.5 in the quality assurance procedure, as shown in Fig. 2.
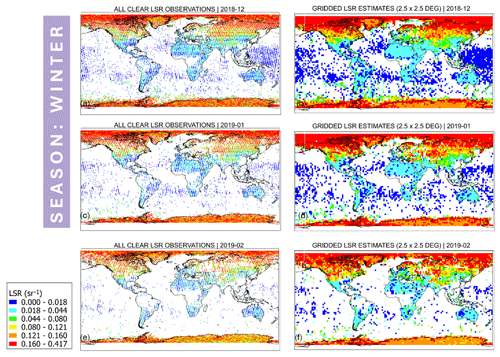
Figure 11All clear (qflag = 0, AOD < 1.0) LSR observations for (a) December 2018, (c) January 2019 and (e) February 2019, respectively. Gridded LSR estimates at 2.5° × 2.5° resolution based on the observations from panels (a), (c) and (e) for (b) December 2018, (d) January 2019 and (f) February 2019, respectively.
Figure 12 shows the Northern Hemisphere spring LSR distributions. A line of snow retreat towards the north is distinctly visible in the Northern Hemisphere, as seen by the shift in the orange–red LSR cluster northwards. While snow-related clusters nearly disappear from the Northern Hemisphere in May 2019, a strong LSR signal remains over the Arctic, perhaps indicating a localized peak in sea ice seasonality in the region. Alternatively, a potential wetting effect from ice and snow at warmer temperatures could be behind the increasing LSRs, as the below-ice surface emerges as snow melts, thereby potentially contributing to this signal. Moreover, there is a noticeable weakening of the signal over the entire land region in the Northern Hemisphere, manifested on the map as the emergence of dark-blue-colored clusters, similar to water in magnitude. This is potentially related to the greening of vegetation during the Northern Hemisphere growing season, as indicated by passive remote sensing studies (Tilstra et al., 2017) and our previous lidar-based LSR work (Labzovskii et al., 2023). From a land reflectivity perspective, the weakest UV returns are registered over densely vegetated, i.e., green, areas. More unexpectedly, the distribution of the detected ocean surface returns change in spring 2019. Specifically, the LSRs formed two longitudinal bands near the tropics that reach their respective areal peaks in March–April 2019. These ocean areas are the so-called “Southern Hemisphere gyres”, where the concentration of chlorophyll is very low, near-surface wind speeds are low and ocean mixing is weak (Morel et al., 2010). It should be noted that we do not have sufficient empirical arguments to support this hypothesis, although such analysis is outside of the scope of this paper.
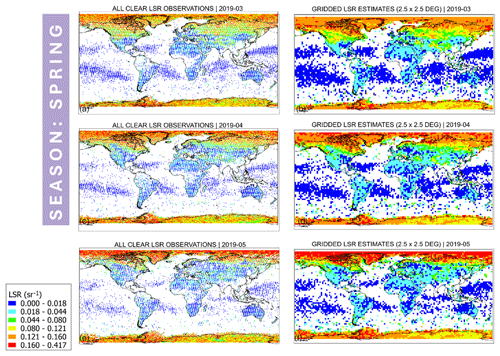
Figure 12All clear (qflag = 0, AOD < 1.0) LSR observations for (a) March, (c) April and (e) May 2019, respectively. Gridded LSR estimates at a 2.5° × 2.5° resolution based on the observations from panels (a), (c) and (e) for (b) March, (d) April and (f) May 2019, respectively.
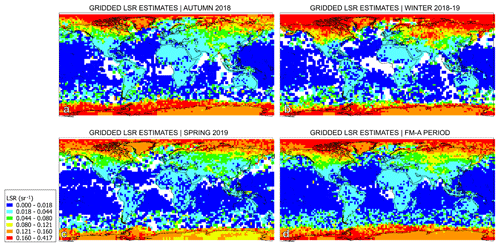
To finalize the global seasonal analysis of LSRs, we also visualized the LSR mean gridded estimates for the entire FM-A period and for each season separately in Fig. 13. Interestingly, LSRs exhibited several distinct gradients, like the land–water, snow–no-snow and snow–ice gradients. As a reminder, the color scale reflects the Jenks optimization clustering result, as described earlier. In particular, the gradient between land and ocean is best visible in the difference between the light-blue (0.018–0.044 sr−1) and dark-blue (< 0.018 sr−1) colors, respectively. Over land, LSRs can strongly vary (similar to water returns), with the weakest signals observed mostly over the Northern Hemisphere during high-productivity seasons. In general, LSRs over land vary from 0.018 to 0.121 sr−1 outside of the very high latitudes or highland areas, where snow can be formed (e.g., see the yellow clusters in Fig. 13 over northern Siberia, Northern Canada, Tibet and the Pamir Mountains). On the one hand, the difference between arid and vegetation areas is unexpectedly subtle on such maps. On the other hand, orange clusters indicate the areas where snow can be found (0.12–0.16 sr−1), while red-colored areas are located over high-latitude seas or oceans, representing mostly sea ice formation areas with the strongest LSRs of > 0.16 sr−1. This is an interesting finding, as the LSR magnitude over sea ice is stronger using the current official ground bin detection method, compared with the Labzo-23 method, which has previously yielded the highest gridded values of ∼ 0.10 sr−1 over Greenland and Antarctica. Moreover, the difference between ice-covered ocean areas and snow-covered areas was also not distinct using the Labzo-23 approach. This is an interesting result that can be explained by the ability of the official ground bin detection approach to register only strong returns. In other words, while the Labzo-23 gridded statistics would be based on omnipresent weak returns from water alongside occasional cases of sea ice from high latitudes, the current approach yields only the strongest returns, as the weaker ocean returns are not considered to be ground bin detections here. The reader should take note of the obvious scarcity of any weak ocean signals over the Southern Ocean – they are simply missing from the global statistics in Figs. 10–12.
3.3 Region-specific analysis of LSRs and LER
Furthermore, we analyzed the regional agreement between LSRs and LER. To reiterate, promising agreement has previously been reported between LER regional monthly averages and corresponding Aeolus averages in arid regions like the Sahara that have low reflectivity variability during the year (Labzovskii et al., 2023). In other words, the very weak annual reflectivity variability in poorly vegetated areas, which had been previously thought to be insignificant, has been detected by Aeolus LSRs in the September 2018–September 2019 period. As the prior seasonal analysis had been limited to the Sahara only, we extend the seasonal analysis by incorporating more than 30 regions. These regions were previously selected to represent typical geographical conditions from an ecosystem perspective in Labzovskii et al. (2023). This region-specific analysis illustrates seasonal LSR–LER comparisons at monthly scales for each representative region from an ecosystem point of view (Fig. 14), and a correlation table between LSRs and LER for each selected region is shown (Fig. 15). The regions in Fig. 15 are ranked based on the TROPOMI–GOME-2 agreement in descending order (where red denotes higher agreement).
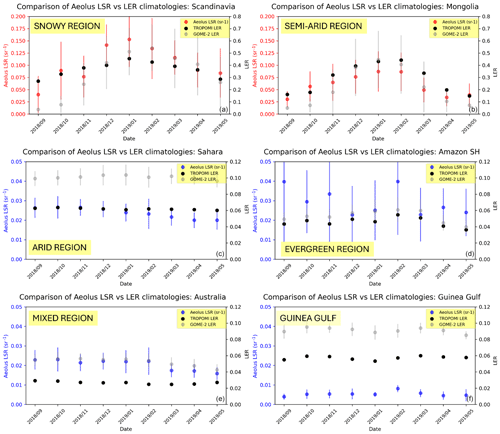
Figure 14LSR (red and blue) comparison with LERT (black) and LERG (gray) for several representative regions, including (a) Scandinavia (region with frequent snow occurrence, e.g., “snowy region”, as described on the plot), (b) Mongolia (semiarid), (c) the Sahara (arid), (d) the Southern Hemisphere (SH) part of the Amazon (evergreen region), (e) Australia (mixed region) and (f) the Gulf of Guinea (ocean region). Error bars are taken from 1σ monthly deviations of the average LSRs. Red-colored and blue-colored plots have different y-axis ranges: red denotes the strongest LSR regions, whereas blue denotes weak to moderate LSR regions.
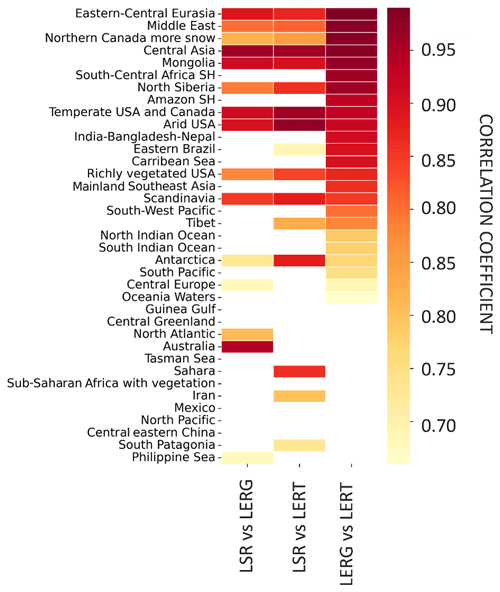
Figure 15Correlation table between Aeolus (LSRs), GOME-2 (LERG) and TROPOMI (LERT) monthly regional averages for all regions considered in this study. The correlation table is sorted in descending order with respect to the correlation coefficient between LERG and LERT.
In geographical terms, the highest agreement between LSRs and LER was found in regions where snow occurrence is common in winter (Fig. 15), thus forming white surfaces that strongly reflect UV light (Tanskanen and Manninen, 2007). For example, high correlation coefficients of 0.87, 0.88, 0.86 and 0.75 were discerned between LSRs and LERT in eastern Central Eurasia, Scandinavia, northern Siberia and Northern Canada, respectively; in the case of LSR–LERG, the corresponding values were 0.89, 0.85, 0.79 and 0.72, respectively. Figure 14a illustrates an example of Scandinavia, where both LSRs and LER are sensitive to the emergence of snow, with reflectivity peaks in December–January. In terms of magnitude, LSRs reach ∼ 0.15 sr−1 in January 2019, corresponding to ∼ 0.3 in terms of LER. This one-peak curve is evident for both the LER and LSR estimates except in Northern Canada, where LSRs decrease at a faster rate in comparison to LER estimates at the end of winter (not shown in Fig. 14 with different regions). Interestingly, for year-round ice-covered regions, the agreement is less obvious, with high agreement for Antarctica (r = 0.63 and r = 0.88 for LSR–LERG and LSR–LERT comparisons, respectively), on the one hand, but lower agreement over central Greenland (r < 0.10 for both Aeolus–GOME-2 and Aeolus–TROPOMI comparisons), on the other hand. Note that LERG and LERT both yielded moderate agreement (r = 0.67 and 0.51) with each other over Antarctica and over central Greenland, respectively. The reason behind the lower agreement is that LER estimates show very low variability throughout the year over these regions, while Aeolus detects several LSR changes in March–April 2019 in central Greenland (see Fig. S7). It is hard to compare these dynamics with existing reference seasonal data on ice in Antarctica, even qualitatively, because most studies address ice extent (Parkinson, 2014) in the region, not snow cover, to which LSRs are most sensitive. Another reason could be the fact that Aeolus boasts unprecedented coverage of these high latitudes, with many observations during polar night and no issues arising from solar zenith angle, as typical for passive remote sensing instruments (Tilstra et al., 2017). Moreover, LER is a multiyear average that is filled in with a constant value if detection is not successful, whereas Aeolus provides direct measurements of unidirectional reflectivity.
In arid and semiarid regions, the agreement between LSRs and LER is generally high for most regions with a few exceptions. Note that we did not labeled the semiarid regions like Mongolia (Han et al., 2014) based on the conventional ecosystem classification; rather, we chose to use the possibility of snow occurrence in these generally arid regions. As in Labzovskii et al. (2023), a very good agreement between LSRs and LERT over the Sahara is discerned, despite the very weak reflectivity variability identified (Fig. 14c). We previously discovered a rather implausible sensitivity of Aeolus to reflectivity changes in the Sahara Desert (Labzovskii et al., 2023). Importantly, we confirm these findings here by applying the official method of bin detection and extending our analysis to other arid regions, where vegetation changes are minimized. Specifically, for LSR–LERT, good to very good agreement was found over all arid regions including the Middle East (r = 0.81), the Sahara (0.86), Iran (0.70) and all semiarid regions (including Mongolia, 0.90; Central Asia, 0.96; and the arid US, 0.97). For the LSR–LERG comparison, we found good agreement only for the Middle East (0.80) among the arid regions, but we found good agreement for all semiarid regions, including Mongolia (0.91), Central Asia (0.96) and the arid US (0.90). For semiarid regions like Mongolia, shown in Fig. 14b, a one-peaked curve with the maximum in winter indicates that the agreement is driven by the presence of snow, which manifests highest reflectivity in the UV spectrum (Tanskanen and Manninen, 2007). Clear, strong LSR peaks of ∼ 0.15 sr−1 were discerned over Mongolia in winter (Fig. 14b), but these peaks were not present over the Sahara (Fig. 14c), where LSRs remained below 0.05 sr−1. Moreover, these lower LSR values, compared with snow-affected months, are typical of semiarid regions like Mongolia in spring and autumn (see September, October, April and May in Fig. 14b).
For other regions, the agreement between LSRs and LER varies depending on the ecosystem type. For instance, in evergreen ecosystems of the Southern Hemisphere, like tropical regions, the agreement is rather low or lacking. To be specific, for the Southern Hemisphere, while LER intercomparison agreement is high for tropical forests, like the Southern Hemisphere Amazon region (r = 0.93) and mainland Southeast Asia (0.86), or mixed ecosystems, like southern Central Africa (0.96), Aeolus does not exhibit any statistical agreement with either of the LER references in any of these regions (r < 0.10). The dynamic range of LSR variability is very low and close to the instrumental noise magnitude of Aeolus in evergreen regions, as indicated by Fig. 14d which shows the Amazon region. Perhaps, Aeolus LSRs are less sensitive to green vegetation changes at lower reflectivity ranges or have weaker return values from green surfaces, thereby reducing the dynamic range of LSR change over such areas (Weiler et al., 2021). We should stress that this suggestion is merely a hypothesis that necessitates deeper exploration, as shown in the next section. In the mixed-vegetation regions, the agreement patterns may vary, with the best LSR–LER agreement in Australia (Figs. 14e and 15) where LSRs agree well with both LERG and LERT (r = 0.50 and 0.94, respectively). Thus, seasonal surface changes can be resolved using Aeolus LSRs even in regions without snow cover. The presence of snow cover over the region called Australia in this paper is unlikely, as we focused solely on central Australia, excluding mountainous regions where snow pixels might be present. In ocean areas, like the Gulf of Guinea depicted in Fig. 14f, either LSR–LER agreement is low or there is a lack of data for comparison.
3.4 Sensitivity of LSRs to land cover: snow cover and a vegetation proxy
Thus far, for most cases, we have registered good linear agreement between LSRs and LER references for orbit, aggregated monthly orbit, annual global and regional monthly scales. Moreover, we previously revealed a distinct clustering of annual LSR regional averages in Labzovskii et al. (2023). This clustering closely reflected the ecosystem characteristics of different regions, with the LSR magnitude in the following ascending order: ocean regions, highly vegetated regions, arid regions and snow-cover-prone regions. Furthermore, we previously registered moderate negative correlations between yearly averaged LSR and NDVI values, which indicates a simple relationship: less vegetation results in stronger LSRs. However, all of these results do not directly demonstrate the ability of Aeolus to resolve ecosystem-driven changes in land surface. To reiterate, we arbitrarily selected the regions that reflect different geographical characteristics worldwide. To this end, we quantitatively evaluated two previously suggested (and the most promising) hypotheses stemming from all of our LSR works (Labzovskii et al., 2022, 2023), namely, (1) the strong sensitivity of Aeolus LSRs to snow cover change and (2) the moderate sensitivity of Aeolus LSRs to vegetation change. To this end, we selected two proxy datasets to reflect these characteristics, including snow cover and vegetation proxies (the NDVI); both parameters are described and explained in Sect. 2.2.
As in the aggregated-orbit analysis, shown in Figs. 11 and 12, we sampled the modeled values reflecting land cover conditions for every clear LSR observation for every month. The analysis of snow cover (Fig. 16) unveiled very high agreement with LSRs, yielding a positive correlation for all months during the analysis. The highest agreement was found for November and December 2018 (r = 0.74 for both months), seemingly due to the high dynamic range of snow cover during these months and high differences between the snow-covered high latitudes of the Northern Hemisphere and other regions in these months. In other months, the correlation was moderate (r = 0.60, 0.62 and 0.68 for February 2019, March 2019, September 2018, respectively) or high (r = 0.70, 0.71 and 0.72 for April 2019, January 2019 and October 2018, respectively). Regarding vegetation, we evaluated the LSR–NDVI hypothesis by estimating statistical agreement between LSRs and vegetation cover (see Fig. 17). We found a weak to moderate negative association between LSRs and the vegetation reference (NDVI), with the strongest negative correlation in November 2018, December 2018 and January 2019 (r = −0.62, 0.61 and 0.60, respectively). For other months, a rather weak negative association between the NDVI and LSRs was registered, with correlations ranging from −0.48 (September 2018) to −0.59 (May 2019). We noticed an interesting pattern manifested by the highest agreement in the periods when snow cover was highest in the Northern Hemisphere. During these months, two distinct populations of LSRs with a negative association were discerned: stronger LSRs (see the horizontally prolonged upper population) and a lower LSR population of the same shape. The stronger LSR population is distributed across the entire NDVI range, whereas the lower population mostly ranges from 0.5 to 1.0. As the stronger population density on the plot and the agreement with the snow cover are lowest in September, we suspect that the stronger LSR population is related to snow cover occurrence, not directly to vegetation. This suggestion is sensible, as numerous previous studies, many of which are mentioned by Tanskanen and Manninen (2007), have demonstrated that UV reflectivity of green Earth surfaces is very weak, unless covered by a white layer such as snow (Weiler, 2017). To evaluate this hypothesis, we applied a snow cover mask of 0.05 and filtered out all observations above this threshold. This evaluation indirectly confirmed our suggestion, as shown by Fig. S5 (and Fig. S6). Once we filtered out all snowy cases, the stronger LSR population in the higher segment of the plot nearly disappears (see Fig. S8 in the Supplement). Most crucially, the negative correlation between the NDVI and LSRs dwindles to very low values (r < 0.30) for every month of the analysis if all snow cover cases are masked out.
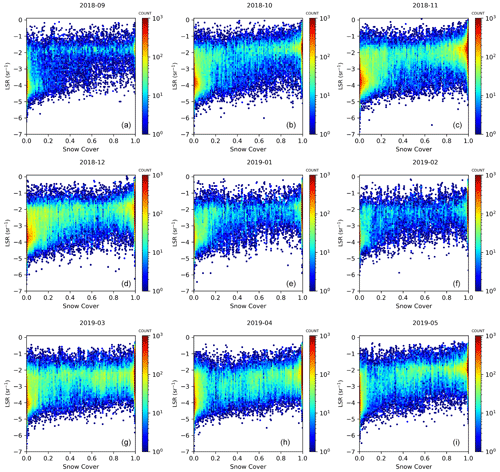
Figure 16Monthly scatterplots comparing LSRs (sr−1) and snow cover (SNW_1) during the entire FM-A period. The y axis and color bar are both shown using a logarithmic scale.
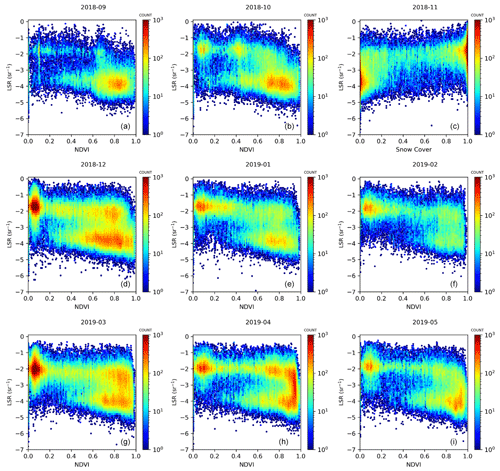
Figure 17Monthly scatterplots comparing LSRs (sr−1) and the NDVI during the entire FM-A period. The y axis and color bar are both shown using a logarithmic scale.
To finalize the discussion on the sensitivity of LSRs to the NDVI, we also evaluated the bin-based agreement of LSRs versus snow cover, LSRs versus the NDVI and LSRs versus the NDVI without snow (snow cover < 0.05). As seen from Fig. 18, the agreement of LSRs with the NDVI (gray markers) is mostly driven by changing snow cover (e.g., more snow results in a lower NDVI). The snow cover (blue markers) is in nearly ideal antiphase with the NDVI compared with either/both LSRs. The pattern here is as follows: the higher snow cover, the higher the LSRs. At the same time, another side of this pattern is as follows: the lower the NDVI, the higher the LSRs. However, if we filter out all snowy cases from the NDVI (see red markers in Fig. 18), LSRs remain nearly unchanged and weak (below 0.05 sr−1) across all variations of the NDVI. It is unclear why NDVI binning does not reflect the pattern that we noticed in our previous paper, namely, a distinct gradient between rich vegetation and arid regions and a moderate negative agreement between yearly averaged NDVI values and yearly averaged LSR values at the regional level (Labzovskii et al., 2023). Perhaps, the LSR difference between arid and vegetated regions is lower than we expected prior to this work, and LSRs are mostly sensitive to the appearance of white surfaces (Tanskanen and Manninen, 2007). We discuss another suggestion explaining this phenomenon in the discussion below in detail.
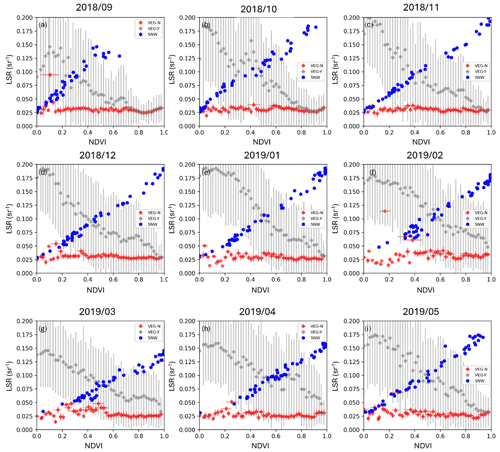
Figure 18Bin-based plots for LSR averages depending on the NDVI with snow (VEG-Y), NDVI without snow (VEG-N) and snow-covered areas (SNW) for every month in the FM-A period. Note that every marker in these plots represents the LSR average for a certain range of VEG-Y, VEG-N or SNW. We considered 50 bins, which means that there are 50 LSR averages, evenly distributed across the x axis from 0 to 1. We illustrate vertical LSR error bars of VEG-Y and VEG-N, but we omit SNW to ensure better illustration. Quantitatively, LSR error bars of SNW are very similar to LSR error bars of VEG-Y and, therefore, can be omitted. The x axis represents both NDVI and SNW changes from 0 to 1.
We described the methodology behind the Aeolus lidar surface return (LSR) retrieval algorithm to be implemented as the official Aeolus Level-2A product. In short, the algorithm relies on a combination of Aeolus L1B (information about ground bin detection and geolocation parameters) and L2A AEL-PRO (backscattering coefficient) data to calculate the LSRs as surface-integrated attenuated backscatter for all bins where a ground return was located using the official surface detection algorithm. The ability of Aeolus to resolve the optical characteristics of the Rayleigh contribution, aerosols and clouds made the atmospheric correction procedures simple and effective. We used (1) Rayleigh and aerosol optical depths calculated from L2A molecular backscattering and aerosol extinction of AEL-PRO data, respectively, and (2) quality flagging of the LSR signal. To include only useful LSR observations for the analysis, one should account for the number of attenuating features over the ground bin and the aerosol conditions; these can be estimated using the atmospheric quality flag (qflag) that we introduced and AOD, respectively, with the latter calculated using extinction from Aeolus L2A data. As a minimum quality assurance procedure, we strongly advise one to include only clear LSR observations, namely, only those observations satisfying qflag = 0 (no attenuating features above ground bin) and AOD < 1.0 conditions.
According to the official ground bin detection algorithm, for all of the Aeolus soundings in the FM-A period, the ground bin was detected in 8 %–22 % of cases per month (median of 19 % cases), and clear useful LSR observations were available for 7 %–16 % of cases per month (median of 14 % cases), depending on the month. The largest number of clear LSR observations was available from November (2018) to April (2019), seemingly due to the presence of strongly reflecting white surfaces in the Northern Hemisphere. Importantly, the LSR algorithm was shown to be relatively stable to changes in the AOD threshold (0.5–1.5), therefore indicating its potential for use as a Level-3-like gridded product for Aeolus, given the observational data abundance. The official Aeolus ground detection algorithm yielded fewer ocean surface returns due to the weakness of the water signal, compared with our previous work (Labzovskii et al., 2023). Other LSR differences with the aforementioned work were minor and were simply driven by different data-filtering strategies as well as which observations were deemed to have clear LSRs. As land and ocean LSRs demonstrate not only different magnitudes of return in terms of signal but also likely different physical effects in returns, our results prompted us to create another holistic quality flag (or hflag) for LSRs. In this context, hflag can reflect three conditions, including the type of surface (0 denotes water and 1 denotes land), the presence of cloud-driven attenuation over the ground bin (0 denotes- no attenuation and 1 denotes that more than one attenuating feature is detected and that LSRs can, therefore, be noisy or unrepresentative) and the presence of aerosol-driven attenuation over the ground bin (0 denotes a low aerosol load and no attenuation, while 1 denotes potential aerosol attenuation). Users are advised to use the “000” flag for land-surface-reflectivity-oriented studies.
The detailed examination of Aeolus LSRs during the FM-A period conducted in this study unveiled interesting results. Monthly average gridded LSRs form distinct clusters and vary from very weak returns of < 0.0018 sr−1, registered over water surfaces, to returns of 0.018–0.080 sr−1, typical of land surfaces without snow, up to values of 0.080–0.417 sr−1, emerging for regions with occasional or permanent snow or ice cover. Such an LSR signal distribution makes the Aeolus non-nadir UV reflectivity pattern very different from the CALIPSO near-nadir visible reflectivity pattern. The CALIPSO LSR pattern previously exhibited the strongest reflectivity returns from deserts and ocean surfaces but did not exhibit any exceptionally weak returns, compared with land (Lu et al., 2018). In our work, the brightest sea ice returns are the highest, being ∼ 26 times stronger than the strongest water returns and resembling the magnitudes of UV returns from the same type of surfaces reported in Chadyšienė and Girgždys (2008). Unlike Labzovskii et al. (2023), this detailed study revealed no differences between arid and vegetation regions, but we did notice a previously unseen gradient between snow (in most cases < 0.160 sr−1) and sea ice in Antarctica or Arctic waters (0.160–0.417 sr−1) on global 2.5° × 2.5° LSR maps. In terms of LSR evaluation, we achieved very good agreement between LSRs and LER references (both GOME-2 and TROPOMI) at nearly all spatiotemporal levels. The four reference orbits that we selected, on 10 September 2018, 30 November 2018, 11 January 2019 and 1 May 2019, all exhibited reasonable agreement in terms of LSR–LER comparisons. Correlation coefficients ranged from 0.55 to 0.71 for Aeolus–TROPOMI comparisons and from 0.57 to 0.65 for Aeolus–GOME-2 comparisons, and the agreement was mostly driven by land LSRs. For monthly aggregated orbits, containing all clear LSR observations and corresponding sampled LER values from climatologies, we found moderate to good agreement for Aeolus–TROPOMI comparisons (ranging from r = 0.61 in February 2019 to 0.77 in September 2018) and weak to moderate agreement for Aeolus–GOME-2 comparisons (ranging from r = 0.44 in February 2019 to 0.64 in September 2018). The absence of perfect linear agreement is attributed to the distinct physical behaviors of LSRs and LER, which vary depending on surface changes. Unlike the quasi-linear growth of LER, LSRs exhibit a sigmoid-like increase in reflectivity when transitioning from a dark to a white surface. At the regional level, the seasonal dynamics of LSRs agreed very well with LER dynamics in snowy regions (northern Siberia, Northern Canada, eastern Central Eurasia and Scandinavia; r > 0.90), arid regions (the Sahara, the Middle East and Iran; r = 0.70–0.86), semiarid regions (Mongolia, Central Asia and the western US; r = 0.90–0.97) and some regions with mixed vegetation (such as Australia; r = 0.94 in the Aeolus–TROPOMI comparison). However, in greener regions, the agreement between the seasonal dynamics of LSRs and LER is lower or nonexistent due to a low dynamic range of reflectivity and the weaker sensitivity of Aeolus LSRs to green surfaces, as discussed in the following. At the global level, averaged 2.5° × 2.5° LSR estimates for the entire FM-A period exhibited excellent agreement with the averaged LER estimates, yielding correlation coefficients of 0.90 with GOME-2 and 0.92 with TROPOMI.
The expectation that Aeolus LSRs are extremely sensitive to snow cover changes was confirmed in this study. At the aggregated monthly orbit level, we found very high agreement between modeled snow cover and LSRs, with the correlation ranging from 0.62 in March 2019 to 0.74 in November and December 2018. These results directly confirm both literature-based expectations about the exceptionally strong reflectivity of white surfaces in the UV band for lidars (Weiler, 2017) and our previous suggestion about the sensitivity of Aeolus LSRs to snow cover in the UV band. For the NDVI, we found some complex interdependencies between vegetation cover and snow cover. Due to a nearly ideal antiphase of snow cover with the NDVI compared with either/both LSRs, we decided to also filter out all snowy cases from the LSR–NDVI comparison as an additional examination. After this filtering, nearly no change in the LSRs as function of NDVI change could be registered, and LSRs remained fairly weak, with values mostly below 0.05 sr−1. It is possible that Aeolus exhibits less sensitivity to variations among different vegetated surfaces. Alternatively, at midlatitudes, where most Aeolus clear LSR observations are available, the vegetation frequently stretches upward past the snow layer, substantially affecting the snow-covered terrain's reflective capacity depending on the land cover type and snow condition (Tanskanen and Manninen, 2007). The mechanisms tied to the transition of surface albedo in vegetated areas with the occasional presence of snow can, therefore, manifest a very complex interplay that is challenging to disentangle in the current study.
While the main aim of this study was to familiarize readers with the Aeolus lidar surface return (LSR) algorithm and resultant LSR parameter to be implemented as the Aeolus official L2 product, we also showed that gridded LSR estimates manifest some reflectivity and land-cover-relevant patterns that can be useful for researchers. We encourage the production of not only operational LSR data at the original resolution but also a gridded 2.5° × 2.5° LSR product in the form of Aeolus-lifetime LSR Level-3 climatology as a future effort. Leveraging the excellent sensitivity of Aeolus LSRs to white surfaces like snow cover, particularly at high latitudes, such products can significantly benefit researchers interested in radiative transfer, reflectivity and snow cover studies. Most crucially, along with CALIPSO-based works on land surface returns (Lu et al., 2018) and ocean surface returns (Josset et al., 2008; Hu et al., 2008; He et al., 2016; Venkata and Reagan, 2016), our methodological framework and scientific results on Aeolus LSRs will complement Aeolus post-commissioning studies and pave the way for future lidar missions. These efforts have partially addressed the gaps in understanding surface LSRs in the UV and at non-nadir angles by Aeolus, thereby deepening the existing understanding provided by the CALIPSO studies mentioned above. Considering these experiences collectively, a practical framework to maximize the benefits of surface return signals for future lidar missions like EarthCARE and even Aeolus-2 can now be outlined. EarthCARE, with its operation of colocated radar and UV nadir lidar measurements, suggests that lidar surface returns can be utilized to construct UV surface climatologies sensitive to white surfaces. Additionally, EarthCARE's ocean surface returns can be used for introducing aerosol optical depth (AOD) algorithms, based on (1) the inverse relationship of ocean surface backscatter and wind speed (Hu et al., 2008) and (2) the combination of lidar and radar surface returns to infer AOD (Josset et al., 2008). For Aeolus-2, assuming a similar optical setup, it is clear that AOD retrieval using ocean surface returns will be challenging, but efforts to deliver subsurface reflectance contributions of the ocean and continuation of the LSR 2.5° × 2.5° gridded record, which will build upon current efforts, would be highly beneficial. Moreover, the current LSR efforts can be used to model expected reflectance from Aeolus-2 in lidar simulation tools.
The underlying research data supporting the findings of this study are available upon request. Please contact the corresponding author for access.
The supplement related to this article is available online at: https://doi.org/10.5194/amt-17-7183-2024-supplement.
LDL: conceptual idea, experimental design, software development, data analysis and manuscript writing; GJvZ: methodological solutions, software conceptual design and quality assurance, quality flag development, data processing for critical data dependencies in our algorithm, and manuscript editing; DPD: methodological solutions, quality flag development and data processing for critical data dependencies in our algorithm; JdK: methodological solutions, software quality assurance assistance, data processing for critical data dependencies in our algorithm and manuscript editing; LGT: supporting validation experimentation and manuscript editing; AS: conceptual methodological advisory and manuscript editing; DJ: conceptual methodological advisory and manuscript editing; PS: conceptual methodological advisory and manuscript editing.
At least one of the (co-)authors is a member of the editorial board of Atmospheric Measurement Techniques. The peer-review process was guided by an independent editor, and the authors also have no other competing interests to declare.
Publisher's note: Copernicus Publications remains neutral with regard to jurisdictional claims made in the text, published maps, institutional affiliations, or any other geographical representation in this paper. While Copernicus Publications makes every effort to include appropriate place names, the final responsibility lies with the authors.
The authors thank the anonymous reviewers for their constructive feedback during the peer-review process. We also wish to thank the data producers and developers responsible for the publication of all of the datasets that we used in this study. Furthermore, the main author acknowledges the advisory support received from different colleagues, including Oliver Reitebuch, Fabian Weiler, Ping Wang, Cedric Jamet, Davide Dionisi, Timon Hummel, Alexandru Dandocsi, Diko Hemminga, Andreas Richter, Anne-Greta Straume and Luis Lauro Gonzalez, during the conceptualization and implementation phase of the project. The main author is also grateful for support from researchers and team members from KNMI, ESA and DLR, who facilitated the work on the LSR algorithm during the project.
This research has been supported by the European Space Agency (grant no. 4000133124/20/I-BG).
This paper was edited by Ulla Wandinger and reviewed by two anonymous referees.
Behrenfeld, M. J., Hu, Y., O'Malley, R. T., Boss, E. S., Hostetler, C. A., Siegel, D. A., Sarmiento, J. L., Schulien, J., Hair, J. W., Lu, X., Rodier, S., and Scarino, A. J.: Annual boom–bust cycles of polar phytoplankton biomass revealed by space-based lidar, Nat. Geosci., 10, 118–122, https://doi.org/10.1038/NGEO2861, 2016.
Chadyšienė, R. and Girgždys, A.: Ultraviolet radiation albedo of natural surfaces, J. Environ. Eng. Landsc., 16, 83–88, https://doi.org/10.3846/1648-6897.2008.16.83-88, 2008.
Chakraborty, S., Jiang, J. H., Su, H., and Fu, R.: Deep convective evolution from shallow clouds over the Amazon and Congo rainforests, J. Geophys. Res.-Atmos., 125, e2019JD030962, https://doi.org/10.1029/2019JD030962, 2020.
Dmitrovic, S., Hair, J. W., Collister, B. L., Crosbie, E., Fenn, M. A., Ferrare, R. A., Harper, D. B., Hostetler, C. A., Hu, Y., Reagan, J. A., Robinson, C. E., Seaman, S. T., Shingler, T. J., Thornhill, K. L., Vömel, H., Zeng, X., and Sorooshian, A.: High Spectral Resolution Lidar – generation 2 (HSRL-2) retrievals of ocean surface wind speed: methodology and evaluation, Atmos. Meas. Tech., 17, 3515–3532, https://doi.org/10.5194/amt-17-3515-2024, 2024.
Dionisi, D., Bucci, S., Cesarini, C., Colella, S., D'Alimonte, D., Di Ciolo, L., Di Girolamo, P., Di Paolantonio, M., Franco, N., Gostinicchi, G., Kajiyama, T., Liberti, G. L., Organelli, E., and Santoleri, R.: Ocean color through satellite lidars: the COLOR project, EGU General Assembly 2023, Vienna, Austria, 24–28 Apr 2023, EGU23-16196, https://doi.org/10.5194/egusphere-egu23-16196, 2023.
Dionisi, D., Bucci, S., Cesarini, C., Colella, S., D'Alimonte, D., Di Ciolo, L., Di Girolamo, P., Di Paolantonio, M., Franco, N., Gostinicchi, G., Giuliano, G., Kajiyama, T., Organelli, E., Santoleri, R., and Liberti, G. L.: Exploring the potential of Aeolus lidar mission for ocean color applications, Remote Sens. Environ., 313, 114341, https://doi.org/10.1016/j.rse.2024.114341, 2024.
Donovan, D. P., van Zadelhoff, G.-J., Wang, P., and Labzovskii, L.: ATLID Algorithms Applied to ALADIN, in: Proceedings of the 30th International Laser Radar Conference (ILRC 2022), Big Sky, Montana, USA, 26 June–1 July 2022, 731–738, 2022.
Donovan, D. P., Kollias, P., Velázquez Blázquez, A., and van Zadelhoff, G.-J.: The generation of EarthCARE L1 test data sets using atmospheric model data sets, Atmos. Meas. Tech., 16, 5327–5356, https://doi.org/10.5194/amt-16-5327-2023, 2023.
Ehlers, F., Flament, T., Dabas, A., Trapon, D., Lacour, A., Baars, H., and Straume-Lindner, A. G.: Optimization of Aeolus' aerosol optical properties by maximum-likelihood estimation, Atmos. Meas. Tech., 15, 185–203, https://doi.org/10.5194/amt-15-185-2022, 2022.
Flament, T., Trapon, D., Lacour, A., Dabas, A., Ehlers, F., and Huber, D.: Aeolus L2A aerosol optical properties product: standard correct algorithm and Mie correct algorithm, Atmos. Meas. Tech., 14, 7851–7871, https://doi.org/10.5194/amt-14-7851-2021, 2021.
GMAO (Global Modeling and Assimilation Office): inst3_3d_asm_Cp: MERRA-2 3D IAU State, Meteorology Instantaneous 3-hourly (p-coord, 0.625x0.5L42), version 5.12.4, Goddard Space Flight Center Distributed Active Archive Center (GSFC DAAC), Greenbelt, MD, USA, 2015.
Han, L., Tsunekawa, A., Tsubo, M., He, C., and Shen, M.: Spatial variations in snow cover and seasonally frozen ground over northern China and Mongolia, 1988–2010, Global Planet. Change, 116, 139–148, https://doi.org/10.1016/j.gloplacha.2014.02.008, 2014.
He, M., Hu, Y., Huang, J. P., and Stamnes, K.: Aerosol optical depth under “clear” sky conditions derived from sea surface reflection of lidar signals, Opt. Express, 24, A1618, https://doi.org/10.1364/OE.24.0A1618, 2016.
Hu, Y., Stamnes, K., Vaughan, M., Pelon, J., Weimer, C., Wu, D., Cisewski, M., Sun, W., Yang, P., Lin, B., Omar, A., Flittner, D., Hostetler, C., Trepte, C., Winker, D., Gibson, G., and Santa-Maria, M.: Sea surface wind speed estimation from space-based lidar measurements, Atmos. Chem. Phys., 8, 3593–3601, https://doi.org/10.5194/acp-8-3593-2008, 2008.
Jamet, C. E., Belakebi-Joly, F. Poustomis, E., Lecuyer, X., Mériaux, Q., Cazenave, J., Delanoë, J., and Flamant, C.: Aeolus+ Innovation AEOLUS Ocean Colour (AOC), Presented at Aeolus Science Conference 22–26 May 2023, Rodos Palace Hotel, Rhodes Island, Greece, 2023.
Jenks, G. F.: The Data Model Concept in Statistical Mapping, International Yearbook of Cartography, 7, 186–190, 1967.
Josset, D., Pelon, J., Protat, A., and Flamant, C.: New approach to determine aerosol optical depth from combined CALIPSO and CloudSat ocean surface echoes, Geophys. Res. Lett., 35, L10805, https://doi.org/10.1029/2008GL033442, 2008.
Josset, D., Pelon, J., and Hu, Y.: Multi-Instrument Calibration Method Based on a Multiwavelength Ocean Surface Model, IEEE Geosci. Remote S., 7, 195–199, https://doi.org/10.1109/LGRS.2009.2030906, 2010.
Josset, D., Pelon, J., Pascal, N., Hu, Y., and Hou, W.: On the Use of CALIPSO Land Surface Returns to Retrieve Aerosol and Cloud Optical Depths, IEEE T. Geosci. Remote, 56, 3256–3264, https://doi.org/10.1109/TGRS.2018.2796850, 2018.
Kavaya, M. J., Menzies, R. T., Haner, D. A., Oppenheim, U. P., and Flamant, P. H.: Target reflectance measurements for calibration of lidar atmospheric backscatter data, Appl. Optics, 22, 2619–2628, https://doi.org/10.1364/AO.22.002619, 1983.
Labzovskii, L., van Zadelhoff, G.-J., Donovan, D., De Kloe, J., and Josset, D.: How sensitive are Aeolus Lidar Surface Returns (LSR) to the types of surface? Insights for LSR-based retrieval of AOD over ocean by using Aeolus. Presented at EGU General Assembly 2022. https://doi.org/10.5194/egusphere-egu22-12079, 2022.
Labzovskii, L. D., Van Zadelhoff, G. J., Tilstra, L. G., De Kloe, J., Donovan, D. P., and Stoffelen, A.: High sensitivity of Aeolus UV surface returns to surface reflectivity, Sci. Rep., 13, 17552, https://doi.org/10.1038/s41598-023-44525-5, 2023.
Li, Z., Lemmerz, C., Paffrath, U., Reitebuch, O., and Witschas, B.: Airborne Doppler Lidar Investigation of Sea Surface Reflectance at a 355-nm Ultraviolet Wavelength, J. Atmos. Ocean. Tech., 27, 693–704, https://doi.org/10.1175/2009JTECHA1302.1, 2010.
Lu, X., Hu, Y., Trepte, C., Zeng, S., and Churnside, J. H.: Ocean subsurface studies with the CALIPSO spaceborne lidar, J. Geophys. Res.-Oceans, 119, 4305–4317, https://doi.org/10.1002/2014JC009970, 2014.
Lu, X., Hu, Y., Yang, Y., Vaughan, M., Liu, Z., Rodier, S., Hunt, W., Powell, K., Lucker, P., and Trepte, C.: Laser pulse bidirectional reflectance from CALIPSO mission, Atmos. Meas. Tech., 11, 3281–3296, https://doi.org/10.5194/amt-11-3281-2018, 2018.
Lu, X., Hu, Y., Yang, Y., Neumann, T., Omar, A., Baize, R., Vaughan, M., Rodier, S., Getzewich, B., Lucker, P., Trepte, C., Hostetler, C., and Winker, D.: New Ocean Subsurface Optical Properties From Space Lidars: CALIOP/CALIPSO and ATLAS/ICESat-2, Earth Space Sci., 8, e2021EA001839, https://doi.org/10.1029/2021EA001839, 2021.
Lux, O., Lemmerz, C., Weiler, F., Marksteiner, U., Witschas, B., Rahm, S., Schäfler, A., and Reitebuch, O.: Airborne wind lidar observations over the North Atlantic in 2016 for the pre-launch validation of the satellite mission Aeolus, Atmos. Meas. Tech., 11, 3297–3322, https://doi.org/10.5194/amt-11-3297-2018, 2018.
Lux, O., Lemmerz, C., Weiler, F., Marksteiner, U., Witschas, B., Rahm, S., Geiß, A., and Reitebuch, O.: Intercomparison of wind observations from the European Space Agency's Aeolus satellite mission and the ALADIN Airborne Demonstrator, Atmos. Meas. Tech., 13, 2075–2097, https://doi.org/10.5194/amt-13-2075-2020, 2020.
Lux, O., Witschas, B., Geiß, A., Lemmerz, C., Weiler, F., Marksteiner, U., Rahm, S., Schäfler, A., and Reitebuch, O.: Quality control and error assessment of the Aeolus L2B wind results from the Joint Aeolus Tropical Atlantic Campaign, Atmos. Meas. Tech., 15, 6467–6488, https://doi.org/10.5194/amt-15-6467-2022, 2022.
Maignan, F., Bréon, F.-M., and Lacaze, R.: Bidirectional reflectance of Earth targets: Evaluation of analytical models using a large set of spaceborne measurements with emphasis on the Hot Spot, Remote Sens. Environ., 90, 210–220, https://doi.org/10.1016/j.rse.2003.12.006, 2004.
Morel, A., Claustre, H., and Gentili, B.: The most oligotrophic subtropical zones of the global ocean: similarities and differences in terms of chlorophyll and yellow substance, Biogeosciences, 7, 3139–3151, https://doi.org/10.5194/bg-7-3139-2010, 2010.
Parkinson, C. L.: Global Sea Ice Coverage from Satellite Data: Annual Cycle and 35-Yr Trends, J Climate, 27, 9377–9382, https://doi.org/10.1175/JCLI-D-14-00605.1, 2014.
Randerson, J. T., Chen, Y., Van Der Werf, G. R., Rogers, B. M., and Morton, D. C.: Global burned area and biomass burning emissions from small fires, J. Geophys. Res., 117, 2012JG002128, https://doi.org/10.1029/2012JG002128, 2012.
Reagan, J. A. and Zielinskie, D. A.: Spaceborne lidar remote sensing techniques aided by surface returns, Opt. Eng., 30, 96–102, https://doi.org/10.1117/12.55776, 1991.
Reitebuch, O., Huber, D., Nikolaus, I.: ADM-Aeolus Algorithm Theoretical Basis Document ATBD Level1B Products, 45, European Space Agency, https://earth.esa.int/eogateway/documents/20142/37627/Aeolus-L1B-Algorithm-ATBD.pdf (last accessed: 23 February 2023), 2018.
Rodgers, C. D.: Inverse Methods For Atmospheric Sounding: Theory And Practice, Series On Atmospheric, Oceanic And Planetary Physics, Vol. 2, World Scientific, ISBN 981022740X, 9789810227401, 2000.
Sadeghfam, S., Hassanzadeh, Y., Nadiri, A. A., and Khatibi, R.: Mapping groundwater potential field using catastrophe fuzzy membership functions and Jenks optimization method: a case study of Maragheh-Bonab plain, Iran, Environ. Earth Sci., 75, 545, https://doi.org/10.1007/s12665-015-5107-y, 2016.
Shipley, S. T., Tracy, D. H., Eloranta, E. W., Trauger, J. T., Sroga, J. T., Roesler, F. L., and Weinman, J. A.: High spectral resolution lidar to measure optical scattering properties of atmospheric aerosols. 1: Theory and instrumentation, Appl. Optics, 22, 3716–3724, https://doi.org/10.1364/AO.22.003716, 1983.
Stephens, G. L., Slingo, A., Webb, M. J., Minnett, P. J., Daum, P. H., Kleinman, L., Wittmeyer, I., and Randall, D. A.: Observations of the Earth's Radiation Budget in relation to atmospheric hydrology: 4. Atmospheric column radiative cooling over the world's oceans, J. Geophys. Res., 99, 18585–18604, https://doi.org/10.1029/94JD01151, 1994.
Stoffelen, A., Marseille, G. J., Bouttier, F., Vasiljevic, D., De Haan, S., and Cardinali, C.: ADM-Aeolus Doppler wind lidar Observing System Simulation Experiment, Q. J. Roy. Meteor. Soc., 132, 1927–1947, https://doi.org/10.1256/qj.05.83, 2006.
Tanskanen, A. and Manninen, T.: Effective UV surface albedo of seasonally snow-covered lands, Atmos. Chem. Phys., 7, 2759–2764, https://doi.org/10.5194/acp-7-2759-2007, 2007.
Tilstra, L. G., Tuinder, O. N. E., Wang, P., and Stammes, P.: Surface reflectivity climatologies from UV to NIR determined from Earth observations by GOME-2 and SCIAMACHY, J. Geophys. Res.-Atmos., 122, 4084–4111, https://doi.org/10.1002/2016JD025940, 2017.
Tilstra, L. G., de Graaf, M., Trees, V. J. H., Litvinov, P., Dubovik, O., and Stammes, P.: A directional surface reflectance climatology determined from TROPOMI observations, Atmos. Meas. Tech., 17, 2235–2256, https://doi.org/10.5194/amt-17-2235-2024, 2024.
van Zadelhoff, G.-J., Donovan, D. P., and Wang, P.: Detection of aerosol and cloud features for the EarthCARE atmospheric lidar (ATLID): the ATLID FeatureMask (A-FM) product, Atmos. Meas. Tech., 16, 3631–3651, https://doi.org/10.5194/amt-16-3631-2023, 2023.
Venkata, S. and Reagan, J.: Aerosol Retrievals from CALIPSO Lidar Ocean Surface Returns, Remote Sens.-Basel, 8, 1006, https://doi.org/10.3390/rs8121006, 2016.
Weiler, F.: Bias correction using ground echoes for the airborne demonstrator of the wind lidar on the ADM-Aeolus mission, Master's Thesis, University of Innsbruck, Faculty of Geo- and Atmospheric Sciences, https://diglib.uibk.ac.at/urn:nbn:at:at-ubi:1-7104 (last accessed: 7 May 2024), 2017.
Weiler, F., Rennie, M., Kanitz, T., Isaksen, L., Checa, E., de Kloe, J., Okunde, N., and Reitebuch, O.: Correction of wind bias for the lidar on board Aeolus using telescope temperatures, Atmos. Meas. Tech., 14, 7167–7185, https://doi.org/10.5194/amt-14-7167-2021, 2021.
Winker, D. M., Pelon, J., Coakley Jr., J. A., Ackerman, S. A., Charlson, R. J., Colarco, P. R., Flamant, P., Fu, Q., Hoff, R. M., Kittaka, C., Kubar, T. L., Treut, H. L., Mccormick, M. P., Mégie, G., Poole, L., Powell, K., Trepte, C., Vaughan, M. A., and Wielicki, B. A.: A Global 3D View of Aerosols and Clouds, B. Am. Meteorol. Soc., 91, 1211–1230, https://doi.org/10.1175/2010BAMS3009.1, 2010.


