the Creative Commons Attribution 4.0 License.
the Creative Commons Attribution 4.0 License.
 | 31 Jan 2024
Wall loss of semi-volatile organic compounds in a Teflon bag chamber for the temperature range of 262–298 K: mechanistic insight on temperature dependence
Longkun He
Wenli Liu
Jixuan Wang
Mikinori Kuwata
Yingjun Liu
Teflon bag chambers have long been used for investigating atmospheric chemical processes, including secondary organic aerosol formation. The wall-loss process of gas-phase species in Teflon bag chambers has typically been investigated at around room temperature. Recent laboratory studies started employing Teflon bag chambers at sub-273 K conditions for simulating wintertime and upper-tropospheric environments. However, temperature dependence in vapor-wall-loss processes of semi-volatile organic compounds (SVOCs) in a Teflon bag chamber has not been well investigated. In this study, we experimentally investigated wall-loss processes of C14–C19 n-alkanes in a 1 m3 Teflon bag for the temperature range of 262 to 298 K. Enhanced wall losses of the tested n-alkanes were observed following the decrease in temperature. For instance, 65 % of C14 n-alkane was lost to the wall 15 h after injection at room temperature, while the corresponding value was 95 % at 262 K. The experimental data were analyzed using a two-layer kinetic model, which considers both absorption of gas-phase species to the surface layer of the Teflon wall and diffusion to the inner layer. The experimental data demonstrated that absorption of gas-phase species by the surface layer was enhanced at lower temperatures. The temperature dependence in absorption was well accounted for using the equilibrium-dissolution model of organic compounds to the Teflon surface by considering reduced saturation vapor pressure at lower temperatures. On the contrary, diffusion of n-alkanes from the surface to the inner layer slowed down at reduced temperatures. Mechanistic studies on these processes will need to be conducted in the future to quantitatively predict the influence of temperature-dependent wall-loss processes of SVOCs on laboratory experimental results.
- Article
(2776 KB) - Full-text XML
-
Supplement
(1403 KB) - BibTeX
- EndNote


The environmental chamber is one of the most widely used laboratory systems for studying chemical processes in the atmosphere, including formation of secondary organic aerosol (SOA) (Clark et al., 2016; Nakao et al., 2011; Ng et al., 2007; Song et al., 2005). The environmental chambers are typically made of Teflon films or stainless steel (Cocker et al., 2001; Voigtländer et al., 2012). The existence of walls in the environmental chambers induces losses of both vapors and particles due to their deposition on wall surfaces (McMurry and Grosjean, 1985; Krechmer et al., 2020). Wall loss of gas-phase organic compounds in the environmental chambers can lead to underestimation of SOA mass yields. For instance, injection of seed particles into Teflon bags has been shown to increase SOA yields by a few times due to the reduced relative importance of the chamber wall as a condensation sink in the system (Kroll et al., 2007; Zhang et al., 2014).
Vapor wall loss in Teflon bag chambers, especially that for semi-volatile organic compounds (SVOCs), has been intensively investigated in the last decade (Matsunaga and Ziemann, 2010; Yeh and Ziemann, 2014, 2015; Zhang et al., 2015; Krechmer et al., 2016; Y. L. Huang et al., 2018; Pratap et al., 2020; Yu et al., 2022). For instance, Matsunaga and Ziemann (2010) studied wall-loss processes of alkanes, alkenes, alcohols, and ketones. These previous wall-loss experiments were predominantly conducted at around room temperature (293–303 K), as most of the chamber studies employed the corresponding temperature range (Hidy, 2019). The experimental results were often modeled by assuming equilibrium dissolution of the organic compounds into the Teflon film. A more recent study separately considered the surface and inner layers of the Teflon film for explaining the loss process more quantitatively (Y. L. Huang et al., 2018).
Recently, a growing number of environmental chamber experiments have been conducted at low temperatures to simulate wintertime and upper-tropospheric conditions in the laboratory (W. Huang et al., 2018; Pratap et al., 2019; Quéléver et al., 2019; Simon et al., 2020; Wang et al., 2022). For instance, some SOA formation experiments have been conducted for the temperature range down to 223 K using stainless-steel chambers such as the Aerosol Interaction and Dynamics in the Atmosphere (AIDA) and Cosmics Leaving OUtdoor Droplets (CLOUD) chambers (W. Huang et al., 2018; Simon et al., 2020). Teflon bag chambers have also been employed for the temperature range down to 258 K (Kristensen et al., 2017; Deng et al., 2021). These studies demonstrate that temperature is an important parameter determining both mass yields and chemical composition of SOA. Vapor wall loss of SVOCs in the environmental chambers for the corresponding temperature range needs to be understood for better interpreting these experimental data in a quantitative way. So far only one group has attempted to investigate vapor wall loss below room temperature by measuring the size evolution of levoglucosan particles injected into a Teflon chamber (Pratap et al., 2020). However, the experimental results were confounded by slow evaporation of levoglucosan from particles at low temperatures.
This study investigated vapor wall loss of C14–C19 n-alkanes in a Teflon chamber for the temperature range of 262 to 298 K by monitoring the evolution of their gas-phase concentrations following a pulse release. The wall-loss process was investigated as a function of temperature. The experimental results were analyzed using the two-layer kinetic model, which considers partitioning of gas-phase SVOCs to the surface layer and further diffusion to the inner layer. Temperature effects on the two processes were evaluated separately.
2.1 Teflon chamber experiments
Figure 1 shows the experimental setup. The experiment was conducted using a fluorinated ethylene propylene (FEP) bag with a volume of 1 m3. The thickness of the FEP film for the bag was 75 µm. The dimensions of the bag were 260 cm × 55 cm × 70 cm. The surface-area-to-volume ratio of the chamber was 7.26 m−1. The chamber volume was experimentally validated by employing CO2 as a tracer (Fig. S1 in the Supplement). The timescale for CO2 to be well mixed in the bag after a pulse injection was approximately 30 min (Fig. S1). The bag was newly purchased for the experiment, meaning that it was employed for no other experiments. The bag was installed in a chest freezer (Model 2288, Nixue Inc.), which was equipped with an additional internal thermal insulation layer. Two fans were installed in the freezer (outside the bag) to facilitate mixing of air so that air temperature in the freezer was uniform. The temperature of the freezer was measured at three points using temperature sensors (Fig. 1). Temporal variation in temperature was ±0.5 K at 262 K.
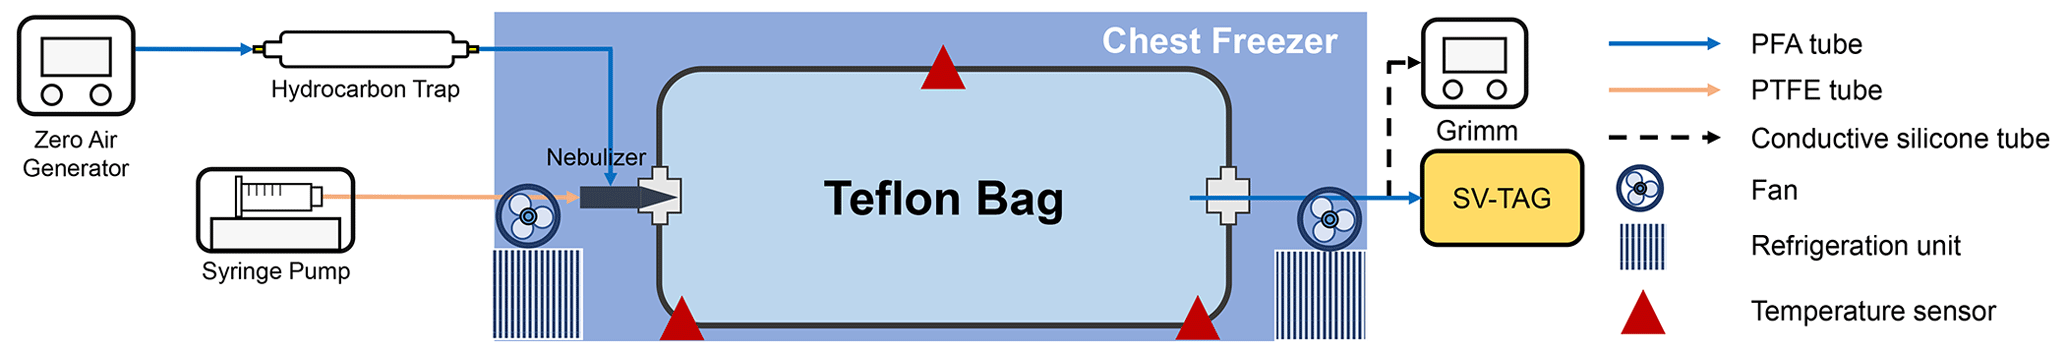
Throughout the experiments, purified air was employed. The purified air was produced using a zero-air generator (model 747-30, AADCO Instruments Inc.) and further purified using a hydrocarbon trap (BHT-2, Agilent Technologies Inc.). Hydrocarbon concentration in the purified air was less than 5 ppbv. Relative humidity (RH) was less than 0.1 %.
Solutions containing C14–C19 n-alkanes (Konoscience Inc., > 98 %) were prepared and injected into the chamber. Hexane (Fisher Chemical Co., HPLC Grade) was employed as the solvent. The purities and saturation vapor pressures of all chemicals are given in Table S1. The solutions were injected into the chamber using a syringe pump (Fusion 200 Touch, Chemyx Inc.) and a nebulizer (TR-30-A1, Meinhard Inc.) through polytetrafluoroethylene (PTFE) tubing, as shown in Fig. 1. The use of the nebulizer expedited the evaporation of the solution.
Eight sets of wall-loss experiments were conducted in the temperature range of 262 to 298 K. Prior to each experiment, the chamber was heated to ∼ 320 K and continuously flushed using purified air. The cleaning process lasted for 2–3 d until the concentration of investigated n-alkanes dropped to the background level. To start an experiment, the chamber was switched to batch mode, and the solution was injected into the chamber at room temperature. The injection lasted for 13 min, with a liquid flow rate of 100 µL min−1. The airflow rate of the nebulizer was 0.7 L min−1. The resulting initial concentrations (C0) of individual n-alkanes in the chamber ranged from 4 to 50 µg m−3 assuming no wall loss, which was lower than 20 % of their saturation concentrations under the corresponding experimental temperature to avoid particle formation. The solution used for low-temperature experiments (< 278 K) did not contain C18 and C19 n-alkanes to avoid formation of particles. For experiments below room temperature, the cooling system of the freezer was turned on 1 h after the completion of the injection. The operation procedure was employed to avoid homogeneous nucleation and subsequent condensational growth of aerosol particles. The validity of employing this post-cooled operation procedure was demonstrated by comparison with a pre-cooled chamber result at 270 K (Fig. S2). Measurements using an optical particle counter (11-D, GRIMM Aerosol Technik Ainring, Germany) experimentally confirmed negligible abundance of aerosol particles in the chamber (< 0.5 µg m−3). It took ∼ 3 h for the temperature in the freezer to drop to a stable level after injection (Fig. S3). Although the air in the bag leaked out during experiments due to compression of the bag by its own weight, absence of intrusion of room air into the bag was confirmed by observing no changes in contaminant signals (Table S2). The gas-phase concentrations of n-alkanes were therefore unaffected by the changes in bag volume.
Concentrations of SVOCs in the chamber were quantified using the semi-volatile thermal desorption aerosol gas chromatograph (SV-TAG, Aerodyne Research Inc. & Aerosol Dynamic Inc., USA) (Zhao et al., 2013). The gas chromatography–mass spectrometer (GC–MS) (7890B, Agilent Technologies Inc.) was employed for the system. Detailed descriptions of the SV-TAG operation and performance tests were presented in our previous papers (Li et al., 2022a, b). Herein, chamber air was sampled through ∼ 1 m long perfluoroalkoxy alkane (PFA) tubing (0.25 in. in diameter). Prior to sampling, the chamber air passed through the PFA tubing at 0.5 L min−1 for at least 20 min for passivation of the tubing wall (Matsunaga and Ziemann, 2010). Samples were periodically collected for 5 min at 4 L min−1 each time at 1–15 h after injection. As the absence of particles was confirmed, only gas-phase SVOCs were sampled by the SV-TAG. The instrument response to n-alkanes was calibrated with standards before and after each experiment (Fig. S4), utilizing the in situ automatic injection system (Isaacman et al., 2011). The gas-phase concentrations of SVOCs were calculated from the measured quantity of SVOCs and sampled air volume.
2.2 Kinetic model
Herein we used a unified vapor-wall-loss transport model developed by Y. L. Huang et al. (2018) to fit the experimental data. Figure 2 shows the concept of the model. Briefly, SVOCs partition between the gas phase and the surface of the FEP film. Subsequently, the absorbed SVOCs may diffuse to the inner layer of the film. As the thickness of the FEP film (75 µm) is a couple of orders larger than that of the surface layer (∼ 5 nm) (Y. L. Huang et al., 2018), the inner layer is assumed as an infinite sink. As a result, the diffusion process of SVOCs from the inner layer to the film surface is ignored. A list of all the parameters is provided in Appendix A. The governing equations without and with considering diffusion to the inner layer are presented below, respectively.
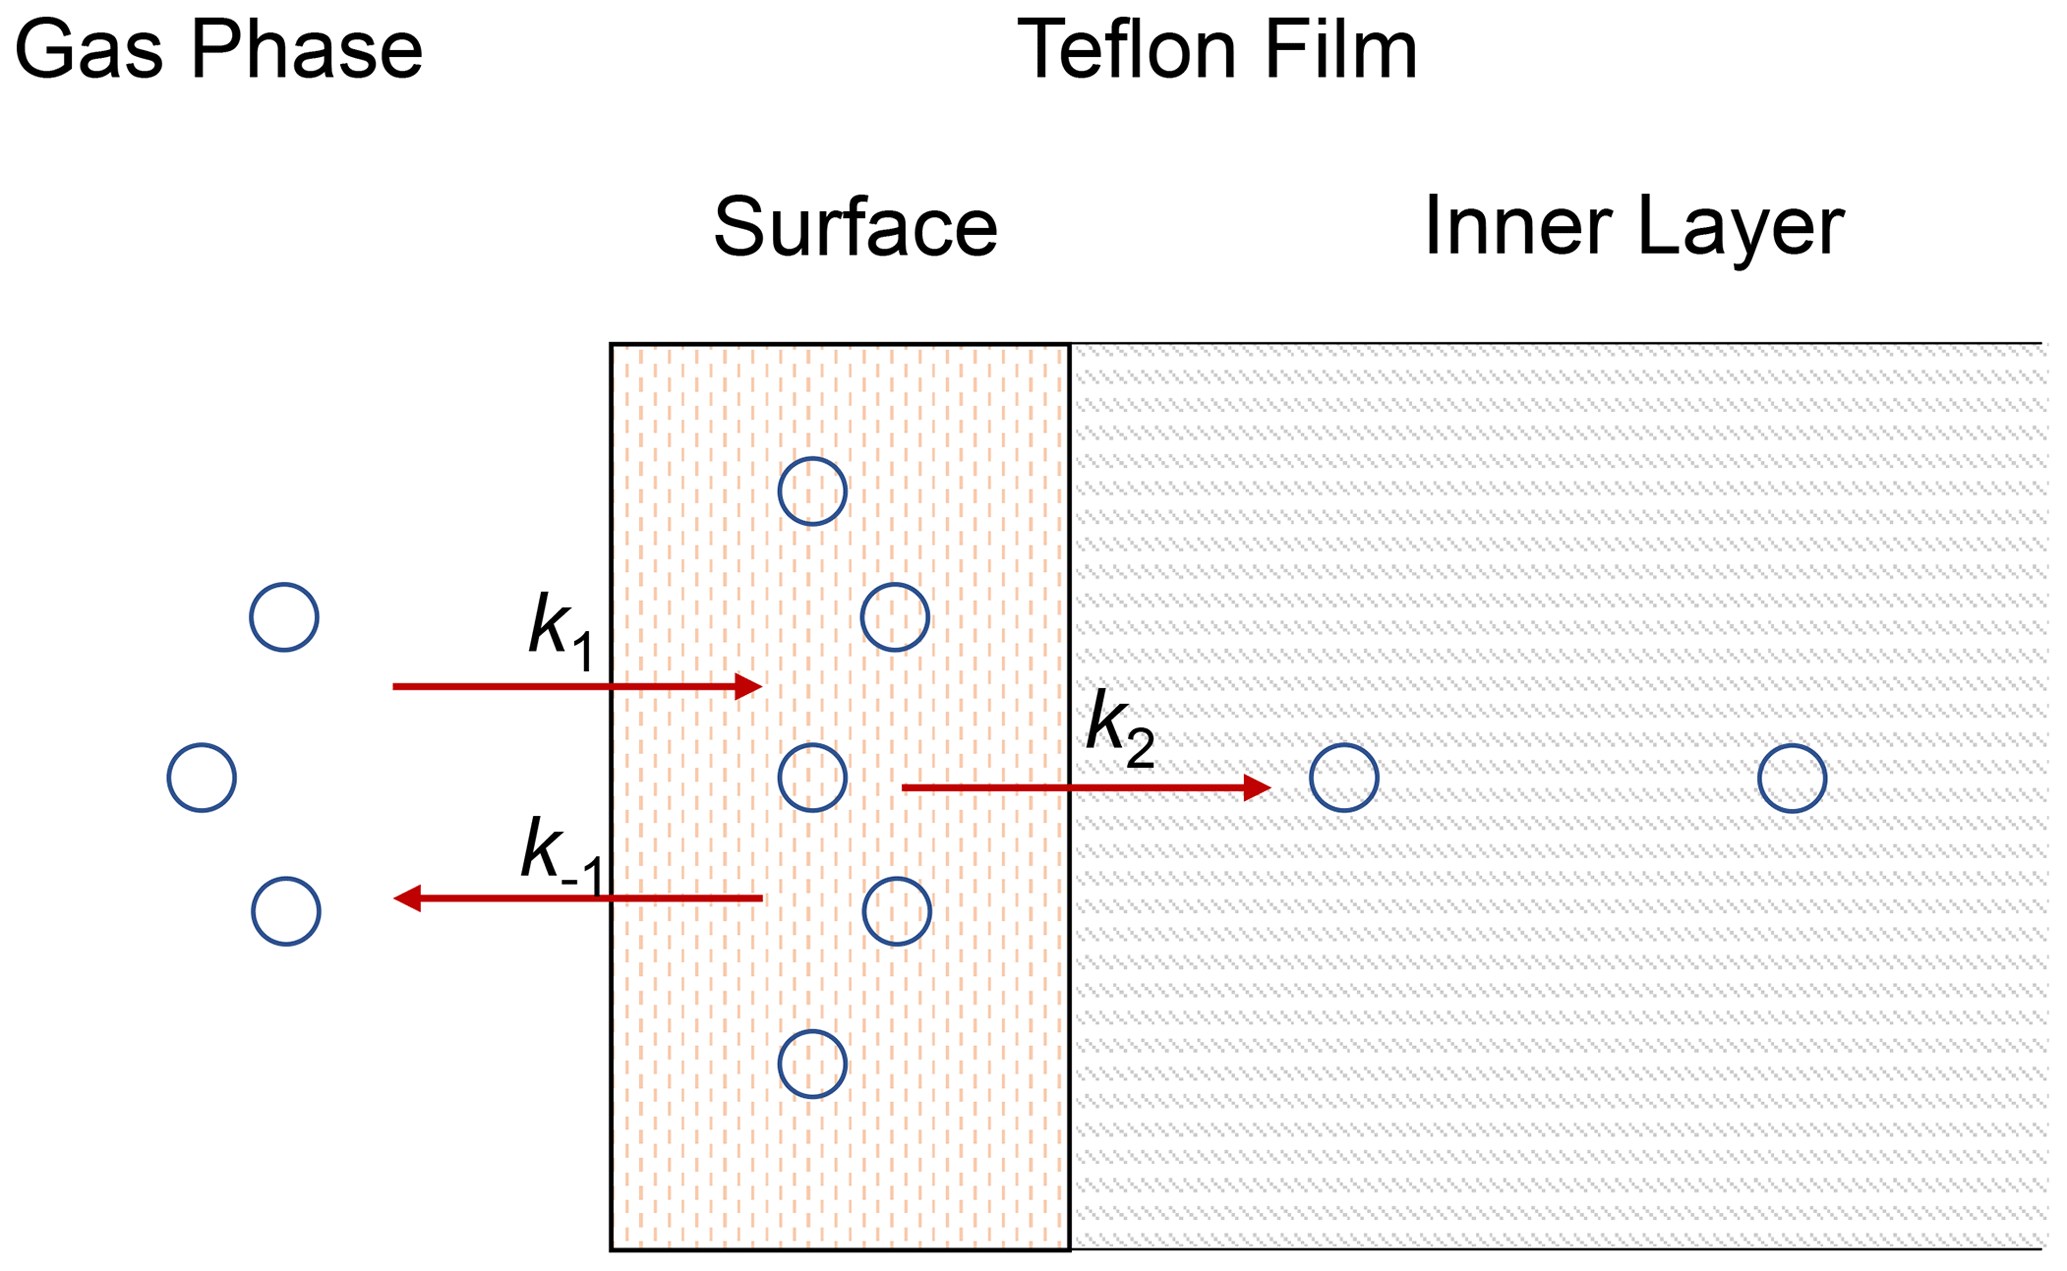
Figure 2Schematic diagram of wall-loss process. Compounds partition between the gas phase and the surface layer with forward and backward rates (k1 and k−1). Compounds in the surface layer undergo irreversible diffusion into the inner layer with first-order loss rate (k2).
-
Without considering the diffusion process in the inner layer, the wall-loss process is solely controlled by partitioning of SVOCs between the gas phase and surface layer and can be described as follows:
where k1 and k−1 are forward and backward rate constants in the process. The corresponding first-order kinetic equations are
where Cgas and Csurface are the SVOC concentrations in the gas phase and on the wall surface, respectively. It should be noted that Csurface was defined as the total mass of SVOCs on the wall surface divided by the chamber volume, following previous studies (Matsunaga and Ziemann, 2010; Yeh and Ziemann, 2014, 2015). This model has been commonly used to interpret the experimental data of vapor wall loss in previous studies (Matsunaga and Ziemann, 2010; Yeh and Ziemann, 2014, 2015; Zhang et al., 2015).
The gas–surface equilibrium timescale τsurface and equilibrium constant Keq can be obtained by
-
Considering the diffusion process in the inner layer, the whole vapor-wall-loss process can be formulated as follows:
where k2 is the first-order loss rate constant in the diffusion process. Correspondingly, the kinetic processes for Cgas and Csurface can be described by the following equations:
The diffusion process has the first-order decay timescale τinner of . If (i.e., τinner≫τsurface), gas–surface partitioning occurs much faster than the diffusion process to the inner layer. In this case, the apparent first-order decay loss constant of SVOC from the gas phase can asymptotically be represented as (Y. L. Huang et al., 2018)
The data analysis and model fitting were conducted using Wolfram Mathematica 13.1. The controlling factors of individual parameters in the above equations were previously discussed by Y. L. Huang et al. (2018).
3.1 Wall loss of n-alkanes at room temperature
An example of the temporal profile for C14–C19 n-alkanes during the experiment at 298 K is shown in Fig. 3. The figure demonstrates the temporal change of , where C0 indicates the initial concentration of n-alkanes. The values of for each n-alkane exhibited similar temporal patterns. During the first 1 h following the injection, exponentially decreased. After that, gradual decreases in were observed. For example, the decline in gas fraction for C14 n-alkane during the first hour accounted for 71 % of the total change in over the whole experimental period of 15 h. The values of decreased with the increase in carbon number, indicating enhanced wall loss. The values of at 15 h after injection were 0.32, 0.25, 0.16, 0.097, 0.069, and 0.037 for C14–C19 n-alkanes, respectively.
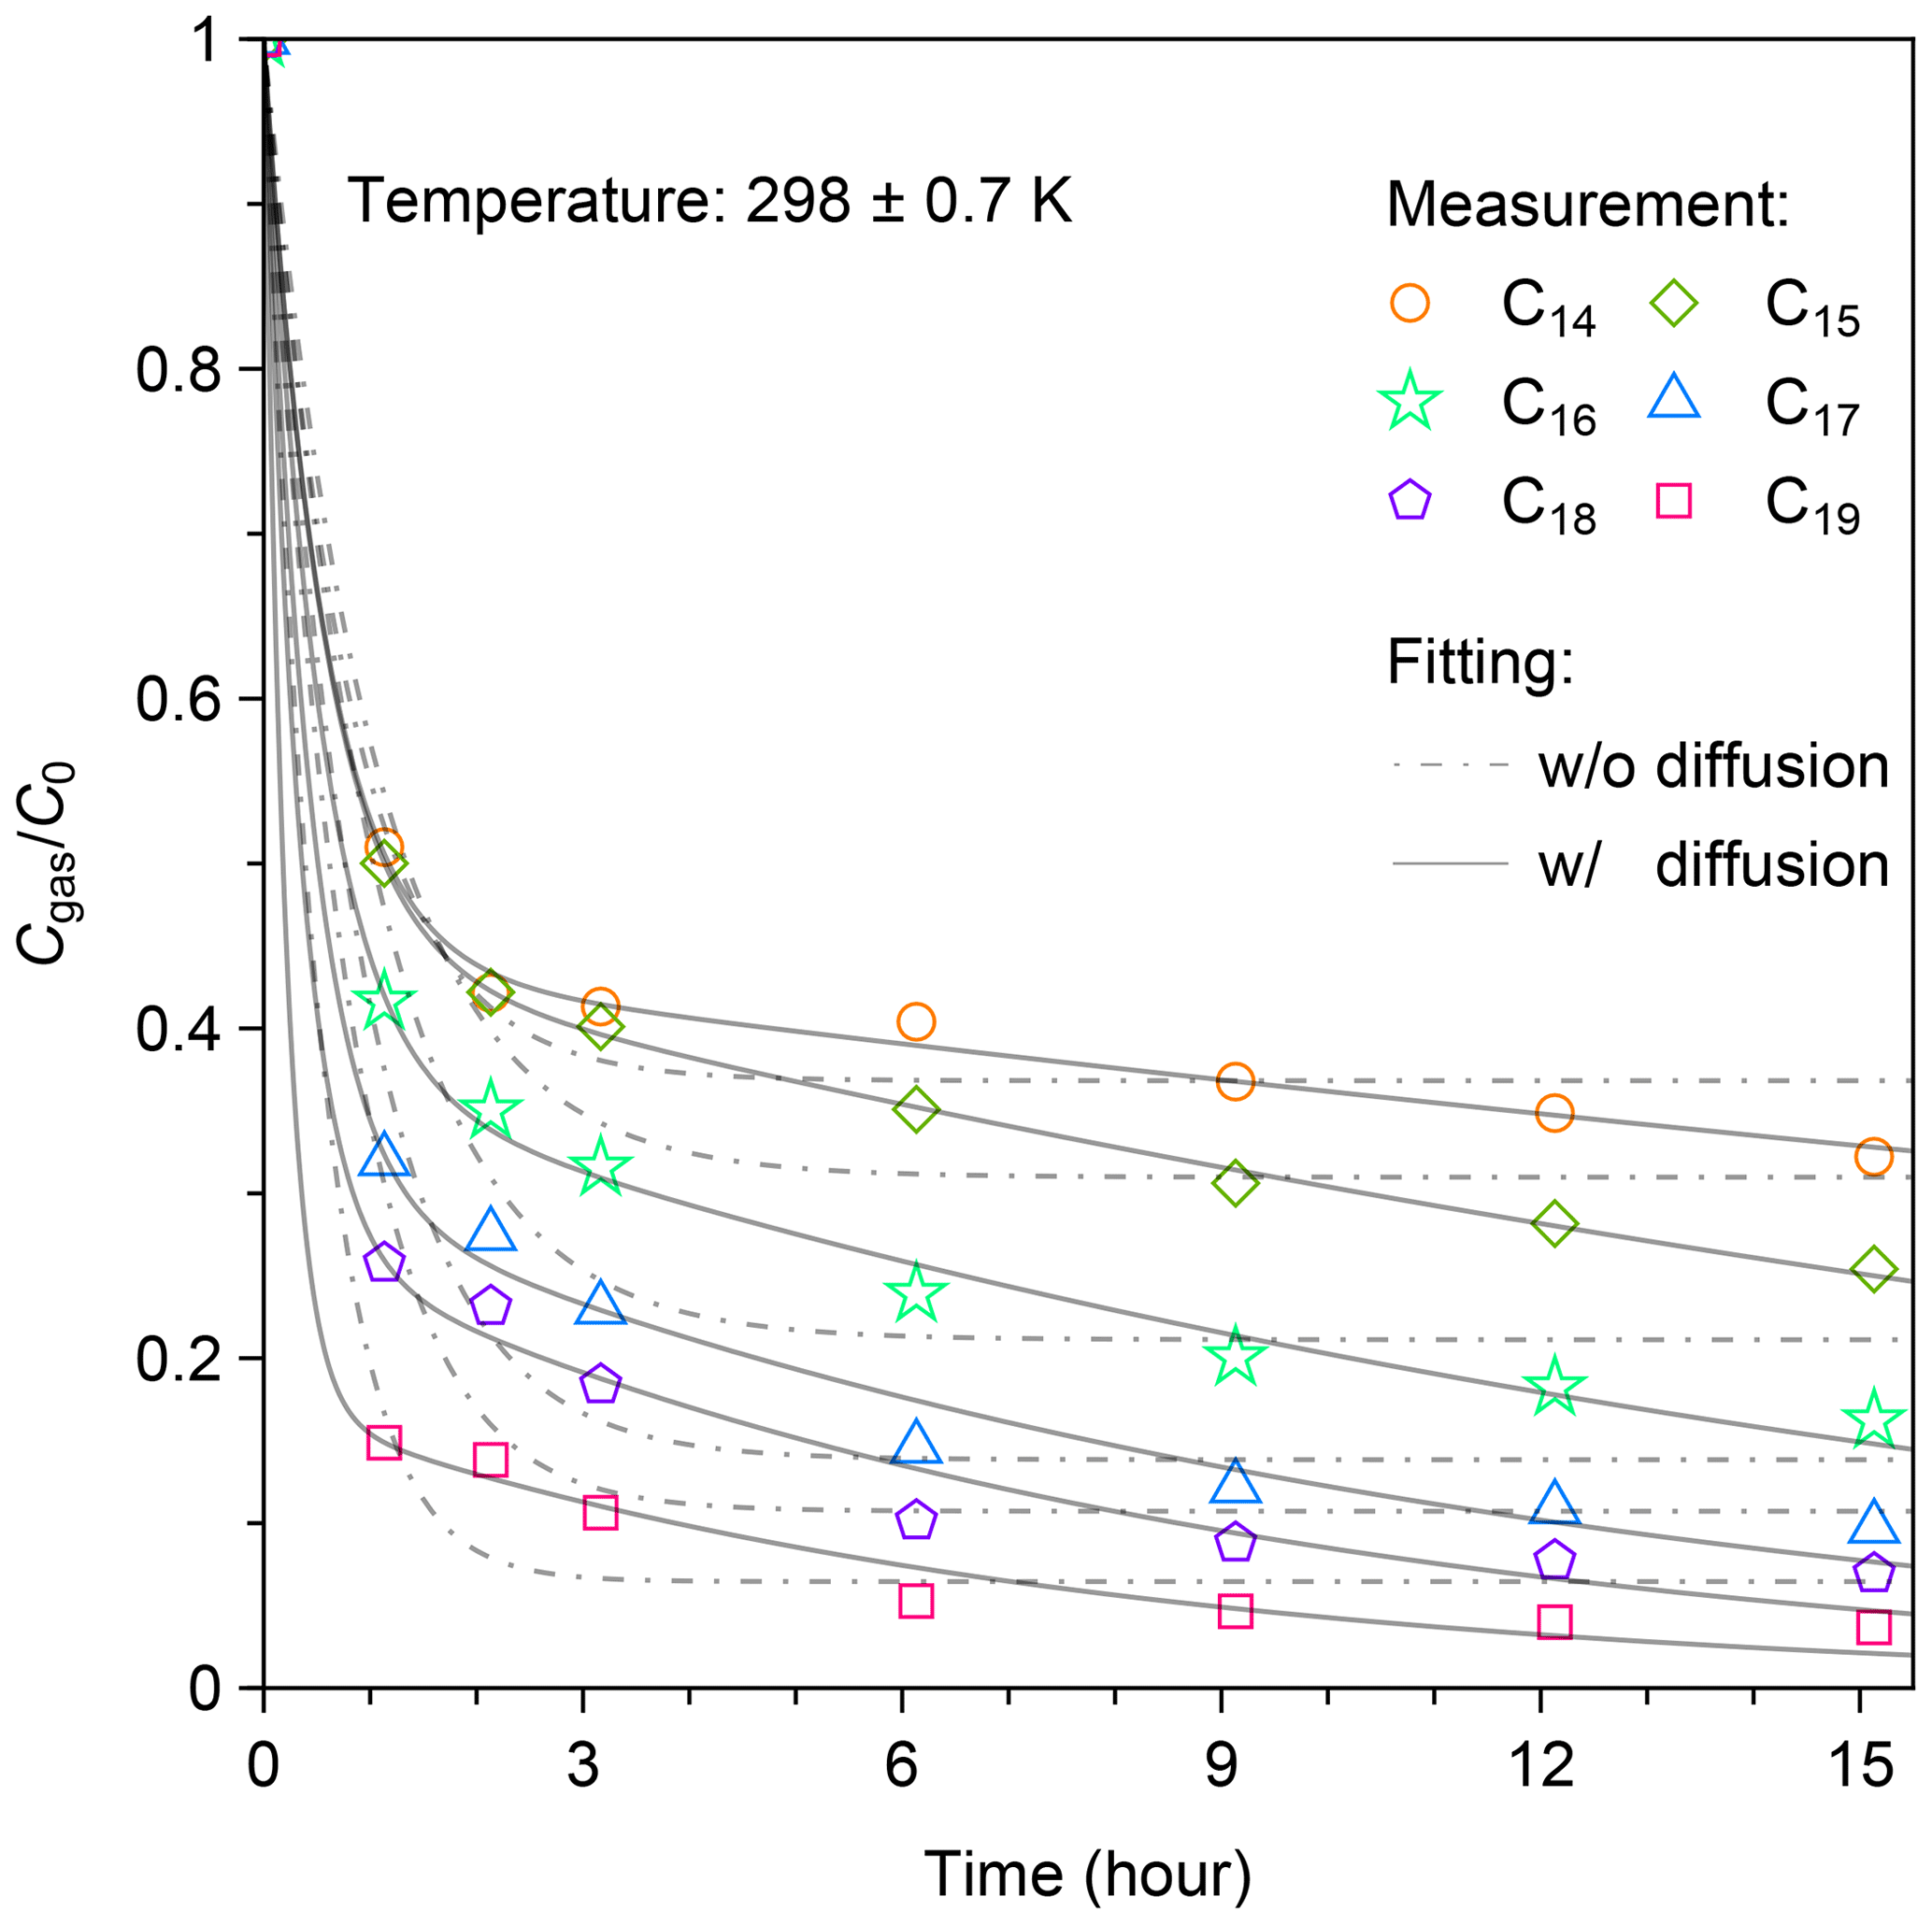
Figure 3Temporal variation in for C14–C19 n-alkanes at 298 ± 0.7 K following injection. Cgas is the concentration of each n-alkane in the gas phase, and C0 is the corresponding initial concentration of each n-alkane. The two-layer kinetic sorption model (Sect. 2.2) was employed to fit the data (solid black line). The dot-dashed black lines show the fitting result to the model that ignores the diffusion process to the inner layer (i.e., k2 = 0).
The experimental result can be fitted well using the two-layer model, but the fits deteriorate in the case that diffusion in the inner layer is neglected (Fig. 3). The optimized parameter sets are shown in Table S3. Mass fractions of injected chemical species in the gas-, surface-, and inner-layer phases that were estimated using the model are shown in Fig. S5. In the case of the most volatile compound (C14 n-alkane), the maximum mass fraction in the surface phase occurred at 2 h after injection. Subsequently, the mass fractions for the compound in both the gas phase and surface layer gradually decreased. During this period, the ratio of the mass in the surface layer to that in the gas phase stabilized at 1.33. The mass fraction of the compound in the inner layer steadily increased, reaching 0.22 at 15 h after injection.
In the case of the least volatile compound (C19 n-alkane), the mass fraction in the surface layer reached the maximum (∼ 76 %) approximately 1 h after injection, accounting for the rapid decrease in the observed concentration in the gas phase. Subsequently, mass fractions of the compound in the gas phase and in the surface layer decreased in proportion. The concentration ratio of the gas phase and surface layer stayed constant (Fig. S5). The mass fraction of the compound in the inner layer kept increasing during the experiment. At 15 h after injection, 87 % of the compound existed in the inner layer.
The timescale for n-alkanes to reach partitioning equilibrium between the gas and surface phases is estimated to be 12–35 min, consistent with literature data. For example, Matsunaga and Ziemann (2010) reported that the corresponding timescale for C8–C16 alkanes was 60 ± 20 min. The corresponding value for oxygenated organic compounds was reported as 26 ± 23 min (Yeh and Ziemann, 2015).
Our result for the mass transfer of SVOCs to the inner layer can also be compared with a previous study. The rates for the decrease in for C14–C19 n-alkanes were 0.6 % h−1–1.3 % h−1 after the partitioning between the gas phase and surface layer reached equilibrium (i.e., 3–15 h). Yeh and Ziemann (2015) reported the corresponding value for 2-ketones as approximately 1 % h−1 for the timescale of 7 h. They suggested that the value is close to the theoretical value for the Fickian diffusion loss rate (∼ 0.5 % h−1).
3.2 Temperature dependence of wall loss of n-alkanes
Figure 4a summarizes the values of for all experiments at 3 h after injection. The data for this sampling time were selected, as the loss of gas-phase species by partitioning to the surface layer accounted for the dominant portion of the decline in the gas-phase concentration. Generally, was lower for less volatile compounds and at lower temperatures, suggesting enhanced partitioning of n-alkanes to the chamber wall. The data for room temperature ( equal to 0.47, 0.45, 0.34, 0.24, 0.17, and 0.091 for C14, C15, C16, C17, C18, and C19 n-alkanes) were smaller than those reported by a previous study. Namely, Matsunaga and Ziemann (2010) quantified the corresponding values for equilibration between the gas and surface phases for C14–C16 n-alkanes as ∼ 80 %–90 %. The enhanced partitioning to the surface layer in our study is likely due to the chamber for the present study having a larger surface-area-to-volume ratio (7.26 m−1 versus 3.39 m−1).
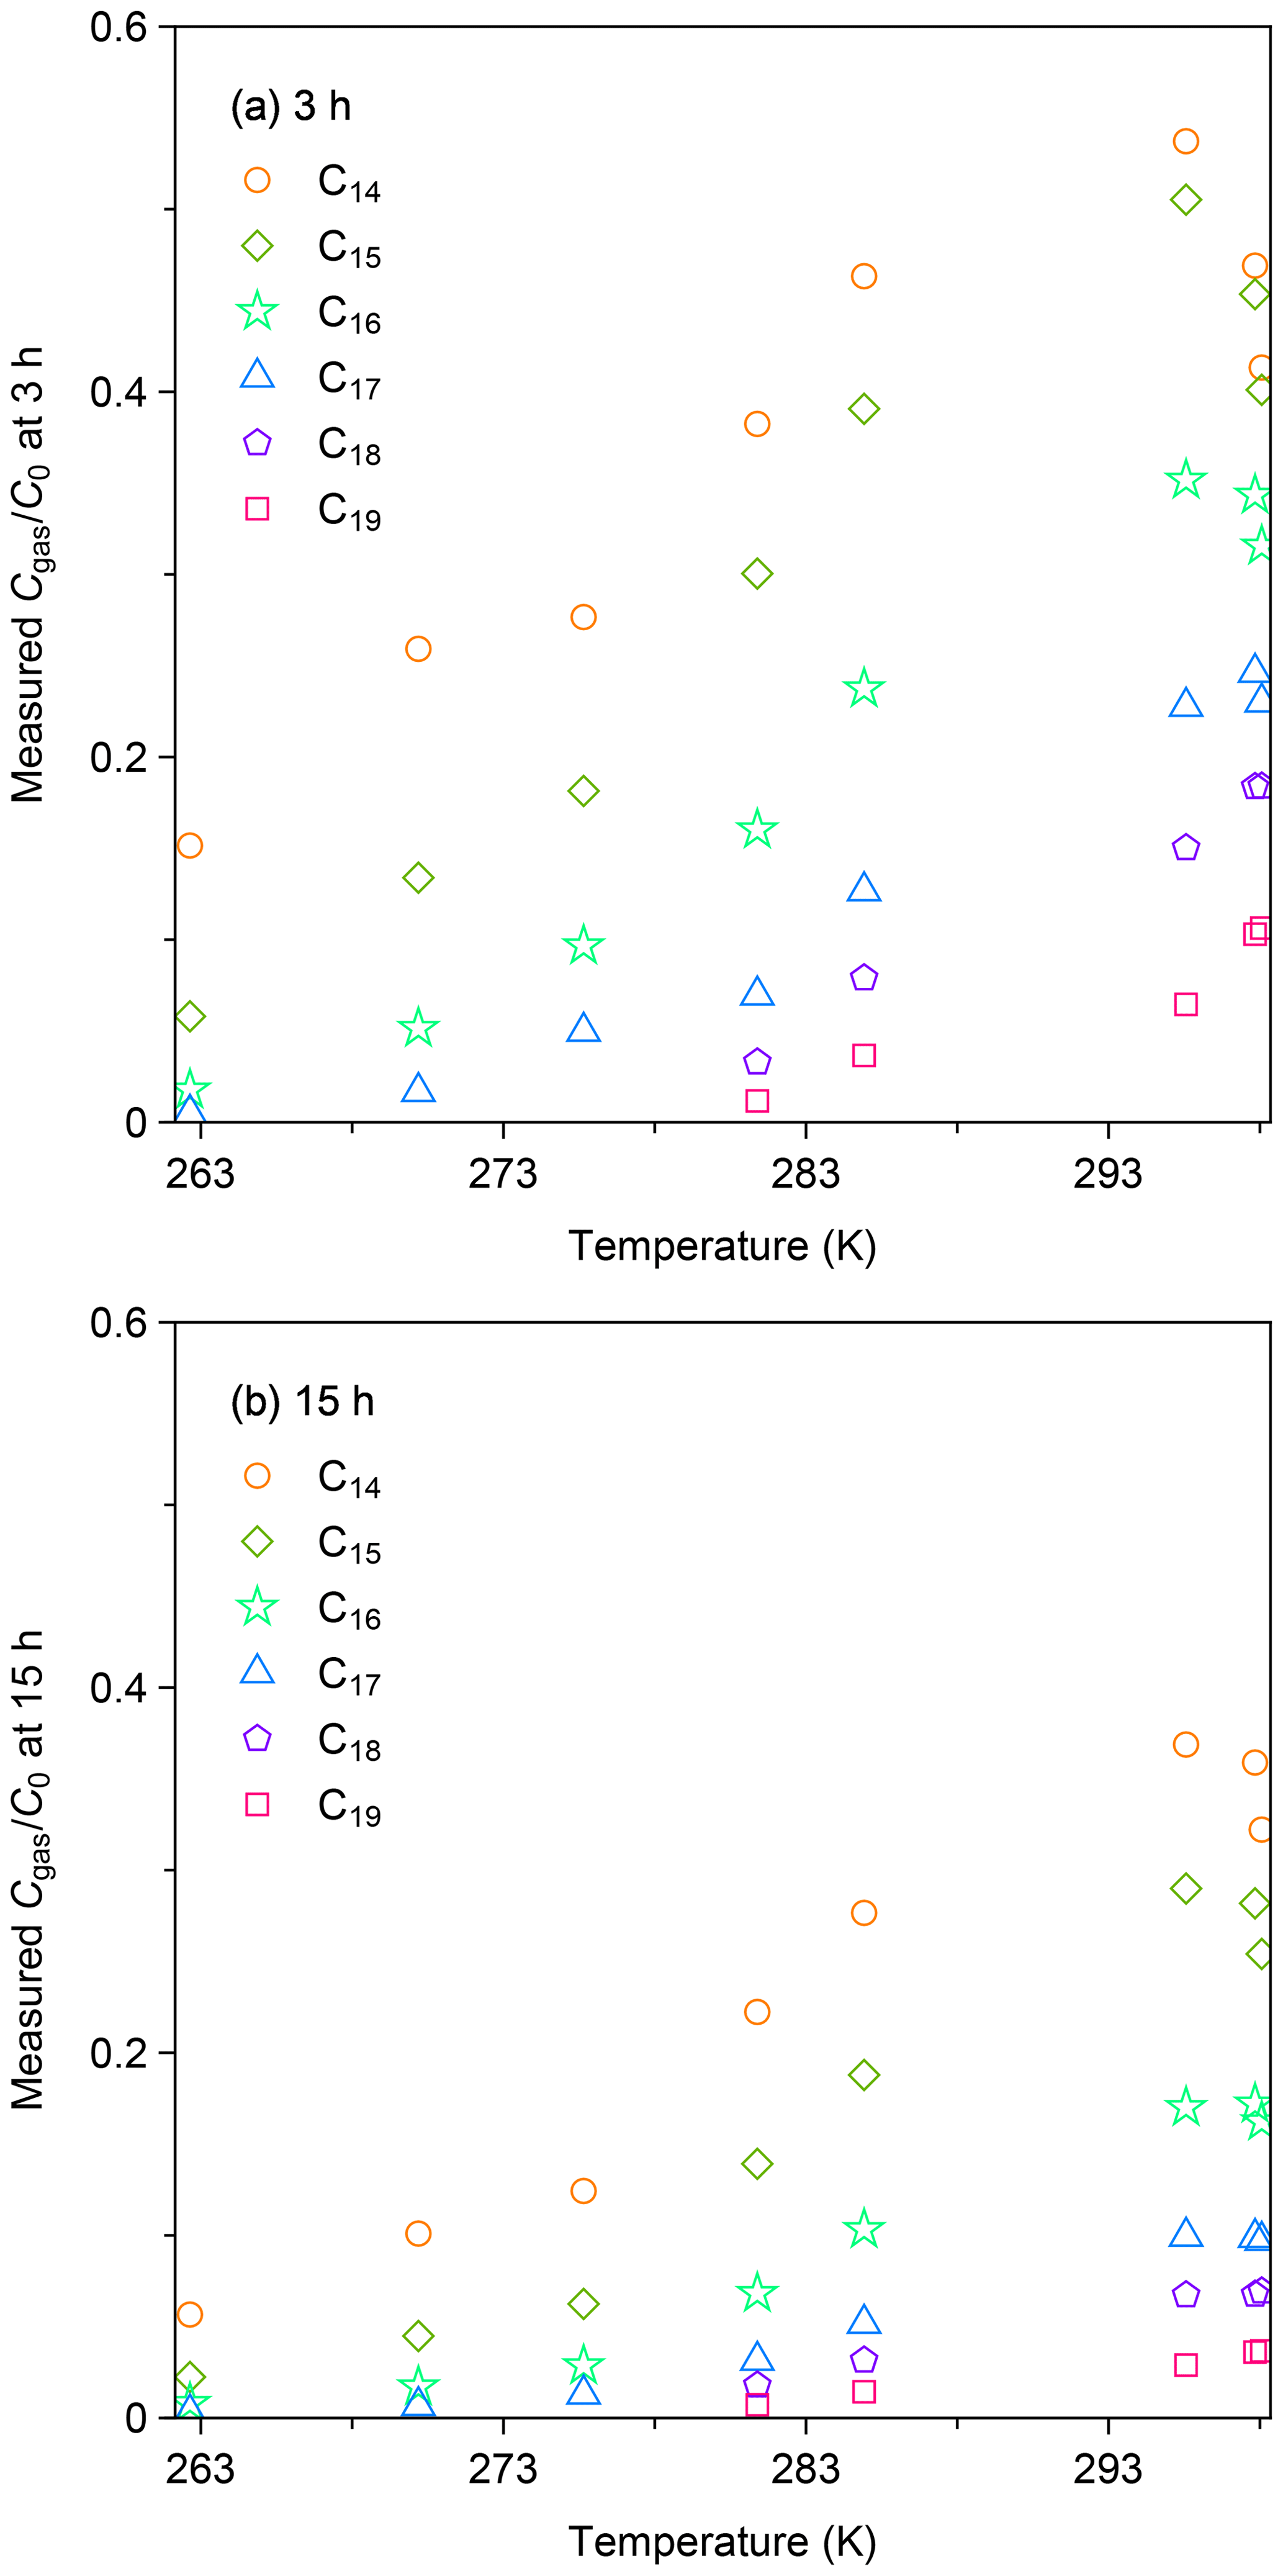
Figure 4b shows the values of as a function of temperature at 15 h after injection. In all experiments, the values of at 15 h after injection were consistently lower than those for 3 h. For instance, for C14 n-alkane at 262 K decreased from 0.15 (3 h) to 0.06 (15 h). As discussed in the case of the experiment at 298 K, the result suggests that diffusional loss in the inner layer of the chamber wall occurred for the whole temperature range.
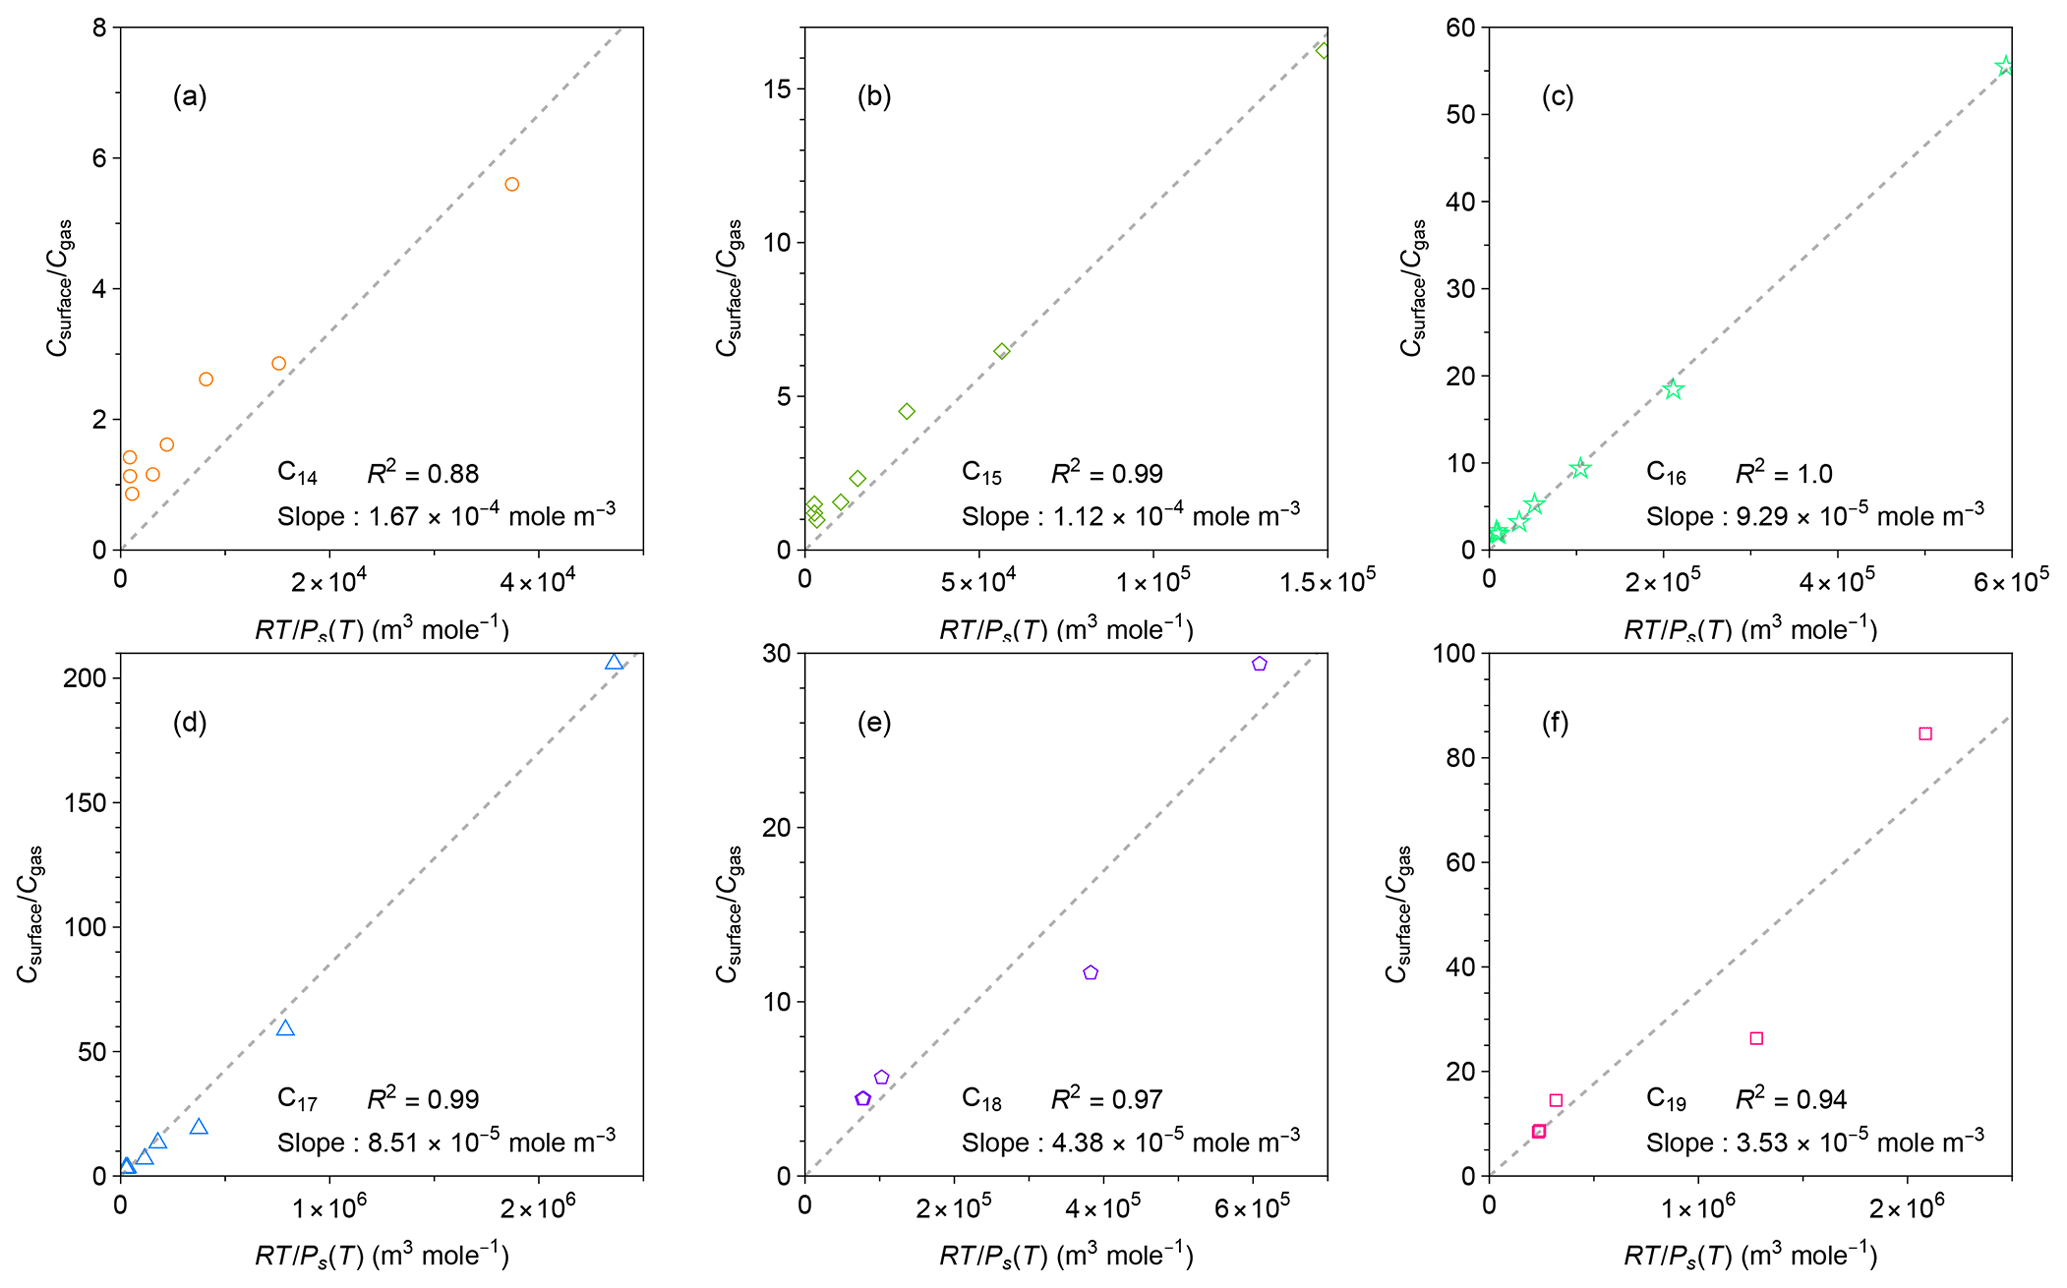
Figure 5Relationships between measured ratio of concentrations in the chamber wall surface phase and in the gas phase at quasi-equilibrium and calculated values of for individual n-alkanes. Calculation methods for are detailed in the text. The values of for each n-alkane were calculated by the EVAPORATION group contribution method (Compernolle et al., 2011). The dashed black lines are best linear fits of the data for each n-alkane.
3.3 Temperature dependence of partitioning between gas phase and wall surface
The temperature dependence in the data summarized in Fig. 4a can be understood by considering changes in partitioning between the gas phase and surface layer. Matsunaga and Ziemann (2010) introduced the following equation for relating and temperature based on the equilibrium-dissolution model:
where CFEP_surface is the equivalent organic mass concentration of the FEP chamber surface wall, Mwall is the average molecular mass of the FEP, γFEP_surface is the activity coefficient of the organic compound in the Teflon surface, R is the gas constant, T is temperature, and Ps(T) is the saturation vapor pressure of the compound at temperature T. Among the terms for the right-hand side of Eq. (8), can be calculated from the experimental conditions. Herein Ps(T) was calculated by the EVAPORATION group contribution method (Compernolle et al., 2011). Comparison between the EVAPORATION method and other approaches for estimating Ps(T) is available in Fig. S6. The equation suggests that and may vary in proportion to the slope of .
It is challenging to retrieve the value of by fitting the data of the low-temperature experiments using the two-layer model, since the chamber was cooled after the injection of n-alkanes. Alternatively, the value of was approximated using , assuming that diffusion of n-alkanes to the inner layer was still a minor loss process within 3 h. Potential uncertainties associated with this approximation are summarized in Text S1 in the Supplement. The uncertainties were estimated in two ways: (1) kinetic simulation based on fitting parameters in Fig. 3 (Fig. S5) and (2) comparison of the retrieved values of (i.e., Keq) and at room temperature (Table S3). The room-temperature experiments were conducted for three runs, allowing for the estimation of experimental uncertainties as a standard deviation. Although the kinetic simulation implies overestimates of 7 %–55 %, the measurement-based comparison demonstrates that and agree within the experimental uncertainties, thereby supporting the validity of the approximation.
Figure 5 shows the correlations between and for individual compounds. For all the tested compounds, these two parameters correlated well, even though increased by more than an order of magnitude when the chamber was cooled down. The result suggests that Eq. (8) can be applied to a wide range of temperatures without considering the temperature dependence of . In other words, γFEP_surface can be practically treated as a constant for the investigated temperature range, given that CFEP_surface and Mwall are independent of temperature. This implication is consistent with previous findings that the activity coefficients of organic compounds in polymers only change slightly with temperature. For instance, Kontogeorgis et al. (1993) compared the experimental and modeled values of activity coefficients for hydrocarbons in a few polymers such as low-density polyethylene. The values of activity coefficients change by 10 %–20 % for a temperature change of 100 K.
Values of γFEP_surface for n-alkanes can be estimated from Fig. 5. Based on Eq. (8), the fitted slopes correspond to . For a specific chamber design, compound-independent CFEP_surface can be estimated by the density of FEP film (2150 kg m−3), the thickness of surface layer (∼ 5 nm), and the surface-to-volume ratio of the chamber (Y. L. Huang et al., 2018). The estimated CFEP_surface for the chamber in this experiment was 78.2 mg m−3. For estimating compound-dependent γFEP_surface, previous studies assumed Mwall = 200 g mol−1 (Y. L. Huang et al., 2018; Matsunaga and Ziemann, 2010). The same approximations were employed in the present study.
Figure 6 plots the retrieved values of γFEP_surface for n-alkanes against Ps(298 K) for n-alkanes. The figure also shows the corresponding parameters obtained from previous experimental studies (compiled by Y. L. Huang et al., 2018, including Matsunaga and Ziemann, 2010; Yeh and Ziemann, 2014, 2015; Krechmer et al., 2016). It should be noted that the literature results were analyzed with fixed values of surface-area-to-volume ratio of 3 m−1 and CFEP_surface of 32.2 mg m−3 (Y. L. Huang et al., 2018). Regardless of differences in types of chemicals and chambers, the experimentally estimated values of γFEP_surface and Ps(298 K) correlate in logarithmic scale. The relationship followed the equation of .
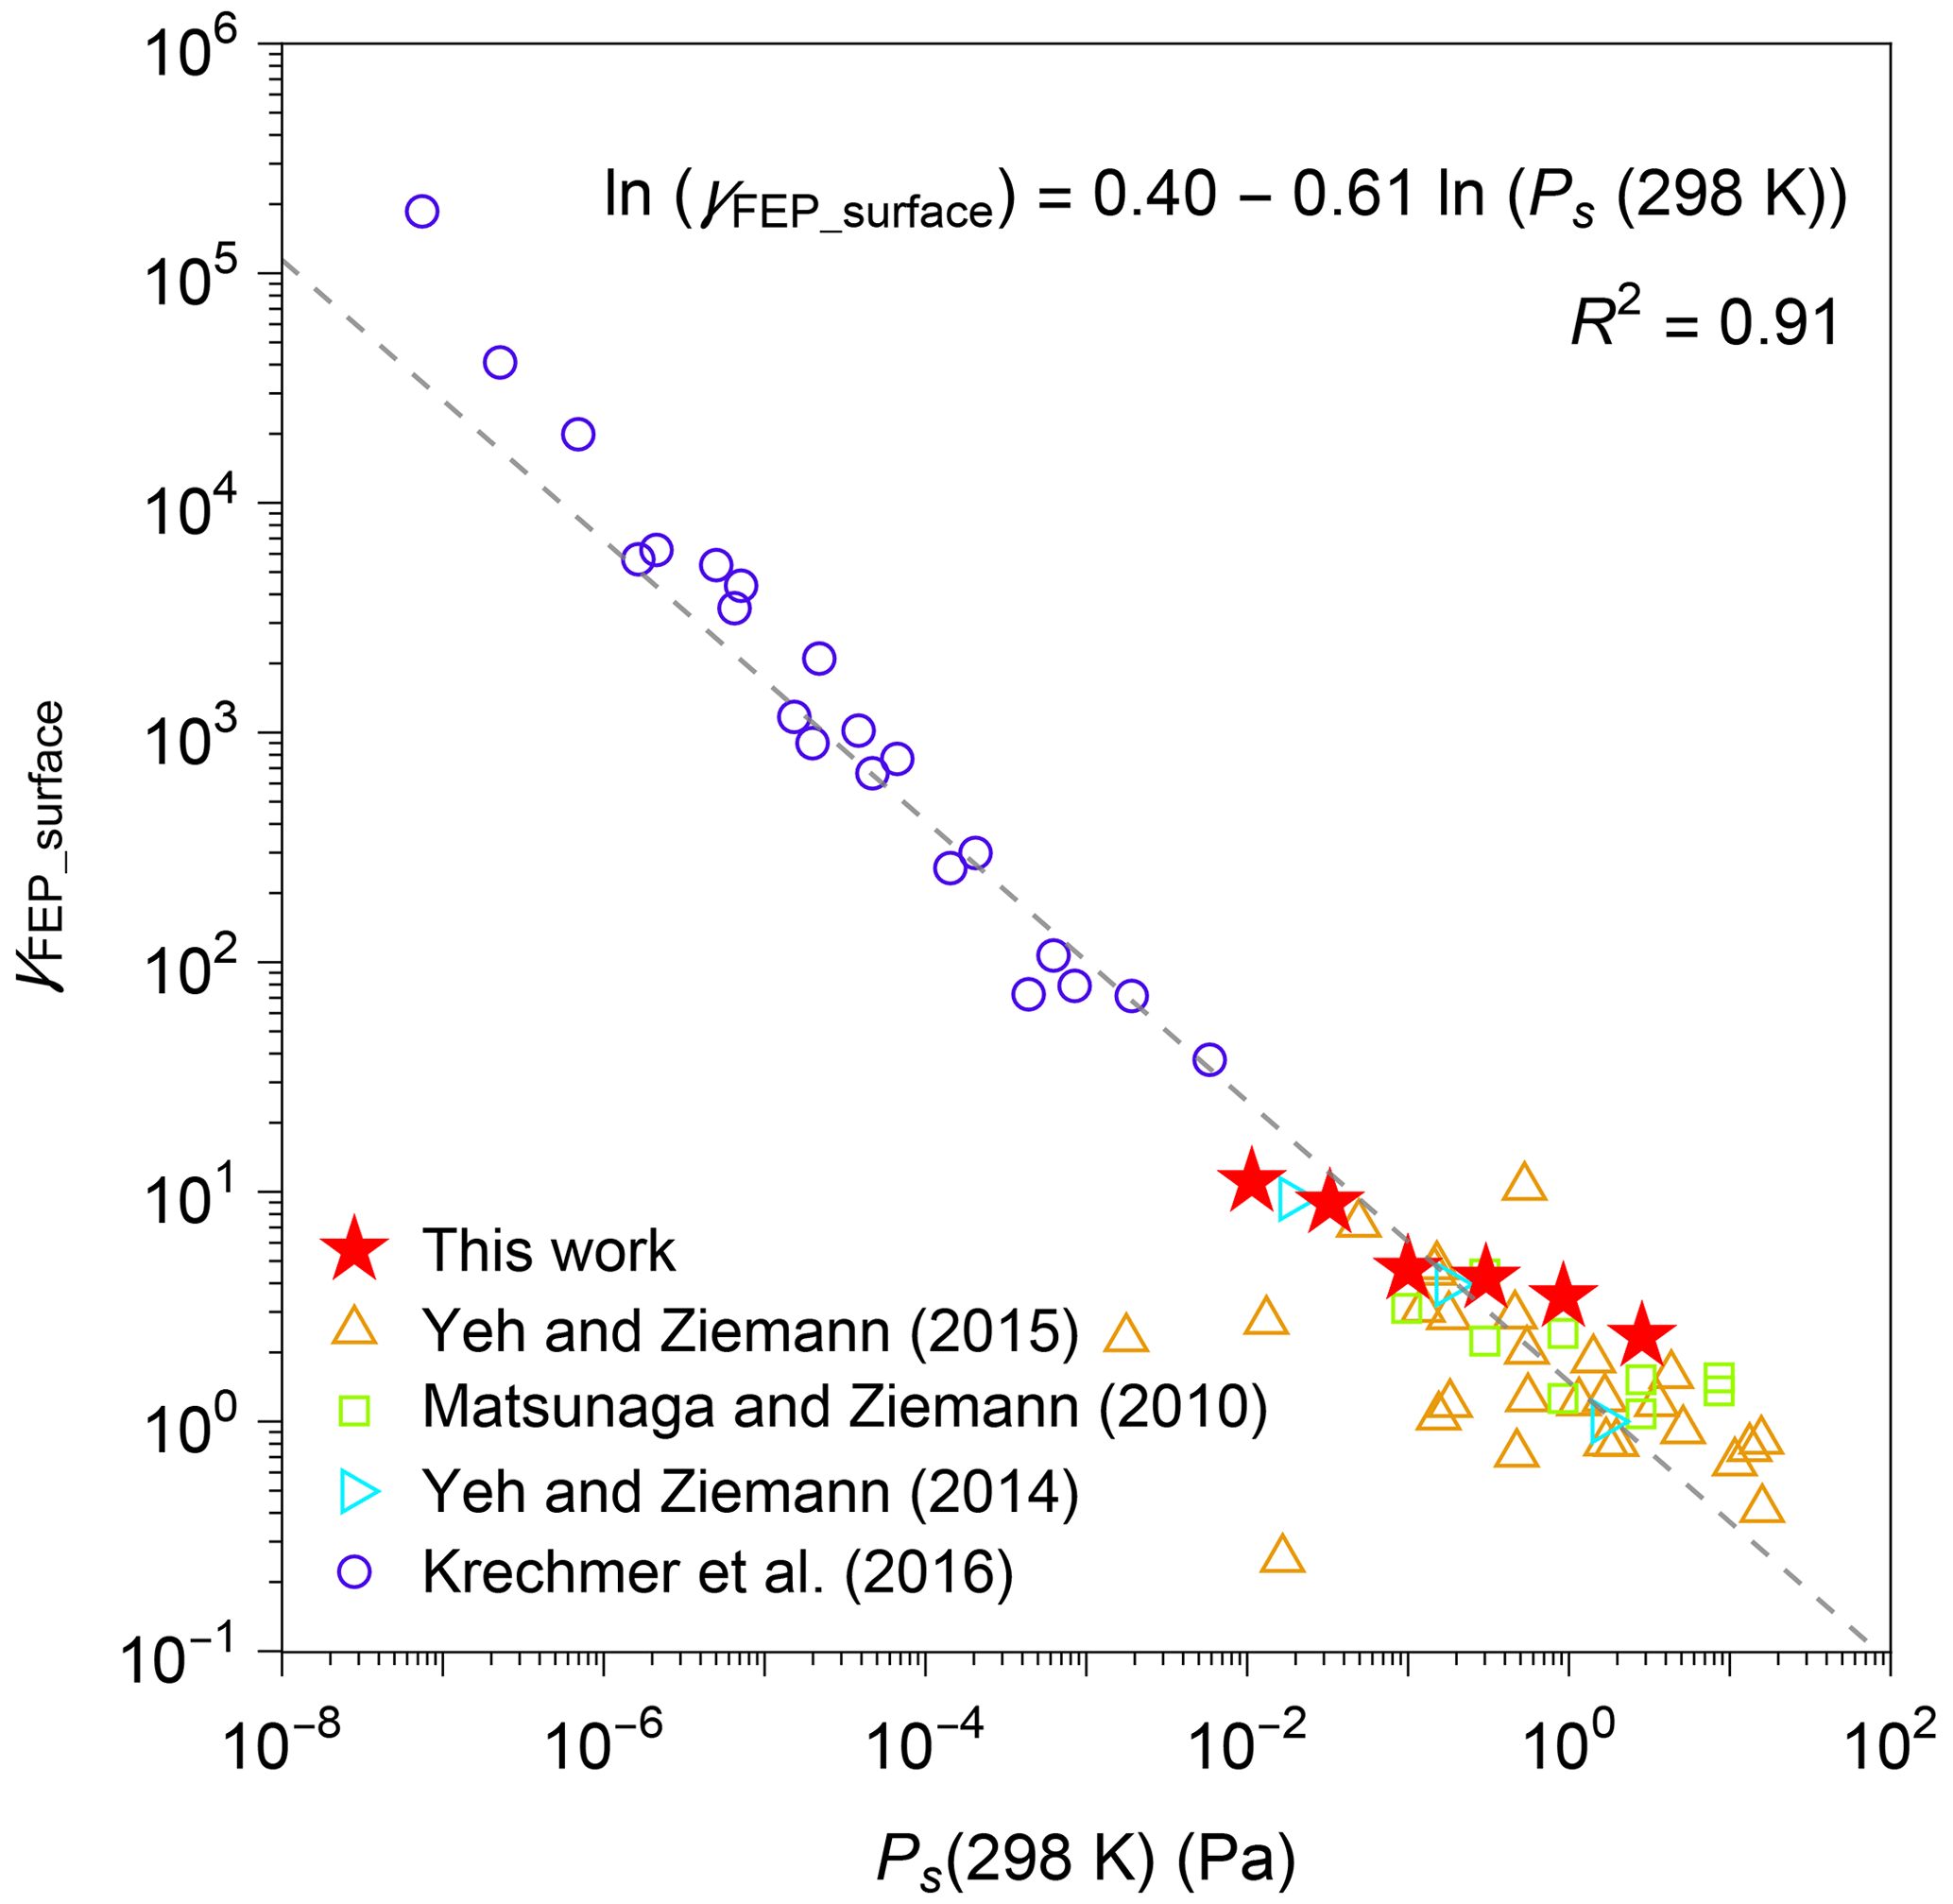
Figure 6Activity coefficient (γFEP_surface) of organic compounds in FEP film. The sources of data include this work and the literature (compiled by Y. L. Huang et al., 2018, including Matsunaga and Ziemann, 2010; Yeh and Ziemann, 2014, 2015; Krechmer et al., 2016). A list of chemical species that were investigated by each study is available in Table S4. Saturation vapor pressures at 298 K (Ps(298 K)) were estimated by EVAPORATION (Compernolle et al., 2011).
3.4 Characterization of diffusion from the Teflon surface to inner layer
Values of k2 were estimated using Eq. (7), since values of τinner are at least 18 times larger than those of τsurface (Table S3). The values of at 3 h after injection were employed to calculate Keq as discussed earlier. The experimental data for 9, 12, and 15 h after injection were employed for obtaining k2.
Figure 7 plots the estimated values of k2 against Ps(T) for all compounds in all experiments. The values of k2 and Ps(T) positively correlate. As a comparison point, a previous study reported positive correlations for (1) the diffusivity of organic compounds in FEP film and saturation concentration, as well as (2) k2 and diffusivity (Y. L. Huang et al., 2018). Our current result is qualitatively similar to the previous study, though temperature was maintained as a constant in the previous study. The decrease in k2 at lower temperatures could be induced by reduced viscosity in the inner layer or weakened thermal motion of n-alkane molecules (Mattila et al., 2023). It should be noted that compression of bag volume during the experiment would lead to an increase in the surface-area-to-volume ratio. Consequently, this may introduce bias into the estimation of diffusion loss rate solely based on gas-phase measurement. Based on some photos during the experiment, the leak-out air could have increased the surface-area-to-volume ratio by a few times. A further study that considers changes in chamber volume would be needed in the future for quantitatively interpreting the data.
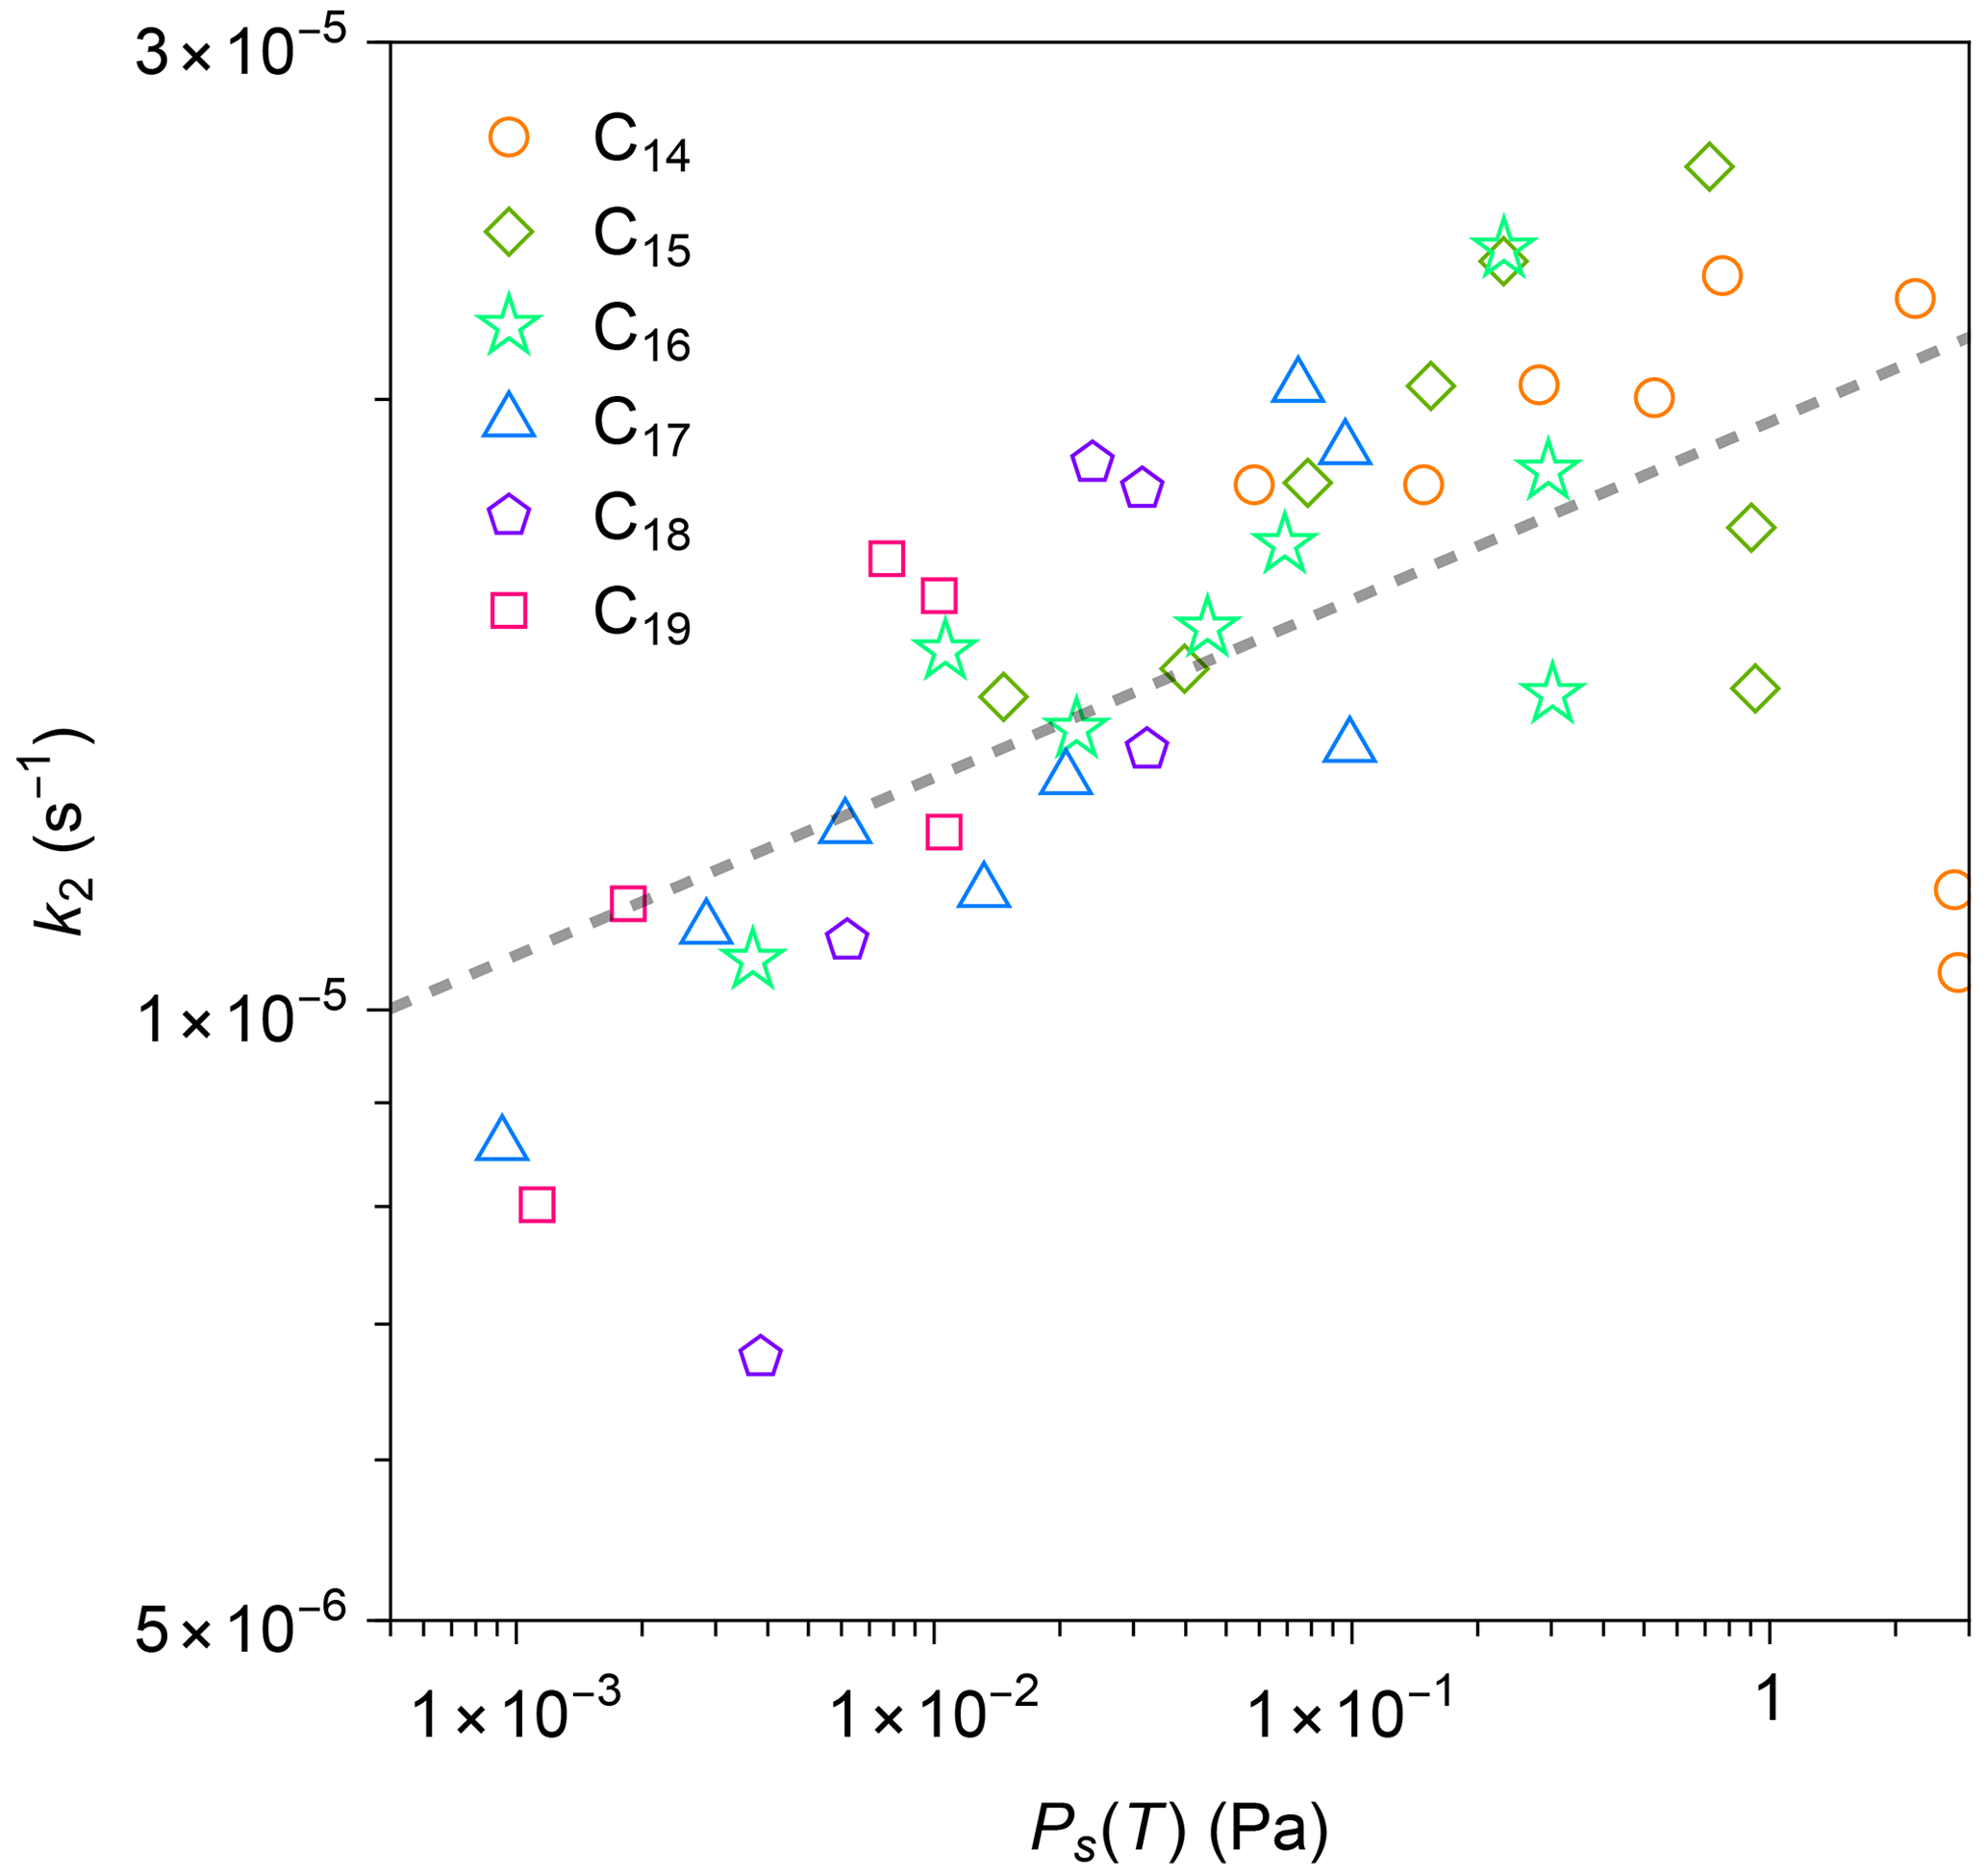
Figure 7Relationship between calculated first-order loss rate k2 for each n-alkane and calculated values of saturation vapor pressure by the EVAPORATION group contribution method (Compernolle et al., 2011). The calculation method for k2 is detailed in the text. The dashed black line is the best linear fit to the data in a logarithmic scale.
The present study investigated the wall-loss processes of C14–C19 n-alkanes to the wall of a 1 m3 chamber bag, which was composed of FEP film. The temperature of the chamber was controlled for the range of 262 to 298 K. Decay in gas-phase concentrations of the n-alkanes was quantified using the SV-TAG for 15 h following injection. The temporal variations in the n-alkane concentrations suggested two types of loss processes. The first process was characterized by rapid exponential decay in the first few hours. Subsequently, slow first-order decrease in the n-alkane concentrations was identified until the end of the experiment. Enhanced wall loss was observed at lower temperatures for all compounds.
The experimental data were fitted well using a two-layer kinetic model, which considers partitioning of gas-phase species to the surface layer of the chamber film and further diffusion to the inner layer. The analysis suggests that when the Teflon bag chamber is operated at low temperatures, partitioning of gas-phase species to the chamber wall surface is enhanced, whereas the permeation of the chemical compounds to the inner layer is suppressed. The temperature effect on gas–surface partitioning outweighs that on diffusion into the inner layer for n-alkanes, leading to an overall enhanced wall loss at lower temperature.
The quasi-equilibrium partitioning of n-alkanes between the gas phase and surface layer was interpreted by considering the dissolution process of the species into the surface layer. Values of at quasi-equilibrium are proportional to for individual compounds. The result suggests that decreased saturation vapor pressure is the major driving force for enhanced partitioning to the surface layer at low temperatures for all investigated compounds, while their activity coefficients can be practically treated as constants for the investigated temperature range. The relationship can be potentially employed for predicting changes in wall loss of SVOCs as a function of temperature after further verification employing other types of organic compounds.
In the future, the underlying mechanisms of the present findings will need to be sought for a better understanding of the chamber wall loss of SVOCs. The present study focused on n-alkanes. In the case of chamber experiments for SOA formation, wall-loss processes of oxygenated chemical species would be more important. Thus, a temperature-dependent wall-loss study for oxygenated chemical species will still need to be conducted for interpreting SOA chamber experiments under a wide range of temperatures.
| k1 | forward rate constant (s−1) |
| k−1 | backward rate constant (s−1) |
| k2 | first-order loss rate constant (s−1) |
| τsurface | gas–surface equilibrium timescale (min) |
| τinner | diffusion timescale (min) |
| C0 | initial SVOC concentration in gas phase (µg m−3) |
| Cgas | SVOC concentration in gas phase (µg m−3) |
| Cwall | SVOC concentration on wall surface (µg m−3) |
| Keq | gas–surface equilibrium constant |
| CFEP_surface | equivalent organic mass concentration of the FEP chamber surface (mg m−3) |
| Mwall | average molecular mass of the Teflon wall (g mol−1) |
| γFEP_surface | activity coefficient in the Teflon surface |
| R | gas constant (J K−1 mol−1) |
| T | temperature (K) |
| Ps(T) | saturation vapor pressure of compound at temperature T (Pa) |
Data will be made available on request.
The supplement related to this article is available online at: https://doi.org/10.5194/amt-17-755-2024-supplement.
LH contributed to conceptualization, methodology, experiment, data curation, formal analysis, and writing the original draft. WL contributed to methodology, experiment, and writing in the review and editing stage. YaL contributed to methodology and writing in the review and editing stage, and JW contributed to experiment and writing in the review and editing stage. Both MK and YiL supervised the project, were responsible for project administration and funding acquisition, and contributed to formal analysis and writing in the review and editing stage.
The contact author has declared that none of the authors has any competing interests.
Publisher’s note: Copernicus Publications remains neutral with regard to jurisdictional claims made in the text, published maps, institutional affiliations, or any other geographical representation in this paper. While Copernicus Publications makes every effort to include appropriate place names, the final responsibility lies with the authors.
We thank Ying Zhou for assisting in improvement of figure quality.
This research has been supported by the National Key Research and Development Program of China (grant no. 2023YFC3710100) and the National Natural Science Foundation of China (grant nos. 92044303, 42175121, 42150610485).
This paper was edited by Cuiqi Zhang and reviewed by Yuanlong Huang and two anonymous referees.
Clark, C. H., Kacarab, M., Nakao, S., Asa-Awuku, A., Sato, K., and Cocker III, D. R.: Temperature effects on secondary organic aerosol (SOA) from the dark ozonolysis and photo-oxidation of isoprene, Environ. Sci. Technol., 50, 5564–5571, https://doi.org/10.1021/acs.est.5b05524, 2016.
Cocker, D. R., Flagan, R. C., and Seinfeld, J. H.: State-of-the-art chamber facility for studying atmospheric aerosol chemistry, Environ. Sci. Technol., 35, 2594–2601, https://doi.org/10.1021/es0019169, 2001.
Compernolle, S., Ceulemans, K., and Müller, J.-F.: EVAPORATION: a new vapour pressure estimation method for organic molecules including non-additivity and intramolecular interactions, Atmos. Chem. Phys., 11, 9431–9450, https://doi.org/10.5194/acp-11-9431-2011, 2011.
Deng, Y., Inomata, S., Sato, K., Ramasamy, S., Morino, Y., Enami, S., and Tanimoto, H.: Temperature and acidity dependence of secondary organic aerosol formation from α-pinene ozonolysis with a compact chamber system, Atmos. Chem. Phys., 21, 5983–6003, https://doi.org/10.5194/acp-21-5983-2021, 2021.
Hidy, G. M.: Atmospheric chemistry in a box or a bag, Atmosphere, 10, 401, https://doi.org/10.3390/atmos10070401, 2019.
Huang, W., Saathoff, H., Pajunoja, A., Shen, X., Naumann, K.-H., Wagner, R., Virtanen, A., Leisner, T., and Mohr, C.: α-Pinene secondary organic aerosol at low temperature: chemical composition and implications for particle viscosity, Atmos. Chem. Phys., 18, 2883–2898, https://doi.org/10.5194/acp-18-2883-2018, 2018.
Huang, Y. L., Zhao, R., Charan, S. M., Kenseth, C. M., Zhang, X., and Seinfeld, J. H.: Unified theory of vapor-wall mass transport in Teflon-walled environmental chambers, Environ. Sci. Technol., 52, 2134–2142, https://doi.org/10.1021/acs.est.7b05575, 2018.
Isaacman, G., Kreisberg, N. M., Worton, D. R., Hering, S. V., and Goldstein, A. H.: A versatile and reproducible automatic injection system for liquid standard introduction: application to in-situ calibration, Atmos. Meas. Tech., 4, 1937–1942, https://doi.org/10.5194/amt-4-1937-2011, 2011.
Kontogeorgis, G. M., Fredenslund, A., and Tassios, D. P.: Simple activity-coefficient model for the prediction of solvent activities in polymer-solutions, Ind. Eng. Chem. Res., 32, 362–372, https://doi.org/10.1021/ie00014a013, 1993.
Krechmer, J. E., Pagonis, D., Ziemann, P. J., and Jimenez, J. L.: Quantification of gas-wall partitioning in Teflon environmental chambers using rapid bursts of low-volatility oxidized species generated in situ, Environ. Sci. Technol., 50, 5757–5765, https://doi.org/10.1021/acs.est.6b00606, 2016.
Krechmer, J. E., Day, D. A., and Jimenez, J. L.: Always lost but never forgotten: Gas-phase wall losses are important in all Teflon environmental chambers, Environ. Sci. Technol., 54, 12890–12897, https://doi.org/10.1021/acs.est.0c03381, 2020.
Kristensen, K., Jensen, L. N., Glasius, M., and Bilde, M.: The effect of sub-zero temperature on the formation and composition of secondary organic aerosol from ozonolysis of alpha-pinene, Environ. Sci.-Proc. Imp., 19, 1220–1234, https://doi.org/10.1039/c7em00231a, 2017.
Kroll, J. H., Chan, A. W. H., Ng, N. L., Flagan, R. C., and Seinfeld, J. H.: Reactions of semivolatile organics and their effects on secondary organic aerosol formation, Environ. Sci. Technol., 41, 3545–3550, https://doi.org/10.1021/es062059x, 2007.
Li, Y. T., He, L. K., Xie, D., Zhao, A. Q., Wang, L. X., Kreisberg, N. M., Jayne, J., and Liu, Y. J.: Strong temperature influence and indiscernible ventilation effect on dynamics of some semivolatile organic compounds in the indoor air of an office, Environ. Int., 165, 107305, https://doi.org/10.1016/j.envint.2022.107305, 2022a.
Li, Y. T., Xie, D., He, L. K., Zhao, A. Q., Wang, L. X., Kreisberg, N. M., Jayne, J., and Liu, Y. J.: Dynamics of di-2-ethylhexyl phthalate (DEHP) in the indoor air of an office, Build. Environ., 223, 109446, https://doi.org/10.1016/j.buildenv.2022.109446, 2022b.
Matsunaga, A. and Ziemann, P. J.: Gas-wall partitioning of organic compounds in a Teflon film chamber and potential effects on reaction product and aerosol yield measurements, Aerosol Sci. Technol., 44, 881–892, https://doi.org/10.1080/02786826.2010.501044, 2010.
Mattila, J. M., Li, E. Y., and Offenberg, J. H.: Tubing material considerably affects measurement delays of gas-phase oxygenated per- and polyfluoroalkyl substances, J. Air Waste Manage. Assoc., 73, 335–344, https://doi.org/10.1080/10962247.2023.2174612, 2023.
McMurry, P. H. and Grosjean, D.: Gas and aerosol wall losses in Teflon film smog chambers, Environ. Sci. Technol., 19, 1176–1182, https://doi.org/10.1021/es00142a006, 1985.
Nakao, S., Shrivastava, M., Anh, N., Jung, H., and Cocker III, D.: Interpretation of secondary organic aerosol formation from diesel exhaust photooxidation in an environmental chamber, Aerosol Sci. Technol., 45, 964–972, https://doi.org/10.1080/02786826.2011.573510, 2011.
Ng, N. L., Chhabra, P. S., Chan, A. W. H., Surratt, J. D., Kroll, J. H., Kwan, A. J., McCabe, D. C., Wennberg, P. O., Sorooshian, A., Murphy, S. M., Dalleska, N. F., Flagan, R. C., and Seinfeld, J. H.: Effect of NOx level on secondary organic aerosol (SOA) formation from the photooxidation of terpenes, Atmos. Chem. Phys., 7, 5159–5174, https://doi.org/10.5194/acp-7-5159-2007, 2007.
Pratap, V., Bian, Q. J., Kiran, S. A., Hopke, P. K., Pierce, J. R., and Nakao, S.: Investigation of levoglucosan decay in wood smoke smog-chamber experiments: The importance of aerosol loading, temperature, and vapor wall losses in interpreting results, Atmos. Environ., 199, 224–232, https://doi.org/10.1016/j.atmosenv.2018.11.020, 2019.
Pratap, V., Kiran, S. A., Bian, Q., Pierce, J. R., Hopke, P. K., and Nakao, S.: Observation of vapor wall deposition in a smog chamber using size evolution of pure organic particles, Aerosol Air Qual. Res., 20, 2705–2714, https://doi.org/10.4209/aaqr.2020.05.0268, 2020.
Quéléver, L. L. J., Kristensen, K., Normann Jensen, L., Rosati, B., Teiwes, R., Daellenbach, K. R., Peräkylä, O., Roldin, P., Bossi, R., Pedersen, H. B., Glasius, M., Bilde, M., and Ehn, M.: Effect of temperature on the formation of highly oxygenated organic molecules (HOMs) from alpha-pinene ozonolysis, Atmos. Chem. Phys., 19, 7609–7625, https://doi.org/10.5194/acp-19-7609-2019, 2019.
Simon, M., Dada, L., Heinritzi, M., Scholz, W., Stolzenburg, D., Fischer, L., Wagner, A. C., Kürten, A., Rörup, B., He, X.-C., Almeida, J., Baalbaki, R., Baccarini, A., Bauer, P. S., Beck, L., Bergen, A., Bianchi, F., Bräkling, S., Brilke, S., Caudillo, L., Chen, D., Chu, B., Dias, A., Draper, D. C., Duplissy, J., El-Haddad, I., Finkenzeller, H., Frege, C., Gonzalez-Carracedo, L., Gordon, H., Granzin, M., Hakala, J., Hofbauer, V., Hoyle, C. R., Kim, C., Kong, W., Lamkaddam, H., Lee, C. P., Lehtipalo, K., Leiminger, M., Mai, H., Manninen, H. E., Marie, G., Marten, R., Mentler, B., Molteni, U., Nichman, L., Nie, W., Ojdanic, A., Onnela, A., Partoll, E., Petäjä, T., Pfeifer, J., Philippov, M., Quéléver, L. L. J., Ranjithkumar, A., Rissanen, M. P., Schallhart, S., Schobesberger, S., Schuchmann, S., Shen, J., Sipilä, M., Steiner, G., Stozhkov, Y., Tauber, C., Tham, Y. J., Tomé, A. R., Vazquez-Pufleau, M., Vogel, A. L., Wagner, R., Wang, M., Wang, D. S., Wang, Y., Weber, S. K., Wu, Y., Xiao, M., Yan, C., Ye, P., Ye, Q., Zauner-Wieczorek, M., Zhou, X., Baltensperger, U., Dommen, J., Flagan, R. C., Hansel, A., Kulmala, M., Volkamer, R., Winkler, P. M., Worsnop, D. R., Donahue, N. M., Kirkby, J., and Curtius, J.: Molecular understanding of new-particle formation from α-pinene between −50 and +25 ∘C, Atmos. Chem. Phys., 20, 9183–9207, https://doi.org/10.5194/acp-20-9183-2020, 2020.
Song, C., Na, K. S., and Cocker, D. R.: Impact of the hydrocarbon to NOx ratio on secondary organic aerosol formation, Environ. Sci. Technol., 39, 3143–3149, https://doi.org/10.1021/es0493244, 2005.
Voigtländer, J., Duplissy, J., Rondo, L., Kürten, A., and Stratmann, F.: Numerical simulations of mixing conditions and aerosol dynamics in the CERN CLOUD chamber, Atmos. Chem. Phys., 12, 2205–2214, https://doi.org/10.5194/acp-12-2205-2012, 2012.
Wang, M. Y., Xiao, M., Bertozzi, B., Marie, G., Rorup, B., Schulze, B., Bardakov, R., He, X. C., Shen, J. L., Scholz, W., Marten, R., Dada, L., Baalbaki, R., Lopez, B., Lamkaddam, H., Manninen, H. E., Amorim, A., Ataei, F., Bogert, P., Brasseur, Z., Caudillo, L., De Menezes, L. P., Duplissy, J., Ekman, A. M. L., Finkenzeller, H., Carracedo, L. G., Granzin, M., Guida, R., Heinritzi, M., Hofbauer, V., Hohler, K., Korhonen, K., Krechmer, J. E., Kurten, A., Lehtipalo, K., Mahfouz, N. G. A., Makhmutov, V., Massabo, D., Mathot, S., Mauldin, R. L., Mentler, B., Muller, T., Onnela, A., Petaja, T., Philippov, M., Piedehierro, A. A., Pozzer, A., Ranjithkumar, A., Schervish, M., Schobesberger, S., Simon, M., Stozhkov, Y., Tome, A., Umo, N. S., Vogel, F., Wagner, R., Wang, D. S., Weber, S. K., Welti, A., Wu, Y. S., Zauner-Wieczorek, M., Sipila, M., Winkler, P. M., Hansel, A., Baltensperger, U., Kulmala, M., Flagan, R. C., Curtius, J., Riipinen, I., Gordon, H., Lelieveld, J., El-Haddad, I., Volkamer, R., Worsnop, D. R., Christoudias, T., Kirkby, J., Mohler, O., and Donahue, N. M.: Synergistic HNO3-H2SO4-NH3 upper tropospheric particle formation, Nature, 605, 483–489, https://doi.org/10.1038/s41586-022-04605-4, 2022.
Yeh, G. K. and Ziemann, P. J.: Alkyl nitrate formation from the reactions of C8–C14 n-alkanes with OH radicals in the presence of NOx: Measured yields with essential corrections for gas-wall partitioning, J. Phys. Chem. A, 118, 8147–8157, https://doi.org/10.1021/jp500631v, 2014.
Yeh, G. K. and Ziemann, P. J.: Gas-wall partitioning of oxygenated organic compounds: Measurements, structure-activity relationships, and correlation with gas chromatographic retention factor, Aerosol Sci. Technol., 49, 726–737, https://doi.org/10.1080/02786826.2015.1068427, 2015.
Yu, S., Jia, L., Xu, Y., Zhang, H., Zhang, Q., and Pan, Y.: Wall losses of oxygenated volatile organic compounds from oxidation of toluene: Effects of chamber volume and relative humidity, J. Environ. Sci., 114, 475–484, https://doi.org/10.1016/j.jes.2021.09.026, 2022.
Zhang, X., Cappa, C. D., Jathar, S. H., McVay, R. C., Ensberg, J. J., Kleeman, M. J., and Seinfeld, J. H.: Influence of vapor wall loss in laboratory chambers on yields of secondary organic aerosol, P. Natl. Acad. Sci. USA, 111, 5802–5807, https://doi.org/10.1073/pnas.1404727111, 2014.
Zhang, X., Schwantes, R. H., McVay, R. C., Lignell, H., Coggon, M. M., Flagan, R. C., and Seinfeld, J. H.: Vapor wall deposition in Teflon chambers, Atmos. Chem. Phys., 15, 4197–4214, https://doi.org/10.5194/acp-15-4197-2015, 2015.
Zhao, Y. L., Kreisberg, N. M., Worton, D. R., Teng, A. P., Hering, S. V., and Goldstein, A. H.: Development of an in situ thermal desorption gas chromatography instrument for quantifying atmospheric semi-volatile organic compounds, Aerosol Sci. Technol., 47, 258–266, https://doi.org/10.1080/02786826.2012.747673, 2013.