the Creative Commons Attribution 4.0 License.
the Creative Commons Attribution 4.0 License.
 | 31 Jan 2024
Identifying and correcting interferences to PTR-ToF-MS measurements of isoprene and other urban volatile organic compounds
Matthew M. Coggon
Chelsea E. Stockwell
Megan S. Claflin
Eva Y. Pfannerstill
Jessica B. Gilman
Julia Marcantonio
Kelvin Bates
Georgios I. Gkatzelis
Aaron Lamplugh
Erin F. Katz
Caleb Arata
Eric C. Apel
Rebecca S. Hornbrook
Felix Piel
Francesca Majluf
Donald R. Blake
Armin Wisthaler
Manjula Canagaratna
Brian M. Lerner
Allen H. Goldstein
John E. Mak
Carsten Warneke
Proton-transfer-reaction time-of-flight mass spectrometry (PTR-ToF-MS) is a technique commonly used to measure ambient volatile organic compounds (VOCs) in urban, rural, and remote environments. PTR-ToF-MS is known to produce artifacts from ion fragmentation, which complicates the interpretation and quantification of key atmospheric VOCs. This study evaluates the extent to which fragmentation and other ionization processes impact urban measurements of the PTR-ToF-MS ions typically assigned to isoprene ( 69, C5H8H+), acetaldehyde ( 45, CH3CHO+), and benzene ( 79, C6H6H+). Interferences from fragmentation are identified using gas chromatography (GC) pre-separation, and the impact of these interferences is quantified using ground-based and airborne measurements in a number of US cities, including Las Vegas, Los Angeles, New York City, and Detroit. In urban regions with low biogenic isoprene emissions (e.g., Las Vegas), fragmentation from higher-carbon aldehydes and cycloalkanes emitted from anthropogenic sources may contribute to 69 by as much as 50 % during the day, while the majority of the signal at 69 is attributed to fragmentation during the night. Interferences are a higher fraction of 69 during airborne studies, which likely results from differences in the reactivity between isoprene and the interfering species along with the subsequent changes to the VOC mixture at higher altitudes. For other PTR masses, including 45 and 79, interferences are observed due to fragmentation and O ionization of VOCs typically used in solvents, which are becoming a more important source of anthropogenic VOCs in urban areas. We present methods to correct these interferences, which provide better agreement with GC measurements of isomer-specific molecules. These observations show the utility of deploying GC pre-separation for the interpretation PTR-ToF-MS spectra.
- Article
(7031 KB) - Full-text XML
-
Supplement
(1414 KB) - BibTeX
- EndNote


Volatile organic compounds (VOCs) are an important contributor to urban air pollution. Once emitted to the atmosphere, VOCs undergo chemical reactions that contribute to the formation of hazardous pollutants such as ozone and secondary organic aerosol. It is important to quantify VOC mixing ratios in urban areas to determine strategies that may reduce air pollution.
Proton-transfer-reaction time-of-flight mass spectrometry (PTR-ToF-MS) is a technique used to measure a wide spectrum of VOCs, including oxygenates, aromatics, furanoids, nitriles, and biogenic species such as isoprene and monoterpene isomers (Yuan et al., 2017). PTR-ToF-MS measurements in urban regions enable the determination of VOC mixing ratios from an extensive range of emission sources, including fossil fuels, solvent evaporation from volatile chemical products (VCPs), residential wood burning, cooking, and urban foliage (Yuan et al., 2017). The fast time resolution and broad selectivity of PTR-ToF-MS measurements enable source apportionment, flux estimates, and spatial mapping on mobile platforms that yield important information about urban VOC source strengths (e.g., Gkatzelis et al., 2021a; Karl et al., 2018; Pfannerstill et al., 2023b).
VOC detection by PTR-ToF-MS relies on analyte reactions with protonated water (Reaction R1).
Proton transfer is exothermic and spontaneous for VOCs with a proton affinity that is greater than water. For many VOCs, including ketones, aromatics, and nitriles, the protonated product () is the primary signal detected by PTR-ToF-MS. For other VOCs, secondary reactions including neutral loss of water, carbon fragmentation, and water clustering result in additional product ions that can complicate the mass spectra. Pagonis et al. (2019) summarize studies that have reported fragmentation for a wide spectrum of species. Fragmentation is prevalent in alcohols, aldehydes, and other species with long-chain alkane functionality (e.g., Buhr et al., 2002). Small alcohols and aldehydes (C <3) primarily react to form protonated products following Reaction (R1), while at higher carbon numbers, a large fraction of the reactions undergo neutral loss of water to form a carbonium ion which may then undergo fragmentation to form lower-carbon ions (Reactions R2–R3).
R is the carbon backbone of an alcohol (R-OH) or aldehyde R-C(O)H, R+ is the product formed by loss of water, R is a fragment, and R2 is a neutral product. Fragmentation may also result from protonation of cycloalkanes or alkyl aromatics. PTR-ToF-MS is not sensitive to small alkanes (C <5), but larger alkanes and cycloalkanes are detected at low sensitivity and upon ionization subsequently fragment to produce ions that often overlap with the dehydration and fragmentation products of alcohols and aldehydes (Arnold et al., 1998; Gueneron et al., 2015; Jobson et al., 2005). The degree of dehydration and fragmentation is partially dependent on the strength of the drift field (E) and density (N) (characterized by the ratio), which impacts ion kinetic energy (Arnold et al., 1998; Krechmer et al., 2018; Yuan et al., 2017; Holzinger et al., 2019). Lower results in lower fragmentation but higher clustering with neutral water, which may further complicate the mass spectra (Holzinger et al., 2019). Additional products may also be formed by reactions of analytes with O and NO+ ions, which are present due to the ionization of small amounts of air in the discharge reactor. The degree of ionization by these ions may vary depending on the ion source design or relative humidity in the drift tube.
In the atmosphere, complex mixtures of emissions may result in PTR-ToF-MS mass spectra where dehydration and fragmentation products interfere with the quantification of important atmospheric VOCs. For example, PTR-ToF-MS measurements in regions with significant oil and natural gas development show that substituted cycloalkanes fragment to produce a significant signal at 69 (C5H, Koss et al., 2017; Warneke et al., 2014; Pfannerstill et al., 2019). Likewise, interferences have been observed downwind of urban and industrial environments (e.g., Inomata et al., 2010; Choi et al., 2022). These fragments overlap with protonated isoprene and these previous studies have shown that interferences make isoprene quantification challenging in these regions. In forested areas, isoprene is largely emitted from biogenic sources and previous studies that have compared PTR-ToF-MS measurements to those from gas chromatography show good agreement (e.g., Kaser et al., 2013). The impact of an interference on specific molecules, such as isoprene, depends on atmospheric composition, which changes spatially (e.g., urban vs. rural regions) and temporally (e.g., summer vs. winter).
Assessments of interferences to PTR-MS measurements in urban atmospheres have been conducted previously (e.g., Warneke et al., 2003), but the sources that contribute to urban VOCs change on decadal timescales as fossil fuel emissions steadily decline (Kim et al., 2022; Warneke et al., 2012). The urban atmospheric composition, once dominated by motor vehicle emissions, is now composed of a higher proportion of oxygenates from solvents, other VOCs emitted from sources such as volatile chemical products (VCPs), and cooking (Gkatzelis et al., 2021b; McDonald et al., 2018a; Peng et al., 2022; Wernis et al., 2022). Significant advances in PTR-ToF-MS detectors (quadrupole vs. time-of-flight mass spectrometers) and drift tube designs have enhanced instrument capabilities to acquire mass spectra with greater resolution and sensitivity (Breitenlechner et al., 2017; Krechmer et al., 2018; Yuan et al., 2016; Holzinger et al., 2019). These technological advances enable better identification and quantification as well as an improved understanding of the interferences that impact PTR-ToF-MS spectra.
With the changes in atmospheric composition and technological advances, it is necessary to revisit potential interferences to commonly observed and reported VOCs by PTR-ToF-MS. In this study, we investigate the interferences that impact PTR-ToF-MS spectra measured across several US urban areas including Los Angeles (CA), Las Vegas (NV), Detroit (MI), and New York City (NY). Interferences are identified using GC pre-separation, similar to previous measurements that quantified PTR-ToF-MS fragmentation and interferences observed in complex mixtures, including wildfire and urban emissions (e.g., Koss et al., 2018; Warneke et al., 2003). We show that commonly measured species, such as acetaldehyde, benzene, and isoprene, exhibit interferences from larger molecules associated with solvent use and cooking. The extent of these interferences depends on the temporal and spatial variability of VOC emission sources. We present methods to correct for these interferences based on the measurement capabilities of modern PTR-ToF-MS instruments.
Table 1 summarizes the key field campaigns and instrumentation used to quantify VOCs and PTR-ToF-MS interferences. Multiple PTR-ToF-MS instruments are used in this study, and Table 1 outlines the PTR-ToF-MS reactor designs and drift tube operating parameters that play an important role in determining ion distributions. The instruments described in this study use ion molecular reactors and ion optics devolved by Ionicon Analytik and TOFWERK, AG as described by Müller et al. (2014) and Krechmer et al. (2018), respectively. In this study, all instruments were operated with 120–140 Td. The following sections describe each campaign and provide additional details of instrument operation.
Table 1Summary of campaigns, instrumentation, drift tube operating parameters, and interferences reported for each campaign. Measurement uncertainties are for calibrated species reported in this study.
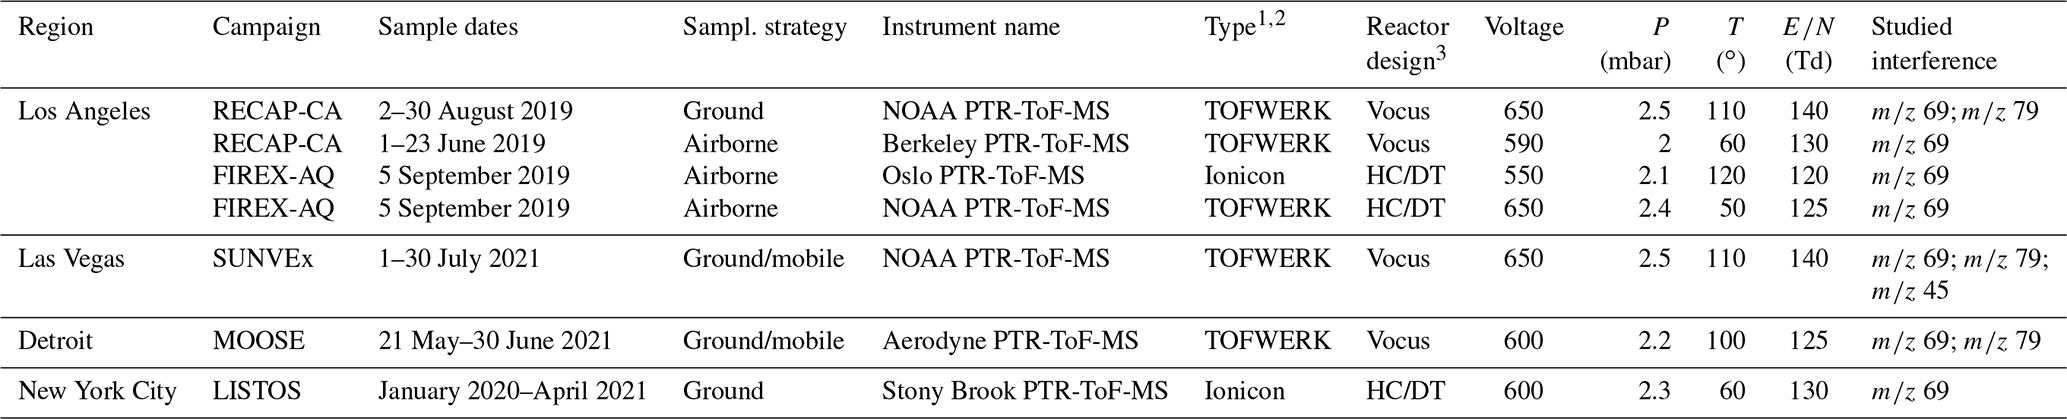
1 TOFWERK design PTR-ToF-MS using quadrupole ion optics as described by Krechmer et al. (2018). 2 Ionicon design PTR-ToF-MS with ion optics consisting of two einzel lenses as described by Müller et al. (2014). 3 HC/DT refers to the hollow cathode/drift tube design used in traditional PTR-MS instruments (e.g., Müller et al., 2014). The Vocus design is described by Krechmer et al. (2018).
2.1 Campaign descriptions
2.1.1 SUNVEx/RECAP-CA
PTR-ToF-MS measurements were performed as part of the 2021 Southwest NOx and VOC Experiment (SUNVEx, https://csl.noaa.gov/projects/sunvex/, last access: 1 December 2023) and Re-Evaluating the Chemistry of Air Pollutants in California (RECAP-CA). SUNVEx was a ground campaign conducted to study air quality in the Las Vegas Valley during the summer ozone season using both mobile and ground-based sampling. The RECAP-CA campaign was conducted in Los Angeles and included mobile, ground-based, and airborne sampling.
Measurements in Las Vegas were conducted between 30 June and 27 July 2021 at an air quality monitoring station located near the Jerome Mack Middle School (Fig. 1). Jerome Mack is an urban background site located ∼ 8 km east of downtown Las Vegas. The site was chosen based on its suite of trace gas and PM2.5 monitors and classification as a US Environmental Protection Agency (EPA) Photochemical Assessment Monitoring Station (Clark County Department of Environment and Sustainability, 2022).
Measurements in the Los Angeles Basin were conducted between 2 August and 5 September 2021 at the California Institute of Technology in Pasadena, CA (Caltech, Fig. 1). The ground site was located within 0.5 km of the site used during the California Research at the Nexus of Air Quality and Climate Change (CalNex) field study in order to directly compare with air quality measurements conducted in 2010 (Ryerson et al., 2013). During this portion of the campaign, instruments were situated in a trailer and sampled air from the top of a 10 m tower. The PTR-ToF-MS sampled air with a bypass flow of ∼ 10 L min−1, resulting in a residence time of ∼ 2 s. Long sample lines may alter VOC distributions by acting as a sink, source, or reactive surface for various compounds. These effects may contribute to the variability of interferences discussed here.
During both SUNVEx and RECAP-CA, the NOAA mobile laboratory was deployed to sample the spatial distribution of VOCs and NOx in regions of varying population density. A similar sampling strategy was employed previously to study urban VOC enhancements in New York City and is useful for identifying VOC signatures emitted from major sources, such as fossil fuels, VCPs, and cooking activities (Coggon et al., 2021; Gkatzelis et al., 2021a, b; Stockwell et al., 2021). Drive tracks from the mobile laboratory are shown on the map in Fig. 1, along with the locations of the ground sites and major population centers.
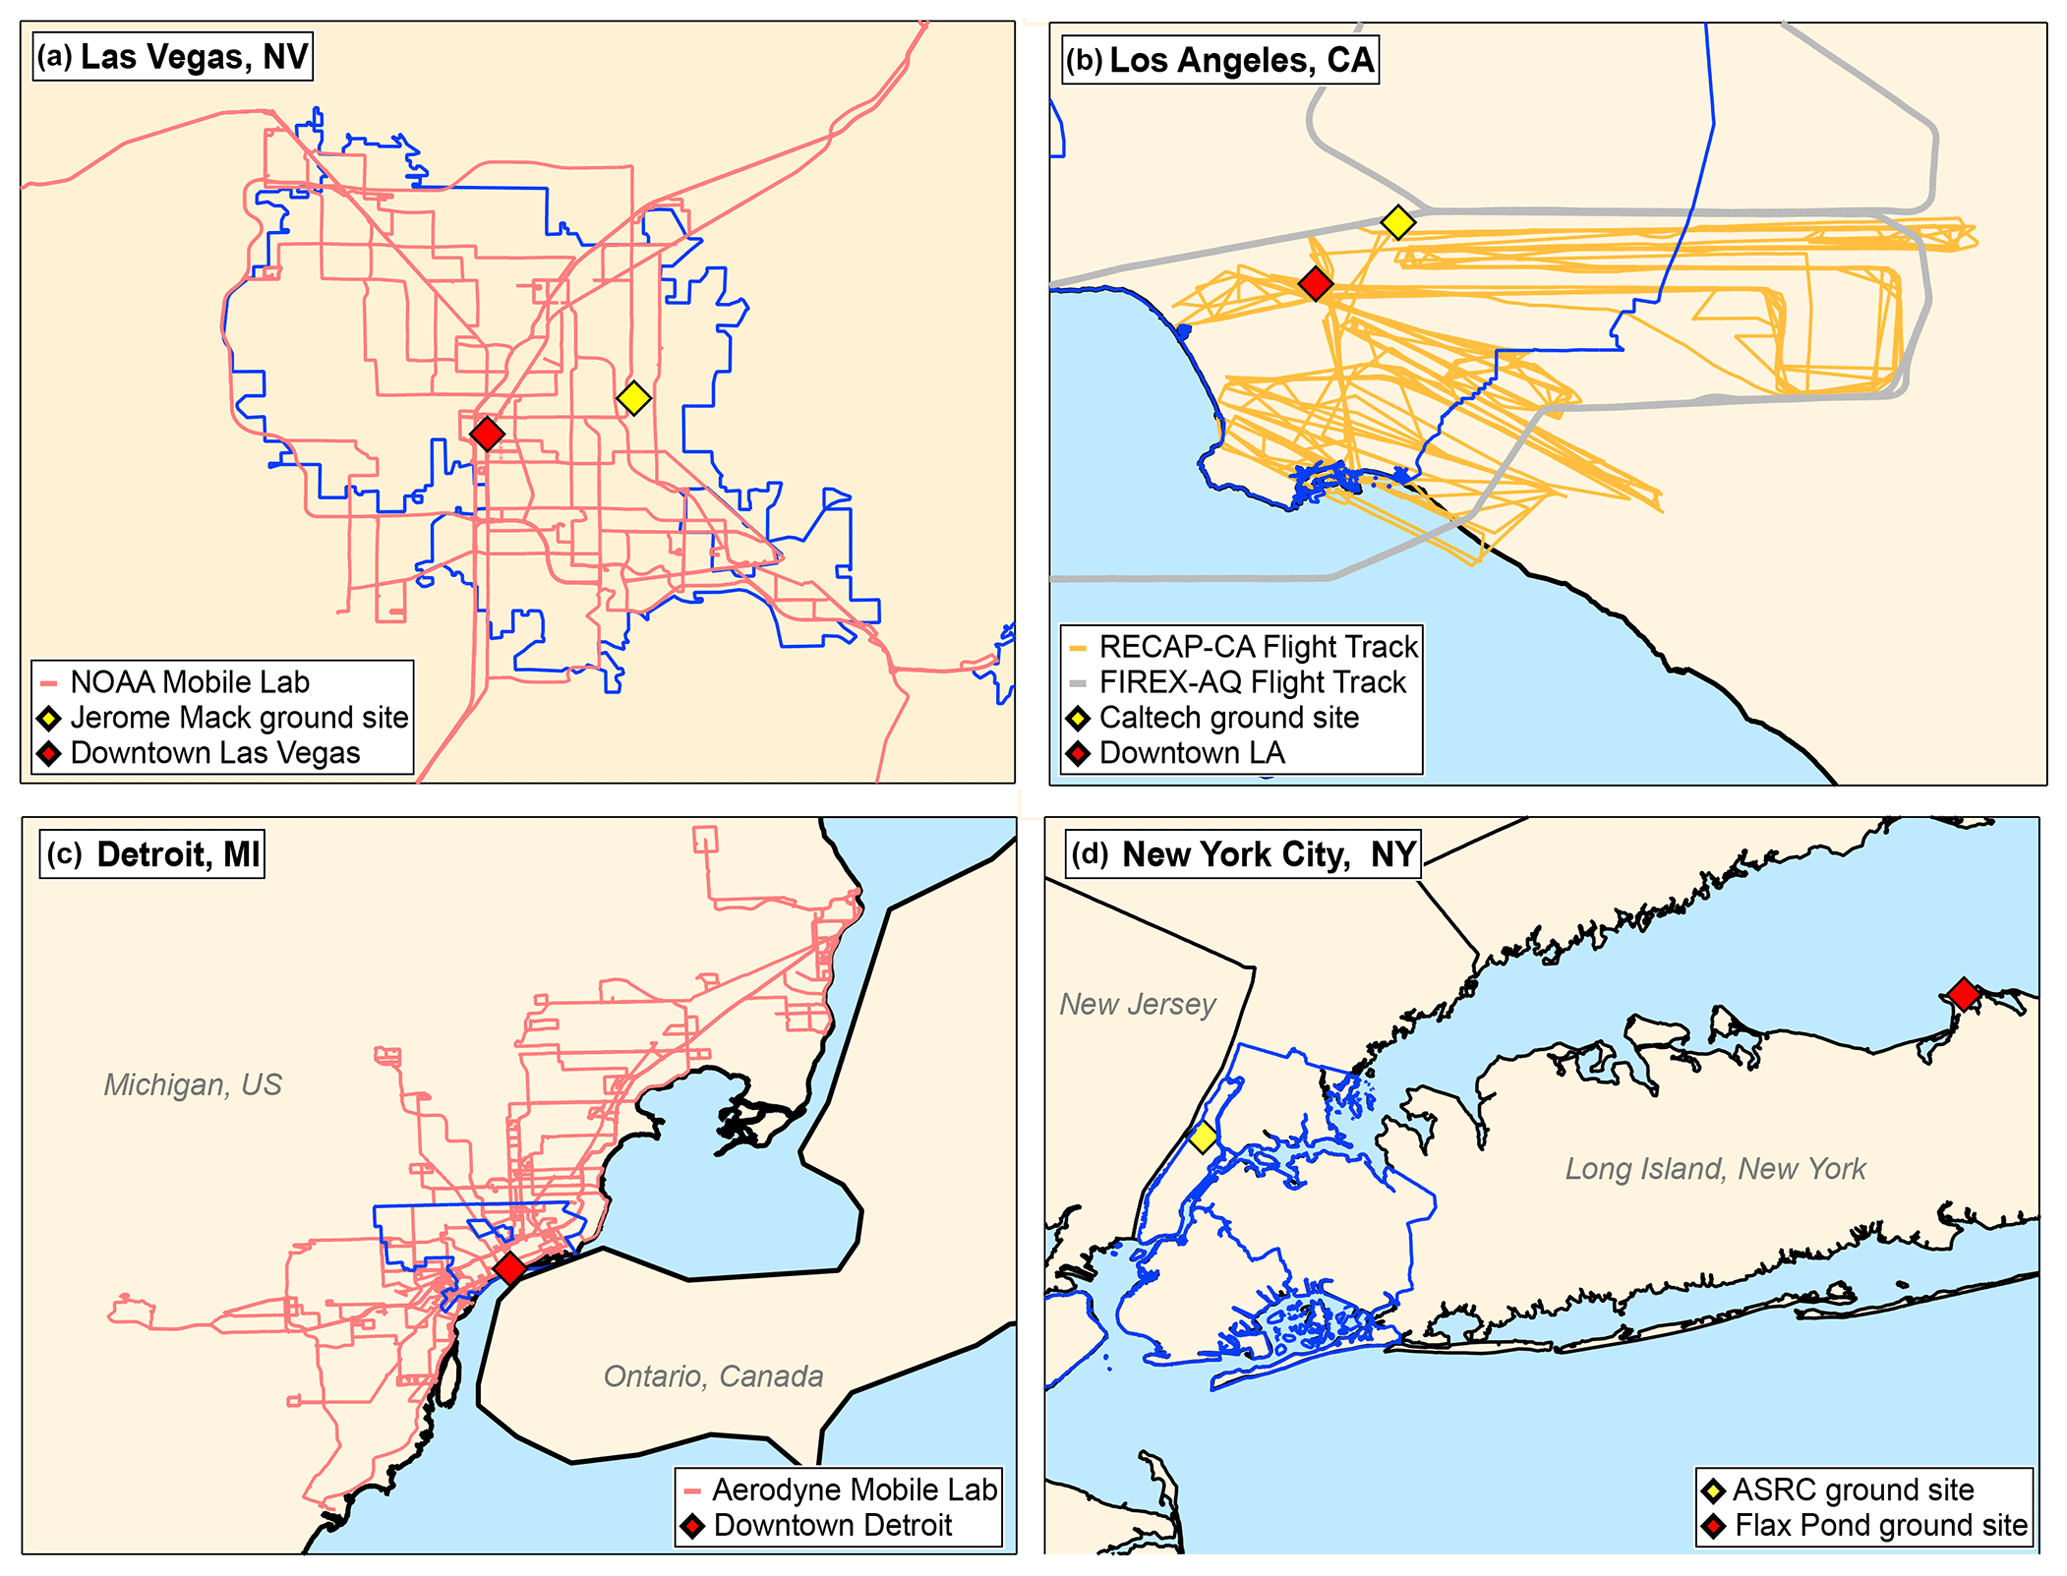
Figure 1Mobile laboratory drive tracks, flight tracks, ground site locations, and locations of interest for the field campaigns outlined in Table 1. The blue lines highlight the statistical metropolitan areas for Las Vegas, Los Angeles, and Detroit, as well as the five boroughs of New York City.
The airborne component of RECAP-CA was conducted on board the Naval Postgraduate School UV-18A Twin Otter aircraft and was based out of an airport located in Burbank, CA. Measurements of VOCs, NOx, and greenhouse gases took place on 9 d between 1 and 23 June 2021. The Twin Otter typically flew at ∼ 300 m above ground level at air speeds of 50–60 m s−1. Each flight covered approximately 500 km of distance across the Los Angeles area, including downtown, the coast, the Santa Ana area, and the San Bernardino Valley. The flight track of the Twin Otter is shown in Fig. 1b.
2.1.2 FIREX-AQ
The 2019 Fire Influence on Regional to Global Environments and Air Quality (FIREX-AQ) campaign was a large field study designed to investigate the emissions and atmospheric chemistry of biomass burning emissions. A detailed description of the campaign, instrumentation, and science goals is provided by Warneke et al. (2023). As part of the measurements, urban flights were performed through the Los Angeles Basin on 5 September 2019. VOC measurements were conducted on board the NASA DC-8 by the NOAA PTR-ToF-MS and University of Oslo PTR-ToF-MS. VOC measurements were also conducted by three GC instruments: the NOAA improved Whole Air Sampler (iWAS), the University of California Irvine Whole Air Sampler (WAS) and the NCAR trace organic gas analyzer with a time-of-flight mass spectrometer (TOGA-ToF). The flight tracks conducted in Los Angeles are shown in Fig. 1b.
2.1.3 MOOSE campaign
The Michigan–Ontario Ozone Source Experiment (MOOSE) campaign was a multi-institutional ground-based and mobile sampling effort conducted in 2021 to study ozone, meteorology, and pollution in and around Michigan and Ontario. This region is currently designated the status of non-attainment of the US federal ozone standard. Aerodyne Research, Inc. scientists deployed the Aerodyne Mobile Laboratory (Herndon et al., 2005; Yacovitch et al., 2015) as part of the CHEmical Source Signatures (CHESS) sub-experiment in order to measure emission plumes from point sources and gain insight into the drivers of local ozone pollution during MOOSE. Other goals of CHESS included developing emission source fingerprints for significant industrial source sites in the area.
Ambient VOC measurements were conducted on board the mobile laboratory using a PTR-ToF-MS, which was co-located with an in situ GC-EI-ToF-MS equipped with a thermal desorption preconcentration (Claflin et al., 2021). The AML sampled air around the Detroit metropolitan region between 21 May and 30 June 2021 (Fig. 1c). During mobile sampling, the mobile laboratory transited through major population centers and targeted industrial point sources. Overnight and when not driving, the mobile laboratory was stationed at Salina Elementary School in Dearborn, MI, parked at the Michigan Department of Environment, Great Lakes, and Energy air monitoring station (AQS ID 26-163-0033).
2.1.4 LISTOS
The Stony Brook PTR-ToF-MS was deployed on the rooftop observatory at the Advanced Sciences Research Center (ASRC) of the City University of New York to make continuous high-time-resolution measurements of VOCs during the COVID lockdown from January 2020 to April 2021, (Fig. 1c; Cao et al., 2023). This campaign was a part of the broader Long Island Sound Tropospheric Ozone Study (LISTOS). ASRC is located in the Manhattan Borough of New York City, which is a highly urbanized region. Air was continuously sampled from a rooftop observatory that is situated ∼ 90 m above sea level on one of the tallest buildings in the vicinity of the site. In June 2022, the Stony Brook PTR-ToF-MS was moved to the Flax Pond Marine Laboratory (40∘57′36′′ N, 73∘8′24′′ W) near Stony Brook, New York, which is about 100 km east of ASRC and located on the north side of Long Island in a forested suburban area. The Flax Pond Marine Laboratory is a 0.6 km2 preserve that encompasses a tidal wetland area and is operated for research purposes by the School of Marine and Atmospheric Sciences of Stony Brook University. At Flax Pond, air was continuously sampled from a ∼ 10 m tower.
2.2 Instrument descriptions
2.2.1 NOAA PTR-ToF-MS
The NOAA PTR-ToF-MS was deployed during SUNVEx, RECAP-CA, and FIREX-AQ. During FIREX-AQ, the NOAA PTR-ToF-MS used a traditional ion source and drift tube as described by Yuan et al. (2016). A full description of the operating parameters, VOC measurements, and calibration methods is provided by Gkatzelis et al. (2023).
During SUNVEx and RECAP-CA, the instrument was modified to use the Vocus focusing ion molecule reactor (TOFWERK, AG) and was operated following the recommendations by Krechmer et al. (2018). The Vocus provides greater sensitivity to VOCs compared to the traditional drift tube design due to the use of quadrupole ion guides that increase ion transmission. Here, the Vocus was operated at 2.5 mbar and with an axial electric field gradient of 65 V cm−1 ( ∼ 140 Td). The water flow to the ion source was maintained at 23 mL min−1 and the drift tube was heated to 110 ∘C. Typically, the quadrupole ion guide in the Vocus PTR-ToF-MS is operated at voltages >275 V to reduce the transmission of reagent ions that would otherwise limit the lifetime of the detectors (Krechmer et al., 2018). Here, the quadrupole ion guide was tuned to 250 V to increase the transmission of ions produced from important VOCs with low molecular weights, such as ethanol ( 47), acetonitrile ( 42), and methanol ( 33). Figure S1 in the Supplement compares the product distribution of VOCs measured by the Vocus against those measured with the traditional drift tube. In general, the ion product distributions are comparable, though small differences in water clusters and fragmentation in the Vocus reflect the higher amount of water in the drift tube and a higher operating . The degree of fragmentation in the NOAA Vocus PTR-ToF-MS is comparable to other PTR-MS systems with Td (e.g., Buhr et al., 2002; Pagonis et al., 2019). Other Vocus PTR-ToF-MS instruments used in this study observed higher fragmentation owing to differences in operating conditions of the big-segmented quadrupole (BSQ). The implications of fragmentation from the BSQ are discussed further in Sect. 3.1.
When installed on the mobile laboratory, the PTR-ToF-MS sampled air through a 1 m Teflon inlet at 2 L min−1, and instrument backgrounds were determined every 15 min. Instrument backgrounds were determined hourly by passing ambient air through platinum catalyst heated to 350 ∘C. The PTR-ToF-MS was calibrated using gravimetrically prepared gas standards or by liquid calibration (Coggon et al., 2018). Mixing ratios for calibrated species have uncertainties of ∼ 20 %.
2.2.2 University of Oslo PTR-ToF-MS
The University of Oslo PTR-ToF-MS was deployed during FIREX-AQ to target NH3 but also measured the same VOCs as the NOAA PTR-ToF-MS. The instrument was operated as described by Müller et al. (2014) with modifications to reduce the formation of NH in the ion source as described by Tomsche et al. (2023). Briefly, the instrument sampled air through a heated inlet at a flow rate of 10–60 L min−1 in order to reduce losses of NH3 to inlet surfaces. The drift tube was operated at 2.1 mbar and 120 ∘C with a corresponding ratio of 120 Td. VOC sensitivities were determined via calibrated using gravimetrically prepared standards. Mixing ratios for calibrated species have uncertainties of ∼ 10 % (Müller et al., 2014).
2.2.3 University of California Berkeley PTR-ToF-MS
The Berkeley Vocus PTR-ToF-MS (Aerodyne Research, Inc., Billerica, USA) was deployed during the RECAP-CA aircraft campaign on the US Navy Twin Otter. The PTR-ToF-MS was operated with a Vocus reactor set to 60 ∘C, 2.0 mbar, and an ratio of ∼ 130 Td. The potential gradient along the drift tube was 590 V. The gradient between BSQ skimmer 1 and skimmer 2 was changed once during the campaign from 6 to 9.1 V, which resulted in an improved sensitivity for some VOCs but significantly stronger fragmentation for other compounds such as nonanal (Fig. S2). Both operating conditions were calibrated. The reagent water flow was 20 mL min−1. Similar to the NOAA-PTR-ToF-MS, the voltage of the quadrupole ion guide was operated at 200 V to improve the transmission for low-mass VOCs like methanol.
Ambient air was sampled via a 90 cm long heated (40 ∘C) in. Teflon line through a Teflon filter from an isokinetic inlet (flow rate ∼ 6 m s−1 for 5 m length) with a mass flow controller at 1.5 L min−1. Mass spectra were recorded at 10 Hz time resolution for a mass range of 10–500 Da. Zero-air blank measurements were conducted several times in each flight for 1–5 min during aircraft turns about two to four times per flight, each followed by a pulse of calibration gas ∼ 1–5 min in duration. These in-flight calibrations were used to validate the sensitivities calculated from ground calibrations. Ground calibrations were conducted every 1–3 d (in total, 19 times) during the campaign using one of three gravimetrically prepared multicomponent VOC standards (Apel-Riemer Environmental Inc., Miami, FL, USA). More details on the instrument operation, calibration, and determination of uncertainties can be found in Pfannerstill et al. (2023b). Mixing ratios for calibrated species have uncertainties of ∼ 20 %.
2.2.4 Aerodyne PTR-ToF-MS
Aerodyne Research, Inc. deployed a Vocus PTR-ToF-MS during MOOSE 2021 (Krechmer et al., 2018; Riva et al., 2019). The Vocus was operated at a pressure of 2.2 mbar and axial voltage gradient of 600 V, corresponding to an ratio of 125 Td. Data were recorded and processed at 1 Hz time resolution using the Tofware software (Aerodyne Research Inc. and TOFWERK) in Igor Pro (WaveMetrics) (Stark et al., 2015). Background measurements were conducted every 16 min by overflowing the Vocus inlet with air from a zero-air generator (ZAG) equipped with a Pt–Pd catalyst at 400 ∘C. Calibrations were performed every 4 h with a multicomponent VOC mixture (Apel-Riemer Environmental Inc., Miami, FL, USA; nominal 1 ppm in N2) diluted with ZAG air. Mixing ratios for calibrated species have uncertainties of ∼ 20 % (Krechmer et al., 2018).
2.2.5 Stony Brook PTR-ToF-MS
The Stony Brook Ionicon high-resolution PTR-ToF-MS (Ionicon 8000, Analytik GmbH, Austria) was deployed in New York City during the COVID shutdown and subsequently at Flax Pond on Long Island. In this study, the Stony Brook PTR-ToF-MS was operated with a drift field of ∼ 130 Td, drift voltage of 600 V, reactor temperature of 60∘, and drift tube pressure of 2.3 mbar. The instrument sampled VOCs through a heated (60∘) in. outer diameter (o.d.) capillary PEEK inlet (∼ 1 m length) with bypass flow line teed off the 1/2 in. PTFE inlet line fitted with a blower on the back end (residence time of the gas was ∼ 10 s). Data were collected at 1 Hz and integrated to 5 min averages.
Calibrations were performed using a dynamic dilution system. VOC-free air was produced by pumping ambient air through a Pt-based catalytic converter at 400∘, then mixed with multicomponent gas calibration mixture (Apel-Riemer Environmental Inc., Miami, FL, USA) that included isoprene. Calibration was performed spanning a concentration range of observed values (0, 5, 10, 15, 20 ppbv). At ASRC, the calibration gas was typically analyzed twice a week prior to the COVID-19 lockdown and typically every 1–2 weeks during the lockdown given limited access to the observatory. At Flax Pond, the calibration gas was analyzed once a week. Mixing ratios for calibrated species have uncertainties of ∼ 20 % (Cao et al., 2023)
2.2.6 GC-PTR-ToF-MS and other GC-MS instruments
To guide the identification of the proton-transfer-reaction products, a GC was used to trap and pre-separate ambient VOCs sampled by the NOAA PTR-ToF-MS during SUNVEx. The GC deployed here is the same instrument used by Stockwell et al. (2021) to identify molecular isomers measured from coating headspaces. Briefly, the GC consists of a liquid nitrogen cryotrap coupled to a DB-624 column (Restek MXT-624; 30 m length × 0.25 mm inner diameter – i.d., 1.4 µm film thickness). Samples were collected onto the cryotrap at predetermined volumes (typically 80 cm3), then injected onto the column via rapid heating to 100 ∘C. Nitrogen gas carried the sample through the column at 8 sccm while the column was heated from 40 to 150 ∘C at a rate of 12 ∘C min−1. The effluent from the column was injected into the PTR-ToF-MS inlet. In this study, we use this setup (termed GC-PTR-ToF-MS) to qualitatively assess isomer distributions and fragmentation patterns for VOCs detected during in situ sampling.
The GC-PTR-ToF-MS was primarily deployed during the ground-based sampling phase in Las Vegas. Samples were collected every 2 h and automatically analyzed by PTR-ToF-MS. Between GC measurements, the PTR-ToF-MS sampled ambient air through a 10 m Teflon inlet at 2 L min−1. During an evening drive on 31 July 2021, the GC-PTR-ToF-MS was deployed to speciate VOCs on the Las Vegas Strip, where large crowds of people were present and anthropogenic emissions from personal care products, cooking, and other human activities were expected to be highest.
Additional GC measurements were conducted as part of the field campaigns described in Sect. 2.1. A full description of these measurements is provided in the Supplement.
The following sections outline PTR-ToF-MS interferences observed for ions typically assigned to isoprene, oxygenated VOCs, and aromatic VOCs. The primary data used for this analysis are from the NOAA PTR-ToF-MS, which provided direct evidence of interferences via GC pre-separation. Each section begins with a description of GC-PTR-ToF-MS samples collected along the Las Vegas Strip during SUNVEx. This region comprises many hotels and entertainment establishments and is impacted by emissions from fossil fuels, VCPs, and restaurant cooking. This region had the highest observed mixing ratios compared to New York, Detroit, and Los Angeles. These interferences are then compared to ground site data collected by the NOAA PTR-ToF-MS during SUNVEx and RECAP-CA. Finally, observations from other instruments in cities across the US are presented to show the ubiquity of these interferences across instruments and urban environments. Where possible, we describe methods to correct for interferences.
A key focus of this discussion is the impact of fragmentation on PTR-ToF-MS observations of the C5H8H+ ion at 69.070 (henceforth referred to as 69). This ion is typically assigned to isoprene, and mixing ratios are determined based on measurements of isoprene standards; however, the raw signals at this mass may include contributions of other compounds due to fragmentation. Throughout the discussion, we report 69 mixing ratios calculated using PTR-ToF-MS sensitivities to isoprene in order to demonstrate the extent to which interferences bias estimations of isoprene mixing ratios. We note that this analysis only reflects interferences attributable to high-resolution PTR-MS systems. Quadrupole or compact time-of-flight mass spectrometers measure additional ions that are isobaric to C5H8H+ (e.g., furan, C4H4OH+ at 69.034), and further corrections are needed to these data to resolve isoprene mixing ratios.
3.1 Isoprene
3.1.1 Known interferences to isoprene ( 69)
Biogenic VOCs are commonly reported by PTR-ToF-MS, including isoprene and the sum of monoterpene isomers. Isoprene is the dominant biogenic VOC emitted by urban foliage and is a major contributor to urban OH reactivity (Calfapietra et al., 2013). Interferences to isoprene in PTR-ToF-MS spectra result from the production of the C5H8H+ ion, which is a common fragment for higher-carbon aldehydes (> C5), alkenes, and cycloalkanes (Buhr et al., 2002; Gueneron et al., 2015; Pagonis et al., 2019; Romano and Hanna, 2018). Previous studies have characterized ambient isoprene interferences from 2-methyl-3-buten-2-ol alkenes emitted from biogenic sources (e.g., Karl et al., 2012; Fall, 2001) and cycloalkanes emitted from fossil fuel use as well as oil and natural gas production (e.g., Gueneron et al., 2015; Warneke et al., 2014; Pfannerstill et al., 2023b). For example, Gueneron et al. (2015) showed that substituted cyclohexanes and cyclohexenes produce fragmentation patterns that consist largely of 111, 125, 69, 83, 57, and other less abundant hydrocarbon fragments. In regions with significant oil and natural gas development, these compounds may produce interferences at 69, which can interfere with the signal resulting from biogenic sources of isoprene (e.g., Warneke et al., 2014). Similarly, Kilgour et al. (2021) show that aldehydes emitted due to ozone deposition to surface ocean waters may interfere with the quantification of isoprene. The key aldehydes observed to produce an interference were nonanal and octanal. The same aldehydes may be produced on inlet surfaces exposed to high ozone concentrations and result in an isoprene artifact (Ernle et al., 2023; Vermeuel et al., 2022).
3.1.2 Characterizing aldehyde interferences to 69 using GC-PTR-ToF-MS
Figure 2 shows a GC-PTR-ToF-MS chromatogram of the ion typically assigned to isoprene ( 69, C5H8H+). This sample was collected on the Las Vegas Strip in the evening (∼ 22:15 local time – LT; the time zone for all instances in the text is LT) when biogenic emissions of isoprene are expected to be low. The chromatogram shows that isoprene (retention time, RT = 65 s) is only a small contributor to the signal at 69 measured in this region. Additional peaks are observed at RT = 210, 250, 600, and 710 s. These peaks are not cycloalkanes, as might be expected from mobile source emissions (Gueneron et al., 2015); rather, these are fragmentation products of saturated aldehydes, including methylbutanal, pentanal, octanal, and nonanal. Chromatograms of the parent ions attributed to octanal and octanone ( 129, C8H16OH+), together with nonanal and nonanone ( 143, C9H18OH+), are shown in Fig. S3. The parent ion and the water-loss products ( 111 C8H and 125 C9H, respectively) are observed, but at different ratios between the aldehydes and ketones. Pentanal and methylbutanal almost entirely fragment and do not a exhibit significant signal at the parent ion mass. Comparisons of ambient observations with GC-PTR-ToF-MS chromatograms of standard mixtures show that only aldehydes (and not the ketones) are observed in significant quantities on the Las Vegas Strip (Fig. S3).
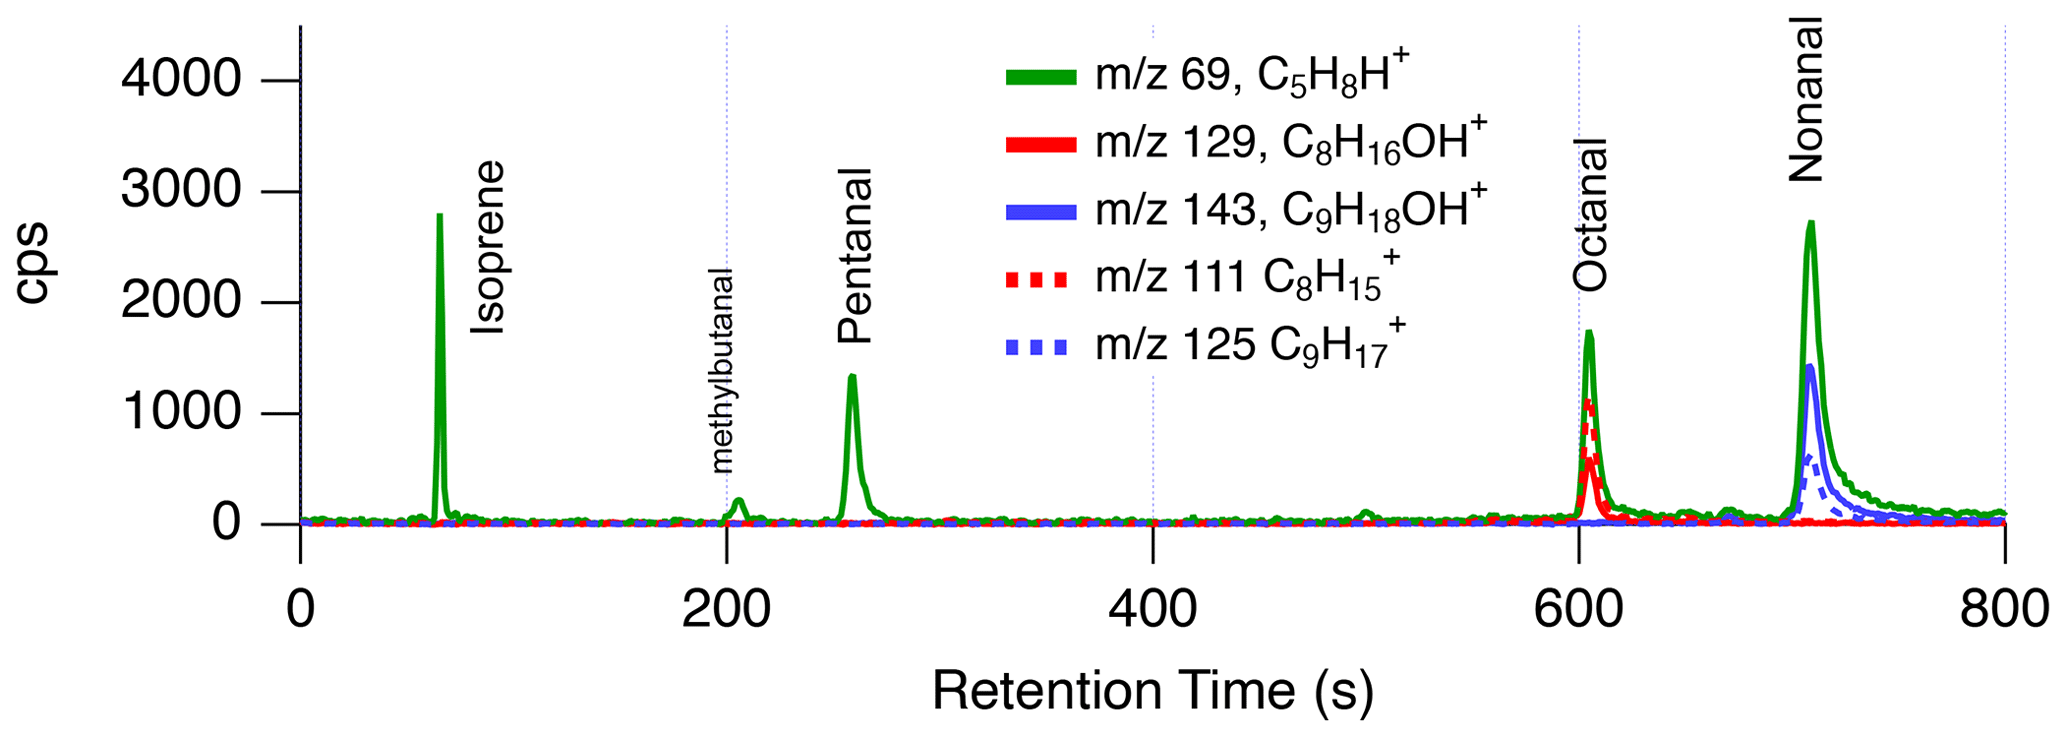
Figure 2GC-PTR-ToF-MS chromatogram from downtown Las Vegas at 22:15 on 30 July 2021, showing the contributions of isomers and fragments to the ion typically assigned to isoprene ( 69, C5H8H+).
These aldehyde emissions likely result from cooking (Arata et al., 2021; Klein et al., 2016; Schauer et al., 1999; Karl et al., 2018; Wernis et al., 2022) and their significant presence on the Las Vegas Strip possibly reflects the high density of restaurants along Las Vegas Boulevard. Figure 3 shows mobile laboratory measurements of nonanal and 69 during evening drives on 28 June and 30 July 2021. GC-PTR-ToF-MS sampling was only conducted on 30 July and the location of the sample (Las Vegas Strip) is shown in Fig. 1a. During both drives, 69 was enhanced along Las Vegas Boulevard and mixing ratios reached a maximum of 6 ppb. On 28 June, 69 and nonanal detected at 143 (C9H18OH+) are highly correlated (r2>0.93), suggesting that these ions share a common source. A similar correlation was observed between 69 and octanal (r2=0.90).
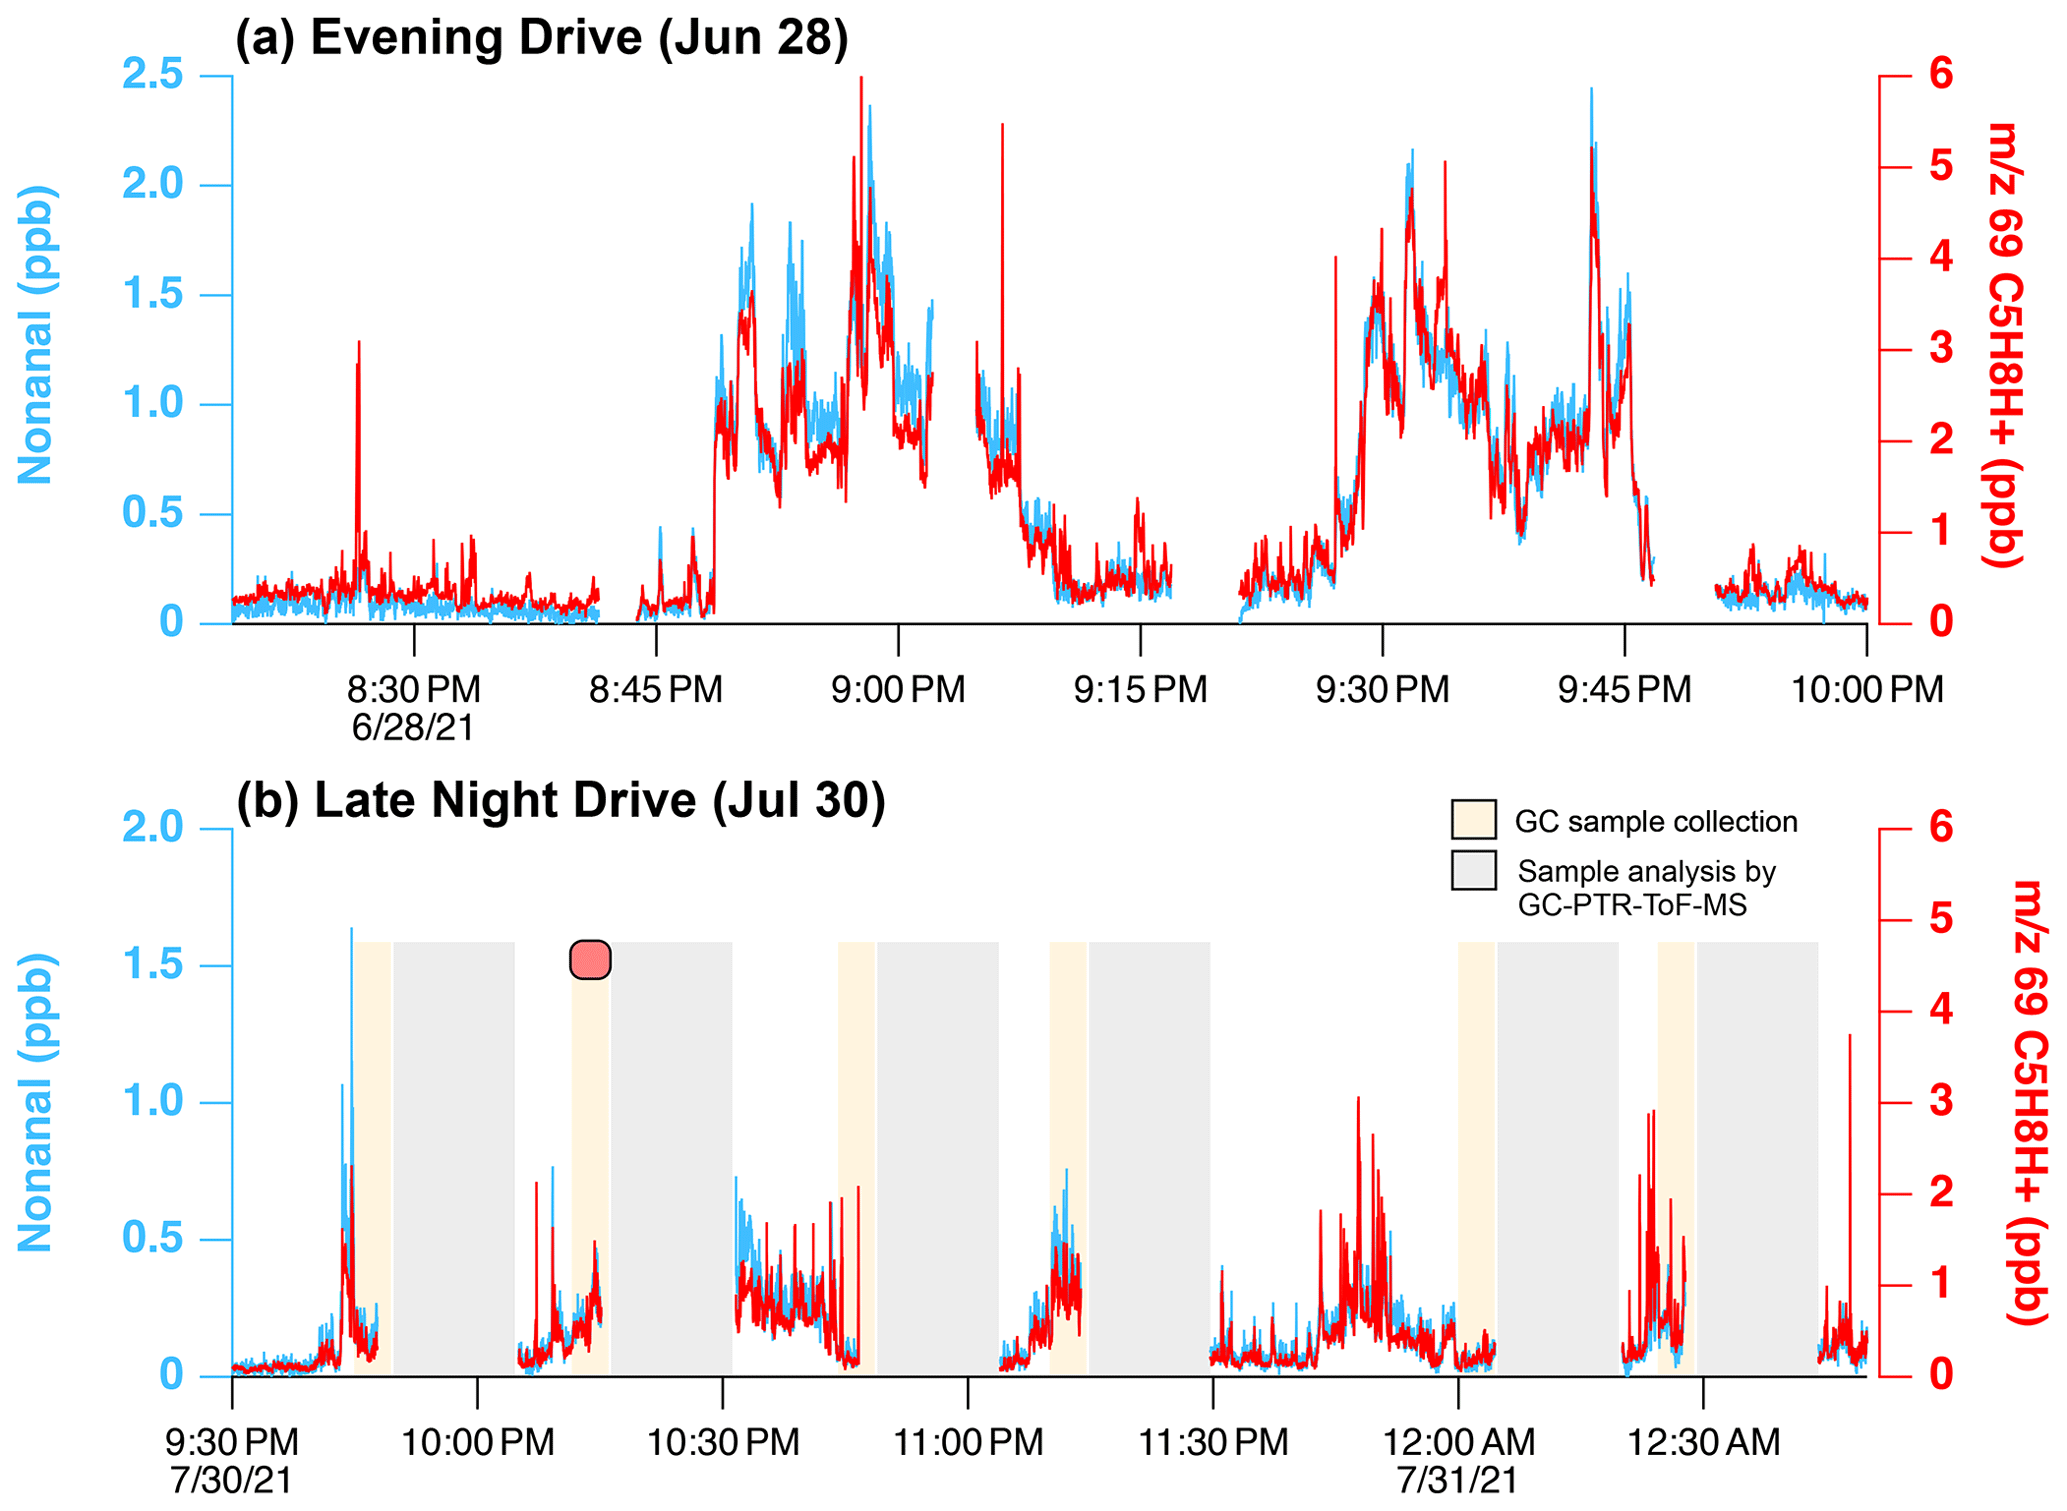
Figure 3Mobile laboratory data showing PTR-ToF-MS measurements of nonanal ( 143, C9H18OH+, blue) and 69 (C5H8H+, red) on the Las Vegas Strip during nighttime hours on (a) 28 June and (b) 30 July 2021. Mixing ratios of 69 are calculated assuming a sensitivity equivalent to isoprene. GC samples were only collected on 30 July, and the shaded regions in panel (b) show periods of sample collection (beige) and sample analysis (grey). The red marker in panel (b) indicates the time of the GC-PTR-ToF-MS sample shown in Fig. 2.
Long-chain aldehydes are not routinely reported in urban datasets and the isoprene interference due to aldehyde fragmentation is underappreciated in ambient PTR-ToF-MS datasets. Studies have described how aldehydes produced on the surfaces of inlet tubing interfere with isoprene measured by PTR-ToF-MS in remote forests (Vermeuel et al., 2022) and in the stratosphere (Ernle et al., 2023), and aldehydes emitted from ocean surface waters also interfere with isoprene measurements in laboratory studies and ambient measurements near coastal regions (Kilgour et al., 2021). Long-chain aldehydes are likely ubiquitous in cities, and cooking activities are likely a major source of octanal and nonanal, resulting in an isoprene interference (Wernis et al., 2022; Peng et al., 2022).
The interference from aldehydes is likely common across PTR designs, even though differences could exist due to operating conditions (e.g., the ratio). Figure S1 compares the fragmentation patterns of pentanal, octanal, and nonanal observed in the NOAA PTR-ToF-MS ( ∼ 140 Td), which utilizes the Vocus ion source, to those reported by Buhr et al. (2002) ( ∼ 120–130 Td), which employ a traditional drift tube and quadrupole. In both reactor designs, C5 aldehydes lose neutral water to produce C5H8H+ ( 69) directly, while larger aldehydes such as octanal and nonanal lose water to produce C8H ( 111, exact mass: 111.117) and C9H ( 125, exact mass: 125.123), then further fragment to produce the C5H8H+ ion (Buhr et al., 2002; Pagonis et al., 2019). These water-loss products are unique to aldehydes since ketone isomers do not undergo significant fragmentation (Fig. S3).
We note that even though the fragmentation was similar between two instruments with different reactor designs, fragmentation may result from the operation of other instrument components. For example, the intensity of aldehyde fragmentation was found to vary strongly with voltage gradients within the BSQ of the Berkeley Vocus PTR-ToF-MS (Fig. S2). These results show that PTR-ToF-MS systems employing quadrupole ion guides may exhibit fragmentation outside the drift tube region; consequently, care may be needed when tuning instruments to minimize unwanted secondary reactions.
3.1.3 Corrections to 69 measured by NOAA PTR-ToF-MS during ground sampling in Los Angeles and Las Vegas
GC-PTR-ToF-MS and mobile laboratory measurements described in Sect. 3.1.2 indicate that aldehydes significantly contribute to the signal at 69 in urban areas. Chromatograms show that the dehydration products from nonanal ( 125) and octanal ( 111) are useful markers that distinguish aldehydes from ketone isomers. Coincidentally, the dehydration products from nonanal and octanal are identical to the fragments produced from substituted cyclohexanes, which interfere with isoprene in hydrocarbon-rich environments (see Gueneron et al., 2015; Warneke et al., 2014; Pfannerstill et al., 2023b). Here, it is proposed that the signals at 111 and 125 can be used as proxies to calculate the contribution from aldehyde and cycloalkane fragmentation to the signal at 69 in urban areas.
Figure 4 shows how the sum of 111 and 125 (termed the “isoprene interference”) varies relative to the signal at 69 measured by the NOAA PTR-ToF-MS at the ground sites in Los Angeles and Las Vegas. In Los Angeles, high daytime emissions of isoprene dominate and comprise most of the signal of 69 from 06:00–19:00 LT. The high variability in the signal at 69 is caused by very localized emissions from trees upwind of the measurement site. In Las Vegas, isoprene emissions are much lower and the diel pattern of 69 closely follows the behavior of the isoprene interference with only a small additional signal during the daytime.
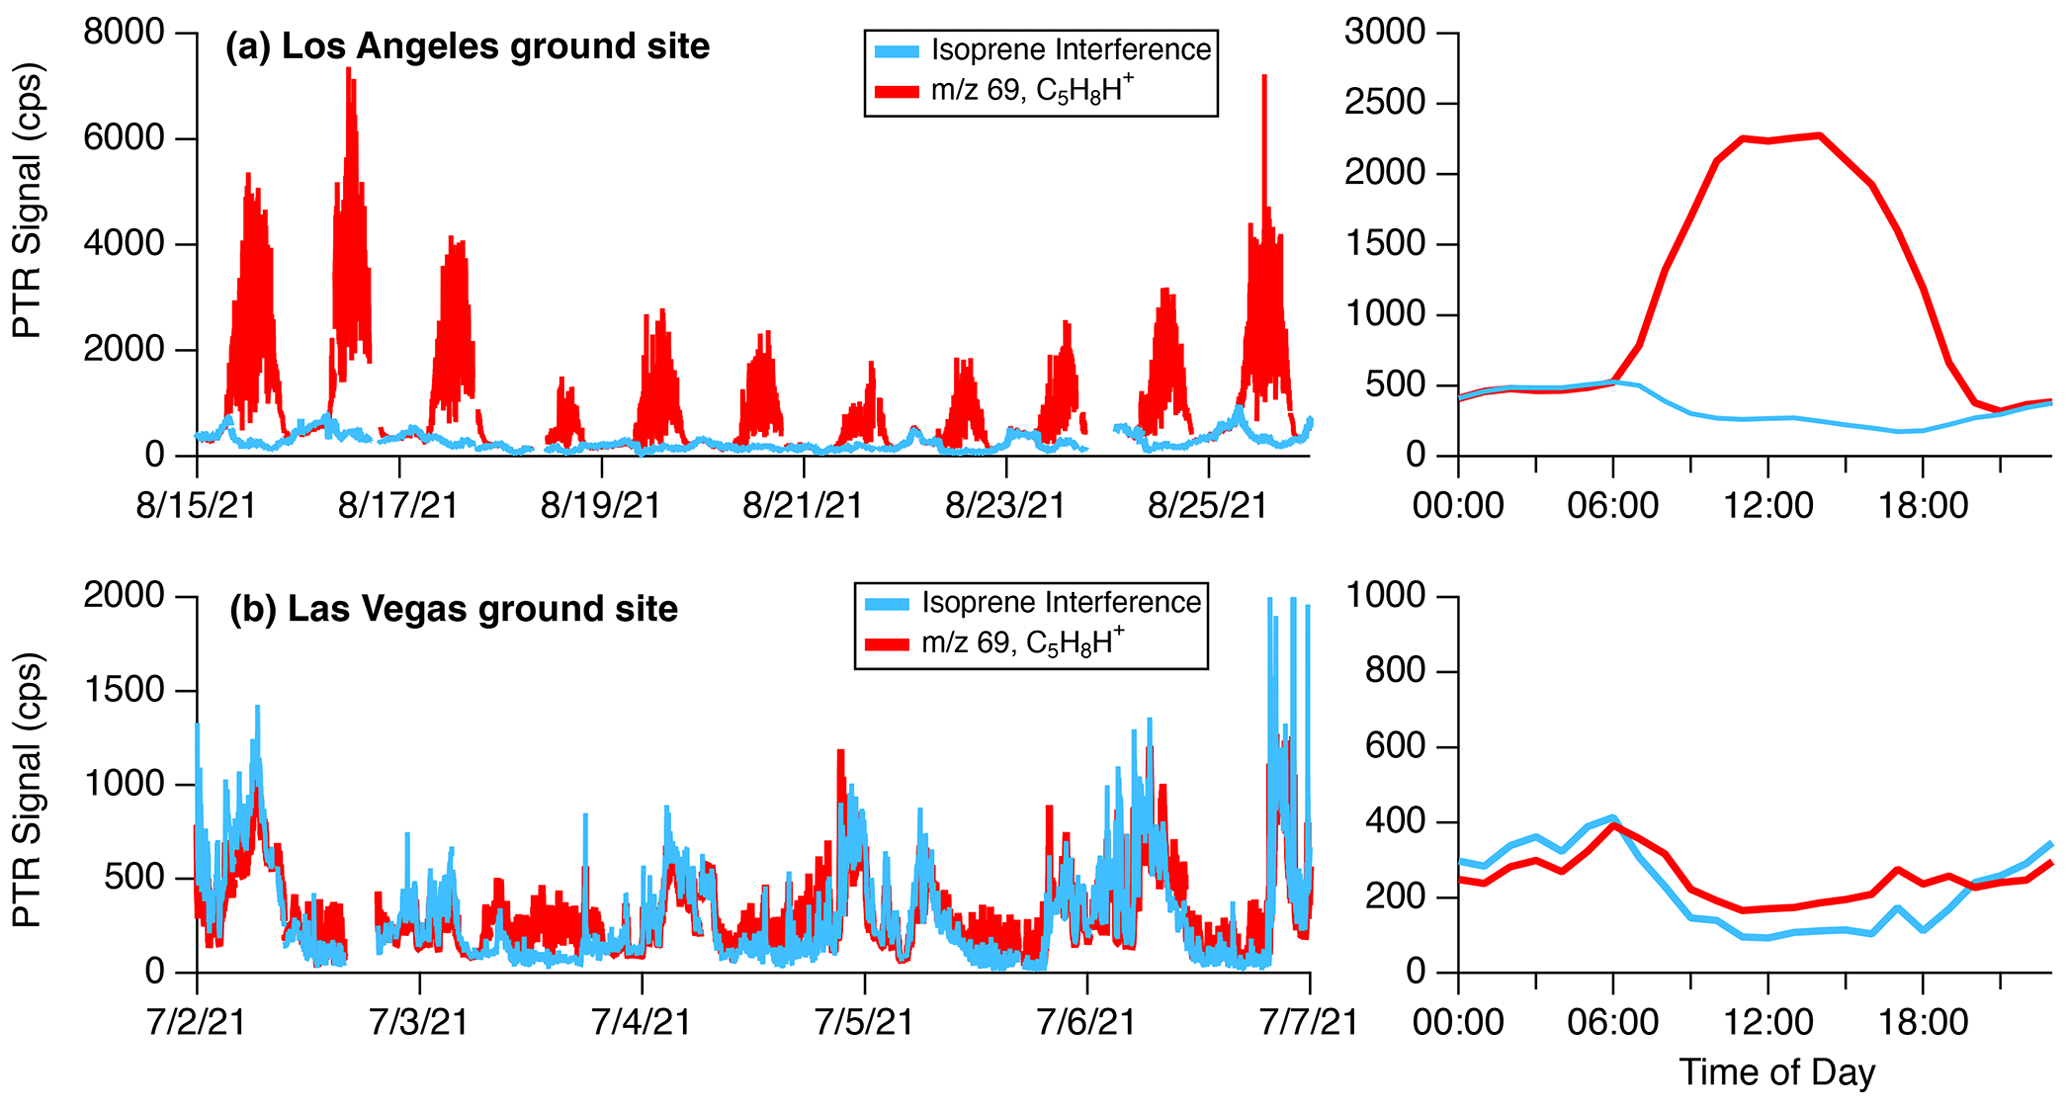
Figure 4Time series and diurnal pattern of the signal at 69 (C5H8H+) and the isoprene interference ( 111 + 125) measured at the (a) Los Angeles and (b) Las Vegas ground sites by the NOAA PTR-ToF-MS. The time series data are shown for select periods to illustrate correlations between the isoprene interference and 69. The diel patterns on the right are campaign averages.
Biogenic isoprene is predominantly emitted during daytime hours (e.g., Guenther et al., 2012), while the isoprene interference in both cities is more prevalent at night. These differences in diurnal patterns can be leveraged to subtract interferences from aldehydes and cycloalkanes from PTR-ToF-MS measurements of 69. Here, the signals at 69, 111, and 125 are analyzed between 00:00 and 04:00 LT when daytime isoprene from biogenic sources is expected to be low. The instrument response to aldehyde and cycloalkane fragmentation is calculated by determining the ratio of 69 to the sum of 111 + 125. This ratio is then applied to the full dataset following Eq. (1).
S69 is the signal measured at 69, S111+125 is the signal of the isoprene interference (sum of 111 + 125), and is the interference ratio determined at night. The nighttime interference ratio in Las Vegas (3.1) and Los Angeles (3.6) is shown in Fig. S4. This interference ratio is determined using an orthogonal distance regression to account for errors in the signals at 69, 111, and 125. The differences between the cities may reflect variations in the distribution of aldehydes and cycloalkanes.
Figure 5 shows how measurements of 69 change as a result of this correction and compares the corrected and calculated isoprene mixing ratios to the GC-MS measurements co-located with the PTR-ToF-MS. In Los Angeles, the correction largely impacts 69 signals at night. The diurnal pattern shows that average mixing ratios approach zero in the evenings, though increases in nighttime isoprene mixing ratios are observed during some periods (e.g., 22–24 August, Fig. S5). Corrections to 69 during the daytime lead to a ∼ 10 % decrease in reported mixing ratios. This shows that even when isoprene emissions are high, VOC fragmentation can have a significant impact on the signal at 69.
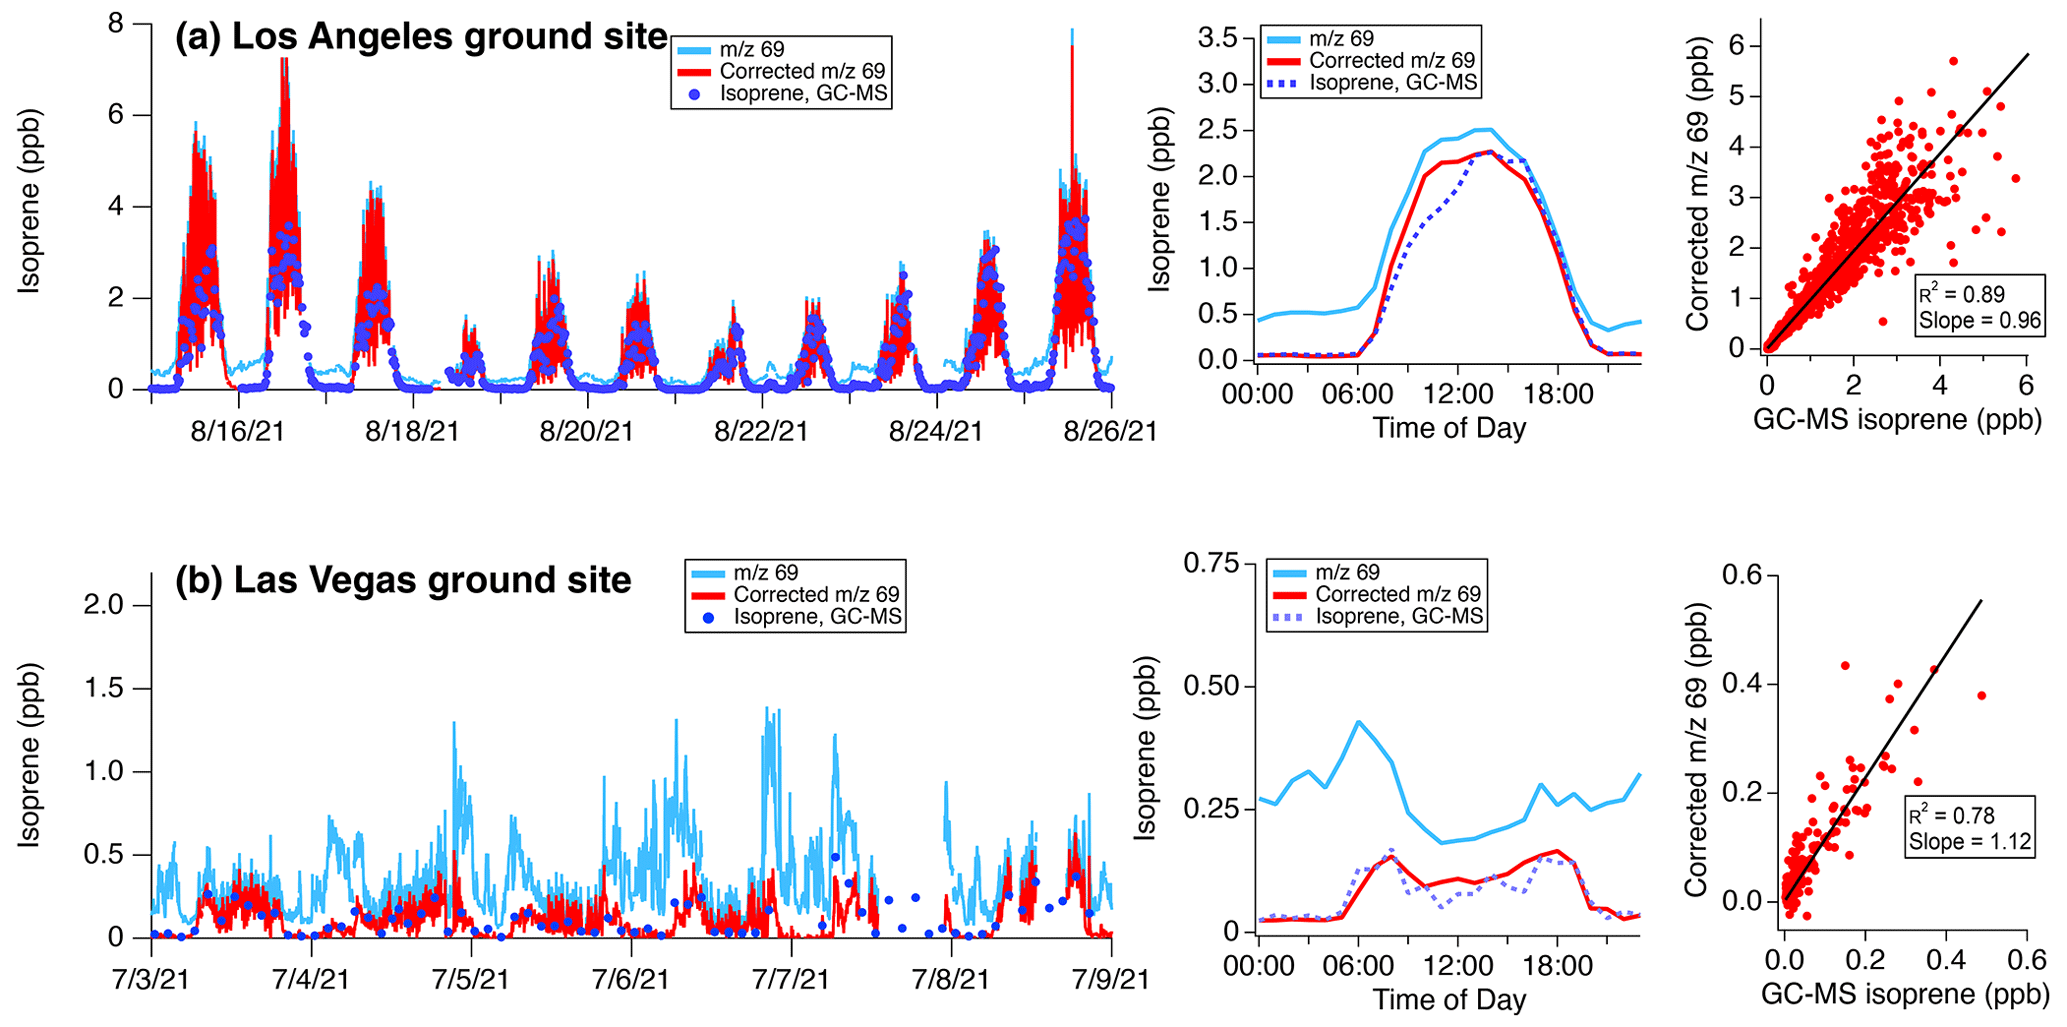
Figure 5Uncorrected and corrected 69 as time series, diel averages, and correlation plots for (a) the Los Angeles and (b) Las Vegas ground sites. GC-MS measurements are shown for comparison against the corrected 69 isoprene mixing ratios. A detailed comparison of nighttime isoprene corrections in Los Angeles is shown in Fig. S5. The best fits are determined using ODR.
The corrected 69 measurements are well-correlated with GC-MS isoprene measurements (r2=0.89) and agree to within 4 %. At high isoprene mixing ratios, the measurements exhibit a greater degree of scatter. This variability likely results from the differences in sampling timescales (1 s for PTR-ToF-MS, ∼ 240 s for GC-MS, and 120 s for WAS samples) along with the high variability of isoprene emissions from trees at the measurement site. When averaged to a diel profile, the daytime mixing ratios also agree to within 4 %. Both instruments show that average isoprene decreases to low mixing ratios at night (<0.05 ppb). The GC-MS observed a number of periods of enhanced nighttime isoprene, likely from non-biogenic sources. Remarkably, after accounting for the isoprene interference, the corrected 69 mixing ratios from the PTR-ToF-MS capture the variability in nighttime isoprene observed by GC-MS in Los Angeles (Fig. S5). On average, the isoprene interference represents ∼ 90 % of the nighttime signal of 69.
The isoprene correction is most impactful on the Las Vegas measurements where isoprene emissions are low and aldehyde + cycloalkane fragments constitute a larger fraction of the signal at 69. Without correction, the variability in 69 across all daytime hours is driven by the isoprene interference (Fig. 4). After the interference contributions are subtracted, corrected isoprene mixing ratios approach zero at night and decrease by nearly 50 % to 0.1–0.15 ppb during the day (Fig. 5b). The resulting diel pattern changes substantially and exhibits a daytime peak that is consistent with the expected pattern for isoprene. GC-MS measurements show that isoprene mixing ratios were typically <0.2 ppb and the corrected 69 diel pattern generally matches the average diel pattern of isoprene reported by GC-MS. Though the number of canister samples in Las Vegas was limited (total 275, sampled every 2–4 h), a comparison between the corrected 69 and GC-MS isoprene shows that the measurements agree to within 15 %.
3.1.4 Corrections to 69 measured by NOAA and Oslo PTR-ToF-MS during airborne sampling over Los Angeles
The isoprene interferences observed during SUNVEx and RECAP-CA show that PTR-ToF-MS measurements of 69 are significantly impacted by aldehydes and cycloalkanes. To assess the impact of isoprene interferences at higher altitudes, we analyze the FIREX-AQ and RECAP-CA measurements of flights in the Los Angeles Basin and determine corrected 69 signals following Eq. (1). One challenge to this approach is that the DC-8 and Twin Otter aircraft did not sample the Los Angeles Basin at night, and therefore the interference ratio () is not easily determined in the absence of isoprene. To overcome this limitation for FIREX-AQ, we vary the interference ratio until the corrected 69 signals reported by the NOAA PTR-ToF-MS match the isoprene mixing ratios reported by GC instrumentation on the DC-8. The resulting ratio determined by iteration (4.4) is ∼ 20 % higher than the ratio determined at ground level during SUNVEx (3.6), which likely reflects differences between the operating conditions and drift tube designs used on the NOAA PTR-ToF-MS during FIREX-AQ and SUNVEx (traditional vs. Vocus).
Figure 6 illustrates the spatial and temporal variability in (a) the corrected 69 mixing ratios and (b) the calculated interference. Transits to the north show that the interference is highest along the San Gabriel Mountains where anthropogenic pollution typically builds in the Los Angeles Basin (Angevine et al., 2013) and reached mixing ratios as high as 500 ppt. The interference correlates well with both methylcyclohexane measured by the UCI WAS and methylpropanal measured by TOGA-ToF, which are proxies for the species known to fragment to produce the isoprene interference (i.e., cycloalkanes and aldehydes). Corrected 69 mixing ratios only exhibit significant enhancements in regions where the DC-8 sampled air close to vegetation. Short bursts of isoprene were observed above the San Gabriel Mountains, but mixing ratios were typically lower than 500 ppt. Over the entire flight, the isoprene interference constituted >50 % of the signal observed at 69.
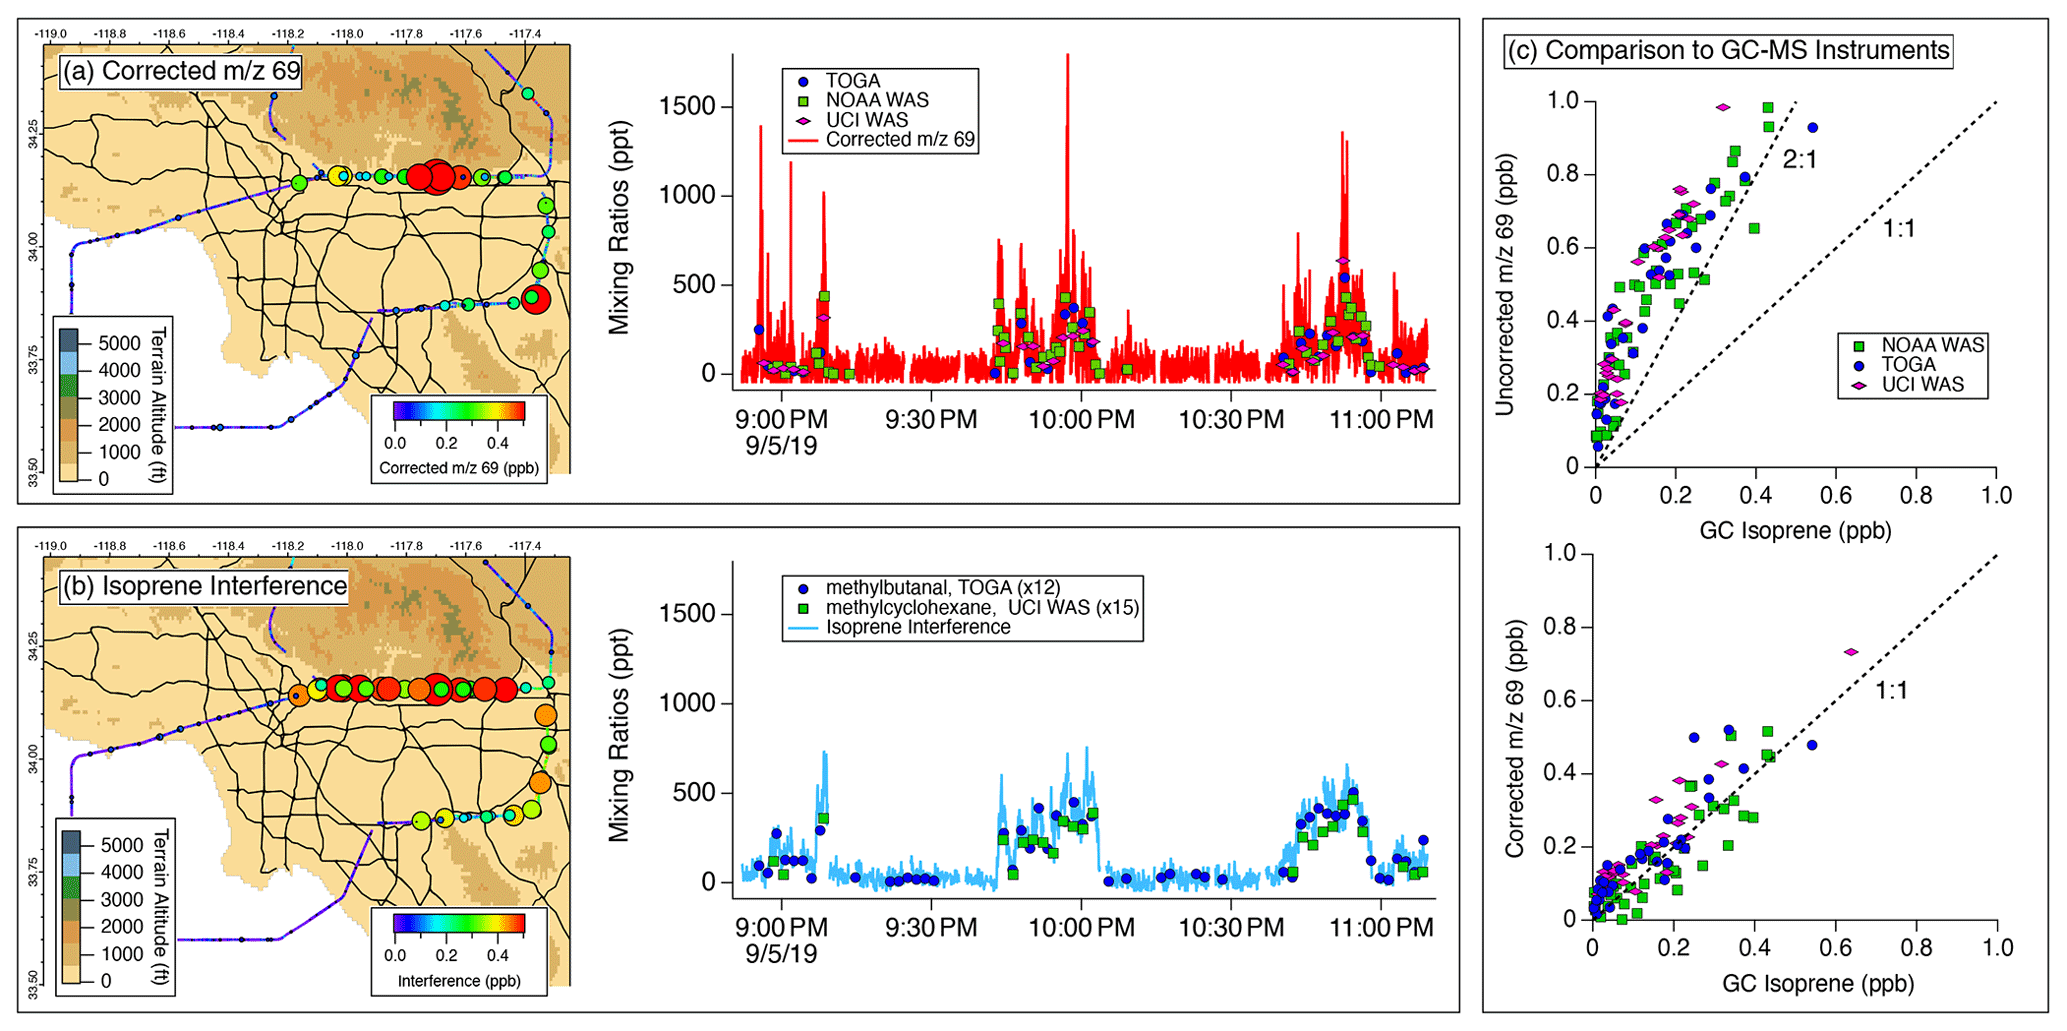
Figure 6Impact of isoprene interference correction on 69 measurements from the NOAA PTR-ToF-MS during FIREX-AQ. (a) Map of corrected 69 distribution (left) and time series with corresponding measurements of isoprene from GC-MS samples (right). (b) Map of isoprene interference (left) and time series with GC-MS measurements of methylcyclohexane and methylpropanal, which are proxies for cycloalkanes and aldehydes known to contribute to the signal at 69. (c) Comparisons of PTR-ToF-MS measurements of 69 and GC-based isoprene mixing ratios for uncorrected 69 (top) and corrected 69 (bottom) using Eq. (1) with an interference ratio of 10.
Figure 6c compares the PTR-ToF-MS measurements to GC-based samples for uncorrected 69 (top) and corrected 69 mixing ratios (bottom). These comparisons show that the isoprene interference resulted in an overestimation of PTR-ToF-MS measurements of isoprene by at least a factor of 2. At times, the NOAA PTR-ToF-MS measured mixing ratios of 69 that were 5 times larger than the isoprene mixing ratios reported by GC-based methods. The Oslo PTR-ToF-MS also sampled on board the DC8 during FIREX-AQ and presented an opportunity to compare to the fragmentation observed by the NOAA PTR-ToF-MS. Following a similar correction procedure as described above, Fig. S6 shows that the Oslo PTR-ToF-MS measured the same degree of interference as the NOAA PTR-ToF-MS (i.e., fragmentation biased isoprene measurements high by at least a factor of 2). The consistency between the two instruments demonstrates that isoprene interferences are common across PTR-ToF-MS designs (i.e., TOFWERK vs. Ionicon).
3.1.5 Corrections to 69 measured by Berkeley PTR-ToF-MS during airborne sampling over Los Angeles
The Berkeley Vocus PTR-ToF-MS also observed interferences to 69 during the RECAP-CA flights. Unlike FIREX-AQ, GC-MS measurements were not available on board the Twin Otter to compare against PTR-ToF-MS measurements. To evaluate the interference contributions to 69 here, we determine the interference ratio from nonanal calibrations and compare it with data collected from the Central Valley and Los Angeles Basin. In these regions, the signal at 69 and the sum of 111 +125 are well-correlated with a slope that closely matches the measured fragmentation pattern for nonanal (Fig. S7). The interference ratio observed in the Central Valley where oil and natural gas emissions are significant is similar to the ratio observed in Los Angeles where aldehydes are more important. In the Central Valley, periods of high biogenic influence are clearly separated from periods of high interference from anthropogenic emissions. Building on these responses, we use the calibrated data for nonanal to derive an 69 correction in Los Angeles. This method is limited in accounting for molecules that have fragmentation ratios differing from nonanal, but since the interference ratio observed from oil and gas regions and from the Los Angeles Basin is similar to the nonanal fragmentation ratio, we expect the uncertainty to be relatively small despite there being no GC comparison.
Figure 7 shows the impact of the isoprene interference on the Berkeley PTR-ToF-MS data. The Twin Otter flew nine flights and the total signal of 69 varied between 200 and 1200 ppt. Similar to the observations by the NOAA PTR-ToF-MS during FIREX-AQ, the isoprene interference during RECAP-CA was at least 50 % of the signal observed at 69 (Fig. 7c). The Twin Otter sampled a larger swath of area than the DC-8, and Fig. 7 shows that the interference is persistent across the Los Angeles Basin (Fig. 7b) at mixing ratios as high as 600 ppt. Similar to the DC-8 flight, corrected 69 mixing ratios are highest along the San Gabriel Mountains. The Twin Otter is capable of sampling at lower altitudes than the DC-8, and therefore larger mixing ratios of isoprene were observed.
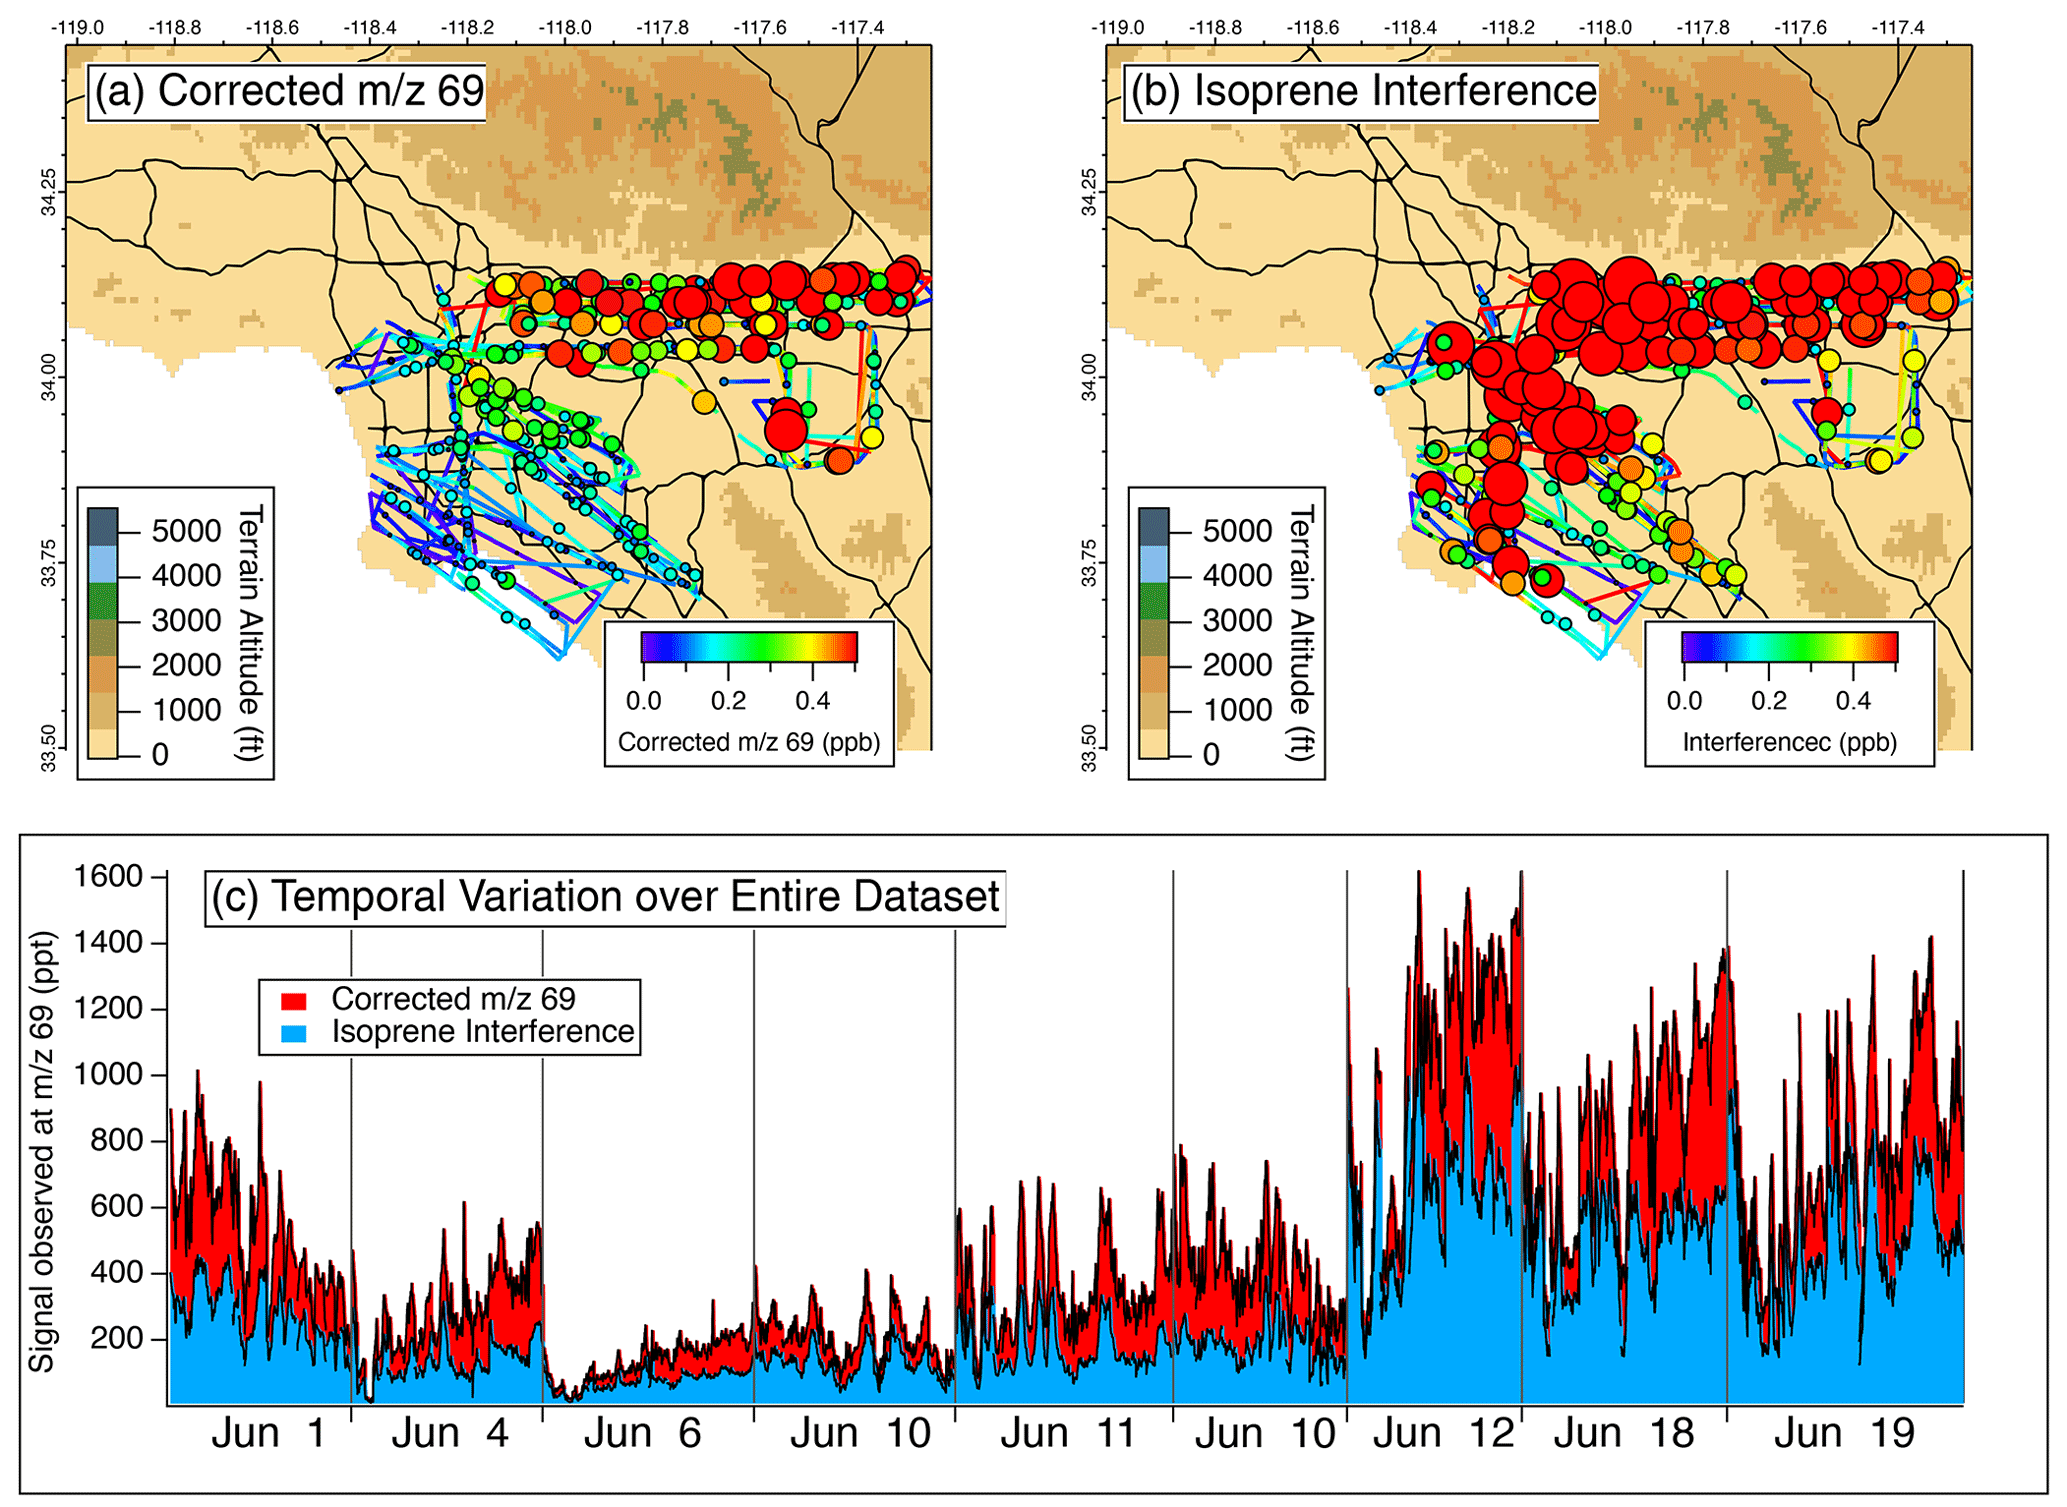
Figure 7Impact of isoprene interference correction on isoprene measurements during RECAP-CA as (a) the corrected isoprene distribution, (b) the isoprene interference, and (c) a pseudo-time series of the total 69 signal colored by the contributions of corrected 69 and isoprene interference for all flights.
The contribution of the isoprene interference observed from the aircraft with the Berkeley PTR-ToF-MS differs from the observations by the NOAA PTR-ToF-MS at Caltech during RECAP-CA. On the ground, the isoprene interference observed by the NOAA PTR-ToF-MS was ∼ 10 % of the signal at 69 during daytime hours (Fig. 5a), while at altitude the Berkeley PTR-ToF-MS observed an interference >50 %. This difference can be explained by (1) the abundance of isoprene emitters close to the ground site, (2) the differences in reactivities between isoprene, aldehydes, and cycloalkanes, and (3) the different instrument setting of the Berkeley PTR-ToF-MS (Fig. S2). Isoprene is highly reactive to atmospheric oxidants such as the OH radical ( cm3 molec.−1 s−1), whereas saturated aldehydes and cycloalkanes are expected to be 5–10 times less reactive (Burkholder et al., 2019). This difference in reactivity may alter the distribution of VOCs that contribute to 69 and result in higher interferences aloft. The DC-8 and Twin Otter aircraft did not specifically target altitude profiling while sampling in the Los Angeles Basin, but future work may help to characterize the impact of the isoprene interference at other altitudes.
3.1.6 Corrections to 69 measured by Aerodyne PTR-ToF-MS during ground sampling in Detroit, MI
The SUNVEx, RECAP-CA, FIREX-AQ data reflect the behavior of the NOAA, Oslo, and Berkeley instruments during summertime measurements in Los Angeles. Isoprene interferences likely impact ground and airborne measurements in other cities and at other times of year. Figure 8 shows the impact of interferences to the signal at 69 reported by the Aerodyne PTR-ToF-MS measurements during MOOSE. This campaign targeted emissions in Detroit, MI, where the Aerodyne Mobile Laboratory conducted a mix of mobile and stationary sampling in select locations around the metropolitan area (Fig. 1). Figure 8a shows a subset of PTR-ToF-MS measurements of 69 and corrected 69, along with isoprene measurements by the Aerodyne GC-MS. Corrected 69 is calculated by determining the interference ratio at night (2.54), similar to the approach used to calculate interferences during SUNVEx/RECAP-CA. Figure 8b shows normalized histograms for each measurement over the entire deployment.
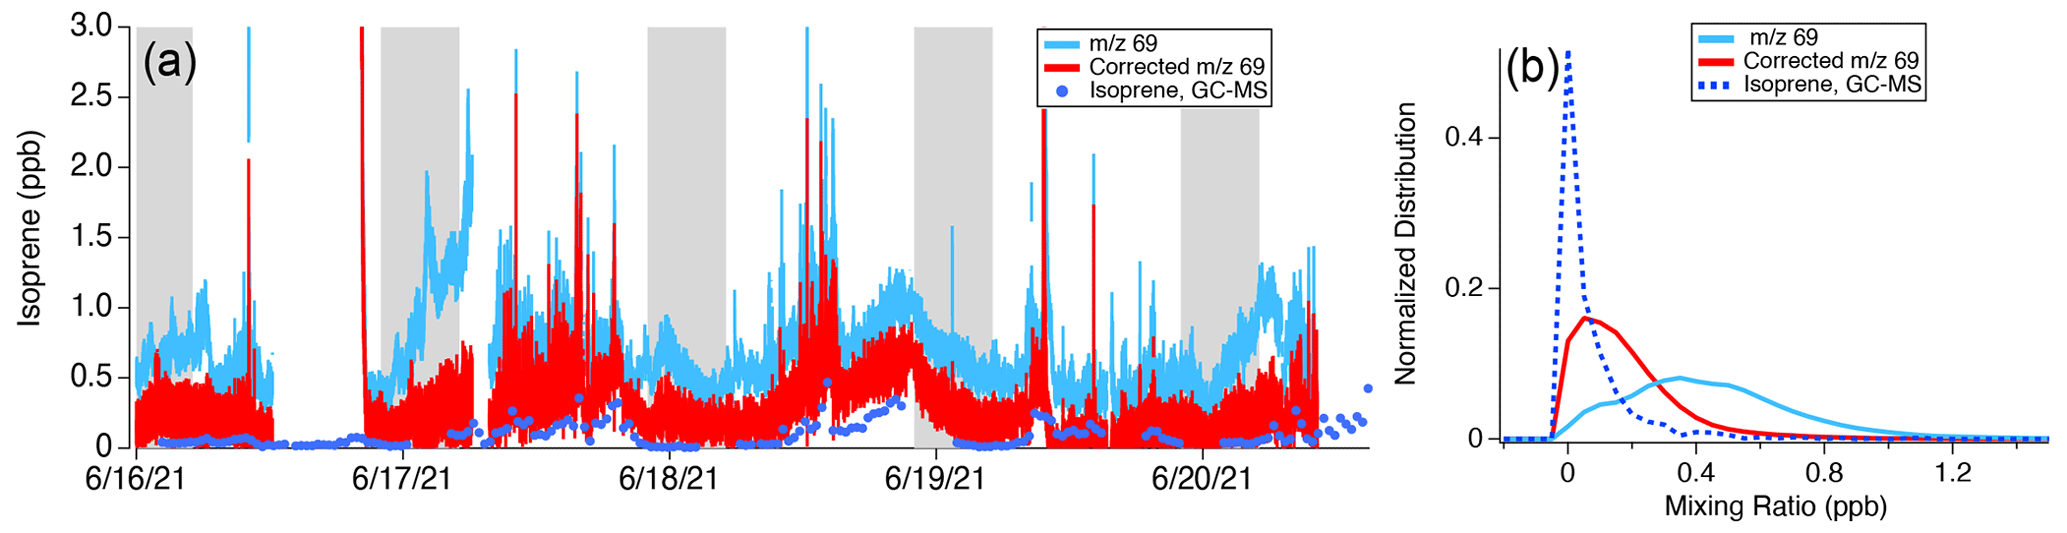
Figure 8Impact of isoprene interference correction on the PTR-ToF-MS data collected from the Aerodyne Mobile Laboratory during the MOOSE campaign as a (a) time series of GC-MS measurements, as well as uncorrected and corrected 69 isoprene mixing ratios. The shaded regions show nighttime measurements (22:00–05:00 LT). (b) Histograms showing the distribution of 69 measured by the Aerodyne PTR-ToF-MS, corrected 69 isoprene mixing ratios, and isoprene mixing ratios measured by the GC-MS.
Without correction, 69 reported by PTR-ToF-MS exhibits a broad distribution with a peak mixing ratio of ∼ 0.4 ppb (Fig. 8b). After applying the corrections described by Eq. (1), 69 signals decrease by nearly a factor of 2 and show better agreement with isoprene reported by GC-MS. Corrected 69 mixing ratios are still a factor of 2 higher than the isoprene mixing ratios reported by the GC-MS. One possibility is that other VOCs in the Detroit region may also contribute to the signal at 69. GC pre-separation measurements directly using PTR-ToF-MS were not conducted during MOOSE; consequently, it is difficult to determine what other species might contribute to 69 in this region. Broad deployment of GC-PTR-ToF-MS measurements in urban areas may help to better quantify the contributions of fragmenting species to PTR-ToF-MS measurements of 69.
3.1.7 Seasonal changes to the 69 interferences observed by the Stony Brook PTR-ToF-MS in New York City
Figure 9 shows the impact of the isoprene interference on data reported by the Stony Brook PTR-ToF-MS during a year-long sampling effort to characterize emissions in New York City during the COVID-19 lockdown. Shown here are mixing ratios of 69 along with the estimated contribution to 69 from the isoprene interference. We calculate the isoprene interference for each season and present the diurnal patterns in the top row. The interference ratio (, Eq. 1) is similar in spring, summer, and winter (2.2–2.5) but lower during fall (1.9).
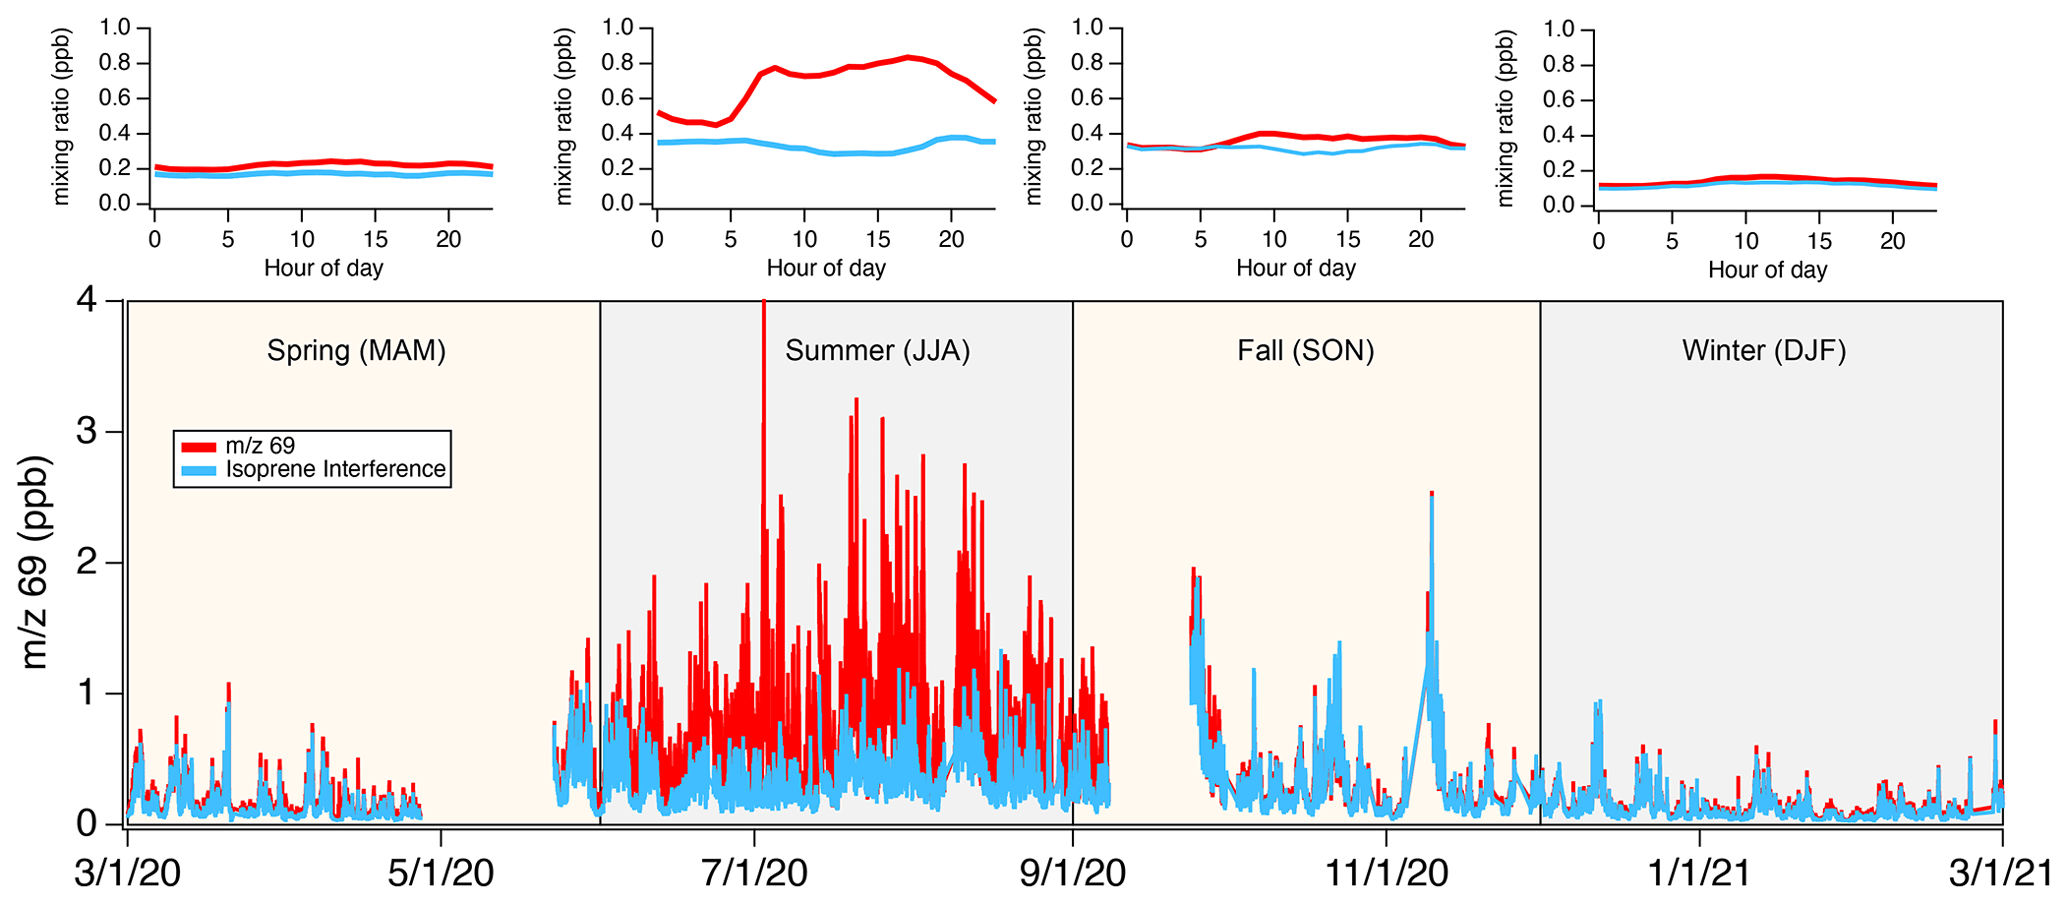
Figure 9Bottom: time series of 69 and isoprene interference measured by the Stony Brook PTR-ToF-MS at the urban ASRC ground site in New York City. Top: diel patterns of 69 and isoprene interference mixing ratios for each season.
The signal at 69 is variable across seasons and the highest mixing ratios are observed during summer. The isoprene interference is a major contributor to 69 in fall, winter, and spring (77 %–88 % of the total signal) and strongly influences the day-to-day variability. During summertime isoprene emissions from urban foliage increase the variability in 69 and result in higher mixing ratios of 69 during the day. The isoprene interference increases the background mixing ratios of 69 and dominates the total signal at night.
The ASRC site is located in a heavily urbanized region and the PTR-ToF-MS sampled air at the top of the building where mixing ratios of isoprene are likely lower. The persistent, high contribution from the isoprene interference to 69 during all seasons likely reflects the high emissions of aldehydes and cycloalkanes from anthropogenic sources in this region. Figure S8 contrasts the measurements at ASRC with those reported from the Flax Pond site. Flax Pond is located in a less densely populated region of Long Island where biogenic sources of isoprene are more abundant. There, interferences are a much smaller fraction of the signal at 69 (<10 %) and the variability is largely driven by isoprene during the summer months. Mixing ratios at Flax Pond are lower during the winter but comparable to those observed at ASRC during the same season (∼ 100–150 ppt). Furthermore, the variability is predominantly driven by the isoprene interference. Figures 9 and S8 demonstrate that interferences will vary spatially between heavily urban and biogenic-dominated regions. In addition, outside the summer months, isoprene is unlikely to be a major contributor to 69 in both regions.
3.1.8 Implications of the 69 correction for estimates of biogenic isoprene
The contribution of the isoprene interference to 69 in New York City is comparable to the ground-level measurements in Las Vegas, Los Angeles, and Detroit (0.25–0.5 ppb), which demonstrates that isoprene measurements by PTR-MS are significantly impacted across most, if not all, urban regions. The interferences to 69 are highest at night and in the wintertime; consequently, identifying anthropogenic or nighttime sources of isoprene by PTR-MS will be difficult if not unambiguously confirmed by GC-PTR-ToF-MS or separately by GC-MS.
The measurements in Los Angeles, Las Vegas, and New York City show that interferences may bias daytime measurements of 69 (and thus estimates of isoprene) by as much as a factor of 2 depending on the location or sampling altitude. Isoprene is an major contributor to OH reactivity and ozone production in these regions (McDonald et al., 2018b), and measurements from high-time-resolution instruments are often used to validate biogenic emissions inventories used in air quality models (e.g., Coggon et al., 2021; Pfannerstill et al., 2023a; McDonald et al., 2018b). Corrections to PTR-ToF-MS data are important when comparing 69 mixing ratios to biogenic emissions inventories in urban areas so that isoprene emissions are not overestimated in air quality models. PTR-ToF-MS measurements may also be used to determine isoprene fluxes. Due to the differences in spatial variability between interferences and biogenic isoprene, estimates of isoprene fluxes may be less sensitive to the impact of aldehyde or cycloalkene fragmentation (Pfannerstill et al., 2023a, b).
3.2 Oxygenated VOCs
3.2.1 Characterizing interferences to oxygenated VOCs using GC-PTR-ToF-MS
Small oxygenated VOCs are an important contributor to the reactivity and ozone produced in urban areas. Alcohols, ketones, and small aldehydes (< C4) may be emitted to the atmosphere from mobile sources, VCPs, cooking activities, and other sources (Klein et al., 2016; McDonald et al., 2018a) but are also formed as secondary products of atmospheric chemistry. Some studies have reported that certain alcohols, such as ethanol, may ionize to produce products that overlap with proton-transfer products of other important oxygenates, such as acetaldehyde (Buhr et al., 2002; Pagonis et al., 2019). Previous intercomparisons have shown that acetaldehyde is one example of oxygenated VOCs for which there may be large disagreements between PTR-ToF-MS and GC-MS (Yuan et al., 2016).
Figure 10 shows the GC-PTR-ToF-MS chromatogram collected on the Las Vegas Strip for proton-transfer products typically assigned to oxygenated VOCs. Here, we present small oxygenates typically reported in ambient datasets that are subject to fragmentation or interferences, including methanol, acetaldehyde, ethanol, and C4 carbonyls, which represent the sum of methacrolein (MACR), methyl vinyl ketone (MVK), and crotonaldehyde.
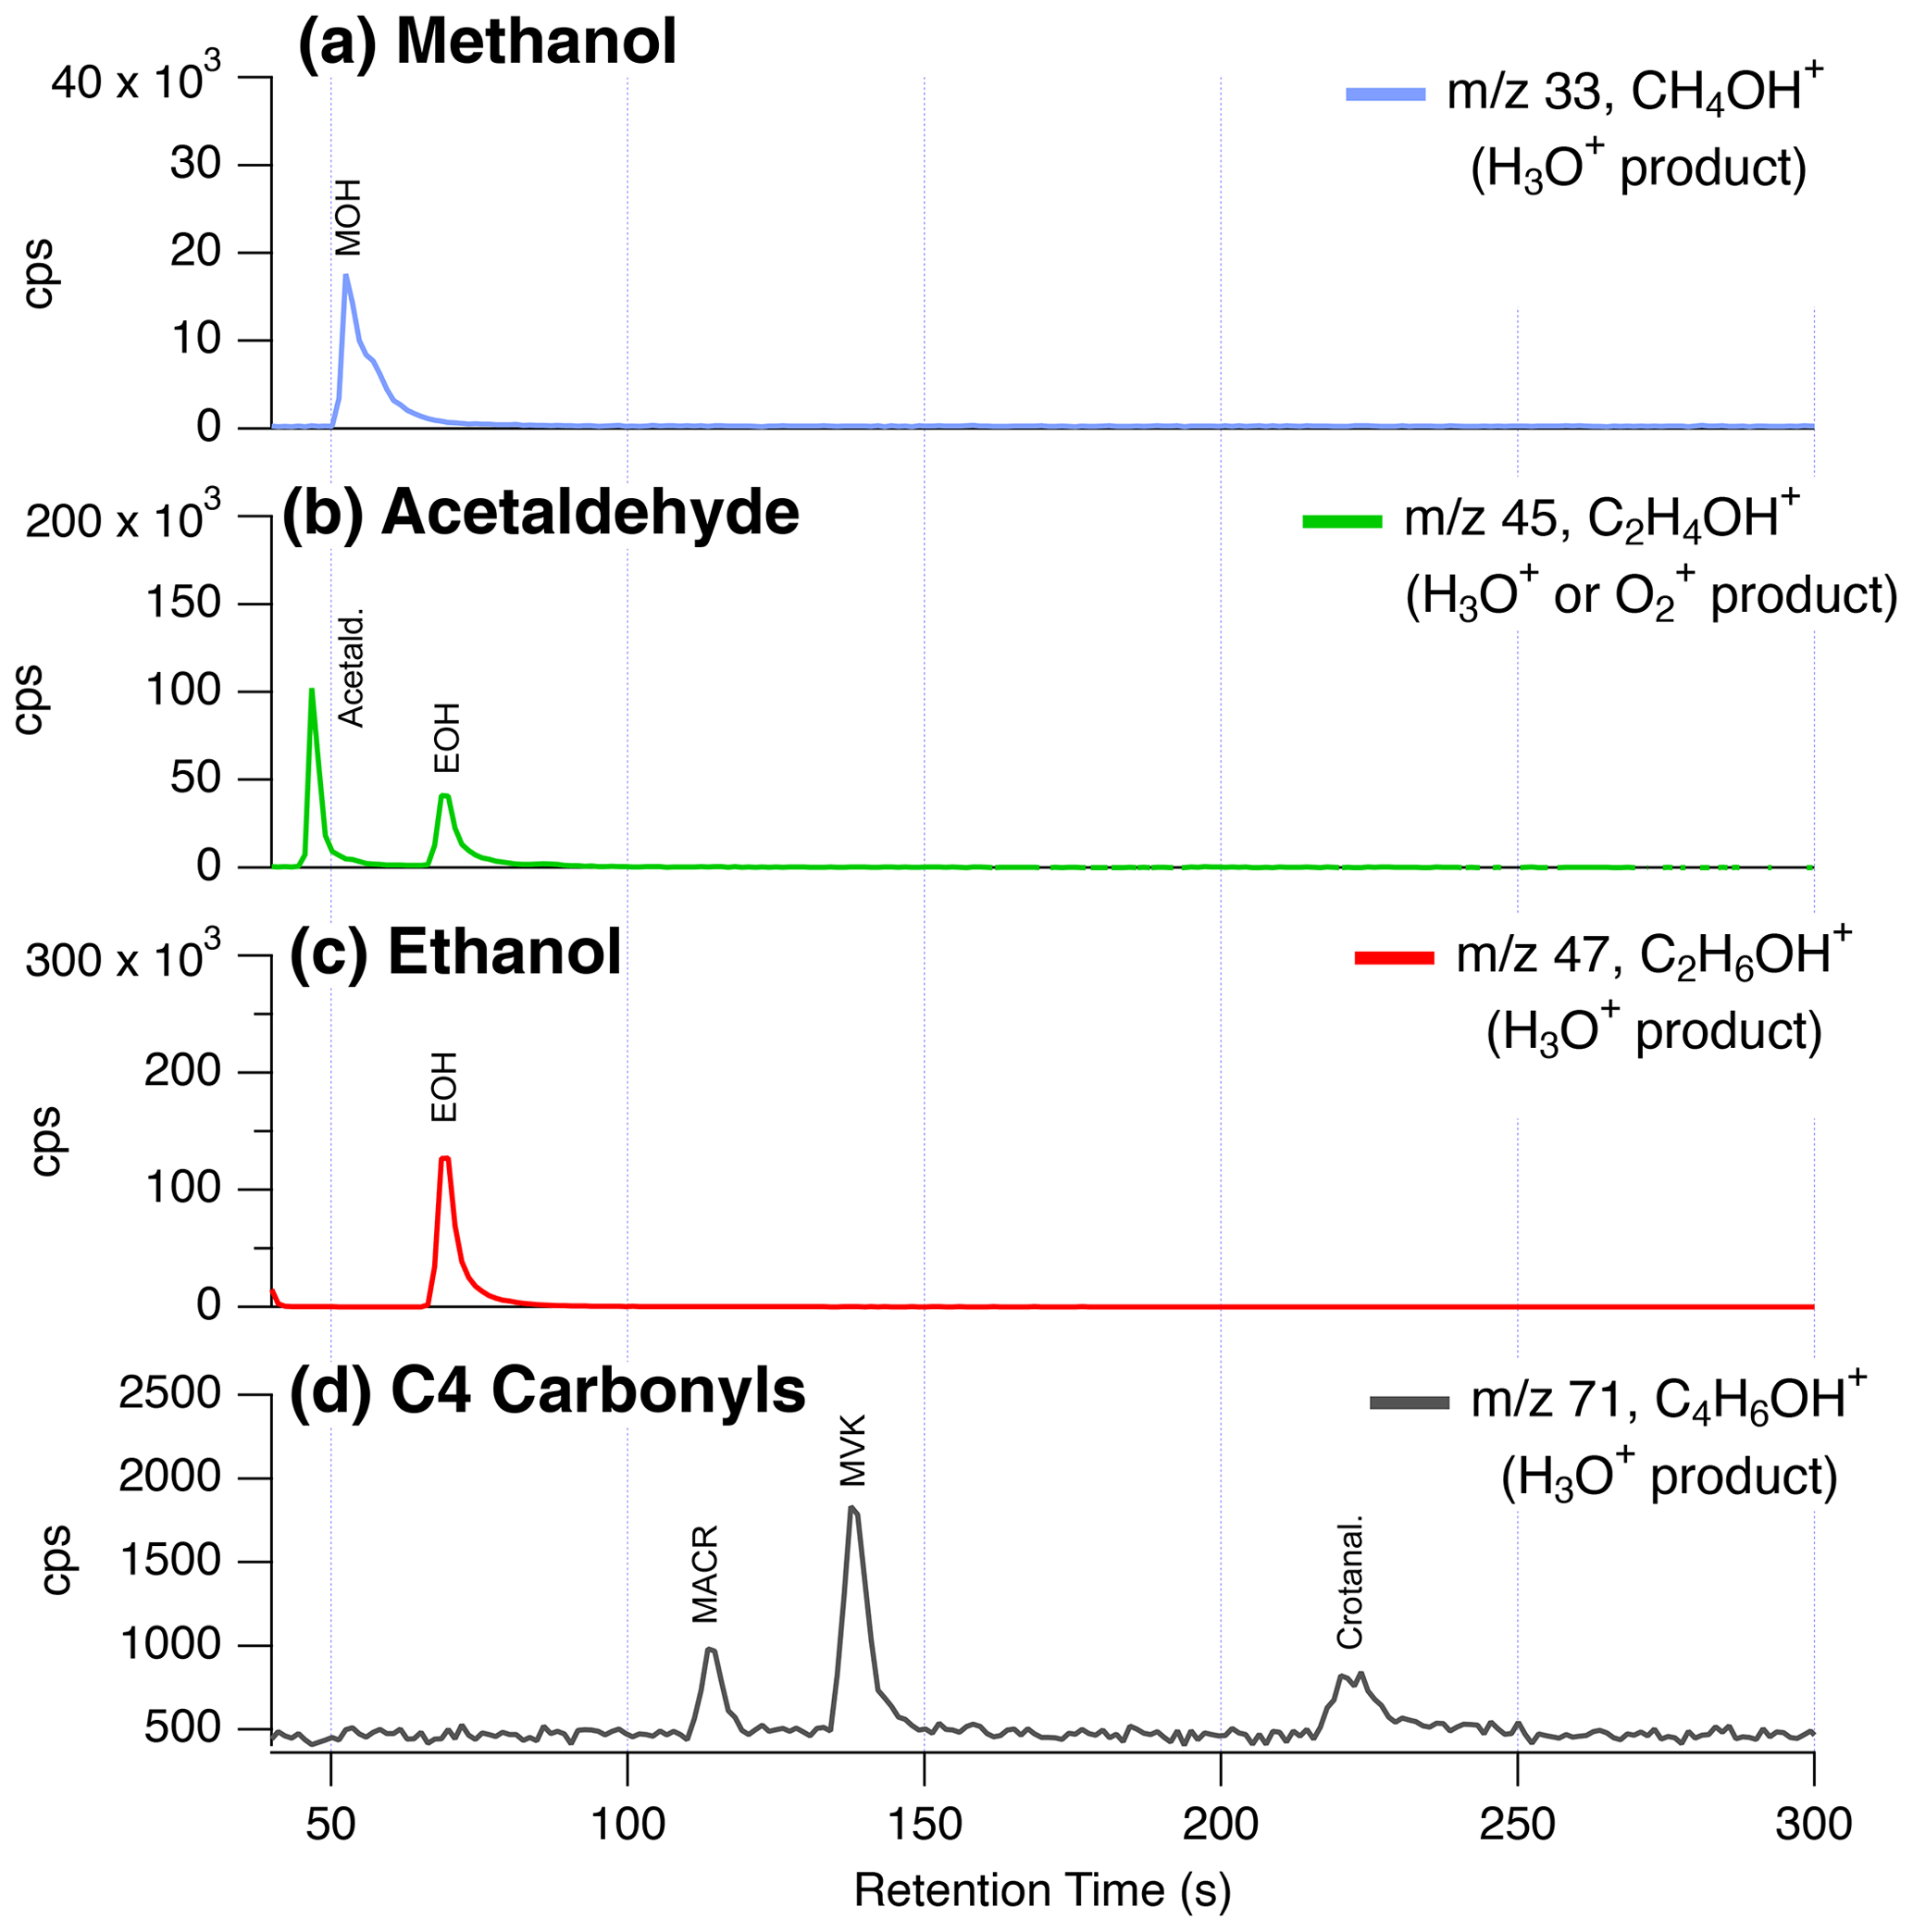
Figure 10GC-PTR-ToF-MS chromatograms from the Las Vegas Strip showing the contributions of isomers and fragments to ions typically assigned to small oxygenates. The labels highlight the traditionally assigned isomers for (a) methanol, (b) acetaldehyde, (c) ethanol, and (d) C4 carbonyls including methacrolein (MACR), methyl vinyl ketone (MVK), and crotonaldehyde.
First, GC-PTR-ToF-MS data show that no other species elute through the GC column to yield a significant interference to methanol and ethanol. The signal at 59 (C3H6OH+) is also observed to result entirely from acetone + propanal (not shown). This is consistent with previous studies that show good agreement between GC-MS and PTR-ToF-MS (e.g., Warneke et al., 2003).
Crotonaldehyde is a major fraction of the C4 carbonyls observed on the Las Vegas Strip. Typically, MVK and MACR are treated as the dominant isomers to the C4 carbonyl product ( 71, C4H6OH+), since these are secondary products from isoprene oxidation and are expected to be present at high mixing ratios (Yuan et al., 2017). Crotonaldehyde is observed to be a major contributor to 71 in biomass burning emissions (Koss et al., 2018), but its presence on the Las Vegas Strip likely points to other important aldehyde sources, such as cooking. The higher fraction of crotonaldehyde reflects the fact that isoprene mixing ratios are lower in Las Vegas than other cities (Fig. 5) and that cooking is an important source of VOCs along the Las Vegas Strip (Fig. 2). Xu et al. (2022) showed that measurements of C4 carbonyls by the NOAA PTR-ToF-MS, ammonium-adduct chemical ionization mass spectrometer (NH4-CIMS), and NOAA GC-MS agreed in the daytime during RECAP-CA when MVK and MACR were high but disagreed at night when isoprene products were low and crotonaldehyde mixing ratios were likely elevated. Additional interferences at 71 could result from decomposition of ISOPOOH on inlet surfaces (Rivera-Rios et al., 2014).
3.2.2 Interferences to 45 from ethanol reactions with O
The most significant interference for the small oxygenated VOCs observed by GC-PTR-ToF-MS is associated with the ionization of ethanol to produce a signal at the mass typically assigned to acetaldehyde ( 45, C2H5O+). Ethanol has been shown by Inomata and Tanimoto (2009) to produce fragments at 19 (H3O+), 31 (CH3O+), and 29 (C2H). Buhr et al. (2002) identified 45 as a product and found that it correlated with the ethanol proton-transfer product ( 47, C2H6OH+) with a ratio of 0.22. The likely pathway for the formation of 45 is by ethanol reactions with O, which has been identified by Spanel and Smith (1997) as the dominant O product using selective ion flow tube (SIFT) mass spectrometry. The NOAA Vocus PTR-ToF-MS observes a ratio that is higher than that determined by Buhr et al. (2002) (∼ 0.38), although the distribution of total fragmentation (i.e., the sum of all ethanol fragments relative to 47) appears similar (Fig. S1).
Figure 11 shows the temporal behavior of 45 and 47 (ethanol) during the nighttime drive on 30 July. Figure 11a shows the mixing ratio of 45 assuming the sensitivity of acetaldehyde and Fig. 11b shows the mixing ratio of ethanol. Figure 11c shows a scatter plot of the signal at 45 vs. that of 47 for the entire mobile laboratory dataset. First, ethanol and 45 are correlated when ethanol mixing ratios are high (Fig. 11a, b). Ethanol on the Las Vegas Strip reached mixing ratios of 1.5 ppm, and corresponding increases in 45 were observed that point towards a contribution from ethanol. Figure 11c shows that a subset of the 45 signal measured throughout the Las Vegas dataset exhibits a ratio to ethanol that agrees with the fragmentation ratio observed from GC-PTR-ToF-MS measurements. These observations point towards a broader impact of ethanol on 45 throughout the Las Vegas region.
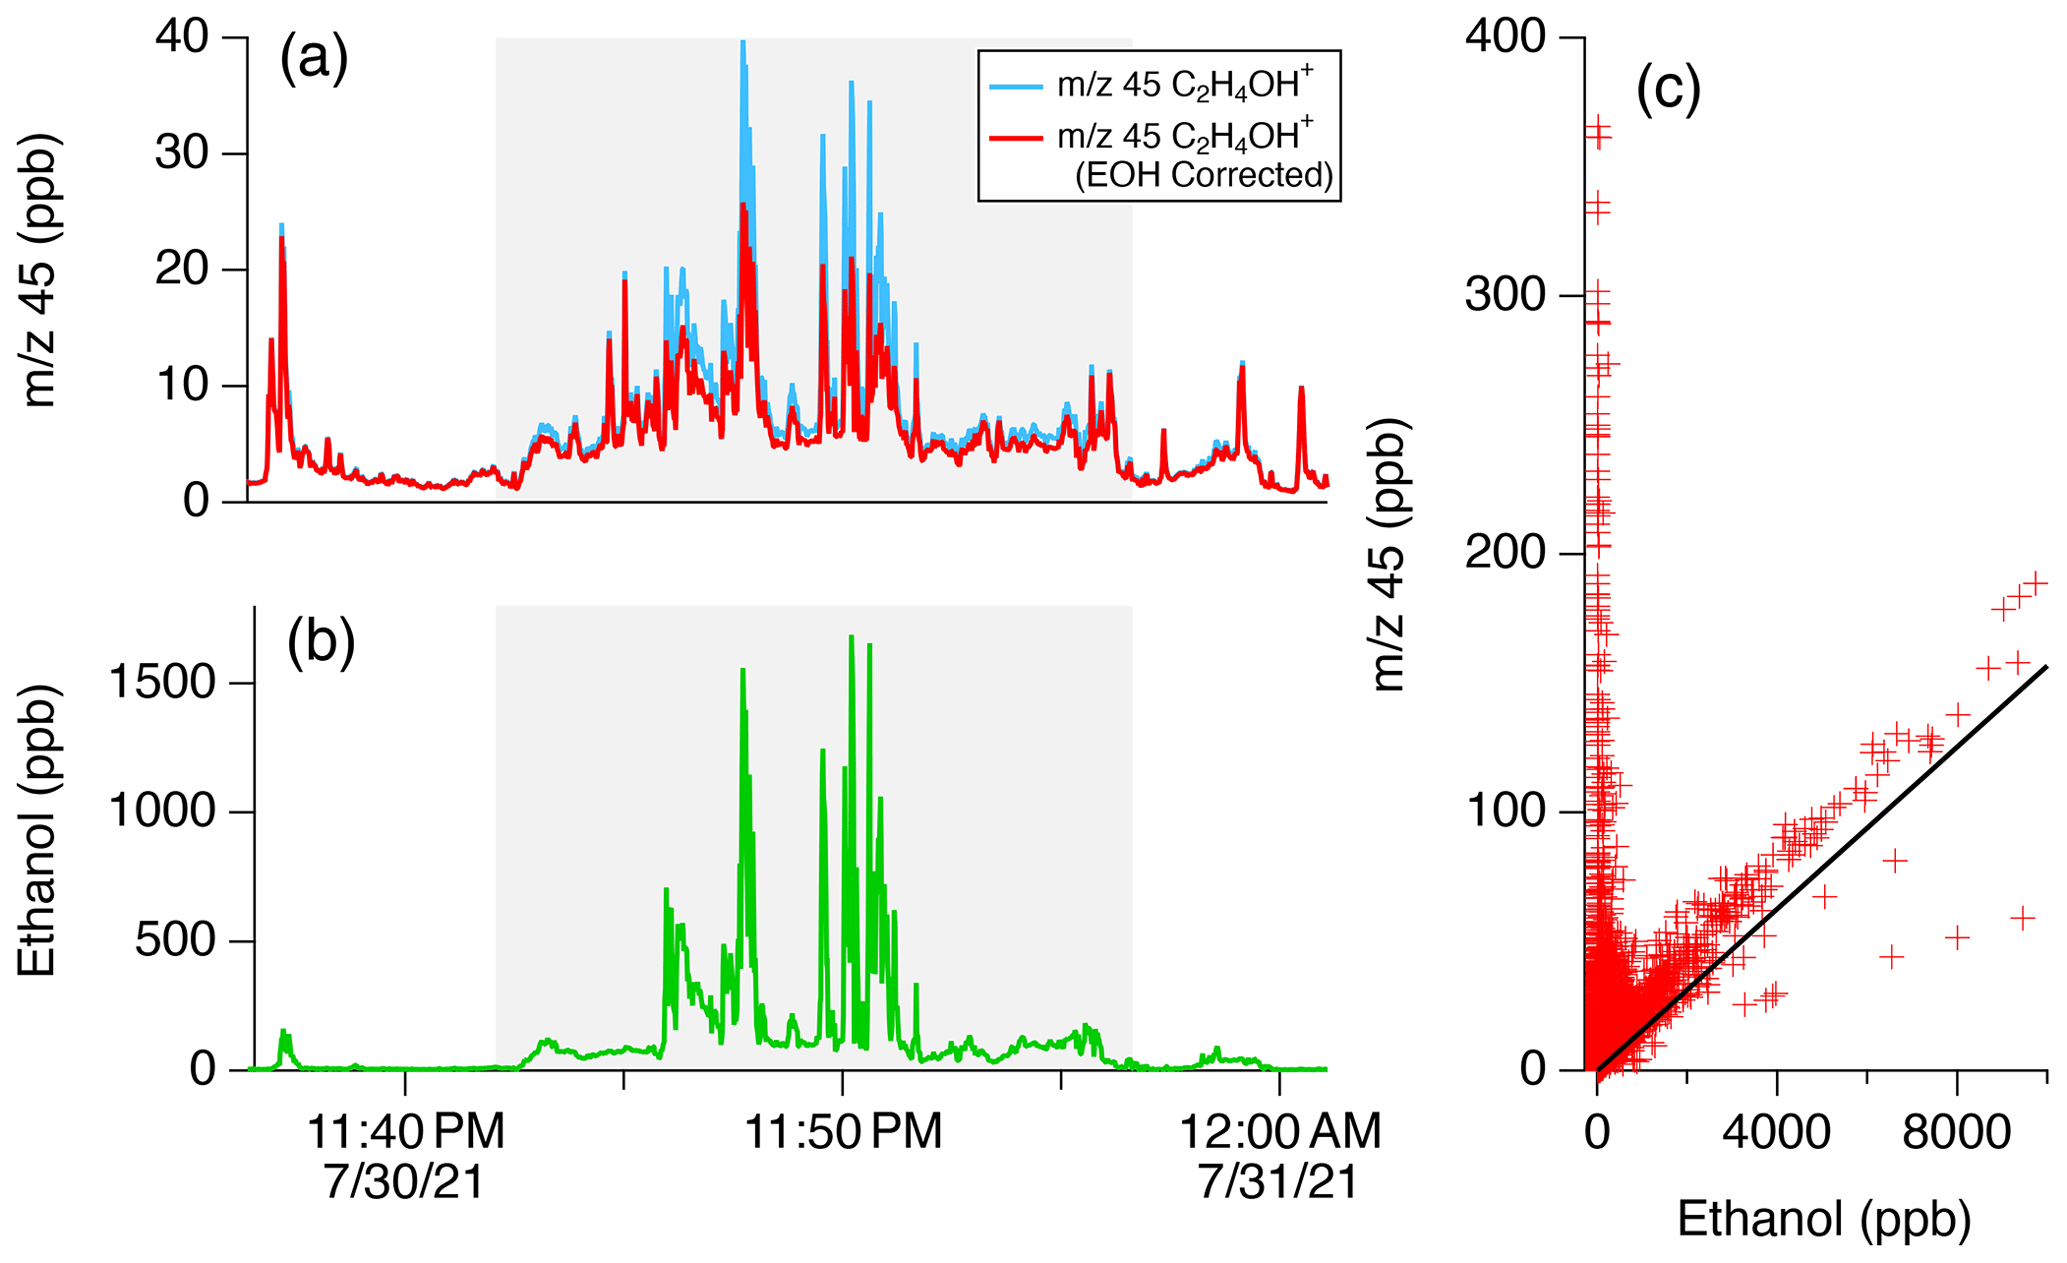
Figure 11Demonstration of the impacts of ethanol on mobile drive data in downtown Las Vegas during the evening drive on 30 July. (a) Time series of the signal at 45 (C2H4OH+) with and without the subtraction of the ethanol interference. (b) Time series of ethanol ( 47, C2H6OH+). The shaded regions show when the mobile laboratory was sampling along the Las Vegas Strip. (c) Correlation plot of mobile drive data for the entire Las Vegas dataset. The solid line shows the fragmentation ratio of 45 to 47 for ethanol, as derived from the GC-PTR-ToF-MS data (Fig. 10).
3.2.3 Corrections to 45 measured by NOAA PTR-ToF-MS during ground sampling in Las Vegas
The extent to which ethanol contributed to the signal at 45 can be determined by correction techniques. Figure 11a shows the 45 signal with the contribution from ethanol subtracted following
S45 is the signal from 45, S47 is the signal of ethanol, and is the ratio determined by GC-PTR-ToF-MS. Generally, the ethanol-corrected data on 45 show that ethanol contributed ∼ 40 % to the signal on the Las Vegas Strip. Outside this region, ethanol ionization has a modest impact on 45. Over the average mobile laboratory dataset, ethanol may have contributed as much as 5 % to the total signal at 45. Similar contributions are estimated for the ground site data collected during ground sampling in Los Angeles. Consequently, ethanol reactions with O may only be an important contributor to 45 in highly concentrated ethanol plumes, which may be encountered during mobile sampling or upon aircraft encounters with point sources. This ratio may also be affected by humidity, which changes the distribution of in drift tubes operated at a low water mixing ratio. The TOFWERK and Ionicon instruments have fundamental design differences that impact O production and relatively humidity responses. Ionicon instruments have a separate region where excess water and air are pumped away from the ion source. In these instruments, O production is low since diffusion of air into the discharge region is mitigated, but changes to ambient relative humidity may result in alterations to the primary ion distribution. In contrast, ions and excess water are passed through the Vocus in TOFWERK instruments. The water content in the drift tube is high, resulting in negligible humidity responses (Krechmer et al., 2018), but air in the drift tube may diffuse to the ion source to produce O.
The GC-PTR-ToF-MS provides some insights into the interferences of oxygenates, but there are limits to the extent to which oxygenates elute through a DB-624 or other GC columns with similar polarity. Interferences towards oxygenated masses may be an important focus for future work, as recent studies have pointed towards the increasing fraction of oxygenated VOCs observed in urban air (Karl et al., 2018; Xu et al., 2022; Khare et al., 2022), and instrumentation capable of measuring unfragmented oxygenates is becoming more common (e.g., Khare et al., 2022; Xu et al., 2022; Riva et al., 2019). Intercomparisons with GC-MS measurements employing polar columns, or with mass spectrometers employing softer ionization chemistry (e.g., iodide or NH adduct mass spectrometers), may help to better characterize the response and selectivity of PTR-ToF-MS to oxygenates.
3.3 Aromatic VOCs
3.3.1 Known interferences to aromatic masses
PTR-ToF-MS is well-suited to measure ambient mixing ratios of C6–C9 aromatics; however, it is known that alkyl aromatics (e.g., ethylbenzene and ethyltoluene isomers) and aromatic monoterpenes and monoterpenoids (e.g., cymene and fenchone, Kari et al., 2018; Tani, 2013) fragment and contribute to the signals typically attributed to benzene ( 79, C6H6H+) and toluene ( 93, C7H8H+) (Pagonis et al., 2019; Yuan et al., 2017). The abundance and distribution of aromatics depends on the relative mix of VOC emissions from petrochemical sources, including fossil fuels, solvents emitted from VCPs (e.g. paints and architectural coatings), and asphalt paving (Gkatzelis et al., 2021a, b; Khare et al., 2020; Stockwell et al., 2021). Higher aromatics, such as xylenes and ethylbenzene, are prevalent in both fossil fuel and VCP emissions, whereas benzene is restricted in consumer products and is therefore almost entirely associated with fossil fuels (McDonald et al., 2018a). Consequently, PTR-ToF-MS measurements in urban regions with significant solvent emissions may exhibit a greater degree of interference on benzene and toluene than regions with greater fossil fuel usage.
3.3.2 Characterizing interferences to 79 using GC-PTR-ToF-MS
Figure 12 shows GC-PTR-ToF-MS measurements of key aromatic compounds measured in downtown Las Vegas where both fossil fuels and VCP emissions were prevalent. Each panel is labeled by the typical compound assignment and shows chromatograms of the corresponding proton-transfer product. In general, chromatograms show that C9 and C8 aromatics are the expected key contributors to the signals at 121 (C9H12H+) and 107 (C8H10H+), respectively. This is consistent with previously observed PTR-ToF-MS behavior (Yuan et al., 2017) and shows that urban measurements at these masses continue to be reliably assigned to simple alkyl aromatics.
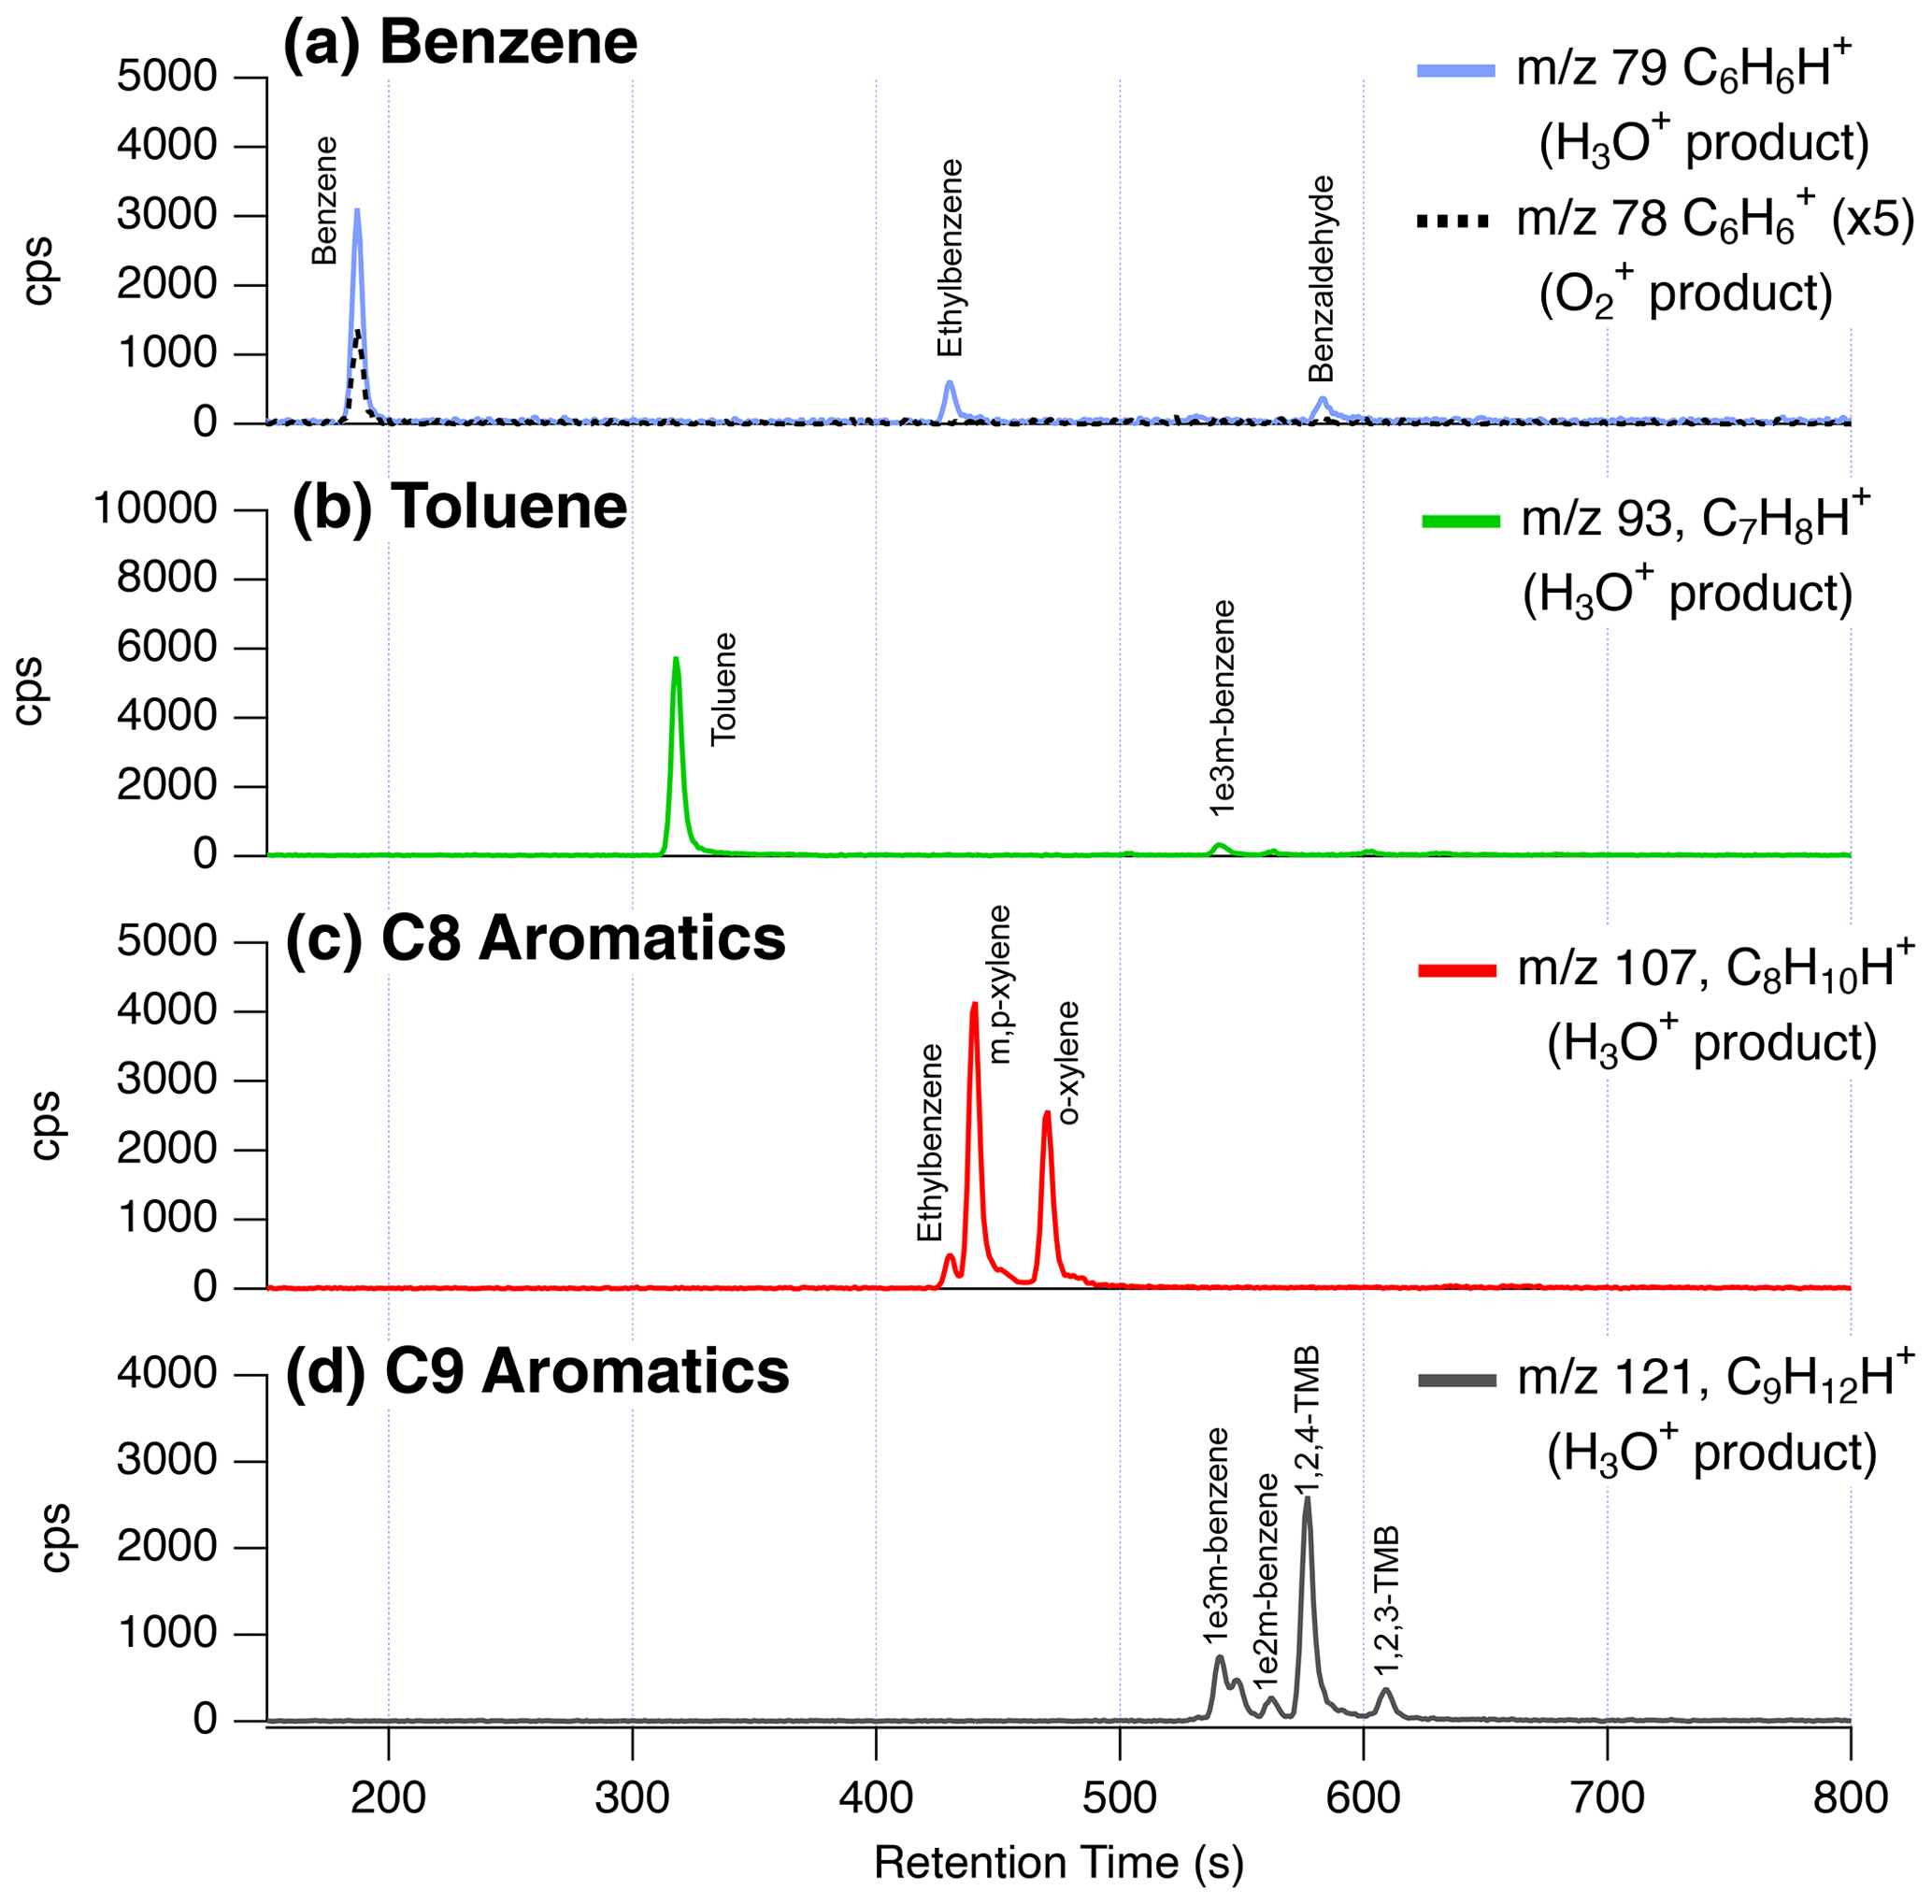
Figure 12GC-PTR-ToF-MS chromatogram from downtown Las Vegas showing the contributions of isomers and fragments to ions typically assigned to C6–C9 aromatics. The labels highlight the traditionally assigned isomers for (a) benzene, (b) toluene, (c) C8 aromatics (including o-, m-, p-xylene + ethylbenzene), and (d) C9 aromatics including ethyltoluene isomers + trimethylbenzene isomers.
In contrast, the masses typically assigned to benzene ( 79, C6H6H+) and toluene ( 93, C7H8H+) show greater contributions from the fragmentation of alkyl aromatics. At 93, most of the signal is attributed to toluene and a small fraction (<5 %) results from the fragmentation of 1-ethyl-3-methylbenzene. At 79, ∼ 80 % of the signal results from the proton-transfer product of benzene and the remainder from the fragmentation of ethylbenzene and benzaldehyde. Previous work has shown contributions of ethylbenzene to 79 in urban air (Inomata et al., 2010), whereas contributions from benzaldehyde are not well-studied. Benzaldehyde may result from VCPs, cooking, motor vehicle emissions, biomass burning, or secondary production (Gkatzelis et al., 2021a; Koss et al., 2018; McDonald et al., 2018a).
3.3.3 Corrections to 79 measured by NOAA PTR-ToF-MS during ground sampling in Los Angeles and Las Vegas
The interferences at 79 are significant and present a challenge for reliably quantifying benzene in Las Vegas and other urban regions. To quantify this interference, Fig. 13 highlights benzene measurements from the Las Vegas and Los Angeles ground sites. Figure 13a and b show that corrected and uncorrected benzene at 79 can be attributed to benzene calculated from two methods.
S is the signal of C6H6H+, S is the signal attributable to benzaldehyde, S is the signal attributable to ethylbenzene, and S is the signal attributed to the benzene charge-transfer product at 78. and are the fragmentation patterns of benzaldehyde () and ethylbenzene () as determined by GC-PTR-ToF-MS chromatograms. Method 1 corrects for benzene by subtracting the contributions of benzaldehyde and ethylbenzene to the signal at C6H6H+. GC-PTR-ToF-MS measurements show that benzaldehyde is the primary contributor to S, whereas ethylbenzene is one of four isomers that contribute to S. We use the GC-PTR-ToF-MS measurements at the Las Vegas ground site and find that ethylbenzene contributes ∼ 12.5 % of the total C8 aromatic signal. Method 2 simply estimates benzene mixing ratios based on calibrations applied to the charge-transfer product at 78 (C6H). This mass has no discernible interference from other VOCs in the GC-PTR-ToF-MS data (Fig. 12) and is detected with sufficient sensitivity to reliably quantify benzene (∼ 180 cps ppb−1). We note that Method 1 requires regular quantification of C8 aromatic distributions by GC in order to account for ethylbenzene fragmentation, whereas Method 2 relies only on measurements of the O charge-transfer product. We note that Method 2 may present limitations if other species are present that fragment to produce the O product or if a PTR-ToF-MS response to the O depends on humidity or ion source design. Deployment of GC-PTR-ToF-MS in other cities may help to determine whether the charge-transfer product is unambiguously linked to benzene.
On average, the interferences from ethylbenzene and benzaldehyde constitute ∼ 38 % of the signal at 79 detected in Las Vegas and ∼ 3 % of signal detected in Los Angeles (pie charts, Fig. 13). We speciate the interference in Las Vegas using GC-PTR-ToF-MS and find that the majority of the interference is associated with fragmentation of ethylbenzene (31 % of total signal) with a small contribution from benzaldehyde (7 % of total signal). Ethylbenzene was likely emitted from a local source due to a cabinet-making shop upwind of the ground site. The two methods for correcting benzene agree well for Las Vegas data, which confirms that ethylbenzene and benzaldehyde are the primary contributors to the benzene interferences. We note that we only use Method 2 for data collected in Los Angeles since GC-PTR-ToF-MS measurements were unavailable during this period of the deployment.
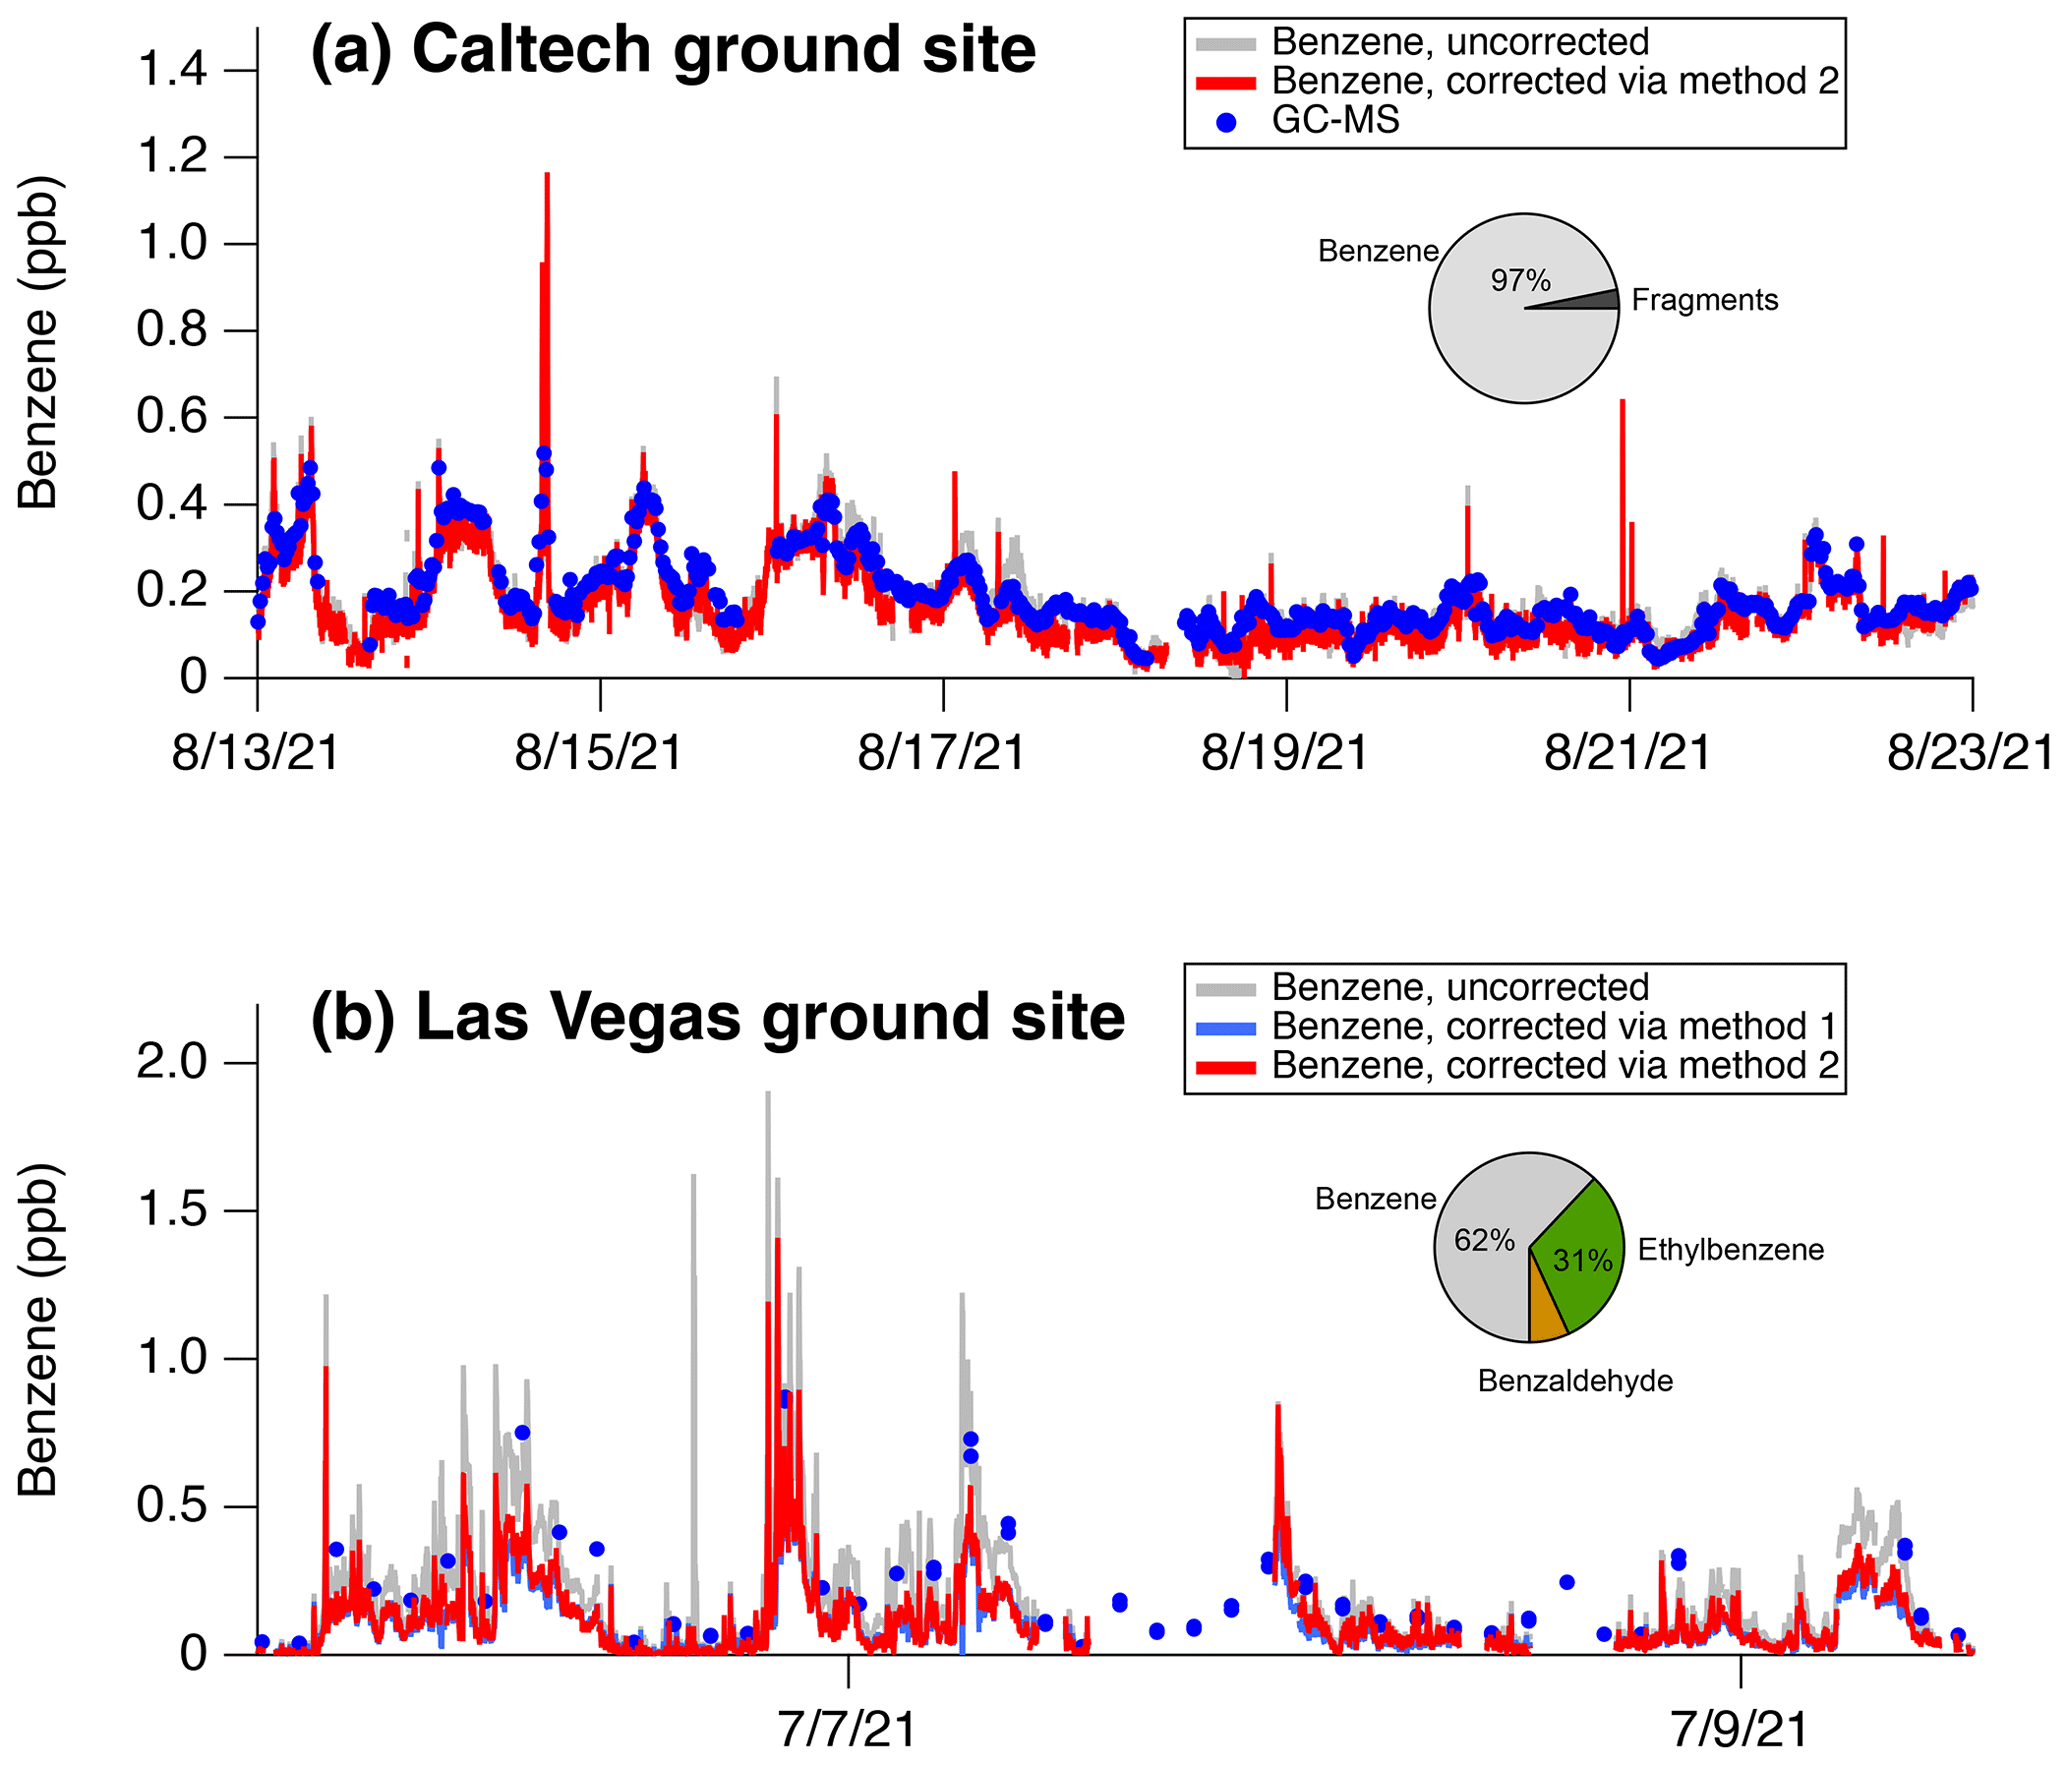
Figure 13Impact of fragmentation on the signal at 79 (C6H6H+) and corresponding benzene mixing ratios measured in (a) Los Angeles and (b) Las Vegas. The corrections using the two methods are shown compared to uncorrected data. The pie charts show the average contribution of benzene, ethylbenzene, and benzaldehyde to the signal at 79 (C6H6H+).
3.3.4 Corrections to 79 measured by Aerodyne PTR-ToF-MS during ground sampling in Detroit
The significant interferences to 79 observed in Las Vegas are also observed in PTR-ToF-MS data collected downwind of Detroit during the MOOSE campaign. Figure 14 shows 4 d of mobile laboratory sampling with the Aerodyne PTR-ToF-MS and GC-MS instrumentation. Similar to Fig. 13, 79 measurements corrected via Method 2 and uncorrected are shown (Fig. 14a). Figure 14b shows the histograms of PTR-ToF-MS measurements alongside those from the GC-MS during the entire campaign. The pie chart shows the average fraction of 79 attributed to benzene vs. the fraction associated with fragments. Benzaldehyde and ethylbenzene contributions are not separated since GC-PTR-ToF-MS measurements were unavailable.
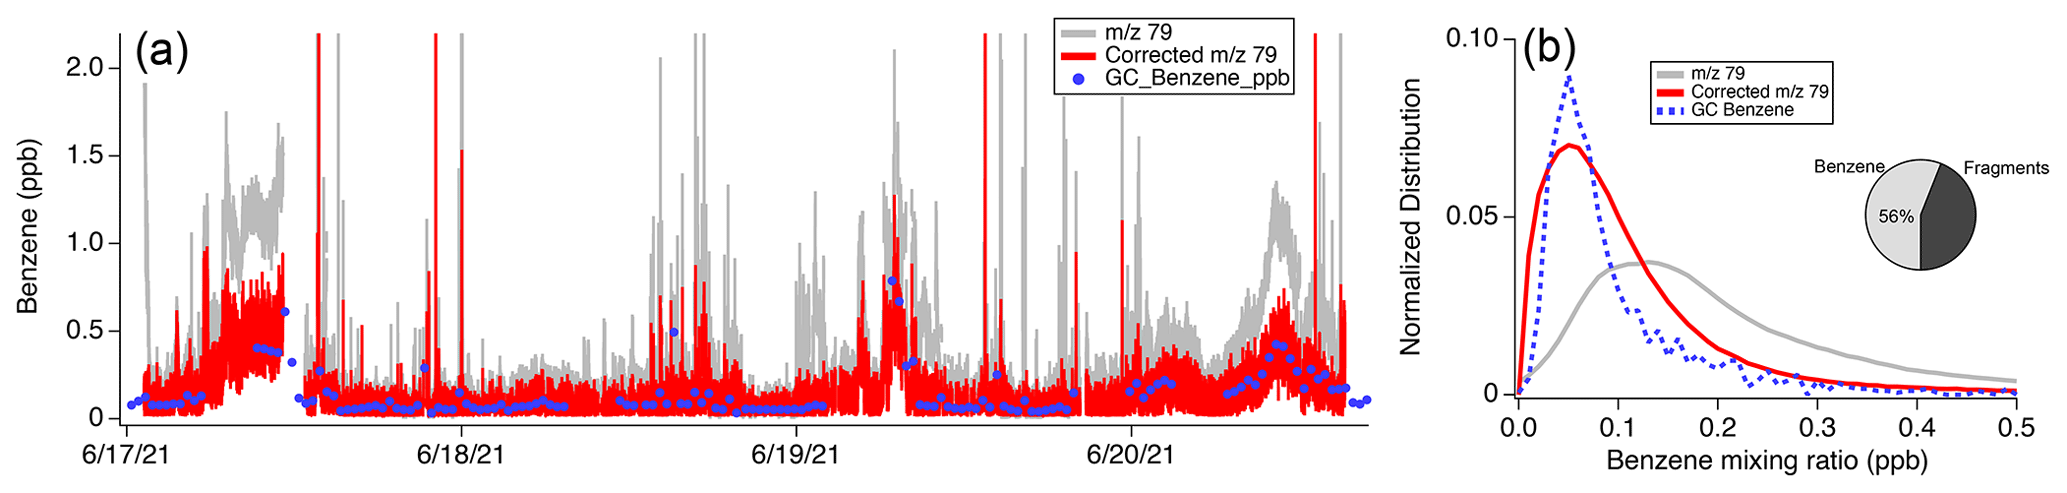
Figure 14(a) Time series of GC-MS samples of benzene and PTR-ToF-MS mixing ratios of 79 (C6H6H+) and corrected 79 reported during sampling by the Aerodyne Mobile Laboratory downwind of Detroit, MI. (b) Histograms showing the distribution of 79 measured by the Aerodyne PTR-ToF-MS, corrected 79 mixing ratios calculated using Method 2, and benzene mixing ratios measured by the GC-MS. The pie chart highlights the fraction of 79 associated with benzene vs. the fraction associated with fragments.
Similar to Las Vegas, fragmentation of higher aromatic species plays an important role in determining the benzene signal in 79. The distribution of uncorrected 79 shows a peak around 0.12 ppb and a broad tail biased towards higher mixing ratios. The GC-MS measures a distribution of benzene with a maximum at 0.05 ppb and a much lower frequency of higher mixing ratios. When the PTR-ToF-MS data are calibrated using the benzene charge-transfer product (Method 2), corrected 79 mixing ratios show better agreement with GC-MS measurements. The distribution of corrected 79 is wider than that reported by GC-MS, which may reflect the faster sampling of the PTR-ToF-MS and more frequent observations of concentrated aromatic plumes (Fig. 14a). Over the entire sampling period, the average distribution of 79 shows that benzene accounts for ∼ 56 % of the total signal. This is consistent with the observations in Las Vegas (interference ∼ 62 % of the signal), indicating that 79 in both datasets was influenced by solvent emissions to a significant extent.
Urban VOCs significantly contribute to the degradation of air quality, and PTR-ToF-MS provides important constraints on the emissions and chemical transformation of many gas-phase organics. Advances in PTR-ToF-MS sensitivity and detection provide opportunities to identify, characterize, and revisit measurement interferences to commonly reported VOCs (Yuan et al., 2017). Here, we find that long-chain aldehydes, along with previously identified cycloalkanes, are important contributors to the signal of 69 typically associated with isoprene in many urban areas. The fragmentation of these molecules can be larger than the signal associated with the proton-transfer product from isoprene, depending on the mixture of anthropogenic and biogenic VOCs, time of day, and season. We find that interferences at ground level in Los Angeles (large isoprene emissions, large anthropogenic emissions) are highest at night and constitute ∼ 10 % of the signal observed during the day. Interferences are a higher fraction of 69 at altitude (>50 %) and are observed to be widespread throughout the Los Angeles Basin. In Las Vegas (low isoprene emissions, large anthropogenic emissions), interferences dominate the signal at 69 throughout the day and night. These interferences are observed in other cities (e.g., Detroit and New York City), depend on season, and are common among drift tube designs operated at similar . Corrections to PTR-ToF-MS measurements at 69 are necessary in order to capture the air quality impacts of isoprene in urban areas.
Other PTR-ToF-MS masses also exhibit interferences, including those typically assigned to oxygenates and aromatic VOCs. Fragmentation from ethanol impacts measurements of acetaldehyde on 45, though this interference is only significant in regions with large ethanol emissions. PTR-ToF-MS measurements of benzene using 79 exhibit significant interferences from the fragmentation of ethylbenzene and benzaldehyde. In Las Vegas and Detroit, fragmentation impacts 79 mixing ratios by as much as 40 %. The growing contribution of interferences to aromatics and oxygenates may reflect the changing mix of urban VOC emissions from one dominated by mobile sources to one dominated by solvents (Gkatzelis et al., 2021b; McDonald et al., 2018a). In the case of benzene, other ions such as the charge-transfer product ( 78, C6H) can be used to quantify benzene without significant influence from fragmentation from higher-carbon VOCs. As instrument sensitivity improves, there may be other ions that can be used to improve the quantification of additional VOCs. These ions may differ across instrument designs depending on the ion source design and response to ambient relative humidity.
Corrections to these interferences are feasible, though it is unlikely that a universal correction factor is sufficient to resolve instrument discrepancies across datasets. Instrument responses, as well as changes to the VOC mixture in different regions, require detailed characterization to be performed on a dataset-by-dataset basis. GC-MS measurements provide an opportunity to compare against PTR-ToF-MS measurements for a wide variety of key VOCs, including isoprene, small oxygenates, and aromatics. Likewise, information about fragmentation and instrument-specific responses to reactive hydrocarbons can be determined using GC-PTR-ToF-MS. For species such as oxygenates, intercomparisons against other mass spectrometers using softer ionization (e.g., iodide or ammonium-adduct CIMS) or use of GC pre-separation using polar columns may yield valuable information about instrument artifacts.
Data for SUNVEx and RE-CAP are available at the NOAA CSL data repository (https://csl.noaa.gov/projects/sunvex/, NOAA Chemical Sciences Laboratory, 2023). Data for FIREX-AQ (https://doi.org/10.5067/SUBORBITAL/FIREXAQ2019/DATA001, NASA Langley Research Center, 2023a), MOOSE (https://doi.org/10.5067/ASDC/SUBORBITAL/MOOSE/DATA001, NASA Langley Research Center, 2023c), and LISTOS (https://doi.org/10.5067/Suborbital/LISTOS/Ground_Other_Data_1, NASA Langley Research Center, 2023b) are available at the NASA data repository.
The supplement related to this article is available online at: https://doi.org/10.5194/amt-17-801-2024-supplement.
MMC, CES, LX, JBG, AL, CW, EYP, CA, EFK, and AHG conducted measurements during SUNVEx and RE-CAP. MMC, GIG, CW, JBG, AL, AW, FP, DB, RH, and ECA conducted measurements during FIREX-AQ. MSC, BML, FM, and MC conducted measurements during MOOSE. JM, CC, and JEM conducted measurements during LISTOS. MMC and CW wrote the paper with contributions from all authors.
At least one of the (co-)authors is a member of the editorial board of Atmospheric Measurement Techniques. The peer-review process was guided by an independent editor, and the authors also have no other competing interests to declare.
Publisher's note: Copernicus Publications remains neutral with regard to jurisdictional claims made in the text, published maps, institutional affiliations, or any other geographical representation in this paper. While Copernicus Publications makes every effort to include appropriate place names, the final responsibility lies with the authors.
All authors thank Paul Wennberg, John Seinfeld, and Ben Schulze for their coordination of the Caltech ground site.
Matthew M. Coggon, Chelsea E. Stockwell, Lu Xu, Jessica B. Gilman, and Carsten Warneke have been supported by Clark County, NV (contract no. 20-022001), and the California Air Resources Board (contract no. 20RD002). Julia Marcantonio, Cong Cao, and John E. Mak have been supported by the Northeast States for Coordinated Air Use Management (NESCAUM) through a contract with the New York State Energy Research and Development Authority (NYSERDA) (agreement no. 101132). Allen H. Goldstein, Eva Y. Pfannerstill, Erin F. Katz, and Caleb Arata have been supported by the California Air Resources Board (contract nos. 20RD003, 20AQP012), the NOAA Climate Program Office's Atmospheric Chemistry, Carbon Cycle, and Climate program (contract nos. NA22OAR4310540 – UCB, NA22OAR4310541 – AD), the Office of Naval Research Defense University Research Instrumentation Program (grant no. N00014-19-1-2108), and EPA-STAR (grant no. 84001001). Eva Y. Pfannerstill was supported by a Feodor Lynen Fellowship of the Alexander von Humboldt Foundation.
This paper was edited by Pierre Herckes and reviewed by two anonymous referees.
Angevine, W. M., Brioude, J., McKeen, S., Holloway, J. S., Lerner, B. M., Goldstein, A. H., Guha, A., Andrews, A., Nowak, J. B., Evan, S., Fischer, M. L., Gilman, J. B., and Bon, D.: Pollutant transport among California regions, J. Geophys. Res.-Atmos., 118, 6750–6763, https://doi.org/10.1002/jgrd.50490, 2013.
Clark County Department of Environment and Sustainability: Annual Monitoring Network Plan, , 1–77, https://desaqmonitoring.clarkcountynv.gov/ (last access: 1 December 2023), 2022.
Arata, C., Misztal, P. K., Tian, Y., Lunderberg, D. M., Kristensen, K., Novoselac, A., Vance, M. E., Farmer, D. K., Nazaroff, W. W., and Goldstein, A. H.: Volatile organic compound emissions during HOMEChem, Indoor Air, 31, 2099–2117, https://doi.org/10.1111/ina.12906, 2021.
Arnold, S. T., Viggiano, A. A., and Morris, R. A.: Rate Constants and Product Branching Fractions for the Reactions of H3O+ and NO+ with C2–C12 Alkanes, J. Phys. Chem. A, 102, 8881–8887, https://doi.org/10.1021/jp9815457, 1998.
Breitenlechner, M., Fischer, L., Hainer, M., Heinritzi, M., Curtius, J., and Hansel, A.: PTR3: An Instrument for Studying the Lifecycle of Reactive Organic Carbon in the Atmosphere, Anal. Chem., 89, 5824–5831, https://doi.org/10.1021/acs.analchem.6b05110, 2017.
Buhr, K., van Ruth, S., and Delahunty, C.: Analysis of volatile flavour compounds by Proton Transfer Reaction-Mass Spectrometry: fragmentation patterns and discrimination between isobaric and isomeric compounds, Int. J. Mass Spectrom., 221, 1–7, https://doi.org/10.1016/S1387-3806(02)00896-5, 2002.
Burkholder, J. B., Sander, S. P., Abbatt, J., Barker, J. R., Cappa, C., Crounse, J. D., Dibble, T. S., Huie, R. E., Kolb, C. E., Kurylo, M. J., Orkin, V. L., Percival, C. J., Wilmouth, D. M., and Wind, P. H.: Chemical Kinetics and Photochemical Data for Use in Atmospheric Studies, Evaluation No. 19, JPL Publication 19-5, Jet Propulsion Laboratory, Pasadena, https://jpldataeval.jpl.nasa.gov/ (last access: 1 December 2023), 2019.
Calfapietra, C., Fares, S., Manes, F., Morani, A., Sgrigna, G., and Loreto, F.: Role of Biogenic Volatile Organic Compounds (BVOC) emitted by urban trees on ozone concentration in cities: A review, Environ. Pollut., 183, 71–80, https://doi.org/10.1016/j.envpol.2013.03.012, 2013.
Cao, C., Gentner, D. R., Commane, R., Toledo-Crow, R., Schiferl, L. D., and Mak, J. E.: Policy-Related Gains in Urban Air Quality May Be Offset by Increased Emissions in a Warming Climate, Environ. Sci. Technol., 57, 9683–9692, https://doi.org/10.1021/acs.est.2c05904, 2023.
Choi, J., Henze, D. K., Cao, H., Nowlan, C. R., González Abad, G., Kwon, H.-A., Lee, H.-M., Oak, Y. J., Park, R. J., Bates, K. H., Maasakkers, J. D., Wisthaler, A., and Weinheimer, A. J.: An Inversion Framework for Optimizing Non-Methane VOC Emissions Using Remote Sensing and Airborne Observations in Northeast Asia During the KORUS-AQ Field Campaign, J. Geophys. Res.-Atmos., 127, e2021JD035844, https://doi.org/10.1029/2021JD035844, 2022.
Claflin, M. S., Pagonis, D., Finewax, Z., Handschy, A. V., Day, D. A., Brown, W. L., Jayne, J. T., Worsnop, D. R., Jimenez, J. L., Ziemann, P. J., de Gouw, J., and Lerner, B. M.: An in situ gas chromatograph with automatic detector switching between PTR- and EI-TOF-MS: isomer-resolved measurements of indoor air, Atmos. Meas. Tech., 14, 133–152, https://doi.org/10.5194/amt-14-133-2021, 2021.
Coggon, M. M., McDonald, B. C., Vlasenko, A., Veres, P. R., Bernard, F., Koss, A. R., Yuan, B., Gilman, J. B., Peischl, J., Aikin, K. C., DuRant, J., Warneke, C., Li, S.-M., and de Gouw, J. A.: Diurnal Variability and Emission Pattern of Decamethylcyclopentasiloxane (D5) from the Application of Personal Care Products in Two North American Cities, Environ. Sci. Technol., 52, 5610–5618, https://doi.org/10.1021/acs.est.8b00506, 2018.
Coggon, M. M., Gkatzelis, G. I., McDonald, B. C., Gilman, J. B., Schwantes, R. H., Abuhassan, N., Aikin, K. C., Arend, M. F., Berkoff, T. A., Brown, S. S., Campos, T. L., Dickerson, R. R., Gronoff, G., Hurley, J. F., Isaacman-VanWertz, G., Koss, A. R., Li, M., McKeen, S. A., Moshary, F., Peischl, J., Pospisilova, V., Ren, X., Wilson, A., Wu, Y., Trainer, M., and Warneke, C.: Volatile chemical product emissions enhance ozone and modulate urban chemistry, P. Natl. Acad. Sci. USA, 118, e2026653118, https://doi.org/10.1073/pnas.2026653118, 2021.
Ernle, L., Ringsdorf, M. A., and Williams, J.: Influence of ozone and humidity on PTR-MS and GC-MS VOC measurements with and without a Na2S2O3 ozone scrubber, Atmos. Meas. Tech., 16, 1179–1194, https://doi.org/10.5194/amt-16-1179-2023, 2023.
Fall, R., Karl, T., Jordan, A., and Lindinger, W.: Biogenic C5 VOCs: release from leaves after freeze–thaw wounding and occurrence in air at a high mountain observatory, Atmos. Environ., 35, 3905–3916, https://doi.org/10.1016/S1352-2310(01)00141-8, 2001.
Gkatzelis, G. I., Coggon, M. M., McDonald, B. C., Peischl, J., Aikin, K. C., Gilman, J. B., Trainer, M., and Warneke, C.: Identifying Volatile Chemical Product Tracer Compounds in U.S. Cities, Environ. Sci. Technol., 55, 188–199, https://doi.org/10.1021/acs.est.0c05467, 2021a.
Gkatzelis, G. I., Coggon, M. M., McDonald, B. C., Peischl, J., Gilman, J. B., Aikin, K. C., Robinson, M. A., Canonaco, F., Prevot, A. S. H., Trainer, M., and Warneke, C.: Observations Confirm that Volatile Chemical Products Are a Major Source of Petrochemical Emissions in U.S. Cities, Environ. Sci. Technol., 55, 4332–4343, https://doi.org/10.1021/acs.est.0c05471, 2021b.
Gkatzelis, G. I., Coggon, M. M., Stockwell, C. E., Hornbrook, R. S., Allen, H., Apel, E. C., Ball, K., Bela, M. M., Blake, D. R., Bourgeois, I., Brown, S. S., Campuzano-Jost, P., St. Clair, J. M., Crawford, J. H., Crounse, J. D., Day, D. A., DiGangi, J., Diskin, G., Fried, A., Gilman, J., Guo, H., Hair, J. W., Halliday, H. A., Hanisco, T. F., Hannun, R., Hills, A., Huey, G., Jimenez, J. L., Katich, J. M., Lamplugh, A., Lee, Y. R., Liao, J., Lindaas, J., McKeen, S. A., Mikoviny, T., Nault, B. A., Neuman, J. A., Nowak, J. B., Pagonis, D., Peischl, J., Perring, A. E., Piel, F., Rickly, P. S., Robinson, M. A., Rollins, A. W., Ryerson, T. B., Schueneman, M. K., Schwantes, R. H., Schwarz, J. P., Sekimoto, K., Selimovic, V., Shingler, T., Tanner, D. J., Tomsche, L., Vasquez, K., Veres, P. R., Washenfelder, R., Weibring, P., Wennberg, P. O., Wisthaler, A., Wolfe, G., Womack, C., Xu, L., Yokelson, R., and Warneke, C.: Parameterizations of US wildfire and prescribed fire emission ratios and emission factors based on FIREX-AQ aircraft measurements, EGUsphere [preprint], https://doi.org/10.5194/egusphere-2023-1439, 2023.
Gueneron, M., Erickson, M. H., VanderSchelden, G. S., and Jobson, B. T.: PTR-MS fragmentation patterns of gasoline hydrocarbons, Int. J. Mass Spectrom., 379, 97–109, https://doi.org/10.1016/j.ijms.2015.01.001, 2015.
Guenther, A. B., Jiang, X., Heald, C. L., Sakulyanontvittaya, T., Duhl, T., Emmons, L. K., and Wang, X.: The Model of Emissions of Gases and Aerosols from Nature version 2.1 (MEGAN2.1): an extended and updated framework for modeling biogenic emissions, Geosci. Model Dev., 5, 1471–1492, https://doi.org/10.5194/gmd-5-1471-2012, 2012.
Herndon, S. C., Jayne, J. T., Zahniser, M. S., Worsnop, D. R., Knighton, B., Alwine, E., Lamb, B. K., Zavala, M., Nelson, D. D., McManus, J. B., Shorter, J. H., Canagaratna, M. R., Onasch, T. B., and Kolb, C. E.: Characterization of urban pollutant emission fluxes and ambient concentration distributions using a mobile laboratory with rapid response instrumentation, Faraday Discuss., 130, 327–339, https://doi.org/10.1039/B500411J, 2005.
Holzinger, R., Acton, W. J. F., Bloss, W. J., Breitenlechner, M., Crilley, L. R., Dusanter, S., Gonin, M., Gros, V., Keutsch, F. N., Kiendler-Scharr, A., Kramer, L. J., Krechmer, J. E., Languille, B., Locoge, N., Lopez-Hilfiker, F., Materić, D., Moreno, S., Nemitz, E., Quéléver, L. L. J., Sarda Esteve, R., Sauvage, S., Schallhart, S., Sommariva, R., Tillmann, R., Wedel, S., Worton, D. R., Xu, K., and Zaytsev, A.: Validity and limitations of simple reaction kinetics to calculate concentrations of organic compounds from ion counts in PTR-MS, Atmos. Meas. Tech., 12, 6193–6208, https://doi.org/10.5194/amt-12-6193-2019, 2019.
Inomata, S. and Tanimoto, H.: A deuterium-labeling study on the reproduction of hydronium ions in the PTR-MS detection of ethanol, Int. J. Mass Spectrom., 285, 95–99, https://doi.org/10.1016/j.ijms.2009.05.001, 2009.
Inomata, S., Tanimoto, H., Kato, S., Suthawaree, J., Kanaya, Y., Pochanart, P., Liu, Y., and Wang, Z.: PTR-MS measurements of non-methane volatile organic compounds during an intensive field campaign at the summit of Mount Tai, China, in June 2006, Atmos. Chem. Phys., 10, 7085–7099, https://doi.org/10.5194/acp-10-7085-2010, 2010.
Jobson, B. T., Alexander, M. L., Maupin, G. D., and Muntean, G. G.: On-line analysis of organic compounds in diesel exhaust using a proton transfer reaction mass spectrometer (PTR-MS), Int. J. Mass Spectrom., 245, 78–89, https://doi.org/10.1016/j.ijms.2005.05.009, 2005.
Kari, E., Miettinen, P., Yli-Pirilä, P., Virtanen, A., and Faiola, C. L.: PTR-ToF-MS product ion distributions and humidity-dependence of biogenic volatile organic compounds, Int. J. Mass Spectrom., 430, 87–97, https://doi.org/10.1016/j.ijms.2018.05.003, 2018.
Karl, T., Hansel, A., Cappellin, L., Kaser, L., Herdlinger-Blatt, I., and Jud, W.: Selective measurements of isoprene and 2-methyl-3-buten-2-ol based on NO+ ionization mass spectrometry, Atmos. Chem. Phys., 12, 11877–11884, https://doi.org/10.5194/acp-12-11877-2012, 2012.
Karl, T., Striednig, M., Graus, M., Hammerle, A., and Wohlfahrt, G.: Urban flux measurements reveal a large pool of oxygenated volatile organic compound emissions, P. Natl. Acad. Sci. USA, 115, 1186–1191, https://doi.org/10.1073/pnas.1714715115, 2018.
Kaser, L., Karl, T., Schnitzhofer, R., Graus, M., Herdlinger-Blatt, I. S., DiGangi, J. P., Sive, B., Turnipseed, A., Hornbrook, R. S., Zheng, W., Flocke, F. M., Guenther, A., Keutsch, F. N., Apel, E., and Hansel, A.: Comparison of different real time VOC measurement techniques in a ponderosa pine forest, Atmos. Chem. Phys., 13, 2893–2906, https://doi.org/10.5194/acp-13-2893-2013, 2013.
Khare, P., Machesky, J., Soto, R., He, M., Presto, A. A., and Gentner, D. R.: Asphalt-related emissions are a major missing nontraditional source of secondary organic aerosol precursors, Science Advances, 6, eabb9785, https://doi.org/10.1126/sciadv.abb9785, 2020.
Khare, P., Krechmer, J. E., Machesky, J. E., Hass-Mitchell, T., Cao, C., Wang, J., Majluf, F., Lopez-Hilfiker, F., Malek, S., Wang, W., Seltzer, K., Pye, H. O. T., Commane, R., McDonald, B. C., Toledo-Crow, R., Mak, J. E., and Gentner, D. R.: Ammonium adduct chemical ionization to investigate anthropogenic oxygenated gas-phase organic compounds in urban air, Atmos. Chem. Phys., 22, 14377–14399, https://doi.org/10.5194/acp-22-14377-2022, 2022.
Kilgour, D. B., Novak, G. A., Claflin, M. S., Lerner, B. M., and Bertram, T. H.: Production of oxygenated volatile organic compounds from the ozonolysis of coastal seawater, EGUsphere [preprint], https://doi.org/10.5194/egusphere-2023-2210, 2023.
Kim, S.-W., McDonald, B. C., Seo, S., Kim, K.-M., and Trainer, M.: Understanding the Paths of Surface Ozone Abatement in the Los Angeles Basin, J. Geophys. Res.-Atmos., 127, e2021JD035606, https://doi.org/10.1029/2021JD035606, 2022.
Klein, F., Platt, S. M., Farren, N. J., Detournay, A., Bruns, E. A., Bozzetti, C., Daellenbach, K. R., Kilic, D., Kumar, N. K., Pieber, S. M., Slowik, J. G., Temime-Roussel, B., Marchand, N., Hamilton, J. F., Baltensperger, U., Prévôt, A. S. H., and El Haddad, I.: Characterization of Gas-Phase Organics Using Proton Transfer Reaction Time-of-Flight Mass Spectrometry: Cooking Emissions, Environ. Sci. Technol., 50, 1243–1250, https://doi.org/10.1021/acs.est.5b04618, 2016.
Koss, A., Yuan, B., Warneke, C., Gilman, J. B., Lerner, B. M., Veres, P. R., Peischl, J., Eilerman, S., Wild, R., Brown, S. S., Thompson, C. R., Ryerson, T., Hanisco, T., Wolfe, G. M., Clair, J. M. St., Thayer, M., Keutsch, F. N., Murphy, S., and de Gouw, J.: Observations of VOC emissions and photochemical products over US oil- and gas-producing regions using high-resolution H3O+ CIMS (PTR-ToF-MS), Atmos. Meas. Tech., 10, 2941–2968, https://doi.org/10.5194/amt-10-2941-2017, 2017.
Koss, A. R., Sekimoto, K., Gilman, J. B., Selimovic, V., Coggon, M. M., Zarzana, K. J., Yuan, B., Lerner, B. M., Brown, S. S., Jimenez, J. L., Krechmer, J., Roberts, J. M., Warneke, C., Yokelson, R. J., and de Gouw, J.: Non-methane organic gas emissions from biomass burning: identification, quantification, and emission factors from PTR-ToF during the FIREX 2016 laboratory experiment, Atmos. Chem. Phys., 18, 3299–3319, https://doi.org/10.5194/acp-18-3299-2018, 2018.
Krechmer, J., Lopez-Hilfiker, F., Koss, A., Hutterli, M., Stoermer, C., Deming, B., Kimmel, J., Warneke, C., Holzinger, R., Jayne, J., Worsnop, D., Fuhrer, K., Gonin, M., and de Gouw, J.: Evaluation of a New Reagent-Ion Source and Focusing Ion–Molecule Reactor for Use in Proton-Transfer-Reaction Mass Spectrometry, Anal. Chem., 90, 12011–12018, https://doi.org/10.1021/acs.analchem.8b02641, 2018.
McDonald, B. C., de Gouw, J. A., Gilman, J. B., Jathar, S. H., Akherati, A., Cappa, C. D., Jimenez, J. L., Lee-Taylor, J., Hayes, P. L., McKeen, S. A., Cui, Y. Y., Kim, S. W., Gentner, D. R., Isaacman-VanWertz, G., Goldstein, A. H., Harley, R. A., Frost, G. J., Roberts, J. M., Ryerson, T. B., and Trainer, M.: Volatile chemical products emerging as largest petrochemical source of urban organic emissions, Science, 359, 760–764, https://doi.org/10.1126/science.aaq0524, 2018a.
McDonald, B. C., McKeen, S. A., Cui, Y. Y., Ahmadov, R., Kim, S.-W., Frost, G. J., Pollack, I. B., Peischl, J., Ryerson, T. B., Holloway, J. S., Graus, M., Warneke, C., Gilman, J. B., de Gouw, J. A., Kaiser, J., Keutsch, F. N., Hanisco, T. F., Wolfe, G. M., and Trainer, M.: Modeling Ozone in the Eastern U.S. using a Fuel-Based Mobile Source Emissions Inventory, Environ. Sci. Technol., 52, 7360–7370, https://doi.org/10.1021/acs.est.8b00778, 2018b.
Müller, M., Mikoviny, T., Feil, S., Haidacher, S., Hanel, G., Hartungen, E., Jordan, A., Märk, L., Mutschlechner, P., Schottkowsky, R., Sulzer, P., Crawford, J. H., and Wisthaler, A.: A compact PTR-ToF-MS instrument for airborne measurements of volatile organic compounds at high spatiotemporal resolution, Atmos. Meas. Tech., 7, 3763–3772, https://doi.org/10.5194/amt-7-3763-2014, 2014.
NASA Atmospheric Science Data Center: Fire Influence on Regional to Global Environments and Air Quality, NASA Langley Atmospheric Science Data Center DAAC [data set], https://doi.org/10.5067/SUBORBITAL/FIREXAQ2019/DATA001, 2023a.
NASA Atmospheric Science Data Center: Long Island Sound Tropospheric Ozone Study, NASA Langley Atmospheric Science Data Center DAAC [data set], https://doi.org/10.5067/Suborbital/LISTOS/Ground_Other_Data_1, 2023b.
NASA Atmospheric Science Data Center: Michigan-Ontario Ozone Source Experiment, NASA Langley Atmospheric Science Data Center DAAC [data set], https://doi.org/10.5067/ASDC/SUBORBITAL/MOOSE/DATA001, 2023c.
NOAA Chemical Sciences Laboratory: SUNVEx Data Repository, https://csl.noaa.gov/projects/sunvex, date of last access 01/12/2023
Pagonis, D., Sekimoto, K., and de Gouw, J.: A Library of Proton-Transfer Reactions of H3O+ Ions Used for Trace Gas Detection, J. Am. Soc. Mass Spectr., 30, 1330–1335, https://doi.org/10.1007/s13361-019-02209-3, 2019.
Peng, Y., Mouat, A. P., Hu, Y., Li, M., McDonald, B. C., and Kaiser, J.: Source appointment of volatile organic compounds and evaluation of anthropogenic monoterpene emission estimates in Atlanta, Georgia, Atmos. Environ., 288, 119324, https://doi.org/10.1016/j.atmosenv.2022.119324, 2022.
Pfannerstill, E. Y., Wang, N., Edtbauer, A., Bourtsoukidis, E., Crowley, J. N., Dienhart, D., Eger, P. G., Ernle, L., Fischer, H., Hottmann, B., Paris, J.-D., Stönner, C., Tadic, I., Walter, D., Lelieveld, J., and Williams, J.: Shipborne measurements of total OH reactivity around the Arabian Peninsula and its role in ozone chemistry, Atmos. Chem. Phys., 19, 11501–11523, https://doi.org/10.5194/acp-19-11501-2019, 2019.
Pfannerstill, E. Y., Arata, C., Zhu, Q., Schulze, B. C., Woods, R., Harkins, C., Schwantes, R. H., McDonald, B. C., Seinfeld, J. H., Bucholtz, A., Cohen, R. C., and Goldstein, A. H.: Comparison between Spatially Resolved Airborne Flux Measurements and Emission Inventories of Volatile Organic Compounds in Los Angeles, Environ. Sci. Technol., 57, 15533–15545, https://doi.org/10.1021/acs.est.3c03162, 2023a.
Pfannerstill, E. Y., Arata, C., Zhu, Q., Schulze, B. C., Woods, R., Seinfeld, J. H., Bucholtz, A., Cohen, R. C., and Goldstein, A. H.: Volatile organic compound fluxes in the San Joaquin Valley – spatial distribution, source attribution, and inventory comparison, EGUsphere [preprint], https://doi.org/10.5194/egusphere-2023-723, 2023b.
Riva, M., Rantala, P., Krechmer, J. E., Peräkylä, O., Zhang, Y., Heikkinen, L., Garmash, O., Yan, C., Kulmala, M., Worsnop, D., and Ehn, M.: Evaluating the performance of five different chemical ionization techniques for detecting gaseous oxygenated organic species, Atmos. Meas. Tech., 12, 2403–2421, https://doi.org/10.5194/amt-12-2403-2019, 2019.
Rivera-Rios, J. C., Nguyen, T. B., Crounse, J. D., Jud, W., St. Clair, J. M., Mikoviny, T., Gilman, J. B., Lerner, B. M., Kaiser, J. B., de Gouw, J., Wisthaler, A., Hansel, A., Wennberg, P. O., Seinfeld, J. H., and Keutsch, F. N.: Conversion of hydroperoxides to carbonyls in field and laboratory instrumentation: Observational bias in diagnosing pristine versus anthropogenically controlled atmospheric chemistry, Geophys. Res. Lett., 41, 8645–8651, https://doi.org/10.1002/2014GL061919, 2014.
Romano, A. and Hanna, G. B.: Identification and quantification of VOCs by proton transfer reaction time of flight mass spectrometry: An experimental workflow for the optimization of specificity, sensitivity, and accuracy, J. Mass Spectrom., 53, 287–295, https://doi.org/10.1002/jms.4063, 2018.
Ryerson, T. B., Andrews, A. E., Angevine, W. M., Bates, T. S., Brock, C. A., Cairns, B., Cohen, R. C., Cooper, O. R., de Gouw, J. A., Fehsenfeld, F. C., Ferrare, R. A., Fischer, M. L., Flagan, R. C., Goldstein, A. H., Hair, J. W., Hardesty, R. M., Hostetler, C. A., Jimenez, J. L., Langford, A. O., McCauley, E., McKeen, S. A., Molina, L. T., Nenes, A., Oltmans, S. J., Parrish, D. D., Pederson, J. R., Pierce, R. B., Prather, K., Quinn, P. K., Seinfeld, J. H., Senff, C. J., Sorooshian, A., Stutz, J., Surratt, J. D., Trainer, M., Volkamer, R., Williams, E. J., and Wofsy, S. C.: The 2010 California Research at the Nexus of Air Quality and Climate Change (CalNex) field study, J. Geophys. Res.-Atmos., 118, 5830–5866, https://doi.org/10.1002/jgrd.50331, 2013.
Schauer, J. J., Kleeman, M. J., Cass, G. R., and Simoneit, B. R. T.: Measurement of Emissions from Air Pollution Sources. 1. C1 through C29 Organic Compounds from Meat Charbroiling, Environ. Sci. Technol., 33, 1566–1577, https://doi.org/10.1021/es980076j, 1999.
Spanel, P. and Smith, D.: SIFT studies of the reactions of H3O+, NO+ and O with a series of alcohols, Int. J. Mass Spectrom., 167–168, 375–388, https://doi.org/10.1016/S0168-1176(97)00085-2, 1997.
Stark, H., Yatavelli, R. L. N., Thompson, S. L., Kimmel, J. R., Cubison, M. J., Chhabra, P. S., Canagaratna, M. R., Jayne, J. T., Worsnop, D. R., and Jimenez, J. L.: Methods to extract molecular and bulk chemical information from series of complex mass spectra with limited mass resolution, Int. J. Mass Spectrom., 389, 26–38, https://doi.org/10.1016/j.ijms.2015.08.011, 2015.
Stockwell, C. E., Coggon, M. M., Gkatzelis, G. I., Ortega, J., McDonald, B. C., Peischl, J., Aikin, K., Gilman, J. B., Trainer, M., and Warneke, C.: Volatile organic compound emissions from solvent- and water-borne coatings – compositional differences and tracer compound identifications, Atmos. Chem. Phys., 21, 6005–6022, https://doi.org/10.5194/acp-21-6005-2021, 2021.
Tani, A.: Fragmentation and Reaction Rate Constants of Terpenoids Determined by Proton Transfer Reaction-mass Spectrometry, Environmental Control in Biology, 51, 23–29, https://doi.org/10.2525/ecb.51.23, 2013.
Tomsche, L., Piel, F., Mikoviny, T., Nielsen, C. J., Guo, H., Campuzano-Jost, P., Nault, B. A., Schueneman, M. K., Jimenez, J. L., Halliday, H., Diskin, G., DiGangi, J. P., Nowak, J. B., Wiggins, E. B., Gargulinski, E., Soja, A. J., and Wisthaler, A.: Measurement report: Emission factors of NH3 and NHx for wildfires and agricultural fires in the United States, Atmos. Chem. Phys., 23, 2331–2343, https://doi.org/10.5194/acp-23-2331-2023, 2023.
Vermeuel, M. P., Novak, G. A., Kilgour, D. B., Claflin, M. S., Lerner, B. M., Trowbridge, A. M., Thom, J., Cleary, P. A., Desai, A. R., and Bertram, T. H.: Observations of biogenic volatile organic compounds over a mixed temperate forest during the summer to autumn transition, EGUsphere [preprint], https://doi.org/10.5194/egusphere-2022-1015, 2022.
Warneke, C., de Gouw, J. A., Kuster, W. C., Goldan, P. D., and Fall, R.: Validation of Atmospheric VOC Measurements by Proton-Transfer-Reaction Mass Spectrometry Using a Gas-Chromatographic Preseparation Method, Environ. Sci. Technol., 37, 2494–2501, https://doi.org/10.1021/es026266i, 2003.
Warneke, C., de Gouw, J. A., Holloway, J. S., Peischl, J., Ryerson, T. B., Atlas, E., Blake, D., Trainer, M., and Parrish, D. D.: Multiyear trends in volatile organic compounds in Los Angeles, California: Five decades of decreasing emissions, J. Geophsys. Res., 117, D00V17, https://doi.org/10.1029/2012jd017899, 2012.
Warneke, C., Geiger, F., Edwards, P. M., Dube, W., Pétron, G., Kofler, J., Zahn, A., Brown, S. S., Graus, M., Gilman, J. B., Lerner, B. M., Peischl, J., Ryerson, T. B., de Gouw, J. A., and Roberts, J. M.: Volatile organic compound emissions from the oil and natural gas industry in the Uintah Basin, Utah: oil and gas well pad emissions compared to ambient air composition, Atmos. Chem. Phys., 14, 10977–10988, https://doi.org/10.5194/acp-14-10977-2014, 2014.
Warneke, C., Schwarz, J. P., Dibb, J., Kalashnikova, O., Frost, G., Al-Saad, J., Brown, S. S., Brewer, W. A., Soja, A., Seidel, F. C., Washenfelder, R. A., Wiggins, E. B., Moore, R. H., Anderson, B. E., Jordan, C., Yacovitch, T. I., Herndon, S. C., Liu, S., Kuwayama, T., Jaffe, D., Johnston, N., Selimovic, V., Yokelson, R., Giles, D. M., Holben, B. N., Goloub, P., Popovici, I., Trainer, M., Kumar, A., Pierce, R. B., Fahey, D., Roberts, J., Gargulinski, E. M., Peterson, D. A., Ye, X., Thapa, L. H., Saide, P. E., Fite, C. H., Holmes, C. D., Wang, S., Coggon, M. M., Decker, Z. C. J., Stockwell, C. E., Xu, L., Gkatzelis, G., Aikin, K., Lefer, B., Kaspari, J., Griffin, D., Zeng, L., Weber, R., Hastings, M., Chai, J., Wolfe, G. M., Hanisco, T. F., Liao, J., Campuzano Jost, P., Guo, H., Jimenez, J. L., Crawford, J., and The FIREX-AQ Science Team: Fire Influence on Regional to Global Environments and Air Quality (FIREX-AQ), J. Geophys. Res.-Atmos., 128, e2022JD037758, https://doi.org/10.1029/2022JD037758, 2023.
Wernis, R. A., Kreisberg, N. M., Weber, R. J., Drozd, G. T., and Goldstein, A. H.: Source apportionment of VOCs, IVOCs and SVOCs by positive matrix factorization in suburban Livermore, California, Atmos. Chem. Phys., 22, 14987–15019, https://doi.org/10.5194/acp-22-14987-2022, 2022.
Xu, L., Coggon, M. M., Stockwell, C. E., Gilman, J. B., Robinson, M. A., Breitenlechner, M., Lamplugh, A., Crounse, J. D., Wennberg, P. O., Neuman, J. A., Novak, G. A., Veres, P. R., Brown, S. S., and Warneke, C.: Chemical ionization mass spectrometry utilizing ammonium ions (NH CIMS) for measurements of organic compounds in the atmosphere, Atmos. Meas. Tech., 15, 7353–7373, https://doi.org/10.5194/amt-15-7353-2022, 2022.
Yacovitch, T. I., Herndon, S. C., Pétron, G., Kofler, J., Lyon, D., Zahniser, M. S., and Kolb, C. E.: Mobile Laboratory Observations of Methane Emissions in the Barnett Shale Region, Environ. Sci. Technol., 49, 7889–7895, https://doi.org/10.1021/es506352j, 2015.
Yuan, B., Koss, A., Warneke, C., Gilman, J. B., Lerner, B. M., Stark, H., and de Gouw, J. A.: A high-resolution time-of-flight chemical ionization mass spectrometer utilizing hydronium ions (H3O+ ToF-CIMS) for measurements of volatile organic compounds in the atmosphere, Atmos. Meas. Tech., 9, 2735–2752, https://doi.org/10.5194/amt-9-2735-2016, 2016.
Yuan, B., Koss, A. R., Warneke, C., Coggon, M., Sekimoto, K., and de Gouw, J. A.: Proton-Transfer-Reaction Mass Spectrometry: Applications in Atmospheric Sciences, Chem. Rev., 117, 13187–13229, https://doi.org/10.1021/acs.chemrev.7b00325, 2017.