the Creative Commons Attribution 4.0 License.
the Creative Commons Attribution 4.0 License.
 | 28 Feb 2025
Determining optimal sampling conditions in the TSI Nanometer Aerosol Sampler 3089
Behnaz Alinaghipour
Sadegh Niazi
Robert Groth
Branka Miljevic
Physicochemical characterisation of airborne particles requires appropriate sampling and deposition methods. The TSI Nanometer Aerosol Sampler 3089 (TSI NAS) has predominantly been used as an electrostatic precipitator for depositing airborne particles, enabling subsequent offline characterisation through techniques such as electron microscopy. However, the optimal sampling time of TSI NAS for varying input concentrations has not been thoroughly investigated. This is extremely important as the concentrations of particles in different environments differ significantly. This study aimed to establish the appropriate sampling durations of TSI NAS for various input concentrations or, conversely, to determine suitable input concentrations for a fixed sampling duration. We developed an experimental setup and a linear regression model to predict conditions conducive to efficiently collecting loaded samples, particularly at low concentrations, such as exhaled particles from the human respiratory tract or marine aerosol particles. Experiments were conducted using the TSI NAS 3089 at a flow rate of 1 L min−1 and a voltage of −9 kV. Three particle types, nebulised from different solutions at low, medium, and high concentrations, were sampled over durations of 1, 3, and 6 h. Deposition densities were subsequently analysed using ImageJ software. The findings revealed a linear relationship between deposition density and the product of particle concentration and sampling time, with a recommended density range of 0.015 to 0.1 particles µm−2 for particles with a count median diameter of approximately 100 nm and average circularity of 0.56 ± 0.25. Despite potential factors affecting the accuracy of the model, such as the number of samples, random collisions, and potential overload in high-concentration experiments, it provides a valuable predictive tool for determining optimal sampling times. The suggested linear regression model is applicable across various research areas, enhancing the efficiency and accuracy of airborne particle characterisation.
- Article
(2591 KB) - Full-text XML
-
Supplement
(511 KB) - BibTeX
- EndNote


Aerosol can present significant threats to the atmosphere, climate, and human health, necessitating comprehensive research efforts to understand its multifaceted impacts (Pöschl, 2005; Savage et al., 2017). Extensive experiments have been conducted to sample and characterise various types of aerosols, focusing on their morphology, size distribution, and chemical composition (Mirhoseini et al., 2016; Müller et al., 2011; Groth et al., 2022). One of the primary challenges of sampling these particles lies in their potential presence at low number concentrations, particularly in aerosols emitted during respiratory activities (Groth et al., 2021; Pöhlker et al., 2023).
Microscopy is a valuable method for assessing various features of aerosols, including constructing particle size distributions (PSDs) and determining particle morphology and composition (Wittmaack et al., 2005; Sobanska et al., 2014; Groth et al., 2023). Various electron microscopy (EM) techniques, including scanning electron microscopy (SEM) and transmission electron microscopy (TEM), have been widely employed for analysing airborne particles. For example, Wittmaack et al. (2005) characterised bioaerosols in ambient air using SEM, revealing their complex morphology and diversity in size and shape. Similarly, Capannelli et al. (2011) evaluated SEM, field emission SEM (FE-SEM), and TEM modes to optimise procedures for analysing particles on filtering membranes, demonstrating the capabilities of these techniques for direct particle observation. However, obtaining accurate microscopy results requires collecting an efficiently loaded number of aerosols on a flat, chemically stable, and transportable substrate. This is critical because such substrates prevent chemical interactions and physical deformations that could alter the characteristics of the aerosols, ensuring that the observed characteristics reflect their true nature (Li et al., 2010).
Aerosol loading on a substrate for EM analyses includes inertial, thermophoretic, and electrophoretic techniques, each offering unique advantages for aerosol collection and analysis. Inertial sampling methods rely on the separation of particles based on their momentum, which depends on their aerodynamic properties, and subsequently collected onto an impaction surface (Hering et al., 1990). Thermophoretic methods utilise temperature gradients to drive aerosol particles towards a cooler surface for collection, allowing for the selective sampling of particles based on their thermal properties (Wasmund et al., 2010). Electrophoretic deposition is a very common method employed for the collection of aerosols based on their electrical mobility diameter. In this process, the particles are first charged and are subsequently directed toward a surface that carries an opposite electric charge. Aerosols with higher mobility are deposited onto the charged surface, while aerosols with lower mobility continue their passage and are expelled through the exhaust. The diameter of the aerosols that are ultimately deposited on the surface depends on several factors such as particle charge, surface voltage or electrical fields, and rate of airflow (Kettleson et al., 2009).
The TSI Nanometer Aerosol Sampler 3089 (TSI NAS, Shoreview, MN) is a widely used electrostatic precipitator for collecting airborne particles to facilitate offline analysis, including EM (Lyu et al., 2024; Bauer et al., 2019; Buckley et al., 2017). The NAS offers two primary advantages: an efficient collection of particles ranging from 2 to 100 nm and fairly uniform deposition on the substrate, allowing a small portion of the sample to accurately reflect the entire sample (Dixkens and Fissan, 1999; Nanometer Aerosol Sampler 3089, 2024). The NAS has been employed to investigate the collection efficiency for ultrafine particles (UFPs) across a range of voltages and flow rates to evaluate the optimal sampling conditions within a specific time span (Li et al., 2010). Li et al. (2010) found that collection efficiency improved with the decrease in flow rate and increase in voltage. The highest efficiency was measured at 1 L min−1 and −9.3 kV. Thus, there is a direct relationship between particle deposition and voltage owing to the greater electrical force (Li et al., 2010). The NAS has also been used for collecting atmospheric aerosols for offline particle characterisation studies. Barone and Zhu (2008) investigated the morphology of particles with diameters smaller than 100 nm collected on TEM grids attached to the NAS electrode. They conducted sampling at 1 L min−1 and −10 kV to sample particles on and near major freeways in Los Angeles, CA, where particles were electrically charged using a bipolar diffusion charger and selectively sized to 50 nm using a differential mobility analyser. Analysis of the particles selected based on size using TEM allowed them to explore changes in the fraction of particles within each morphology class with distance from the major freeway, providing insights into the aerosol mechanisms affecting the number size distribution (Barone and Zhu, 2008).
Samples collected using the NAS have also been used to investigate the chemical composition of UFPs, offering valuable insights into the nature and origin of the aerosols present in the ambient air near coal-fired power stations (Hinkley et al., 2008). Hinkley et al. (2008) collected particles under 300 nm on TEM grids affixed to the NAS electrode with a flow rate and voltage of 1 L min−1 and −10 kV, respectively. Prior to the collection by the NAS, aerosols underwent a cascade impactor separation and charge neutralisation. Subsequently, they were subjected to TEM analysis coupled with energy-dispersive X-ray (EDX) to determine both chemical composition and morphology. The study investigated the contribution of UFPs from power station emissions to ambient aerosol at a near-source sampling site (Hinkley et al., 2008). Hinkley et al. (2008) reported a table indicating the suitability of sample loading for TEM analysis based on various particle concentrations and sampling duration. Four out of 10 experiments were well loaded, while the remaining were categorised as either lightly loaded or overloaded. Overloading could lead to inaccuracies in size and shape analysis, introducing bias or errors and reducing the reliability and representativeness of the collected data. Verma et al. (2019) investigated the effect of fuel oxygen content on morphology and nanostructure characteristics of soot particles utilising fuels such as diesel, coconut biodiesel, and triacetin. They employed a NAS at 1 L min−1 flow rate and 7 kV voltage. Diesel fuel, producing the highest number of particles, was sampled first while the engine operated at 100 % load. They tried to optimise sampling duration to prevent particle overlap and ensure an adequate number of soot particles for morphological analysis. TEM imaging revealed that a sampling time of 3–4 min was sufficient for diesel particles. For the other fuels, the sampling time was gradually increased to 7 min to collect enough particles for analysis while still avoiding the overlap of soot agglomerates (Verma et al., 2019).
Despite efforts to characterise UFPs using the NAS and determining the efficient operating flow rate and voltage, there have not been comprehensive studies on the optimum sampling time for a given input concentration. This gap is particularly significant in low-input-concentration environments, such as aerosols generated from the human respiratory system, marine aerosols, and aerosols present in the free troposphere at high altitudes (Mirhoseini et al., 2016; Facchini et al., 2008; Pöhlker et al., 2012). This study aimed to sample three types of aerosols in low-, medium-, and high-input-concentration environments over a sampling duration spanning 1 to 6 h. The outcome of this study can provide a model for the prediction of optimal sampling conditions for the NAS to ensure reliable measurements of the physiochemical properties of collected aerosols.
2.1 Experimental arrangement
In this study, the collection density of aerosols generated from phosphate-buffered saline (PBS), Dulbecco's Modified Eagle Medium (DMEM) solutions, and human saliva was evaluated using the TSI NAS with a voltage of up to −10 kV as an electrostatic precipitator to collect charged aerosols for offline analysis. The PBS, DMEM, and human saliva aerosols were selected as a representative of marine or human respiratory aerosols. PBS, a balanced salt solution used in biological research, contains inorganic compounds including chloride- and phosphate-containing salts and is buffered to maintain physiological pH (Almeida et al., 2013). Consequently, PBS was chosen to represent the complexity of the ionic composition of not only marine aerosols (Nenes et al., 2011; Baker et al., 2006) but also other aerosols in general. DMEM, a widely used cell culture medium, contains amino acids, vitamins, glucose, and salts, providing nutrients for cell growth (Yao and Asayama, 2017). The combination of organic and inorganic components in DMEM tends to produce irregular shapes, contrasting with the relatively regular structures observed in PBS. DMEM may also be representative of respiratory fluid particles. The morphology of human saliva can be complex due to its diverse composition, comprising both inorganic and organic components, such as water, electrolytes, proteins, enzymes, mucins, and cells. The drying process can lead to the formation of heterogeneous structures, including protein aggregates and fibrous structures (Sharma et al., 2011; Bel'skaya et al., 2019). The morphology of the aerosols may influence the NAS deposition due to different dynamic shape factors and agglomeration, where highly agglomerated or non-spherical particles may result in higher particle diffusion coefficients (Moskal and Payatakes, 2006). As the diffusion coefficient increases, aerosols disperse more extensively from the electrode where they are initially deposited, potentially reducing particle concentration near the electrode (Park and Chun, 2002). However, the three selected solutions in this study are expected to show no agglomeration, with particles predominantly spherical or cubic.
Two adjacent vibrating mesh nebulisers (VMNs) mounted inside a rotating drum were utilised to produce the aerosols (Johnson et al., 2016; Niazi et al., 2021). These aerosols were then passed through a silica diffusion dryer (DD) and an 85Kr neutraliser (Kr-85) before being collected on continuous carbon-coated copper grids (200 mesh, Ted Pella, Inc.) fixed on the electrode of the NAS. This ensures that all aerosols were in the same humidity during deposition, and the humidity inside the drum did not affect the deposition density of the NAS. The NAS was operated at a flow rate and voltage of 1 L min−1 and −9 kV, respectively, which has been shown to have the highest collection efficiency (Li et al., 2010). A schematic diagram of the NAS is presented in Fig. S1 in the Supplement to highlight airflow patterns, aerosol deposition, and electrical field dynamics. Particle input concentration and size distribution were measured by the TSI 3080 scanning mobility particle sizer (SMPS) using the TSI 3776 butanol-based condensation particle counter (CPC) (TSI, Shoreview, MN). The SMPS had a sheath flow rate of 3 L min−1, and each scan was conducted for 5 min. After scans were performed, the average PSDs were used for comparison with data obtained from SEM micrographs. An AeroTrak Handheld Particle Counter 9306 (OPC) was used to ensure the experimental system was clean and free from any residual particles prior to aerosol injection. Figure 1 shows the schematic diagram of the experimental setup. The summary of the NAS parameters and operating conditions is presented in Table 1.
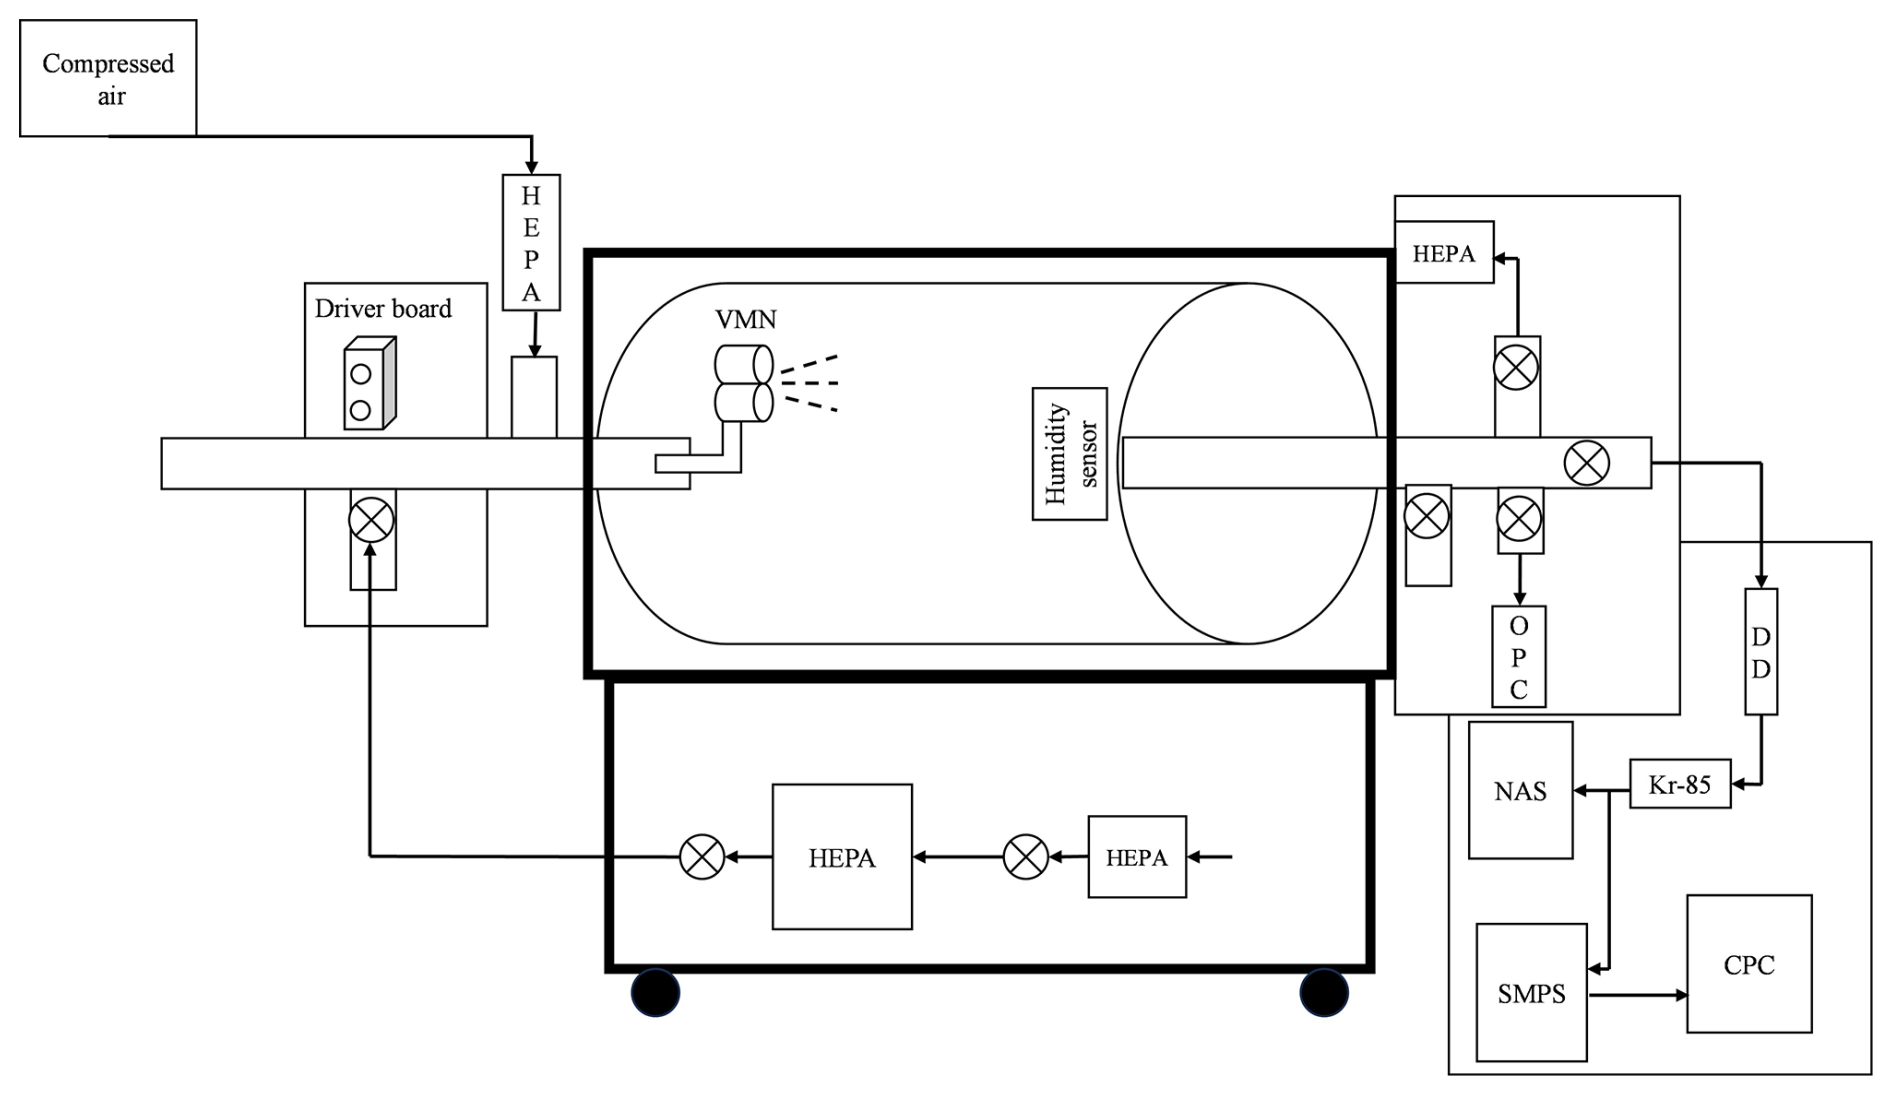
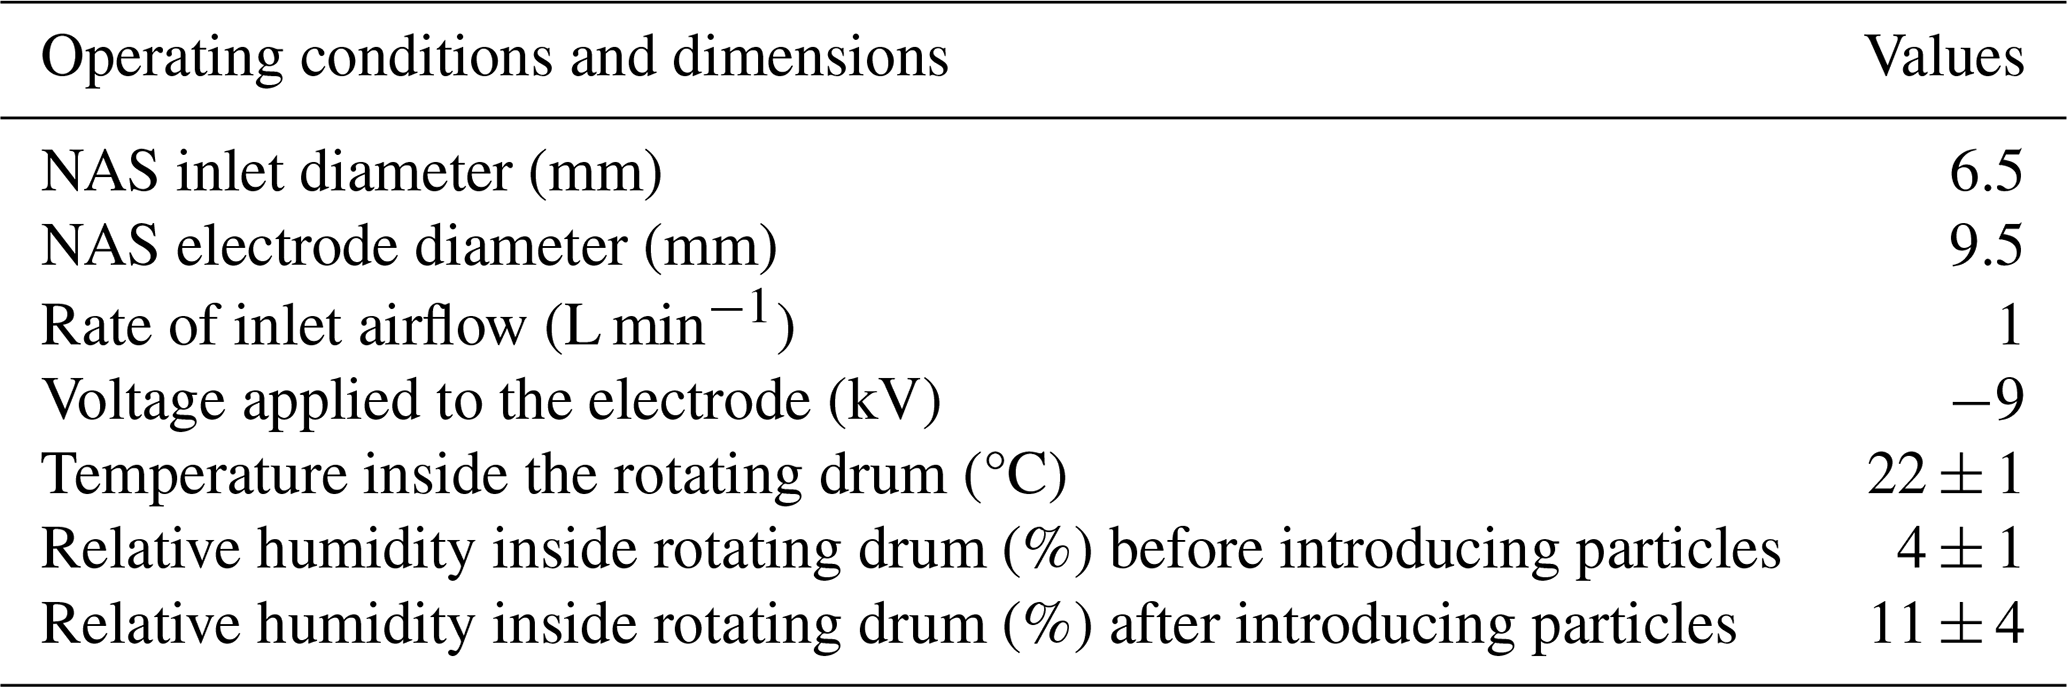
Table 1The operating conditions and dimensions of the Nanometer Aerosol Sampler (TSI NAS 3089) employed in this study.
Experiments were conducted at three different concentrations and three sampling durations of 1, 3, and 6 h. The desired input particle number concentrations for each experiment were achieved by modifying the nebulisation time of the VMNs. Specifically, 1.5 mL of the solution was nebulised for 3 s in low-deposition experiments, 9 s for medium-deposition experiments, and 20 s for high-deposition experiments. The number of collected particles was examined by scanning electron microscopy (Hitachi SU 7000 SEM), employing a high-energy electron beam scanned in a raster pattern. Micrographs were captured at an accelerating voltage ranging from 10 to 20 kV and a spot intensity of 30 % in secondary electron imaging (SE) mode. To prepare the samples for analysis, they were first coated with a 10 nm carbon layer to avoid surface accumulation of electrostatic charge.
2.2 Deposition density calculations
Figure 2 shows examples of SEM micrographs depicting under-loaded, efficiently loaded, and overloaded numbers of particles. When particle numbers are too low (Fig. 2a) or excessively high, resulting in clusters or pileups (Fig. 2c), accurate size and shape analysis becomes unattainable. Additionally, overlapping particles introduce bias and errors into the data, complicating the identification of individual particles and reducing the reliability and representativeness of the collected chemical composition information. Conversely, the efficiently loaded sample (Fig. 2b) exhibits an optimal deposition density that enhances the reliability and representativeness of morphology, size, and chemical composition characterisation.
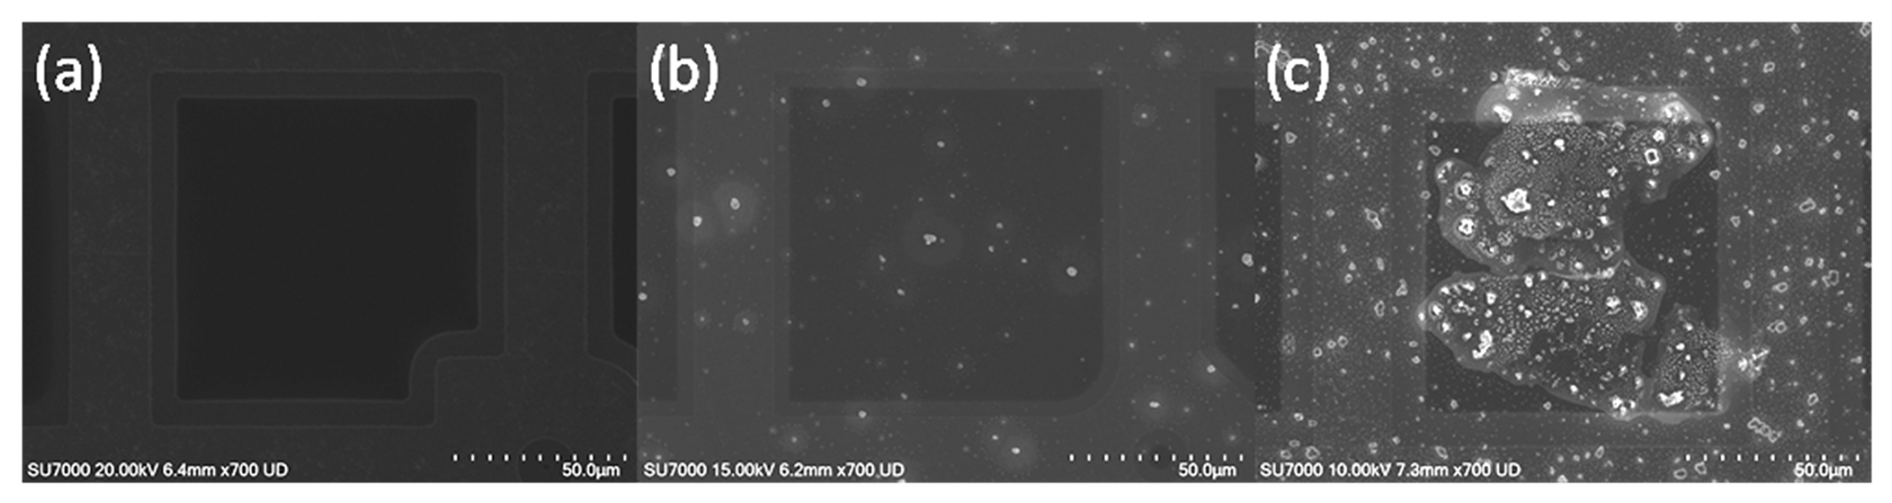
Figure 2SEM images of phosphate-buffered saline (PBS) particles collected at different input concentrations and sampling times: (a) low concentration (200 particles cm−3), 1 h, particles µm−2; (b) medium concentration (500 particles cm−3), 6 h, particles µm−2; (c) high concentration (5000 particles cm−3), 6 h, 0.385 particles µm−2.
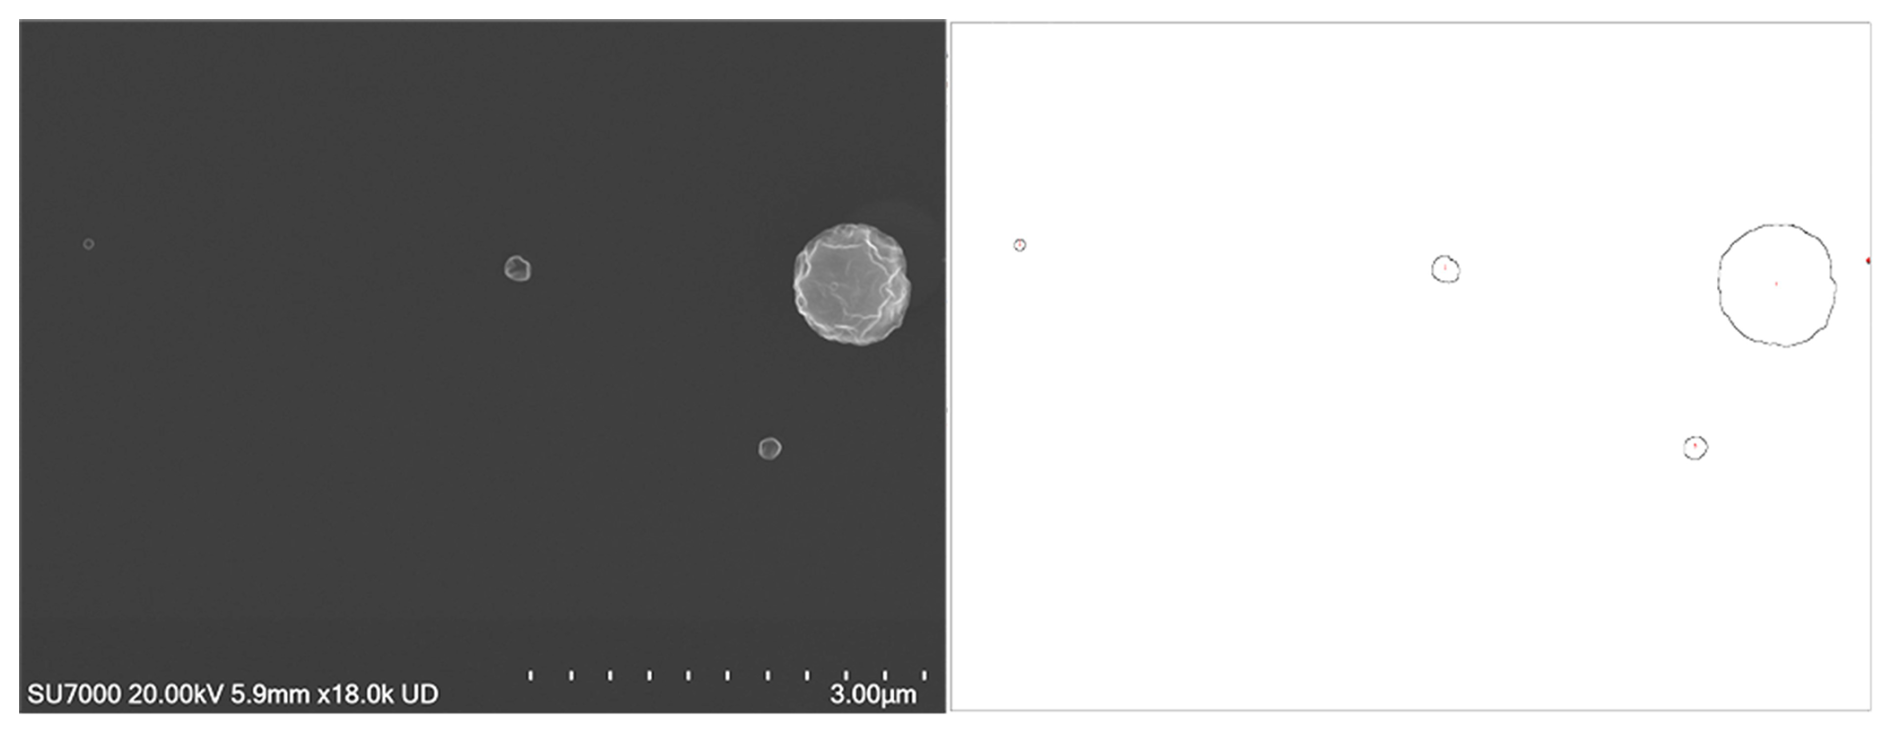
On each sample substrate, multiple grid squares at different locations were randomly investigated, and micrographs of the collected particles were captured. Subsequently, image analysis was conducted using ImageJ to determine the deposition density of the collected particles (Schneider et al., 2012). A sample of a viewing area processed by ImageJ is presented in Fig. 3. First, the micrographs were binarised and size-corrected using the image scale bar. The number, perimeter, and area of the particles in the image were then measured using the “Analyze Particles” feature. The deposition density of the collected particles was calculated by dividing the number of detected particles in each grid square by the total area of that grid square:
where D is the deposition density of the collected particles (particles µm−2), Ncount is the number of deposited particles counted using SEM (no.), and Atotal is the total area of the examined substrate (µm2). The number of particles in each viewing area (6.3 µm × 4.7 µm) was investigated and calculated for three different types of generated aerosol. The relative standard deviation in the particle count per viewing area was calculated to be below 10 % for the efficiently loaded samples, suggesting a relatively uniform deposition. To calculate this, 4500 viewing areas were randomly investigated by SEM. This uniform deposition enables a small sample of the substrate to be analysed as a representative of the entire collection on the TEM grid.
3.1 Comparison of SEM analysis with SMPS measurements
Examples of the three different aerosols collected and their PSDs are shown in Fig. 4. Following particle detection using ImageJ, measurements of particles can be conducted, yielding the area (A) and perimeter (P) of the collected particles. To convert the collected data into size distributions of particles, the area equivalent diameter (dAE) can be calculated using Eq. (2).
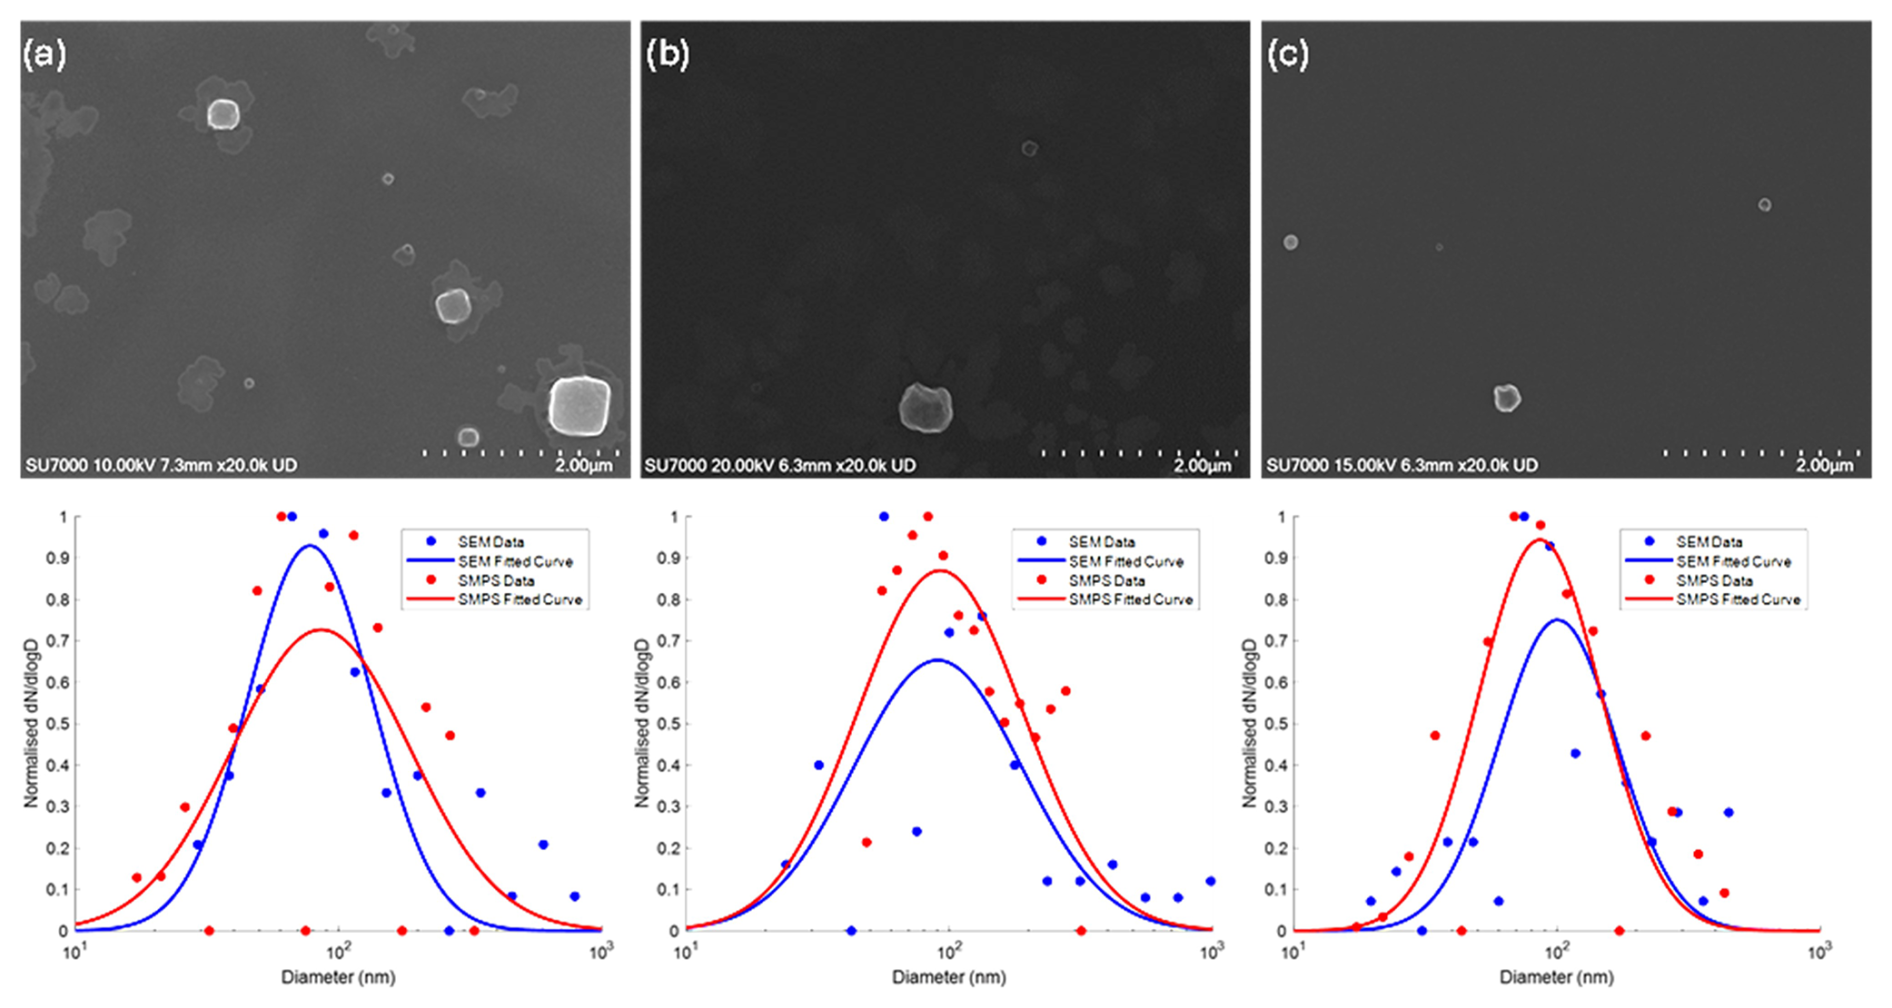
Figure 4SEM images and particle size distributions of (a) phosphate-buffered saline (PBS), (b) Dulbecco's Modified Eagle Medium (DMEM), and (c) human saliva. Particle size distributions were normalised to the maximum concentration for easier comparison between SEM and SMPS. Particle size distributions with absolute concentrations are provided in Fig. S2.
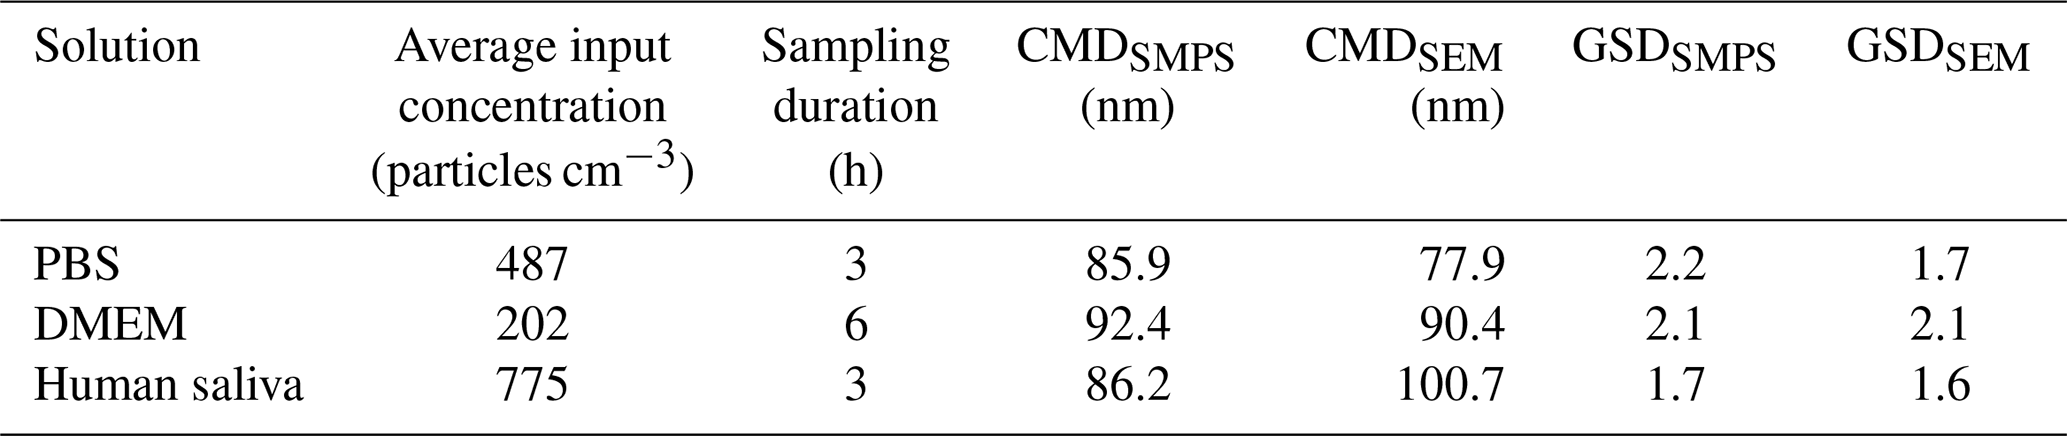
Furthermore, Fig. 4 illustrates a comparison of the PSD obtained through both SEM analysis of deposited particles using ImageJ and SMPS measurement of airborne particles. This comparison was made for PBS aerosols (Fig. 4a), DMEM aerosols (Fig. 4b), and human saliva aerosols (Fig. 4c). Spherical particle geometry was assumed for consistency between the measurement techniques. This allowed the electrical mobility diameter from SMPS to be compared with the area-equivalent diameter from SEM without requiring shape factor corrections. Table 2 outlines the average input concentration during the experiment, sampling duration, count median diameters (CMDs), and geometric standard deviations (GSDs) obtained from both SMPS and SEM for PBS, DMEM, and human saliva aerosols. The PSDs acquired by SEM analysis and SMPS measurements exhibit good agreement, affirming the validity of the setup for determining the optimal sampling time.
Table 2Properties of dry aerosol generated under different conditions by vibrating mesh nebulisers and measured by scanning electron microscopy (SEM) analysis and scanning mobility particle sizer (SMPS) measurements.
3.2 Estimating optimal sampling time
The results obtained from the SMPS measurements and SEM image analysis are presented in Table 3, which includes data for experiments conducted at low, medium, and high concentrations of PBS, DMEM, and human saliva aerosols. To compare deposition density (D) with sampling time (t) and concentration (C), a new variable, which is a product between the particle concentration and time of sampling C×t, is introduced. This variable is equivalent to the particle exposure of the grids. By applying linear regression analysis to the data and setting the intercept to zero, Eq. (3) defines the relationship between deposition density and C×t. This equation allows us to determine the ideal sampling time (in hours) for a given particle number concentration (in cm−3) or the optimal particle number concentration within a set sampling duration, given a specified optimal deposition density.
Table 3Values measured by scanning mobility particle sizer (SMPS) and scanning electron microscopy (SEM) images for phosphate-buffered saline (PBS), Dulbecco's Modified Eagle Medium (DMEM), and human saliva aerosols.
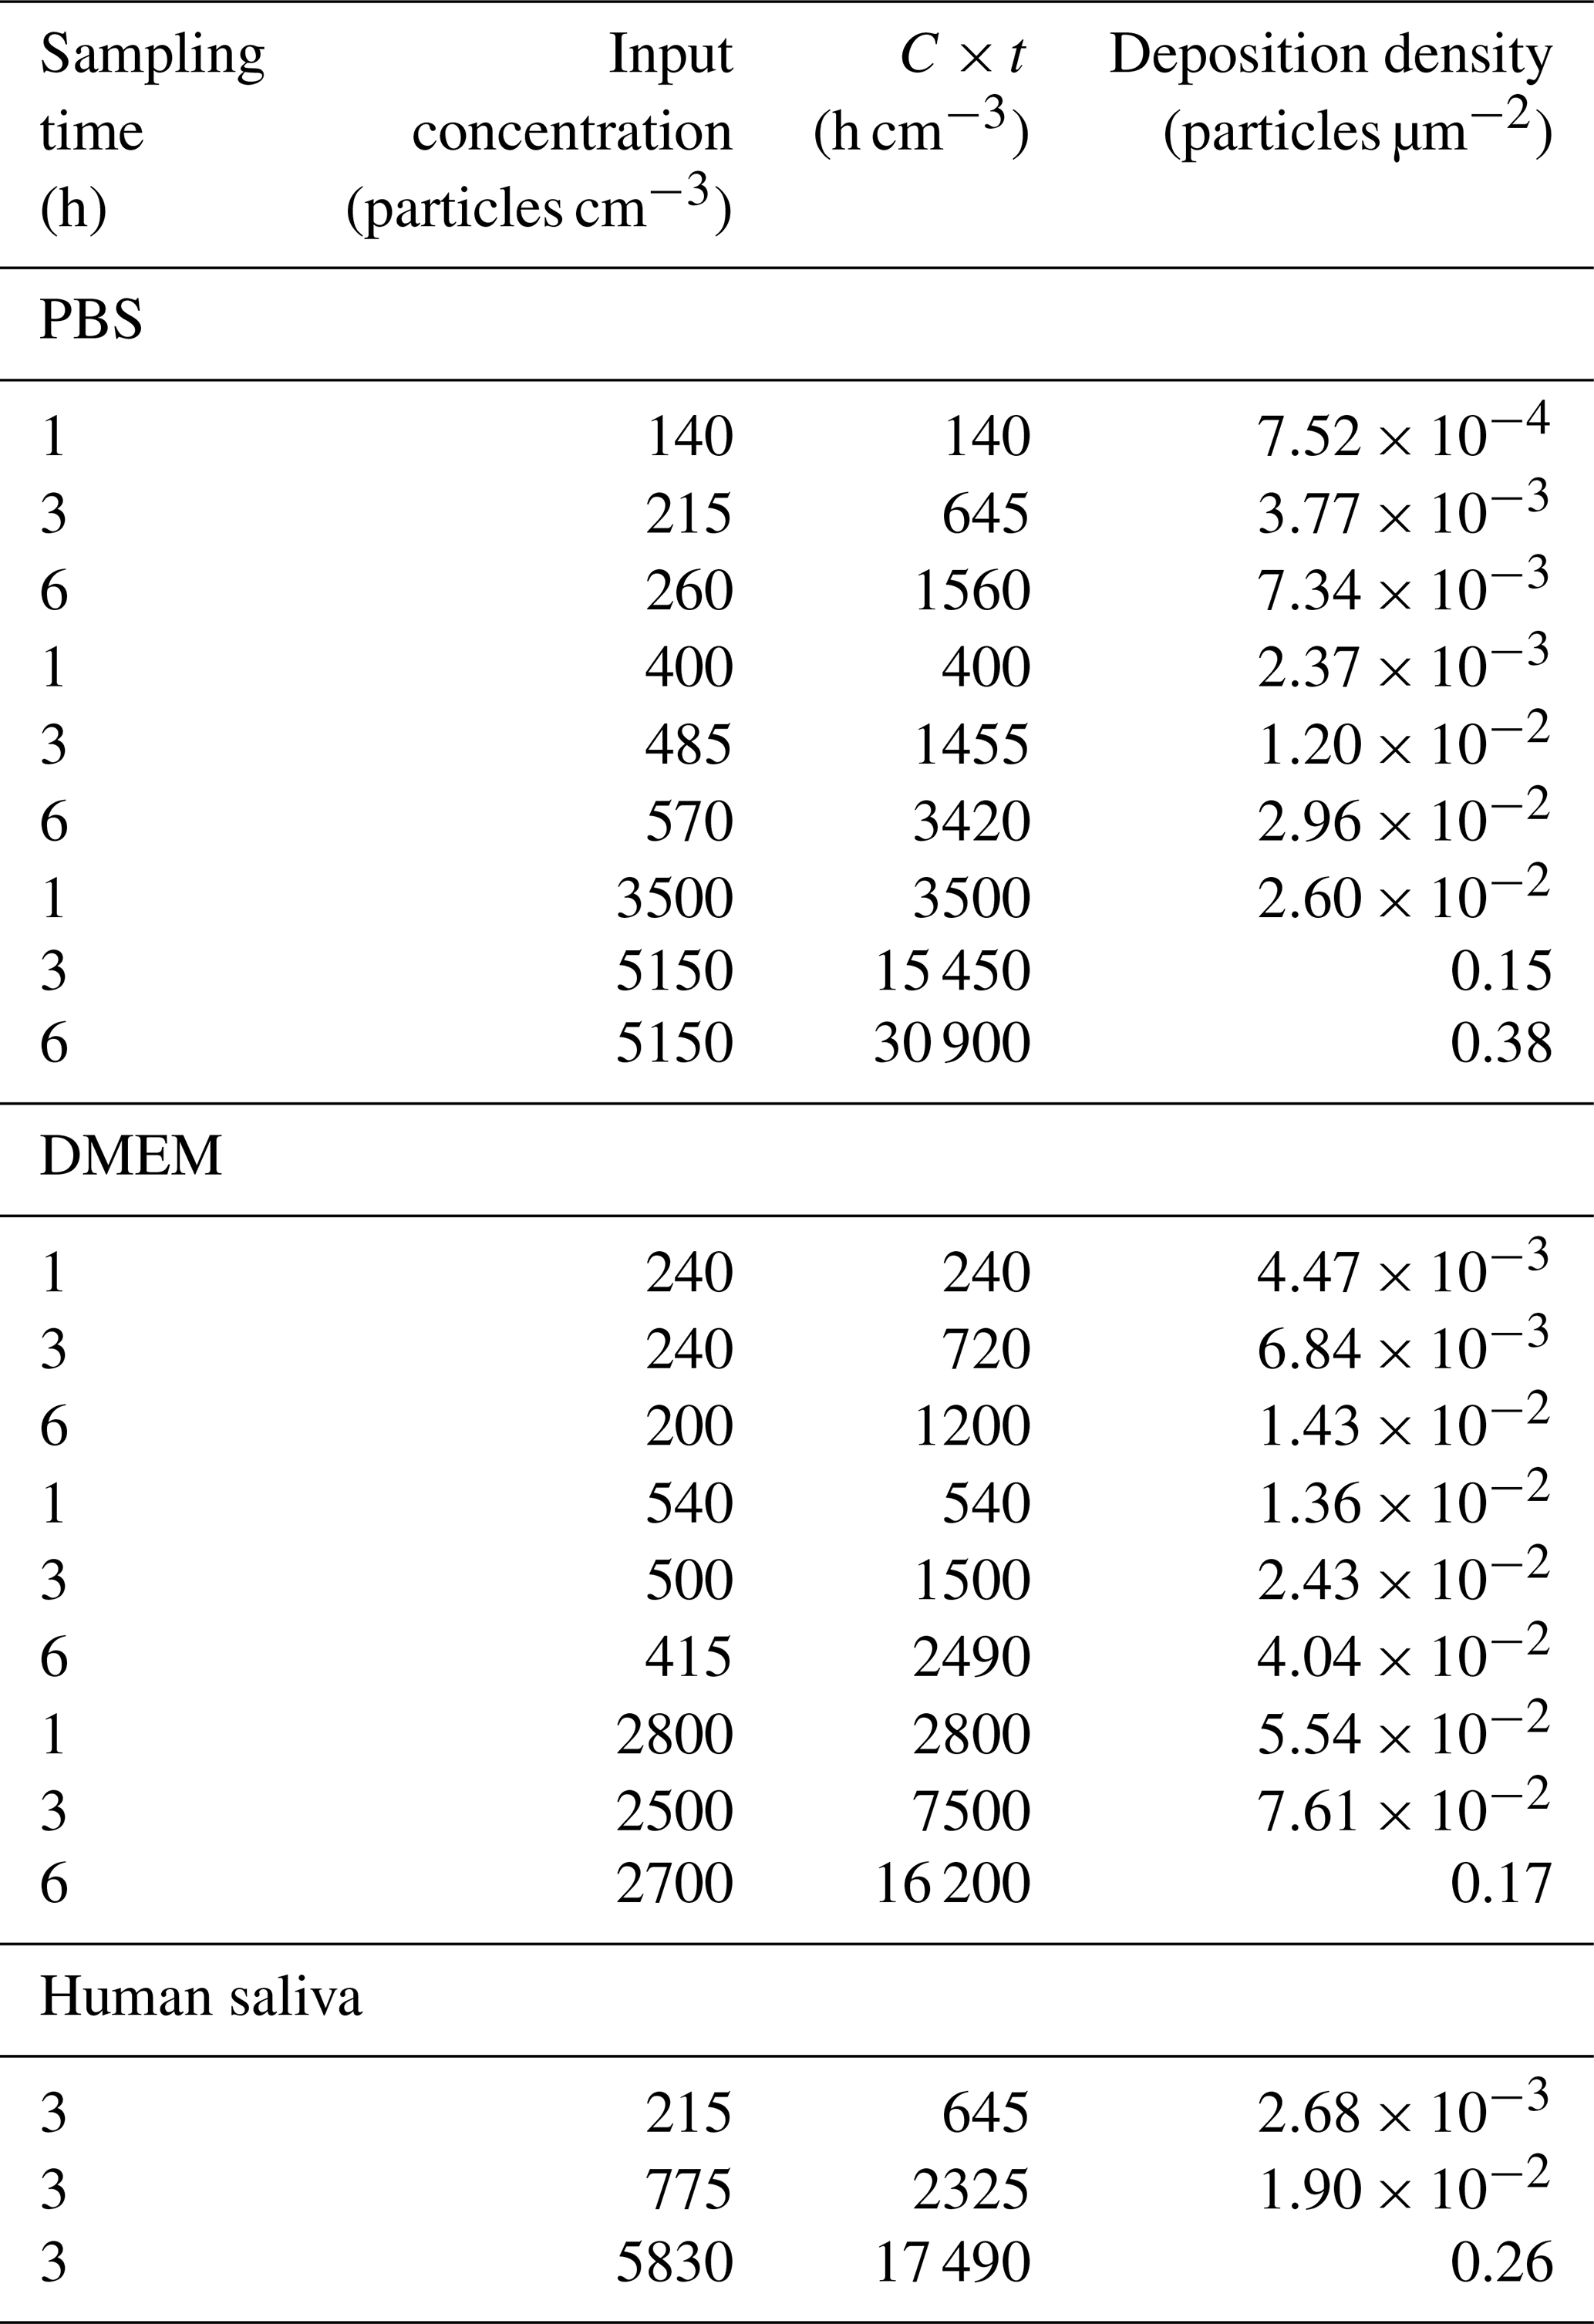
Figure 5 illustrates the plot of the linear fit to the data, along with the 95 % confidence bands. As the particle number concentration changes for several orders of magnitude, the x axis has a logarithmic scale. The regression analysis yielded a multiple R value of 0.99, indicating a strong correlation between C×t and D. The R2 value of 0.98 indicates that the regression model effectively explains the variability in the data. With a relative standard error of 2 %, the average distance between observed and predicted values is relatively low. Based on qualitative observations during this study, the suggested deposition density falls within the range of 0.015 to 0.1 µm−2. It is important to note that the relationship established in this study was for nebulised aerosols with a CMD of around 100 nm.
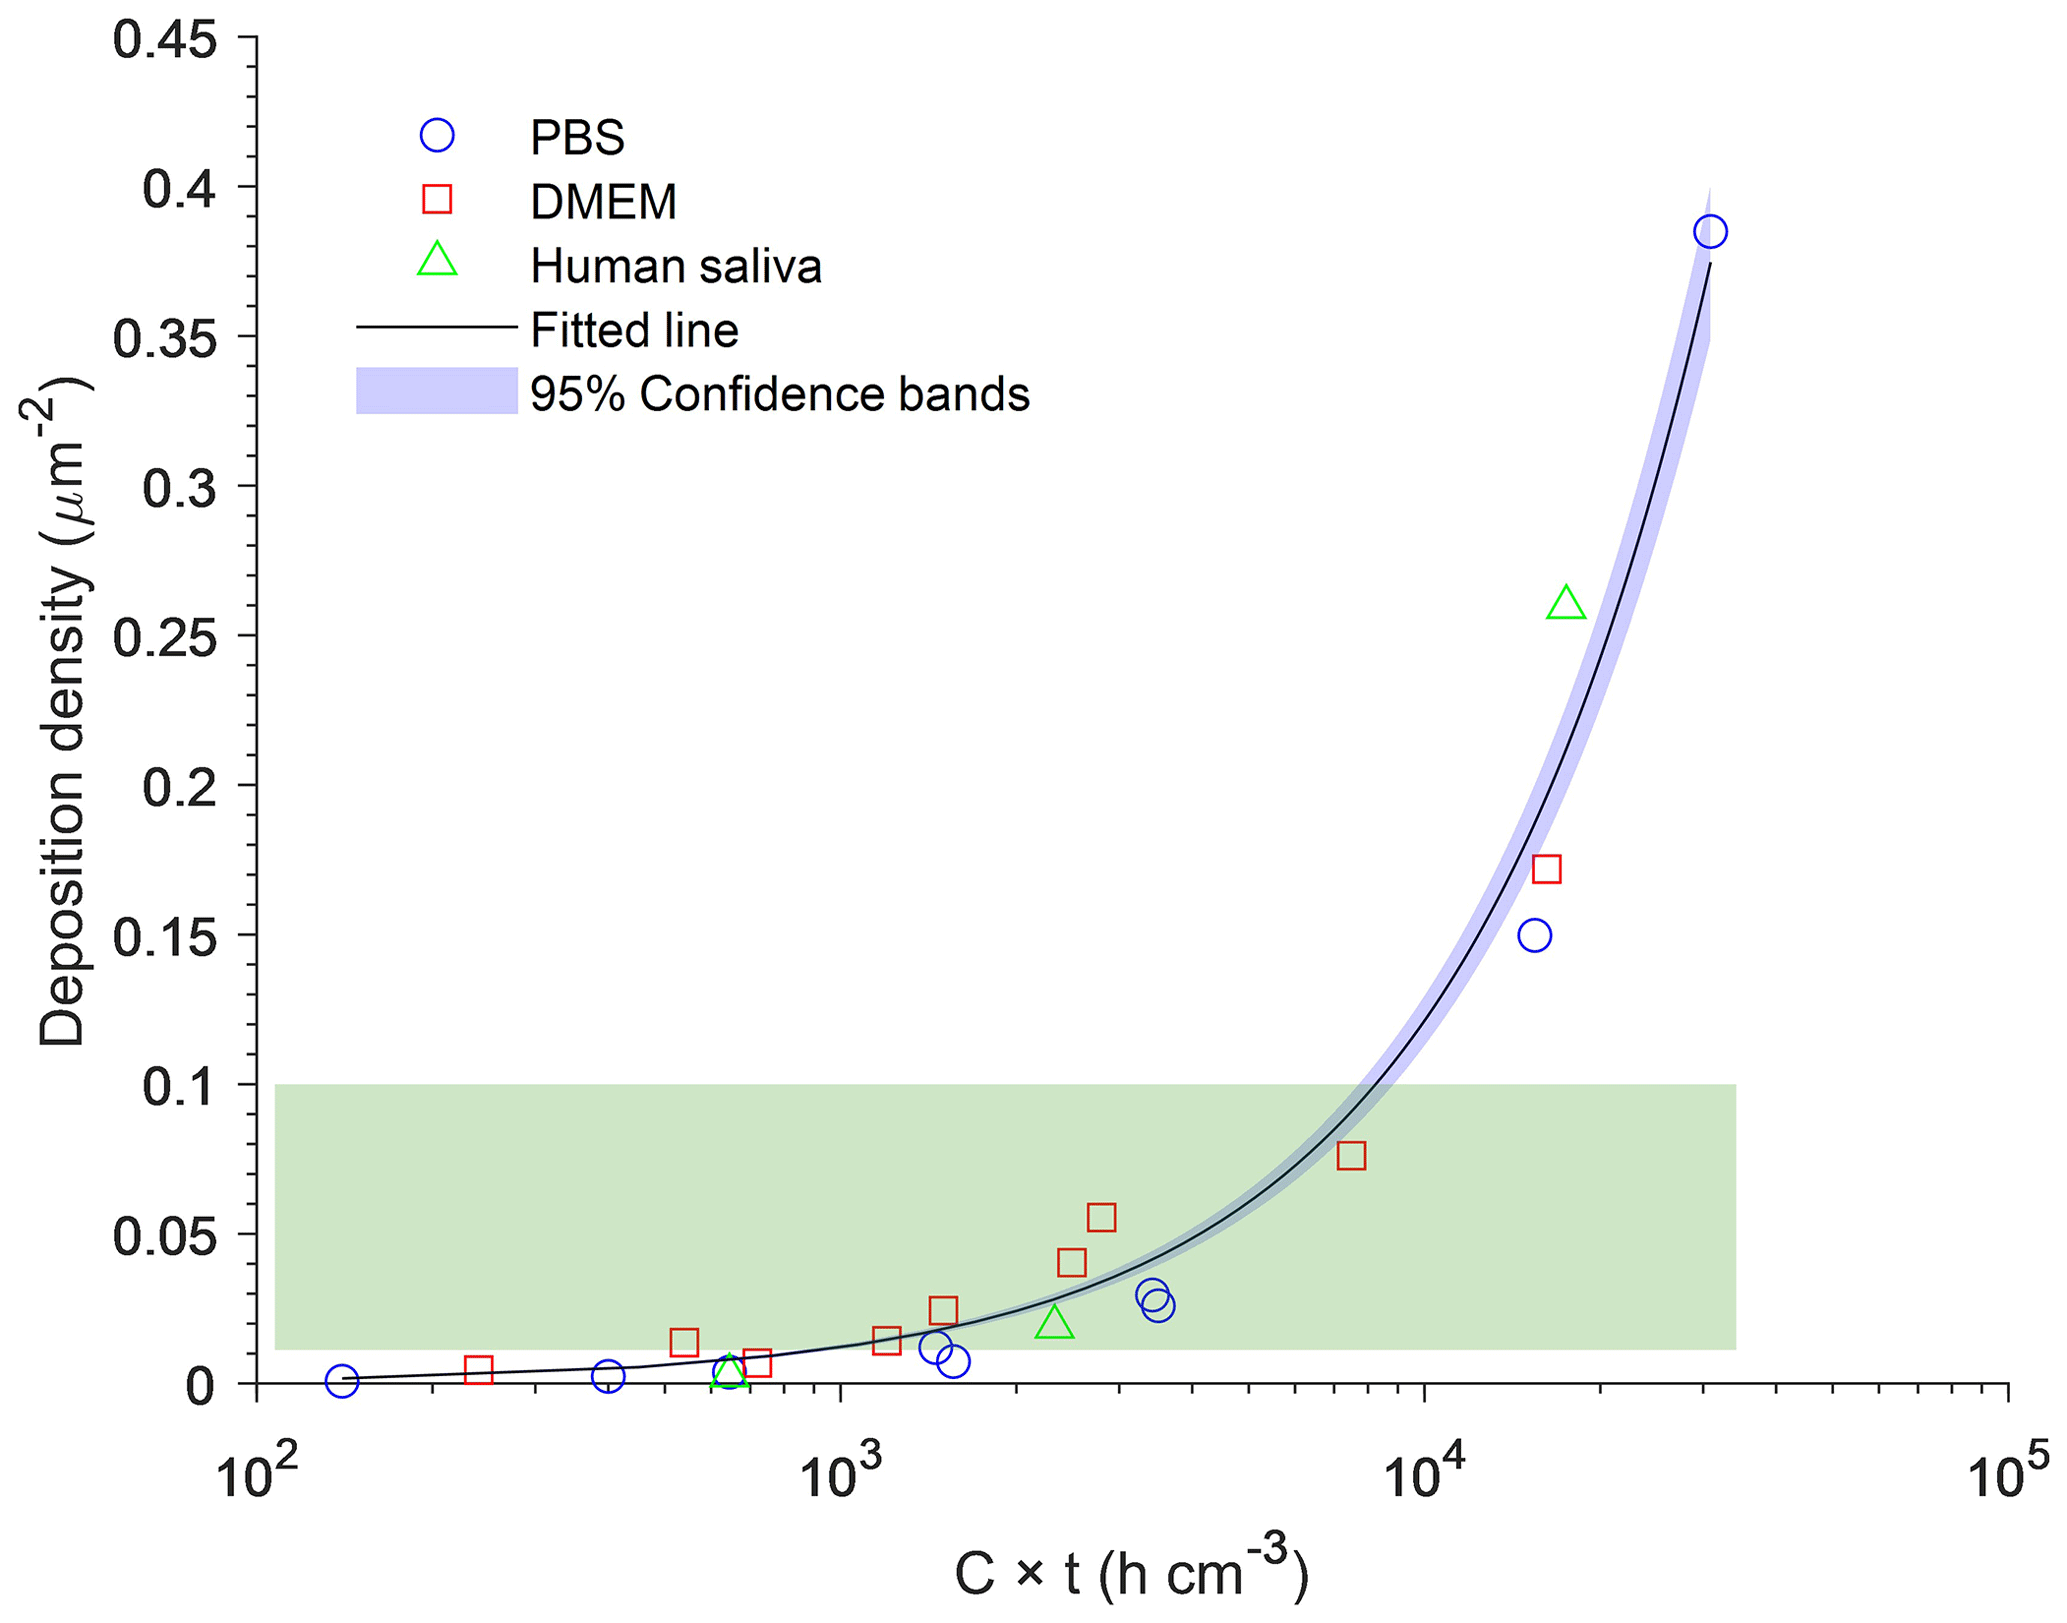
Figure 5Regression model derived for phosphate-buffered saline (PBS), Dulbecco's Modified Eagle Medium (DMEM), and human saliva aerosols collected by the TSI Nanometer Aerosol Sampler. The green box highlights the suggested range for the deposition density values, ranging from 0.015 to 0.1 µm−2.
Certain factors, such as the number of samples, particle diffusion, Brownian motion, random collisions, and potential overload in high-concentration experiments, can impact the accuracy of the model. Despite these potential influences, the model provides a robust estimation of particle deposition and enables the determination of the optimal sampling time for a given particle concentration. This ensures the identification and characterisation of an adequate number of particles in subsequent research phases. For the particle diameters examined in this study, all particles closely adhere to the derived regression model.
Furthermore, the deposition density of the NAS was found to be relatively consistent with the variations in particle morphology. Particle circularity was calculated using the formula , with both area and perimeter obtained by ImageJ. Circularity values were 0.51 ± 0.25 for DMEM, 0.57 ± 0.24 for PBS, and 0.67 ± 0.24 for human saliva, indicating a range of shapes from irregular to cubic or spherical. These results suggest that Eq. (3) can be used to estimate deposition density across a variety of particle shapes. The comprehensive evaluation of the TSI NAS 3089 instrument is critical not only for the analysis of human respiratory aerosols and their analogues, but also for a variety of applications, including marine aerosol studies (Laskina et al., 2015; Tervahattu et al., 2002), engine emissions (Dallmann et al., 2014), and indoor air quality measurements (Vestlund et al., 2014; Wittmaack et al., 2005). It is recommended that researchers utilise this model as a first-order estimate of required sampling time and extend its application to high-concentration experiments.
In this study, a linear regression model was developed to predict the optimal sampling time for a given particle number concentration or determine the optimal particle number concentration within a specified sampling duration. This model was constructed for sampling aerosols utilising a TSI NAS 3089 at a flow rate of 1 L min−1 and a voltage of −9 kV, where three different aerosol types were generated at low, medium, and high concentrations. These aerosols were subsequently collected on a TEM grid over the duration of 1, 3, and 6 h. SEM images were post-processed using ImageJ to determine deposition density, revealing a linear relationship between deposition density and the product of particle concentration and time. The recommended deposition density range of 0.015 to 0.1 µm−2 was found to be suitable for aerosols with a CMD around 100 nm. Notably, this model is effective for aerosols with an average circularity of approximately 0.56 ± 0.25, regardless of their chemical composition, and that are not agglomerated.
It is important to consider factors that may influence the accuracy of the developed linear regression model, including the number of samples, particle diffusion, Brownian motion, random collisions, and potential overload in high-concentration experiments. These considerations require attention in future investigations to refine and enhance the predictive capabilities of the model. In conclusion, the suggested linear regression model provides a valuable tool for predicting the optimal sampling time and offers researchers a reliable estimation of particle behaviour and concentration. Its applicability extends beyond the study of human respiratory aerosols, making it relevant to a wide range of aerosol research areas.
Plots in electronic format and SEM data will be provided upon request.
The supplement related to this article is available online at https://doi.org/10.5194/amt-18-1063-2025-supplement.
BA, SN, RG, BM, and ZR designed the research. BA and SN performed the research. BA, SN, RG, and ZR analysed and processed data. BA, SN, RG, BM, and ZR drafted the manuscript.
The contact author has declared that none of the authors has any competing interests.
Publisher's note: Copernicus Publications remains neutral with regard to jurisdictional claims made in the text, published maps, institutional affiliations, or any other geographical representation in this paper. While Copernicus Publications makes every effort to include appropriate place names, the final responsibility lies with the authors.
The authors would like to acknowledge the Central Analytical Research Facility (CARF) for the SEM training and assistance in its operation. Special thanks are extended to the Queensland University of Technology Design and Fabrication Research Facility (QUT DeFab) facility for their expertise and support in building the rotating drum.
This research has been supported by the Australian Research Council (grant no. DP210103284).
This paper was edited by Hartmut Herrmann and reviewed by two anonymous referees.
Almeida, J. d., Alves, A. M. H., Melo, R. F. d., Felippe, M. C. S., Bortoluzzi, E. A., Teixeira, C. d. S., and Felippe, W. T.: The sealing ability of MTA apical plugs exposed to a phosphate-buffered saline, J. Appl. Oral Sci., 21, 341–345, 2013.
Baker, A., Jickells, T., Witt, M., and Linge, K.: Trends in the solubility of iron, aluminium, manganese and phosphorus in aerosol collected over the Atlantic Ocean, Mar. Chem., 98, 43–58, 2006.
Barone, T. L. and Zhu, Y.: The morphology of ultrafine particles on and near major freeways, Atmos. Environ., 42, 6749–6758, 2008.
Bauer, P. S., Amenitsch, H., Baumgartner, B., Köberl, G., Rentenberger, C., and Winkler, P.: In-situ aerosol nanoparticle characterization by small angle X-ray scattering at ultra-low volume fraction, Nat. Commun., 10, 1122, https://doi.org/10.1038/s41467-019-09066-4, 2019.
Bel'skaya, L. V., Sarf, E. A., and Solonenko, A. P.: Morphology of dried drop patterns of saliva from a healthy individual depending on the dynamics of its surface tension, Surfaces, 2, 395–414, 2019.
Buckley, A., Warren, J., Hodgson, A., Marczylo, T., Ignatyev, K., Guo, C., and Smith, R.: Slow lung clearance and limited translocation of four sizes of inhaled iridium nanoparticles, Part. Fibre Toxicol., 14, 1–15, 2017.
Capannelli, G., Castello, E., Comite, A., Costa, C., and Mamolini, G.: Electron microscopy characterization of airborne micro-and nanoparticulate matter, J. Electron Microsc., 60, 117–131, 2011.
Dallmann, T. R., Onasch, T. B., Kirchstetter, T. W., Worton, D. R., Fortner, E. C., Herndon, S. C., Wood, E. C., Franklin, J. P., Worsnop, D. R., Goldstein, A. H., and Harley, R. A.: Characterization of particulate matter emissions from on-road gasoline and diesel vehicles using a soot particle aerosol mass spectrometer, Atmos. Chem. Phys., 14, 7585–7599, https://doi.org/10.5194/acp-14-7585-2014, 2014.
Dixkens, J. and Fissan, H.: Development of an electrostatic precipitator for off-line particle analysis, Aerosol Sci. Tech., 30, 438–453, 1999.
Facchini, M. C., Decesari, S., Rinaldi, M., Carbone, C., Finessi, E., Mircea, M., Fuzzi, S., Moretti, F., Tagliavini, E., and Ceburnis, D.: Important source of marine secondary organic aerosol from biogenic amines, Environ. Sci. Technol., 42, 9116–9121, 2008.
Groth, R., Cravigan, L. T., Niazi, S., Ristovski, Z., and Johnson, G. R.: In situ measurements of human cough aerosol hygroscopicity, J. Roy. Soc. Interface, 18, 20210209, https://doi.org/10.1098/rsif.2021.0209, 2021.
Groth, R., Niazi, S., Johnson, G. R., and Ristovski, Z.: Nanomechanics and morphology of simulated respiratory particles, Environ. Sci. Technol., 56, 10879–10890, 2022.
Groth, R., Niazi, S., Spann, K., Johnson, G. R., and Ristovski, Z.: Physicochemical characterization of porcine respiratory aerosol and considerations for future aerovirology, PNAS nexus, 2, pgad087, https://doi.org/10.1093/pnasnexus/pgad087, 2023.
Hering, S. V., Appel, B. R., Cheng, W., Salaymeh, F., Cadle, S. H., Mulawa, P. A., Cahill, T. A., Eldred, R. A., Surovik, M., and Fitz, D.: Comparison of sampling methods for carbonaceous aerosols in ambient air, Aerosol Sci. Tech., 12, 200–213, 1990.
Hinkley, J., Bridgman, H., Buhre, B., Gupta, R., Nelson, P., and Wall, T.: Semi-quantitative characterisation of ambient ultrafine aerosols resulting from emissions of coal fired power stations, Sci. Total Environ., 391, 104–113, 2008.
Johnson, G. R., Knibbs, L. D., Kidd, T. J., Wainwright, C. E., Wood, M. E., Ramsay, K. A., Bell, S. C., and Morawska, L.: A novel method and its application to measuring pathogen decay in bioaerosols from patients with respiratory disease, PLoS One, 11, e0158763, https://doi.org/10.1371/journal.pone.0158763, 2016.
Kettleson, E. M., Ramaswami, B., Hogan Jr., C. J., Lee, M.-H., Statyukha, G. A., Biswas, P., and Angenent, L. T.: Airborne virus capture and inactivation by an electrostatic particle collector, Environ. Sci. Technol., 43, 5940–5946, 2009.
Laskina, O., Morris, H. S., Grandquist, J. R., Estillore, A. D., Stone, E. A., Grassian, V. H., and Tivanski, A. V.: Substrate-deposited sea spray aerosol particles: Influence of analytical method, substrate, and storage conditions on particle size, phase, and morphology, Environ. Sci. Technol., 49, 13447–13453, 2015.
Li, C., Liu, S., and Zhu, Y.: Determining ultrafine particle collection efficiency in a nanometer aerosol sampler, Aerosol Sci. Tech., 44, 1027–1041, 2010.
Lyu, Y., Varriale, F., Malmborg, V., Ek, M., Pagels, J., and Wahlström, J.: Tribology and airborne particle emissions from grey cast iron and WC reinforced laser cladded brake discs, Wear, 556–557, 205512, https://doi.org/10.1016/j.wear.2024.205512, 2024.
Mirhoseini, S. H., Nikaeen, M., Satoh, K., and Makimur, K.: Assessment of airborne particles in indoor environments: Applicability of particle counting for prediction of bioaerosol concentrations, Aerosol Air Qual. Res., 16, 1903–1910, 2016.
Moskal, A. and Payatakes, A.: Estimation of the diffusion coefficient of aerosol particle aggregates using Brownian simulation in the continuum regime, J. Aerosol Sci., 37, 1081–1101, 2006.
Müller, T., Henzing, J. S., de Leeuw, G., Wiedensohler, A., Alastuey, A., Angelov, H., Bizjak, M., Collaud Coen, M., Engström, J. E., Gruening, C., Hillamo, R., Hoffer, A., Imre, K., Ivanow, P., Jennings, G., Sun, J. Y., Kalivitis, N., Karlsson, H., Komppula, M., Laj, P., Li, S.-M., Lunder, C., Marinoni, A., Martins dos Santos, S., Moerman, M., Nowak, A., Ogren, J. A., Petzold, A., Pichon, J. M., Rodriquez, S., Sharma, S., Sheridan, P. J., Teinilä, K., Tuch, T., Viana, M., Virkkula, A., Weingartner, E., Wilhelm, R., and Wang, Y. Q.: Characterization and intercomparison of aerosol absorption photometers: result of two intercomparison workshops, Atmos. Meas. Tech., 4, 245–268, https://doi.org/10.5194/amt-4-245-2011, 2011.
Nanometer Aerosol Sampler 3089: https://tsi.com/discontinued-products/nanometer-aerosol-sampler-3089/, last access: 10 July 2024.
Nenes, A., Krom, M. D., Mihalopoulos, N., Van Cappellen, P., Shi, Z., Bougiatioti, A., Zarmpas, P., and Herut, B.: Atmospheric acidification of mineral aerosols: a source of bioavailable phosphorus for the oceans, Atmos. Chem. Phys., 11, 6265–6272, https://doi.org/10.5194/acp-11-6265-2011, 2011.
Niazi, S., Philp, L. K., Spann, K., and Johnson, G. R.: Utility of three nebulizers in investigating the infectivity of airborne viruses, Appl. Environ. Microb., 87, e0049721, https://doi.org/10.1128/AEM.00497-21, 2021.
Park, J.-H. and Chun, C.-H.: An improved modelling for prediction of grade efficiency of electrostatic precipitators with negative corona, J. Aerosol Sci., 33, 673–694, 2002.
Pöhlker, C., Huffman, J. A., and Pöschl, U.: Autofluorescence of atmospheric bioaerosols – fluorescent biomolecules and potential interferences, Atmos. Meas. Tech., 5, 37–71, https://doi.org/10.5194/amt-5-37-2012, 2012.
Pöhlker, M. L., Pöhlker, C., Krüger, O. O., Förster, J.-D., Berkemeier, T., Elbert, W., Fröhlich-Nowoisky, J., Pöschl, U., Bagheri, G., and Bodenschatz, E.: Respiratory aerosols and droplets in the transmission of infectious diseases, Rev. Mod. Phys., 95, 045001, https://doi.org/10.1103/RevModPhys.95.045001, 2023.
Pöschl, U.: Atmospheric aerosols: composition, transformation, climate and health effects, Angew. Chem. Int. Edit., 44, 7520–7540, 2005.
Savage, N. J., Krentz, C. E., Könemann, T., Han, T. T., Mainelis, G., Pöhlker, C., and Huffman, J. A.: Systematic characterization and fluorescence threshold strategies for the wideband integrated bioaerosol sensor (WIBS) using size-resolved biological and interfering particles, Atmos. Meas. Tech., 10, 4279–4302, https://doi.org/10.5194/amt-10-4279-2017, 2017.
Schneider, C. A., Rasband, W. S., and Eliceiri, K. W.: NIH Image to ImageJ: 25 years of image analysis, Nat. Methods, 9, 671–675, https://doi.org/10.1038/nmeth.2089, 2012.
Sharma, S., Gillespie, B. M., Palanisamy, V., and Gimzewski, J. K.: Quantitative nanostructural and single-molecule force spectroscopy biomolecular analysis of human-saliva-derived exosomes, Langmuir, 27, 14394–14400, 2011.
Sobanska, S., Falgayrac, G., Rimetz-Planchon, J., Perdrix, E., Brémard, C., and Barbillat, J.: Resolving the internal structure of individual atmospheric aerosol particle by the combination of Atomic Force Microscopy, ESEM–EDX, Raman and ToF–SIMS imaging, Microchem. J., 114, 89–98, 2014.
Tervahattu, H., Hartonen, K., Kerminen, V. M., Kupiainen, K., Aarnio, P., Koskentalo, T., Tuck, A. F., and Vaida, V.: New evidence of an organic layer on marine aerosols, J. Geophys. Res.-Atmos., 107, AAC 1-1–AAC 1-8, 2002.
Verma, P., Pickering, E., Jafari, M., Guo, Y., Stevanovic, S., Fernando, J. F., Golberg, D., Brooks, P., Brown, R., and Ristovski, Z.: Influence of fuel-oxygen content on morphology and nanostructure of soot particles, Combust. Flame, 205, 206–219, 2019.
Vestlund, A. T., Al-Ashaab, R., Tyrrel, S. F., Longhurst, P. J., Pollard, S. J., and Drew, G. H.: Morphological classification of bioaerosols from composting using scanning electron microscopy, Waste Manage., 34, 1101–1108, 2014.
Wasmund, E. B., Coley, K., Shaubel, R. M., Reynolds, K. O., and Benedik, J.: A new technique to derive particle size distributions and aerosol number concentrations directly from thermophoretic data, Chem. Eng. Sci., 65, 4271–4284, 2010.
Wittmaack, K., Wehnes, H., Heinzmann, U., and Agerer, R.: An overview on bioaerosols viewed by scanning electron microscopy, Sci. Total Environ., 346, 244–255, 2005.
Yao, T. and Asayama, Y.: Animal-cell culture media: History, characteristics, and current issues, Reproductive Medicine and Biology, 16, 99–117, 2017.