the Creative Commons Attribution 4.0 License.
the Creative Commons Attribution 4.0 License.
 | 04 Mar 2025
Chilean Observation Network De Meteor Radars (CONDOR): multi-static system configuration and wind comparison with co-located lidar
Zishun Qiao
Alan Z. Liu
Gunter Stober
Javier Fuentes
Fabio Vargas
Christian L. Adami
Iain M. Reid
The Chilean Observation Network De Meteor Radars (CONDOR) commenced deployment in June 2019 and became fully operational in February 2020. It is a multi-static meteor radar system consisting of three ∼ 1° latitudinally separated stations. The main (central) station is located at the Andes Lidar Observatory (ALO; 30.25° S, 70.74° W) and is used for both transmission and reception. The two remote sites are located to the north and south and are used for reception only. The southern station is located at the Southern Cross Observatory (SCO; 31.20° S, 71.00° W), and the northern station is located at the Las Campanas Observatory (LCO; 29.02° S, 70.69° W). The successful deployment and maintenance of CONDOR provide measurements of horizontal winds in the mesosphere and lower thermosphere (MLT) and permit the retrieval of spatially resolved horizontal winds and vertical winds. This is possible because of the high meteor detection rates. Over 30 000 quality-controlled underdense meteor echoes are detected at the ALO site each day, and in total ∼ 88 000 events are detected each day over the three sites. In this paper, we present the configuration of the CONDOR system and discuss the validation and initial results of its data products. The motivations of deploying the CONDOR system also include combining measurements from other co-located ground-based instruments at the ALO site, which provide uniquely cross-validated and cross-scale observations of the MLT dynamics with multiple scientific goals.
- Article
(7642 KB) - Full-text XML
-
Supplement
(2345 KB) - BibTeX
- EndNote


The upper mesosphere and lower thermosphere is a region of very active atmospheric dynamic processes, with interactions of atmospheric waves from small-scale gravity waves to large-scale atmospheric tides and planetary waves. These waves and their interactions are key mechanisms driving the variabilities in the mesopause region as well as the thermosphere and ionosphere above. The measurement of neutral atmospheric winds is essential for studying the dynamics in this region. While medium-frequency (MF) and high-frequency (HF) radars were among the earliest radio techniques used for measuring the neutral upper atmosphere (see, e.g., Reid, 2015, and references therein), the meteor radar technique has gained significant popularity in the past 2 decades due to its reliability, easy deployment, small footprint, and significantly improved meteor detection capability (Hocking et al., 2001b; Elford, 2004). Modern specular meteor radars derive neutral winds by detecting Doppler shifts in specular radio echoes from the plasma trails formed during meteor ablation, which appear more or less randomly in space and time in the region between 70 and 110 km altitude. With sufficient accumulation of such detections, a mean neutral wind can be inferred. This technique is proven to be able to provide unbiased wind measurements based on comparison with accurate high-resolution sodium (Na) lidar measurements (Liu et al., 2002; Franke et al., 2005b).
A typical mono-static meteor radar measures horizontal winds at nominally 1 h temporal and 2 km vertical resolutions. The resolution of meteor radar winds is primarily limited by the number of detected meteors. More meteor detections within a given time interval and spatial volume lead to more accurate and/or higher-resolution wind measurements. In recent years, meteor signals have also been explored to infer neutral atmosphere temperature (e.g., Tsutsumi et al., 1994; Hocking, 1999; Yi et al., 2016; Liu et al., 2017) and density (e.g., Stober et al., 2012; Younger et al., 2015; Yi et al., 2018), as well as gravity wave variances and momentum flux (e.g., Hocking, 2005; Liu et al., 2013; Spargo et al., 2019). All these applications would benefit from increased meteor detections, which contribute to reducing the uncertainties in these difficult-to-acquire quantities (see, e.g., Vincent et al., 2010).
Table 1Various meteor radars around the world, with their transmitter frequency, peak transmitting power, and daily detection of underdense meteors that can be used for wind measurements. These radars are grouped by model and ranked by peak power, as their meteor detection rates depend closely on the peak power and frequency. DrAAMER: Drake Antarctic Agile Meteor Radar, SAAMER: Southern Argentina Agile Meteor Radar, SKiYMET: All-Sky Interferometric Meteor Radar. The SKiYMET model is a meteor radar system developed jointly by Genesis Software Pty Ltd of Australia and Mardoc Inc of Canada, and the ATRAD model is a meteor radar system built by ATRAD Pty Ltd.
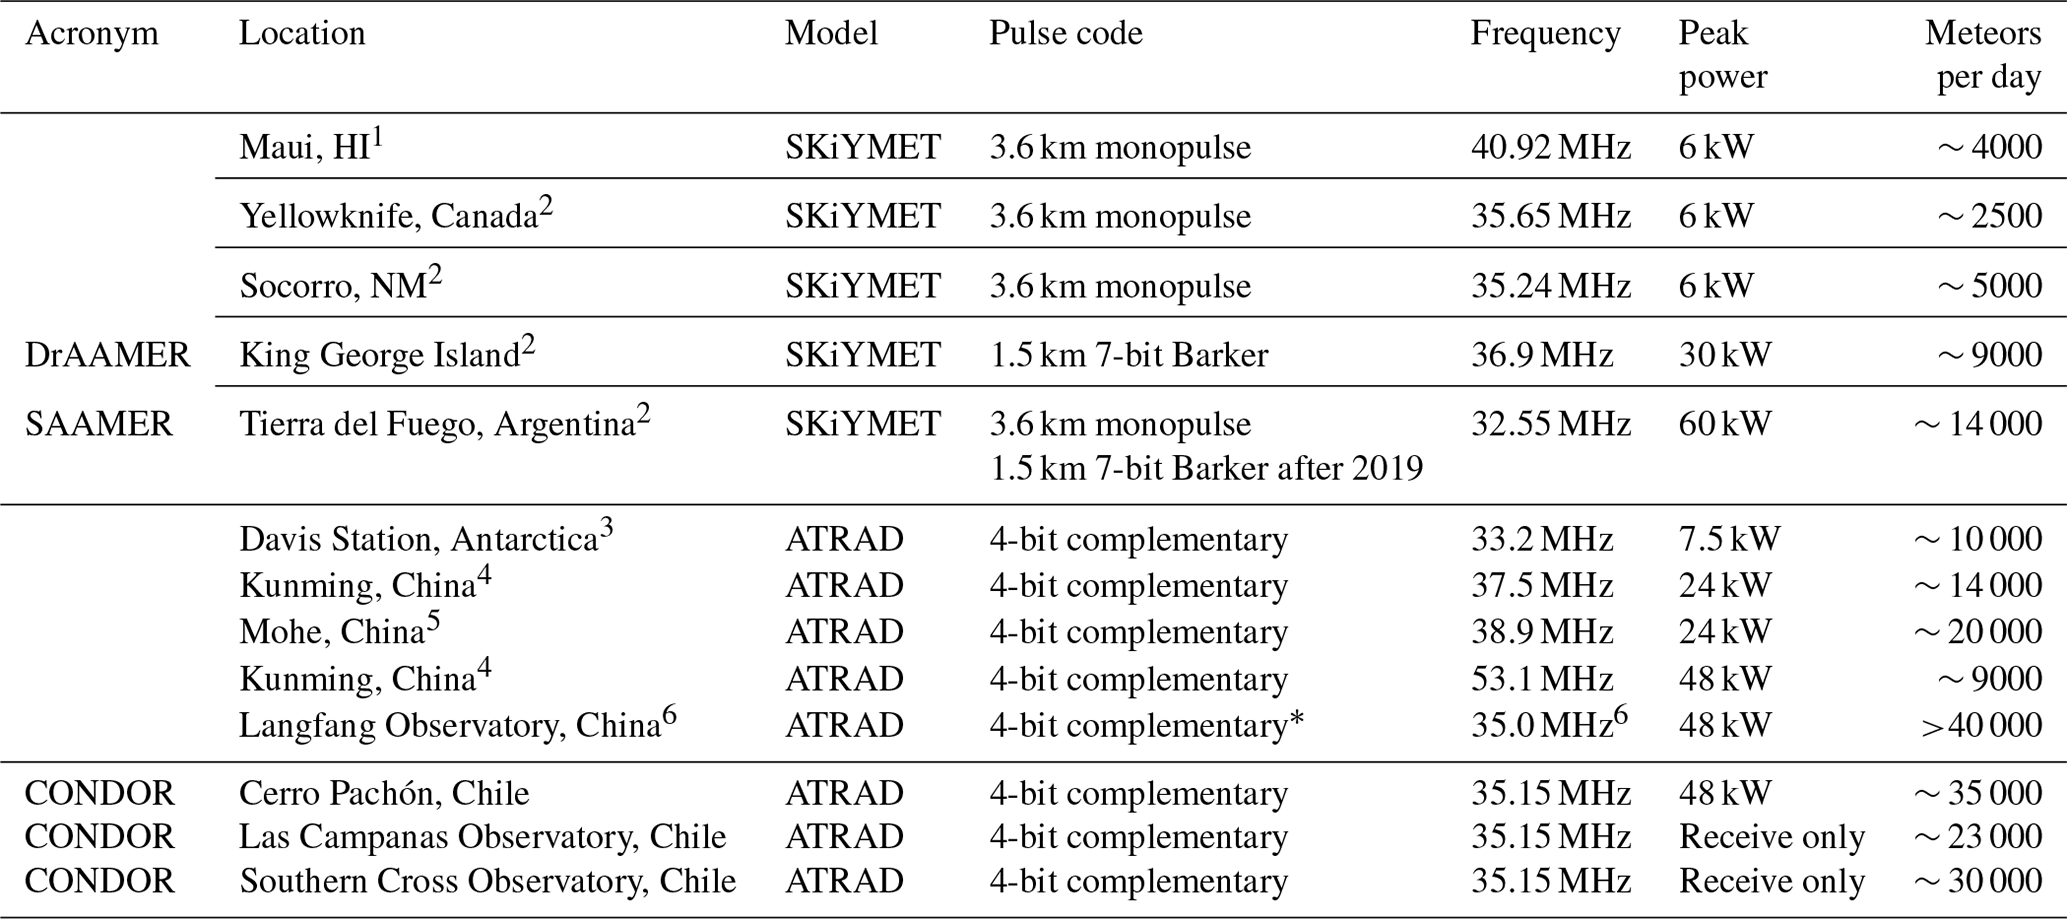
1 Franke et al. (2005b). 2 Fritts et al. (2012). 3 Holdsworth et al. (2008). 4 Yi et al. (2018). 5 Liu et al. (2017). 6 Xu et al. (2024).
* Meteor mode operation of the Langfang dual-frequency stratospheric–tropospheric (ST) meteor radar.
The detection rate of meteor radars has increased over the years with improvements in their peak power, electronics, and detection algorithms. Table 1 lists several selected meteor radar systems around the world, including their transmitting frequency, peak power, and average daily detection of underdense meteor trails used for wind measurements. The meteor radars are arbitrarily selected to illustrate the dependence of the detection rate on the transmitted power and frequency. It is evident that higher-power systems are capable of detecting more meteors and systems with similar powers show varying detection counts at different locations, largely due to different operating frequencies and levels of background radio noise. Lower-frequency meteor radars can detect more meteors due to the longer wavelength of the radio wave, which is more sensitive to meteor trails with smaller electron line densities as full wave-scattering models demonstrate (Poulter and Baggaley, 1977; Stober et al., 2021a, 2023b). A typical 6 kW system at around 35 MHz can detect a few thousand meteors per day, while a 40 kW system can detect about 20 000.
In addition to increasing the transmitting power, an innovative approach to increasing meteor detection rates without additional transmitters is the use of multi-static meteor radar systems. The concept involves using additional receiving antennas to detect both backward and forward scattering from specular meteor echoes. This approach has a very long history, being used for studies of turbulence (Roper and Elford, 1963; Muller, 1974) and for studies of mesosphere and lower-thermosphere (MLT) winds (Deegan et al., 1970). The latter study indicated the potential of measuring the 2D structure of the horizontal wind using multi-static pulsed radar and attempts to do that. The technique has also previously applied for meteor orbit determination (see, e.g., Jones et al., 2005; Stober and Chau, 2015; Reid, 2024, and references therein). It was revisited using modern equipment for MLT wind observations by Stober and Chau (2015), and several other multi-static meteor radars have been developed more recently (e.g., Spargo et al., 2019; Conte et al., 2021; Yi et al., 2022). This low-cost addition to an existing “mono-static” system can significantly increase meteor detections without the full expense of a meteor radar transmitting station. The multi-static meteor radar system introduced by the current study was designed and developed by ATRAD Pty Ltd (https://www.atrad.com.au, last access: 20 February 2025). This system, named the Chilean Observation Network De Meteor Radars (CONDOR), consists of a main station at the Andes Lidar Observatory (ALO) in Cerro Pachón, Chile, together with receiving antennas and two remote stations with receiver-only antennas located 138 km north and 108 km south of ALO, respectively. The CONDOR system installation began in northern Chile in June 2019, with the final installation at the northern remote station completed in February 2020, making the meteor radar system fully operational since then. As listed in Table 1, the number of combined average daily meteor detections from the three sites of CONDOR is ∼ 88 000, about 15 to 20 times greater than a typical 6 kW system.
This paper describes the installation of the aforementioned meteor radar system, its initial results, and the use of neutral atmospheric wind measurements made by the Na wind–temperature lidar at ALO to assess the performance of the winds measured by this meteor radar. Section 2 details the multi-static system configuration of the CONDOR system. Section 3 summarizes the routine data products as well as the validation of wind measurements, while Sect. 4 discusses the potential applications of CONDOR measurements.
The geographical layout of the CONDOR system is illustrated in Fig. 1, with two remote sites located to the north and south of the main station, ALO. All three sites are astronomy observatories with good infrastructure and engineering support and have good potential for deploying and operating optical remote sensing instruments together with the meteor radar considering their excellent seeing conditions (∼ 300 clear nights per year). The northern site, Las Campanas Observatory (LCO; 29.02° S, 70.69° W; elevation of 2339 m), is located in Chile's Atacama Desert and approximately 100 km northeast of the city of La Serena, inside one of the world's highest and driest regions, and has not yet been affected by light pollution. The southern site, Southern Cross Observatory (SCO; 31.20° S, 71.00° W; elevation of 1140 m), is a tourist observatory operated by the municipality of Combarbalá in Cerro Peralito in the Coquimbo Region of Chile. Though it is only 3.5 km away from downtown, light pollution is still negligible. The central site, Andes Lidar Observatory (ALO; 30.25° S, 70.74° W; elevation of 2520 m), is located near the summit of Cerro Pachón and managed by the Association of Universities for Research in Astronomy (AURA). Multiple upper-atmosphere instruments have been deployed at ALO since 2009, including a sodium (Na) wind–temperature lidar, a mesospheric temperature mapper, and an all-sky airglow imager (see, e.g., Vargas et al., 2022; Liu et al., 2016, and references therein).
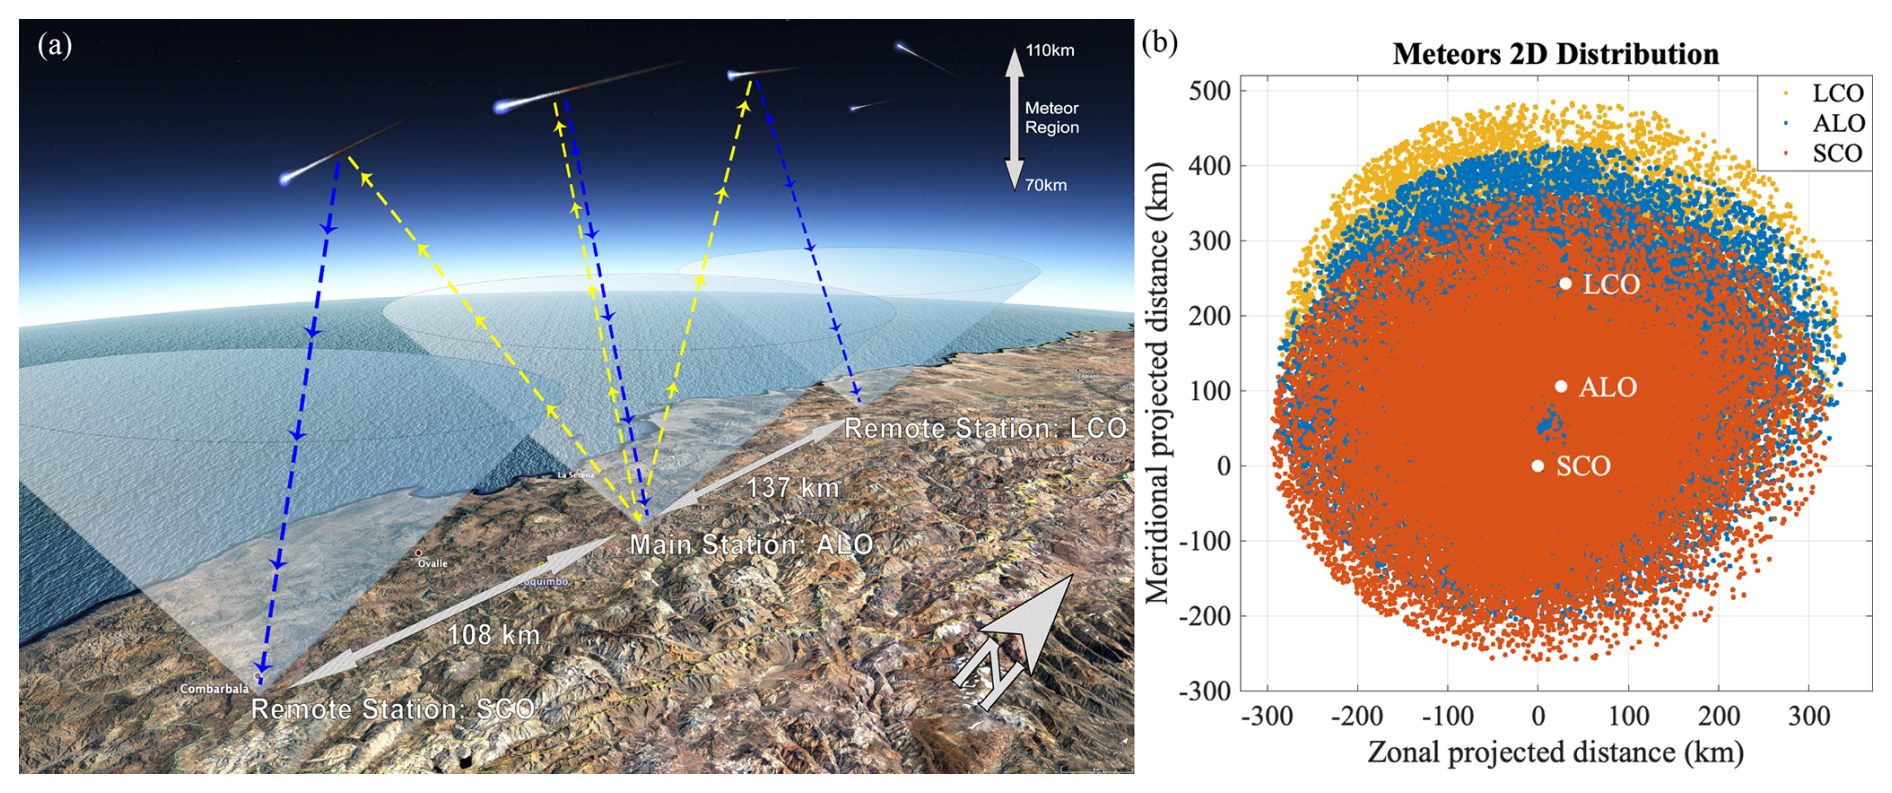
Figure 1(a) Schematic layout of the CONDOR multi-static system. The background is adapted from © Google Earth over northern Chile. The dashed yellow arrow lines denote the transmitting signals, and the dashed blue arrow lines denote the receiving signals and their directions. The cones represent the field of view (FOV) of good detections, of which the error codes are zeros. Note that the FOVs are larger and more overlapped in the meteor region. (b) The projected 2D distribution of detected good meteor events in 1 d (1 March 2020) at LCO (yellow), ALO (blue), and SCO (red), respectively. The solid white dots denote the relative geo-locations of three sites, and x and y axes mark the distance from SCO.
The CONDOR meteor radar was manufactured and installed by ATRAD Pty Ltd, a commercial atmospheric radar company that has built and installed more than 30 meteor radars over the world. The CONDOR transmitter and receiver system was first installed at ALO, and the work was completed by 26 June 2019. SCO and LCO are receiver-only sites. A receiver-only system was installed at SCO next and became operational on 13 July 2019. The receiver-only system at LCO began operation on 24 February 2020. CONDOR uses a high-power folded crossed-dipole antenna for transmission, which is designed to provide “all-sky” illumination (Reid et al., 2018). CONDOR also incorporates a GPS-disciplined oscillator at each site that provides the GPS-locked time and frequency. The receiving antenna array at each site consists of five crossed-dipole antennas arranged as an interferometer using either a cross or “T” arrangement, with baseline separations of 2λ and 2.5λ in two orthogonal axes on a plane. Such an array is often called a Jones array (Jones et al., 1998). The receiving array layout at LCO has a T shape, and ALO and SCO have a cross layout. The operating frequency of the CONDOR system is 35.15 MHz, the pulse repetition frequency is 430 Hz, the range resolution is 1800 m, and the peak transmitting power is 48 kW. Note that the 2.52 km elevation at ALO should be of particular consideration regarding the geometry for determining the height of detected meteors, compared to the other meteor radars located near sea level (see the height determination described in Younger, 2011). Before all sites became operational, the ALO meteor radar software was configured to use the mono-static analysis technique, while at SCO the analysis software used the bi-static forward-scattering technique. Once all three sites became operational on 24 February 2020, the analysis software at ALO was also configured to use the same algorithm for bi-static configuration. For ALO the bi-static algorithm is applied with a very small distance between the transmitter and receiver. This provides better consistency in signal processing as well as easier incorporation of geometric factors such as the elevation differences among three sites. The distances from ALO to SCO and from ALO to LCO are ∼ 108 and ∼ 137 km, respectively (illustrated in Fig. 1a), which are values similar to the ∼ 118 km distance in the MMARIA experiment (Stober and Chau, 2015).
Figure 1b provides the 2D projected meteor distributions detected by all three sites during 1 d, in which the detections are identified as “good” events, meeting further data-processing criteria. A typical number of quality-controlled underdense meteor echoes at ALO is over 30 000 d−1 and is ∼ 88 000 d−1 when echoes from three sites are combined. This is several times larger than a typical mono-static meteor radar (e.g., some of the meteor radars listed in Table 1) and notably improves the quality of atmospheric parameter estimation. While the software at each of the three sites processes its meteor detections and produces routine data products independently, combining all the echoes in the overlapping volume (as shown in Fig. 1b) can reduce the uncertainties in wind estimation (see, e.g., Zhong et al., 2021). More sophisticated data processing can also be developed to resolve small-scale structures within the overlapping volume. For instance, Stober et al. (2023a) present a case study of identifying volcanic gravity waves utilizing the CONDOR latitudinal keograms, from ∼ 27 to ∼ 33° S. Some of the advanced algorithms for atmospheric parameter estimation are discussed in Sect. 4.
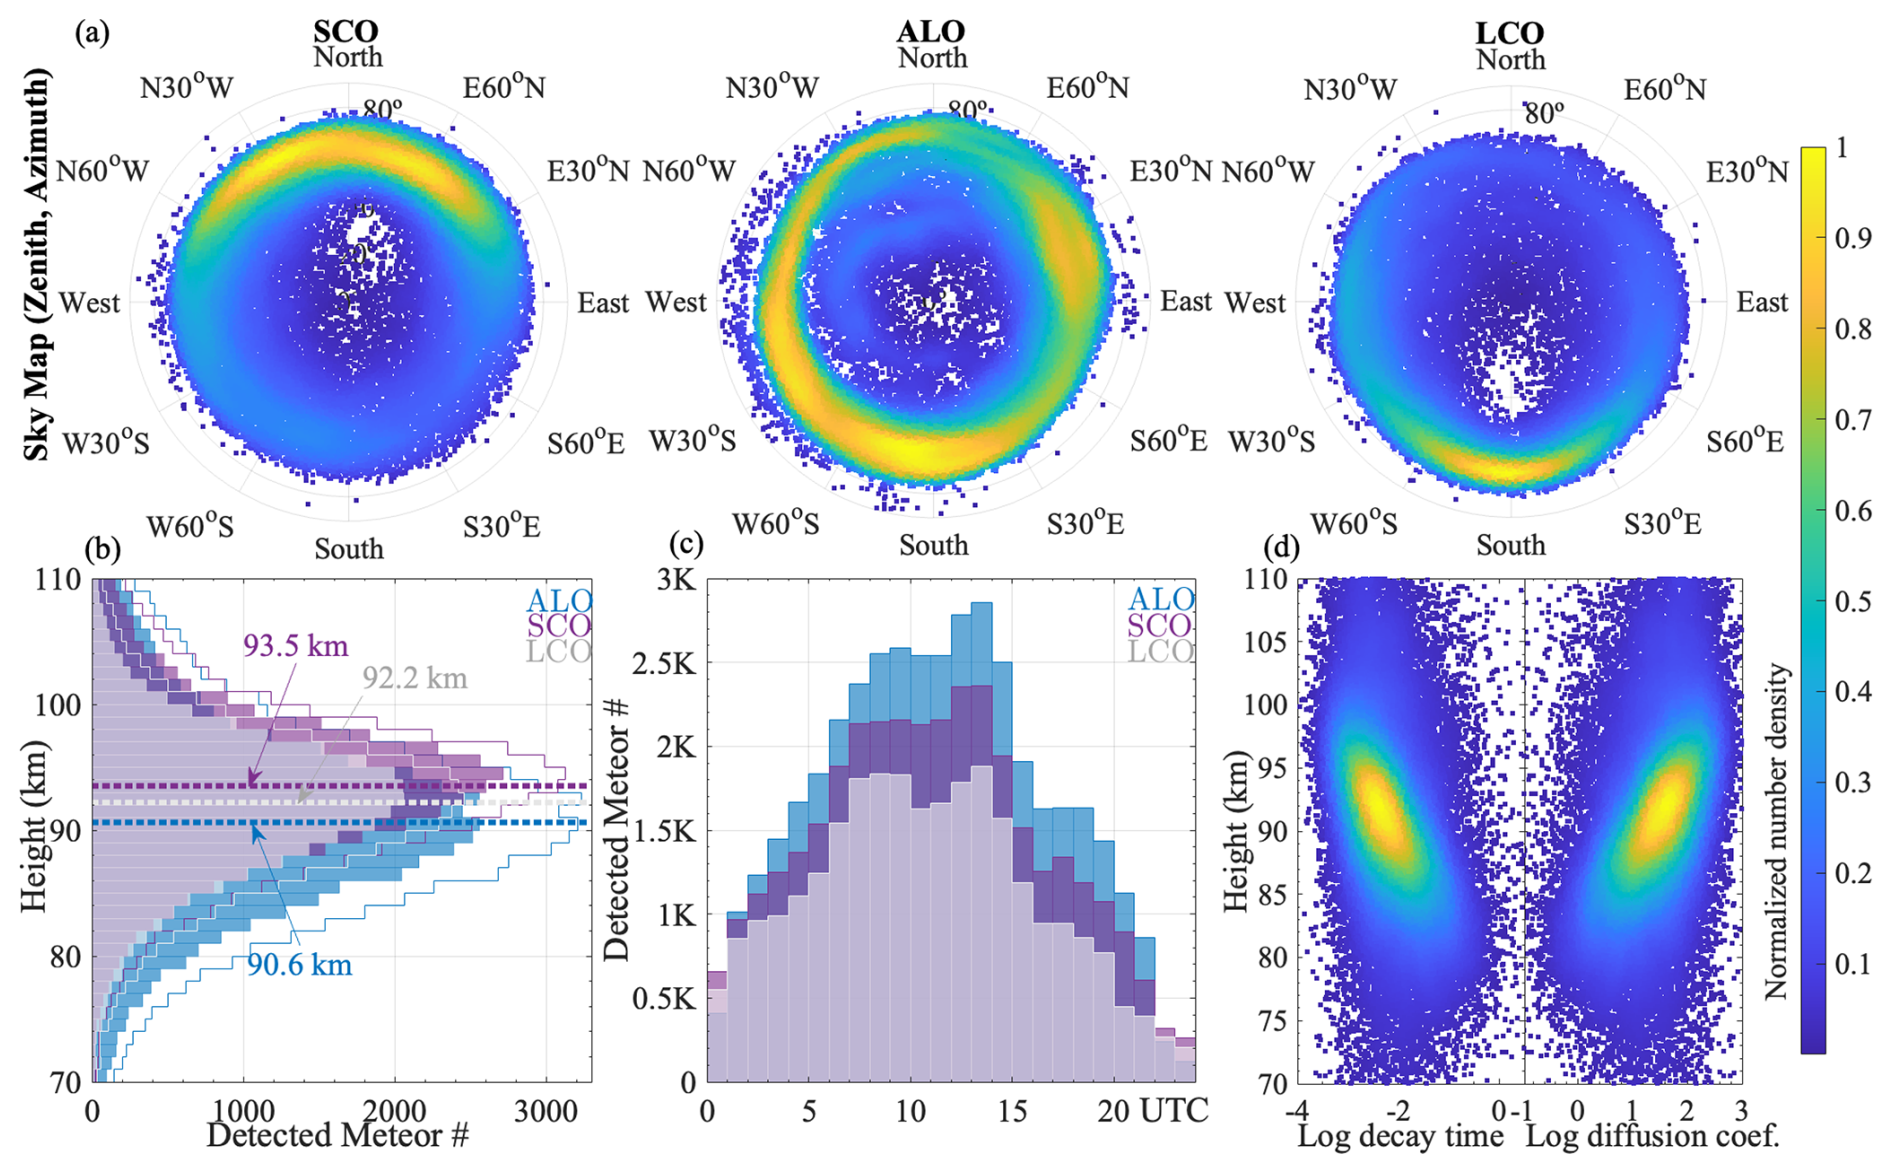
Figure 2Meteor detections in 1 example day (1 March 2020), plotted as (a) sky maps at three sites, (b) height distribution, and (c) time distribution in UTC. Panel (d) shows the meteor plasma trails' decay time and diffusion coefficient. Note that panels (a) and (d) share the same color map, which represents the normalized number density.
Having introduced the multi-static system layout of CONDOR, we now present an overview of its daily detections. The characteristics of detected meteor echoes are shown in Fig. 2 for 1 d (1 March 2020). Only the underdense echoes that can be used for wind estimated are included here (Holdsworth et al., 2004), and the overdense signals are discarded from the raw data (see, e.g., Younger, 2011). Figure 2a displays the sky maps of meteor detections at each site. Note that the color presents the normalized number density of detected events. The most dense areas of the detections fall between SCO and ALO, as well as LCO and ALO, which are in between the transmitter and the receivers. To provide a brief overview of the ratio of good detections, the non-shaded areas in Fig. 2b are meteor detections in total including all error codes, while the shaded areas are those of zero error codes. The height distributions at each site is quasi-Gaussian, with the peak heights varying between 90 and 95 km. The peak heights at SCO and LCO are both higher than that at ALO, by 2.9 and 1.6 km, respectively, as presented by the horizontal lines in Fig. 2b. The difference in peak height is consistent with the overall height distribution and is expected in the way that the forward-scattering peak height is higher than the backward-scattering peak height. This is consistent with the results from other multi-static meteor radar experiments or recently deployed networks (see Stober and Chau, 2015, Fig. 5, and Spargo et al., 2019, Fig. 1b) and is due to the longer effective Bragg wavelength. In addition, the meteor detection rate has a clear diurnal variation as is observed in all meteor radar locations (Fig. 2c). For CONDOR, the detection rates are highest around 12:00–13:00 UTC (08:00–09:00 LT, local morning) and lowest at around 23:00 UTC (19:00 LT, local evening). Such local time dependence has also been shown in other multi-static meteor radar measurements (see Chau et al., 2021, Fig. 2g, and Yi et al., 2022, Fig. 2c). Another important measured parameter is the meteor trail decay time, which is related to the ambipolar diffusion coefficient. Figure 2d shows an example of the relationship of meteor trail decay time and the ambipolar diffusion coefficient versus height, which could be used to derive layer-averaged temperature.
The overall CONDOR meteor detection rates and their spatiotemporal distributions align with the expectation for multi-static meteor radar networks, and the detection rates at each CONDOR station rank among the highest in existing multi-static meteor radar networks and campaigns. For instance, the BP–Mylor bi-static meteor radar achieves around 10 000 and 6000 detections per day at its main and remote stations, respectively (see Spargo et al., 2019, Fig. 1a), while the CONDOR stations – LCO, SCO, and ALO – have daily detection rates of approximately 23 000, 30 000, and 35 000, respectively. Similarly, the two highest-performing SIMONe Peru stations present detection rates comparable to the LCO and SCO sites (see Chau et al., 2021, Fig. 2g), although the other three stations have relatively lower rates. However, in combination, their five stations achieve a substantial daily count. In addition, the main site of the Mengcheng–Changfeng bi-static meteor radar exhibits a detection rate similar to that of LCO with a lower detection rate at its remote station (see Yi et al., 2022, Fig. 2c). The high detection rates of CONDOR facilitate the high-resolution wind measurements presented in the following sections.
This section discusses the validation and comparison of the routinely derived and most commonly used zonal and meridional winds. With the meteor radar system running 24 h d−1, except for some occasional power outages, CONDOR is continuously providing estimations of the zonal and meridional winds as its routine data product, with three temporal resolutions of 15 min, 30 min, and 1 h and a vertical resolution of 2 km. Daily counts of valid meteor detections and winds plots are displayed on the ALO website (https://andesnetwork.org/data/mr/, last access: 20 February 2025). Correlation analysis of winds measured at three sites is first performed, and its detail is described in Sect. 3.1, in which the promising high correlation coefficients confirm the robustness of wind measurements. We further compare the winds at ALO with the wind measurements of a co-located sodium lidar. While lidar wind has higher vertical and temporal resolutions but less temporal coverage than meteor radar, considerable consistency is exhibited between the simultaneously measured winds by these two instruments. Gain factors between the two wind datasets from meteor radar and lidar are also computed to discuss the different sensitivities to their measured variabilities (i.e., winds), and the detail is described in Sect. 3.2.
3.1 Cross-site validation of CONDOR winds
The cross-site validation of CONDOR winds is performed by comparing the simultaneously measured hourly winds from two of the three sites, utilizing measurements in 1 example month (1–31 January 2021) with a vertical coverage from 70 to 110 km and resolution of 2 km. Scatterplots of the coincident winds at three sites are displayed in Fig. 3, in which the colors denote normalized number density. The majority of zonal winds appear to vary from 50 m s−1 westward to 100 m s−1 eastward (top row), and the meridional winds are mostly in a range of −100 to 100 m s−1 (bottom row). It is expected that the high dense area (yellow) and the overall distribution (blue) are close along the red reference line, which is determined by y=x. Correlation coefficients (CCs) are also indicated in the plots and have values of ∼ 0.8–0.9. The correlation coefficient (ρ) of two datasets (A, B) is computed as , where cov(A,B) denotes the covariance and σ is the standard deviation. This confirms the overall consistency of wind observations at all sites. Note that the range of zonal winds is different from that of meridional winds, with the zonal wind dominated by eastward wind at this latitude, while the meridional wind oscillates around zero. The shape or broadness of the scatter distribution pattern is related to the range of winds in general. Although in January 2021 the simultaneous meridional winds appear to be more highly correlated than the zonal winds, it is noted that the meridional wind has a more diverse range in each calendar month (not shown) and leads to different values of CCs. CCs of monthly comparisons for 1 year are in the range of ∼ 0.7–0.9, sometimes CC(u) > CC(v), sometimes vice versa. Seasonal variation in the scatterplot distribution is also noted as the distribution of the meridional winds could have a broader pattern than that of the zonal winds in some months (not shown), which is possibly related to the small-scale meridionally propagating fluctuations or tidal variations over the ∼ 1–2° latitudinal difference between three sites.
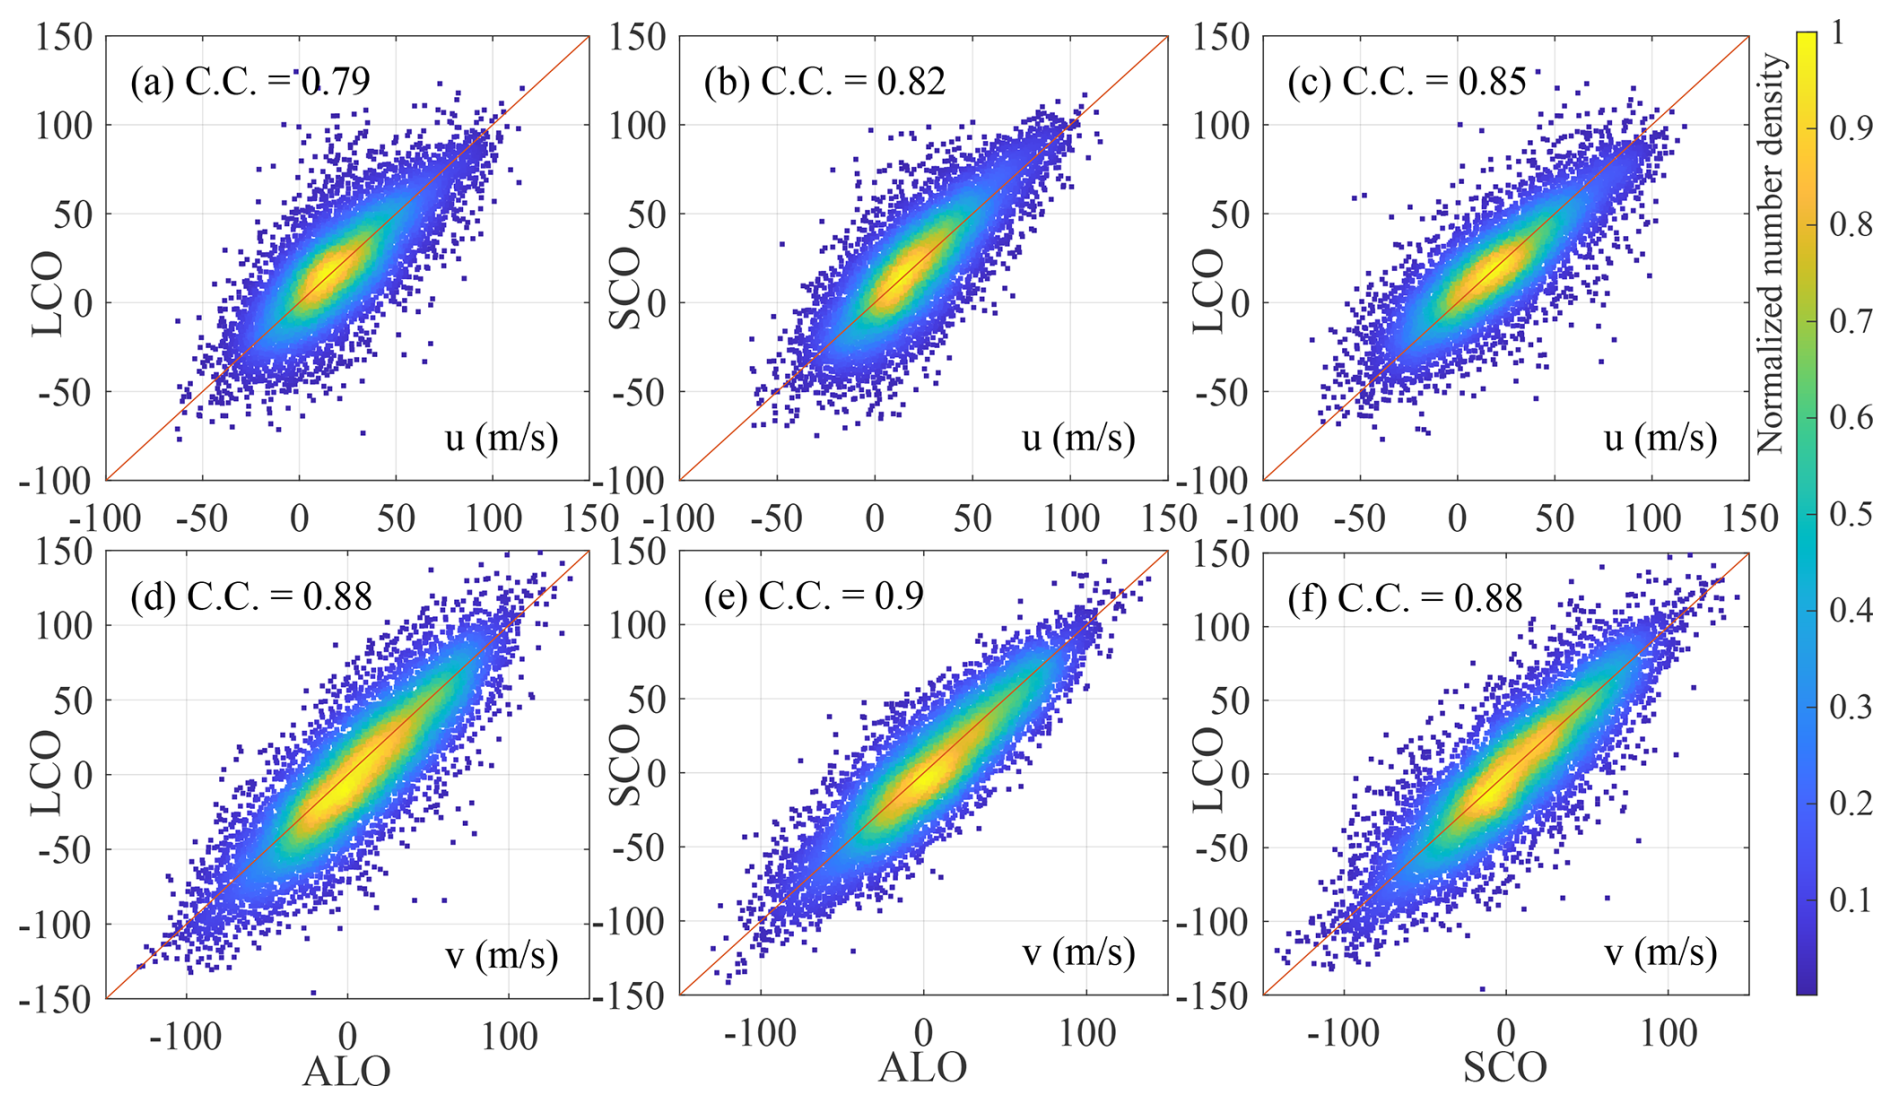
Figure 3Scatterplots of simultaneous hourly zonal (u) and meridional (v) winds measured at ALO, SCO, and LCO, with correlation coefficients (CCs) noted in the top left of each panel. The top row plots the zonal-wind comparison, and the bottom row presents the meridional-wind comparison. Red reference lines are y=x. The color map denotes normalized number density, and data from 1 to 31 January 2021 are utilized.
3.2 Meteor radar and lidar wind comparison
With the comparisons of CONDOR hourly winds from all three sites presented above, we now conduct the comparison of winds from meteor radar and a co-located sodium (Na) lidar at ALO. Note that several optical astronomical telescopes are also located on the Cerro Pachón ridge alongside ALO due to its favorable seeing conditions, since the nearby LCO shares similar atmospheric conditions and has median seeing values ranging from 0.6–0.7 arcsec (Thomas-Osip et al., 2008). The good seeing conditions also ensure a high signal-to-noise ratio for lidar measurements. This co-located Na lidar measures the neutral atmosphere wind, temperature, and sodium density at 0.5 km vertical and 6 min temporal resolution and has been deployed at ALO since 2009. The reliability and signal level of this Na lidar were increased after a system upgrade in 2014, which extends the measurements up to the lower thermosphere (140 km) when the thermospheric Na layer appears (Liu et al., 2016) and provides the capability of detecting turbulence parameters (Guo et al., 2017). Specifically, the neutral wind is measured by detecting the Doppler shift in the sodium D2a line (see, e.g., She et al., 1991; Papen et al., 1995; Gardner, 2004) through a three-frequency technique, taking advantage of the much larger backscatter cross section of sodium atoms available in the mesopause region due to the meteor ablation. Comparisons of a joint dataset of winds from lidar and meteor radars were conducted by Liu et al. (2002) for measurements at Starfire Optical Range, New Mexico, and Franke et al. (2005b) for measurements at Maui Space Surveillance Complex, Hawaii. Since Franke et al. (2005a) attributed the root mean square difference in the meteor radar and lidar winds primarily to the much higher vertical resolution of lidar measurements, it is of particular interest in comparing the high-resolution (15 min × 2 km) CONDOR winds with lidar winds, which is notably improved from the previous spatiotemporal resolution of meteor radar winds of 1 h × 4 km utilized in Franke et al. (2005a) and 1 h × 6 km utilized in Liu et al. (2002).
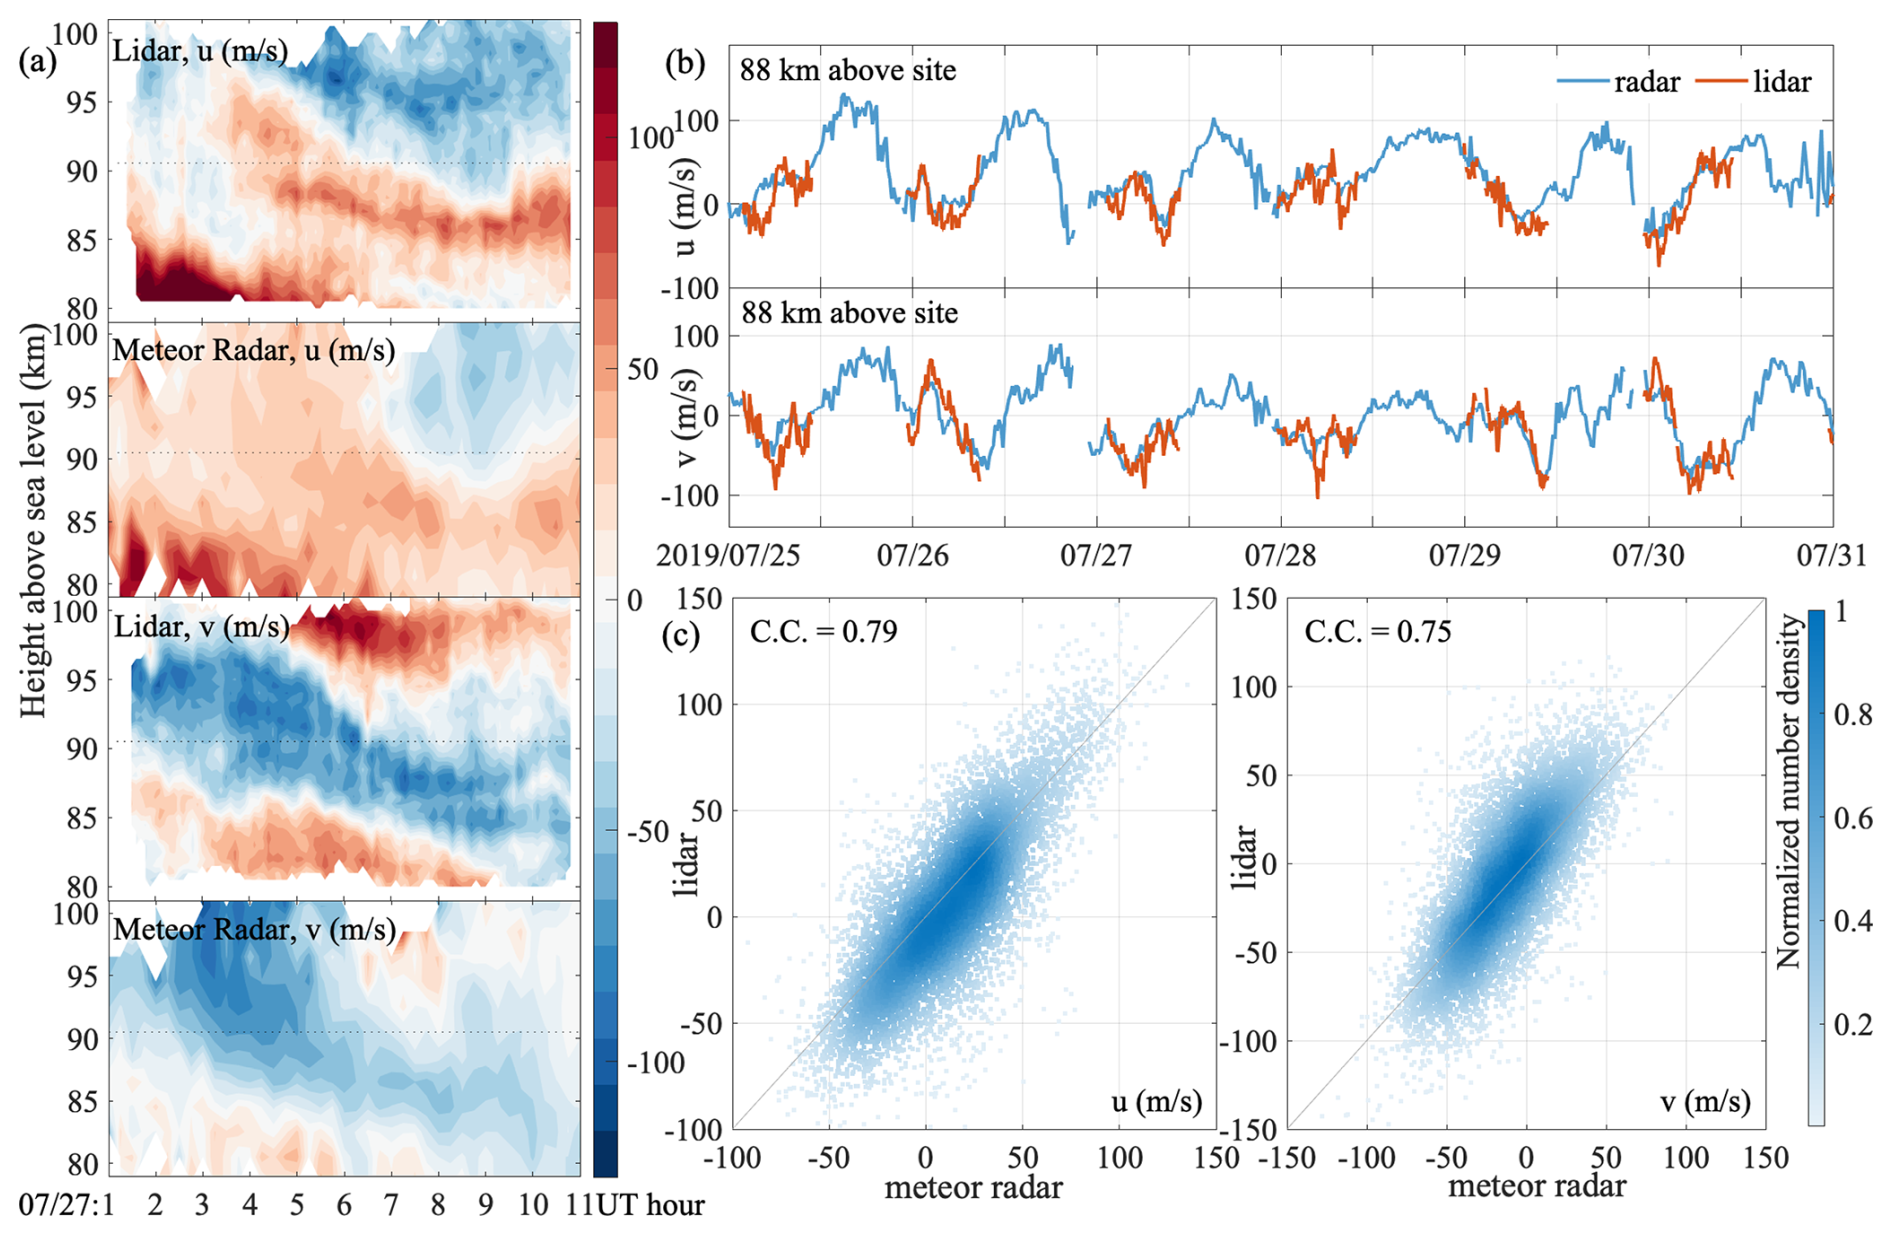
Figure 4(a) Simultaneous lidar and meteor radar winds on 27 July 2019 at 01:00–11:00 UTC. The temporal and spatial resolutions of lidar winds are 6 min and 0.5 km, and those of meteor radar winds are 15 min and 2 km. (b) Vertically averaged lidar winds (6 min, 2 km) compared to meteor radar winds (15 min, 2 km) at 88 km height above the site, from 25 to 31 July 2019. (c) Scatterplot of the coincident lidar and meteor radar winds interpolating to same spatiotemporal resolution of 15 min and 2 km.
After the CONDOR–ALO site became operational in late June 2019, the Na lidar at ALO was operated for several nights every month in the second half of 2019. The collection of Na lidar data has been interrupted since March 2020 due to instrumental issues and the following pandemic. Coincident lidar measured zonal and meridional winds are available for 47 nights in the date range of 28 June–7 July, 25 July–7 August, 24 August–5 September, and 22 September–5 October in the year 2019. Such joint measurements are hereby utilized for the comparison between lidar and CONDOR–ALO winds. Note that before the system changeover of CONDOR (on 24 February 2020), the height data were recorded as the height above site elevation, and the more commonly accepted height above sea level (a.s.l.) should take into account an additional 2.52 km at ALO. The vertical coverage of CONDOR–ALO winds used here is therefore 72.52–112.52 km a.s.l., and that of the joint lidar winds is 80–105 km a.s.l. Figure 4a shows the direct comparison of coincident lidar and meteor radar winds during the example night of 27 July 2019 with their original spatiotemporal resolutions, i.e., 15 min × 2 km for CONDOR winds and 6 min × 0.5 km for lidar winds. It appears that the phase, amplitude, and variation in the large-scale fluctuations (e.g., tides) are captured with overall good agreement in the zonal and meridional winds of two instruments. However, the lidar winds exhibit more detailed structures than radar winds, such as the two layers of southward meridional wind at ∼ 85 km at around 07:00–10:00 UTC in lidar data and the one layer in meteor radar data. For statistical comparisons with the meteor radar winds we further re-grid the lidar winds to match the spatiotemporal resolution of meteor radar winds. Figure 4b presents the lidar (red) and meteor radar (blue) winds at the same vertical resolution but at their original temporal resolution (6 and 15 min), and Fig. 4c displays the point-to-point comparison of meteor radar and degraded lidar winds (15 min × 2 km). The height of winds in Fig. 4b corresponds to the reference lines (dotted black) in Fig. 4a. Although differences could be noted in Fig. 4b, particularly relating to small-scale variations, the overall tendency of the two datasets is convincingly robust and consistent. This is further confirmed by the high correlation coefficients, as indicated in Fig. 4c, of which the values are 0.79 for the zonal winds and 0.75 for the meridional winds. It is also noted that the lidar winds show a consistent trend of having a value larger than that of meteor radar winds in Fig. 4c, which is more thoroughly discussed in the regression analysis below.
Following the method proposed in Hocking et al. (2001a) and Liu et al. (2002), a statistical comparison of the sensitivity of the co-located lidar and meteor radar wind measurements is performed. This method could be generally applied to two datasets from two instruments measuring the same physical quantity but having different accuracies regarding variabilities. The datasets of {xi} and {yi} are written as and , where vi and g0vi are the variabilities detected by the two instruments, respectively; δxi and δyi are the deviations; and the gain factor g0 represents a measure of the relative amplitude of the variability in two measurements. Using the same notation and assumption of the probability density function of vi, δx, and δy described in Hocking et al. (2001a), the aforementioned expression of xi and yi could relate to the gain factor g0 and the variances of deviations of two measurements (, ) in the way that , , and . Ensemble averages are denoted by 〈〉. If we replace with the variance of xi (which is, ), replace with , and replace 〈xiyi〉 with the covariance sxy, then g0 could be expressed as
If we divide Eq. (1) by Eq. (2),
Therefore, with computed variance and covariance of the two datasets (i.e., known , , and sxy), Eqs. (2) and (3) could be understood as the gain factor g0 being a function of only σx and σy, respectively. Note that the deviations from the “accurate” wind could be a combination of systematic errors and random errors. Although it is assumed that both meteor radar and lidar measure the exact same winds, in reality the fields of view of the two instruments and the processing techniques are different. Hence, the variances of the two datasets not only reflect the intrinsic instrumental error but also contain information about the difference between the actual quantities that the two instruments are measuring (Liu et al., 2002).
We now substitute variables with the subscript x(y) in Eqs. (1)–(3) with lidar (meteor radar) winds and discuss the relationships of g0 as a function of σlidar or σradar, as presented in Fig. 5a and b with artificially given σ values sampling from 0 to 25 m s−1. The crossing points of two curves have g0=0.76 for zonal wind and g0=0.67 for meridional wind. At σu=0, gradar=1.02, while glidar=0.63, and at σv=0, gradar=0.98 and glidar=0.55. These numbers are similar to those obtained in Liu et al. (2002). Figure 5c presents the values of g0 at different heights with the assumption that the estimated errors in lidar winds could approximately represent σlidar; i.e., the values of g0 are computed by revisiting Eq. (2) with a known σx. Note that only heights with sufficient joint data points (> 1000) are plotted. As can be seen, the values of g0 are always less than 1 for both zonal and meridional winds. This can be interpreted as indicating that the variability in meteor radar winds is generally smaller than that of lidar winds. This observation aligns with the understanding that lidar measurements are confined to a smaller volume of the atmosphere, rendering them more susceptible to atmospheric perturbations. Meteor-radar-measured mean winds tend to have smaller variability due to the average over the entire field-of-view volume.
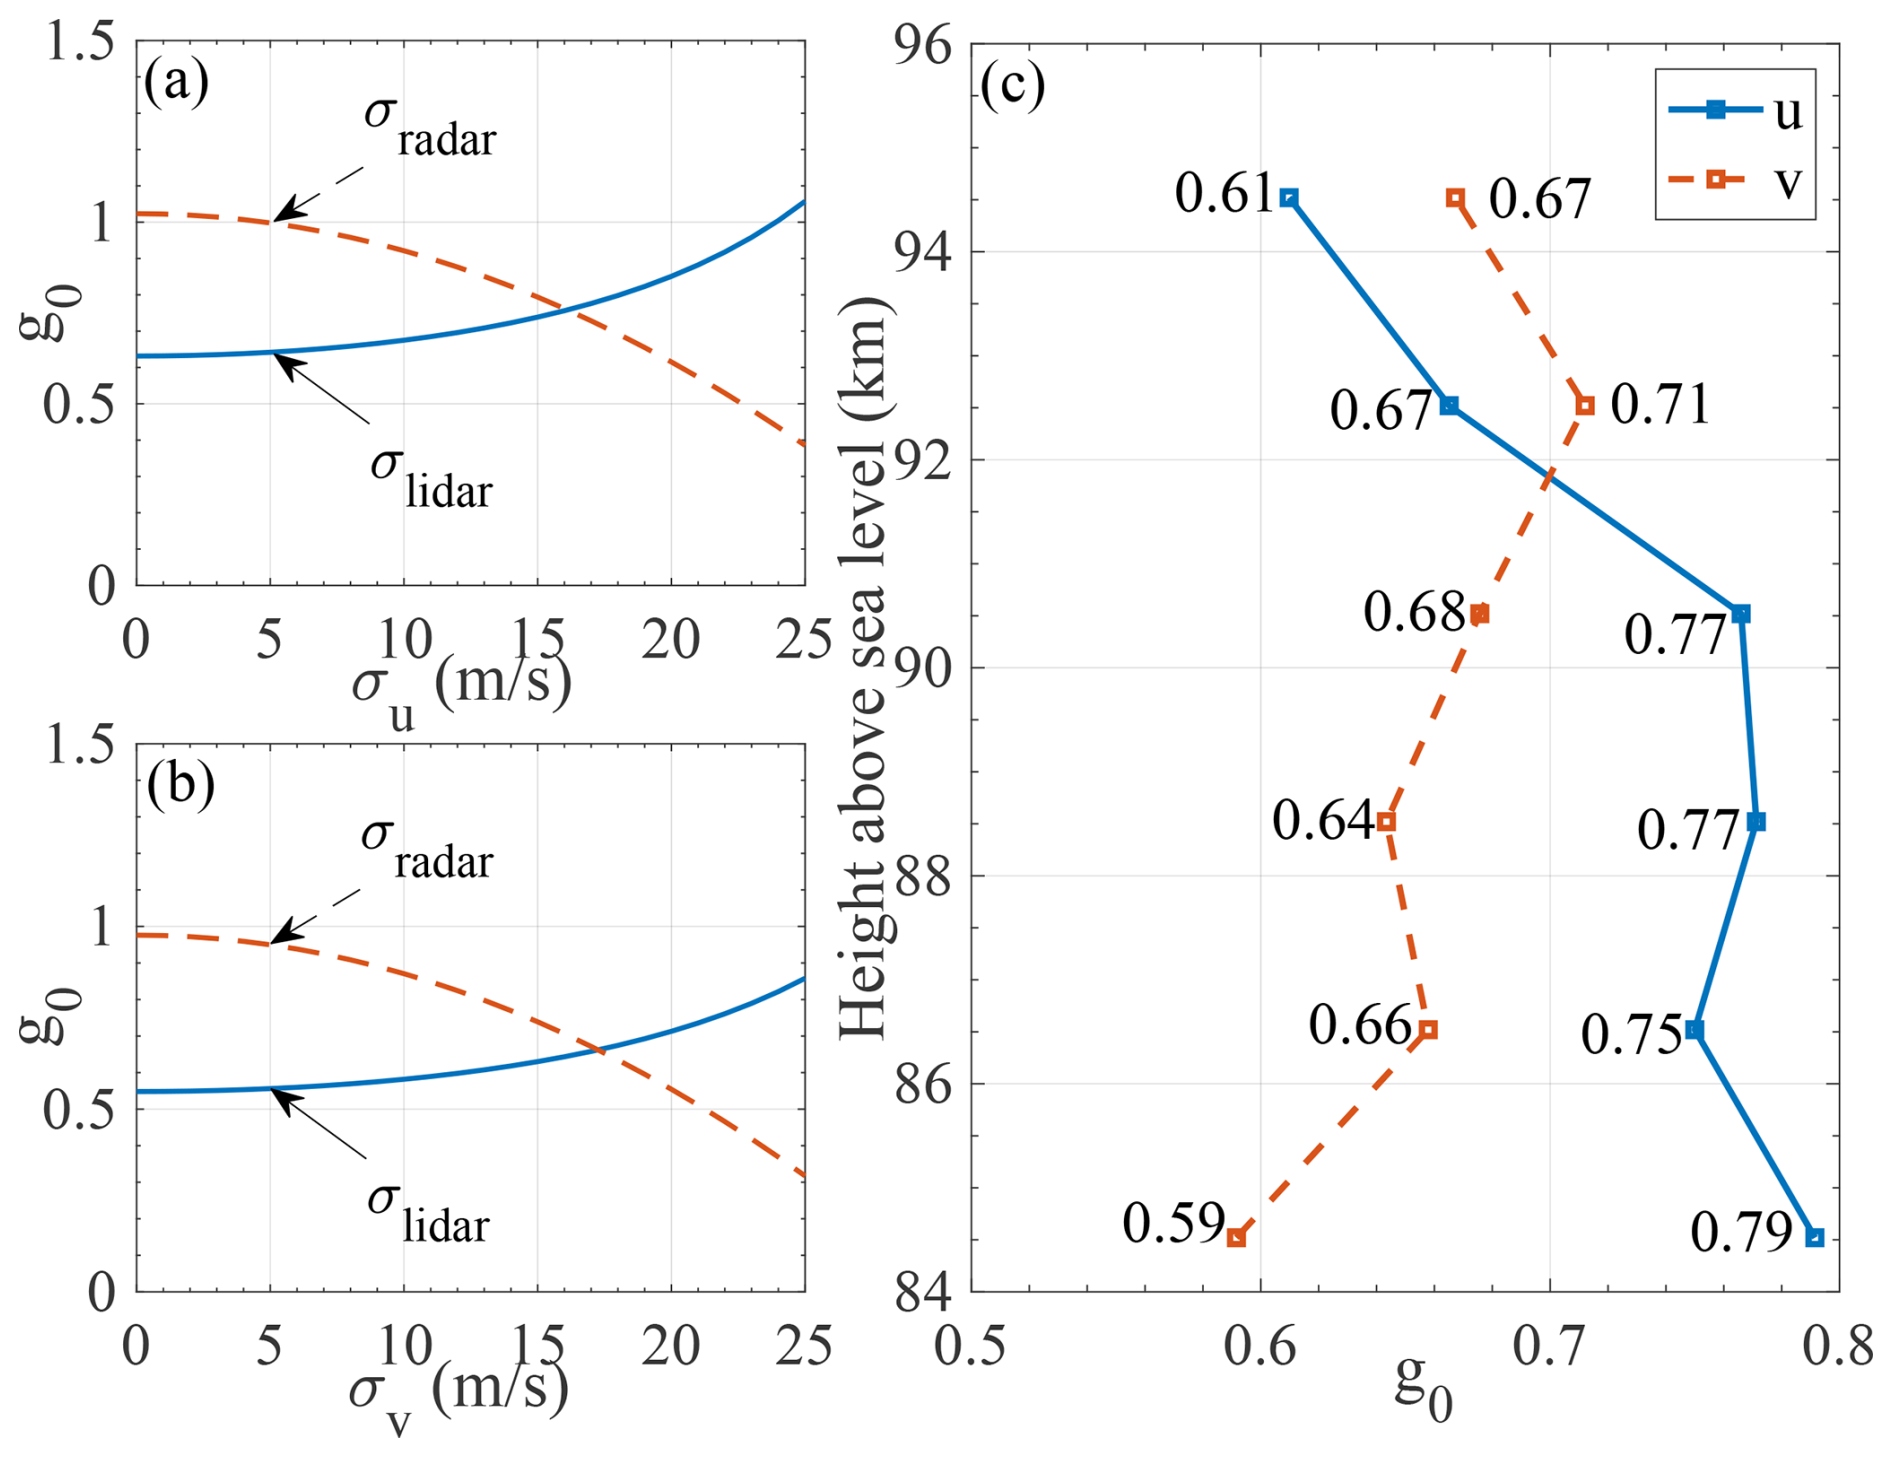
Figure 5(a–b) Gain factor g0 plotted as a function of σradar (dashed red) and σlidar (solid blue) for zonal and meridional winds at all available heights. (c) g0 values at different heights for zonal (solid blue) and meridional winds (dashed red), with the known σlidar as the measurement errors. Only joint measurements at each height totaling over 1000 are considered sufficient and processed.
Winds measured by meteor radars have also been compared to those from other co-located instruments, such as medium-frequency (MF) radars (e.g., Wilhelm et al., 2017; Reid et al., 2018; Zeng et al., 2022) and Fabry–Pérot interferometers (FPIs) (e.g., Lee et al., 2021; Gu et al., 2021). Such comparisons are useful for validating measurements from newly deployed instruments as well as interpreting the relative sensitivity of those measurements. In particular, Reid et al. (2018) indicated that MF radar could underestimate the magnitude of winds to a degree of 10 %–20 % at 86 km when compared to meteor radar. Both Lee et al. (2021) and Gu et al. (2021) reported that FPI-estimated winds are consistently smaller than meteor radar winds. Note that to what degree the difference between two measurements depends on the system configurations. It is generally agreed that the large-scale perturbations such as tides are well captured by all these instruments, but they have different sensitivity to gravity wave perturbations and turbulence. These results, in combination with the aforementioned meteor radar and lidar comparisons, conclude that lidar shows the most sensitivity compared to both meteor radar and either MF radar or FPI, with meteor radar being more sensitive to MF radar or FPI.
In addition to CONDOR-measured horizontal winds, a recently developed algorithm, 3DVAR+DIV, has been used to derive the arbitrary horizontal wind field as well as the vertical wind. This algorithm creates a tomographic reconstruction of the 3D wind field based on the optimal estimation technique and Bayesian statistics and has been adapted to CONDOR measurements (Stober et al., 2021c, 2022). The CONDOR meteor detection rate is particularly increased by its 48 kW high-power transmitter that leads to roughly 30 000 valid detections per day and site. Such a high meteor trail detection rate enables the reconstruction of the 3D wind field within the volume detected by CONDOR and controls the uncertainty estimations. The capability of observing small-scale wind structures, at horizontal scales of tens to hundreds of kilometers, is a significant advancement compared to a traditional meteor radar that provides only vertical profiles of horizontal wind with no information on the horizontal structure.
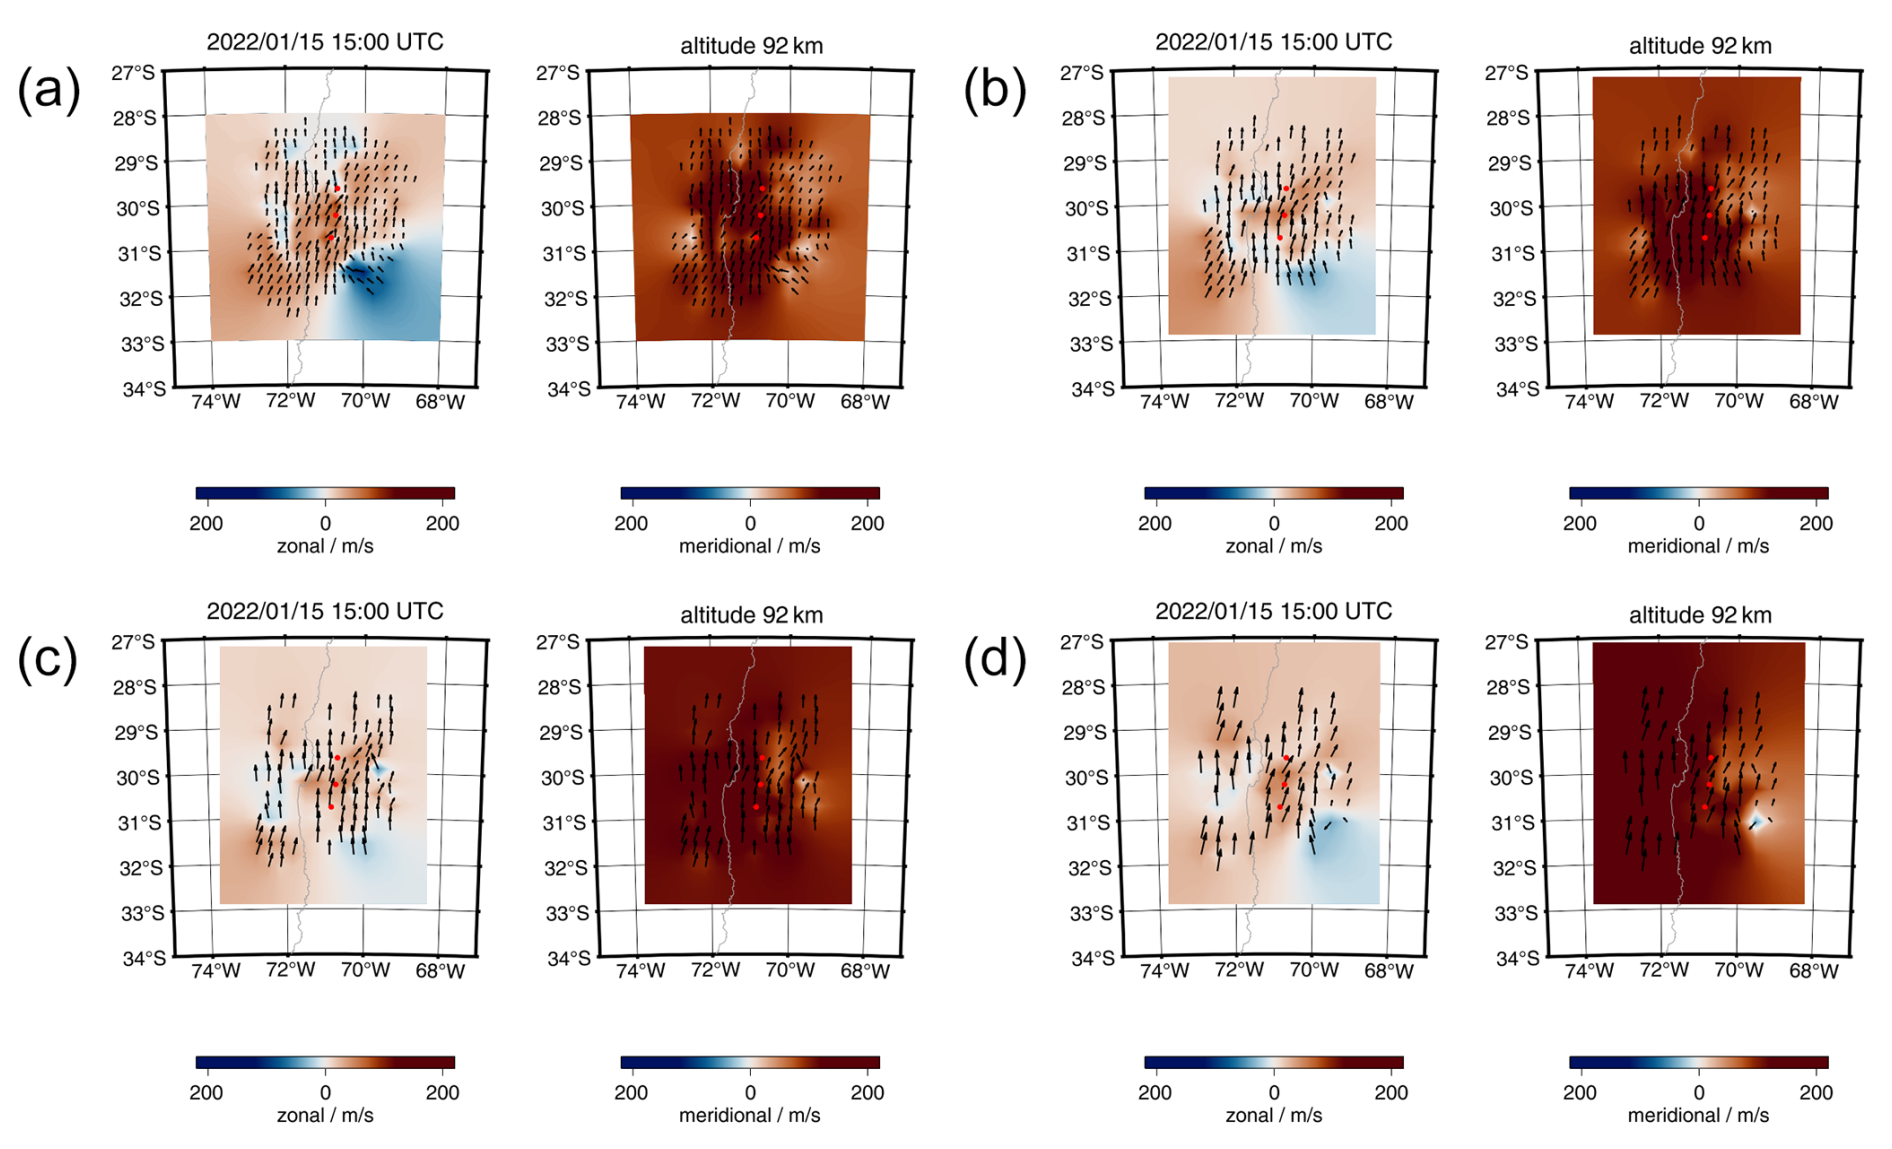
Figure 6Zonal and meridional spatially resolved winds for different temporal and spatial resolutions at 15:00 UTC on 15 January 2022. Panel (a) shows a temporal resolution of 30 min using the geographic grid coordinates with approximately 30 × 30 km spacing. Panels (b)–(c) leverage a Cartesian coordinate grid with 30 × 30 km spacing and temporal resolutions of 10 and 5 min, respectively. Panel (d) presents a high-resolution retrieval with 3 min temporal resolution applying a 40 × 40 km Cartesian coordinate grid.
Figure 6 shows a comparison of different geographic and Cartesian coordinates as well as a very high temporal resolution reaching from 30 to 3 min for CONDOR. These retrievals were performed for the analysis of the Hunga Tonga–Hunga Ha′apai (HTHH) volcanic eruption (Stober et al., 2023a). Due to the high meteor detection rate, CONDOR measurements are suitable to benchmark the 3DVAR+DIV retrievals concerning the temporal resolution of the obtained 3D winds while keeping the spatial information. The example shown in Fig. 6 is exceptional. We recorded wind speeds above 220 m s−1 lasting for more than 30 min. Such wind speeds have not yet been reported from other observations with temporal and spatial resolutions that high on Earth. Furthermore, we demonstrate that temporal resolutions of 5 min appear to be feasible with CONDOR for a 30 × 30 km grid spacing. We even conducted one retrieval run with a 3 min temporal resolution and a 40 × 40 km grid spacing. Our results indicate that the large-scale flow field is well reproduced down to the 3 min temporal resolution, although the problem is much more sparse compared to the 10 min analysis. The corresponding horizontal divergence, relative vorticity, and vertical winds of the 10 min analysis are presented in Fig. S1 of the Supplement. Additional details about the retrieval method can be found in Stober et al. (2022). This example outlines that the combination of advanced multi-static meteor radar networks such as CONDOR combined with 3DVAR retrievals permits us to reach unprecedented temporal resolutions while sustaining spatially resolved 3D winds.
We further benchmark the capabilities of CONDOR by computing temporal and horizontal wavelength spectra, leveraging the high-resolution retrievals from the HTHH analysis. Figure 7 shows the zonal- and meridional-wind spectra in the time domain for the 10, 5, and 3 min retrievals, respectively. We added a slope for reference. The spectra agree very well for the longer-period waves with periods longer than 1 h. Only the 3 min retrievals show a peculiar behavior for the periods between 30 min and 1 h where the slope seems to be less steep, which is likely caused by the sparsity of the inversion problem resulting in relatively larger statistical uncertainties compared to the 10 min retrieval analysis. For periods below 30 min, the slope is again approximately before it falls off more rapidly when reaching the spectral resolution limit. We also calculated horizontal wavelength spectra, leveraging all three temporal resolutions. Figure 7 (right panels) shows the resulting daily mean spectra for the zonal, meridional, and vertical winds based on the 3DVAR+DIV retrieval algorithm. Furthermore, we estimated the spectral slopes for different horizontal wavelength windows. Due to the linear alignment of the passive receiver stations in the north–south direction from the central site at the Andes Lidar Observatory, the zonal domain size is limited and the measurement response for the wind components is not homogeneously distributed over the domain. Zonal winds are most reliable east and west of the central axis but show a reduced measurement response directly above the stations, whereas the meridional winds are most reliable along the north–south axis above the sites with a smaller measurement response on the eastern and western domain boundaries (see Stober et al., 2022, Fig. 5).

Figure 7Temporal and spatial spectra for CONDOR. Panels (a), (c), and (e) show the temporal spectra of the zonal and meridional winds at 92 km altitude for the 10, 5, and 3 min temporal resolution, respectively. These spectra were computed by taking data from 12–31 January 2022. Panels (b), (d), and (f) visualize zonal horizontal wavelength spectra of the 3D winds for all three temporal resolutions. Q2DW: quasi-2-day wave.
The gravity wave (GW) momentum flux is another key quantity to assess the impact of small-scale waves on large-scale circulation. Meteor radar measurements can be used to calculate the GW momentum flux, but its uncertainty is high with traditional meteor radars because the second-order moments are more sensitive to measurement uncertainties. The CONDOR system significantly enhanced this by detecting many more meteor trails, making it possible to estimate the GW momentum flux at higher temporal resolutions with acceptable uncertainty. One approach to computing the GW momentum fluxes from CONDOR measurements is through the aforementioned 3DVAR+DIV algorithm. The detailed retrieval of GW momentum fluxes using the 3DVAR+DIV algorithm with various other meteor radars is discussed in Stober et al. (2021b). For the GW momentum flux analysis specific to CONDOR, we employed a generalized Tikhonov regularization, represented as . Here the term describes the classical least-squares approach of the momentum flux equation as derived in Hocking (2005) weighted by the statistical uncertainties obtained from a non-linear error propagation denoted by the subscript P. However, due to the often limited sampling statistics and all types of measurement errors, we added a generalized Tikhonov constraint. The Tikhonov matrix is estimated by computing an a priori xa for a certain time and altitude bin based on the neighboring bins in altitude and time, which is weighted by a covariance Q. The relative importance of each term in the cost function is controlled by a Lagrange multiplier λ. The relative contribution of the Tikhonov depends on the data quality and temporal resolution and can range between 1 %–10 %, and for some meteor radars it can yield much higher values. The advantage of this approach is that there are almost no longer negative values of the main diagonal elements and that the solution is more robust and less susceptible to biases and statistical errors caused by the random sampling within a time–altitude bin. The 3DVAR+DIV-computed CONDOR GW momentum fluxes and variances have been used to study planetary wave modulations on GWs (e.g., Qiao et al., 2024) and are planned to be analyzed for future related studies. The classical approach of performing least-squares fitting of the momentum flux equation derived in Hocking (2005) was also applied on CONDOR measurements, the details of which can be found in Conte et al. (2022). In that work, seasonal variations in GW momentum fluxes measured by four meteor radars in South America, including CONDOR, were found to change considerably across latitudes, demonstrating the importance of acquiring continuous CONDOR measurements for climatological GW studies.
The successful deployment and maintenance of CONDOR provide continuous measurements of horizontal winds with temporal resolutions of 15 min, 30 min, and 1 h and a vertical resolution of 2 km in the MLT region. These routine winds from CONDOR are not only highly correlated with but also point-to-point comparable to the co-located lidar winds, providing robust and continuous wind measurements to the research community. The CONDOR measurements also facilitate the retrieval of spatially resolved horizontal wind fields and vertical winds at very high temporal resolutions. Its extensive detections provide over 30 000 quality-controlled underdense meteor echoes at ALO and approximately 88 000 events per day in total. This paper presents the system configuration of CONDOR and discusses the validation and initial results of its wind measurements. Specifically, several advantages of this multi-static meteor radar system are listed below:
-
The increased detection of meteors is achieved at relatively low costs, making the estimations of atmospheric parameters more reliable and possible at higher resolutions.
-
The spatial coverage is significantly extended by the multi-static configuration, with receiving stations as far as 250 km from the transmitter still being able to detect meteor trails.
-
Detection of the same volume from different directions allows for better estimation of the wind vector. Even if the number of meteor detections is large enough for tomographic reconstruction, wind rotation (vorticity) cannot be estimated from a mono-static system because all measured Doppler shifts are relative to the same location; thus only the divergent field is included in the estimated wind field. The multi-static system removes this limitation of mono-static systems and allows for the estimation of wind rotation.
We conclude that CONDOR, in combination with other co-located ground-based instruments at ALO, provides uniquely cross-validated and cross-scale observations of the MLT dynamics.
CONDOR winds in the HDF5 format are available from the US National Science Foundation (NSF) Coupling, Energetics, and Dynamics of Atmospheric Regions (CEDAR) madrigal database (http://cedar.openmadrigal.org; Rideout and Cariglia, 2025). To access the data, follow these steps: select “Access Data” and then “List Experiments”, choose “Meteor Radars” from the “Choose instrument category(s)” list, and find “CONDOR multi-static meteor radar system” under “Choose instrument(s)”. The contour plots of horizontal winds are available at https://andesnetwork.org/data/mr/ (last access: 20 February 2025) and the wind data in the MATLAB format are available at https://doi.org/10.5281/zenodo.13293246 (Liu, 2025).
The supplement related to this article is available online at https://doi.org/10.5194/amt-18-1091-2025-supplement.
ZQ prepared the manuscript with contributions from AL, GS, and JF. ZQ and GS performed the data analysis. AL led the CONDOR installation with contributions from JF, FV, and CA. All authors reviewed the manuscript.
The contact author has declared that none of the authors has any competing interests.
Publisher's note: Copernicus Publications remains neutral with regard to jurisdictional claims made in the text, published maps, institutional affiliations, or any other geographical representation in this paper. While Copernicus Publications makes every effort to include appropriate place names, the final responsibility lies with the authors.
Zishun Qiao and Alan Z. Liu acknowledge the excellent support provided by the Cerro Pachón astronomy facility managed by the Association of Universities for Research in Astronomy, the Las Campanas Observatory, and the Southern Cross Observatory. Zishun Qiao acknowledges the discussions with Wen Yi, Xianghui Xue, and Jorge (Koki) Chau. The meteor radar acquisition is funded by the US National Science Foundation (NSF) Major Research Instrumentation Program (grant no. AGS-1828589). The Na lidar operation at ALO is supported by the NSF (grant nos. AGS-1759471 and AGS-1759573). The involvement of Alan Z. Liu and Gunter Stober was also supported by the International Space Science Institute (ISSI) in Bern, through the ISSI International Team Meteors and Phenomena at the Boundary between Earth's Atmosphere and Outer Space (project no. 23-580). Gunter Stober is a member of the Oeschger Centre for Climate Change Research (OCCR). The 3DVAR+DIV retrievals were developed as part of the ARISE design study (http://arise-project.eu/, last access: 8 October 2020) funded by the European Union's Seventh Framework Programme for Research and Technological Development.
This research has been supported by the US National Science Foundation Directorate for Geosciences Division of Atmospheric and Geospace Sciences (grant nos. AGS-1828589, AGS-1759573, and AGS-1759471) and the International Space Science Institute (grant no. 23-580).
This paper was edited by Gerd Baumgarten and reviewed by Qingchen Xu and one anonymous referee.
Chau, J. L., Urco, J. M., Vierinen, J., Harding, B. J., Clahsen, M., Pfeffer, N., Kuyeng, K., Milla, M., and Erickson, P. J.: Multistatic specular meteor radar network in Peru: System description and initial results, Earth Space Sci., 8, e2020EA001293, https://doi.org/10.1029/2020EA001293, 2021. a, b
Conte, J. F., Chau, J. L., Urco, J. M., Latteck, R., Vierinen, J., and Salvador, J. O.: First studies of mesosphere and lower thermosphere dynamics using a multistatic specular meteor radar network over southern Patagonia, Earth Space Sci., 8, e2020EA001356, https://doi.org/10.1029/2020EA001356, 2021. a
Conte, J. F., Chau, J. L., Liu, A., Qiao, Z., Fritts, D. C., Hormaechea, J. L., Salvador, J. O., and Milla, M. A.: Comparison of MLT Momentum Fluxes Over the Andes at Four Different Latitudinal Sectors Using Multistatic Radar Configurations, J. Geophys. Res.-Atmos., 127, e2021JD035982, https://doi.org/10.1029/2021JD035982, 2022. a
Deegan, N. F., Fitzpatrick, R., Forti, G., Grossi, M., Schaffner, M., and Southworth, R.: Study of meteor wind measurement techniques, Final Report, Contract AF 19(628)-3248, Defense Technical Information Center, 128 pp., 1970. a
Elford, W. G.: Radar observations of meteor trails, and their interpretation using Fresnel holography: a new tool in meteor science, Atmos. Chem. Phys., 4, 911–921, https://doi.org/10.5194/acp-4-911-2004, 2004. a
Franke, S., Chu, X., Liu, A., and Hocking, W.: Comparison of meteor radar and Na Doppler lidar measurements of winds in the mesopause region above Maui, Hawaii, J. Geophys. Res.-Atmos., 110, D09S02, https://doi.org/10.1029/2003JD004486, 2005a. a, b
Franke, S. J., Chu, X., Liu, A. Z., and Hocking, W. K.: Comparison of meteor radar and Na Doppler lidar measurements of winds in the mesopause region above Maui, Hawaii, J. Geophys. Res., 110, D09S02, https://doi.org/10.1029/2003JD004486, 2005b. a, b, c
Fritts, D., Janches, D., Hocking, W., Mitchell, N., and Taylor, M. J.: Assessment of gravity wave momentum flux measurement capabilities by meteor radars having different transmitter power and antenna configurations, J. Geophys. Res.-Atmos., 117, 2156–2202, https://doi.org/10.1029/2011JD017174, 2012. a
Gardner, C. S.: Performance capabilities of middle-atmosphere temperature lidars: comparison of Na, K, Ca, Ca+, and Rayleigh systems, Appl. Optics, 43, 4941–4956, https://doi.org/10.1364/AO.43.004941, 2004. a
Gu, S., Hou, X., Li, N., Yi, W., Ding, Z., Chen, J., Hu, G., and Dou, X.: First comparative analysis of the simultaneous horizontal wind observations by collocated meteor radar and FPI at low latitude through 892.0-nm airglow emission, Remote Sens., 13, 4337, https://doi.org/10.3390/rs13214337, 2021. a, b
Guo, Y., Liu, A. Z., and Gardner, C. S.: First Na lidar measurements of turbulence heat flux, thermal diffusivity, and energy dissipation rate in the mesopause region, Geophys. Res. Lett., 44, 5782–5790, 2017. a
Hocking, W.: Temperatures using radar-meteor decay times, Geophys. Res. Lett., 26, 3297–3300, 1999. a
Hocking, W. K.: A new approach to momentum flux determinations using SKiYMET meteor radars, Ann. Geophys., 23, 2433–2439, https://doi.org/10.5194/angeo-23-2433-2005, 2005. a, b, c
Hocking, W., Thayaparan, T., and Franke, S.: Method for statistical comparison of geophysical data by multiple instruments which have differing accuracies, Adv. Space Res., 27, 1089–1098, 2001a. a, b
Hocking, W. K., Fuller, B., and Vandepeer, B.: Real-time determination of meteor-related parameters utilizing modern digital technology, J. Atmos. Sol.-Terr. Phys., 63, 155–169, https://doi.org/10.1016/S1364-6826(00)00138-3, 2001b. a
Holdsworth, D. A., Reid, I. M., and Cervera, M. A.: Buckland Park all-sky interferometric meteor radar, Radio Sci., 39, 1–12, 2004. a
Holdsworth, D. A., Murphy, D. J., Reid, I. M., and Morris, R. J.: Antarctic meteor observations using the Davis MST and meteor radars, Adv. Space Res., 42, 143–154, https://doi.org/10.1016/j.asr.2007.02.037, 2008. a
Jones, J., Webster, A., and Hocking, W.: An improved interferometer design for use with meteor radars, Radio Sci., 33, 55–65, 1998. a
Jones, J., Brown, P., Ellis, K., Webster, A., Campbell-Brown, M., Krzemenski, Z., and Weryk, R.: The Canadian Meteor Orbit Radar: system overview and preliminary results, Planet. Space Sci., 53, 413–421, 2005. a
Lee, C., Jee, G., Kam, H., Wu, Q., Ham, Y.-B., Kim, Y. H., and Kim, J.-H.: A comparison of Fabry–Perot interferometer and meteor radar wind measurements near the polar mesopause region, J. Geophys. Res.-Space, 126, e2020JA028802, https://doi.org/10.1029/2020JA028802, 2021. a, b
Liu, A.: CONDOR Meteor Radar Horizontal Wind, Version v4, ERAU, Zenodo [data set], https://doi.org/10.5281/zenodo.13293246, 2025. a
Liu, A. Z., Hocking, W. K., Franke, S. J., and Thayaparan, T.: Comparison of Na lidar and meteor radar wind measurements at Starfire Optical Range, NM, USA, J. Atmos. Sol.-Terr. Phys., 64, 31–40, https://doi.org/10.1016/S1364-6826(01)00095-5, 2002. a, b, c, d, e, f
Liu, A. Z., Lu, X., and Franke, S. J.: Diurnal variation of gravity wave momentum flux and its forcing on the diurnal tide, J. Geophys. Res.-Atmos., 118, 1668–1678, 2013. a
Liu, A. Z., Guo, Y., Vargas, F., and Swenson, G. R.: First measurement of horizontal wind and temperature in the lower thermosphere (105–140 km) with a Na Lidar at Andes Lidar Observatory, Geophys. Res. Lett., 43, 2374–2380, 2016. a, b
Liu, L., Liu, H., Le, H., Chen, Y., Sun, Y.-Y., Ning, B., Hu, L., Wan, W., Li, N., and Xiong, J.: Mesospheric temperatures estimated from the meteor radar observations at Mohe, China, J. Geophys. Res.-Space, 122, 2249–2259, https://doi.org/10.1002/2016JA023776, 2017. a, b
Muller, H. G.: Winds and Turbulence in the Meteor Zone, in: Structure and Dynamics of the Upper Atmosphere. Developments in Atmospheric in Science; edited by: Verniani, F., Elsevier, Amsterdam, The Netherlands, 1, 347–388, 1974. a
Liu, A. Z.: CONDOR Meteor Radar Network, US NSF [data set], https://andesnetwork.org/data/mr/, last access: 20 February 2025.
Papen, G. C., Pfenninger, W. M., and Simonich, D. M.: Sensitivity analysis of Na narrowband wind-temperature lidar systems, Appl. Optics, 34, 480–498, https://doi.org/10.1364/AO.34.000480, 1995. a
Poulter, E. and Baggaley, W.: Radiowave scattering from meteoric ionization, J. Atmos. Terr. Phys., 39, 757–768, 1977. a
Qiao, Z., Liu, A. Z., Pedatella, N., Stober, G., Reid, I. M., Fuentes, J., and Adami, C. L.: Evidence for SSW triggered Q6DW-tide and Q6DW-gravity wave interactions observed by meteor radars at 30 S, Geophys. Res. Lett., 51, e2023GL108066, https://doi.org/10.1029/2023GL108066, 2024. a
Reid, I. M.: MF and HF radar techniques for investigating the dynamics and structure of the 50 to 110 km height region: a review, Progress in Earth and Planetary Science, 2, 1–34, https://doi.org/10.1186/s40645-015-0060-7, 2015. a
Reid, I. M.: Meteor Radar for Investigation of the MLT Region: A Review, Atmosphere, 15, 505, https://doi.org/10.3390/atmos15040505, 2024. a
Reid, I. M., McIntosh, D. L., Murphy, D. J., and Vincent, R. A.: Mesospheric radar wind comparisons at high and middle southern latitudes, Earth Planets Space, 70, 1–16, 2018. a, b, c
Rideout, W. and Cariglia, K.: CEDAR Madrigal Database, http://cedar.openmadrigal.org, last access: 20 February 2025. a
Roper, R. and Elford, W.: Seasonal variation of turbulence in the upper atmosphere, Nature, 197, 963–964, https://doi.org/10.1038/197963a0, 1963. a
She, C. Y., Yu, J. R., Huang, J. W., Nagasawa, C., and Gardner, C. S.: Na temperature lidar measurements of gravity wave perturbations of winds, density and temperature in the mesopause region, Geophys. Res. Lett., 18, 1329–1331, https://doi.org/10.1029/91GL01517, 1991. a
Spargo, A. J., Reid, I. M., and MacKinnon, A. D.: Multistatic meteor radar observations of gravity-wave–tidal interaction over southern Australia, Atmos. Meas. Tech., 12, 4791–4812, https://doi.org/10.5194/amt-12-4791-2019, 2019. a, b, c, d
Stober, G. and Chau, J. L.: A multistatic and multifrequency novel approach for specular meteor radars to improve wind measurements in the MLT region, Radio Sci., 50, 431–442, https://doi.org/10.1002/2014RS005591, 2015. a, b, c, d
Stober, G., Jacobi, C., Matthias, V., Hoffmann, P., and Gerding, M.: Neutral air density variations during strong planetary wave activity in the mesopause region derived from meteor radar observations, J. Atmos. Sol.-Terr. Phy., 74, 55–63, 2012. a
Stober, G., Brown, P., Campbell-Brown, M., and Weryk, R.: Triple-frequency meteor radar full wave scattering-Measurements and comparison to theory, Astron. Astrophys., 654, A108, https://doi.org/10.1051/0004-6361/202141470, 2021a. a
Stober, G., Janches, D., Matthias, V., Fritts, D., Marino, J., Moffat-Griffin, T., Baumgarten, K., Lee, W., Murphy, D., Kim, Y. H., Mitchell, N., and Palo, S.: Seasonal evolution of winds, atmospheric tides, and Reynolds stress components in the Southern Hemisphere mesosphere–lower thermosphere in 2019, Ann. Geophys., 39, 1–29, https://doi.org/10.5194/angeo-39-1-2021, 2021b. a
Stober, G., Kozlovsky, A., Liu, A., Qiao, Z., Tsutsumi, M., Hall, C., Nozawa, S., Lester, M., Belova, E., Kero, J., Espy, P. J., Hibbins, R. E., and Mitchell, N.: Atmospheric tomography using the Nordic Meteor Radar Cluster and Chilean Observation Network De Meteor Radars: network details and 3D-Var retrieval, Atmos. Meas. Tech., 14, 6509–6532, https://doi.org/10.5194/amt-14-6509-2021, 2021c. a
Stober, G., Liu, A., Kozlovsky, A., Qiao, Z., Kuchar, A., Jacobi, C., Meek, C., Janches, D., Liu, G., Tsutsumi, M., Gulbrandsen, N., Nozawa, S., Lester, M., Belova, E., Kero, J., and Mitchell, N.: Meteor radar vertical wind observation biases and mathematical debiasing strategies including the 3DVAR+DIV algorithm, Atmos. Meas. Tech., 15, 5769–5792, https://doi.org/10.5194/amt-15-5769-2022, 2022. a, b, c
Stober, G., Liu, A., Kozlovsky, A., Qiao, Z., Krochin, W., Shi, G., Kero, J., Tsutsumi, M., Gulbrandsen, N., Nozawa, S., Lester, M., Baumgarten, K., Belova, E., and Mitchell, N.: Identifying gravity waves launched by the Hunga Tonga–Hunga Ha'apai volcanic eruption in mesosphere/lower-thermosphere winds derived from CONDOR and the Nordic Meteor Radar Cluster, Ann. Geophys., 41, 197–208, https://doi.org/10.5194/angeo-41-197-2023, 2023a. a, b
Stober, G., Weryk, R., Janches, D., Dawkins, E. C., Günzkofer, F., Hormaechea, J. L., and Pokhotelov, D.: Polarization dependency of transverse scattering and collisional coupling to the ambient atmosphere from meteor trails – Theory and observations, Planet. Space Sci., 237, 105768, https://doi.org/10.1016/j.pss.2023.105768, 2023b. a
Thomas-Osip, J. E., Prieto, G., Johns, M., and Phillips, M. M.: Giant Magellan Telescope site evaluation and characterization at Las Campanas Observatory, SPIE – The International Society for Optics and Photonics, https://doi.org/10.1117/12.789863, 2008. a
Tsutsumi, M., Tsuda, T., Nakamura, T., and Fukao, S.: Temperature fluctuations near the mesopause inferred from meteor observations with the middle and upper atmosphere radar, Radio Sci., 29, 599–610, 1994. a
Vargas, F., Liu, A., Swenson, G., Segura, C., Vega, P., Fuentes, J., Pautet, D., Taylor, M., Zhao, Y., Morton, Y., and Bourne, H.: Mesosphere and lower thermosphere changes associated with the 2 July 2019 total eclipse in South America over the andes lidar observatory, cerro pachon, Chile, J. Geophys. Res.-Atmos., 127, e2021JD035064, https://doi.org/10.1029/2021JD035064, 2022. a
Vincent, R. A., Kovalam, S., Reid, I. M., and Younger, J. P.: Gravity wave flux retrievals using meteor radars, Geophys. Res. Lett., 37, L14802, https://doi.org/10.1029/2010GL044086, 2010. a
Wilhelm, S., Stober, G., and Chau, J. L.: A comparison of 11-year mesospheric and lower thermospheric winds determined by meteor and MF radar at 69° N, Ann. Geophys., 35, 893–906, https://doi.org/10.5194/angeo-35-893-2017, 2017. a
Xu, Q., Reid, I. M., Cai, B., Adami, C., Zhang, Z., Zhao, M., and Li, W.: A new dual-frequency stratospheric–tropospheric and meteor radar: system description and first results, Atmos. Meas. Tech., 17, 2957–2975, https://doi.org/10.5194/amt-17-2957-2024, 2024. a
Yi, W., Xue, X., Chen, J., Dou, X., Chen, T., and Li, N.: Estimation of mesopause temperatures at low latitudes using the Kunming meteor radar, Radio Sci., 51, 130–141, 2016. a
Yi, W., Xue, X., Reid, I. M., Younger, J. P., Chen, J., Chen, T., and Li, N.: Estimation of mesospheric densities at low latitudes using the Kunming meteor radar together with SABER temperatures, J. Geophys. Res.-Space, 123, 3183–3195, 2018. a, b
Yi, W., Zeng, J., Xue, X., Reid, I., Zhong, W., Wu, J., Chen, T., and Dou, X.: Multistatic meteor radar observations of two-dimensional horizontal MLT wind, Atmos. Meas. Tech. Discuss. [preprint], https://doi.org/10.5194/amt-2022-254, 2022. a, b, c
Younger, J., Reid, I., Vincent, R., and Murphy, D.: A method for estimating the height of a mesospheric density level using meteor radar, Geophys. Res. Lett., 42, 6106–6111, 2015. a
Younger, J. P.: Theory and applications of VHF meteor radar observations, PhD thesis, University of Adelaide, 2011. a, b
Zeng, J., Yi, W., Xue, X., Reid, I., Hao, X., Li, N., Chen, J., Chen, T., and Dou, X.: Comparison between the mesospheric winds observed by two collocated meteor radars at low latitudes, Remote Sens., 14, 2354, https://doi.org/10.3390/rs14102354, 2022. a
Zhong, W., Xue, X., Yi, W., Reid, I. M., Chen, T., and Dou, X.: Error analyses of a multistatic meteor radar system to obtain a three-dimensional spatial-resolution distribution, Atmos. Meas. Tech., 14, 3973–3988, https://doi.org/10.5194/amt-14-3973-2021, 2021. a
- Abstract
- Introduction
- The multi-static configuration of CONDOR
- Horizontal winds: cross-site validation and comparison with Na lidar winds
- Discussion on the tomographic reconstruction of 3D wind fields
- Conclusions
- Data availability
- Author contributions
- Competing interests
- Disclaimer
- Acknowledgements
- Financial support
- Review statement
- References
- Supplement