the Creative Commons Attribution 4.0 License.
the Creative Commons Attribution 4.0 License.
 | 07 Mar 2025
Mitigating radome-induced bias in X-band weather radar polarimetric moments using an adaptive discrete Fourier transform algorithm
Padmanabhan Thiruvengadam
Guillaume Lesage
Ambinintsoa Volatiana Ramanamahefa
Joël Van Baelen
In recent years, the application of compact and cost-effective deployable X-band polarimetric radars has gained in popularity, particularly in regions with complex terrain. The deployable radars generally use a radome constructed by joining multiple panels using metallic threads to facilitate easy transportation. As a part of the ESPOIRS project, Laboratoire de l'Atmosphère et des Cyclones has acquired an X-band meteorological radar with a four-panel radome configuration. In this study, we investigated the effect of the radome on the measured polarimetric variables, particularly differential reflectivity and differential phase. Our observations reveal that the metallic threads connecting the radome panels introduce power loss at vertical polarization, leading to a positive bias in the differential reflectivity values. To address the spatial variability bias observed in differential reflectivity and differential phase, we have developed a novel algorithm based on the discrete Fourier transform. The algorithm's performance was tested during an intense heavy-rainfall event caused by Cyclone Batsirai on Réunion Island. The comparative and joint histogram analysis demonstrates the algorithm's effectiveness in correcting the spatial bias in the polarimetric variables.
- Article
(5136 KB) - Full-text XML
- BibTeX
- EndNote


Doppler weather radars provide comprehensive precipitation measurements at high spatial resolution, offering valuable insights into the orography-influenced precipitation processes (Georgis et al., 2000). Among different frequency bands, X-band radars have gained popularity due to their compact size and affordable cost, making them well suited for deployment in areas with challenging topography. Additionally, modern polarimetric technology has dramatically enhanced the ability of X-band radars to estimate precipitation, overcoming their traditional limitation of high attenuation rates in the rain (Ryzhkov et al., 1994). The ESPOIRS (Etude des Systèmes Précipitants de l'Océan Indien par Radars et Satellites) project implemented by LACy (Laboratoire de l'Atmosphère et des Cyclones) has utilized the advantages of X-band polarimetric radar to examine the dynamics of and variability in intense tropical precipitation at the local scale, particularly its interaction with the relief of the island. Initially, an X-band radar operating at 9.41 GHz was deployed south of Réunion Island (Fig. 1a) to investigate heavy rainfall and the pronounced relief effects that may contribute to rainfall intensification. Later, the radar was installed in Seychelles and Madagascar to explore different geographical and meteorological contexts. The radar performed plan position indicator (PPI) scans with a range gate resolution of 125 m and range height indicator (RHI) scans with a range resolution of 25 m. The radar used for this study is a GAMIC GMWR-25-DP, which by design has the transceiver unit fixed just behind the antenna so that the transceiver and the antenna move together and avoid the use of rotary joints.
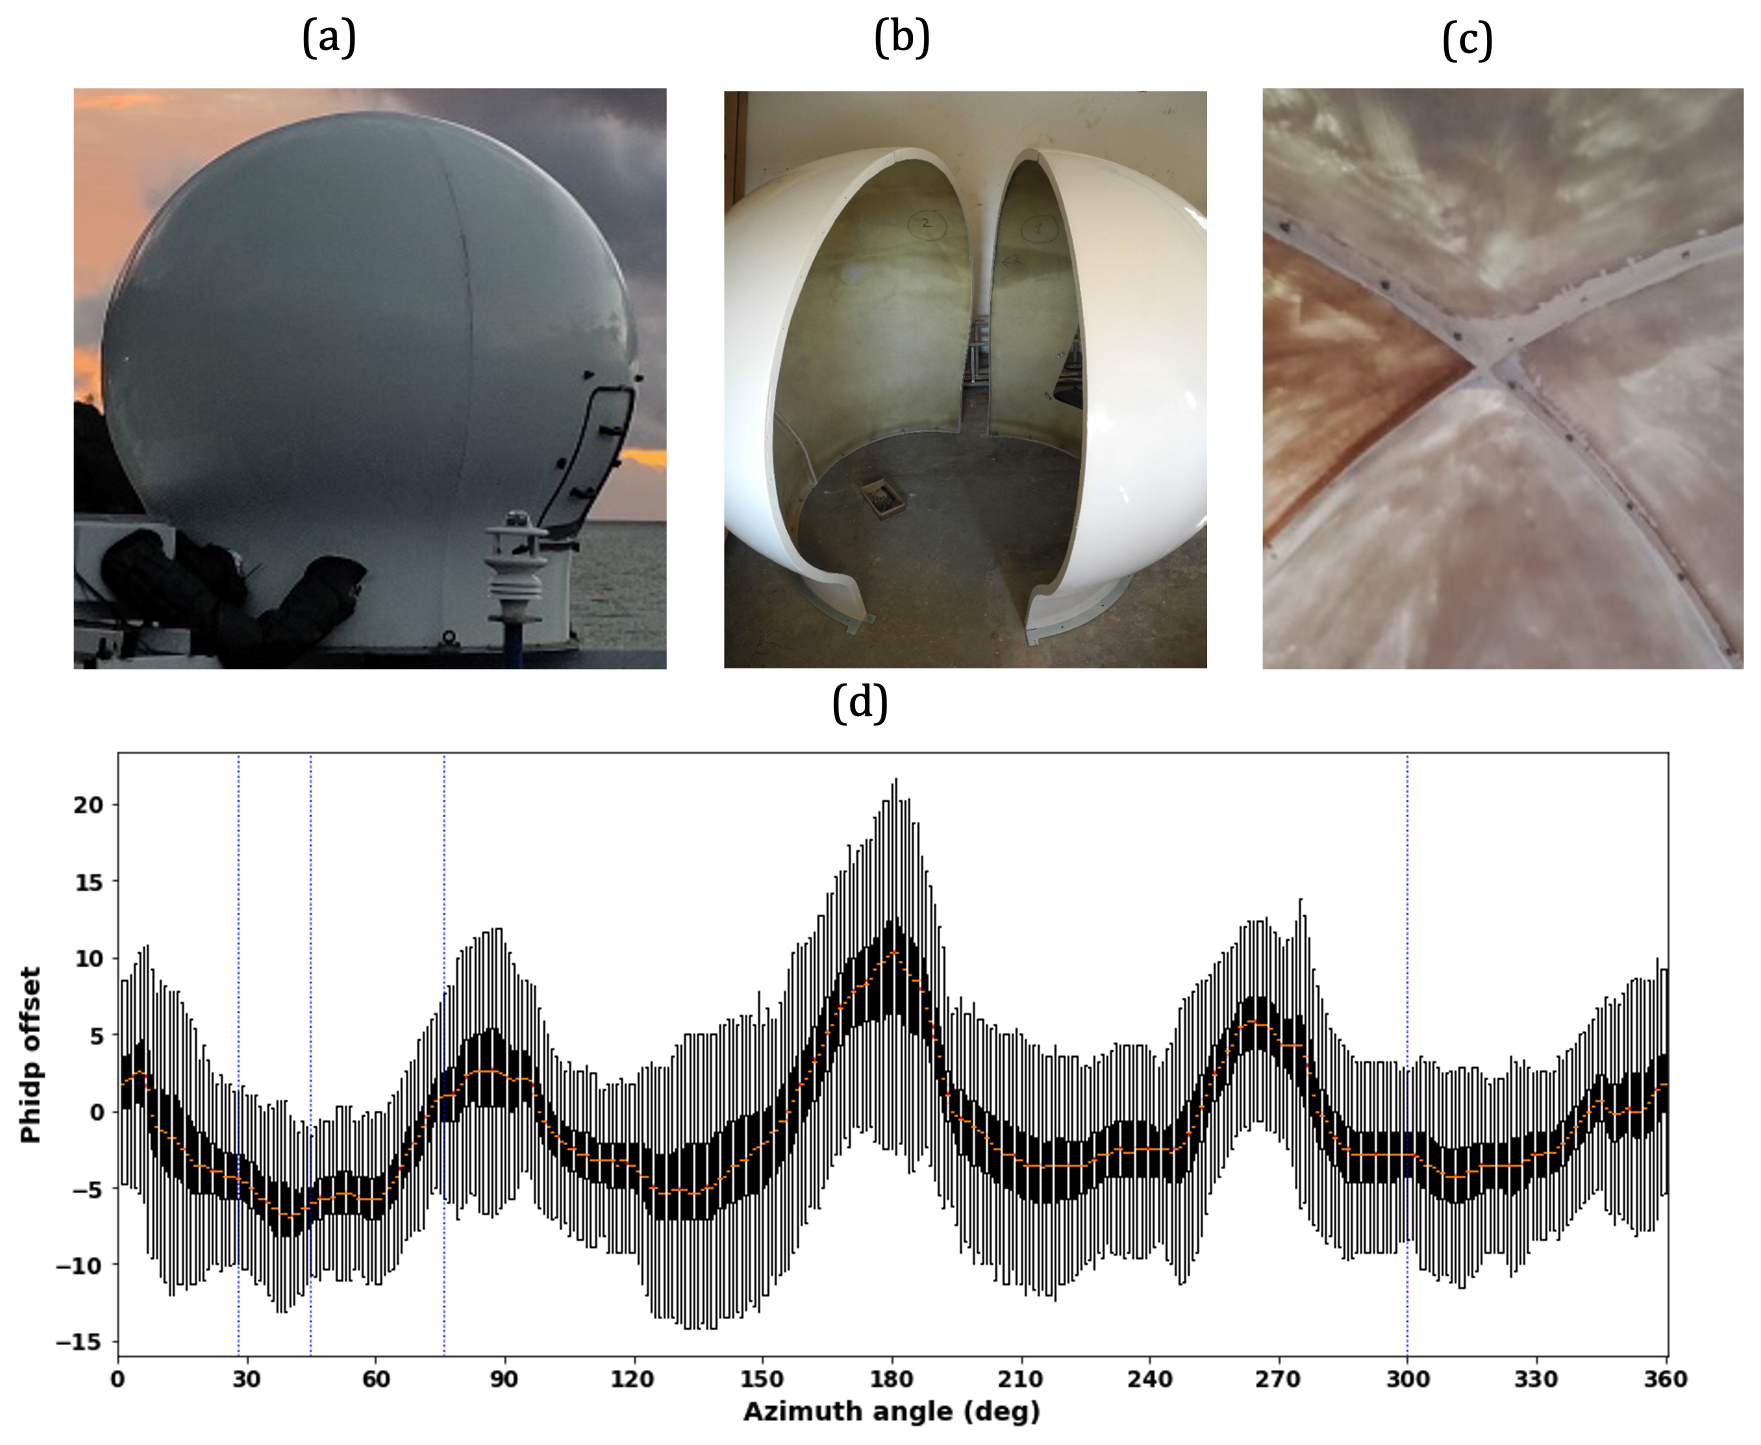
Figure 1Photographs illustrating the structure and assembly of the four lateral panels of the ESPOIRS radar radome showing the regions of metal nuts and bolts (a–c). Distribution of PHIDP offset obtained from all the PPI scans observed on 3 February 2022 (d); the dotted red line shows the median PHIDP offset. In the boxplot, black marks the interquartile range (25th to 75th percentiles), and gray whiskers extend 1.5 times the interquartile range. The dotted blue line indicates the azimuth location of RHI scans in Fig. 2.
Although X-band polarimetric radar offers advantages over single-polarization radars, maintaining the accuracy of its polarimetric data requires rigorous quality control (Park et al., 2005). One factor that can impact the performance of the radars is the radome. While they play a protective role, the radome can passively affect the observations due to material-related transmission losses and variations in sidelobe levels (Figueras i Ventura et al., 2021; Mishra et al., 2014). Mainly, radome panels with metallic threads at their joints, common in mobile radars, can introduce biases in polarimetric observations (Figueras i Ventura et al., 2021; Gourley et al., 2006). The ESPOIRS X-band radar is protected by a composite radome with a 1.435 m base diameter and 2 m height, consisting of four fiberglass-reinforced lateral segments attached through horizontally aligned metal nuts and bolts arranged along the vertical axis (Fig. 1b and c). Radar data from Cyclone Batsirai on 3 February 2022 show significant biases in differential reflectivity (ZDR) and differential phase (PHIDP). One of the objectives of this study is to identify the source of these biases and hypothesize that they originate from the radome metal joints.
In similar scenarios, efforts have been made to address biases using spatial calibration curves from radar data (Figueras i Ventura et al., 2021; Gourley et al., 2006). However, the stochastic nature of radar measurements introduces inherent uncertainty into calibration curves, leading to an overall increase in measurement uncertainty. Previous investigations have also recommended the implementation of a seamless monoblock radome to mitigate spatial bias, as it eliminates the presence of joints and, subsequently, any bias. Nevertheless, the unique design of the portable ESPOIRS X-band radar, which prioritizes ease of transportation, presents inherent challenges in adopting a monoblock radome solution. To address this challenge, this study proposes an adaptive discrete Fourier transform (DFT)-based algorithm to mitigate the bias. This algorithm effectively utilizes the information available in radar scans and enables the correction of the ZDR and PHIDP moments for various scan strategies.
The distinguishing feature of this algorithm is its capacity for dynamic threshold adjustment in the correction of frequency values generated by the DFT based on the characteristics of radar moments. Such adaptivity sets this algorithm apart from traditional methods (Figueras i Ventura et al., 2021; Gourley et al., 2006), which employ fixed spatial calibration curves. To assess the performance of the proposed algorithm, it is applied to correct the ZDR and PHIDP radar scans obtained during an intense heavy-rainfall event caused by the passage of Cyclone Batsirai in the vicinity of Réunion Island from 2 to 4 February 2022. The proposed method is designed to correct spatial biases in ZDR and PHIDP measurements, not absolute biases that are constant across all azimuth directions and elevations. Correcting absolute biases that are uniform across all measurements was not the intent of our study. Section 2 focuses on the source of the spatial bias in ZDR, offering insights into the factor responsible for this bias. The adaptive DFT algorithm proposed in this study is introduced in Sect. 3, providing a discussion of its mathematical formulation. Section 4 assesses the proposed algorithm's performance through comparative and joint histogram analysis. Section 5 summarizes the key points of the study and outlines the direction of future research to test further and enhance the algorithm's performance.
To elucidate the origins of positive bias in PHIDP measurements and ascertain its underlying causes, this study employs a comprehensive approach involving the calculation of PHIDP offsets for all PPI scans conducted in the 3 February 2022 case study, following the technique outlined in previous works (Figueras i Ventura et al., 2012), which utilized PHIDP offsets to discern the influence of radome joints. The findings in Fig. 1d exhibit a box plot distribution of PHIDP offsets across various azimuth angles. Figure 1d shows a sinusoidal azimuthal pattern with four periods in the PHIDP offset. Strikingly, a distinct correlation emerges between the azimuthal period positions of the PHIDP offsets and the orientation of the radome joints, with notable alignment occurring at approximately 5, 85, 175 and 265°. This observation strongly suggests that the metallic threads and joint configuration are the key factors contributing to the bias in PHIDP. The localization of the bias near the joints is due to signal phase sensitivity to path length and material properties. Radome metal joints can introduce significant phase shifts in specific polarizations, impacting PHIDP measurements when signal paths intersect with these joints (Li et al., 2017), explaining the observed PHIDP offset collocation with the radome joint direction.
The positive bias observed in ZDR can result from either an increase in horizontal reflectivity (ZH) values or a decrease in vertical reflectivity (ZV) values. To ascertain the cause of the positive bias in ZDR, the temporal median of horizontal and vertical reflectivity obtained from RHI scan angles of 28, 300, 45 and 76° on 3 February 2022 was computed. These specific azimuth angles were selected as they were the only available RHI scans for analysis. Subsequently, for each median RHI scan at 28, 300, 45 and 76° of azimuth, respectively, elevation angles exhibiting positive ZDR bias (70, 70, 36 and 34°) and unbiased elevation angles (66, 67, 31 and 27°) were identified for both horizontal and vertical polarization and compared as shown in Fig. 2a–d. The biased (red, blue) and unbiased (black, green) elevation angles were chosen sufficiently close to each other to ensure that the same hydrometeor characteristics were observed. For example, the 34° angle marks the transition where the onset of radome-induced bias becomes visible and was chosen as it is the closest elevation angle to 27° (unbiased) that still exhibits the same precipitation pattern.
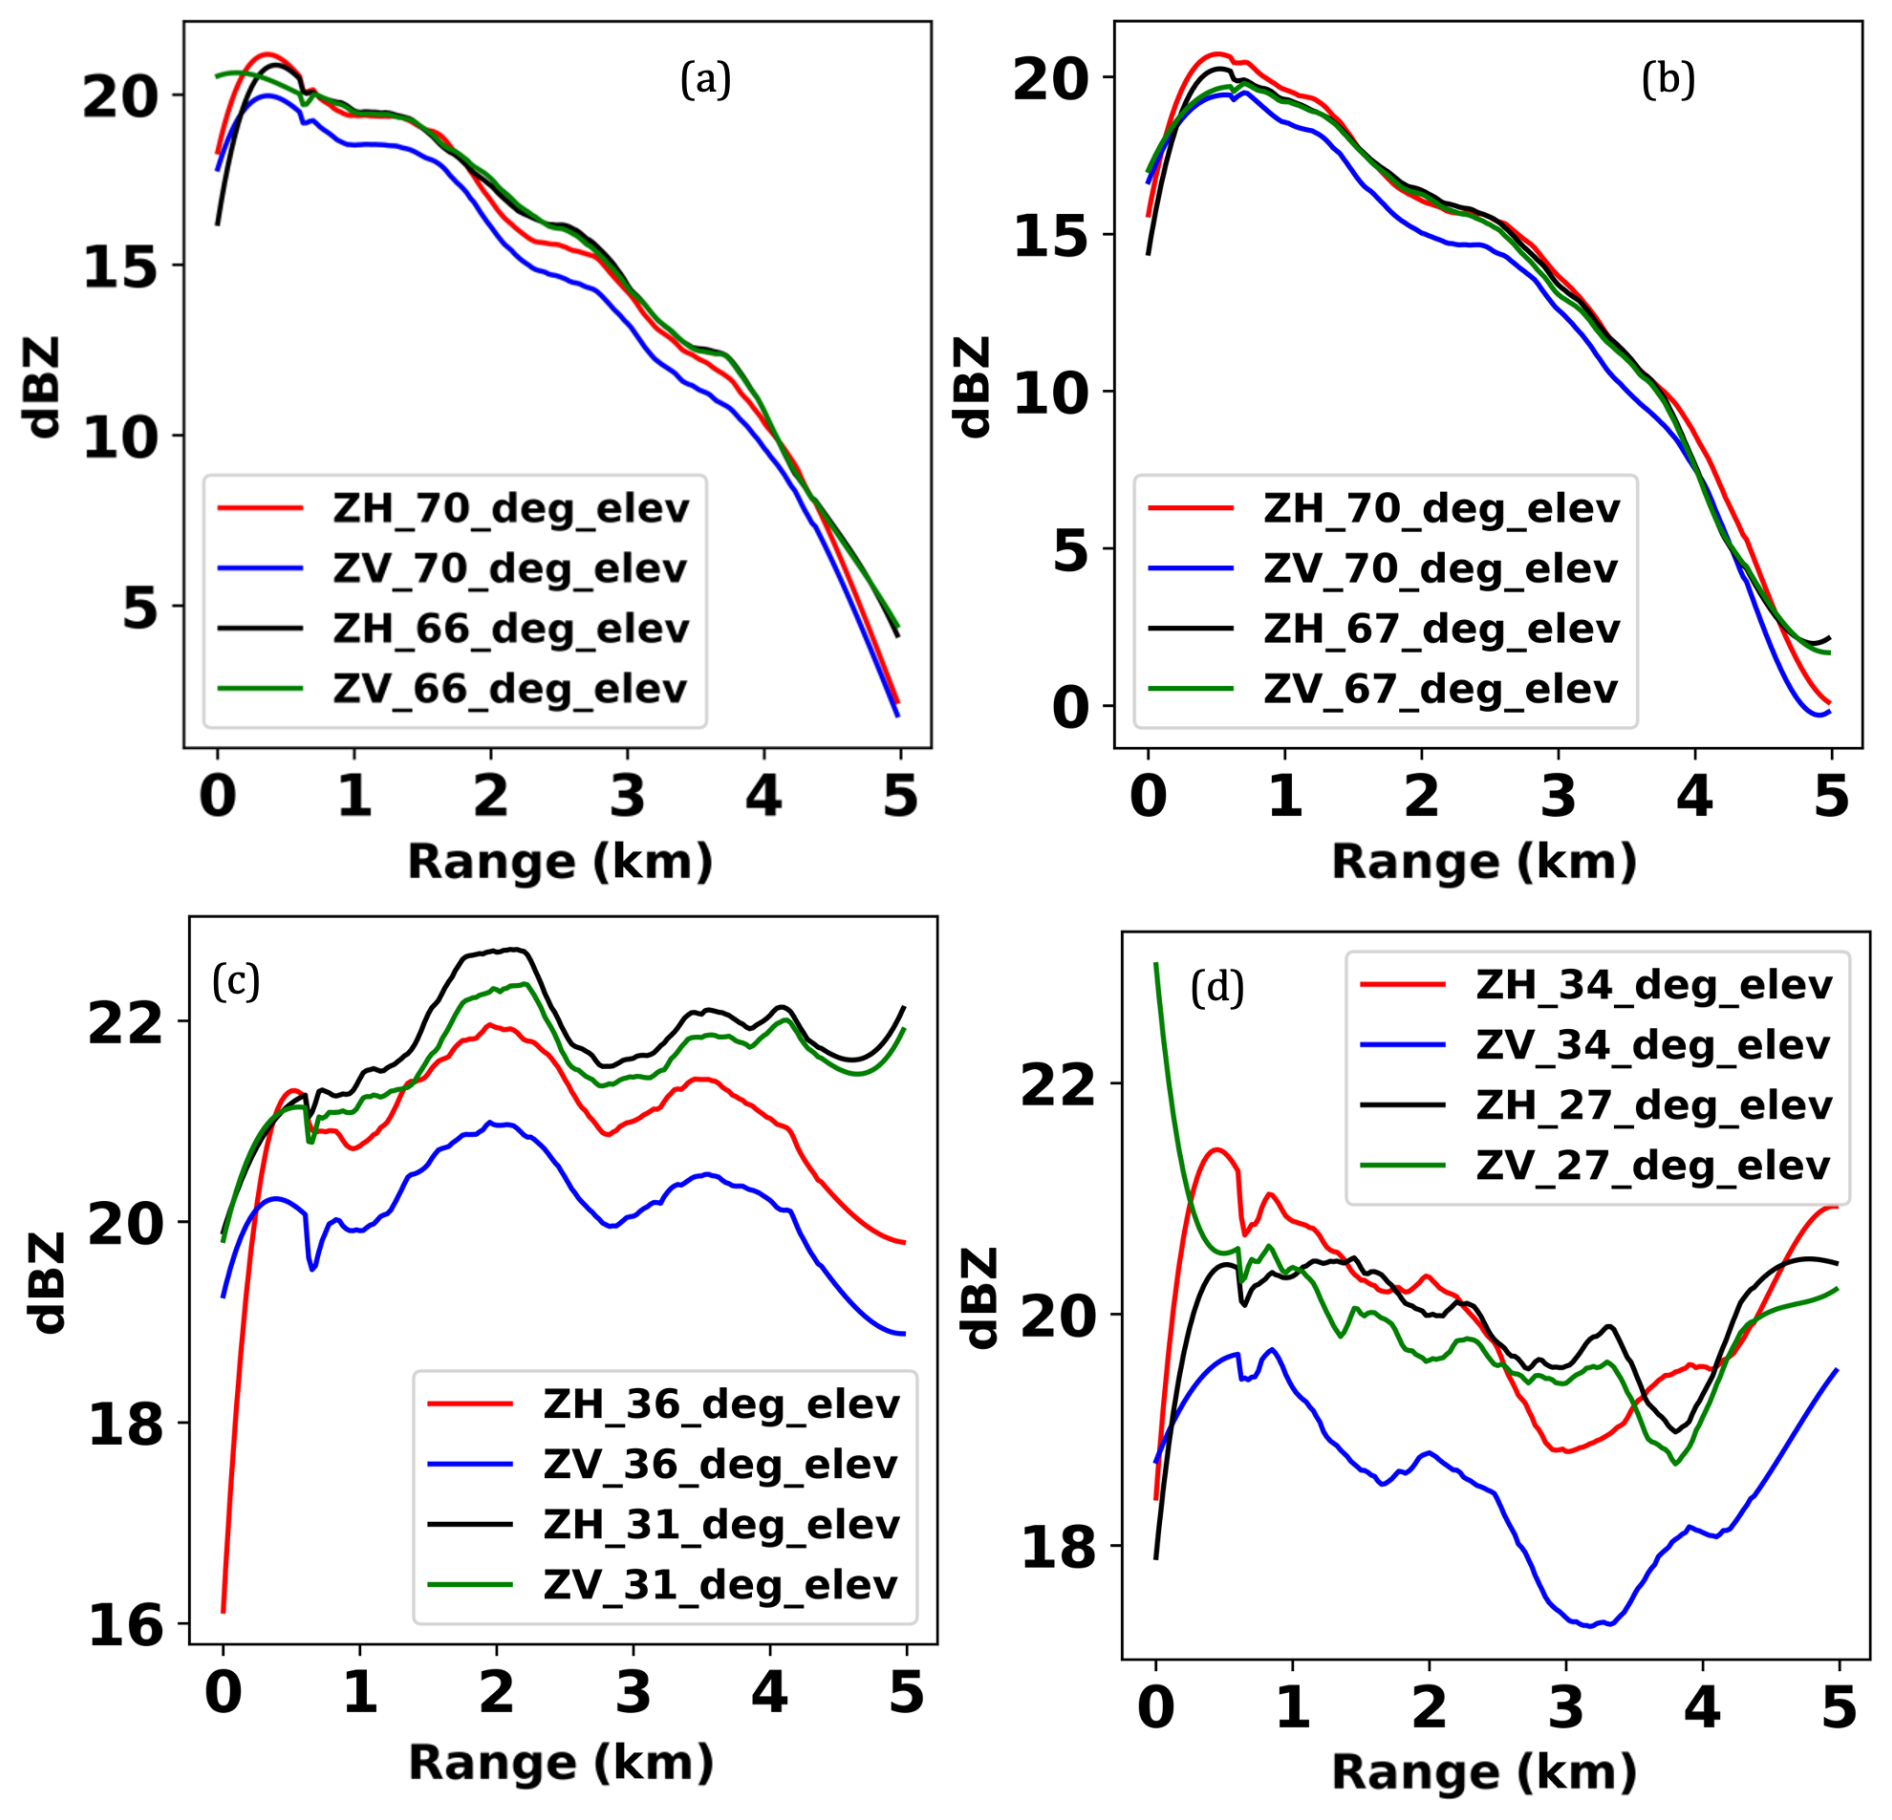
Figure 2The temporal median of horizontal and vertical reflectivity was obtained from RHI scan angles of (a) 28°, (b) 300°, (c) 45° and (d) 76°, with corresponding elevation angles showing positive ZDR bias in red and blue (70, 36 and 34°) and unbiased elevation angles in green and black (66, 67, 31 and 27°) on 3 February 2022.
Figure 2a and b show that the horizontal reflectivity values in biased and unbiased elevation angles (red, black) exhibit a consistent covariation pattern with a negligible offset. Consequently, one would expect the vertical reflectivity values (blue, green) to follow a similar trend. However, it is observed that the vertical reflectivity values correlate with each other but with an offset. Specifically, the biased elevation angle's vertical reflectivity (blue) has a negative offset compared to the unbiased elevation angle's vertical reflectivity (green). At lower elevation angles of RHI scans, where the variance of reflectivity values across the range direction is limited, a noticeable decrease in vertical reflectivity in the biased region is prominent. Specifically, at lower elevation angles of the RHI scans at 45 and 76° of azimuth (Fig. 2c and d), the vertical reflectivity values in the biased region are noticeably lower than their corresponding horizontal and vertical reflectivity values in the unbiased region. This indicates that the metal joints have exerted a notable influence on the propagation of microwaves, particularly regarding vertical polarization. This influence has led to a systematic bias in ZDR.
From Fig. 4a and c, it can be noted that PHIDP and ZDR exhibit biases at somewhat different azimuth angle locations. The observed bias in ZDR at varying angles, compared to the bias in PHIDP, can be attributed to distinct scattering characteristics. The ZDR's azimuthal bias could arise from factors related to the scattering of incident power from the main lobe around the metallic threads, which could potentially amplify the impact of the sidelobes. These increased sidelobe levels cause more energy to be radiated or received in undesirable directions, potentially amplifying susceptibility to noise or interference from those directions (Frech et al., 2013). This differs from the PHIDP's bias, which is primarily influenced by the path length the radar signals traverse (Li et al., 2017). Hence, the PHIDP bias is observed in the direction of the radome joints. Detailed simulations or measurements are imperative for a comprehensive understanding of the precise impact of radome joints on sidelobe levels, phase delays, and their correlation with ZDR and PHIDP.
This study introduces a DFT algorithm to mitigate the spatial bias present in the polarimetric variables. The correction procedure starts by performing a discrete Fourier transform on a single radar scan, which, in this case, corresponds to the 76° azimuth RHI scan measured on 3 February 2022 at 01:08 UTC (Fig. 3a). A one-dimensional DFT is applied along the range direction to the first 100 radar gates containing rain near the radar in order to process the polarimetric variable x for a particular azimuth or elevation angle θ and N total range gates, as shown in Eq. (1), where n and k represent the range gate and frequency index, respectively. The transformation F[k] is repeated for each angle θ, respectively azimuth for PPI scans and elevation for RHI scans, systematically covering the entire radar scan to obtain F[θ,k].

Figure 3A 76° RHI scan of ZDR measured on 3 February 2022 at 01:08 UTC before and after correction (a, b). Three-dimensional power spectrogram (c). The power from the zeroth-frequency (DC) component (blue), adaptive threshold values (dotted red) and the reduced zeroth-frequency power after the application of the correction factor (d).
Subsequently, the power spectrum (P[θ,k]) is calculated from the obtained Fourier transform (F[θ,k]) for each azimuth or elevation angle, as depicted in Fig. 3c. In Fig. 3c, a three-dimensional representation is shown, illustrating the power spectrum obtained from the DFT for each elevation angle of the RHI scan. Notably, the power value of the zeroth-frequency component (P[θ,0]) derived from various elevation angles, representing the DFT's DC component, reveals three distinct peaks corresponding to the spatial bias pattern observed in the RHI scan in Fig. 3a. This indicates that a bias caused by the radome joints will result in a constant positive increase in the magnitude all along the range, an offset which will show up as an increase in the power value of the DC component of the DFT spectrum.
To address this bias, a correction factor () is introduced to filter the three peaks (Fig. 3d) associated with the spatial bias. Notably, the correction factor is only applied to the DC component values (F[θ,0]) that exceed a certain adaptive threshold.
For all other frequency components k ≠ 0, the values remain unchanged:
The threshold value is determined based on the moving median window of the power spectrum at the zeroth frequency (Median(P[θ,0])). For PPI scans, the moving median window encompasses all azimuth angles, covering a full 360°. In the case of RHI scans, the window includes all available 88 elevation angles. This approach simplifies implementation by eliminating the need to define specific window sizes, which could vary with different scans or atmospheric conditions. The correction factor is calculated as the ratio between the median values of F[θ,0] corresponding to the power values below the threshold (A) and the median values of F[θ,0] corresponding to the power values above the threshold (B).
Consequently, the zeroth-frequency values that surpass the threshold are multiplied by the calculated correction factor, while the remaining values are left uncorrected. Figure 3d shows that the power P[θ,0] from the DC component is characterized by distinct peaks alongside the depiction of the adaptive threshold values and the reduced power after applying the correction factor. To derive the corrected ZDR image (Fig. 3b), an inverse Fourier transform is performed on all frequencies, encompassing the corrected DC component.
The performance of the adaptive DFT filtering algorithm is assessed across different scan strategies (PPI and RHI) and different polarimetric moments (ZDR and PHIDP) to determine its effectiveness. Figures 3a and 4a show increased spatial variability in ZDR at specific azimuth and elevation angles of RHI and PPI scans, respectively, with a maximum variability of around 1.5–2 dB observed. Similarly, Figs. 4c and 5a depict increased spatial variability in PHIDP in PPI and RHI scans, with a magnitude of variability of around 8 to 10°. The application of the algorithm led to a substantial reduction in variability, as shown in Figs. 3b, 4b and d, and 5b. The proposed algorithm reduced the spurious ZDR variability from 1.5–2 to 1–1.34 dB, and the PHIDP variability was reduced to less than 5°. The results indicate the algorithm's effectiveness in mitigating spatial variability in both ZDR and PHIDP values across all elevation angles and scanning strategies.
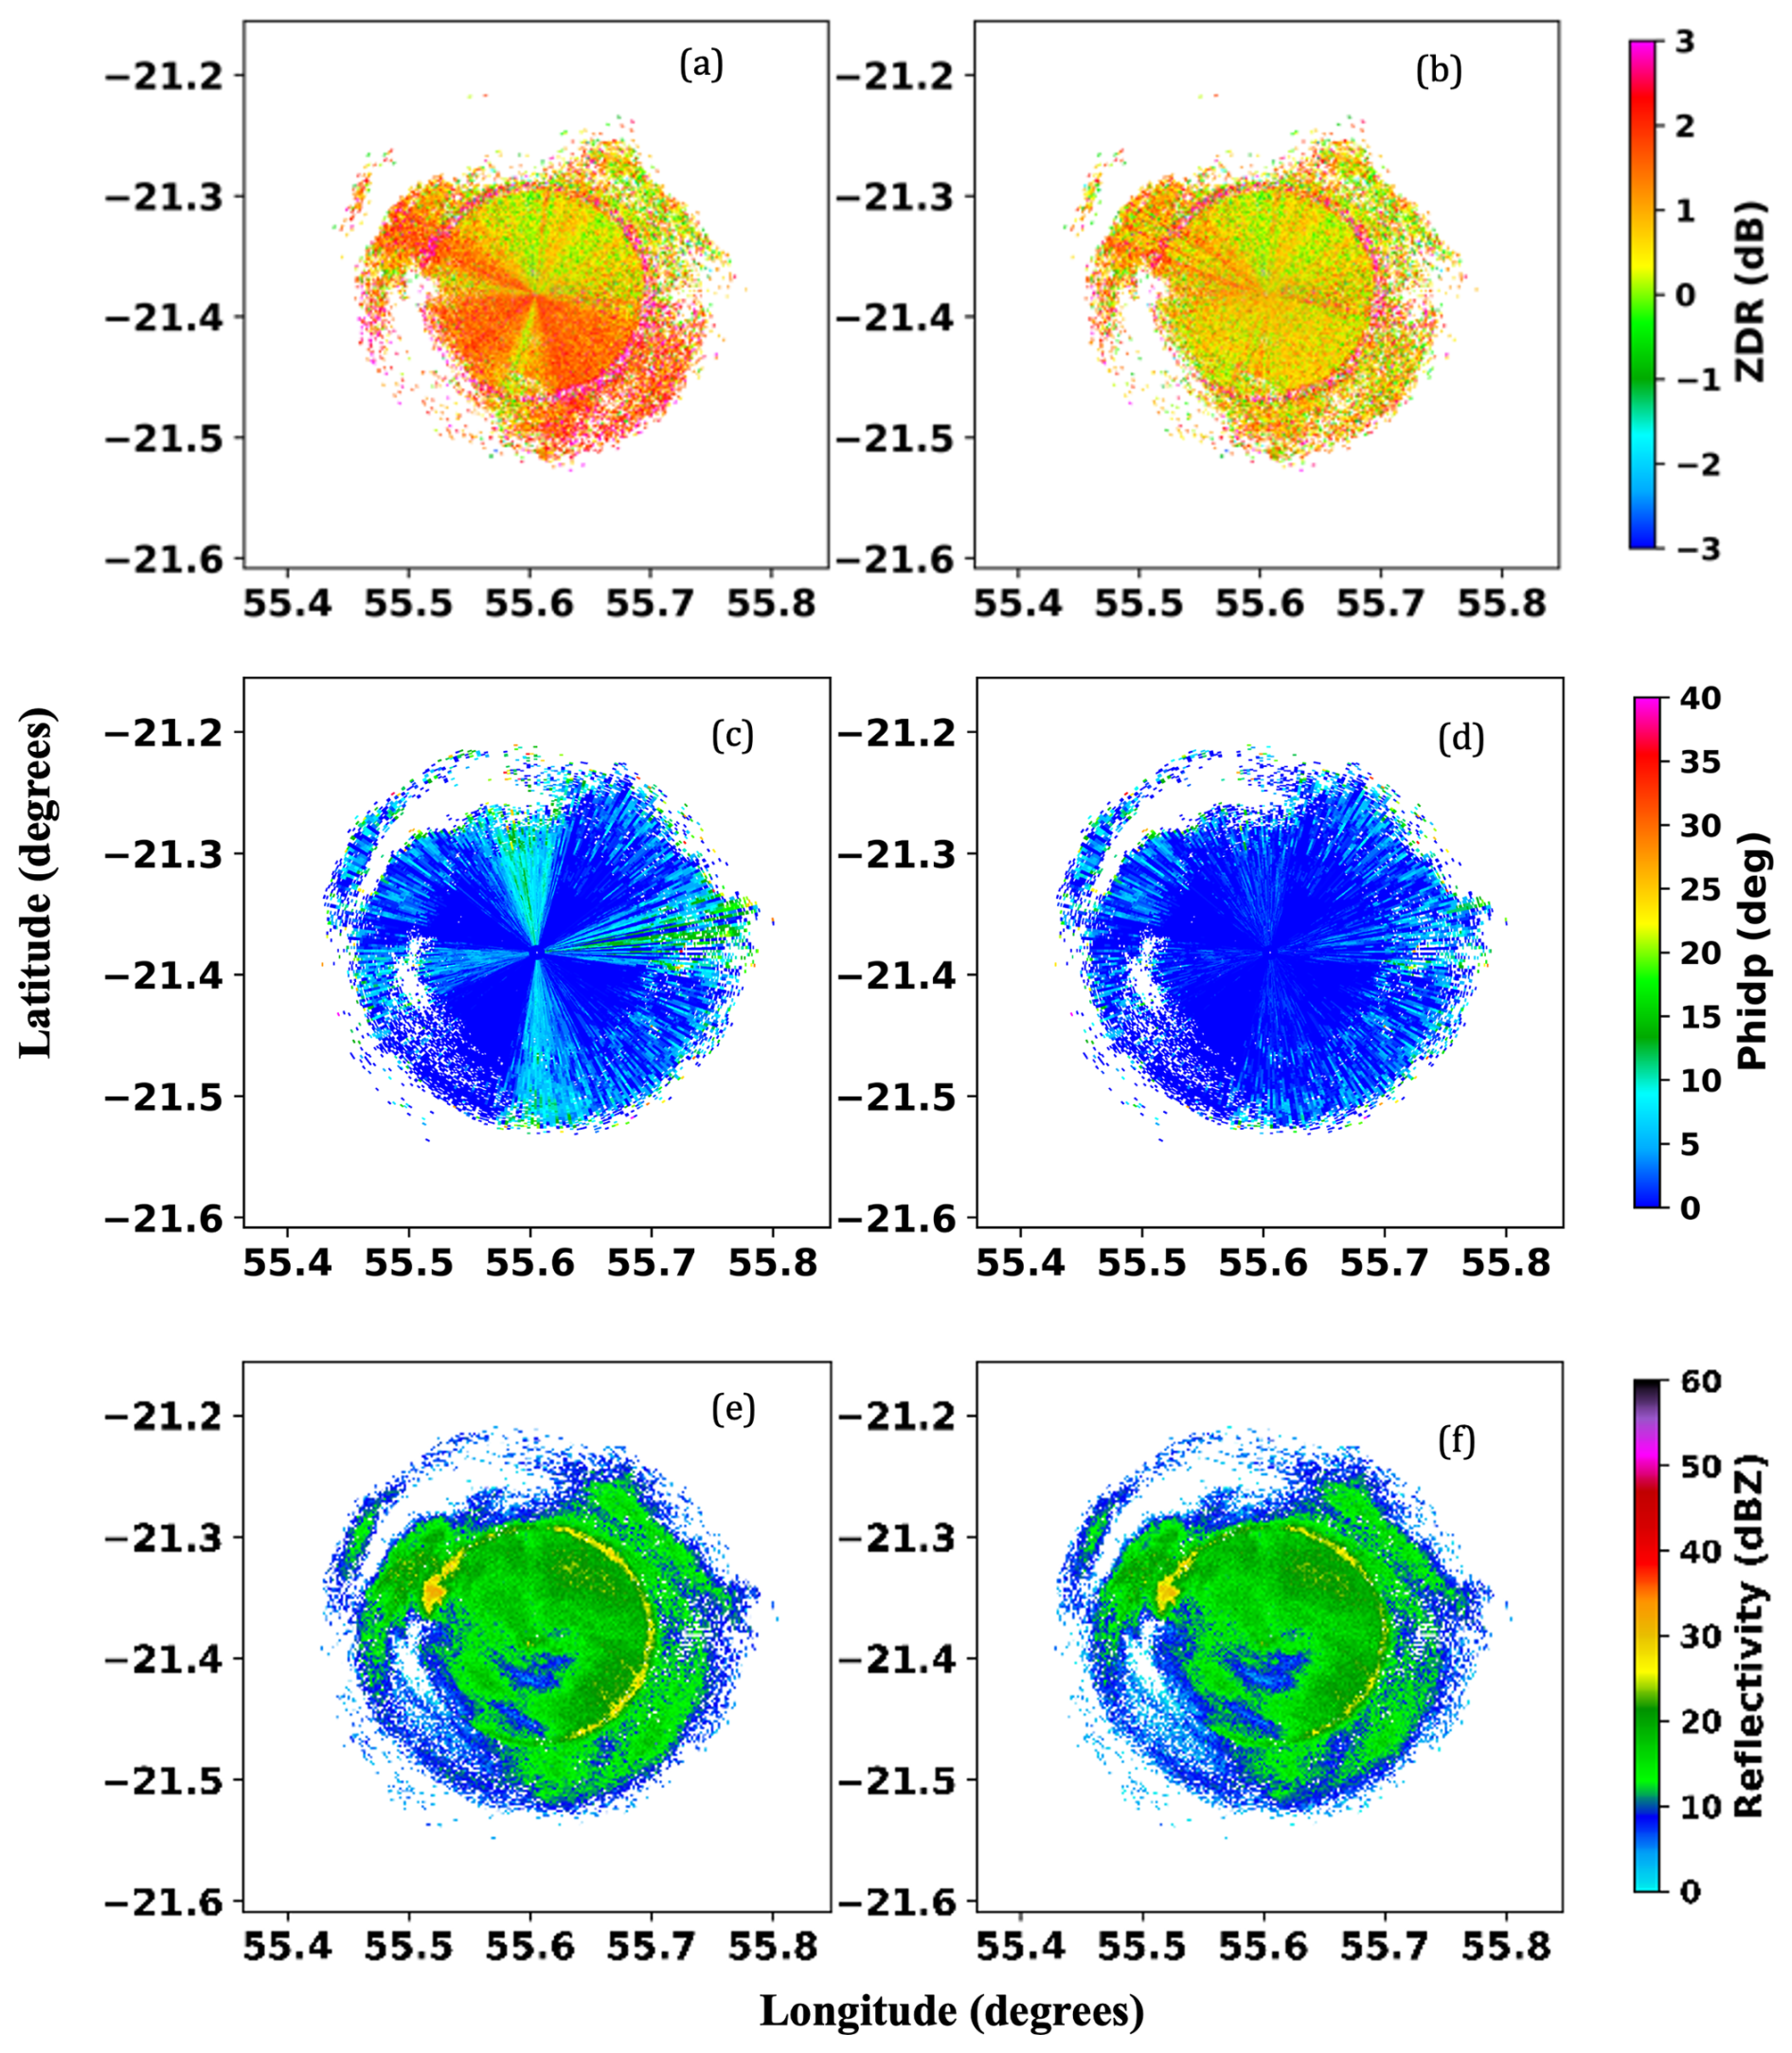
Figure 4A 29° PPI scan of ZDR. PHIDP before correction (a, c) and after correction (b, d). Horizontal (e) and vertical reflectivity (f) measured on 3 February 2022 at 01:50 UTC.
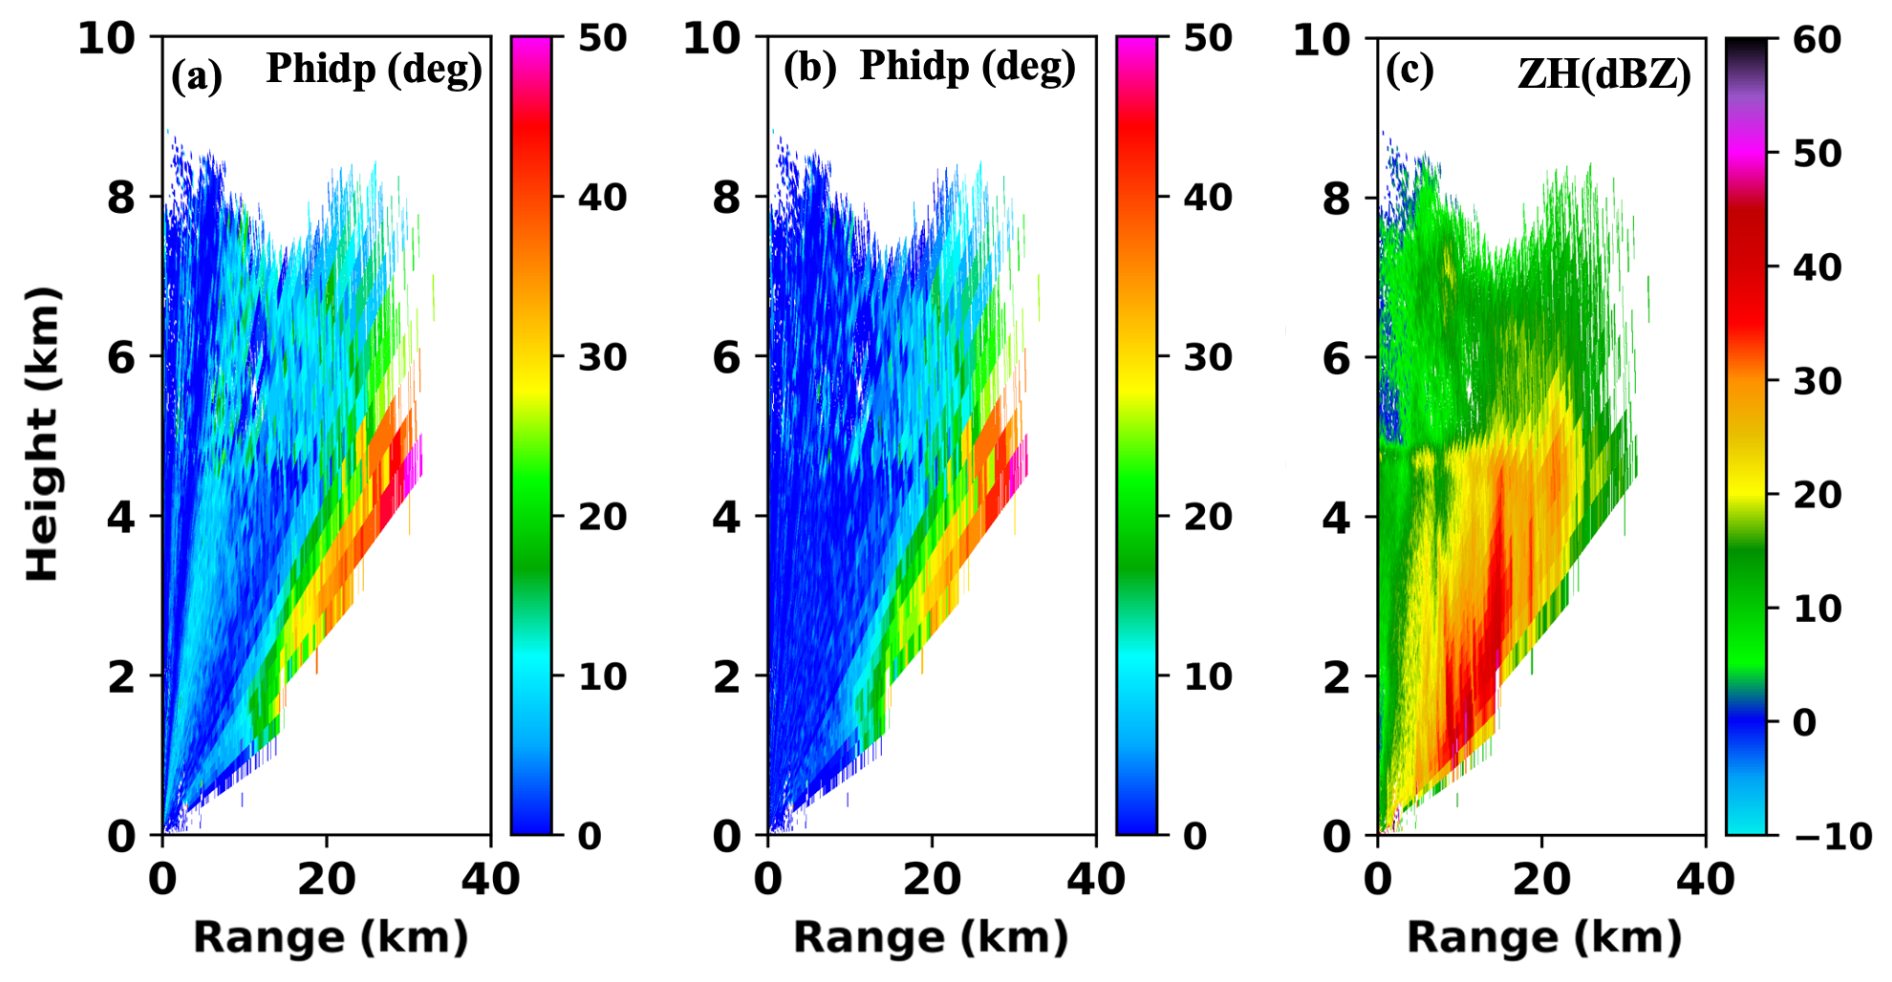
Figure 5A 28° RHI scan of PHIDP before and after correction (a, b) along with ZH (c) on 3 February 2022 at 01:28 UTC.
The relationship between ZDR and ZH provides insights into how raindrops deviate from a perfect spherical shape. Larger raindrops exhibit higher horizontal reflectivity and have their long axis oriented in the horizontal direction compared to the vertical direction, thereby showing signatures of higher ZDR values. Conversely, for lower values of horizontal reflectivity (less than 30 dBZ), we generally expect a ZDR value of nearly 0 dB due to the near-spherical shape of small drops. Therefore, comparing the relationship between ZH and ZDR before and after applying the algorithm (Fig. 6) shows how the correction has brought the biased ZDR close to the expected value. Figure 6a and b show the joint histogram of ZDR and ZH for all the PPI scans conducted on 3 February 2022 before and after applying the correction algorithm, with the marginal distribution of ZH in the top and the marginal distribution of ZDR on the right side. Likewise, Fig. 6c and d show the joint histogram of ZDR and ZH for all the RHI scans on the same date, before and after applying the correction algorithm. Figure 6a and b encompass data from all PPI scans covering various azimuth angles and distances, whereas Fig. 6c and d are specific to the RHIs for the four azimuth angles chosen in Fig. 2. This distinction accounts for the differences between Fig. 6a and c (and likewise Fig. 6b and d). As these figures capture the data before any attenuation correction, the reflectivity distribution ranges from light drizzle (near 0 dBZ) to heavy rainfall (≅ 40 dBZ). It can be observed from Fig. 6a and c that the distribution of ZDR extends significantly beyond 2 dB for reflectivity values below 30 dBZ. Such increases arise from the positive spatial bias in ZDR discussed in Figs. 3a and 4a. The impact of the developed algorithm on the distribution of ZDR is highlighted in Fig. 6b and d. Following the correction, the mean distribution of ZDR shifts towards values closer to zero, approaching the theoretical values at lower reflectivity. Furthermore, the correction also results in a noticeable increase in negative values of ZDR, indicating the presence of differential attenuation fingerprints, a common occurrence in X-band radar systems, which were not as discernible before the correction. Figure 6b and d reveal the impact of the algorithm in successfully addressing the positive bias in ZDR.
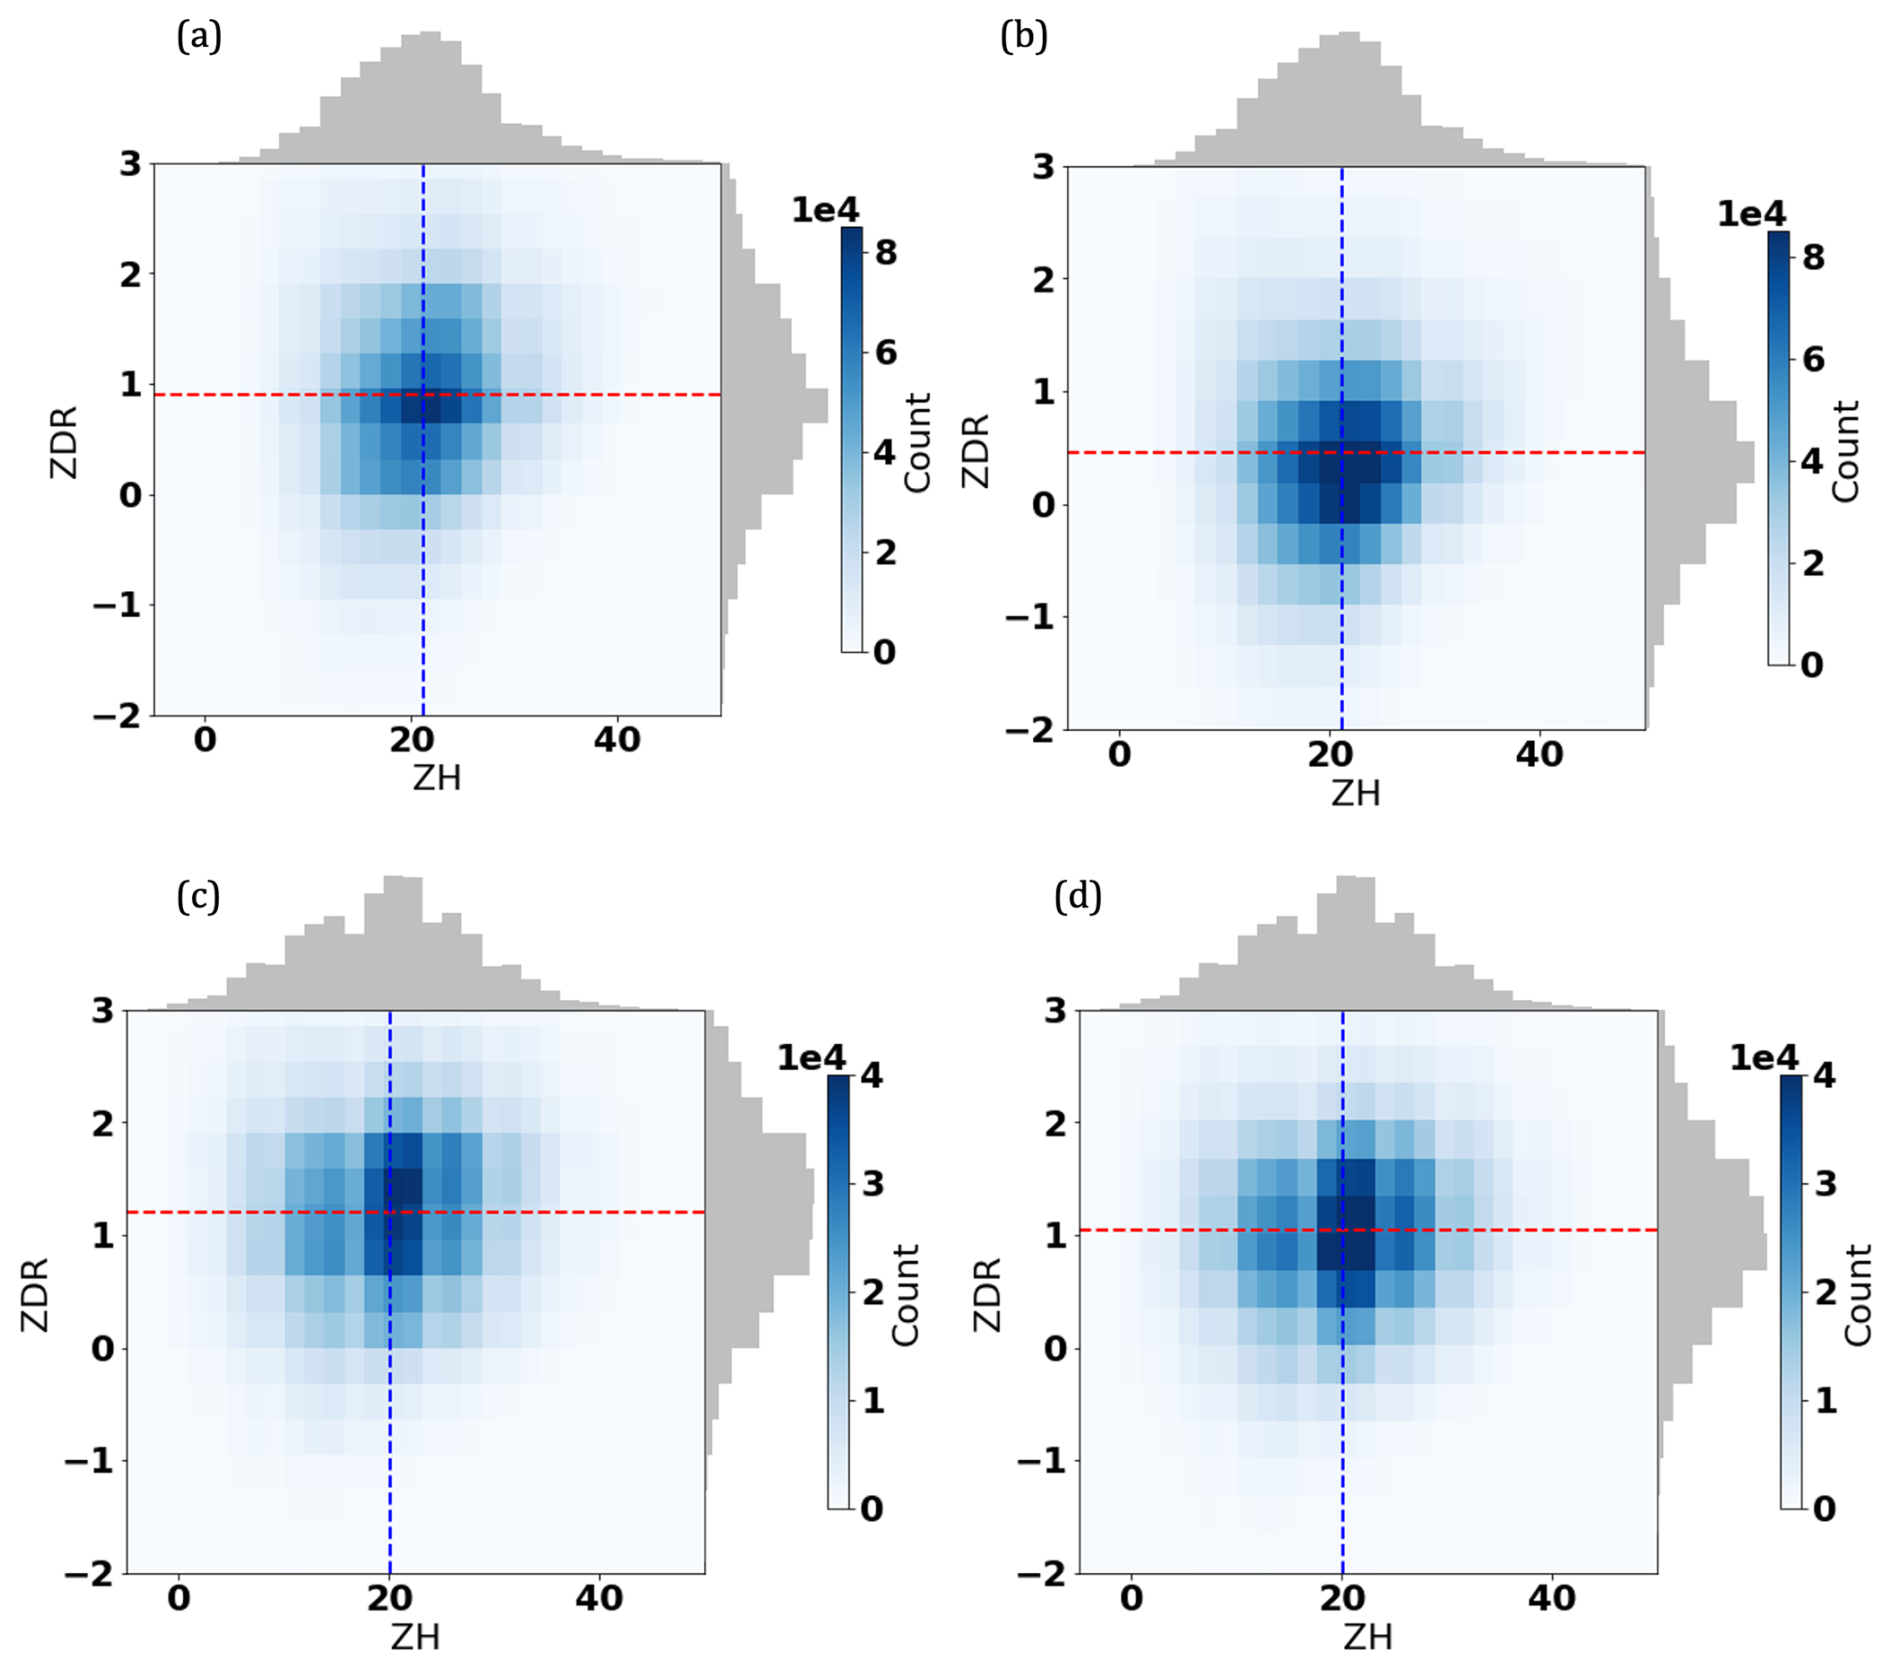
Figure 6Joint histograms of ZDR and ZH for PPI scans (a) before and (b) after correction, as well as RHI scans (c) before and (d) after correction, all from scans conducted on 3 February 2002, with the marginal distribution of ZH in the top and the marginal distribution of ZDR on the right side. The dotted red line represents the median of ZDR, while the dotted blue line represents the median of ZH.
This study investigates the impact of radome joints on the polarimetric variables of a portable X-band weather radar. The radome design introduces spatially dependent biases in polarimetric variables due to preferential loss of power in vertical polarization caused by metallic thread alignment. Due to the stochastic nature of radar measurements, these spatial errors exhibit variability across different scans. This study proposes a novel adaptive DFT algorithm to address the changing bias. The algorithm is formulated with the understanding that the bias caused by the radome joints remains constant along the range. Consequently, the DFT applied along the range exhibits an increase in magnitude in the zeroth-frequency component (DC) for azimuth angles aligned with the radome joint positions compared to those misaligned. This leads to varying offset values of polarimetric variables across azimuths and elevations depending on the radar beam position with respect to the radome joint positions. The algorithm detects and reduces the spatial bias pattern by suppressing the increase in offset values.
The algorithm's performance in mitigating the positive spatial bias in ZDR and PHIDP is evaluated by applying the algorithm in the PPI and RHI polarimetric variable scans measured during the Cyclone Batsirai event on 3 February 2022. The results show that the adaptive DFT algorithm presented herein effectively addresses the spatial biases, enhancing the accuracy of ZDR and PHIDP measurements regardless of the scan type.
As the primary source of spatial bias originates from vertical polarization, the algorithm's effectiveness is further validated by examining the relationship between ZH and ZDR values. Notably, the correction reduces the positive bias observed in ZDR at lower reflectivity levels, bringing the mean ZDR value closer to the expected levels. Additionally, the algorithm reveals negative ZDR values, indicating the presence of attenuation fingerprints.
The proposed algorithm has limitations related to sample size and precipitation type. To effectively distinguish between meteorological targets and bias, it requires a large, noise-free sample along the range direction. Additionally, its performance relies on suppressing variations in the magnitude of the DC component of DFT observed across continuous azimuth angles. As a result, the algorithm performs optimally in scenarios characterized by uniform precipitation, such as stratiform precipitation and large convective systems that cover extensive areas around the radar. However, for isolated or scattered precipitation systems located in limited range and azimuth gates, the algorithm's performance needs to improve due to its inability to capture variations in the DC component magnitude derived from the DFT. To advance future research and potential improvements, an area of interest lies in evaluating the proposed algorithm's performance by conducting measurements both with and without the radome. An additional consideration is the possibility of incorporating a seamless monoblock radome as a future plan.
The code is available upon request from the authors.
All radar data are available at https://geosur.osureunion.fr/thredds/catalog/researchprogram/espoirs/1-Saint_Joseph/RADAR/Data/az-vol-75-0125-1to25deg-2022-01/2022/02/catalog.html (Lesage, 2025). For information on rain gauge data, please send requests to ambinintsoa.ramanamahefa@univ-reunion.fr or visit the Météo-France website, https://portail-api.meteofrance.fr/web/fr/api/DonneesPubliquesObservation (last access: 21 February 2025).
PT developed the algorithm, implemented the data analysis and wrote the paper. GL and AVR contributed to the implementation of the methodology and revised the paper. JVB revised the paper and led the ESPOIRS project and radar field deployments.
The contact author has declared that none of the authors has any competing interests.
Publisher's note: Copernicus Publications remains neutral with regard to jurisdictional claims made in the text, published maps, institutional affiliations, or any other geographical representation in this paper. While Copernicus Publications makes every effort to include appropriate place names, the final responsibility lies with the authors.
This work is part of the INTERREG V ESPOIRS (Study of Precipitating Systems in the Indian Ocean by Radar and Satellites) project. The ESPOIRS scientific program is led by LACy (University of La Réunion/CNRS/Météo-France) and funded by the European Union (FEDER program, GURDTI/20201589-0021087), the Réunion region, SGAR-Réunion, the French state (CPER) and the University of La Réunion.
This research was funded by the European Union (FEDER program, grant no. GURDTI/20201589-0021087), the Réunion region, SGAR-Réunion, the French state (CPER), and the University of La Réunion.
This paper was edited by Gianfranco Vulpiani and reviewed by two anonymous referees.
Figueras i Ventura, J., Boumahmoud, A. A., Fradon, B., Dupuy, P., and Tabary, P.: Long-term monitoring of French polarimetric radar data quality and evaluation of several polarimetric quantitative precipitation estimators in ideal conditions for operational implementation at C-band, Q. J. Roy. Meteor. Soc., 138, 2212–2228, https://doi.org/10.1002/qj.1934, 2012.
Figueras i Ventura, J., Schauwecker, Z., Lainer, M., and Grazioli, J.: On the Effect of Radome Characteristics on Polarimetric Moments and Sun Measurements of a Weather Radar, IEEE Geosci. Remote Sens., 18, 642–646, https://doi.org/10.1109/LGRS.2020.2981993, 2021.
Frech, M., Lange, B., Mammen, T., Seltmann, J., Morehead, C., and Rowan, J.: Influence of a radome on antenna performance, J. Atmos. Ocean. Tech., 30, 313–324, https://doi.org/10.1175/JTECH-D-12-00033.1, 2013.
Georgis, J. F., Roux, F., and Hildebrand, P. H.: Observation of Precipitating Systems over Complex Orography with Meteorological Doppler Radars: A Feasibility Study, Meteorol. Atmos. Phys., 72, 185–202, https://doi.org/10.1007/s007030050015, 2000.
Gourley, J. J., Tabary, P., and du Chatelet, J. P.: Data Quality of the Meteo-France C-Band Polarimetric Radar, J. Atmos. Ocean. Tech., 23, 1340–1356, https://doi.org/10.1175/JTECH1912.1, 2006.
Lesage, G.: OSU-Réunion: Catalogue de données – OSU-Réunion, Radar Data from Saint Joseph (az-vol-75-0125-1to25deg-2022-01) [data set], available at: https://geosur.osureunion.fr/thredds/catalog/researchprogram/espoirs/1-Saint_Joseph/RADAR/Data/az-vol-75-0125-1to25deg-2022-01/2022/02/catalog.html (last access: 21 Februray 2025), 2025.
Li, P., Li, N., Xu, W., and Song, L.: Phase Compensation of Composite Material Radomes Based on the Radiation Pattern, Chin. J. Mech. Eng. (English Edition), 30, 587–594, https://doi.org/10.1007/s10033-017-0133-1, 2017.
Mishra, S., Sarkar, M., and Daniel, A.: Optimization of radome wall and joint for X-band reflector antenna using Floquet modal analysis, J. Electromagn. Waves Appl., 28, 1257–1268, https://doi.org/10.1080/09205071.2014.914859, 2014.
Park, S.-G., Bringi, V. N., Chandrasekar, V., Maki, M., and Iwanami, K.: Correction of Radar Reflectivity and Differential Reflectivity for Rain Attenuation at X Band. Part I: Theoretical and Empirical Basis, J. Atmos. Ocean. Tech., 22, 1621–1632, https://doi.org/10.1175/JTECH1803.1, 2005.
Ryzhkov, A. V., Zhuravlyov, V. B., and Rybakova, N. A.: Preliminary Results of X-Band Polarization Radar Studies of Clouds and Precipitation, J. Atmos. Ocean. Tech., 11, 132–139, https://doi.org/10.1175/1520-0426(1994)011<0132:PROXBP>2.0.CO;2, 1994.