the Creative Commons Attribution 4.0 License.
the Creative Commons Attribution 4.0 License.
 | 11 Mar 2025
Development of a portable laser-flash photolysis Faraday rotation spectrometer for measuring atmospheric total OH reactivity
Nana Wei
Nana Yang
Hao Zhou
Heng Zhang
Jiarong Li
Weijun Zhang
Yanyu Lu
Zhu Zhu
Yue Liu
Quantitative measurements of atmospheric total OH reactivity () provide crucial insights into atmospheric photochemistry. However, widespread application of total OH reactivity measurements is challenging due to insufficient equipment and the complexity of existing instrumentation. In this work, we report the development of a portable laser-flash photolysis Faraday rotation spectroscopy (LP-FRS) instrument for real-time and in situ measurement of . To achieve efficient overlapping between the pump and probe laser and realize a long effective absorption path length, thus enabling high-sensitivity measurement, a specific Herriott-type pump–probe optical multi-pass cell was designed. The instrument's optical box dimensions were 130 cm × 40 cm × 35 cm. The obtained effective absorption path was ∼ 28.5 m in a base length of 77.2 cm. The detection precisions of the LP-FRS instrument were 2.3 and 1.0 s−1 with averaging times of 60 and 300 s, respectively. The measurement uncertainty was evaluated to be within 2 s−1. Field measurement was performed, and the difference between the measured and the model simulated from the measured reactive species was analysed. The developed portable LP-FRS instrument extends the measurement methods of atmospheric total OH reactivity and has certain advantages in terms of cost, operation, and transportation, which will play an increasingly important role in future atmospheric chemistry research.
- Article
(4859 KB) - Full-text XML
- BibTeX
- EndNote


The hydroxyl (OH) radical is the most important oxidant in the atmosphere during daytime. It initiates the oxidation of most natural and anthropogenic trace gas species, thereby dominating their atmospheric lifetimes. Knowledge of tropospheric OH chemistry contributes to our understanding of air pollution and climate change (Lu et al., 2018; Nicely et al., 2018). However, due to the large number (104–105) of volatile organic compounds (VOCs) (Goldstein and Galbally, 2007), a comprehensive interpretation of the sink mechanisms of OH is extremely challenging.
Total OH reactivity (), the inverse of the OH chemical lifetime (τOH), serves as a crucial parameter for estimating the total loss rate of OH due to all atmospheric OH reactants (Yang et al., 2016). It is defined as the sum of OH reactant concentrations ([X]) weighted by their reaction rate coefficient with OH (kOH+X), which can be expressed as
where Xi is the ith reactant. Measurement of provides a powerful tool for both field campaigns and laboratory studies in atmospheric photochemistry (Stone et al., 2012; Fuchs et al., 2013). The balance between OH production and loss rate provides additional information on the OH sources (Martinez et al., 2003; Hens et al., 2014). The difference between measured and calculated can be used to estimate the contribution from individually measured species, the total missing reactivity, and the role of unknown VOCs (Di Carlo et al., 2004; Mao et al., 2010; Sinha et al., 2012). The measured total OH reactivity can also be used as the chemical closure of the reactive carbon budget (Hunter et al., 2017; Safieddine et al., 2017; Heald et al., 2020). In addition, measurements help to estimate instantaneous production potential and the production regime of ozone (Sinha et al., 2012; Li et al., 2021, 2022; Kohno et al., 2022). Recently, the long-term trend in has been proven to be a key atmospheric oxidation capacity parameter for the formulation of ozone (O3) pollution mitigation strategies (Wang et al., 2023).
Several methods for OH reactivity measurement have been developed (Yang et al., 2016; Fuchs et al., 2017), which can be divided into three categories: the indirect method, known as the comparative reactivity method (CRM) (Sinha et al., 2008, Kumar and Sinha, 2014; Michoud et al., 2015; Kim et al., 2016; Praplan et al., 2017; Yang et al., 2017); the semi-direct technique, involving flow tube–chemical ionization mass spectrometry (FT-CIMS) (Muller et al., 2018); and the direct method, including flow tube–laser-induced fluorescence (FT-LIF) (Kovacs and Brune, 2001; Mao et al., 2009; Ingham et.al., 2009; Hansen et al., 2014) and laser-flash photolysis–laser-induced fluorescence (LP-LIF) (Sadanaga et al., 2004; Lou et al., 2010; Parker et al., 2011; Stone et al., 2016).
The CRM indirectly determines by the competitive kinetics for OH between a reference molecule not present in normal atmospheric conditions (e.g. pyrrole) and all reactive atmospheric species in ambient air. Commercial proton-transfer-reaction mass spectrometry (PTR-MS) or gas chromatography (GC) is employed to detect the concentration change in pyrrole (Nölscher et al., 2012). The direct method determined from the measured time-dependent OH decay. The FT-LIF directly measures OH decay by controlling the reaction time through the movement of an OH injector along a flow tube. An LIF instrument is positioned downstream of the flow tube to monitor the OH concentration signal intensity. The sample is then drawn into the low-pressure (∼ 1.5 Torr) cell of the LIF via gas expansion. A 308 nm dye laser is used to excite OH, and the resulting 308 nm fluorescence emitted by OH is collected for concentration evaluation. The LP-LIF is a pump–probe technique where OH decay can be observed with high time resolution after each flash, without needing to determine the reaction time from the point of OH production to the sampling position. In this technique, OH is produced by laser-flash photolysis of O3 at 266 nm across the entire illuminated area in the presence of water vapour. This makes it less susceptible to the recycling process caused by nitric oxide (NO) compared to the above instruments using water vapour photolysis (Sadanaga et al., 2004; Lou et al., 2010) because water vapour photolysis with a 184.9 nm ultraviolet (UV) lamp not only generates OH but also produces HO2 radicals. In the presence of high atmospheric NO concentrations, the reaction of HO2 with NO can lead to the reformation of OH, which may affect the measurement of . In the semi-direct technique of FT-CIMS, sulfuric acid (H2SO4) instead of OH is measured by a CIMS instrument to record the data point of OH decay at each reaction time. The reaction time can be varied by adding 10 ppmv SO2 at different fixed positions within the flow tube. Due to the titration reaction, OH is nearly completely converted to H2SO4, so the measured change in the H2SO4 concentration serves as an indicator of the OH.
Several intercomparisons of the techniques and instruments mentioned above have been conducted. Zannoni et al. (2015) reported a field intercomparison of two CRM instruments in the Mediterranean Basin. Hansen et al. (2015) carried out an intercomparison between the CRM and LP-LIF techniques in an urban environment. The series of intercomparison experiments conducted in the SAPHIR simulation chamber at Forschungszentrum Jülich involved all types of existing methods and nine instruments from around the world (Fuchs et al., 2017). The results show that indirect or semi-direct methods exhibit more scatter in measurements and are most likely limited by the corrections for known effects, such as high NO concentrations for CRM and high-reactivity conditions for FT-CIMS. In comparison, the direct methods (LIF) that combine laser-flash photolysis offer advantages in detection precision and accuracy. Overall, the existing techniques can give reasonable measurement results for a wide range of atmospheric conditions. However, the high cost of development and operation (e.g. the expensive and complex dye laser system and mass spectrometer system), limited instruments, the complex operation and calibration procedures, and the relatively large size of these instruments hinder the widespread application of measuring OH reactivity.
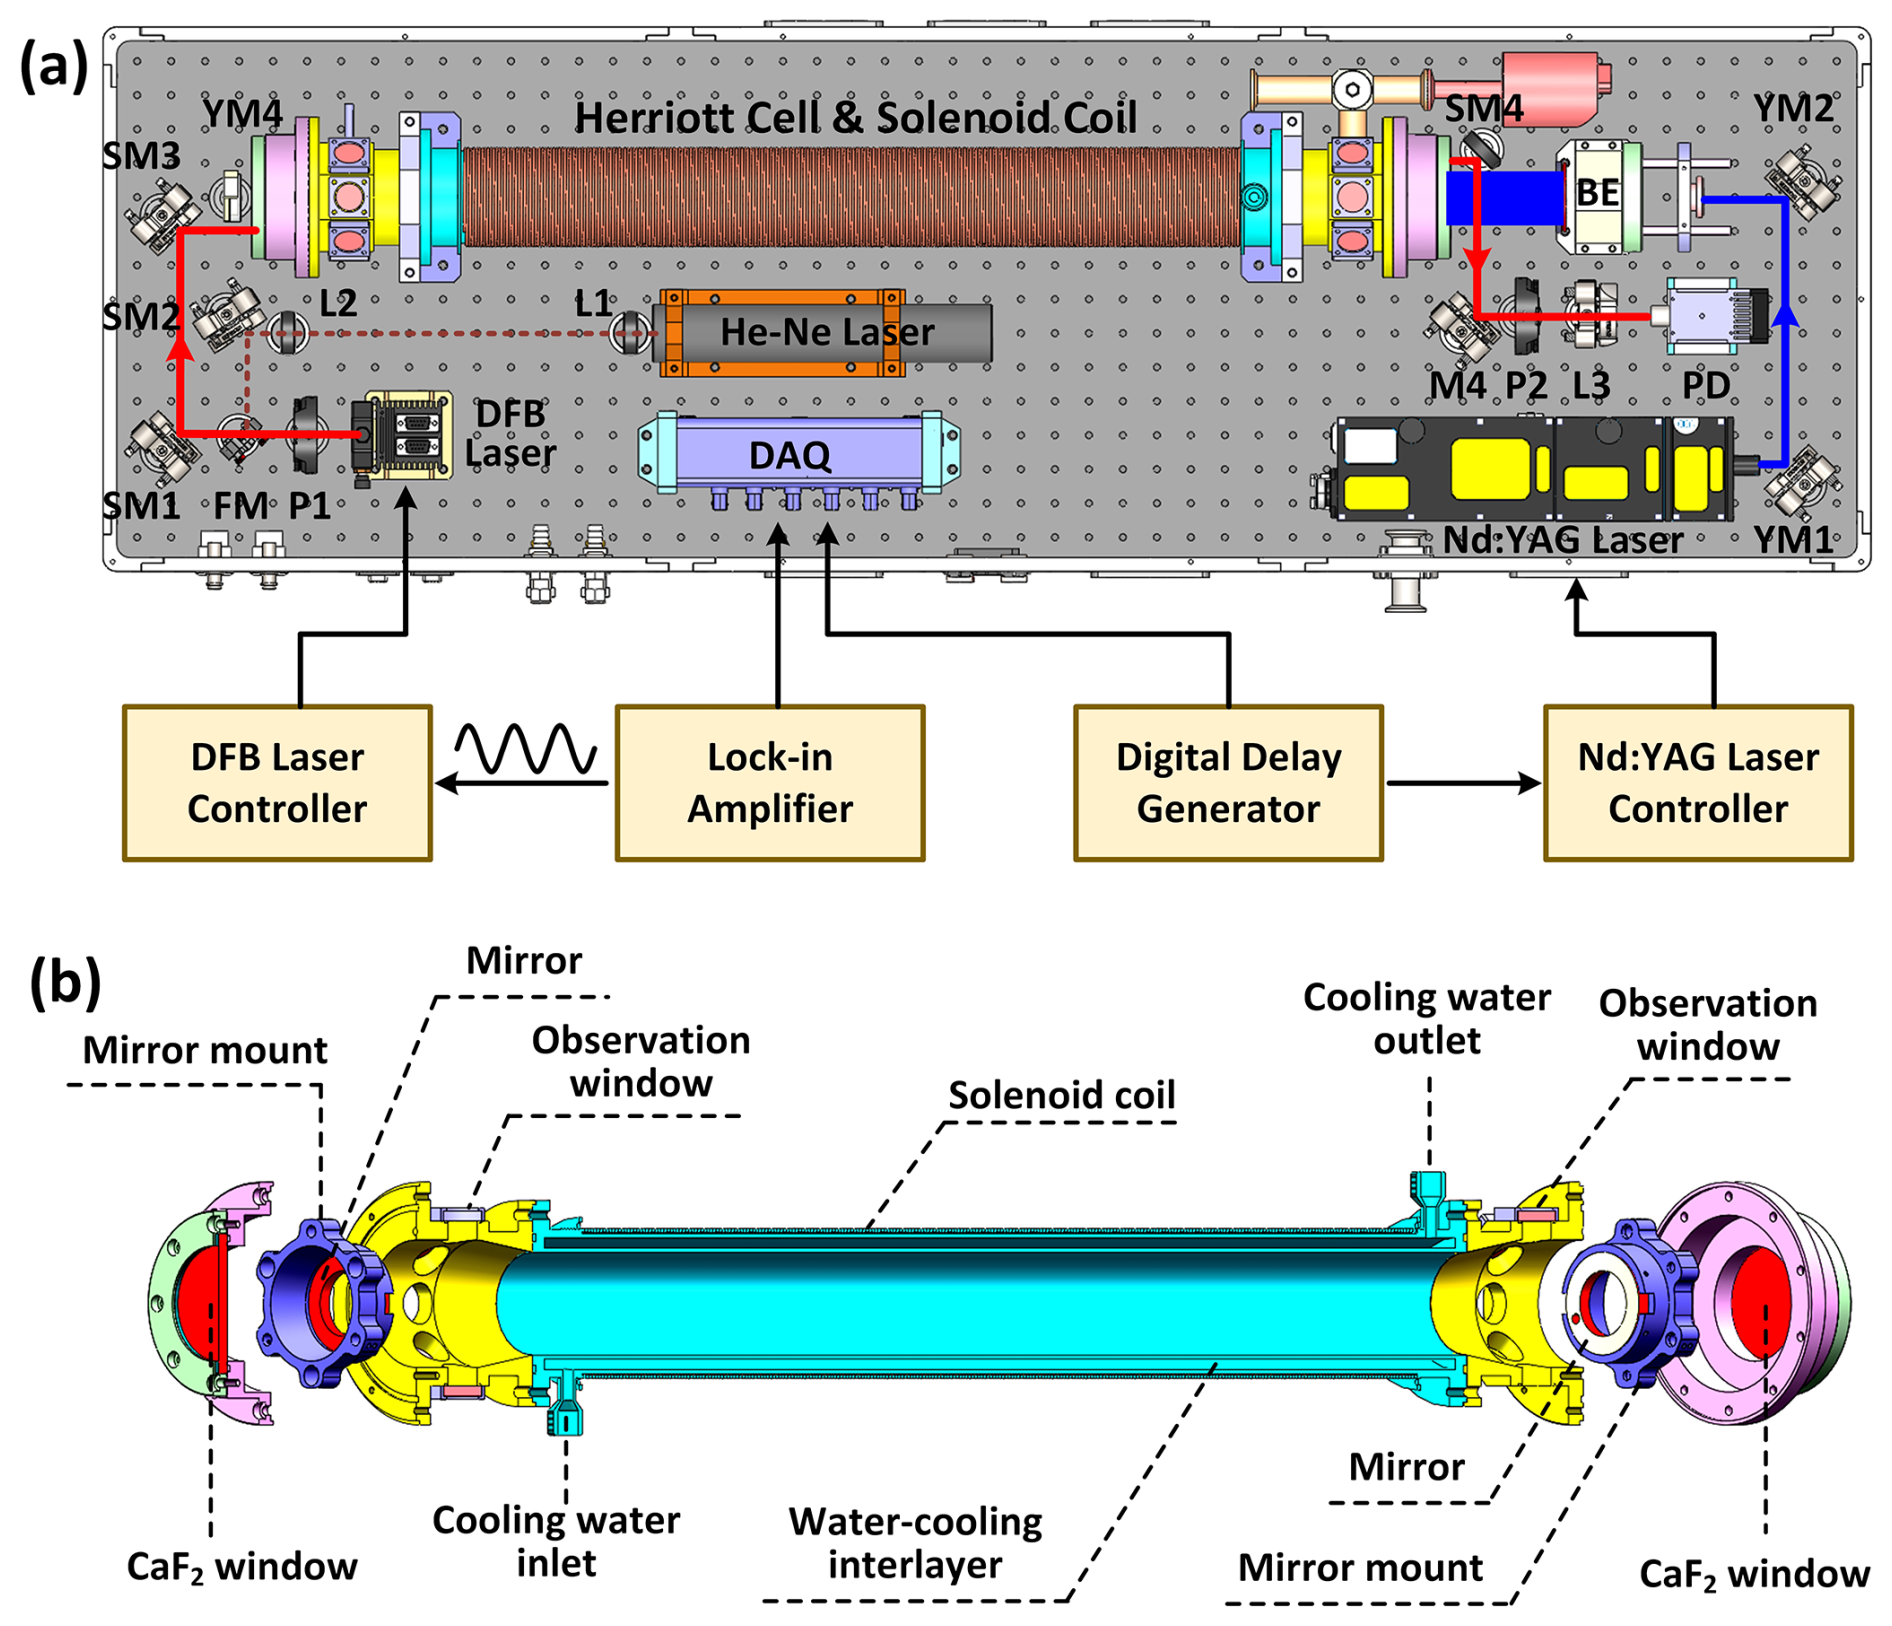
Figure 1(a) Schematic diagram of the developed laser-flash photolysis Faraday rotation spectrometer (LP-FRS), which consists of a mid-infrared Faraday rotation spectroscopy system and a laser photolysis system. The OH radicals are generated by laser-flash photolysis at 266 nm in a Herriott cell wound with copper wires and detected simultaneously by Faraday rotation spectroscopy via the overlapping mid-infrared optical paths. P, polarizer; FM, foldable mirror; SM, silver mirror; L, lens; PD, photodetector; YM, Nd:YAG mirror; BE, beam expander; DAQ, data acquisition card. (b) Assembly diagram of the Herriott-type pump–probe multi-pass cell (MPC). The coil is wound around the body of the MPC. A water-cooling interlayer is designed for temperature control of the solenoid coil and the cell.
In this work, we report the development of a portable laser-flash photolysis Faraday rotation spectroscopy (LP-FRS) instrument for total OH reactivity measurement. The time-resolved LP-FRS is a novel technique that employs a mid-infrared semiconductor diode laser as the probe laser (with a much cheaper commercial price than the dye laser system and good stability) for measurement, making the technique both cost-effective and simple to operate (Wei et al., 2020). Since FRS relies on the detection of the probe light polarization state rotation induced by paramagnetic molecules in a longitudinal magnetic field, the laser noise and molecule interferences are significantly reduced, which enables the FRS system to directly and completely monitor the concentration of OH in a highly sensitive manner without any chemical interferences (Litfin et al., 1980; Zhao et al., 2018). The dimensions of the developed instrument were 130 cm × 40 cm × 35 cm. The achievable detection precision of was 1.0 s−1 with 300 s averaging time. A field test in a suburban area was performed to demonstrate the capability of the LP-FRS instrument.
A schematic diagram of the developed LP-FRS instrument is given in Fig. 1a. The instrument comprises a mid-infrared FRS system for direct measurement of OH and an ultraviolet (UV) laser-flash photolysis system for generating OH. The probe light and the UV beam overlap in a Herriott-type optical multi-pass cell (MPC), enabling simultaneous monitoring of OH by the FRS system during the generation and reaction with reactants. Optical components from both systems are integrated into a single unitary box, with all communications and gas tubes connected to designated interfaces. The optical box has dimensions of 130 cm × 40 cm × 35 cm and a total weight of ∼ 90 kg. The instrument's total operation power consumption is ∼ 3 kW. These factors make the developed LP-FRS instrument both cost-effective and portable for field applications.
2.1 Mid-infrared Faraday rotation spectrometer
A mid-infrared continuous-wave distributed-feedback laser (cw-DFB laser, Nanoplus GmbH) emitting at 2.8 µm is used as the probe laser. The current and temperature of the laser chip are controlled by a laser controller (LDC501, Stanford Research Systems). By changing the injection current from 90 to 130 mA at an operating temperature of 33 °C, the wavelength of the DFB laser can be tuned from 3568.939 to 3568.362 cm−1. The current tuning coefficient is about 0.0024 near the target Q(1.5e) line of the state of OH at 3568.523 cm−1. The selected line has the strongest line strength of S = 9.032 × 10⁻²⁰ at 296 K (Gordon, et al., 2022) with the largest effective gJ value of 0.936 in the infrared region, which make it preferable for the FRS detection (Zhao et al., 2011, 2012). The collimated beam output from the laser head passes through a Rochon prism (Foctek Photonics), with an extinction ratio of ξ < 5 × 10⁻⁶, to establish a linearly polarized state, and then is incident into a Herriott-type pump–probe MPC. A He−Ne laser serves as an indicator. The beam waists of both lasers are aligned at the centre of the MPC to minimize beam divergence after each reflection (Pilgrim et al., 1997). A flipper optical mount facilitates switching between the two lasers. A second Rochon prism is placed at the output path to analyse the polarization state. The exit beam from the MPC is focused on a thermoelectrically cooled mercury cadmium telluride (MCT) photodetector (PVI-4TE-3.4, VIGO system). To effectively modulate the magnetic circular birefringence in a static magnetic field (Zhao et al., 2018; Fang et al., 2020; Wei et al., 2020), a 33 kHz sinusoidal wave from a lock-in amplifier (SR830, Stanford Research Systems) is added to the laser injection current. The detector signal is processed by the lock-in amplifier to demodulate the second harmonic (2f) of the FRS signal. As the laser current is fixed at the absorption peak of the OH radical, a time-resolved Faraday rotation spectrum that directly reflects the concentration variation in OH radicals can be measured (Wei et al., 2020; Cheng et al., 2023).
The pump–probe MPC, as shown in Fig. 1b, consists of a cylindrical stainless steel tube with an inner diameter of 5 cm, a total length of approximately 89 cm, and a sample volume of 1.5 L. At both ends, a pair of 6.8 cm diameter calcium fluoride (CaF2) windows are used for sealing and light transmission. Two gold-coated concave spherical mirrors, each 5 cm in diameter, are spaced 77.2 cm apart within the cell. Each mirror features a 5 mm diameter hole for probe light incidence and exit and a central 32 mm diameter hole (i.e. the maximum diameter permissible for the UV beam passage) for the expanded photolysis beam. Mirror tilt and spacing are adjustable via three screws distributed circularly on the mirror mount. At each end of the MPC, there are eight circular quartz observation windows near the mirrors to facilitate multi-pass light adjustments. A total of 25 reflection spots are arranged on the mirror surfaces in a circular pattern with 2 cm radius. The total path length of the MPC is 37.8 m.
A solenoid coil, wrapped with 1 mm diameter red-copper enamelled wires, is wound around the stainless steel tube and operates in DC mode to offer a static magnetic field for FRS. The length and the outer diameter of the coil are 59 cm and 10 cm, respectively. The magnetic intensity tuning coefficient at the centre of the coil is 73 G/A. A water-cooling interlayer is designed for temperature control of both the solenoid coil and the cell.
2.2 Ultraviolet laser-flash photolysis system
A flashlamp pumped Nd:YAG laser (Big Sky Laser Ultra 100, Quantel) is employed as the photolysis laser. The laser wavelength is frequency doubled to generate the fourth harmonic radiation at 266 nm with a pulse energy of 25 mJ, energy stability of ∼ 2 %, pulse length of ∼ 6 ns, and beam diameter of ∼ 4 mm. The water-cooled laser head has a size of ∼ 30.6 cm × 7.6 cm × 5.6 cm and is controlled by an integrated cooling and electronics unit. The 266 nm pulse emitted from the laser head is directed coaxially into the MPC using two dielectrically coated 1 in. diameter mirrors. Prior to entering the cell, the diameter of the 266 nm beam is expanded to 32 mm using a beam expander consisting of a quartz concave lens with a focal length of 12.5 mm and a quartz convex lens with a focal length of 100 mm.
A digital delay generator (DG645, Stanford Research Systems) was used to control the time sequence of laser-flash photolysis to record the time-resolved OH decay curve. The pump and Q switch of the Nd:YAG laser are synchronized with two 4 Hz transistor–transistor logic (TTL) pulses delayed by 30 ms relative to the data acquisition to achieve the baseline of the OH decay curve. The rising edges of the pulses are used for triggering. The spectrum is sampled with 1000 data points, each separated by a time interval of 0.2 ms.
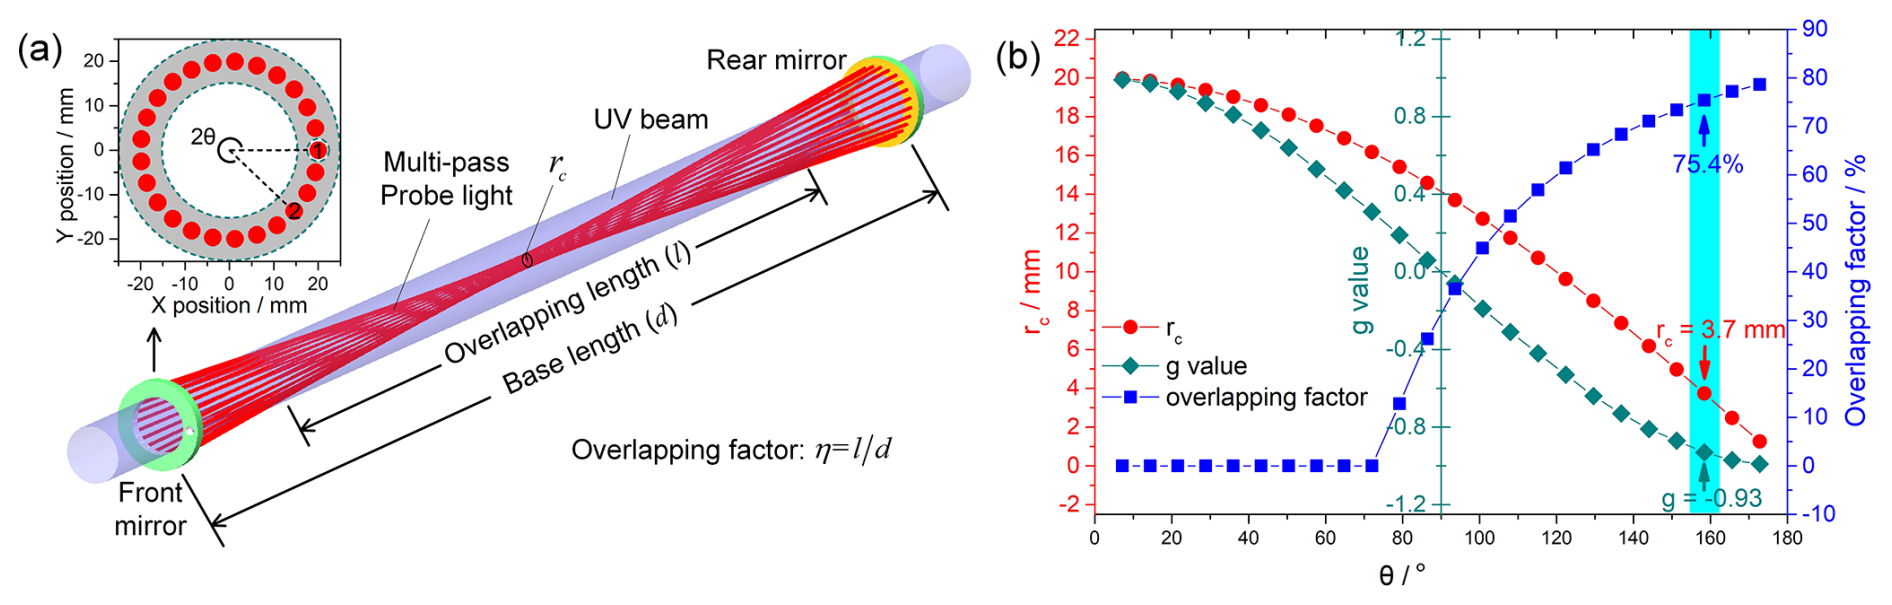
Figure 2(a) Schematic of the Herriott multi-pass cell and the beam pattern on mirror surface for the pump–probe; (b) multi-pass light waist (rc), g value, and overlapping factor (η) as functions of θ. θ is half of the angle between two adjacent reflection spots. The θ of 158.4° is selected, achieving an rc = 3.7 mm and an η of 75.4 %.
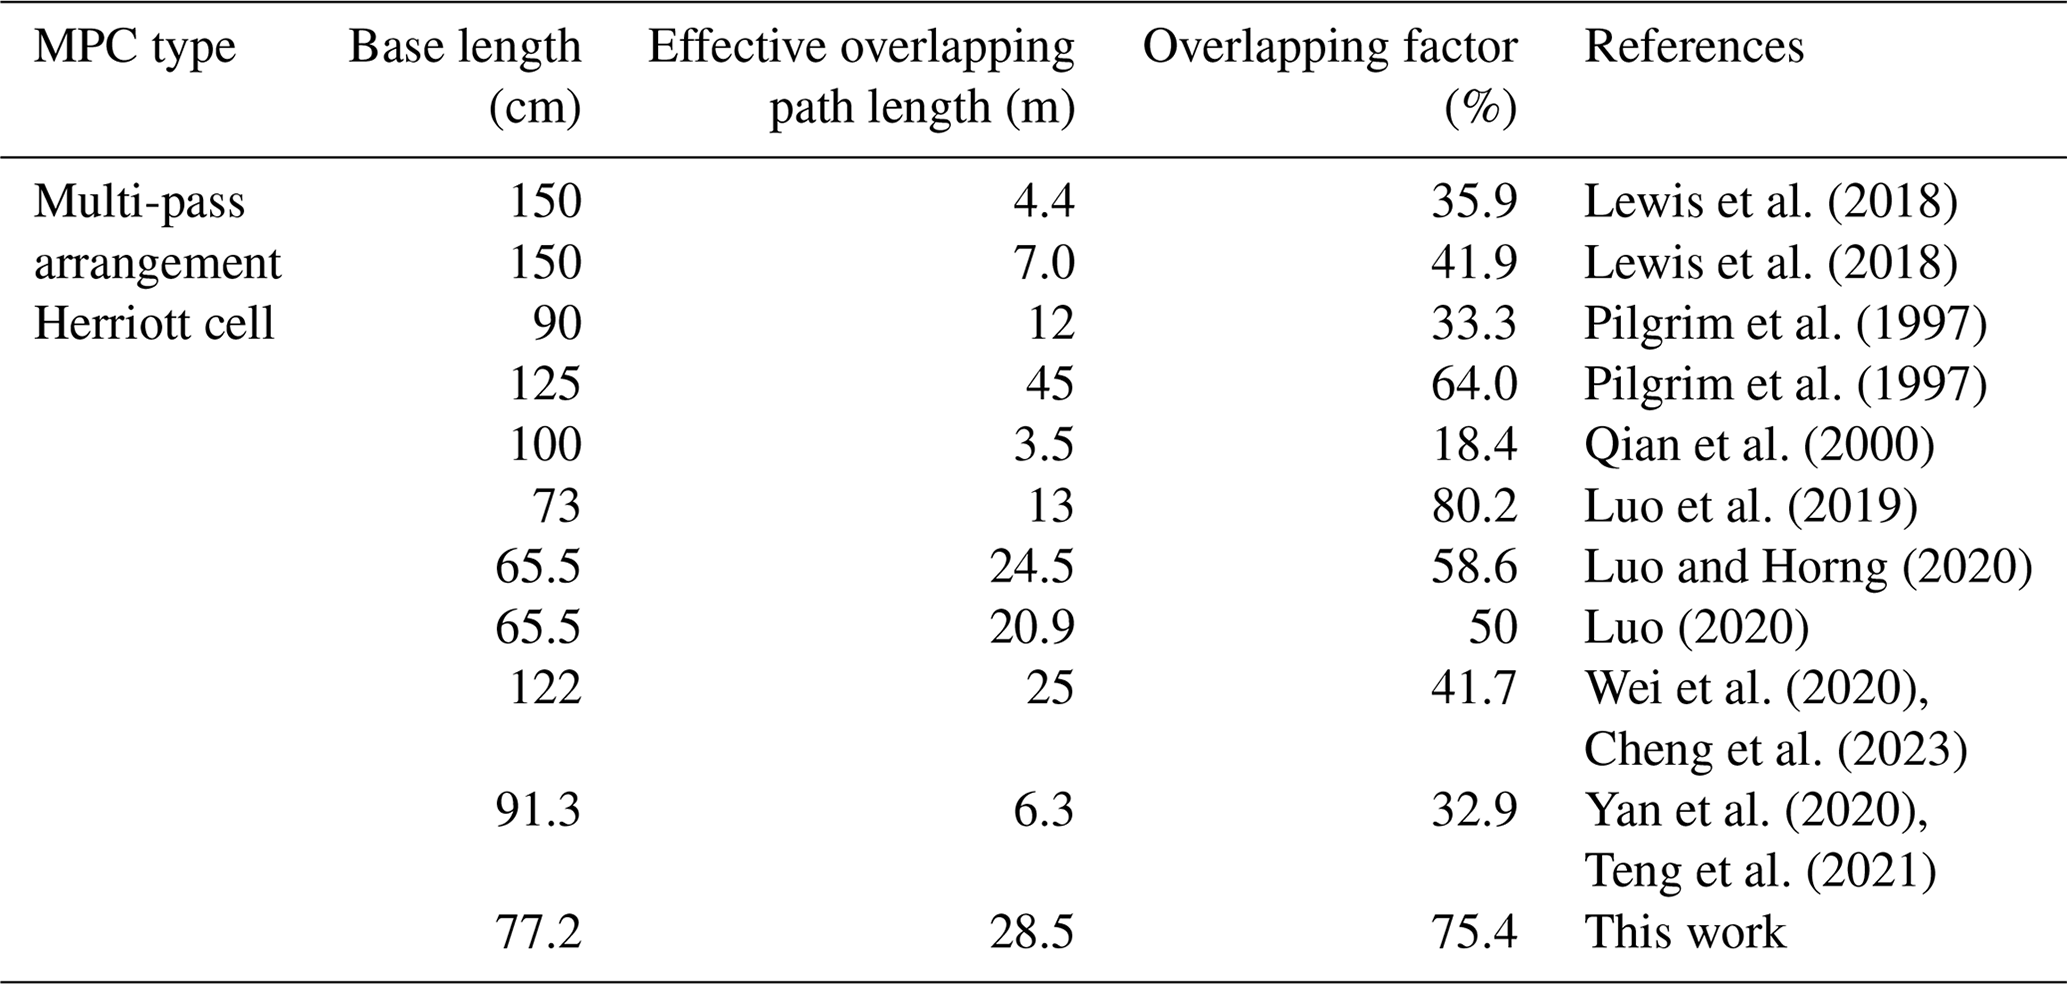
Table 1Overlapping factor comparison of MPCs used for laser photolysis in pump–probe techniques.
3.1 Characterization of the pump–probe MPC
The MPC in the instrument determines the effective absorption path length of the FRS system for OH measurement (Wei et al., 2020; Yan et al., 2020). As shown in Fig. 2a, the mid-infrared light undergoing multiple passes between two mirrors within the MPC is used for OH detection; the expanded 266 nm UV pulse is employed for producing OH. The overlapping factor () can be defined as the ratio of the overlapping length (l) to the base length (d) of the MPC. To develop portable instruments, increasing the overlapping factor is crucial for achieving a long effective path length while reducing the MPC base length. The Herriott MPC in the developed LP-FRS instrument is specially designed with a small multi-pass light distribution circle radius at the centre to achieve a high overlapping factor. The radius of the multi-pass light distribution circle at the centre of the Herriott MPC can be calculated with (Trutna and Byer, 1980)
where g () is the parameter that describes the optical resonance stability of the optical cavity or MPC. When the g value is less than zero, the base length of the multi-pass cell exceeds the curvature radius of the mirror, causing the resonance to become unstable. An incident parallel beam or a beam whose waist is not properly aligned with the cell's centre will quickly diverge and cannot be collected. However, a beam with its waist well matched to the centre can effectively prevent divergence. θ is half of the angle between two adjacent reflection light points on the mirror surface. d is the base length, and is the curvature radii of the mirrors. r is the radius of the spot distribution circle.
Figure 2b illustrates the variations in rc, g, and η as functions of θ. When the θ value is below 79.2, rc exceeds the 16 mm radius of the photolysis beam, resulting in no overlapping path. As θ approaches −1, the value of rc decreases, and the η value increases. Considering the difficulties in processing and testing mirror curvature, θ was set to 158.4°, yielding an rc value of 3.7 mm. The achieved η was up to ∼ 75.4 %, corresponding to an overlapping path length of ∼ 28.5 m.
In fact, from an optical structure perspective, the overlap factor characterizes both the utilization efficiency of the optical path length and the compactness of the pump–probe MPC, making it an ideal parameter for performance characterization. To demonstrate the efforts in reducing instrument size, a comparison of effective overlapping path lengths and overlapping factors with the literature-reported pump–probe MPCs is shown in Table 1. The effective overlapping path length of these MPCs ranged from several metres to tens of metres with base lengths around 100 cm (Pilgrim et al., 1997; Luo et al., 2019; Qian et al., 2000; Lewis et al., 2018; Luo and Horng, 2020; Luo, 2020; Wei et al., 2020; Yan et al., 2020; Teng et al., 2021; Cheng et al., 2023). The overlapping factor of our MPC was comparable to that developed by Luo et al. (2019) for a similar base length, while our effective overlapping path length was twice as long.
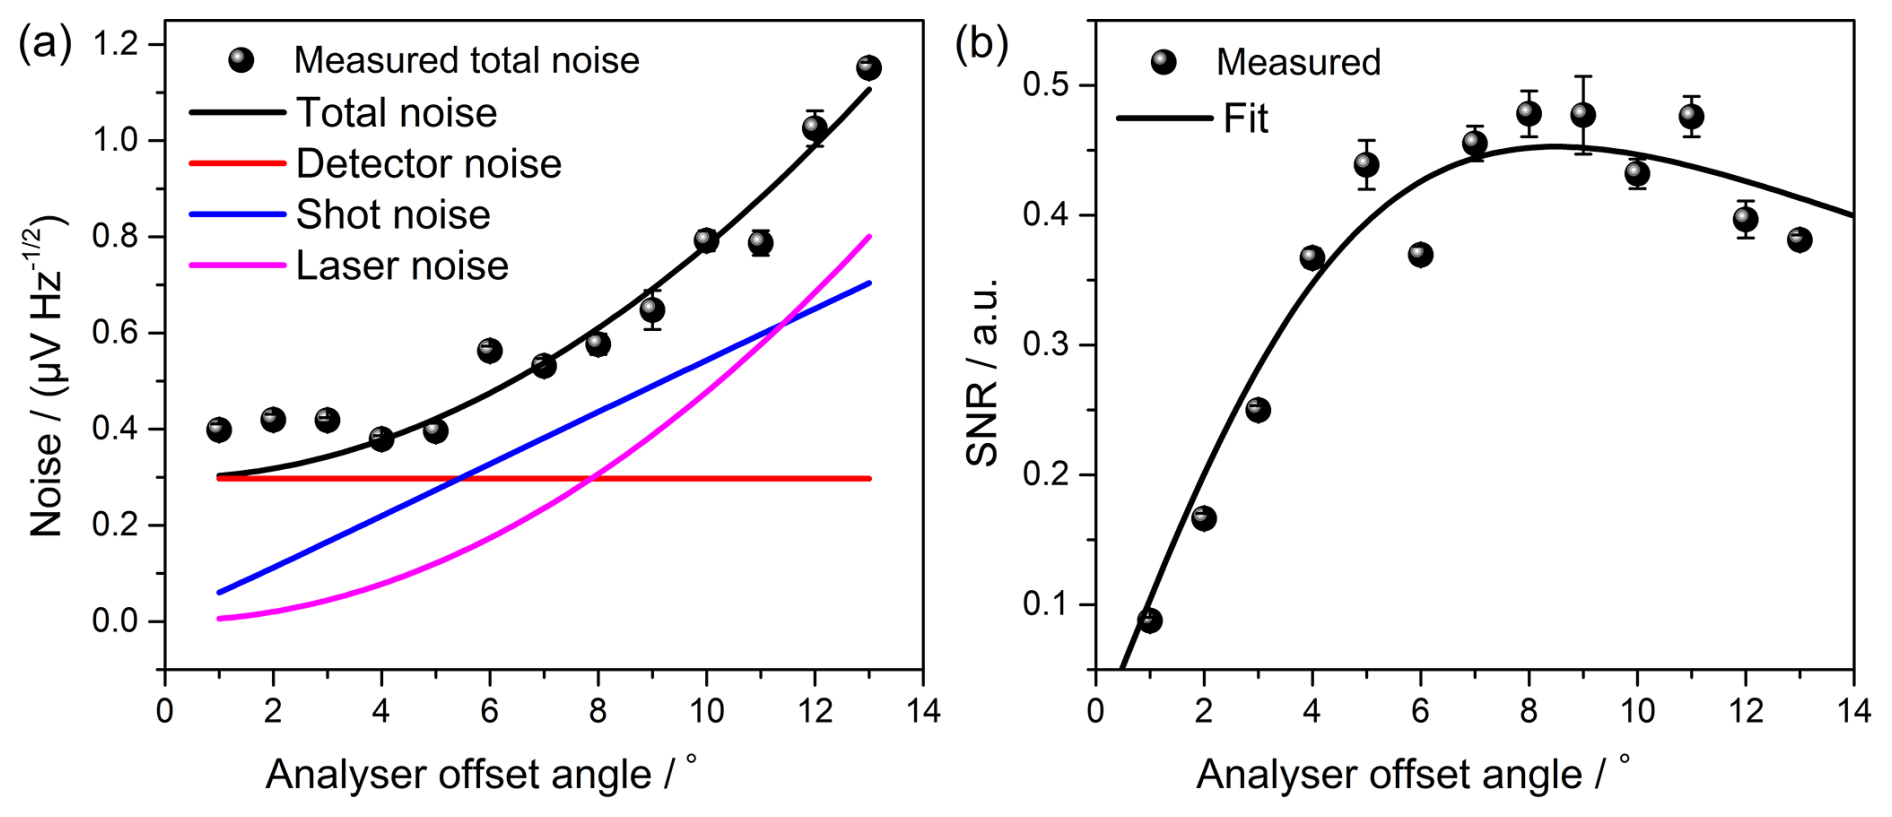
Figure 3(a) Noise and (b) signal-to-noise ratio analysis of the FRS system. The optimum offset angle of the analyser is 8°.
3.2 Optimization of the FRS system
For weak absorption, the FRS signal (SFRS) and total noise (Ntot) of the system can be expressed as functions of the analyser offset angle (ϕ) from the crossed polarization of the light (Zhao et al., 2011; Wei et al., 2020):
where ν is the laser frequency, γ is the instrumentation factor, N is the OH concentration, S is the absorption line strength of OH, and χ is the Faraday rotation line shape (Westberg and Axner, 2014). N0, , and N2(sin 2(ϕ)+ξ) are the detector noise, shot noise, and laser noise of the system, respectively. It is noted that the FRS signal reaches its maximum value when ϕ = ± 45°, while the total noise is more sensitive to sin 2(ϕ). The maximum signal-to-noise ratio (SNR) usually occurs at a small offset angle, which depends on system noise (Lewicki et al., 2009).
The total noises at various offset angles and the detector noise were measured with the lock-in amplifier to determine the noise sources and the optimum angle (ϕopt) for maximizing the SNR of the FRS system (Zhao et al., 2011). Figure 3a shows a fit analysis of the data using Eq. (4). For offset angles below 5.5°, detector noise is the main noise of the system. The measured detector noise was 300 , which closely agreed with the manufacturer's specified value of 290 . Laser noise dominates and rapidly increases beyond an offset angle greater than 11.5°. Since the FRS signal is proportional to sin (2ϕ), the relative SNR for a given absorption at a fixed laser frequency can be evaluated from . As shown in Fig. 3b, the SNR of our system peaks at the ϕopt of ∼ 8°. At this angle, the laser noise was suppressed to 310 , equivalent to the detector noise level. The total system noise was 610 , which was 1.4 times higher than the measured shot noise of 440 .
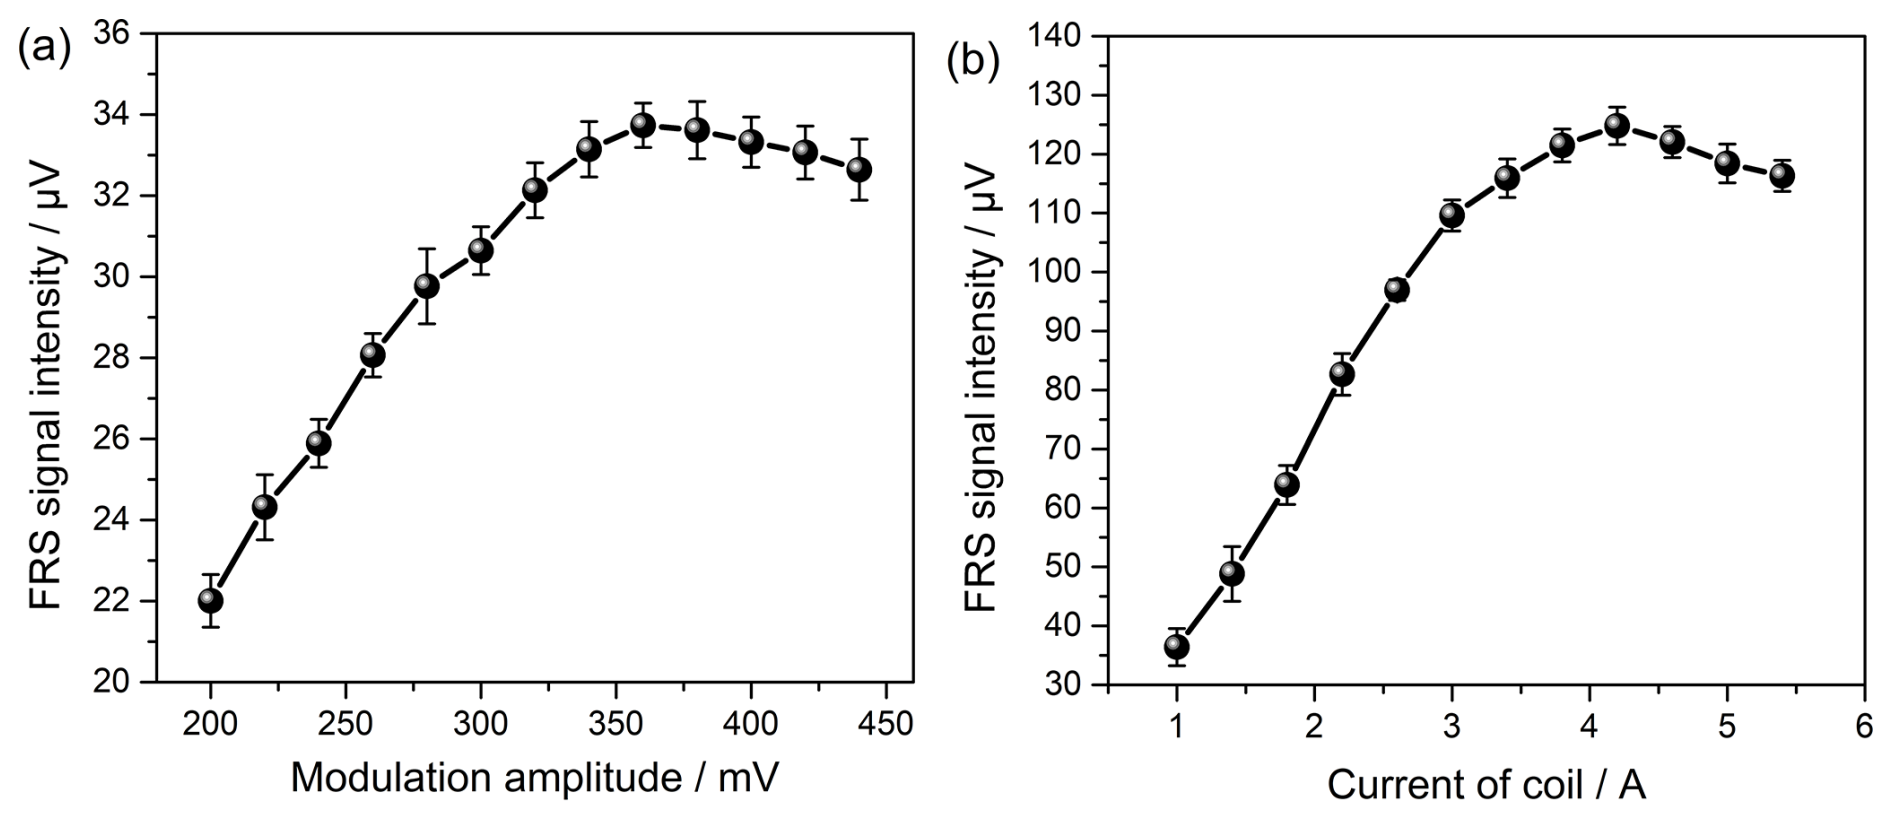
Figure 4FRS signal intensity as functions of the (a) modulation amplitude and (b) current of the coil. The optimum modulation amplitude and magnetic field strength are 360 mVrms and 307 G, respectively.
In this work, the magnetic circular birefringence of OH was effectively modulated with wavelength modulation in a static magnetic field generated by the DC coil. The modulation amplitude and magnetic field strength are critical parameters that affect the intensity of the demodulated FRS signal (Zhao et al., 2018; Fang et al., 2020). The theoretical optimum modulation amplitude is 2.2 times the half-width at half-maximum (HWHM) of the absorption line shape (Schilt et al., 2003). The optimum magnetic field strength (Bopt) is the value that can make the Zeeman splitting comparable with the HWHM (Brecha et al., 1997). A direct and effective approach for determining the two optimum parameters is recording the signal intensity values under series amplitudes of the sinusoidal wave output from the lock-in amplifier and different coil currents. As shown in Fig. 4, the FRS signal intensity value is calculated from the difference before and after the laser flash. The maximum intensity occurred at an amplitude of 360 mV and a coil current of 4.2 A, which corresponds to a wavelength modulation amplitude of ∼ 0.048 cm−1 (∼ 2.45 times the calculated OH absorption linewidth of ∼ 0.020 cm−1 in air) and a Bopt of 307 G, respectively.
3.3 OH concentration in the cell
To produce sufficient OH in the MPC, a small flow rate (∼ 0.25 L min−1) of zero air, which passed through a UV lamp (UVP Pen-Ray, Analytik Jena) and a bubbling bottle to generate O3 and water vapour, is added to the main sampling flow (∼ 6.0 L min−1), resulting in a total flow rate of 6.25 L min−1. The operation pressure in the MPC is set to 200 mbar and maintained by a butterfly valve (DN40, VAT). The flow velocity in the cell is 27 cm s−1, corresponding to a Reynolds number of ∼ 170, which met the laminar flow condition. OH is produced by the 266 nm laser photolysis of O3 and then followed by reaction of O(1D) with water vapour (Sadanaga et al., 2004):
The concentrations of O3 and the water vapour directly influence the OH produced. A dew point sensor was used to measure the water vapour mixing ratio of the total flow. Based on the Magnus–Tetens formula (Lawrence, 2005), the absolute water vapour mass concentration can be evaluated from , where Rw = 461.52 J (kg K)−1, T is the sample temperature, is the actual water vapour pressure at a current pressure of P, A = 17.625, B = 243.04 °C, C = 610.94 Pa, P0 is the standard atmospheric pressure, and Td is the measured dew point temperature. The calculated water vapour volume concentration was ∼ 0.13 % when using zero air for the system test, while it increased to ∼ 1.5 % when measuring the real atmosphere. The O3 concentration is estimated by measuring the energy of the photolysis laser pulse with the UV lamp on and off. Only about 0.3 % of the pulse energy was absorbed by O3. Based on the Beer–Lambert law and the O3 absorption cross section of σ = 9.65 × 10⁻¹⁸ cm2 at 266 nm (Sadanaga et al., 2004), the O3 concentration is determined to be ∼ 800 ppbv. The recommended quantum yield of the O(1D) produced by laser-flash photolysis is ∼ 0.9 (Atkinson et al., 2004), resulting in ∼ 2.2 × 10¹¹ of O(1D). The number density of OH produced by each O(1D) can be estimated by (Wei et al., 2020)
where [OH], [O(1D)], [H2O], and [M] represent the number densities of the corresponding molecule. M is the “bath” gas during the chemical reaction of OH formation. is the volume concentration of water vapour. k5 and k6 are 2.9 × 10⁻¹¹ and 2.2 × 10⁻¹⁰ at 298 K, respectively. The concentration of OH produced in the cell was ∼ 4.3 × 10⁹ during the system test and ∼ 5 × 10¹⁰ during the field application due to different in the sample.
3.4 Kinetics test
The performance of the LP-FRS instrument in measuring different reaction rates was verified with three well-known reactions (Wei et al., 2020; Yan et al., 2020). Reactants from the cylinders (i.e. CH4 (99.999 %, Nanjingteqi), CO (2.01 %, Nanjingteqi), and NO (100 ppmv, Linde)) were added to the main flow at different flow rates. When the concentrations of reactants are much higher than those of OH, the OH decay rate (kdecay) follows pseudo-first-order kinetics and can be determined by fitting the measured decay spectra to the following exponential equation:
where S0 and St are the FRS signal intensities proportional to the OH concentration at the time when the fitting started and at the time t, respectively. Sbackground is the background signal intensity. Since the fitted values for y and kdecay do not depend on the selected time period of the decay curve (Stone et al., 2016), the fit is started at the time of 36 ms rather than the peak to avoid any fluctuations affecting the fitting result. Figure 5 shows two typical decays with loss rates of kdecay = 8.4 s−1 and kdecay = 50.2 s−1, which are given with a 60 s averaging time during the measurements. The recorded time-resolved decay spectra clearly depict the entire event, including the baseline, the instant generation of OH by laser photolysis, and the decay process.
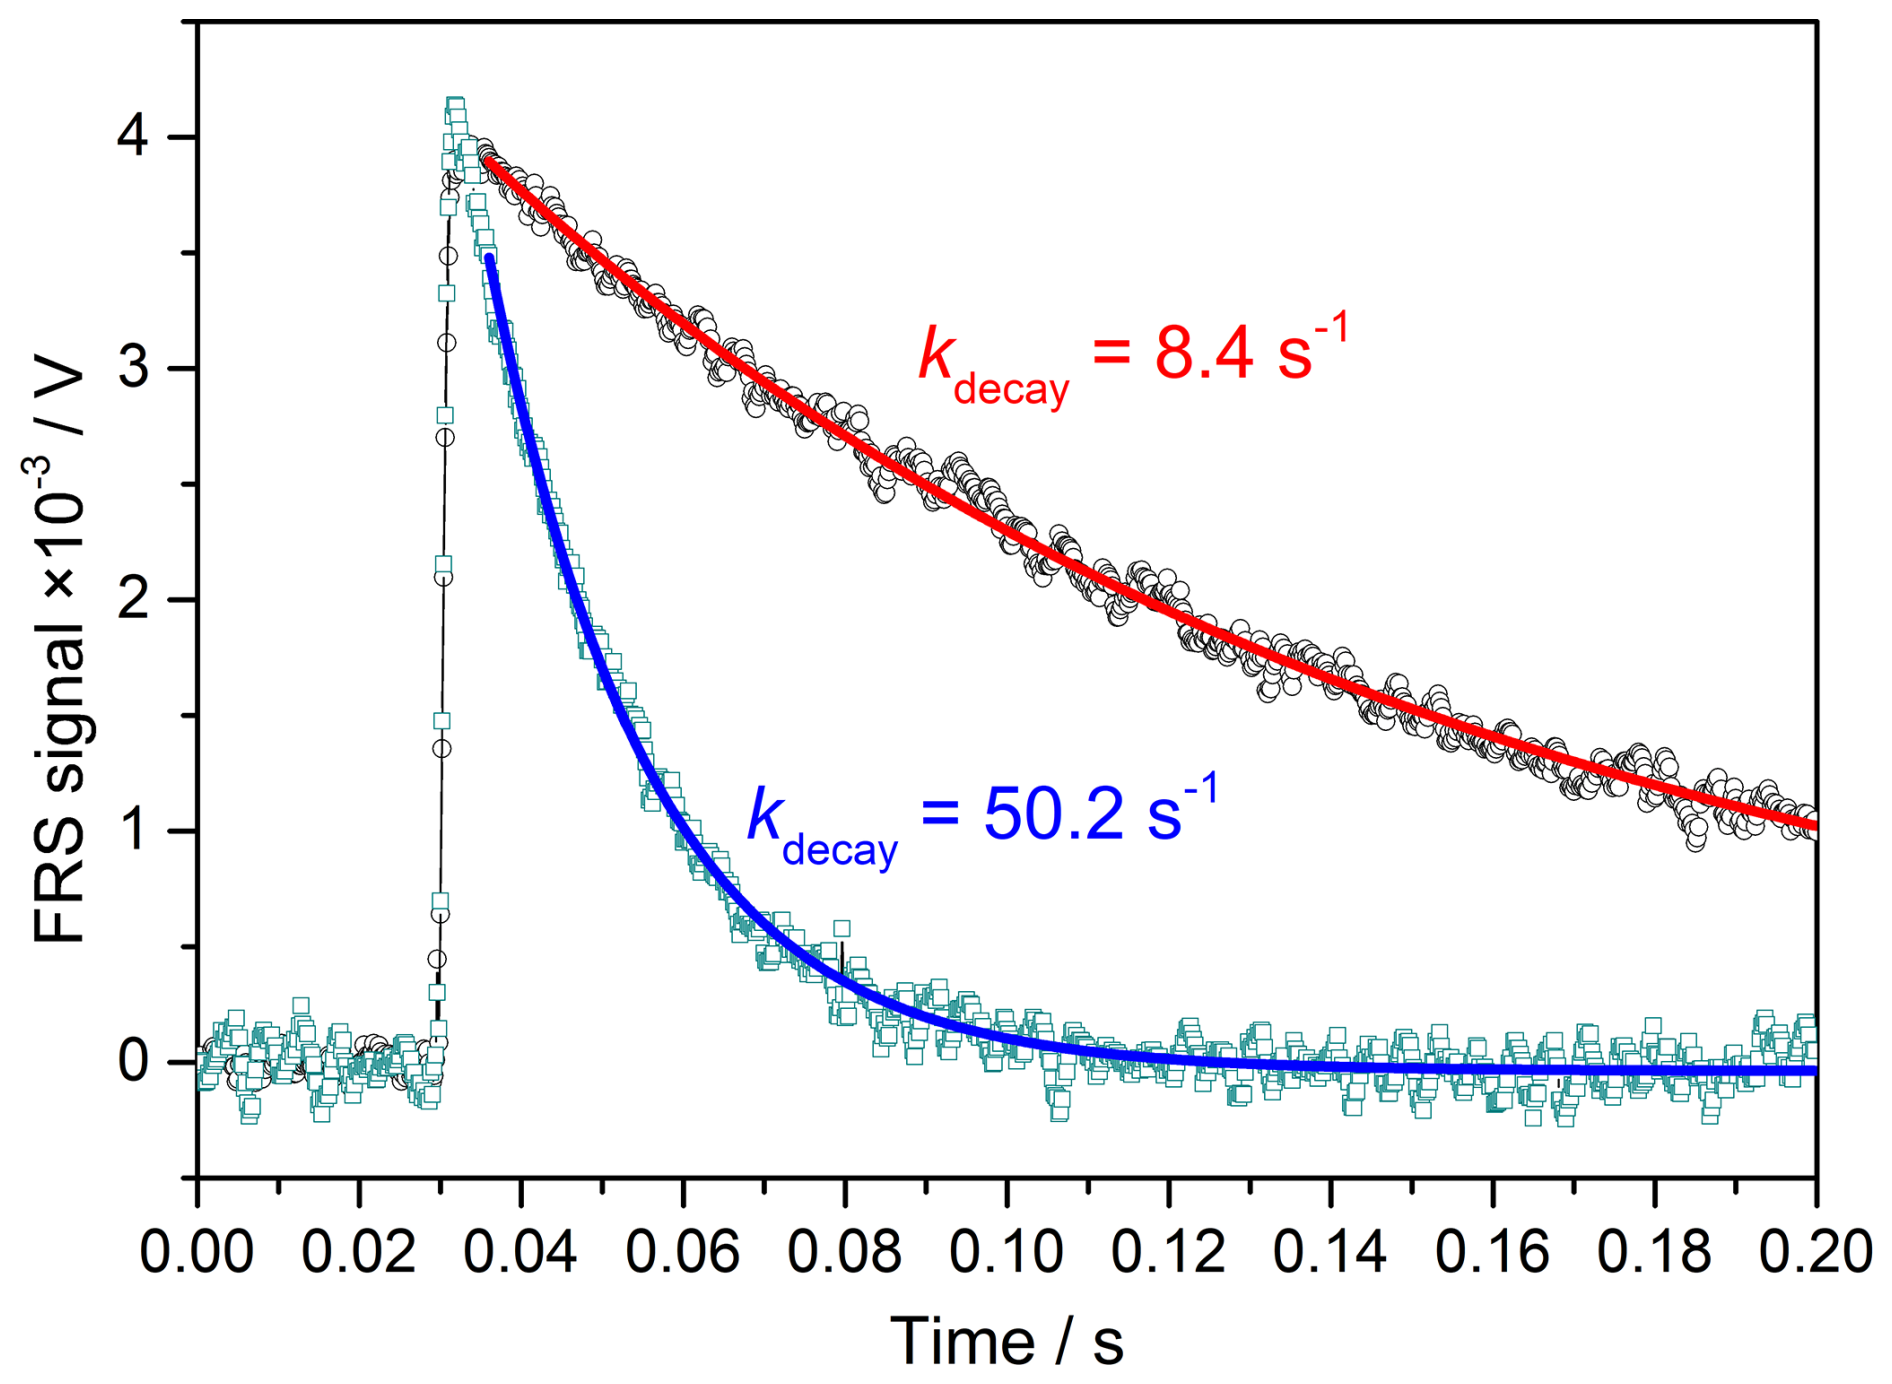
Figure 5Two typical OH decay spectra with different loss rates. Time zero is defined as the moment when the data acquisition trigger occurs.
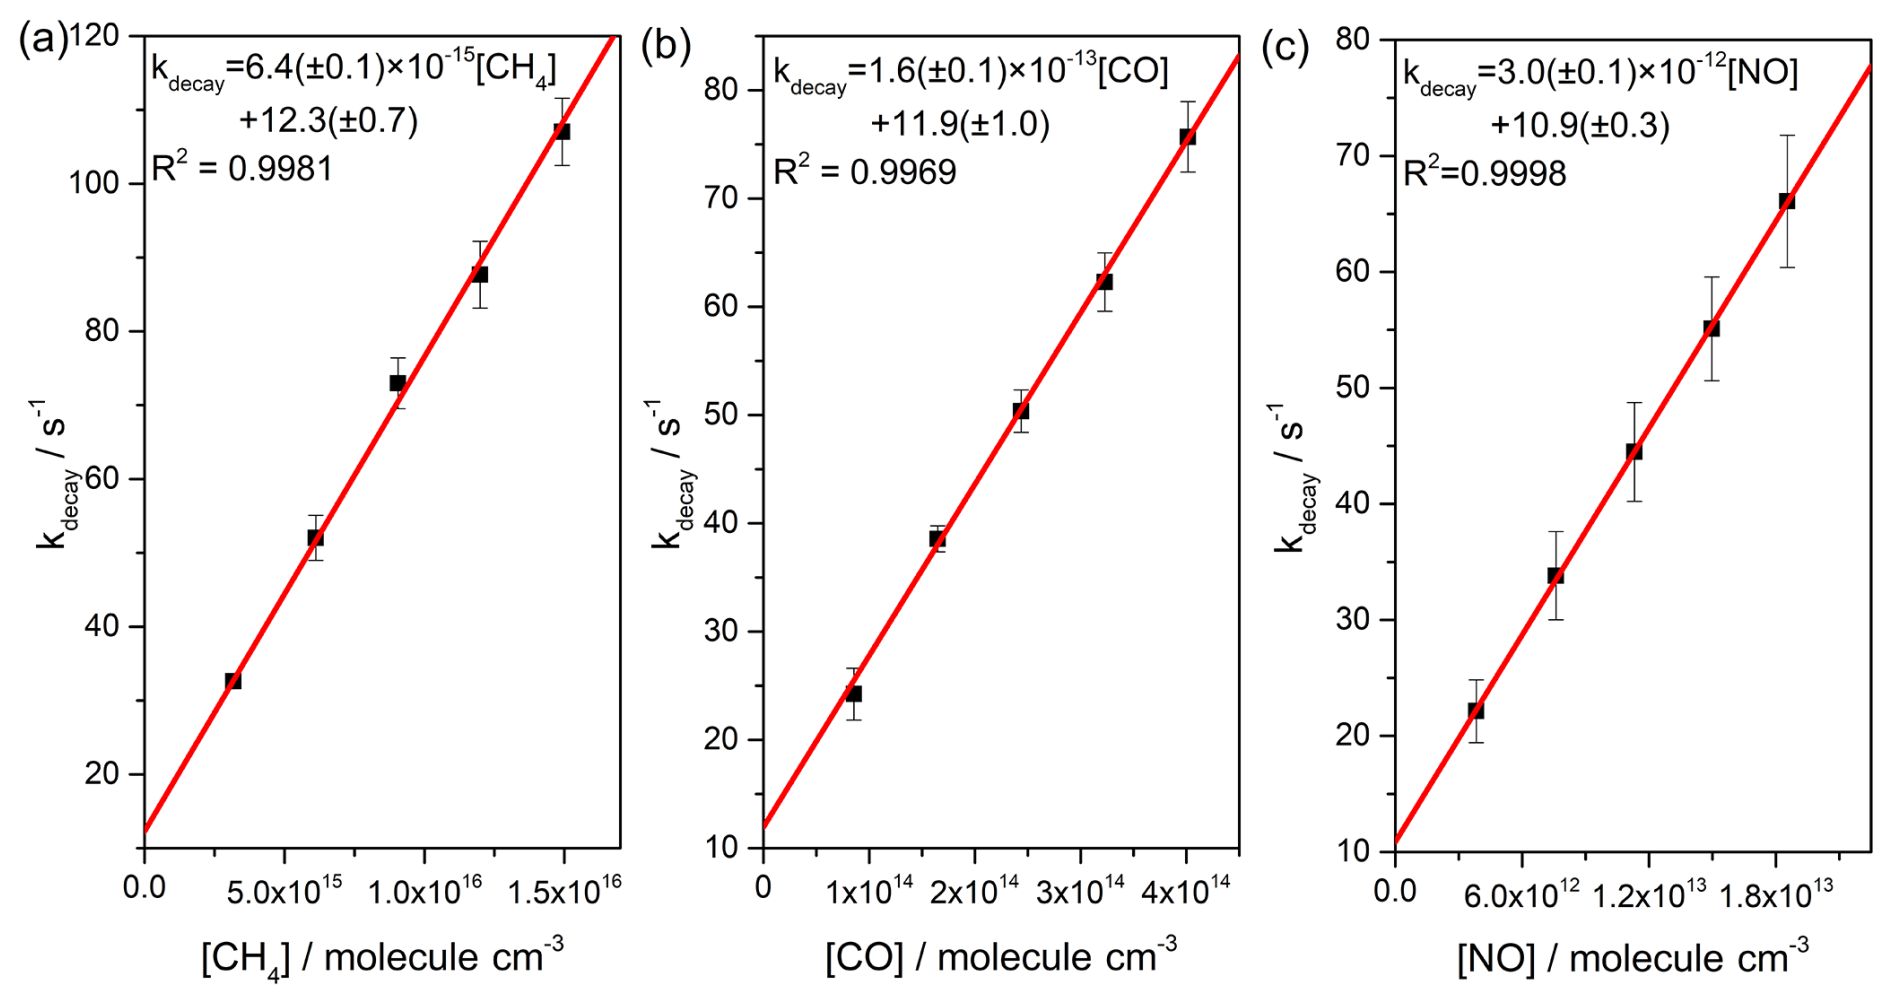
Figure 6Plots of the measured pseudo-first-order rate coefficients vs. (a) CH4 concentrations, (b) CO concentrations, and (c) NO at 298 K. The measured reaction rate constants obtained from the slopes are 10−15, 10−13, and 10−12 , which agree with the recommended values of 10−15, 10−13, and 10−12 , respectively.
The OH decay rates in the reactions with three different species were measured and can be expressed as , where kOH+X is the measured rate constant for the reaction of OH with X, [X] is the concentration of reactant X, and k0 is a background value. As shown in Fig. 6, the obtained reaction rate constants for OH + CH4, OH + CO, and OH + NO at 298 K were found to be 10−15, 10−13, and 10−12 , respectively. The measured values are in agreement with the International Union of Pure and Applied Chemistry (IUPAC) recommended values of 10−15, 10−13, and 10−12 , respectively (Atkinson et al., 2004, 2006).
3.5 Precision and uncertainty of measurement
When the LP-FRS instrument is used for measuring atmospheric , the fitted kdecay value requires corrections for dilution and instrument zero (kzero). Incorporating these corrections, the atmospheric is expressed as
where f, given by , is the total dilution factor, which arises from the low operating pressure of 200 mbar and the additional small flow of humidified air containing a constant mixing ratio of O3. fpressure represents the pressure dilution factor given by the ratio of the ambient pressure to the operation pressure, equal to ∼ 5. fflow is the flow dilution factor calculated as the ratio of the total flow rate of 6.25 L min−1 to the sample flow rate of 6.0 L min−1, equal to 1.04. Therefore, the total correction factor (f) is 5.2.
The instrument zero is critical for calculating from the observed OH decay rate and is usually assumed constant over a certain observation period. To evaluate instrument zero, OH decay rates were measured in zero air produced by a portable zero gas generator, yielding a kzero of 5.2 s−1. Several factors affect the instrument zero, including the self-reaction of OH, reaction of OH with O3, OH diffusion, and reaction of OH with residual reactive species in zero air. The self-reaction rate constant of OH is 1.48 × 10⁻¹² at 298 K (Atkinson et al., 2004), contributing to ∼ 1.5 % of the instrument zero at the current OH concentration. The reaction rate constant of OH with O3 is 7.3 × 10⁻¹⁴ at 298 K (Atkinson et al., 2004), leading to an OH loss rate of 0.3 s−1, which accounts for ∼ 6 % of the instrument zero. The OH loss rate due to diffusion (kdif) under laminar flow conditions can be calculated from (Ivanov et al., 2007; Liu et al., 2009)
where Kdif=3.66 (for a cylinder cell) is the dimensionless geometric parameter, rtube is the radius of the cell, and DOH = 1.3 cm2 s−1 is the OH diffusion coefficient at 200 mbar and 298 K in air. The calculated OH diffusion loss rate was 0.8 s−1, giving a contribution of ∼ 15 % of the instrument zero.
To assess the measurement precision of the LP-FRS instrument, an Allan deviation analysis was conducted on time series of zero-air measurements. The measured values were processed by subtracting the instrument zero. As shown in Fig. 7, the averaging time of the data point was 10 s, with a total measurement time of about 4000 s. The measurement precisions of were 2.3 and 1.7 s−1 with an acquisition time of 60 s and 120 s, respectively. When the averaging time increased to 300 s, the atmospheric measurement precision could be further improved to 1.0 s−1.
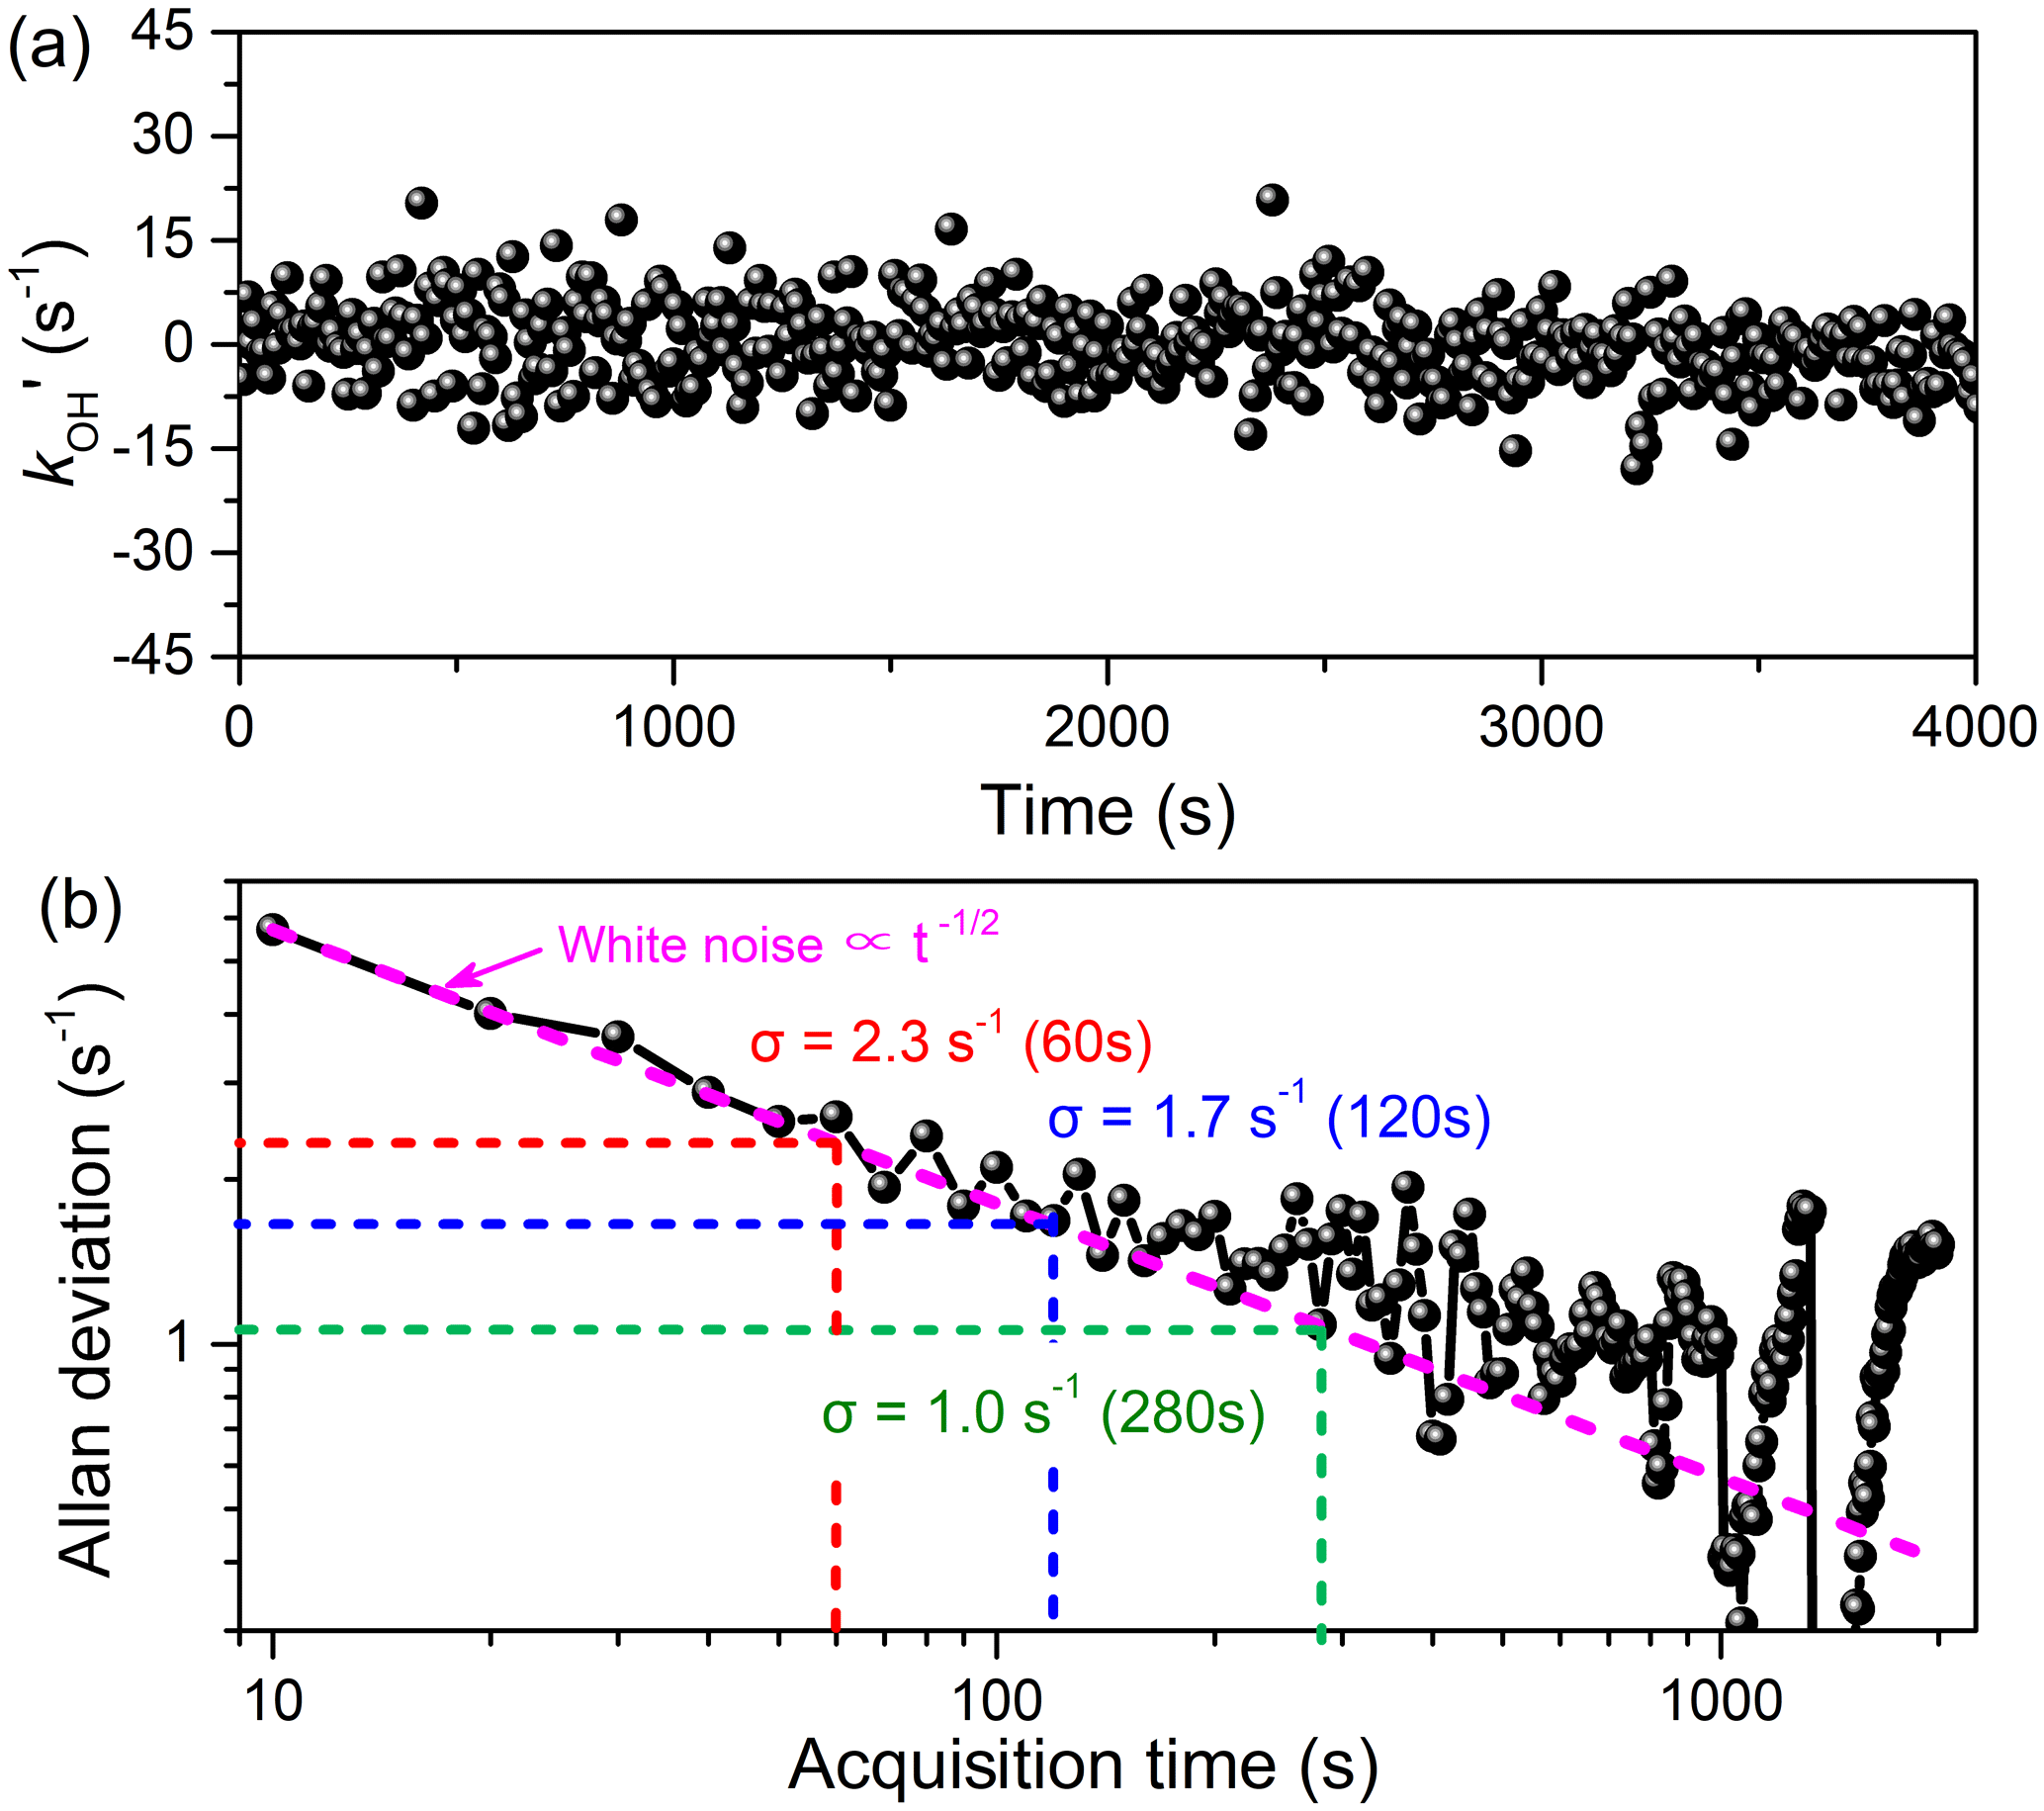
Figure 7(a) Time series of zero air with 10 s time resolution and (b) the Allan deviation analysis of the time series. The measurement precision of can be improved to 2.3 and 1.0 s−1 with averaging times of 60 s and 300 s, respectively.
A comprehensive approach to evaluating the instrument's total uncertainty is measuring zero air. Figure 8 illustrates the values obtained from zero air on different days. Each value was obtained from 1 h continuous measurements. The time intervals for these zero-value measurements are longer than 2 weeks. The error bars of the data points agreed well with the measurement precision obtained from Allan deviation analysis. No significant drift was found during measurements, with a mean value close to zero at 0.2 s−1. The measurement uncertainty of the developed LP-FRS instrument, which can be determined from the deviations of these measurements, was within 2 s−1. The uncertainty of the LP-FRS instrument arises from two main sources: the dilution factor and the instrument zero. The uncertainties associated with the mass flowmeters and the pressure controller used were ∼ 1 % and < 1 %, respectively, resulting in a total uncertainty of the dilution correction factor of less than 2 %. The uncertainty of the instrument zero primarily originates from various influencing factors, such as changes in O3 concentrations and residual reactants in zero air and water.
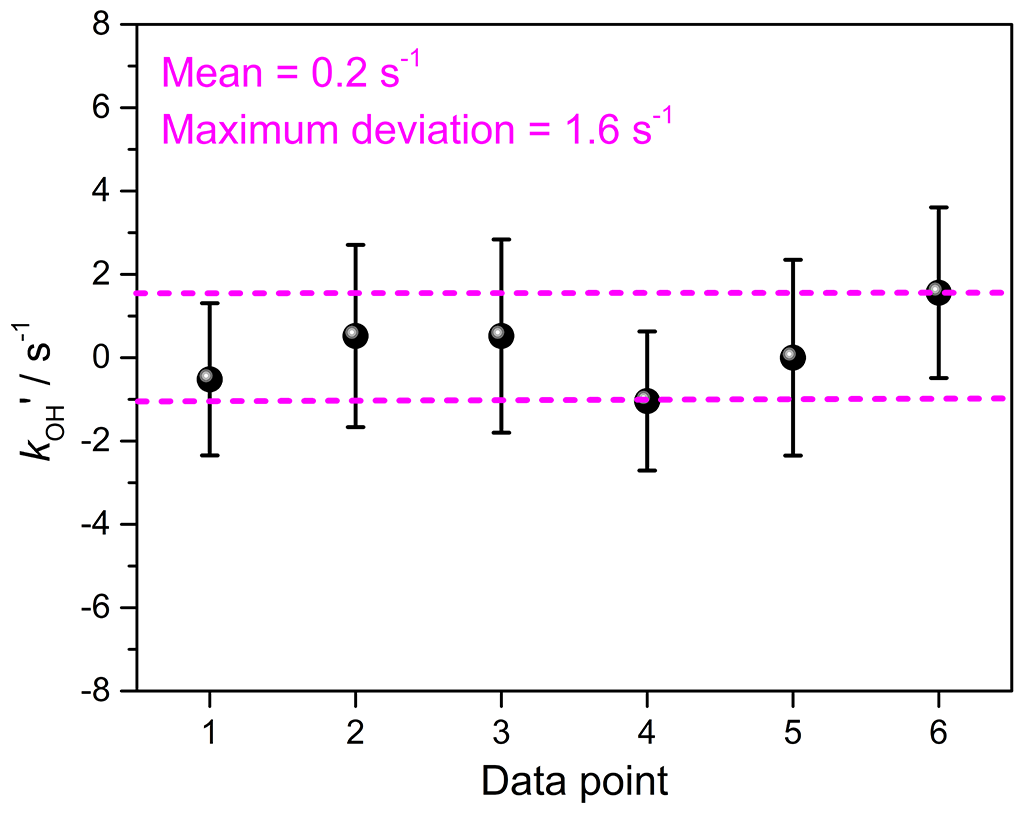
Figure 8Measured values of zero air on different days. The total instrument uncertainty, determined from the measurement deviations, is within 2 s−1.
The capability of the developed LP-FRS instrument was demonstrated through field measurements of atmospheric total OH reactivity. Measurements were conducted at the park of the Hefei Institutes of Physical Science, Chinese Academy of Sciences (31°91′ N, 117°16′ E) (Khayyam et al., 2024). This observation site is situated on a peninsula in a suburban area, surrounded by water on three sides. There were also an optical factory and several mechanical processing factories located on the peninsula. The observation period spanned 1 to 4 May 2023.
The LP-FRS instrument was housed in a container with the sampling port positioned ∼ 1.2 m above the container's roof. In addition to measuring OH reactivity, concentrations of 115 kinds of VOCs were analysed using a gas chromatograph coupled with a flame ionization detector and mass spectrometer (GC-FID/MS; TSQ 9000, Thermo Fisher) with a time resolution of 1 h. The VOCs included 29 alkanes (alka), 12 alkenes (alke), 16 aromatic hydrocarbons (arom), 35 halogenated hydrocarbons (halo), 21 oxygenated volatile organic compounds (OVOCs), 1 alkyne, and 1 carbon disulfide. Concentrations of NO, NO2, and O3 were measured employing an NOx analyser (42i, Thermo Fisher) and an O3 analyser (49i, Thermo Fisher). Data of ambient temperature (T) and relative humidity (RH) were obtained from an automatic monitoring station located ∼ 100 m from the container. The photolysis rate constant of J(NO2) was measured with a photolysis spectrometer (PFS-100, Focused Photonics).
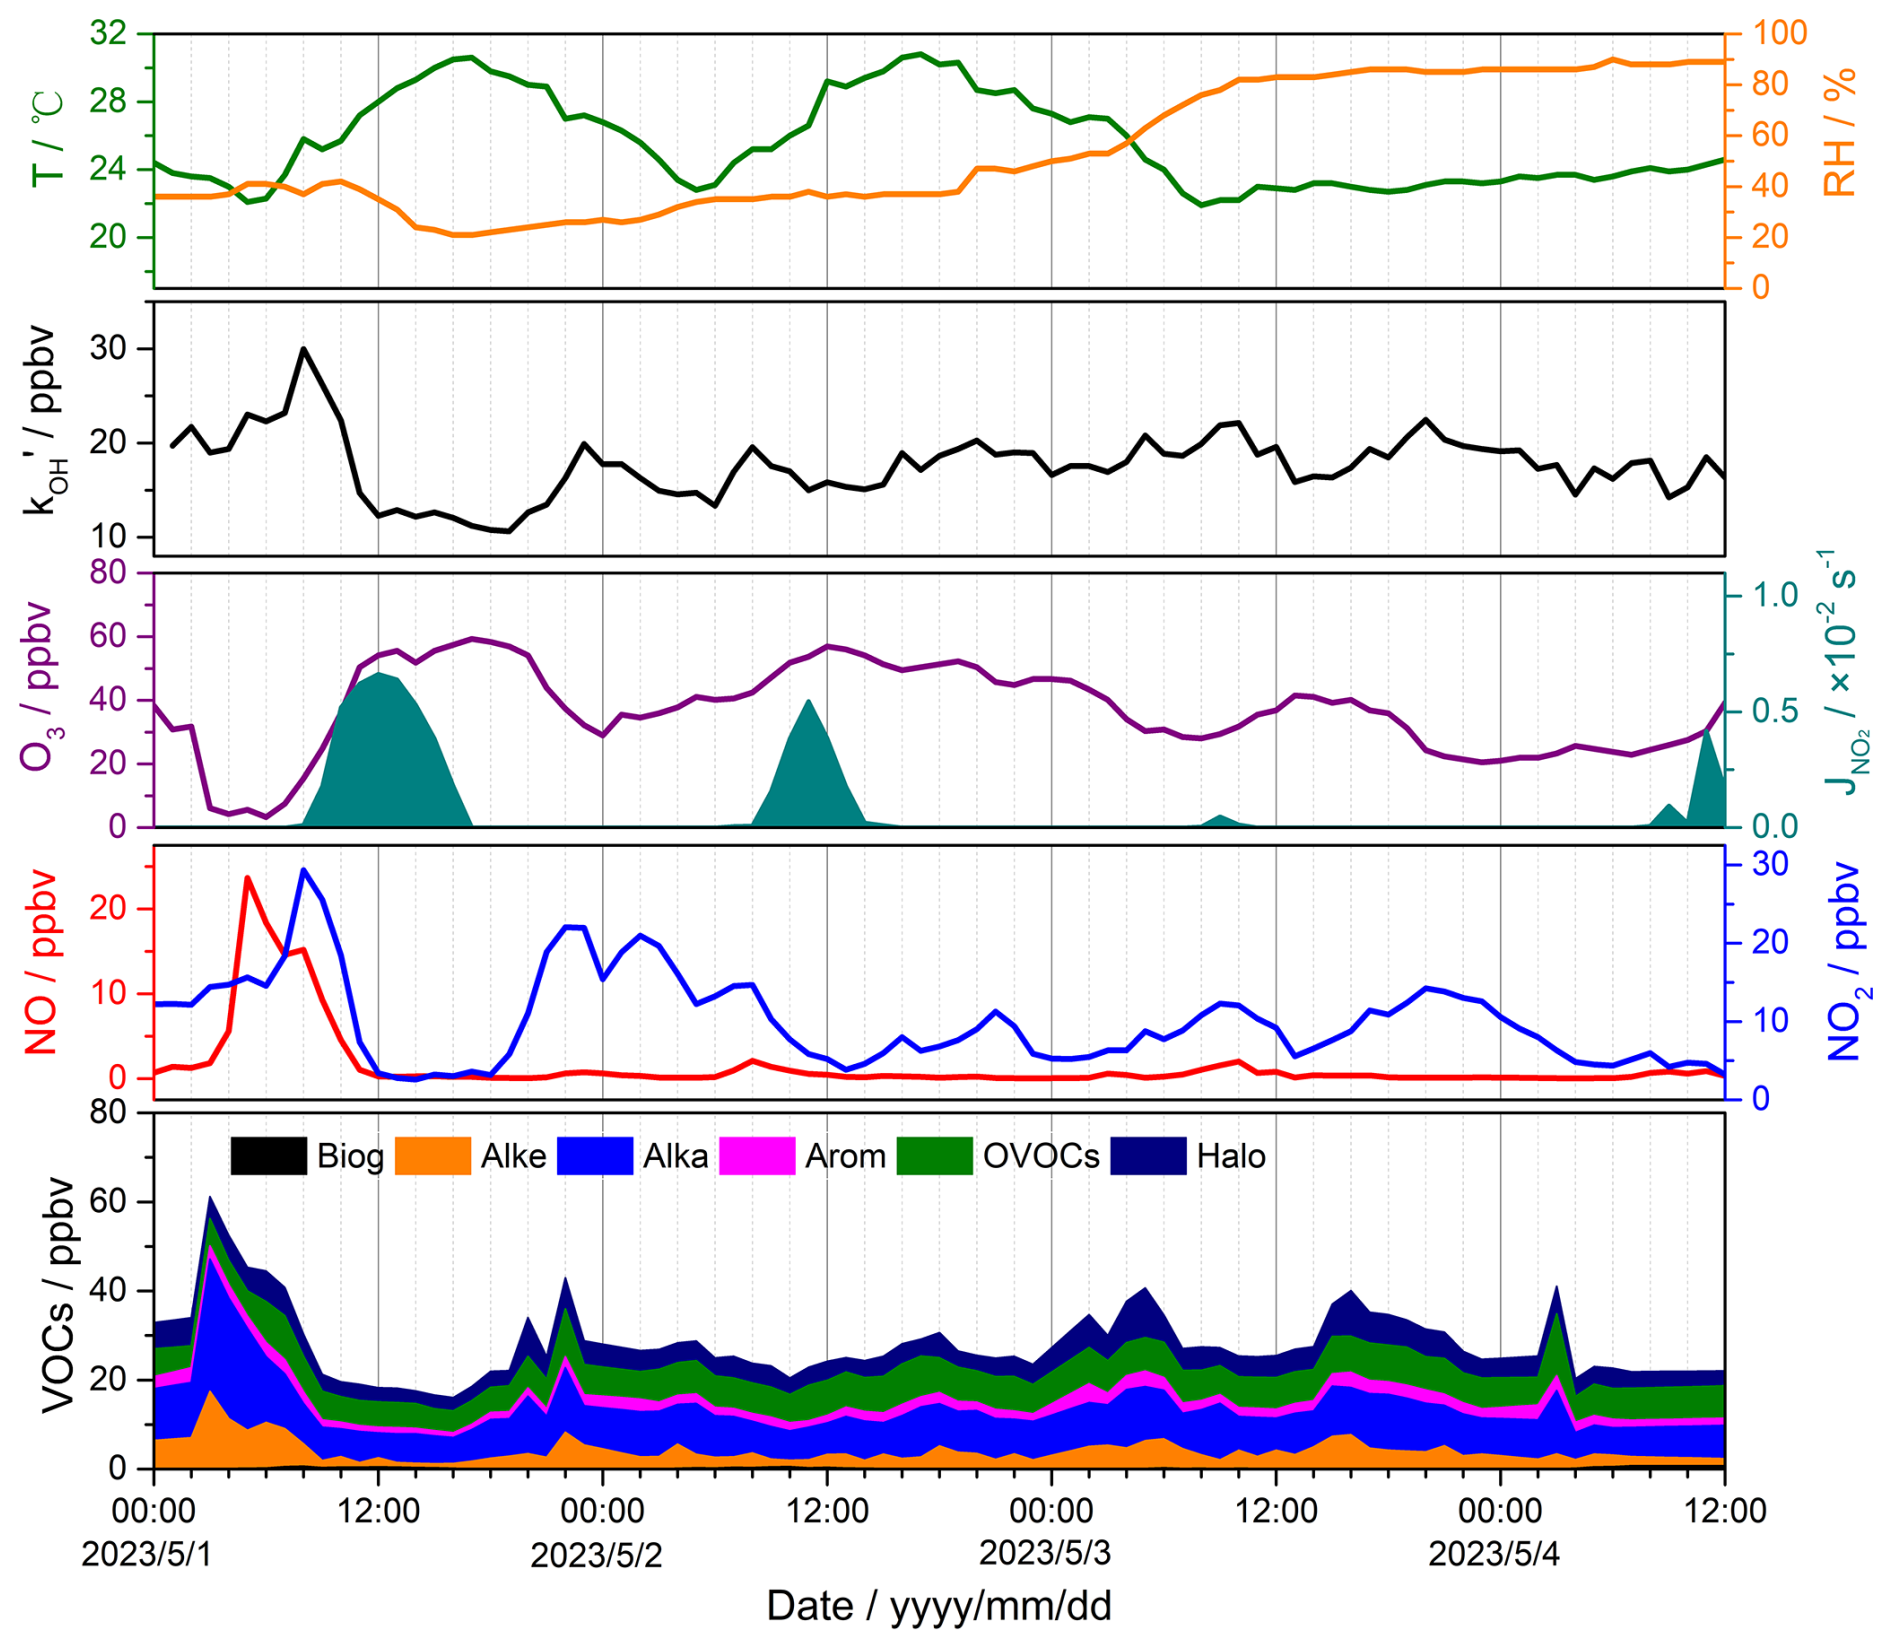
Figure 9Time series of observed meteorological and chemical parameters, including ambient temperature; relative humidity; total OH reactivity; photolysis frequencies (J(NO2)); and concentrations of O3, NO, NO2, and VOCs. The time period is from 1 to 4 May 2023.
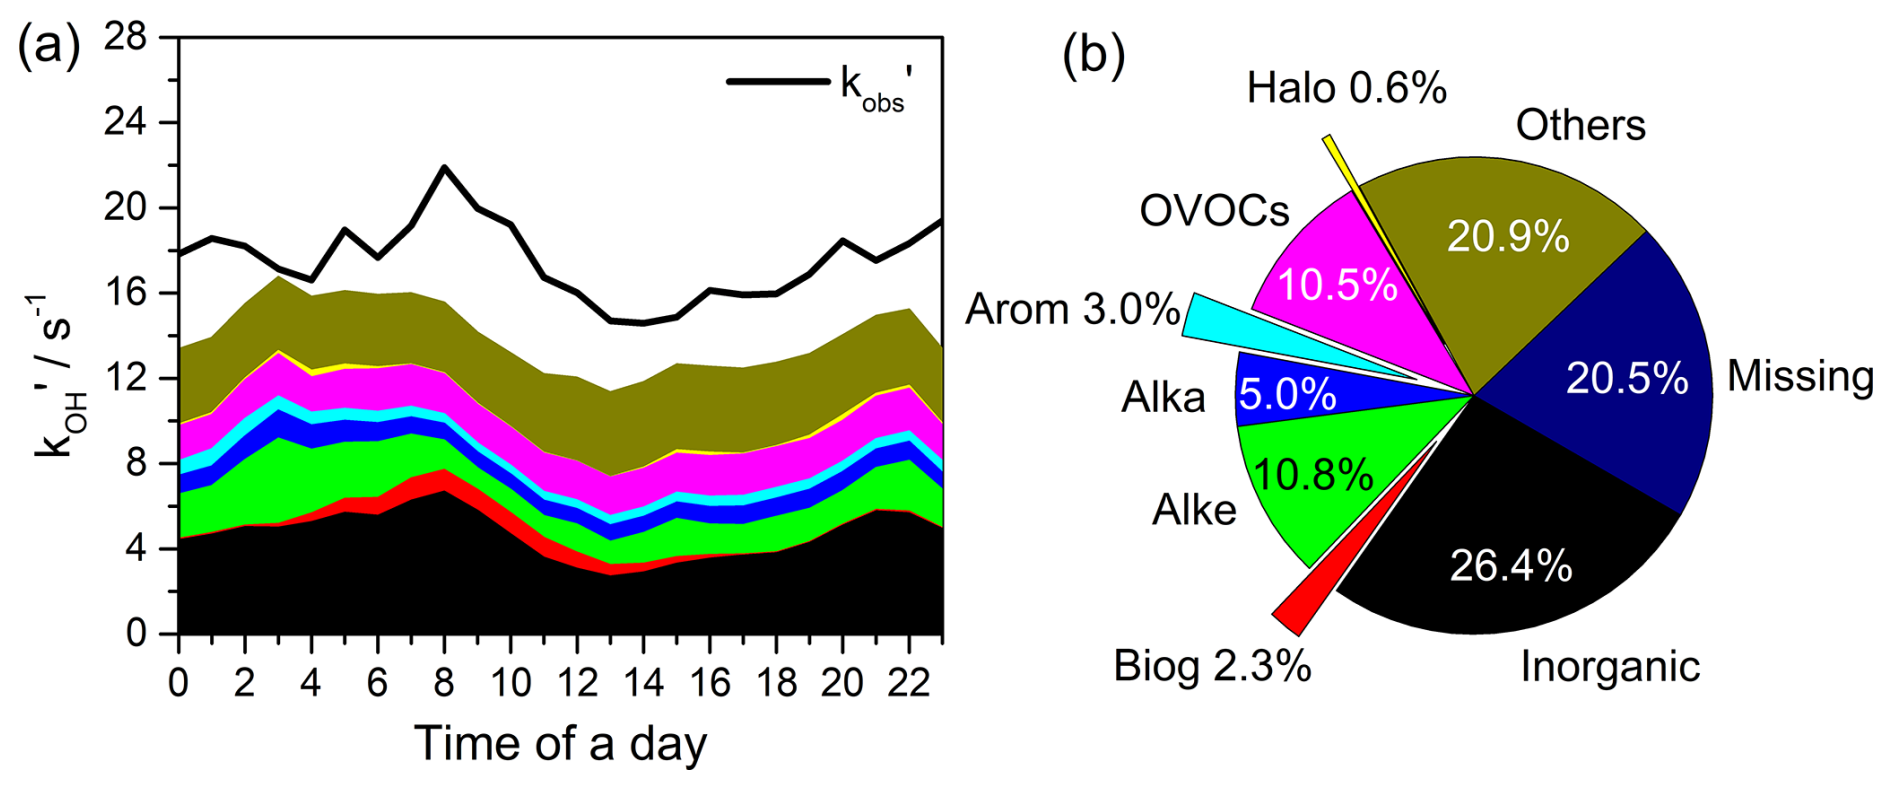
Figure 10(a) Stack of diurnal profiles of observed compared with calculated OH reactivity from individual groups of measured atmospheric species; (b) pie chart of contributions from each group to total reactivity.
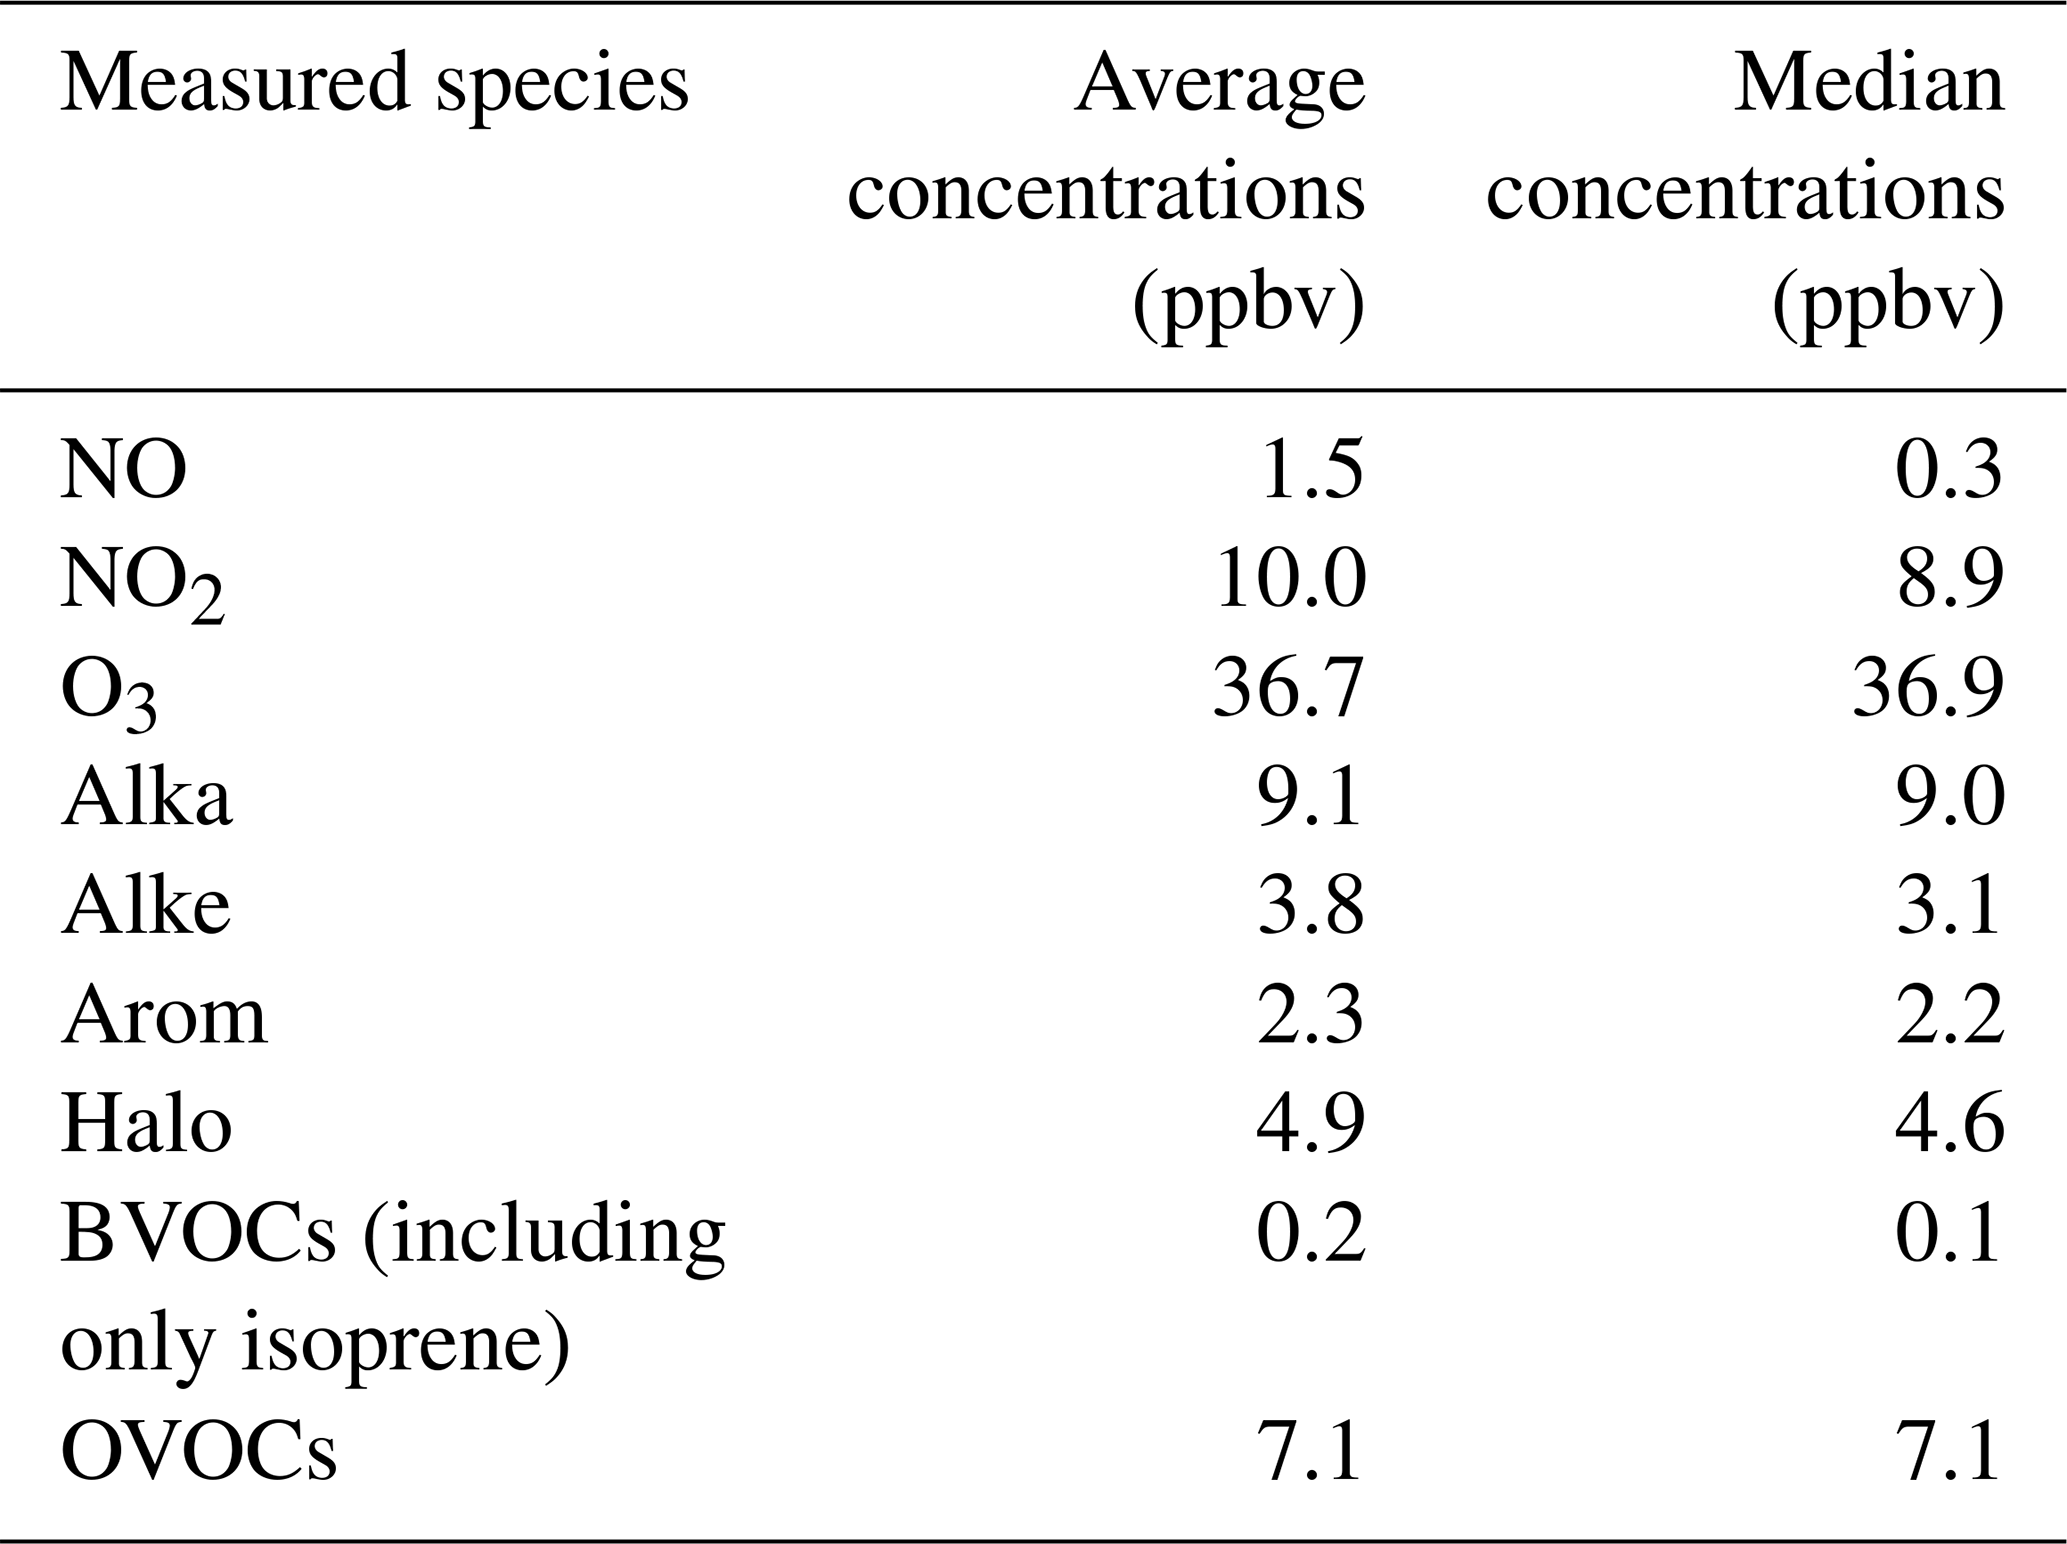
An overview of observed meteorological and gas concentrations is given in Fig. 9. The average temperature and relative humidity during the observation period were 25.6 °C (range from 21.9 to 30.8 °C) and 53.8 % (range from 21 % to 90 %), respectively. The large changes in J(NO2) were due to the rainy weather on 3 May and cloudy conditions on 4 May. Table 2 summarizes the mean and median concentrations of the measured species during the observation period. The mean concentrations of NO, NO2, and O3 were 1.5, 10.0, and 36.7 ppbv, respectively. Alkanes, OVOCs, and hydrocarbons were the three VOCs with the highest concentrations during the period. The corresponding mean concentrations were 9.1, 7.1, and 4.9 ppbv, respectively. The measured BVOCs only include isoprene, with a mean concentration of 0.2 ppbv. The minimum and maximum values of were 10.6 and 30.0 s−1, respectively.
Table 2The mean and median concentrations of measured species during the observation period in the form of classification.
The reactive species and exhibited distinct daily variations on 1 May (the first day of the International Labour Day holiday). The peak of VOC concentrations (60 ppbv) appeared at 03:00 LT. The concentrations of NO began increasing significantly from 03:00 LT onwards, reaching a peak of 23.7 ppbv around 05:00 LT. Concurrently, the abundant NO reacted with O3, resulting in the lowest observed O3 concentration (∼ 5 ppbv) and an increase in NO2 level. and NO2 reached their peak values of 30.0 s−1 and 29.3 ppbv at about 08:00 LT in the morning, declining rapidly as sunlight intensified, with the lowest values observed between 12:00 and 13:00 LT. The highest O3 concentration (59.3 ppbv) occurred around 17:00 LT in the afternoon. and reactive species exhibited relatively low values in the following days, and no significant peak in NO concentration was observed in the afternoon. These changes could be attributed to the “holiday effect” (Fatahi et al., 2021), which reflects extensive vehicle travel on the eve and the first day of the holiday and decreased human activities near the observation site during the holiday (Song et al., 2022).
A zero-dimensional box model (Framework for 0-Dimensional Atmospheric Modelling, F0AM) based on the Master Chemical Mechanism (MCM3.3.1, https://mcm.york.ac.uk/MCM/, last access: 30 July 2024) was applied for comparison with the observed total OH reactivity (Wolfe et al., 2016; Wei et al., 2023). The model was constrained by the measured species and parameters of meteorology and photolysis. Figure 10a shows the diurnal profiles of observed and simulated . The observed ranged from 14.6 s−1 (at 14:00 LT) to 21.9 s−1 (at 08:00 LT), with an average value of 17.5 s−1. According to the pie chart analysis in Fig. 10b, inorganic species, alkenes, OVOCs, and alkanes contributed 26.4 %, 10.8 %, 10.5 %, and 5.0 % to the , respectively. Contributions from aromatic and halogenated hydrocarbons were relatively low, accounting for 3.0 % and 0.6 %. The contribution of photochemical secondary products (others) was as high as 20.9 %, while the missing reactivity (i.e. the difference between observed and simulated averaged ∼ 20.5 %, highlighting the significant role of photochemical and unidentified components in local atmospheric chemistry.
A portable LP-FRS instrument was developed. A specific Herriott-type pump–probe MPC with a small multi-pass beam distribution circle radius of 3.7 mm at the centre of the cell was designed to offer an effective overlapping path length of ∼ 28.5 m between the mid-infrared probe light and the photolysis light with a high overlapping factor of 75.4 %. Such an overlapping factor benefits from reducing instrument size, resulting in dimensions of just 130 cm × 40 cm × 35 cm. The precision and uncertainty of the LP-FRS instrument for measuring atmospheric were 1.0 s−1 (1σ, 300 s) and within 2 s−1, respectively. A field test was performed at a suburban site, where the averaged measured was 17.5 s−1 with a missing reactivity of 20.5 % compared to the model-simulated result based on measured species. The developed portable LP-FRS instrument expands the measurement capabilities for atmospheric total OH reactivity and will be employed in more field observations.
The data used in this study can be obtained from the Science Data Bank accessible at https://doi.org/10.57760/sciencedb.19568 (Fang et al., 2025).
BF and WZhao designed the research. BF, WZhao, and NY built the instrument. BF, JL, and HeZ conducted the instrument test. BF and HaZ analysed the data. NW performed the simulation. BF and WZhang wrote the paper. YaL, ZZ, and YuL helped during the field test. All authors discussed the results and commented on the paper.
The contact author has declared that none of the authors has any competing interests.
Publisher's note: Copernicus Publications remains neutral with regard to jurisdictional claims made in the text, published maps, institutional affiliations, or any other geographical representation in this paper. While Copernicus Publications makes every effort to include appropriate place names, the final responsibility lies with the authors.
This research has been supported by the National Key Research and Development Program of China (grant nos. 2022YFC3700304, 2023YFC3705502), the National Natural Science Foundation of China (grant nos. U21A2028, 42105099, 91544228), the 2024 industrialization fund of Wanjiang Emerging Industry Technology Development Centre (grant no. WJ24CYHXM03), and the HFIPS Director's Fund (grant nos. BJPY2023A02, YZJJ202101).
This paper was edited by Anna Novelli and reviewed by three anonymous referees.
Atkinson, R., Baulch, D. L., Cox, R. A., Crowley, J. N., Hampson, R. F., Hynes, R. G., Jenkin, M. E., Rossi, M. J., and Troe, J.: Evaluated kinetic and photochemical data for atmospheric chemistry: Volume I – gas phase reactions of Ox, HOx, NOx and SOx species, Atmos. Chem. Phys., 4, 1461–1738, https://doi.org/10.5194/acp-4-1461-2004, 2004.
Atkinson, R., Baulch, D. L., Cox, R. A., Crowley, J. N., Hampson, R. F., Hynes, R. G., Jenkin, M. E., Rossi, M. J., Troe, J., and IUPAC Subcommittee: Evaluated kinetic and photochemical data for atmospheric chemistry: Volume II – gas phase reactions of organic species, Atmos. Chem. Phys., 6, 3625–4055, https://doi.org/10.5194/acp-6-3625-2006, 2006.
Brecha, R. J., Pedrotti, L. M., and Krause, D.: Magnetic rotation spectroscopy of molecular oxygen with a diode laser, J. Opt. Soc. Am. B, 14, 1921–1930, https://doi.org/10.1063/1.1149176, 1997.
Cheng, F., Zhao, W., Fang, B., Zhang, Y., Yang, N., Zhou, H., and Zhang, W.: High band-width mid-infrared frequency-modulated Faraday rotation spectrometer for time resolved measurement of the OH radical, Opt. Express, 31, 25058–25069, https://doi.org/10.1364/OE.493270, 2023.
Di Carlo, P., Brune, W. H., Martinez, M., Harder, H., Lesher, R., Ren, X., Thornberry, T., Carroll, M. A., Young, V., Shepson, P. B., Riemer, D., Apel, E., and Campbell, C.: Missing OH reactivity in a forest: evidence for unknown reactive biogenic VOCs, Science, 304, 722–725, https://doi.org/10.1126/science.1094392, 2004.
Fang, B., Yang, N., Wang, C., Zhao, W., Xu, X., Zhang, Y., and Zhang, W.: Detection of nitric oxide with Faraday rotation spectroscopy at 5.33 µm, Chin. J. Chem. Phys., 33, 37–42, https://doi.org/10.1063/1674-0068/cjcp1910182, 2020.
Fang, B., Wei, N., Zhao, W., Yang, N., Zhou, H., Zhang, H., Li, J., Zhang, W., Lu, Y., Zhu, Z., and Liu, Y.: Data used in preprint of “Development of a portable laser-flash photolysis Faraday rotation spectrometer for measuring atmospheric total OH reactivity” [DS/OL], V1, Science Data Bank [data set], https://doi.org/10.57760/sciencedb.19568, 2025.
Fatahi, Y., Kouznetsov, R., and Sofiev, M.: The effect of accounting for public holidays on the skills of the atmospheric composition model SILAM v.5.7, Geosci. Model Dev., 14, 7459–7475, https://doi.org/10.5194/gmd-14-7459-2021, 2021.
Fuchs, H., Hofzumahaus, A., Rohrer, F., Bohn, B., Brauers, T., Dorn, H. P., Häseler, R., Holland, F., Kaminski, M., Li, X., Lu, K., Nehr, S., Tillmann, R., Wegener, R., and Wahner, A.: Experimental evidence for efficient hydroxyl radical regeneration in isoprene oxidation, Nat. Geosci., 6, 1023–1026, https://doi.org/10.1038/ngeo1964, 2013.
Fuchs, H., Novelli, A., Rolletter, M., Hofzumahaus, A., Pfannerstill, E. Y., Kessel, S., Edtbauer, A., Williams, J., Michoud, V., Dusanter, S., Locoge, N., Zannoni, N., Gros, V., Truong, F., Sarda-Esteve, R., Cryer, D. R., Brumby, C. A., Whalley, L. K., Stone, D., Seakins, P. W., Heard, D. E., Schoemaecker, C., Blocquet, M., Coudert, S., Batut, S., Fittschen, C., Thames, A. B., Brune, W. H., Ernest, C., Harder, H., Muller, J. B. A., Elste, T., Kubistin, D., Andres, S., Bohn, B., Hohaus, T., Holland, F., Li, X., Rohrer, F., Kiendler-Scharr, A., Tillmann, R., Wegener, R., Yu, Z., Zou, Q., and Wahner, A.: Comparison of OH reactivity measurements in the atmospheric simulation chamber SAPHIR, Atmos. Meas. Tech., 10, 4023–4053, https://doi.org/10.5194/amt-10-4023-2017, 2017.
Goldstein, A. H. and Galbally, I. E.: Known and unexplored organic constituents in the Earth's atmosphere, Environ. Sci. Technol., 41, 1514–1521, https://doi.org/10.1021/es072476p, 2007.
Gordon, I. E., Rothman, L. S., Hargreaves, R. J., Hashemi, R., Karlovets, E. V., Skinner, F. M., Conway, E. K., Hill, C., Kochanov, R. V., Tan, Y., Wcisło, P., Finenko, A. A., Nelson, K., Bernath, P. F., Birk, M., Boudon, V., Campargue, A., Chance, K. V., Coustenis, A., Drouin, B. J., Flaud, J. M., Gamache, R. R., Hodges, J. T., Jacquemart, D., Mlawer, E. J., Nikitin, A. V., Perevalov, V. I., Rotger, M., Tennyson, J., Toon, G. C., Tran, H., Tyuterev, V. G., Adkins, E. M., Baker, A., Barbe, A., Canè, E., Császár, A. G., Dudaryonok, A., Egorov, O., Fleisher, A. J., Fleurbaey, H., Foltynowicz, A., Furtenbacher, T., Harrison, J. J., Hartmann, J. M., Horneman, V. M., Huang, X., Karman, T., Karns, J., Kassi, S., Kleiner, I., Kofman, V., Kwabia-Tchana, F., Lavrentieva, N. N., Lee, T. J., Long, D. A., Lukashevskaya, A. A., Lyulin, O. M., Makhnev, V. Y., Matt, W., Massie, S. T., Melosso, M., Mikhailenko, S. N., Mondelain, D., Müller, H. S. P., Naumenko, O. V., Perrin, A., Polyansky, O. L., Raddaoui, E., Raston, P. L., Reed, Z. D., Rey, M., Richard, C., Tóbiás, R., Sadiek, I., Schwenke, D. W., Starikova, E., Sung, K., Tamassia, F., Tashkun, S. A., Auwera, J. V., Vasilenko, I. A., Vigasin, A. A., Villanueva, G. L., Vispoel, B., Wagner, G., Yachmenev, A., and Yurchenko, S. N.: The HITRAN2020 molecular spectroscopic database, J. Quant. Spectrosc. Ra., 277, 107949, https://doi.org/10.1016/j.jqsrt.2021.107949, 2022.
Hansen, R. F., Griffith, S. M., Dusanter, S., Rickly, P. S., Stevens, P. S., Bertman, S. B., Carroll, M. A., Erickson, M. H., Flynn, J. H., Grossberg, N., Jobson, B. T., Lefer, B. L., and Wallace, H. W.: Measurements of total hydroxyl radical reactivity during CABINEX 2009 – Part 1: field measurements, Atmos. Chem. Phys., 14, 2923–2937, https://doi.org/10.5194/acp-14-2923-2014, 2014.
Hansen, R. F., Blocquet, M., Schoemaecker, C., Léonardis, T., Locoge, N., Fittschen, C., Hanoune, B., Stevens, P. S., Sinha, V., and Dusanter, S.: Intercomparison of the comparative reactivity method (CRM) and pump–probe technique for measuring total OH reactivity in an urban environment, Atmos. Meas. Tech., 8, 4243–4264, https://doi.org/10.5194/amt-8-4243-2015, 2015.
Heald, C. L., de Gouw, J., Goldstein, A. H., Guenther, A. B., Hayes, P. L., Hu, W., Isaacman-VanWertz, G., Jimenez, J. L., Keutsch, F. N., Koss, A. R., Misztal, P. K., Rappenglück, B., Roberts, J. M., Stevens, P. S., Washenfelder, R. A., Warneke, C., and Young, C. J.: Contrasting reactive organic carbon observations in the southeast United States (SOAS) and southern California (CalNex), Environ. Sci. Technol., 54, 14923–14935, https://doi.org/10.1021/acs.est.0c05027, 2020.
Hens, K., Novelli, A., Martinez, M., Auld, J., Axinte, R., Bohn, B., Fischer, H., Keronen, P., Kubistin, D., Nölscher, A. C., Oswald, R., Paasonen, P., Petäjä, T., Regelin, E., Sander, R., Sinha, V., Sipilä, M., Taraborrelli, D., Tatum Ernest, C., Williams, J., Lelieveld, J., and Harder, H.: Observation and modelling of HOx radicals in a boreal forest, Atmos. Chem. Phys., 14, 8723–8747, https://doi.org/10.5194/acp-14-8723-2014, 2014.
Hunter, J. F., Day, D. A., Palm, B. B., Yatavelli, R. L. N., Chan, A. W. H., Kaser, L., Cappellin, L., Hayes, P. L., Cross, E. S., Carrasquillo, A. J., Campuzano-Jost, P., Stark, H., Zhao, Y., Hohaus, T., Smith, J. N., Hansel, A., Karl, T., Goldstein, A. H., Guenther, A., Worsnop, D. R., Thornton, J. A., Heald, C. L., Jimenez, J. L., and Kroll, J. H.: Comprehensive characterization of atmospheric organic carbon at a forested site, Nat. Geosci., 10, 748–753, https://doi.org/10.1038/NGEO3018, 2017.
Ingham, T., Goddard, A., Whalley, L. K., Furneaux, K. L., Edwards, P. M., Seal, C. P., Self, D. E., Johnson, G. P., Read, K. A., Lee, J. D., and Heard, D. E.: A flow-tube based laser-induced fluorescence instrument to measure OH reactivity in the troposphere, Atmos. Meas. Tech., 2, 465–477, https://doi.org/10.5194/amt-2-465-2009, 2009.
Ivanov, A. V., Trakhtenberg, S., Bertram, A. K., Gershenzon, Y. M., and Molina, M. J.: OH, HO2, and ozone gaseous diffusion coefficients, J. Phys. Chem. A, 111, 1632–1637, https://doi.org/10.1021/jp066558w, 2007.
Khayyam, J., Xie, P., Xu, J., Tian, X., Feng, H., and Qinjin, W.: Vertically resolved meteorological adjustments of aerosols and trace gases in Beijing, Taiyuan, and Hefei by using RF model, Sci. Total Environ., 948, 174795, https://doi.org/10.1016/j.scitotenv.2024.174795, 2024.
Kim, S., Sanchez, D., Wang, M., Seco, R., Jeong, D., Hughes, S., Barletta, B., Blake, D. R., Jung, J., Kim, D., Lee, G., Lee, M., Ahn, J., Lee, S.-D., Cho, G., Sung, M. Y., Lee, Y. H., Kim, D. B., Kim, Y., Woo, J. H., Jo, D., Park, R., Park, J. H., Hong, Y. D., and Hong, J. H.: OH reactivity in urban and suburban regions in Seoul, South Korea – an East Asian megacity in a rapid transition, Faraday Discuss., 189, 231–251, https://doi.org/10.1039/C5FD00230C, 2016.
Kohno, N., Zhou, J., Li, J., Takemura, M., Ono, N., Sadanaga, Y., Nakashima, Y., Sato, K., Kato, S., Sakamoto, Y., and Kajii, Y.: Impacts of missing OH reactivity and aerosol uptake of HO2 radicals on tropospheric O3 production during the AQUAS-Kyoto summer campaign in 2018, Atmos. Environ., 281, 119130, https://doi.org/10.1016/j.atmosenv.2022.119130, 2022.
Kovacs, T. A. and Brune, W. H.: Total OH loss rate measurement, J. Atmos. Chem., 39, 105–122, https://doi.org/10.1023/A:1010614113786, 2001.
Kumar, V. and Sinha, V.: VOC-OHM: A new technique for rapid measurements of ambient total OH reactivity and volatile organic compounds using a single proton transfer reaction mass spectrometer, Int. J. Mass Spectrom., 374, 55–63, https://doi.org/10.1016/j.ijms.2014.10.012, 2014.
Lawrence, M. G.: The relationship between relative humidity and the dewpoint temperature in moist air, B. Am. Meteorol. Soc., 86, 225–234, https://doi.org/10.1175/BAMS-86-2-225, 2005.
Lewicki, R., Doty III, J. H., Curl, R. F., Tittel, F. K., and Wysocki, G.: Ultrasensitive detection of nitric oxide at 5.33 µm by using external cavity quantum cascade laser-based Faraday rotation spectroscopy, P. Natl. Acad. Sci. USA, 106, 12587–12592, https://doi.org/10.1073/pnas.0906291106, 2009.
Lewis, T., Heard, D. E., and Blitz, M. A.: A novel multiplex absorption spectrometer for time-resolved studies, Rev. Sci. Instrum., 89, 024101, https://doi.org/10.1063/1.5006539, 2018.
Li, J., Kohno, N., Sakamoto, Y., Fukusaki, Y., Kousa, Y., Sadanaga, Y., Nakashima, Y., Sato, K., Ramasamy, S., Takami, A., Yoshino, A., Nakayama, T., Kato, S., Ono, N., Zhou, J., Bai, Y., and Kajii, Y.: A quantitative understanding of total OH reactivity and ozone production in a coastal industrial area during the Yokohama air quality study (AQUAS) campaign of summer 2019, Atmos. Environ., 267, 118754, https://doi.org/10.1016/j.atmosenv.2021.118754, 2021.
Li, J., Kohno, N., Sakamoto, Y., Pham, H. G., Murano, K., Sato, K., Nakayama, T., and Kajii, Y.: Potential factors contributing to ozone production in AQUAS-Kyoto campaign in summer 2020: natural source-related missing OH reactivity and heterogeneous HO2/RO2 loss, Environ. Sci. Technol., 56, 12926–12936, https://doi.org/10.1021/acs.est.2c03628, 2022.
Litfin, G., Pollock, C. R., Curl, R. F., and Tittel, F. K.: Sensitivity enhancement of laser absorption spectroscopy by magnetic rotation effect, J. Chem. Phys., 72, 6602–6605, https://doi.org/10.1063/1.439117, 1980.
Liu, Y., Ivanov, A. V., and Molina, M. J.: Temperature dependence of OH diffusion in air and He, Geophys. Res. Lett., 36, L03816, https://doi.org/10.1029/2008GL036170, 2009.
Lu, K., Guo, S., Tan, Z., Wang, H., Shang, D., Liu, Y., Li, X., Wu, Z., Hu, M., and Zhang, Y.: Exploring atmospheric free-radical chemistry in China: the self-cleansing capacity and the formation of secondary air pollution, Natl. Sci. Rev., 6, 579–594, https://doi.org/10.1093/nsr/nwy073, 2018.
Lou, S., Holland, F., Rohrer, F., Lu, K., Bohn, B., Brauers, T., Chang, C. C., Fuchs, H., Häseler, R., Kita, K., Kondo, Y., Li, X., Shao, M., Zeng, L., Wahner, A., Zhang, Y., Wang, W., and Hofzumahaus, A.: Atmospheric OH reactivities in the Pearl River Delta – China in summer 2006: measurement and model results, Atmos. Chem. Phys., 10, 11243–11260, https://doi.org/10.5194/acp-10-11243-2010, 2010.
Luo, P.: Long-wave mid-infrared time-resolved dual-comb spectroscopy of short-lived intermediates, Opt. Lett., 45, 6791–6794, https://doi.org/10.1364/OL.413754, 2020.
Luo, P. and Horng, E.: Simultaneous determination of transient free radicals and reaction kinetics by high-resolution time-resolved dual-comb spectroscopy, Commun. Chem., 3, 95, https://doi.org/10.1038/s42004-020-00353-6, 2020.
Luo, P., Chung, C., and Lee, Y.: Rate coefficient of the reaction CH2OO + NO2 probed with a quantum-cascade laser near 11 µm, Phys. Chem. Chem. Phys., 21, 17578–17583, https://doi.org/10.1039/C9CP03333E, 2019.
Mao, J., Ren, X., Brune, W. H., Olson, J. R., Crawford, J. H., Fried, A., Huey, L. G., Cohen, R. C., Heikes, B., Singh, H. B., Blake, D. R., Sachse, G. W., Diskin, G. S., Hall, S. R., and Shetter, R. E.: Airborne measurement of OH reactivity during INTEX-B, Atmos. Chem. Phys., 9, 163–173, https://doi.org/10.5194/acp-9-163-2009, 2009.
Mao, J., Ren, X., Chen, S., Brune, W., Chen, Z., Martinez, M., Harder, H., Lefer, B., Rappenglück, B., Flynn, J., and Leuchner, M.: Atmospheric oxidation capacity in the summer of Houston 2006: comparison with summer measurements in other metropolitan studies, Atmos. Environ., 44, 4107–4115, https://doi.org/10.1016/j.atmosenv.2009.01.013, 2010.
Martinez, M., Harder, H., Kovacs, T. A., Simpas, J. B., Bassis, J., Lesher, R., Brune, W. H., Frost, G. J., Williams, E. J., Stroud, C. A., Jobson, B. T., Roberts, J. M., Hall, S. R., Shetter, R. E., Wert, B., Fried, A., Alicke, B., Stutz, J., Young, V. L., White, A. B., and Zamora, R. J.: OH and HO2 concentrations, sources, and loss rates during the Southern Oxidants Study in Nashville, Tennessee, summer 1999, J. Geophys. Res., 108, 4617, https://doi.org/10.1029/2003JD003551, 2003.
Michoud, V., Hansen, R. F., Locoge, N., Stevens, P. S., and Dusanter, S.: Detailed characterizations of the new Mines Douai comparative reactivity method instrument via laboratory experiments and modeling, Atmos. Meas. Tech., 8, 3537–3553, https://doi.org/10.5194/amt-8-3537-2015, 2015.
Muller, J. B. A., Elste, T., Plass-Dülmer, C., Stange, G., Holla, R., Claude, A., Englert, J., Gilge, S., and Kubistin, D.: A novel semi-direct method to measure OH reactivity by chemical ionization mass spectrometry (CIMS), Atmos. Meas. Tech., 11, 4413–4433, https://doi.org/10.5194/amt-11-4413-2018, 2018.
Nicely, J. M., Canty, T. P., Manyin, M., Oman, L. D., Salawitch, R. J., Steenrod, S. D., Strahan, S. E., and Strode, S. A.: Changes in Global Tropospheric OH Expected as a Result of Climate Change Over the Last Several Decades, J. Geophys. Res.-Atmos., 123, 10774–10795, https://doi.org/10.1029/2018JD028388, 2018.
Nölscher, A. C., Sinha, V., Bockisch, S., Klüpfel, T., and Williams, J.: Total OH reactivity measurements using a new fast Gas Chromatographic Photo-Ionization Detector (GC-PID), Atmos. Meas. Tech., 5, 2981–2992, https://doi.org/10.5194/amt-5-2981-2012, 2012.
Parker, A. E., Amedro, D., Schoemaecker, C., and Fittschen, C.: OH radical reactivity measurements by FAGE, Environ. Eng. Manag. J., 10, 107–114, 2011.
Pilgrim, J. S., Jennings, R. T., and Taatjes, C. A.: Temperature controlled multiple pass absorption cell for gas phase chemical kinetics studies, Rev. Sci. Instrum., 68, 1875–1878, https://doi.org/10.1063/1.1147960, 1997.
Praplan, A. P., Pfannerstill, E., Williams, J., and Helen, H.: OH reactivity of the urban air in Helsinki, Finland, during winter, Atmos. Environ., 169, 150–161, https://doi.org/10.1016/j.atmosenv.2017.09.013, 2017.
Qian, H., Turton, D., Seakins, P. W., and Pilling, M. J.: Dynamic frequency stabilization of infrared diode laser for kinetic studies, Chem. Phys. Lett., 322, 57–64, https://doi.org/10.1016/S0009-2614(00)00395-X, 2000.
Sadanaga, Y., Yoshino, A., Watanabe, K., Yoshioka, A., Wakazono, Y., Kanaya, Y., and Kajii, Y.: Development of a measurement system of OH reactivity in the atmosphere by using a laser-induced pump and probe technique, Rev. Sci. Instrum., 75, 2648–2655, https://doi.org/10.1063/1.1775311, 2004.
Safieddine, S. A., Heald, C. L., and Henderson, B. H.: The global nonmethane reactive organic carbon budget: A modeling perspective, Geophys. Res. Lett., 44, 3897–3906, https://doi.org/10.1002/2017GL072602, 2017.
Schilt, S., Thévenaz, L., and Robert, P.: Wavelength modulation spectroscopy: combined frequency and intensity laser modulation, Appl. Optics, 42, 6728–6738, https://doi.org/10.1364/AO.42.006728, 2003.
Sinha, V., Williams, J., Crowley, J. N., and Lelieveld, J.: The Comparative Reactivity Method – a new tool to measure total OH Reactivity in ambient air, Atmos. Chem. Phys., 8, 2213–2227, https://doi.org/10.5194/acp-8-2213-2008, 2008.
Sinha, V., Williams, J., Diesch, J. M., Drewnick, F., Martinez, M., Harder, H., Regelin, E., Kubistin, D., Bozem, H., Hosaynali-Beygi, Z., Fischer, H., Andrés-Hernández, M. D., Kartal, D., Adame, J. A., and Lelieveld, J.: Constraints on instantaneous ozone production rates and regimes during DOMINO derived using in-situ OH reactivity measurements, Atmos. Chem. Phys., 12, 7269–7283, https://doi.org/10.5194/acp-12-7269-2012, 2012.
Song, B., Yan, X., Tan, S., Sai, B., Lai, S., Yu, H., Ou, C., and Lu, X.: Human mobility models reveal the underlying mechanism of seasonal movements across China, Int. J. Mod. Phys. C, 33, 2250054, https://doi.org/10.1142/S0129183122500541, 2022.
Stone, D., Whalley, L. K., and Heard, D. E.: Tropospheric OH and HO2 radicals: field measurements and model comparisons, Chem. Soc. Rev., 41, 6348–6404, https://doi.org/10.1039/c2cs35140d, 2012.
Stone, D., Whalley, L. K., Ingham, T., Edwards, P. M., Cryer, D. R., Brumby, C. A., Seakins, P. W., and Heard, D. E.: Measurement of OH reactivity by laser flash photolysis coupled with laser-induced fluorescence spectroscopy, Atmos. Meas. Tech., 9, 2827–2844, https://doi.org/10.5194/amt-9-2827-2016, 2016.
Teng, C. C., Yan, C., Rousso, A., Zhong, H., Chen, T., Zhang, E. J., Ju, Y., and Wysocki, G.: Time-resolved HO2 detection with Faraday rotation spectroscopy in a photolysis reactor, Opt. Express, 29, 2769–2779, https://doi.org/10.1364/OE.413063, 2021.
Trutna, W. R. and Byer, R. L.: Multiple-pass Raman gain cell, Appl. Optics, 19, 301–312, https://doi.org/10.1364/AO.19.000301, 1980.
Wang, W., Li, X., Cheng, Y., Parrish, D. D., Ni, R., Tan, Z., Liu, Y., Lu, S., Wu, Y., Chen, S., Lu, K., Hu, M., Zeng, L., Shao, M., Huang, C., Tian, X., Leung, K. M., Chen, L., Fan, M., Zhang, Q., Rohrer, F., Wahner, A., Pöschl, U., Su, H., and Zhang, Y.: Ozone pollution mitigation strategy informed by long-term trends of atmospheric oxidation capacity, Nat. Geosci., 17, 20–25, https://doi.org/10.1038/s41561-023-01334-9, 2023.
Wei, N., Fang, B., Zhao, W., Wang, C., Yang, N., Zhang, W., Chen, W., and Fittschen, C.: Time-resolved laser-flash photolysis Faraday rotation spectrometer: a new tool for total OH reactivity measurement and free radical kinetics research, Anal. Chem., 92, 4334–4339, https://doi.org/10.1021/acs.analchem.9b05117, 2020.
Wei, N., Zhao, W., Yao, Y., Wang, H., Liu, Z., Xu, X., Rahman, M., Zhang, C., Fittschen, C., and Zhang, W.: Peroxy radical chemistry during ozone photochemical pollution season at a suburban site in the boundary of Jiangsu–Anhui–Shandong–Henan region, China, Sci. Total Environ., 904, 166355, https://doi.org/10.1016/j.scitotenv.2023.166355, 2023.
Westberg, J. and Axner, O.: Lineshape asymmetries in Faraday modulation spectroscopy, Appl. Phys. B, 116, 467–476, https://doi.org/10.1007/s00340-013-5721-x, 2014.
Wolfe, G. M., Marvin, M. R., Roberts, S. J., Travis, K. R., and Liao, J.: The Framework for 0-D Atmospheric Modeling (F0AM) v3.1, Geosci. Model Dev., 9, 3309–3319, https://doi.org/10.5194/gmd-9-3309-2016, 2016.
Yan, C., Teng, C. C., Chen, T., Zhong, H., Rousso, A., Zhao, H., Ma, G., Wysocki, G., and Ju, Y.: The kinetic study of excited singlet oxygen atom O(1D) reactions with acetylene, Combust. Flame, 212, 135–141, https://doi.org/10.1016/j.combustflame.2019.10.034, 2020.
Yang, Y., Shao, M., Wang, X., Nölscher, A. C., Kessel, S., Guenther, A., and Williams, J.: Towards a quantitative understanding of total OH reactivity: A review, Atmos. Environ., 134, 147–161, https://doi.org/10.1016/j.atmosenv.2016.03.010, 2016.
Yang, Y., Shao, M., Keßel, S., Li, Y., Lu, K., Lu, S., Williams, J., Zhang, Y., Zeng, L., Nölscher, A. C., Wu, Y., Wang, X., and Zheng, J.: How the OH reactivity affects the ozone production efficiency: case studies in Beijing and Heshan, China, Atmos. Chem. Phys., 17, 7127–7142, https://doi.org/10.5194/acp-17-7127-2017, 2017.
Zannoni, N., Dusanter, S., Gros, V., Sarda Esteve, R., Michoud, V., Sinha, V., Locoge, N., and Bonsang, B.: Intercomparison of two comparative reactivity method instruments inf the Mediterranean basin during summer 2013, Atmos. Meas. Tech., 8, 3851–3865, https://doi.org/10.5194/amt-8-3851-2015, 2015.
Zhao, W., Wysocki, G., Chen, W., Fertein, E., Coq, L. D., Petiprez, D., and Zhang, W.: Sensitive and selective detection of OH radicals using Faraday rotation spectroscopy at 2.8 µm, Opt. Express, 19, 2493–2501, https://doi.org/10.1364/OE.19.002493, 2011.
Zhao, W., Wyscoki, G., Chen, W., Zhang, W.: High sensitivity Faraday rotation spectrometer for hydroxyl radical detection at 2.8 µm, Appl. Phys. B, 109, 511–519, https://doi.org/10.1007/s00340-012-5089-3, 2012.
Zhao, W., Fang, B., Lin, X., Gai, Y., Zhang, W., Chen, W., Chen, Z., Zhang, H., and Chen, W.: Superconducting-magnet-based Faraday rotation spectrometer for real time in situ measurement of OH radicals at 106 level in an atmospheric simulation chamber, Anal. Chem., 90, 3958–3964, https://doi.org/10.1021/acs.analchem.7b04949, 2018.