the Creative Commons Attribution 4.0 License.
the Creative Commons Attribution 4.0 License.
 | 24 Mar 2025
Exploring commercial Global Navigation Satellite System (GNSS) radio occultation (RO) products for planetary boundary layer studies in the Arctic
Manisha Ganeshan
Dong L. Wu
Joseph A. Santanello
Chi Ao
Panagiotis Vergados
Kevin J. Nelson
Commercial radio occultation (RO) satellites that utilize the Global Navigation Satellite System (GNSS) signals are emerging as key tools for observing the polar regions, which are not covered by the second-generation Constellation Observing System for Meteorology, Ionosphere, and Climate (COSMIC-2) mission. This study evaluates the value of commercial RO measurements, specifically Spire and GeoOptics, for planetary boundary layer (PBL) investigations in the Arctic, a region where favorable lower-atmospheric penetration of GNSS RO is vital for observing the persistently shallow PBL. The lower tropospheric penetration capability of both Spire and GeoOptics over the Arctic Ocean, with nearly 80 % observations reaching an altitude of 500 m above mean sea level, is comparable to other RO missions such as the current Meteorological Operational satellite programme (MetOp) and the discontinued COSMIC-1 missions. A seasonal cycle in RO penetration probability, with the minimum occurring during the Arctic warm season, was observed in most RO datasets, except NASA-purchased Spire data. Monthly mean Arctic PBL height (PBLH) derived from Spire and GeoOptics compares well with MetOp observations and the reanalysis from Modern-Era Retrospective analysis for Research and Applications version 2 (MERRA-2). A minimum penetration threshold of 500 m generally suffices for determining Arctic PBLH, although a 300 m threshold improves performance of NASA-purchased Spire data. Arctic PBLH representation is influenced less by the number of observations or instrument type and more by the algorithms used for bending angle and refractivity retrievals. These findings underscore the importance of processing algorithms in achieving accurate lower-atmospheric soundings and Arctic PBLH representation.
- Article
(6999 KB) - Full-text XML
- BibTeX
- EndNote


The planetary boundary layer (PBL) is a target observable of broad importance to the Earth science community. The Global Navigation Satellite System (GNSS) radio occultation (RO) has been shown to be a good candidate for observing the PBL height (PBLH) across various spatiotemporal scales (Ao et al., 2012; Basha and Ratnam, 2009; Ding et al., 2021; Kalmus et al., 2022; Nelson et al., 2021; Winning et al., 2017) as recommended by the National Academies of Science Decadal Survey for Earth Science and Applications from Space report (NASEM, 2018; Teixeira et al., 2021). Today, advancing PBL science is inherently reliant on high-resolution observations with high-frequency sampling that can chiefly be afforded by a single remote sensing instrument/combination of instruments from space. In this regard, GNSS RO is a vital measurement technique due to its superior vertical resolution (< 100 m) and viewing geometry compared to most other nadir-viewing space-based instrument technologies, allowing for penetration down to 100 m above surface. High-vertical-resolution measurements and deep penetration of observations into the lower atmosphere are deemed vital. This capability is particularly valuable for polar regions, where persistent surface-based temperature inversions create shallow PBLs that are difficult to observe using other remote sensing methods.
1.1 Importance of GNSS RO for Arctic PBL studies: why commercial data?
The study of the Arctic Ocean PBL can greatly benefit from GNSS RO observations due to their ability to (a) operate under all weather conditions; (b) penetrate persistent cloud cover; (c) perform effectively over flat surfaces, such as sea ice and open ocean; and (d) contribute to a long-term climate data record enhanced by commercial satellite coverage. With the decommissioning of the Constellation Observing System for Meteorology, Ionosphere, and Climate (COSMIC-1) in 2019 and the limited (45° N to 45° S) latitude range of COSMIC-2, commercial satellites provide critical high-latitude observations. However, to fully leverage their potential, it is essential to evaluate their lower-atmospheric sounding capabilities and ensure their compatibility with existing climate data records. The refractivity gradient method, commonly used for determining the PBL height (Ao et al., 2012; Nelson et al., 2021; Qiu et al., 2023; Seidel et al., 2010, 2012), is found to be sensitive to the penetration capability of RO profiles in the Arctic (Ganeshan and Wu, 2015). From the analysis of 8 years of COSMIC-1 data, it was found that the availability of RO profiles over the Arctic Ocean reduced significantly at tangent heights below 1 km, which introduces a sensitivity of the retrieved PBL height to the choice of the cutoff altitude, or minimum RO penetration depth, used for profile selection. It was noted that only the absolute PBLH values were sensitive to the choice of cutoff altitude, whereas the spatial and seasonal variability remained largely unaffected (Ganeshan and Wu, 2015). Thus, it is worthwhile exploring the lower-atmospheric penetration capability of commercial RO products and their representation of the Arctic PBLH compared to past and current existing operational GNSS RO products.
1.2 A background of GNSS RO neutral atmosphere technique
In the GNSS RO retrieval technique, the neutral atmosphere is considered to be the atmospheric path consisting of the troposphere and stratosphere (up to 60 km) which is refractive and electrically neutral unlike the mesosphere and ionosphere–thermosphere regions. The neutral atmosphere has both dry and wet components that contribute to refraction, with the wet component becoming more important closer to the surface due to increased concentrations of water vapor. Not all RO profiles reach the surface, and in fact, there can be an exponential drop in the fraction of available RO observations (i.e., penetration probability) as we go towards the surface as shown by Ganeshan and Wu (2015). This change in penetration probability is primarily due to the decrease in the signal-to-noise ratio (SNR) caused by atmospheric defocusing (Wu et al., 2022). However, factors such as instrument design, neutral atmosphere excess-phase computation method, and choice of bending angle retrieval algorithm can also affect the penetration probability profile for a given atmospheric path (Vannah et al., 2025).
A thorough understanding of factors affecting RO penetration is desirable to help minimize sampling bias as well as to ensure data continuity and consistency in climate records. However, this is difficult to achieve given the existence of a large number of GNSS RO missions and different versions of products from a single mission that are periodically re-processed to remain up to date with advances in software and processing algorithms (Vannah et al., 2025). This study aims to provide a comparison of the penetration capability of new commercial GNSS RO data products against other existing products in the Arctic as the first step towards establishing a climate-ready, long-term continuous dataset that can be used for Arctic PBL investigations.
2.1 Datasets
The value of commercial GNSS RO products for PBL studies in the Arctic Ocean (north of 60° N, excluding land areas) is assessed by comparing with established RO mission products, such as COSMIC-1 and the Meteorological Operational satellite programme (MetOp), as well as reanalysis data. The commercial GNSS RO data evaluated in this study are purchased by NASA through the Commercial Satellite Data Acquisition (CSDA) program. As of this study, the only approved vendors with radio occultation data in NASA's CSDA program are Spire and GeoOptics, though data from other vendors are under evaluation for inclusion in the CSDA archives (CSDA, 2025). In addition, commercial data for near-real-time operations purchased by NOAA and processed by University Corporation for Atmospheric Research (UCAR) are also analyzed for overlapping periods.
Table 1List of RO satellite products used in this study, including the Level 2 data processing center, data version, and processing mode, along with the chosen study period and average total monthly RO profile count available over the Arctic Ocean during the study period.
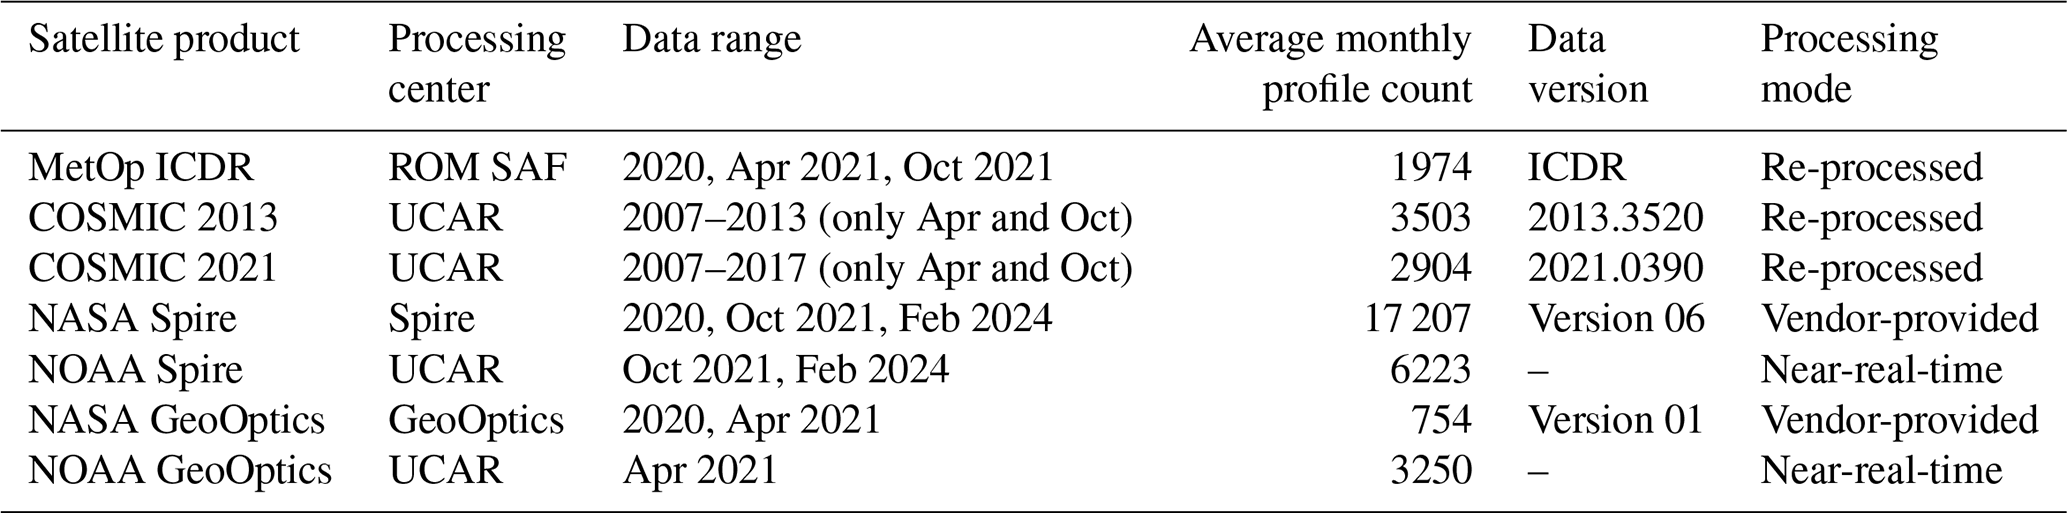
Table 1 summarizes the RO datasets used, including data periods, processing centers, and average monthly profiles over the Arctic Ocean.
2.1.1 Commercial RO data
NASA-purchased Spire data are processed by the vendor and provided at a similar vertical grid and resolution as other GNSS RO missions (such as COSMIC, COSMIC-2, and MetOp), where the lowest level of valid observations differs from profile to profile because the penetration depth achieved by each RO is unique, depending primarily on the SNR. GeoOptics data purchased under the CSDA program and provided by the vendor, on the other hand, are on a uniform 100 m vertical grid, along with a quality flag that is used to determine the lowest penetration level. GeoOptics uses the phase matching methodology in RO processing (Jensen et al., 2004), a wave optics technique designed to extract the full information from the received wave field. The quality flag is applied in two ways: (i) blanket criteria that check the range of the amplitude of computed phase matching integral and cumulative number of phase jumps within the upper neutral atmosphere (between 8 and 40 km), rejecting profiles if the previous checks failed, and (ii) individual criteria that flag each level as good or bad based on the presence or absence of sharp features (e.g., moisture and temperature gradients) that can cause significant deviation of the bending angle relative to a smoothed background bending angle profile. In this study, only profiles satisfying the blanket criteria are considered. Additionally, for each profile, the minimum penetration depth is ascertained by the lowest above-surface level with a good quality flag. It is important to note that if a “sharp” PBL inversion layer with a poor quality control (QC) flag exists above the minimum penetration depth, that profile is not discarded.
The NOAA Spire and GeoOptics data purchased for near-real-time operations are downloaded from the University Corporation for Atmospheric Research (UCAR; UCAR COSMIC Program, 2025a, b) website. NOAA purchases Level 1b (L1b) data from both vendors, and Level 2 (L2) neutral atmosphere products are retrieved from in-house excess-phase computations carried out by UCAR in near-real-time. In the case of GeoOptics, the overlap between available NOAA and NASA purchased data is during the month of April 2021, and for Spire, the month of October 2021 is chosen to compare overlapping data. All subsequent references to Spire and GeoOptics in this paper imply NASA-purchased commercial RO data unless explicitly specified to be NOAA-purchased datasets.
2.1.2 Other RO datasets
MetOp data from the Radio Occultation Meteorology Satellite Applications Facility (ROM SAF) and COSMIC-1 data from UCAR (2013 and 2021 re-processed versions) are used in this study for comparative analysis. A major focus will be year-long comparisons between NASA Spire, NASA GeoOptics, and re-processed MetOp data from ROM SAF. The MetOp data are part of the Interim Climate Data Record (ICDR) ROM SAF product which was developed in 2017 (ROM SAF, 2019). Although the MetOp near-real-time (NRT) product from ROM SAF has a more advanced processing setup with improved lower-tropospheric penetration, the goal is to make a comparison with a consistent climate record to avoid ambiguities resulting from frequent software updates. Therefore, the ICDR data are used in this study. Some differences are observed between the rising and setting occultations of MetOp data owing to the use of raw sampling tracking, which is not considered full “open-loop” tracking. In this study, we only consider setting occultations from MetOp which are known to have a slightly better SNR and an overall deeper penetration (Innerkofler et al., 2023). Additionally, re-processed data from COSMIC-1 available from the University Corporation for Atmospheric Research (UCAR COSMIC Program, 2022) are used to compare RO penetration statistics over the Arctic. COSMIC-1 data ceased to be produced beyond 2019, thereby limiting their use for this comparative analysis which is mainly focused on the year 2020. For this study, they serve to provide a stable climatological record of RO penetration statistics over the Arctic Ocean against which characteristics of newer datasets can be compared. Two versions of UCAR re-processed COSMIC-1 data (from the year 2013 and the year 2021) are obtained for the periods ranging from 2007 to 2013 and from 2007 to 2017, respectively. Table 1 lists and describes all RO datasets used in this study, including the center where the L2 data are processed.
2.1.3 Reanalysis data
The Modern-Era Retrospective analysis for Research and Applications version 2 (MERRA-2) reanalysis product (Gelaro et al., 2017) is used to obtain the monthly mean PBLH and the monthly mean sea-ice fraction over the Arctic Ocean to compare against the PBLH derived from GNSS RO datasets. The GEOS atmospheric model, used in MERRA-2, has a horizontal resolution of approximately ∼ 0.5°. The model vertical grid is based on a terrain-following sigma coordinate system, with the first model level over the Arctic Ocean typically being around 50 m above surface and the vertical grid spacing around 100 m within the lowest five model levels.
In MERRA-2, the PBLH is defined as the model level where the eddy heat diffusivity coefficient (KH) value falls below the 2 m2 s−1 threshold (McGrath-Spangler et al., 2015). The GEOS atmospheric model used in MERRA-2 uses the non-local Lock scheme (Lock et al., 2000) in conjunction with the first-order local turbulence closure Louis scheme (Louis et al., 1982). The Lock scheme is used to parameterize non-local mixing in unstable layers, simulating the effects of surface heating and boundary layer cloud-top cooling, including entrainment, whereas the Louis scheme treats both stable and unstable boundary layers. The scheme estimates heat and momentum diffusivity coefficients based on the bulk Richardson number and the turbulent length scale, with provision for dependency on the PBLH from the previous time step in the case of unstable layers (Ganeshan and Yang, 2019). During persistent stable conditions, such as those commonly observed over the frozen Arctic Ocean, the turbulent length scales are expectedly small, implying that the model diffusivity coefficients are largely based on the bulk Richardson number. Thus, the MERRA-2 PBLH over the Arctic is expected to be sensitive to wind and temperature gradients (used for computing the bulk Richardson number), making it comparable to the refractivity-based RO PBLH which responds primarily to the temperature inversion (Ganeshan and Wu, 2015).
2.2 PBLH determination from RO datasets
GNSS RO-derived PBLH is calculated using a gradient method that identifies the first refractivity gradient minimum exceeding −40 N units km−1. A standard cutoff altitude of 500 m is applied to ensure sufficient penetration depth, although sensitivity to lower thresholds (e.g., 300 m) is also assessed.
The PBLH is derived from the GNSS RO refractivity profile using the bottom-up search approach described in Ganeshan and Wu (2015), identifying the first minima of the refractivity gradient to exceed −40 N units km−1 and assigning the corresponding altitude as the PBLH. This approach is specifically useful for deriving the height of the PBL inversion over the Arctic during cold-season months. A cutoff altitude threshold (which is a required minimum penetration threshold), typically set to 500 m (Ao et al., 2012; Guo et al., 2011; Ganeshan and Wu, 2015; Nelson et al., 2021), is applied so that only RO profiles that reach this altitude or lower are included. Ganeshan and Wu (2015) showed that even though the magnitude of the retrieved PBLH over the Arctic is sensitive to the cutoff altitude, its spatiotemporal variability remained unaffected by the choice of this threshold. In this study, the sensitivity of commercial RO products to the choice of cutoff altitude threshold is additionally explored. All GNSS RO-derived monthly mean penetration probability and monthly PBL height characteristics are interpolated onto a 2° latitude × 10° longitude grid as in Ganeshan and Wu (2015). A distance-weighted averaging method is used for interpolation by considering observations falling within a circle of 5° around each grid point. The MERRA-2 variables are similarly interpolated onto the 2° × 10° horizontal grid for ease of comparison.
3.1 Sensitivity of RO penetration loss to bending angle processing method
The GNSS RO bending angle and refractivity profile observations are characterized by a loss of signal (decrease in SNR) as they approach the surface due to atmospheric defocusing (Wu et al., 2022). However, the rate of penetration loss is expectedly different for various RO missions due to diversity in the design of GNSS receivers and their SNR capabilities. Penetration loss can also be different for measurements from the same instrument due to the viewing geometry, as rising occultations can be more difficult to track (Innerkofler et al., 2023), as well as due to inherent disparity in excess-phase computations and bending angle retrieval algorithms (Vannah et al., 2025). For example, older versions of the same product, such as the UCAR COSMIC 2013 version, can differ significantly from newer re-processed versions (e.g., COSMIC 2021 version) due to advances in excess-phase computations, retrieval software, GNSS orbits, clock, and Earth orientation products (UCAR, 2022).
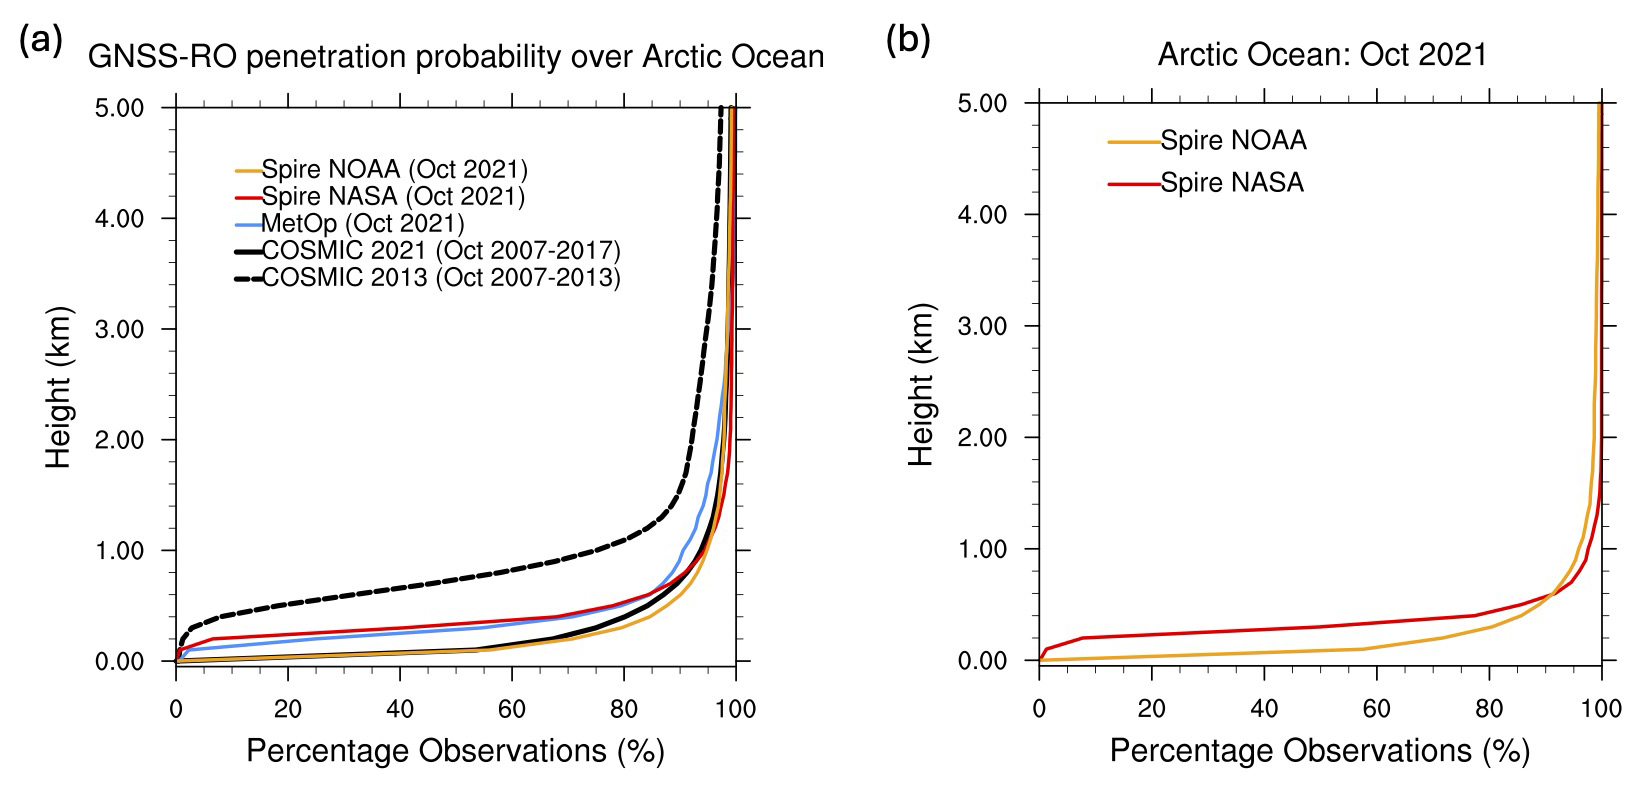
Figure 1RO penetration loss as a function of altitude over the Arctic Ocean (north of 60° N) for the month of October comparing (a) different product versions from three major missions viz. COSMIC-1, MetOp, and Spire and (b) a common sub-sample from Spire NASA and Spire NOAA over the Arctic Ocean.
GNSS RO penetration loss varies by mission and processing methodology. Figure 1a compares the rate of RO penetration loss over the Arctic Ocean for different GNSS RO missions (COSMIC, MetOp, and Spire) as well as for different products from the same mission (COSMIC 2013 vs. COSMIC 2021; Spire NASA vs. Spire NOAA). Clearly, the penetration loss is much less significant for the newer version of COSMIC-1 data compared to the older version. The penetration probability is more or less similar for Spire, MetOp, and COSMIC 2021 products, with differences generally being confined to the lowest 1 km. Spire NASA and MetOp penetration probabilities behave similarly. On the other hand, Spire NOAA data are similar to the re-processed COSMIC 2021 product despite differences in the SNR between the two, with more than 50 % of the profiles penetrating down to 100 m above the surface as opposed to less than 5 % for MetOp and Spire NASA data. The average total monthly observations for each data product are shown in Table 1.
In summary, Fig. 1a demonstrates that newer COSMIC-1 versions significantly outperform older versions in penetration depth. In addition, Spire NASA and MetOp data exhibit similar penetration probabilities, but NOAA-processed Spire data achieve deeper penetration compared to NASA-processed Spire data, underscoring the influence of retrieval algorithms. It is conceivable that differences between Spire NASA and Spire NOAA products in Fig. 1a could be attributable to the differences in the volume and sample size of available data; however, this is not found to be the case. Figure 1b shows the RO penetration probability for a common subset consisting of the exact sub-sample of Spire RO profiles but processed by different sources. The former is processed by the vendor and purchased by NASA as a L2 product, while the latter is processed by UCAR from the vendor-provided L1b data. Even though the same physical ROs are compared, the two products show distinctive penetration patterns below 500 m. The penetration probabilities differ solely due to the choice of the processing algorithm used for retrieving the bending angle and refractivity profiles. On the contrary, when comparing NOAA Spire profiles with the climatology of COSMIC 2021 profiles (Fig. 1a), both processed by UCAR, there is very little difference in the penetration probabilities. Thus, the processing software appears to have a greater bearing on RO penetration loss compared to instrument hardware.
Similarly, Fig. 2 compares the RO penetration profiles for GeoOptics, MetOp, and COSMIC-1 missions. Once again, the most significant differences in RO penetration probabilities are between the old and new re-processed versions of COSMIC-1 data. Comparatively, a smaller percentage of GeoOptics profiles reach 5 km altitude, likely due to the imposed quality checks described in Sect. 2.1.1, however, a good percentage of observations (more than 50 %) reach 100 m altitude, which is comparable to the 2021 re-processed COSMIC-1 product.
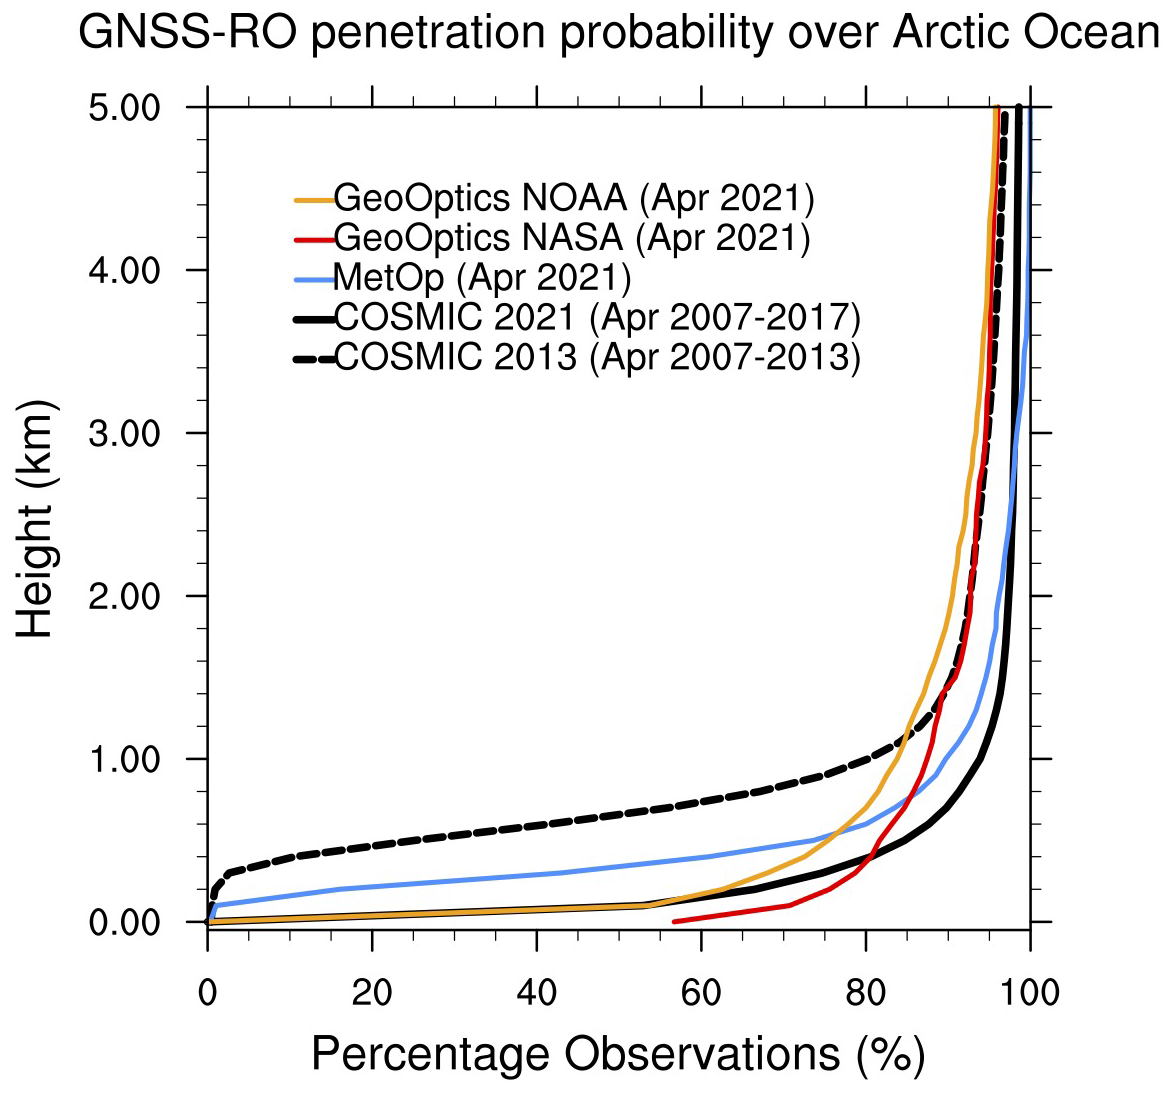
Figure 2RO penetration loss as a function of altitude over the Arctic Ocean (north of 60° N) for the month of April comparing different product versions from three major missions viz. COSMIC-1, MetOp, and GeoOptics.
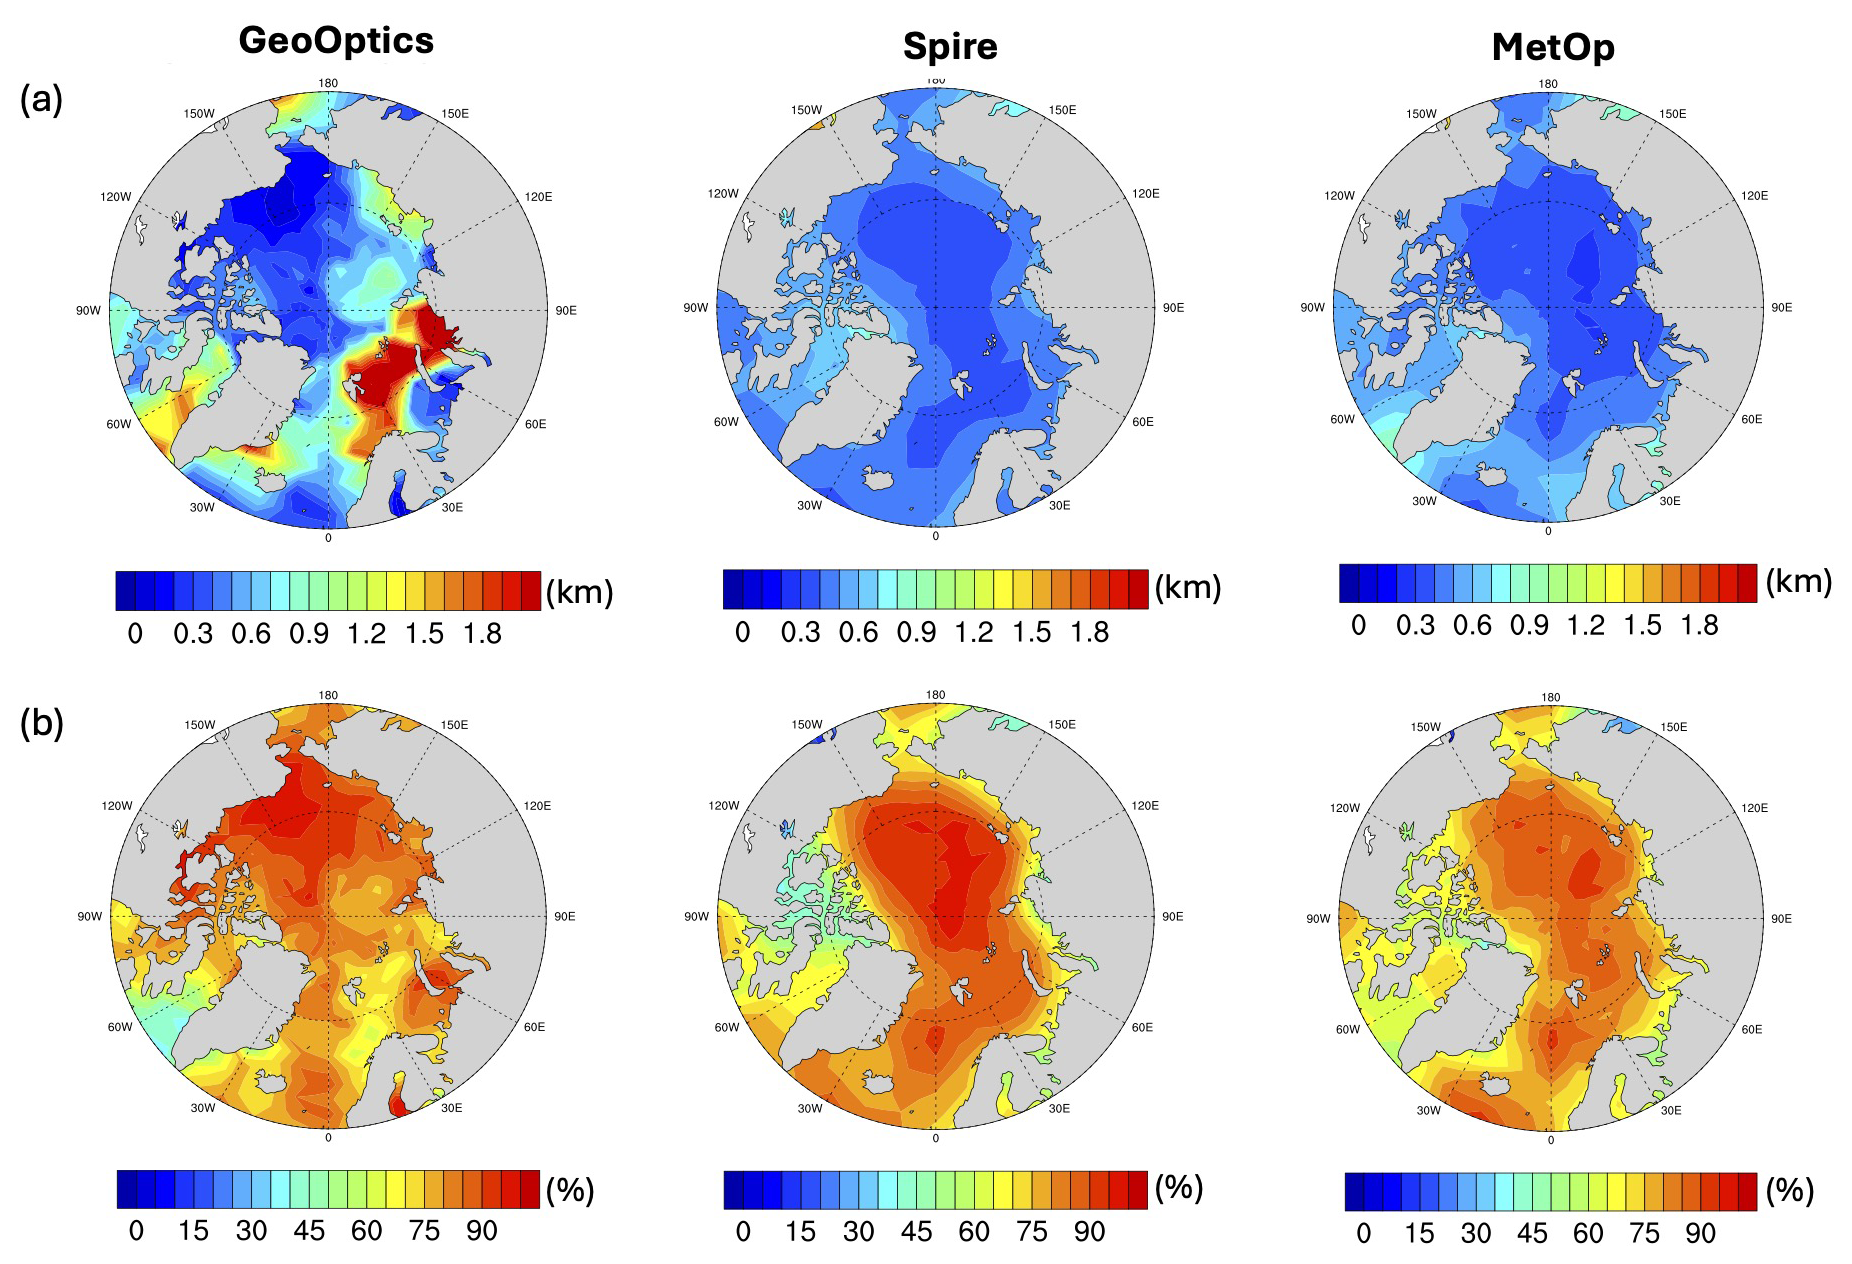
Figure 3RO penetration statistics over the Arctic Ocean for December 2020 comparing GeoOptics, Spire, and MetOp datasets, showing (a) the minimum altitude of RO penetration and (b) the RO penetration probability at 500 m altitude.
3.2 Comparison of RO penetration over the Arctic Ocean
Spatial patterns in RO penetration reveal that Spire and MetOp data have comparable penetration depths, with higher loss near coastal regions, whereas GeoOptics data exhibit the lowest penetration altitudes in regions of persistent sea ice. The top row of Fig. 3 compares the minimum altitude of RO penetration over the Arctic Ocean for NASA Spire, NASA GeoOptics, and MetOp data. Spire and MetOp have similar RO penetration depth throughout the Arctic Ocean, with values dropping towards continental coastlines, which is expected due to influence of topography. GeoOptics has the lowest and highest values of minimum RO penetration altitude compared to the other two datasets, with the lows occurring over the frozen ocean in the Beaufort Sea region and to the north of Greenland and the highs occurring over the Atlantic storm track region. A similar pattern of enhanced RO penetration loss in the storm track region was also observed in COSMIC-1 (2013 version; Ganeshan and Wu, 2015). It has been previously speculated (Ao et al., 2012; Ganeshan and Wu, 2015; Chang et al., 2022) that there is an inverse relationship between water vapor amount and RO penetration depth, with increased lower-atmospheric penetration typically observed in regions away from the tropics, specifically over the dry North Pole.
Previous studies (Ao et al., 2012; Ganeshan and Wu, 2015) have typically chosen a 500 m cutoff altitude to select RO profiles for retrieving the PBLH. Figure 3b compares the RO penetration probability at 500 m altitude between the three datasets. In general, all three products have a high fraction of RO observations (∼ 80 %) reaching 500 m altitude. Figure 4 further compares the annual time series of the percentage of available RO observations at 500 m altitude over the Arctic Ocean. We note a reduction of RO penetration probability for MetOp and GeoOptics during summer months, which is indicative of sensitivity to atmospheric moisture (Ao et al., 2012; Ganeshan and Wu, 2015; Chang et al., 2022). NASA Spire profiles, however, do not show a similar response to moisture, whereas NOAA Spire profiles have the same seasonality in RO penetration probability (not shown). Nevertheless, the focus of this study is the winter season (November–April), during which all three datasets have similar penetration characteristics. The potential for using commercial RO data for Arctic winter PBL studies is further evaluated in the following subsection.
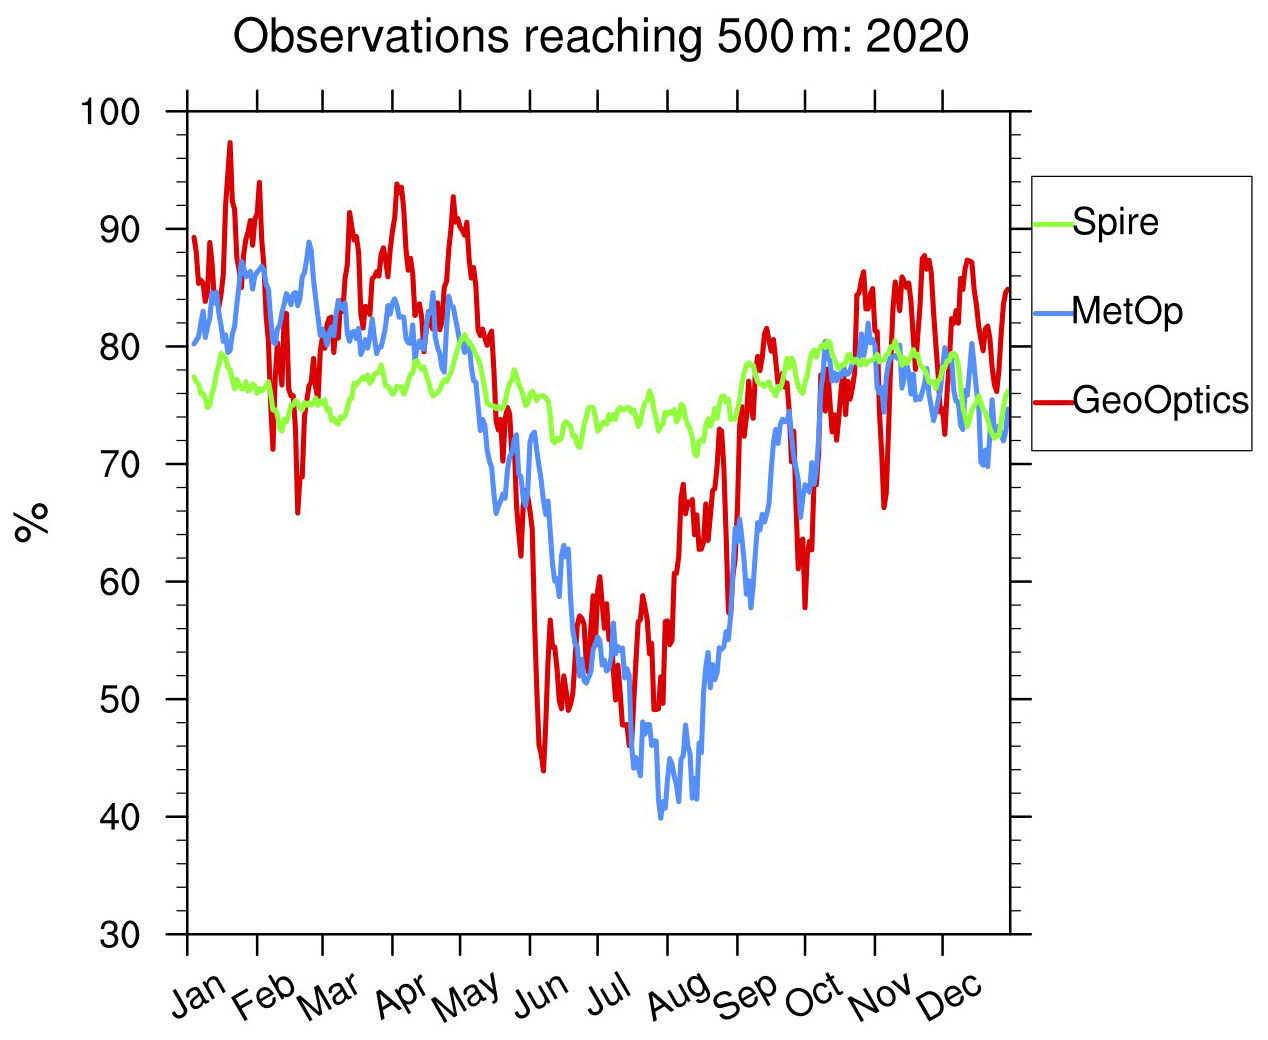
Figure 4Annual time series of the percentage of RO observations reaching 500 m altitude or lower over the Arctic Ocean for the year 2020. The daily observations are smoothed using a 5 d running average filter.
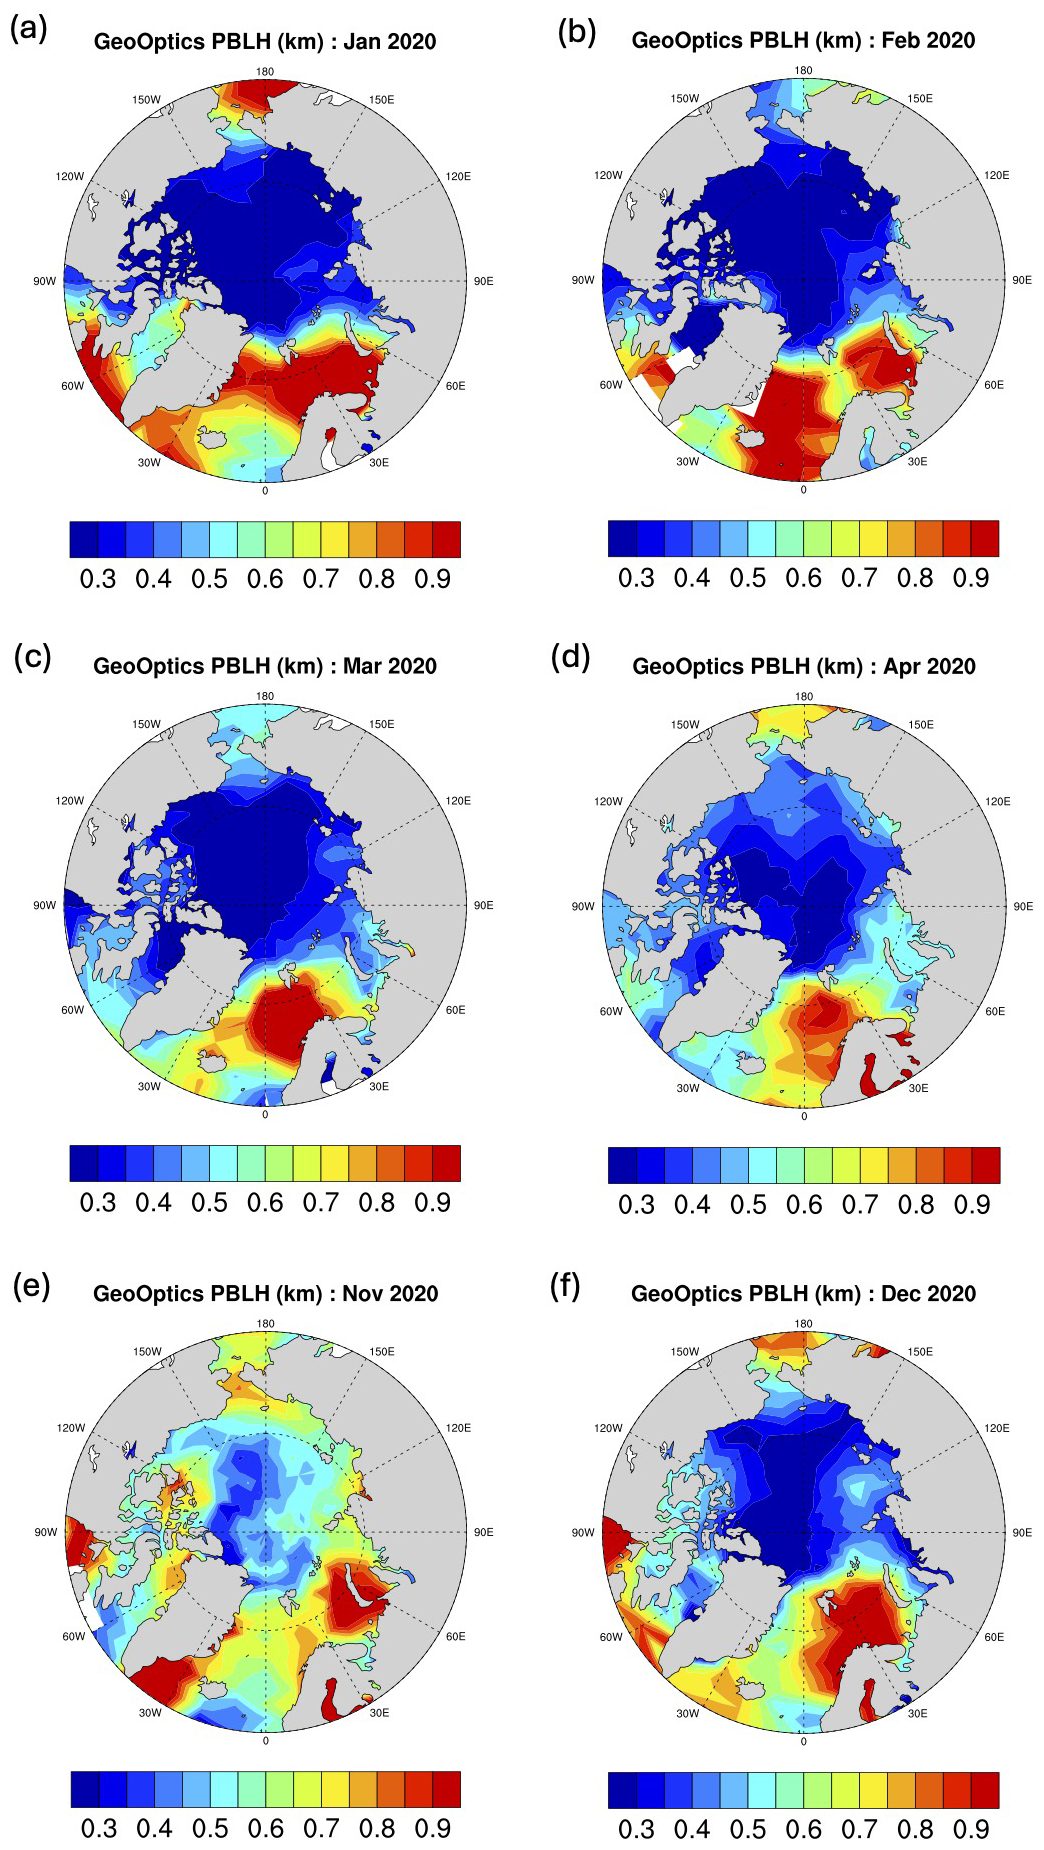
Figure 5NASA GeoOptics monthly Arctic PBLH for cold-season months of the year 2020.
3.3 Performance of commercial GNSS RO datasets for Arctic Ocean PBLH retrieval
Monthly mean PBLH patterns from Spire, GeoOptics, and MetOp datasets align well with MERRA-2 reanalysis (Figs. 5–9). Spire's reduced spatial and seasonal variability and higher values of PBLH minima may result from its vertical smoothing processes, while GeoOptics and MetOp provide better overall representation of the Arctic PBLH.
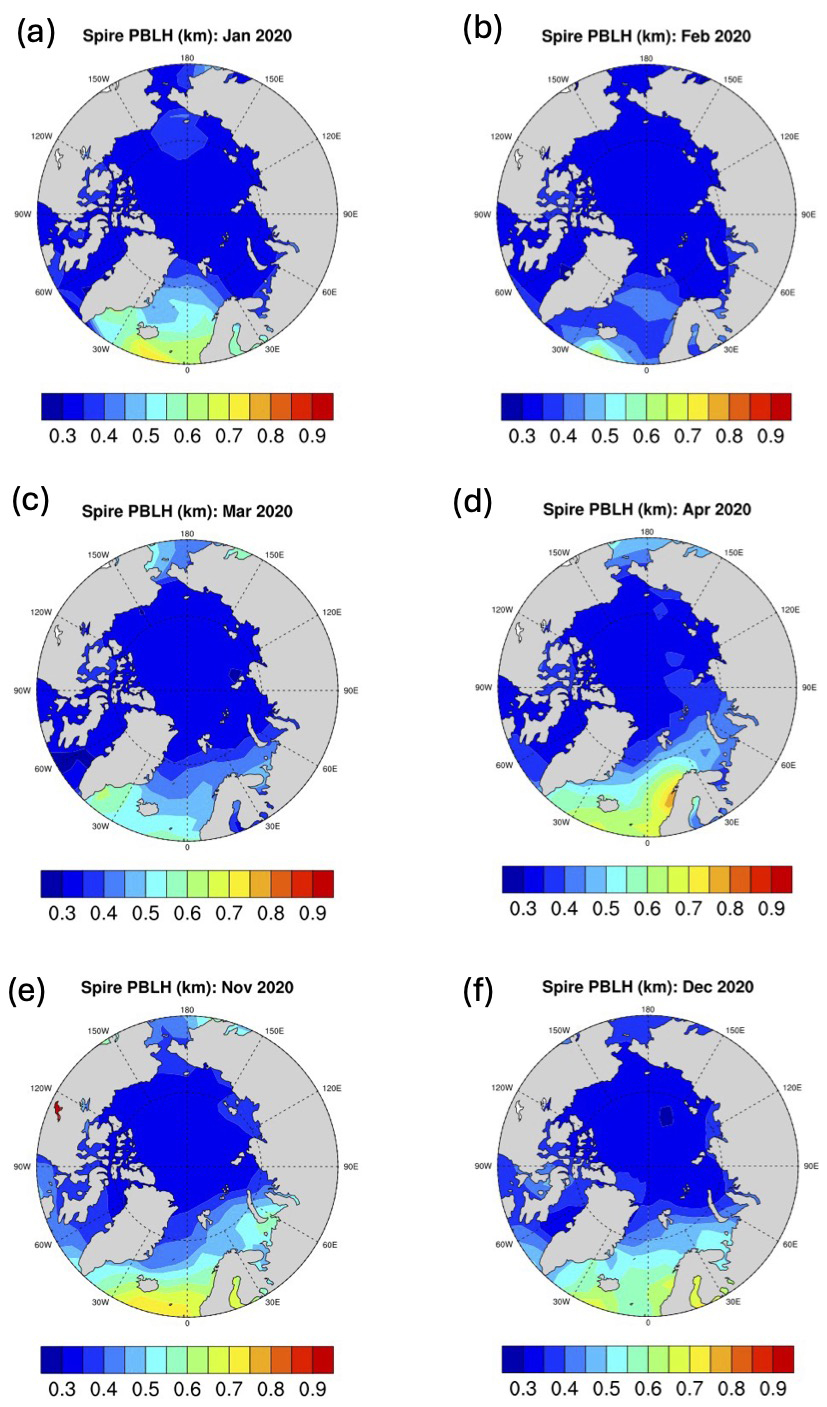
Figure 6NASA Spire monthly Arctic PBLH for cold-season months of the year 2020.
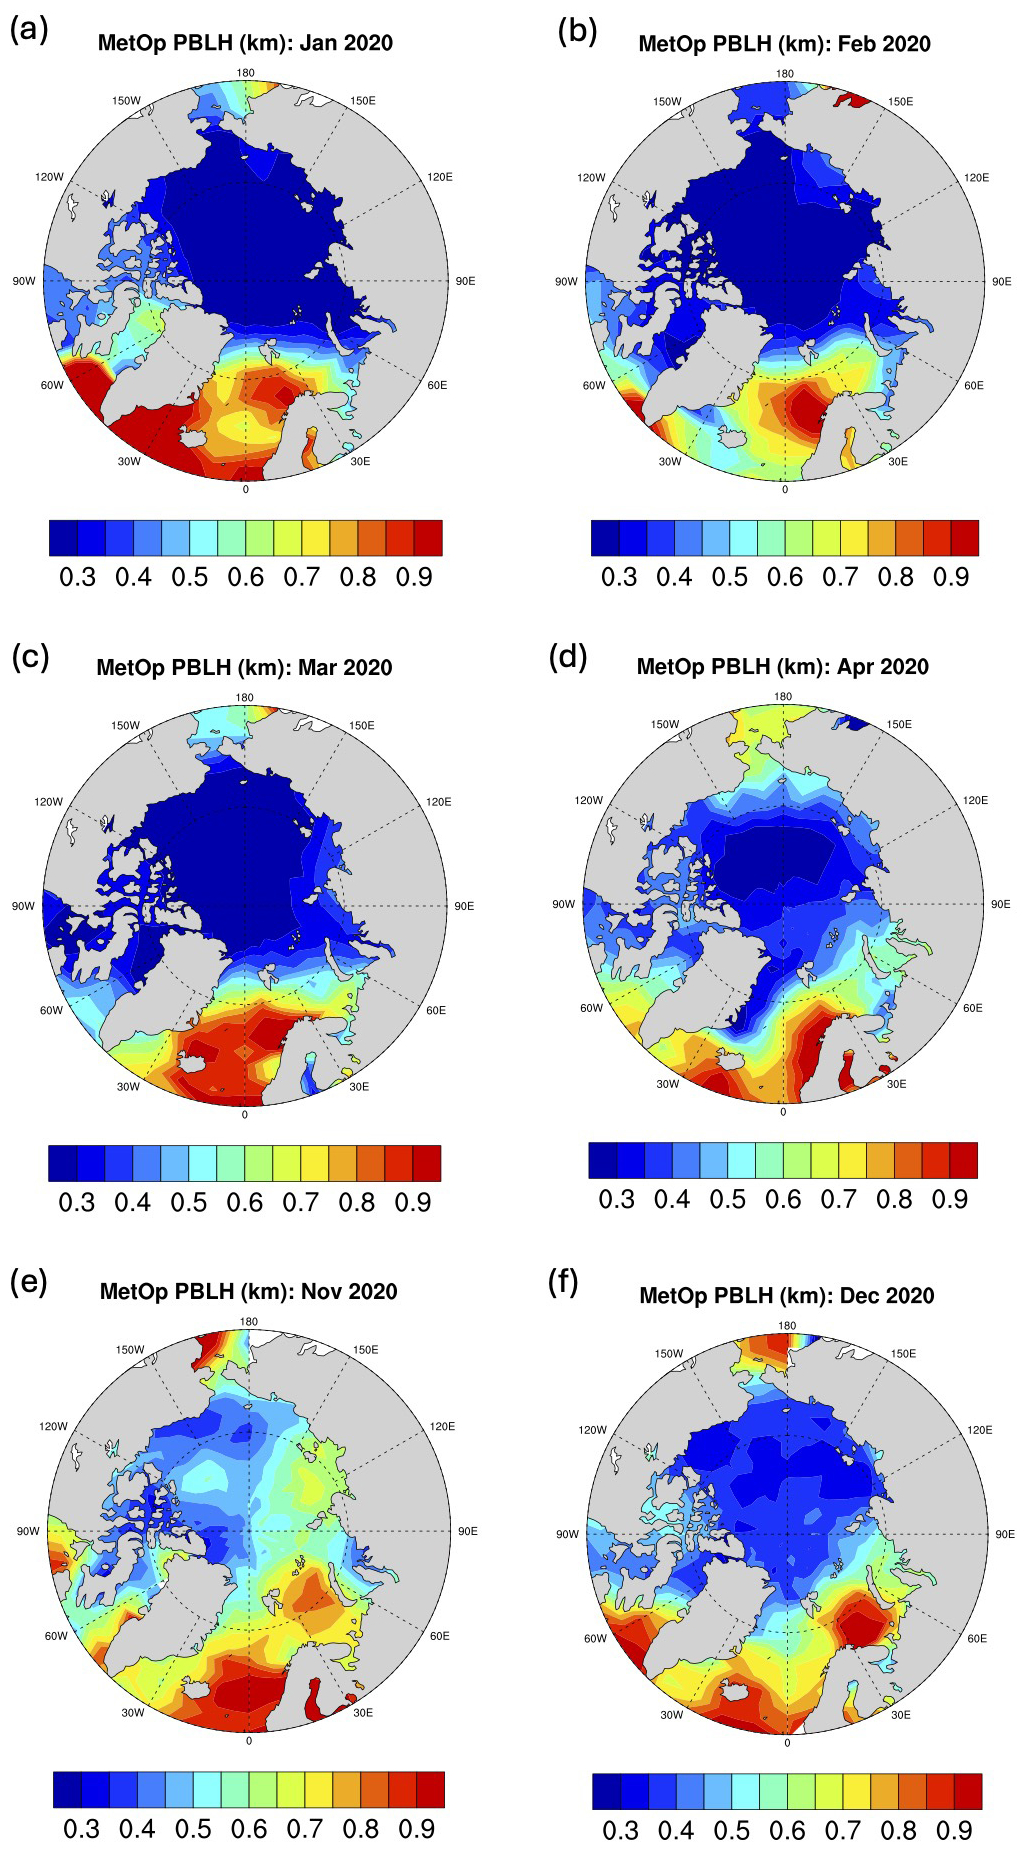
Figure 7MetOp monthly Arctic PBLH for cold-season months of the year 2020.
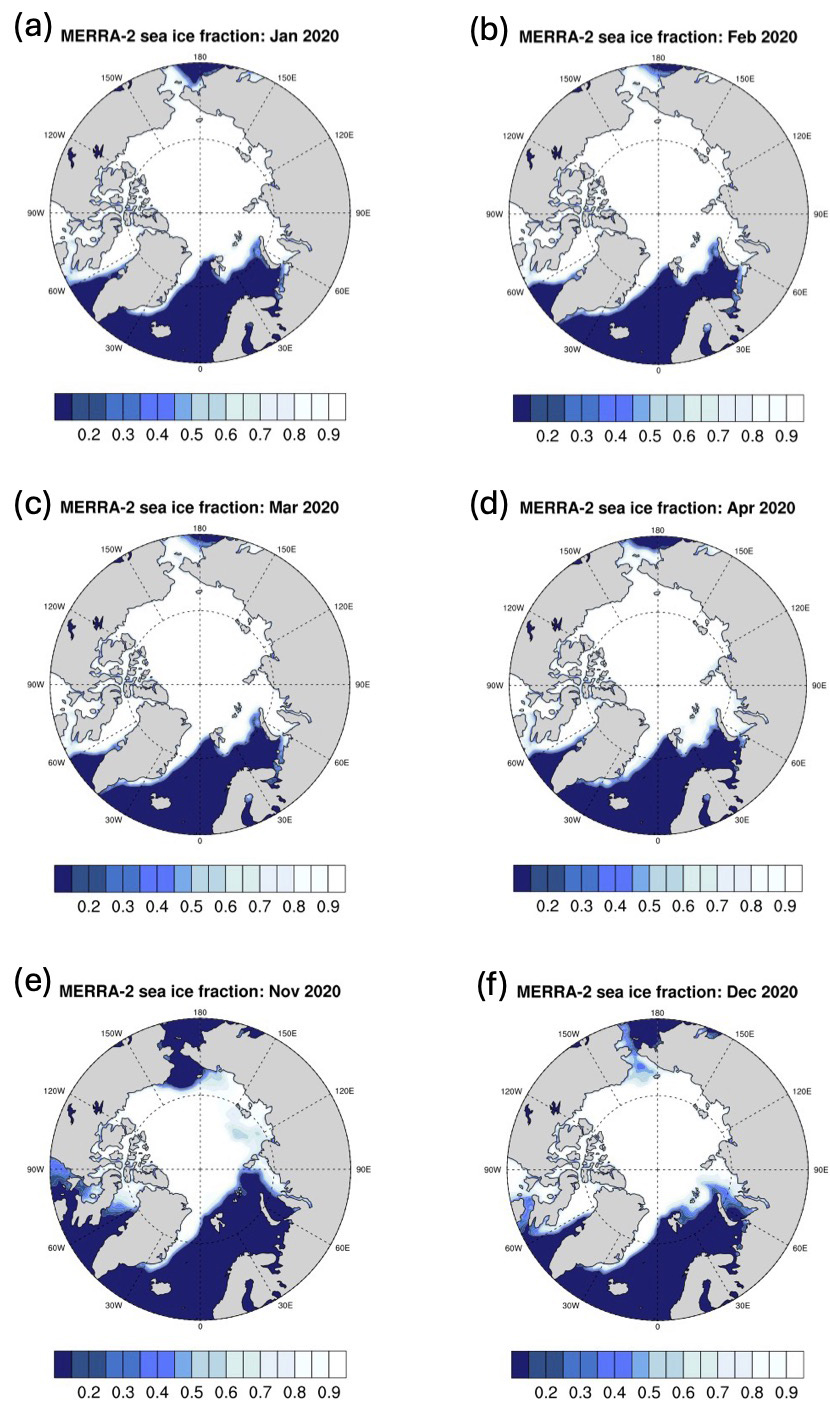
Figure 8MERRA-2 monthly Arctic sea-ice fraction for cold-season months of the year 2020.
As a first step, the cutoff altitude threshold of 500 m is chosen to select RO profiles, which has been used in previous studies (see Sect. 2.2). Ganeshan and Wu (2015) showed that the minimum refractivity gradient method works well to detect the height of PBL temperature inversions over the Arctic Ocean during winter months (November–April). Due to the lack of moisture in the atmosphere, the refractivity gradient minimum is found to be sensitive to the positive temperature gradient maxima (i.e., temperature inversions). Figures 5–7 compare the monthly RO-derived PBLH characteristics for each product during the cold-season months of the year 2020 (January–April and November–December). The adopted methodology (Ganeshan and Wu, 2015) described in Sect. 2.2 appears to work well for all three RO products, which clearly show the expected distribution of shallow PBLH over sea ice versus deeper PBLH over the Atlantic sector (MERRA-2 monthly sea-ice distributions shown in Fig. 8). The extreme high values of PBLH estimates in the Atlantic sector, seen primarily in GeoOptics and MetOp data, seem to be related to expected storm activity in this region. A seasonal evolution in the retrieved PBLH is evident in both GeoOptics and MetOp datasets, with the lowest values generally observed during January, February, and March (Figs. 5a–c and 7a–c) and the highest values in November (Figs. 5e and 7e), which agrees with MERRA-2-derived PBLH (Fig. 9). On the other hand, NASA Spire-derived PBLH appears to have a lesser spatial and seasonal variation as well as higher PBLH values over the frozen Arctic Ocean compared to the other two datasets and compared to MERRA-2, which could be because of the increased vertical smoothing applied to their bending angle product (Bowler, 2020) that may limit the effective vertical resolution of refractivity and the range of refractivity-derived PBLH values.
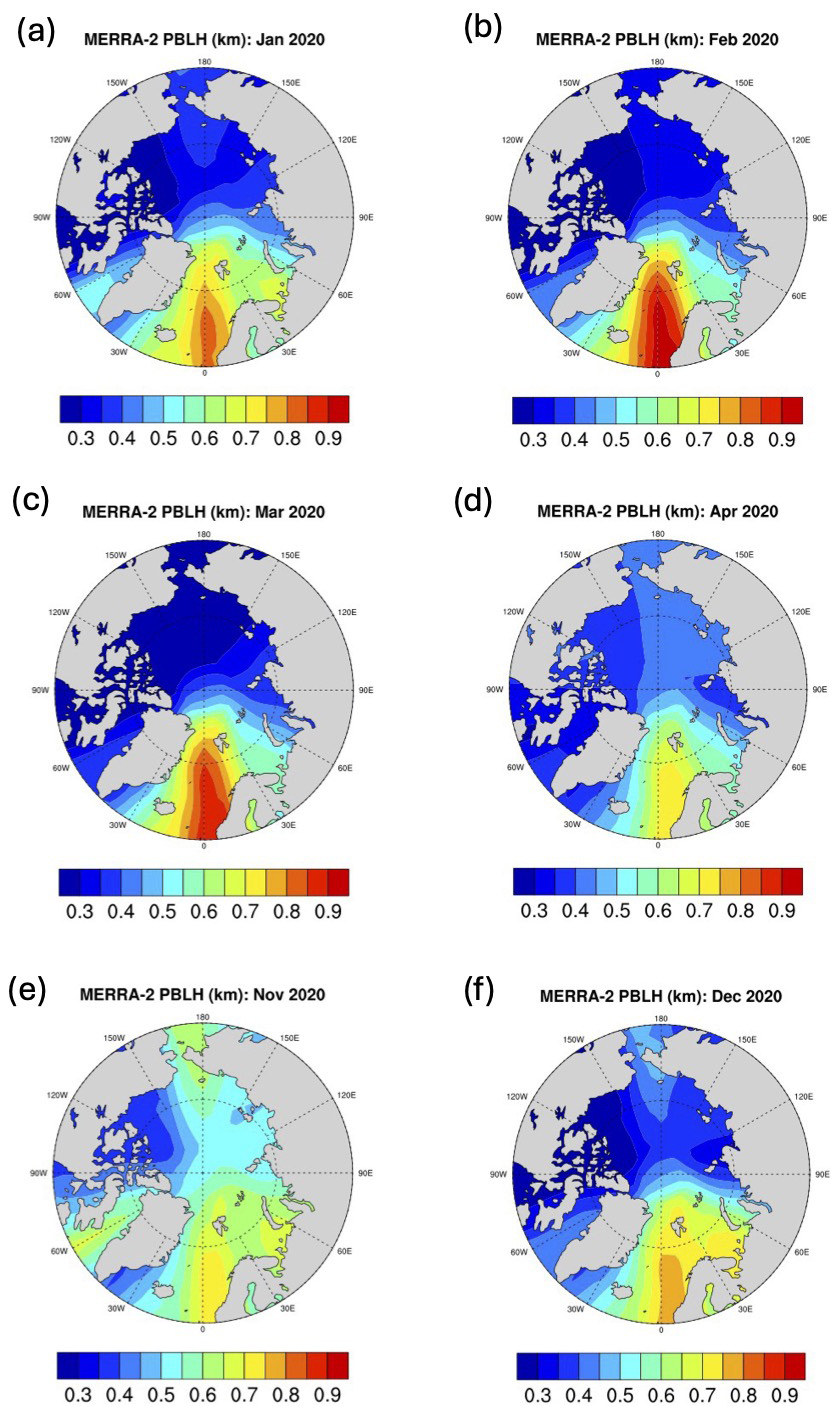
Figure 9MERRA-2 monthly PBLH showing the seasonal evolution and spatial variability in Arctic PBLH for cold-season months of the year 2020.
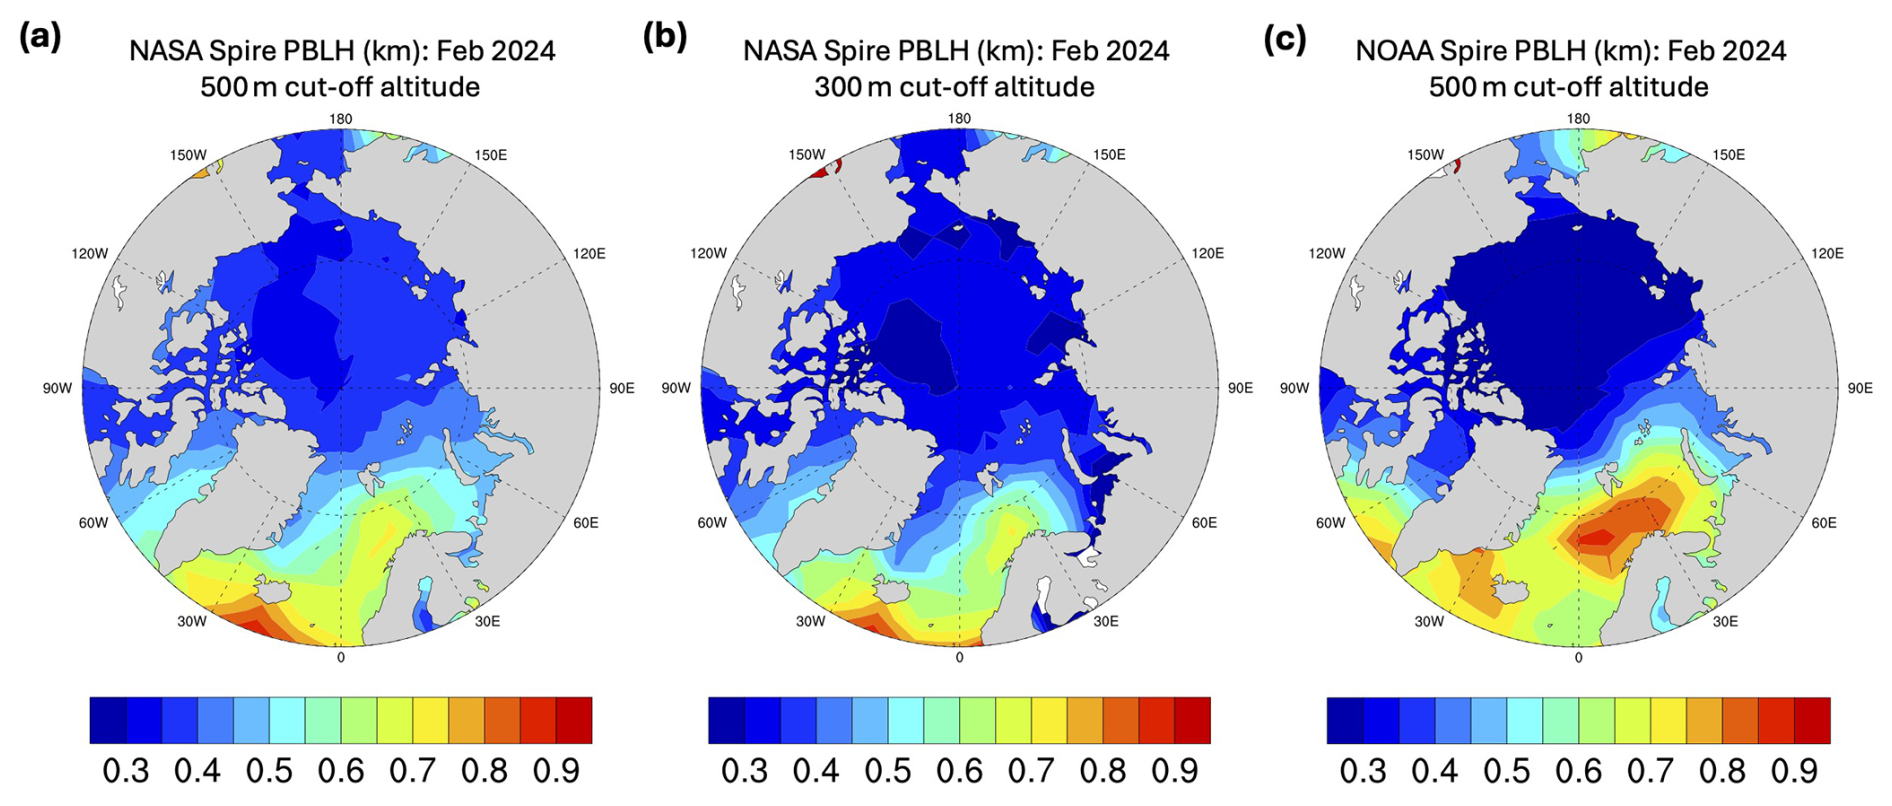
Figure 10RO-derived PBLH over the Arctic Ocean for February 2024 retrieved from (a) NASA Spire data using a 500 m cutoff altitude threshold and (b) NASA Spire data using a 300 m cutoff altitude threshold and (c) NOAA Spire data using a 500 m cutoff altitude threshold for minimum RO penetration depth.
3.4 Sensitivity to cutoff altitude threshold
As discussed in Ganeshan and Wu (2015), a sampling bias may occur in the retrieved PBLH due to a sharp drop in available RO profiles (as seen for the COSMIC-1 2013 version in Fig. 1a), thereby necessitating the selection of an optimal cutoff altitude threshold for minimum required RO penetration height. Although the penetration probability is much improved for commercial RO observations compared to the COSMIC-1 2013 product, with more than a 3-factor increase in the percentage of observations reaching 500 m altitude, it is still possible that some shallow PBLs are missed. In the case of NASA-purchased Spire data, the derived PBLH values over the frozen Arctic Ocean are slightly higher compared to the other two RO datasets and MERRA-2 reanalyses (Fig. 6). It is worth investigating whether the standard 500 m cutoff altitude is suboptimal for NASA-purchased Spire data. Additionally, it is also possible that NOAA Spire refractivity profiles, which are processed using UCAR software on vendor-provided L1b data, have better performance in capturing the shallow Arctic PBLH.
Figure 10a shows the PBLH retrievals from NASA Spire computed using the standard cutoff altitude threshold of 500 m and a lower cutoff altitude threshold of 300 m (Fig. 10b). Reducing the cutoff threshold to 300 m indeed improves retrieval of shallow PBLs over sea ice for NASA Spire data, highlighting the need for customized thresholds for different datasets (Fig. 10a, b). Despite an improvement in the PBLH magnitude, the coarse spatial gradients and lacking seasonal variability (seen in Fig. 6) continue to persist for NASA Spire data even after using a lower cutoff altitude threshold (not shown). On the other hand, the NOAA-processed Spire data achieve shallower PBLs and better overall representation even with the standard 500 m threshold (Fig. 10c), as evidenced by the improved spatial contrast between the frozen Arctic Ocean and open-seas region (e.g., the Chukchi Sea), which is missed by NASA Spire observations. Thus, an optimal cutoff altitude threshold for representing Arctic PBLH values in NASA Spire data appears to be 300 m; however, the spatiotemporal variability in the derived PBLH is not highly impacted by cutoff altitude choice. It appears that qualitative differences in Arctic PBLH representation are mostly decided by the processing setup. In summary, both commercial RO datasets viz. Spire and GeoOptics can satisfactorily observe the Arctic PBLH, albeit the excessive smoothing of NASA Spire data can limit its ability to capture shallow PBLs.
This study demonstrates that commercial GNSS RO data from Spire and GeoOptics are valuable for Arctic PBL studies, offering penetration capabilities comparable to established missions like MetOp and COSMIC-1. Key findings include the following:
-
Processing algorithms have a greater impact on RO penetration depth than hardware.
-
Both commercial RO datasets provide satisfactory Arctic PBLH estimates, with NASA GeoOptics data showing better spatial and seasonal variability compared to NASA Spire data.
-
NOAA-processed Spire data outperform NASA-purchased Spire data in shallow PBL representation.
The launch of commercial GNSS RO CubeSat receivers from Spire and GeoOptics presents an unparalleled opportunity for high-latitude PBL studies that are impacted by the loss of COSMIC-1 and the limited coverage by its successor COSMIC-2. To continue to support PBL studies in polar regions, new GNSS RO products must have sufficient lower-atmospheric penetration capability and the ability to sample shallow PBL temperature inversions that often persist in polar regions. This study attempts to provide a comparison of the penetration capability of the new commercial and other existing GNSS RO data products in the Arctic as the first step towards establishing a climate-ready, long-term continuous dataset that can be used for Arctic PBL investigations.
It is found that the choice of processing software for retrieving neutral atmosphere bending angle and refractivity profiles has a great bearing in determining the rate of RO penetration loss in the lower troposphere compared to factors such as instrument hardware, which is consistent with previous studies (Vannah et al., 2025). Both commercial products purchased by NASA are found to have comparable lower-atmospheric penetration over the Arctic Ocean to other RO climate data products, such as MetOp observations from ROM SAF and COSMIC-1 from UCAR. We identified that, on average, 80 % of GeoOptics RO and Spire RO measurements could probe the Arctic troposphere as low as 500 m. All RO datasets, with the exception of NASA-purchased Spire data, show a drop in the penetration probability during summer months, signifying sensitivity to atmospheric water vapor, which has been speculated in the past (Ao et al., 2012; Ganeshan and Wu, 2015; Chang et al., 2022).
The PBLH derived from the commercial RO products is agreeable with other RO datasets and reanalysis data. Despite its relatively low sampling volume as compared to Spire, the spatial pattern and seasonal evolution of the Arctic Ocean PBLH are better represented by GeoOptics data. The Spire PBLH representation is seemingly improved when using NOAA-processed L2 data, suggesting sensitivity to the choice of software used for processing L1b signals. While there is some sensitivity to cutoff altitude threshold, it is predominantly the methodology used to obtain neutral atmosphere products from excess-phase data that is ultimately crucial for Arctic PBLH representation. With that caveat, both Spire and GeoOptics show promising results for polar PBL studies, underscoring the importance of advancing commercial GNSS RO technology for polar climate research. Future work should focus on harmonizing processing methodologies to ensure consistent climate records.
The code used in this study was developed specifically for the analysis presented and is not extensively documented. While it was implemented to support the findings of this study, it may contain errors and is not intended for general use or broader applications. Researchers interested in accessing the code should do so with the understanding that it is provided as is, without guarantees of functionality or accuracy beyond the scope of this study. Those interested in obtaining the code may contact the authors for further details.
NASA-purchased Spire and GeoOptics datasets used in this study are governed by vendor-specific End User License Agreement data with the US Government and are not publicly available. Other datasets used in this study are publicly available and can be accessed through the UCAR/NCAR COSMIC program and the EUMETSAT SAF on Radio Occultation Meteorology (ROM SAF). The following datasets were utilized:
-
COSMIC-1 radio occultation data (2021.0390; https://doi.org/10.5065/ZD80-KD74, UCAR COSMIC Program, 2022),
-
GeoOptics radio occultation data (0001.0001; https://doi.org/10.5065/0dxg-nn57, UCAR COSMIC Program, 2025a),
-
Spire radio occultation data (0001.0001; https://doi.org/10.5065/1a8d-yh72, UCAR COSMIC Program, 2025b),
-
ROM SAF Radio Occultation Interim Climate Data Record – Metop (https://doi.org/10.15770/EUM_SAF_GRM_0006, ROM SAF, 2019).
These datasets can be accessed following the respective data repository guidelines.
MG was responsible for the concept, development of methodology, investigation, formal analysis, visualization, writing (original draft and reviewing and editing), and funding acquisition. DLW, JAS, JG, PV, and KJN contributed to the concept, development of methodology, investigation, formal analysis, and writing (reviewing and editing). CA contributed to the concept, development of methodology, investigation, formal analysis, writing (reviewing and editing), and funding acquisition.
The contact author has declared that none of the authors has any competing interests.
Publisher's note: Copernicus Publications remains neutral with regard to jurisdictional claims made in the text, published maps, institutional affiliations, or any other geographical representation in this paper. While Copernicus Publications makes every effort to include appropriate place names, the final responsibility lies with the authors.
This article is part of the special issue “Observing atmosphere and climate with occultation techniques – results from the OPAC-IROWG 2022 workshop”. It is a result of the International Workshop on Occultations for Probing Atmosphere and Climate, Leibnitz, Austria, 8–14 September 2022.
This research was supported by NASA's Commercial Satellite Data Acquisition program. The research described in this paper was partially carried out at the Jet Propulsion Laboratory, California Institute of technology, under a contract with NASA.
This research has been supported by the National Aeronautics and Space Administration (grant nos. 80NSSC23K0385 and 80NM0018D0004).
This paper was edited by Andrea K. Steiner and reviewed by three anonymous referees.
Ao, C. O., Waliser, D. E., Chan, S. K., Li, J.-L., Tian, B., Xie, F., and Mannucci, A. J.: Planetary boundary layer heights from GPS radio occultation refractivity and humidity profiles, J. Geophys. Res., 117, D16117, https://doi.org/10.1029/2012JD017598, 2012.
Basha, G. and Ratnam, M.V.: Identification of atmospheric boundary layer height over a tropical station using high-resolution radiosonde refractivity profiles: Comparison with GPS radio occultation measurements, J. Geophys. Res., 114, D16101, https://doi.org/10.1029/2008jd011692, 2009.
Bowler, N. E.: An assessment of GNSS radio occultation data produced by Spire, Q. J. Roy. Meteor. Soc., 146, 3772–3788, 2020.
Chang, H., Lee, J., Yoon, H., Morton, Y. J., and Saltman, A.: Performance assessment of radio occultation data from GeoOptics by comparing with COSMIC data, Earth Planets Space, 74, 108, https://doi.org/10.1186/s40623-022-01667-6, 2022.
CSDA: CSDA SmallSat Data Explorer, Commercial Satellite Data Acquisition (CSDA), https://csdap.earthdata.nasa.gov/, last access: 27 January 2025.
Ding, F., Iredell, L., Theobald, M., Wei, J., and Meyer, D.: PBL Height From AIRS, GPS RO, and MERRA-2 Products in NASA GES DISC and Their 10-Year Seasonal Mean Intercomparison, Earth and Space Science, 8, e2021EA001859, https://doi.org/10.1029/2021EA001859, 2021.
Ganeshan, M. and Wu, D. L.: An investigation of the Arctic inversion using COSMIC RO observations, J. Geophys. Res.-Atmos., 120, 9338–9351, 2015.
Ganeshan, M. and Yang, Y.: Evaluation of the Antarctic boundary layer thermodynamic structure in MERRA2 using dropsonde observations from the Concordiasi campaign, Earth and Space Science, 6, 2397–2409, 2019.
Gelaro, R., McCarty, W., Suárez, M. J., Todling, R., Molod, A., Takacs, L., and Zhao, B.: The modern-era retrospective analysis for research and applications, version 2 (MERRA-2), J. Climate, 30, 5419–5454, 2017.
Guo, P., Kuo, Y.-H., Sokolovskiy, S. V., and Lenschow, D. H.: Estimating atmospheric boundary layer depth using COSMIC radio occultationdata, J. Atmos. Sci., 68, 1703–1713, https://doi.org/10.1175/2011JAS3612.1, 2011.
Innerkofler, J., Kirchengast, G., Schwärz, M., Marquardt, C., and Andres, Y.: GNSS radio occultation excess-phase processing for climate applications including uncertainty estimation, Atmos. Meas. Tech., 16, 5217–5247, https://doi.org/10.5194/amt-16-5217-2023, 2023.
Jensen, A. S., Lohmann, M. S., Nielsen, A. S., and Benzon, H.-H.: Geometrical optics phase matching of radio occultation signals, Radio Sci,, 39, RS3009, https://doi.org/10.1029/2003rs002899, 2004.
Kalmus, P., Ao, C. O., Wang, K.-N., Manzi, M. P., and Teixeira, J.: A high-resolution planetary boundary layer height seasonal climatology from GNSS radio occultations, Remote Sens. Environ., 276, 113037, https://doi.org/10.1016/j.rse.2022.113037, 2022.
Lock, A. P., Brown, A. R., Bush, M. R., Martin, G. M., and Smith, R. N. B.: A new boundary layer mixing scheme. Part I: Scheme description and single-column model tests, Mon. Weather Rev., 138, 3187–3199, https://doi.org/10.1175/1520-0493(2000)128<3187:ANBLMS>2.0.CO;2, 2000.
Louis, J., Tiedke, M., and Geleyn, M.: A short history of the PBL parameterization at ECMWF, paper presented at ECMWF Workshop on Planetary Boundary Layer Parameterization, Reading, UK, 25–27 November 1981, Eur. Cent. for Medium–Range Weather Forecasts, 1982.
McGrath-Spangler, E. L., Molod, A., Ott, L. E., and Pawson, S.: Impact of planetary boundary layer turbulence on model climate and tracer transport, Atmos. Chem. Phys., 15, 7269–7286, https://doi.org/10.5194/acp-15-7269-2015, 2015.
National Academies of Sciences, Engineering, and Medicine (NASEM): Thriving on our changing planet: A decadal strategy for earth observation from Space, The National Academies Press, https://doi.org/10.17226/24938, 2018.
Nelson, K. J., Xie, F., Ao, C. O., and Oyola-Merced, M. I.: Diurnal Variation of the Planetary Boundary Layer Height Observed from GNSS Radio Occultation and Radiosonde Soundings over the Southern Great Plains, J. Atmos. Ocean. Tech., 38, 2081–2093, https://doi.org/10.1175/jtech-d-20-0196.1, 2021.
Qiu, C., Wang, X., Li, H., Zhou, K., Zhang, J., Li, Z., Liu, D., and Yuan, H.: A Comparison of Atmospheric Boundary Layer Height Determination Methods Using GNSS Radio Occultation Data, Atmosphere, 14, 1654, https://doi.org/10.3390/atmos14111654, 2023.
ROM SAF: ROM SAF Radio Occultation Interim Climate Data Record – Metop, EUMETSAT SAF on Radio Occultation Meteorology [data set], https://doi.org/10.15770/EUM_SAF_GRM_0006, 2019.
Seidel, D. J., Ao, C. O., and Li, K.: Estimating climatological planetary boundary layer heights from radiosonde observations: Comparison of methods and uncertainty analysis, J. Geophys. Res., 115, D16113, https://doi.org/10.1029/2009jd013680, 2010.
Seidel, D. J., Zhang, Y., Beljaars, A., Golaz, J.-C., Jacobson, A. R., and Medeiros, B.: Climatology of the planetary boundary layer over the continental United States and Europe, J. Geophys. Res.-Atmos., 117, https://doi.org/10.1029/2012jd018143, 2012.
Teixeira, J. P., Piepmeier, J., Nehrir, A. R., Ao, C. O., Chen, S. S., Clayson, C. A., Fridlind, A. M., Lebsock, M. D., McCarty, W., Salmun, H., and Santanello, J. A.: Toward a global planetary boundary layer observing system: The NASA PBL Incubation Study Team Report, National Aeronautics and Space Agency, https://ntrs.nasa.gov/search?q=Toward%20a%20Global%20Planetary%20Boundary%20Layer%20Observing%20System:%20The%20NASA%20PBL%20Incubation%20Study%20Team%20Report&page=%7B%22from%22:0,%22size%22:25%7D (last access: 20 March 2025), 2021.
UCAR: FORMOSAT-3/COSMIC-1 2021 Reprocessing Data Release, Nov 29 2022, FORMOSAT-3/COSMIC-1 2021 Reprocessing Data, UCAR, https://data.cosmic.ucar.edu/gnss-ro/cosmic1/repro2021/UCAR_COSMIC1_2021_Repro_Notes.pdf (last access: 29 April 2024), 2022.
UCAR COSMIC Program: COSMIC-1 Radio Occultation Data (2021.0390), UCAR/NCAR – COSMIC [data set], https://doi.org/10.5065/ZD80-KD74, 2022.
UCAR COSMIC Program: GeoOptics Radio Occultation Data (0001.0001), UCAR/NCAR – COSMIC [data set], https://doi.org/10.5065/0dxg-nn57, 2025a.
UCAR COSMIC Program: Spire Radio Occultation Data (0001.0001), UCAR/NCAR – COSMIC [data set], https://doi.org/10.5065/1a8d-yh72, 2025b.
Vannah, S., Leroy, S. S., Ao, C. O., Kursinski, E. R., Nelson, K. J., Wang, K.-N., and Xie, F.: The Impact of Differences in Retrieval Algorithms between Processing Centers on GNSS Radio Occultation Refractivity Retrievals in the Planetary Boundary Layer, EGUsphere [preprint], https://doi.org/10.5194/egusphere-2024-4127, 2025.
Winning, T. E., Chen, Y.-L., and Xie, F.: Estimation of the marine boundary layer height over the central North Pacific using GPS radio occultation, Atmos. Res., 183, 362–370, https://doi.org/10.1016/j.atmosres.2016.08.005, 2017.
Wu, D. L., Gong, J., and Ganeshan, M.: GNSS-RO Deep Refraction Signals from Moist Marine Atmospheric Boundary Layer (MABL), Atmosphere, 13, 953, https://doi.org/10.3390/atmos13060953, 2022.