the Creative Commons Attribution 4.0 License.
the Creative Commons Attribution 4.0 License.
 | 01 Apr 2025
Accuracy and sensitivity of NH3 measurements using the Dräger Tube method
Matthias Claß
Nicolas Brüggemann
Regional estimates of ammonia (NH3) emissions are often missing data from heterogeneous or small fields. Areas with no experienced staff or in-field power supply also prevent the use of accurate and fully established micrometeorological measurement techniques. The Dräger Tube method (DTM) is a calibrated open and dynamic chamber method, which requires little training to use and is relatively inexpensive. It uses NH3 detector tubes (Dräger Tubes), an automatic pump, and a chamber system comprised of four stainless-steel chambers connected with PTFE tubing. Even though the DTM is often used in countries such as Germany and China, the detection accuracy, precision and sensitivity have not been tested yet. In order to quantify those for the DTM, we simultaneously measured defined NH3 mixing ratios with the Dräger Tubes, with quantum cascade laser spectroscopy (QCLS) (MGA7, MIRO Analytical AG, Switzerland) and with cavity ring-down spectroscopy (G2103, Picarro, Inc., USA). Second, we tested the effects of exchanging the tubing material and heating the tubing under laboratory conditions, as well as PTFE film attachments or wiping of the DTM chamber system with ethanol during outdoor measurements, on performance improvements. Results showed that the Dräger Tubes had a detection limit between 150 and 200 ppb, which is 3 to 4 times higher than originally assumed. Dräger Tube concentration measurements also underestimated NH3 concentrations by 43 % to 100 % for mixing ratios between 50 and 300 ppb and by 28 % to 46 % for mixing ratios between 500 and 1500 ppb. The PTFE tubing material showed similar performance to the polyester–polyurethane tubing material regarding response time, which was further improved by heating the tubing to 50 °C. The modifications to the chamber surface and cleaning in the outdoor experiment did not lead to any improvements to the NH3 concentration measurements. The results suggest that the DTM should only be used where alternatives are unfeasible and high NH3 emissions are to be expected. Further assessment of calibrated DTM using reference methods is required for a comprehensive evaluation, and alternative developments for a more appropriate method replacing the DTM in small-plot applications is encouraged.
- Article
(1387 KB) - Full-text XML
- BibTeX
- EndNote


Ammonia (NH3) is one of the main air pollutants in Europe (European Environment Agency, 2023). Volatilization of NH3 from agriculture is by far the largest source of anthropogenic NH3 emissions and is responsible for 94 % of emissions in the European Union (European Environment Agency, 2023). NH3 is highly reactive and combines with other molecules in the atmosphere such as sulfuric acid, nitric acid or hydrochloric acid to form particulate matter less than 2.5 µm in size, which has been shown to cause premature death, respiratory infections and diseases, lung cancer, and cerebrovascular disease (Lelieveld et al., 2015; Lim et al., 2012; Wang et al., 2017). Most volatilized NH3 is transported by wind and deposited on the Earth's surface, either dissolved in water through wet deposition or attached to other particulate matter through dry deposition (Cameron et al., 2013). Deposition in aquatic and terrestrial ecosystems can lead to eutrophication and acidification, which has been shown to result in biodiversity loss (Behera et al., 2013). In addition, the volatilization of NH3 causes indirect greenhouse gas emissions once it is partially converted to nitrous oxide through bacterial nitrification after redeposition into the soil. The reduction potential of NH3 in the EU is 20 %–35 % compared to the year 2000 emission levels, and the environmental, health and economic benefits (including the reduced need for fertilizers) far exceed the necessary reduction costs (Zhang et al., 2020). Therefore, the National Emissions Ceilings (NEC) Directive 2016/2284 requires the EU member states to reduce their total NH3 emissions by 19 % by 2030 compared to the year 2005 levels (EU Directive, 2016). To reduce the impact of agriculture on NH3 volatilization, it is crucial to accurately quantify emissions from various types of fertilizers and evaluate effective mitigation options. NH3 emissions can be measured on a global scale using satellite observations, such as those from the Cross-track Infrared Sounder (CrIS) or the Infrared Atmospheric Sounding Interferometer (IASI); these satellite-derived estimates still rely on field data for validation to ensure their accuracy and applicability to different environments. The lack of field measurement data where micrometeorological methods could be impractical due to smaller and heterogeneous plot sizes is mentioned as a major uncertainty (Behera et al., 2013; Dammers et al., 2019; Luo et al., 2022).
There are various approaches to quantifying NH3 emissions in the field. The most common are micrometeorological and chamber methods (Di Perta et al., 2020). Micrometeorological methods are considered to be the most accurate. However, they are unsuitable for comparisons between several plots close to each other or for smaller, heterogeneous fields and those without power supply (Pacholski et al., 2006; Roelcke et al., 2002). Chamber methods operate on the principle that NH3 volatilizes into a hood placed over the emitting soil for a defined period.
Chambers can be broadly divided into static chambers, where there is no forced air circulation, and dynamic chambers, where there is forced air circulation using, for example, a pump or fan. In addition, both static as well as dynamic chambers can be unvented (closed) or vented (open), depending on whether or not they have some kind of pressure vent that allows for passive air exchange with the atmosphere. Closed chambers prevent any air flow in or out, whereas open chambers allow for free air flow and better mimic field conditions (Di Perta et al., 2020). Chamber methods, however, are known to influence environmental parameters such as radiation, evaporation, temperature and wind speed, all of which impact the transport of NH3 from the soil surface (Behera et al., 2013). As a result, these methods are typically used for qualitative rather than quantitative NH3 measurements. Open chamber designs using absorbing sponges treated with acidic solutions, such as the design described by Wang et al. (2004), can continuously measure NH3 emissions in the field. However, there remains a lack of validation or calibration for the absorbing sponge designs in quantifying NH3 emissions under field conditions. Furthermore, the use of such sponges in chamber designs necessitates access to laboratory personnel capable of analyzing the NH3 content in the collected samples.
The Dräger Tube method (DTM) was developed as a simple and cost-effective alternative for quantifying NH3 volatilization from soils, also covered by arable vegetation. It does not require a local power source or special laboratory equipment. This method allows for measurements on smaller or heterogeneous fields (Pacholski et al., 2006; Roelcke et al., 2002). Daily NH3 flux is quantified by linearly interpolating between measurements at discrete points in time. The current DTM system consists of four conical stainless-steel chambers connected by several short PTFE tubes. Ambient air is drawn from the chambers and passed through an NH3 detector tube (Dräger Tube) from Drägerwerk AG & Co. KGaA (Lübeck, Germany) with the aid of a manual or automatic pump. The Dräger Tubes contain bromophenol blue, a pH indicator that turns blue as a result of the reaction with NH3. The intensity of the blue coloration is proportional to the amount of reacting gas. Earlier comparisons of NH3 fluxes measured in the laboratory and 15N field studies showed good correlations, but the DTM underestimated the flux by an order of magnitude, which was attributed to the low air exchange rate (Rees et al., 1996; Roelcke et al., 2002). The DTM was later calibrated by Pacholski et al. (2006) with simultaneous measurements using the integrated horizontal flux method (IHF). This calibration approach was later on validated by other comparative trials involving micrometeorological measurements (Gericke et al., 2011; Quakernack et al., 2012; Ni et al., 2015). Although a calibration was applied to the DTM, there remains considerable uncertainty surrounding its accuracy. The recent literature highlights an underestimation of NH3 fluxes even after calibration, suggesting potential biases in the calibration process itself (Kamp et al., 2024). This indicates that the current calibration approach may not fully account for all factors influencing NH3 emissions. An inherent underestimation of NH3 fluxes by the DTM could mean that the DTM also has a high detection limit, which could lead to unmeasurable NH3 mixing ratios in low-emitting plots. If this is the case, it makes sense to look for ways to improve the sensitivity of the DTM.
The DTM is susceptible to the same measurement errors that occur with other chamber systems for measuring NH3. Wall effects caused by the adhesion of NH3 to the chamber and tubing surface can lead to an underestimation or hysteresis of the mixing ratio measurements of up to 50 % (Sintermann et al., 2012). This is due to the fact that NH3 is a highly reactive gas that can combine very quickly with other molecules. As a result, NH3 is very soluble in water and adheres to even the smallest water film on any surface, which delays the path from the chamber system into the measuring device. This delay is greater at temperatures of 5 °C or less, and less at higher temperatures such as 25 °C, as the volatility of NH3 increases at higher temperatures (Fogg, 1991). In the past, the DTM had been used to perform NH3 concentration measurements with different materials and methods. Roelcke et al. (2002) and Richter (1972) originally used four tin chambers with a total surface area of 400 cm2 and inserted a polyethylene funnel into the chambers. Roelcke et al. (2002) used 35 cm PTFE tubing to connect the chambers and flushed 2–3 L of air from the bottom surface through the chambers and into a used Dräger Tube each time before starting the measurements. This was intended for NH3 to achieve a state of equilibrium in the chambers. This approach was further modified by Pacholski et al. (2006) by using stainless steel as the chamber material with a total surface area of 415 cm2 for the chambers. The rinsing volume to reach a state of equilibrium was set to 2 L in the latest version of his method (Pacholski, 2016). The measuring time ranges from 1–5 min. Wall effects of the chamber system, the short measurement duration and the low flow rate could all contribute to reduced measurement accuracy.
There have also been a number of studies aimed at improving or testing the detection sensitivity of different chamber measurement systems, but none of them directly tested the influence of different materials used for dynamic chambers on NH3 mixing ratios (Di Perta et al., 2020). Yang et al. (2019) compared NH3 measurements from four chamber methods with predicted values and found that the portable ammonia detector method had the highest detection sensitivity and the lowest detection limit of the four. Regarding the material used for the tubing that transports NH3 inside the instrument, Shah et al. (2006) tested the adsorption rate of NH3 in five different tubing materials after 2 h at 1 and 10 parts per million (ppm) and at a flow rate of 10 L min−1. They found no significant difference between the selected materials. The flow rate was much higher than that used in the DTM, and the adsorption dynamics at lower and higher time intervals were not studied. A significant part of the contribution to lower capture efficiencies could also come from the use of a stainless-steel surface of the chambers. In a tubing material experiment, Yokelson et al. (2003) observed a longer response time of NH3 within their experiment when they replaced part of the PTFE tubing with a stainless-steel tubing at room temperature. This delay increased further at a temperature of 5 °C.
In addition to the chamber system, the Dräger Tubes themselves have an intrinsic standard deviation of 10 %–15 % for repeated measurements of the same NH3 source (Drägerwerk AG, 2011). There are no publicly available results of tests on the sensitivity and detection accuracy of the Dräger Tubes. In addition, the original main purpose of the Dräger Tubes was the direct measurement of hazardous gas mixing ratio variations in the workplace or in enclosed spaces prior to entry, as well as the detection of gas leaks in process pipelines (Drägerwerk AG, 2011). For these applications, high accuracy and sensitivity are not required.
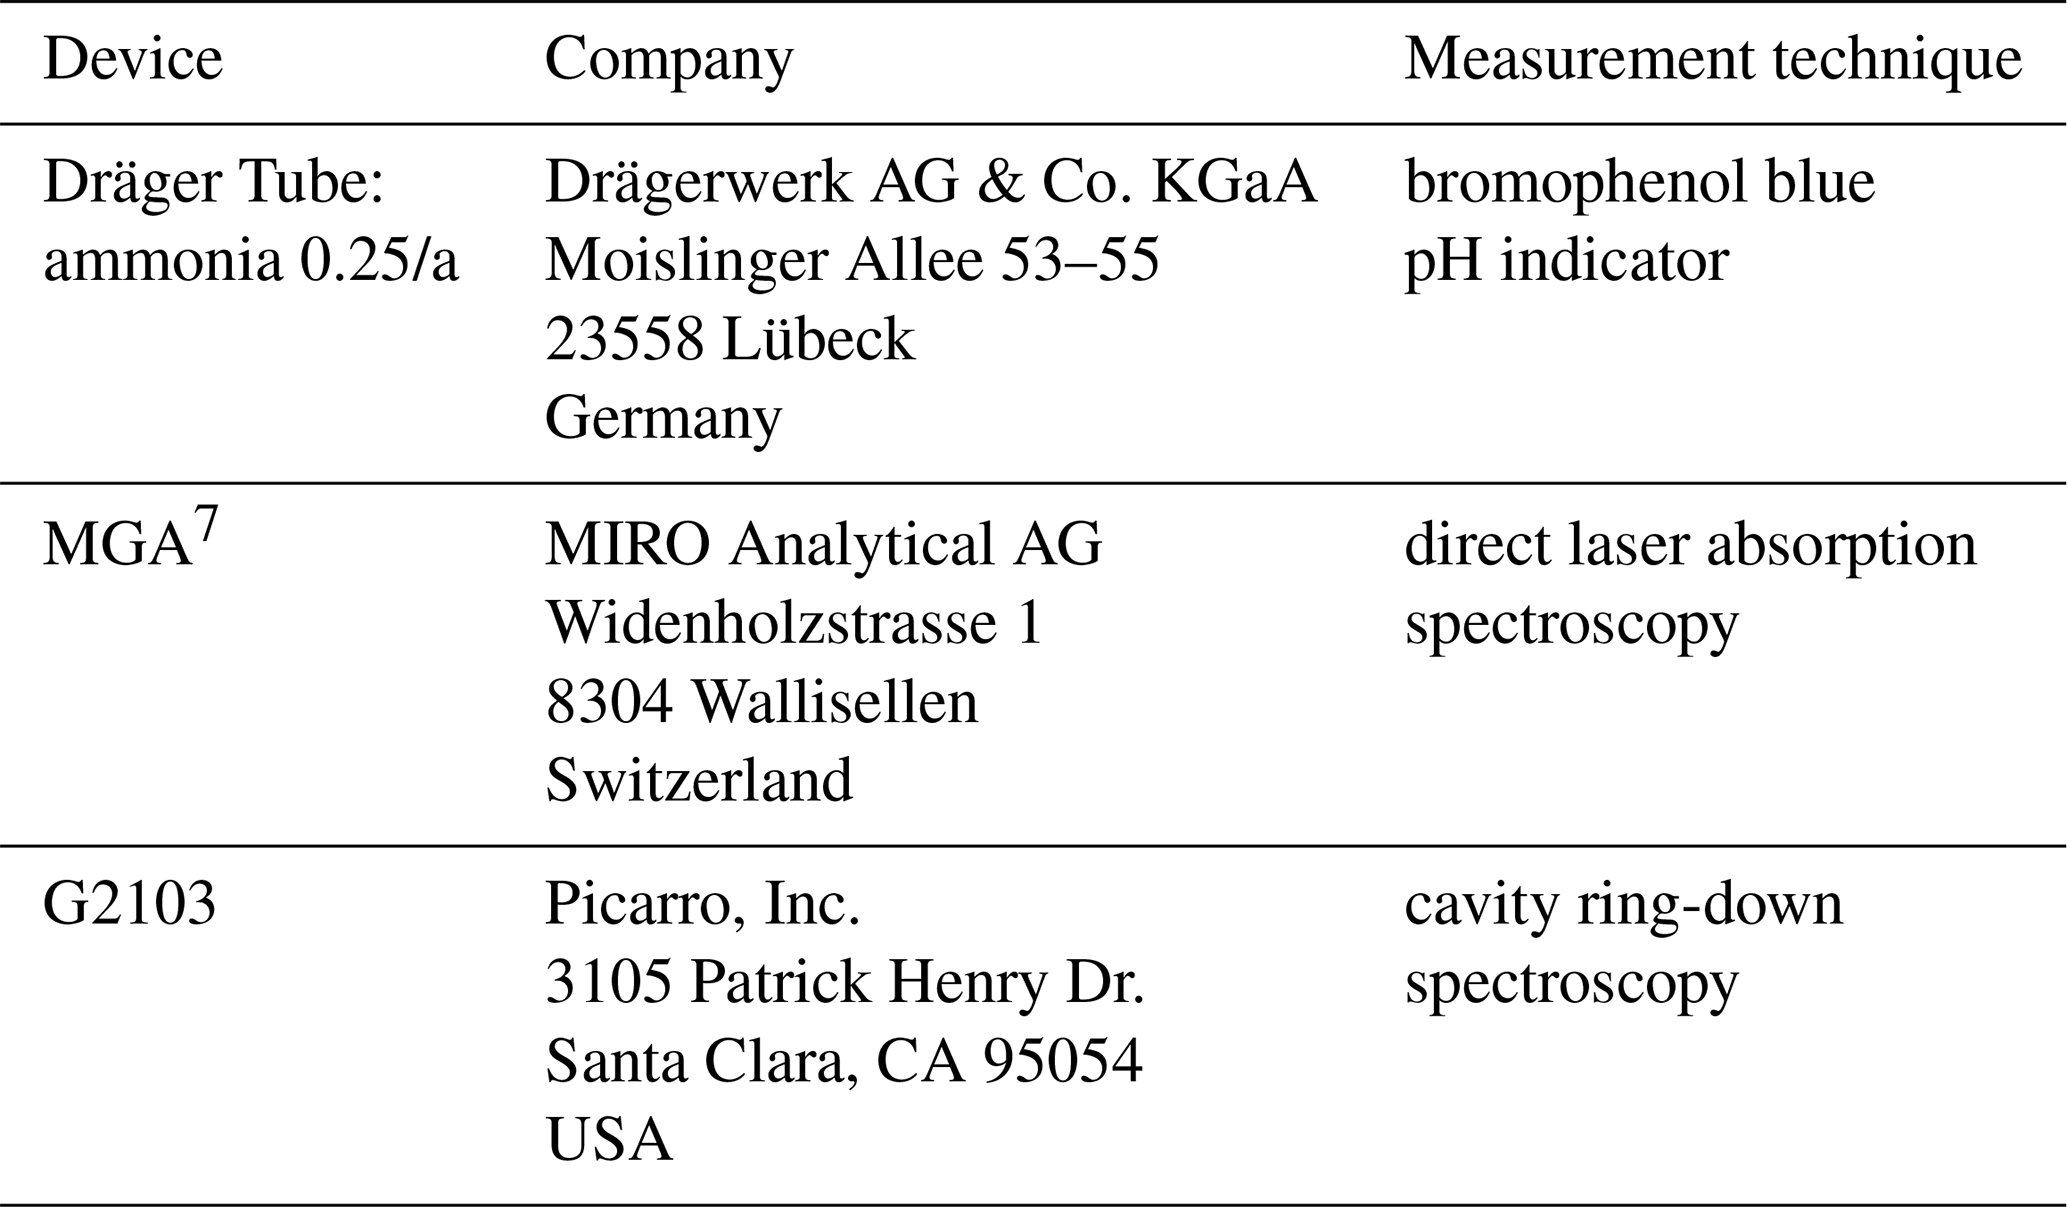
The main objective of this study was to test the detection accuracy, precision and sensitivity of the Dräger Tubes when used for the uncalibrated DTM. NH3 was measured in various mixing ratios from 50 to 1500 parts per billion (ppb) with Dräger Tubes and a multicomponent gas analyzer based on quantum cascade laser spectroscopy (QCLS) (MGA7, MIRO Analytical AG, Wallisellen, Switzerland). We chose a cavity ring-down spectrometer (CRDS) (G2103, Picarro, Inc., USA) as the reference device to compare the Dräger Tube and QCLS measurements. The manufacturer of the CRDS used in this study does factory calibrations by using a so-called golden instrument as a reference standard, from which a specific calibration factor for each produced instrument is derived. Regular checks ensure the stability of the golden instrument's NH3 calibration. The reliability of this calibration factor was independently confirmed by ab initio calculations using the HITRAN2012 database (Rothman et al., 2013) and by the National Physical Laboratory of the United Kingdom (Martin et al., 2016). The stability of the CRDS analyzers was tested in a large intercomparison experiment with 47 CRDS analyzers, and a typical drift of about 0.1 % slope per year was found (Yver Kwok et al., 2015). This high stability in measurements because of the low annual drift ensures that regular direct calibrations (in which the calibration's slope has to be changed) are not necessary (Rella, 2017), and it also makes the used CRDS from Picarro a suitable reference device to compare the other devices.
The influence of tubing material and temperature on response time was tested under laboratory conditions with the QCLS. Due to the dependence of temperature on the adsorption of NH3, it was expected that the heated tubes would perform better, i.e., feature a lower response time to changes in NH3 mixing ratio. Finally, the material used for the chamber system was tested for effects on the measured NH3 mixing ratios under field conditions. Uncalibrated DTM measurements with modifications to the chamber system were compared with measurements with the QCLS. The QCLS was able to display the NH3 mixing ratios entering the system in real time. This minimized the risk of underestimating the NH3 mixing ratios due to adsorption associated with short measurement times. The hypothesis was that the uncalibrated DTM would underestimate mixing ratios compared to the QCLS. The modifications tested on the Dräger system included changing the tubing material to polyester–polyurethane (PUR) or Synflex 1300, wiping the inner surface of the chambers with ethanol after each use, and applying a thin PTFE film to the inner surface of the chambers.
The study was divided into three experiments. The first experiment focused on quantifying the Dräger Tube detection accuracy, precision and sensitivity for NH3. The second experiment investigated the influence of tubing material and temperature on the response time. The third experiment evaluated the modifications to the chamber system during outdoor measurements.
2.1 Laboratory experimental setup
A sketch of the experimental setup can be found in Fig. 1. Compressed air free of NH3 was humidified with a water bubbler to achieve ambient water vapor concentration. This air was mixed with NH3 standard gas. The desired NH3 and water vapor for the sample gas was achieved by regulating the flow of both gas tanks with two needle valves. The sample gas was led through a pump into a mass flow meter to set the flow rate. For the tubing material and the heating experiment, the tubing inserted between the regulated pump and the QCLS was replaceable. The fixed tubing was PTFE with an outer diameter of 6.35 mm. To eliminate the adsorption effects of the fixed tubing, sample gas was constantly flushed through the system. An excess port was installed after the replaceable tubing part to prevent overpressure in the gas analyzers. The tubing connected to the Dräger Tube acted as an additional excess port whenever the Dräger Tubes were not used. The pump behind the Dräger Tube was the Dräger X-act® 5000 Basic electric pump from Drägerwerk AG & Co. KGaA (Lübeck, Germany).
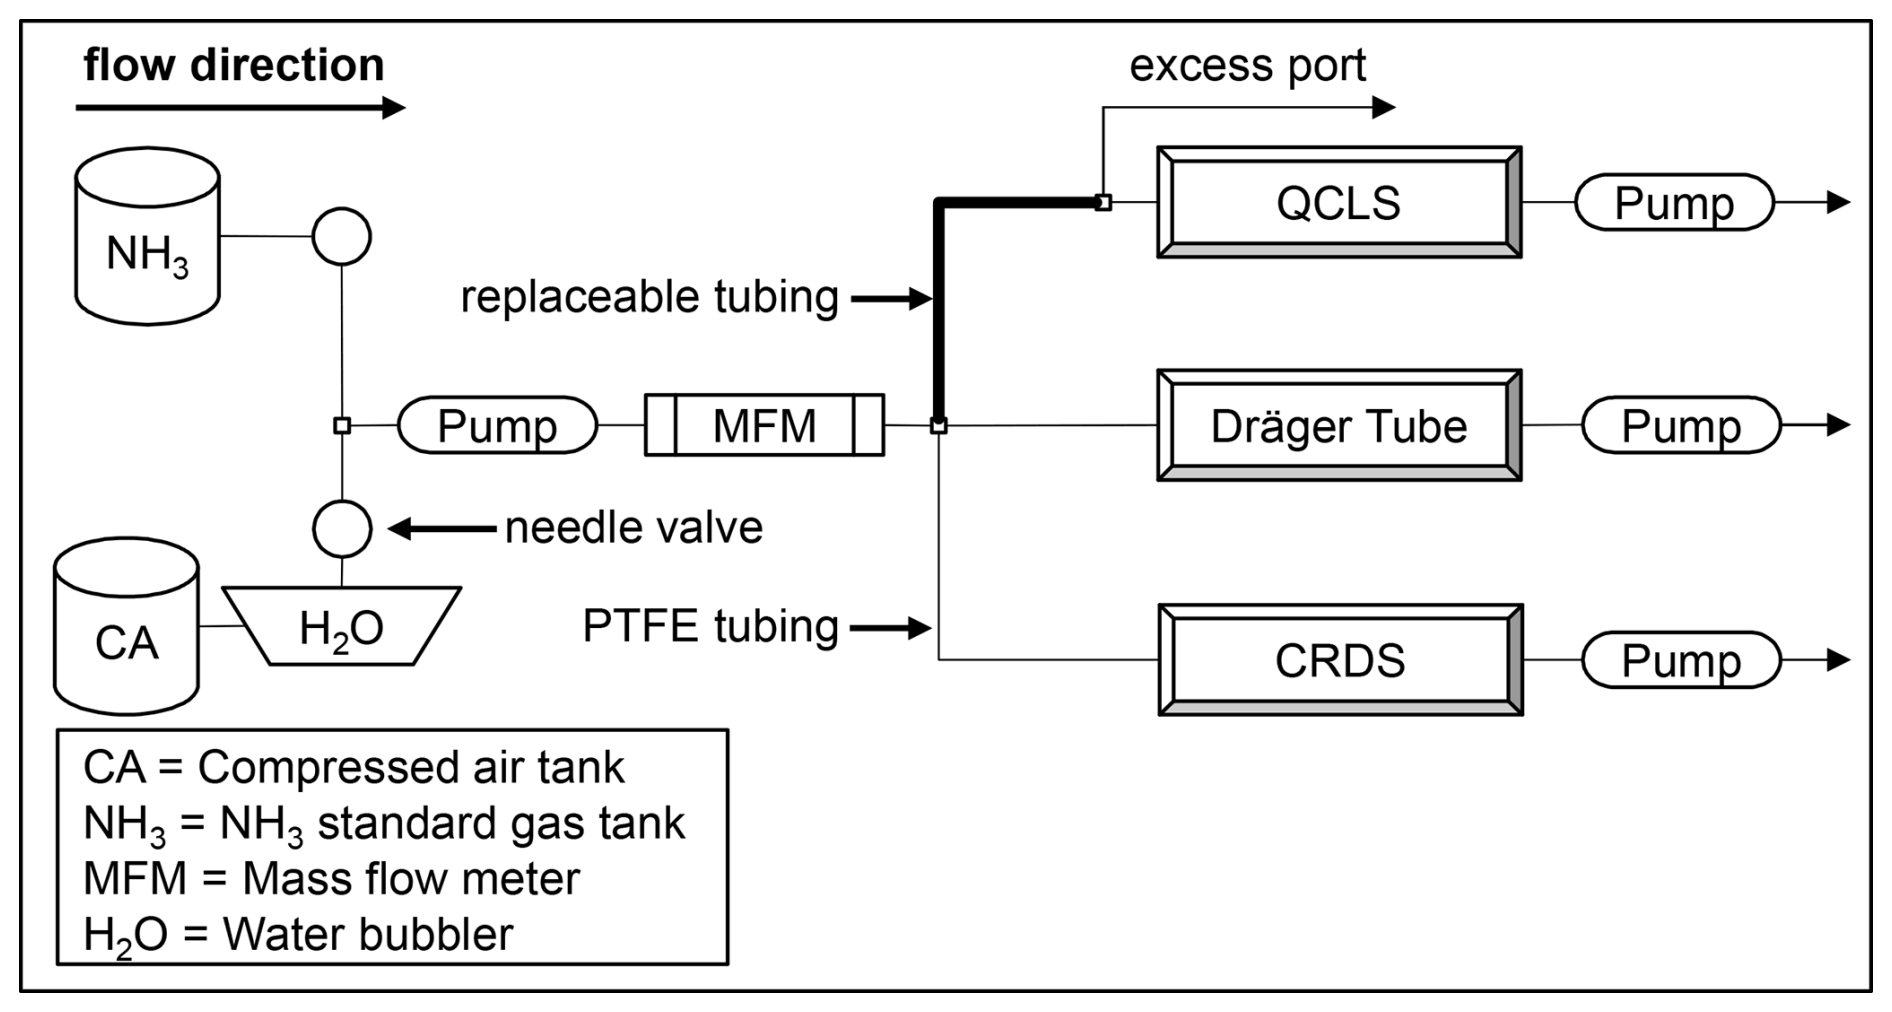
Figure 1A sketch of the experimental setup used to test the NH3 detection accuracy of the Dräger Tubes and QCLS as well as the performance of different tubing materials at room temperature and when heated. The tubing connected to the Dräger Tube acted as a second excess port whenever the Dräger Tubes were not used. The pump behind the Dräger Tube was the Dräger X-act® 5000 Basic electric pump.
2.2 Quantification of the Dräger Tube detection accuracy, precision and sensitivity for NH3
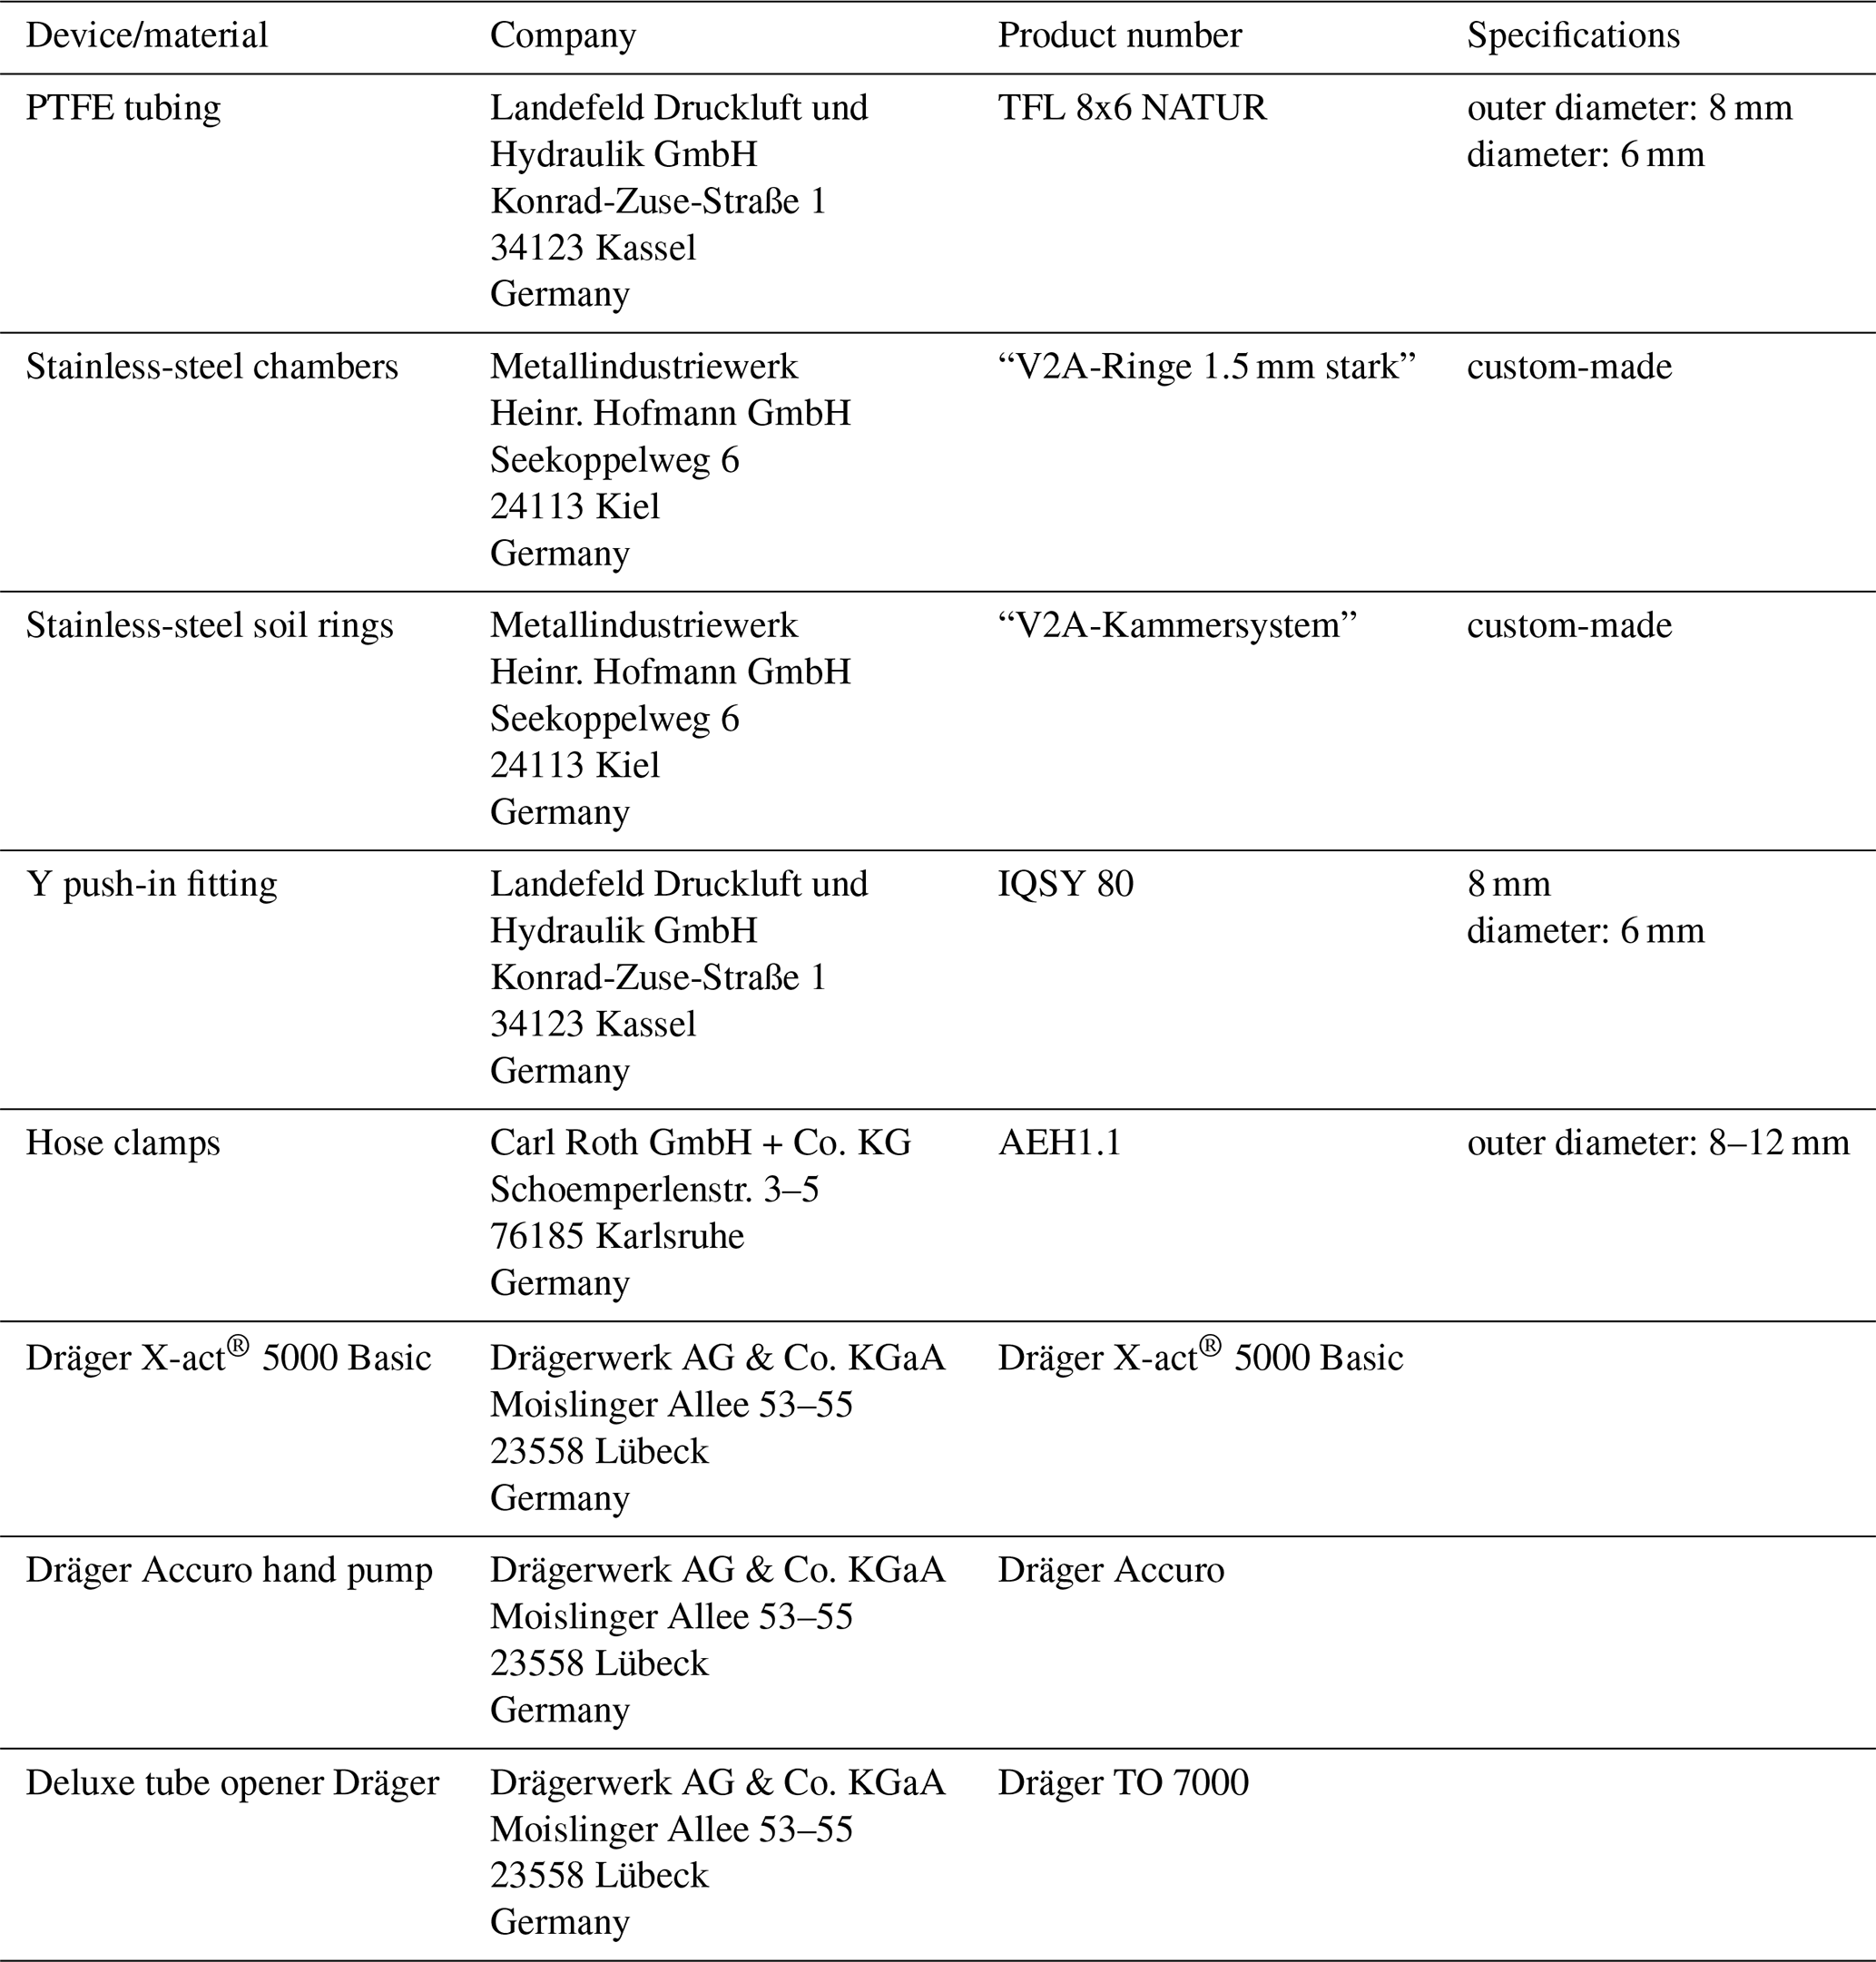
To determine the NH3 detection accuracy of both the QCLS and the Dräger Tubes, humid air with a defined NH3 mixing ratio was passed independently through both the QCLS and the CRDS in the laboratory setup. The mixing ratio was set at approximately 50, 100, 150, 200, 250, 300, 500, 1000 and 1500 ppb. The CRDS readings were used as a reference. The NH3 readings of both the QCLS and the CRDS were allowed to stabilize before starting the Dräger Tube measurements. The Dräger Tubes were inserted into the NH3-rich air excess port as shown in Fig. 1 and then air was pumped into the Dräger Tubes using the Dräger X-act 5000 Basic electric pump from Drägerwerk AG & Co. KGaA (Lübeck, Germany). A minimum of 10 and a maximum of 50 pump strokes were used for the measurements. Ten pump strokes were performed with a used Dräger Tube before each measurement. The Dräger Tube measurements were repeated three times for each mixing ratio level. The detection accuracy was determined by the difference in detected mixing ratios between the CRDS analyzer and the other instruments. The Dräger Tube measurements taken with more than 10 pump strokes (where 10 pump strokes equal 1.0 L of air volume) were scaled back to 1.0 L of air volume to make them comparable to the QCLS and CRDS measurements. A list of the instruments and materials used during the laboratory experiments can be found in Tables A1 and A2.
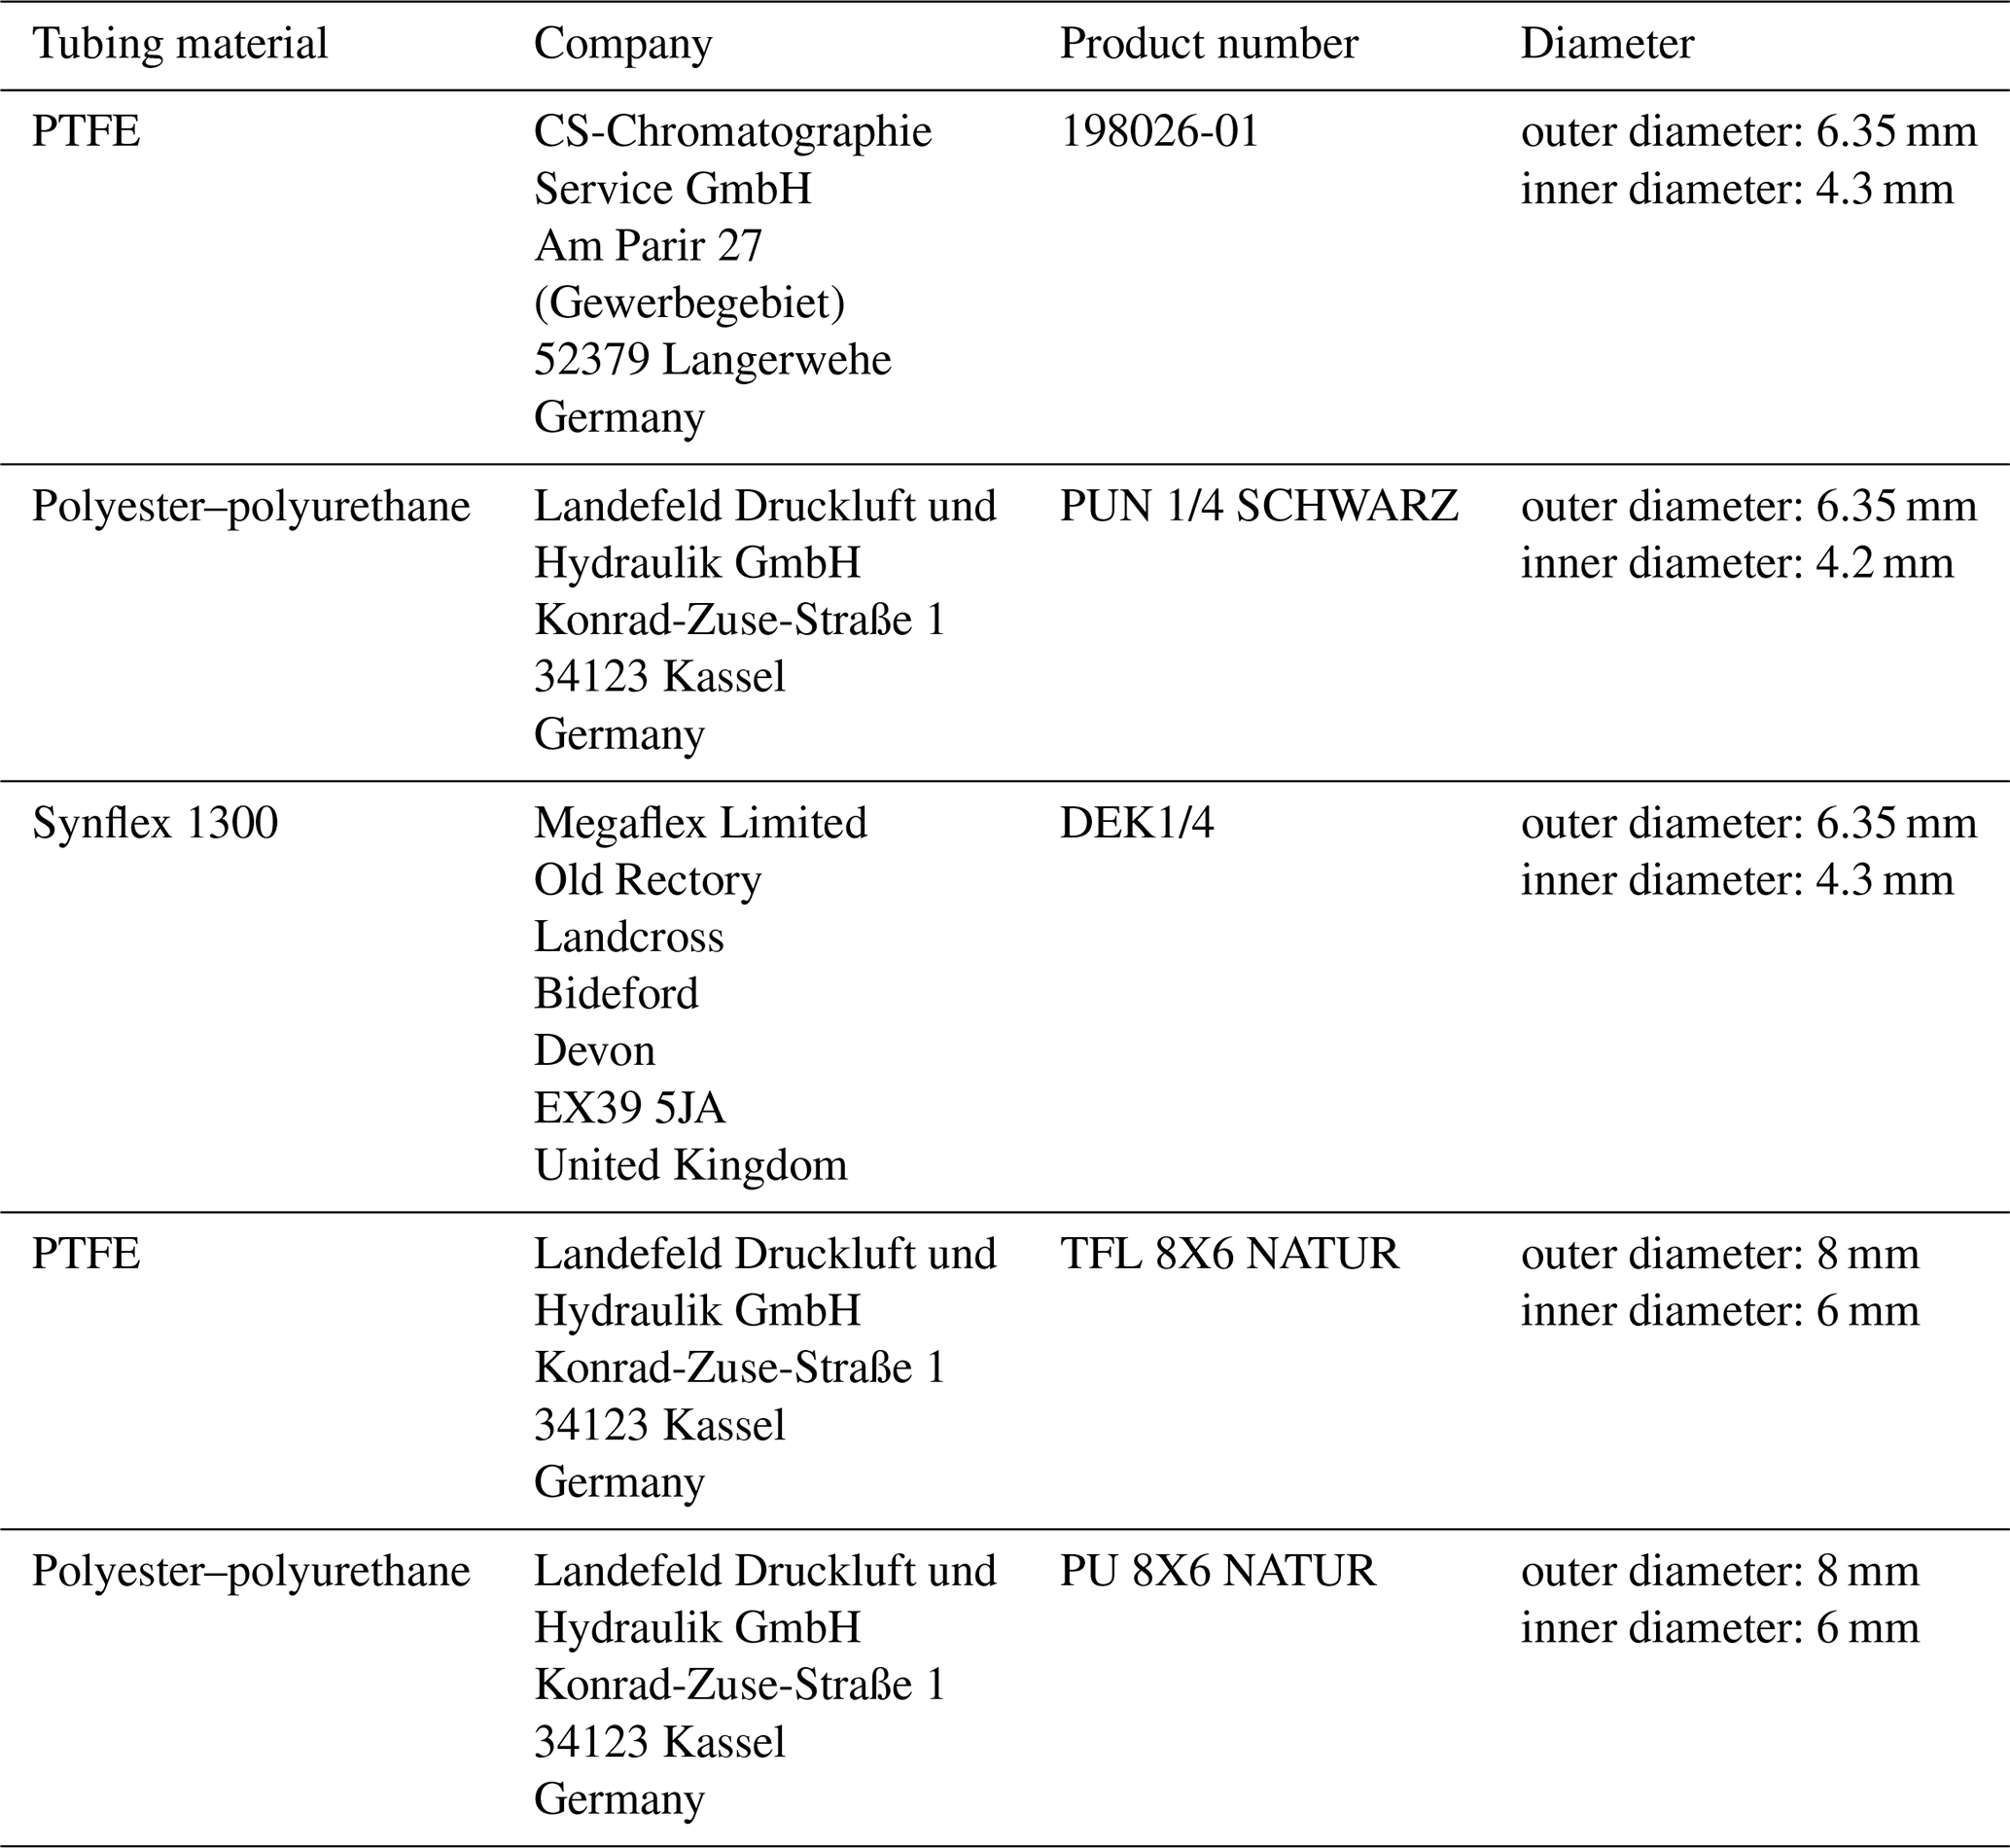
2.3 Influence of tubing material and tubing temperature on NH3 response time
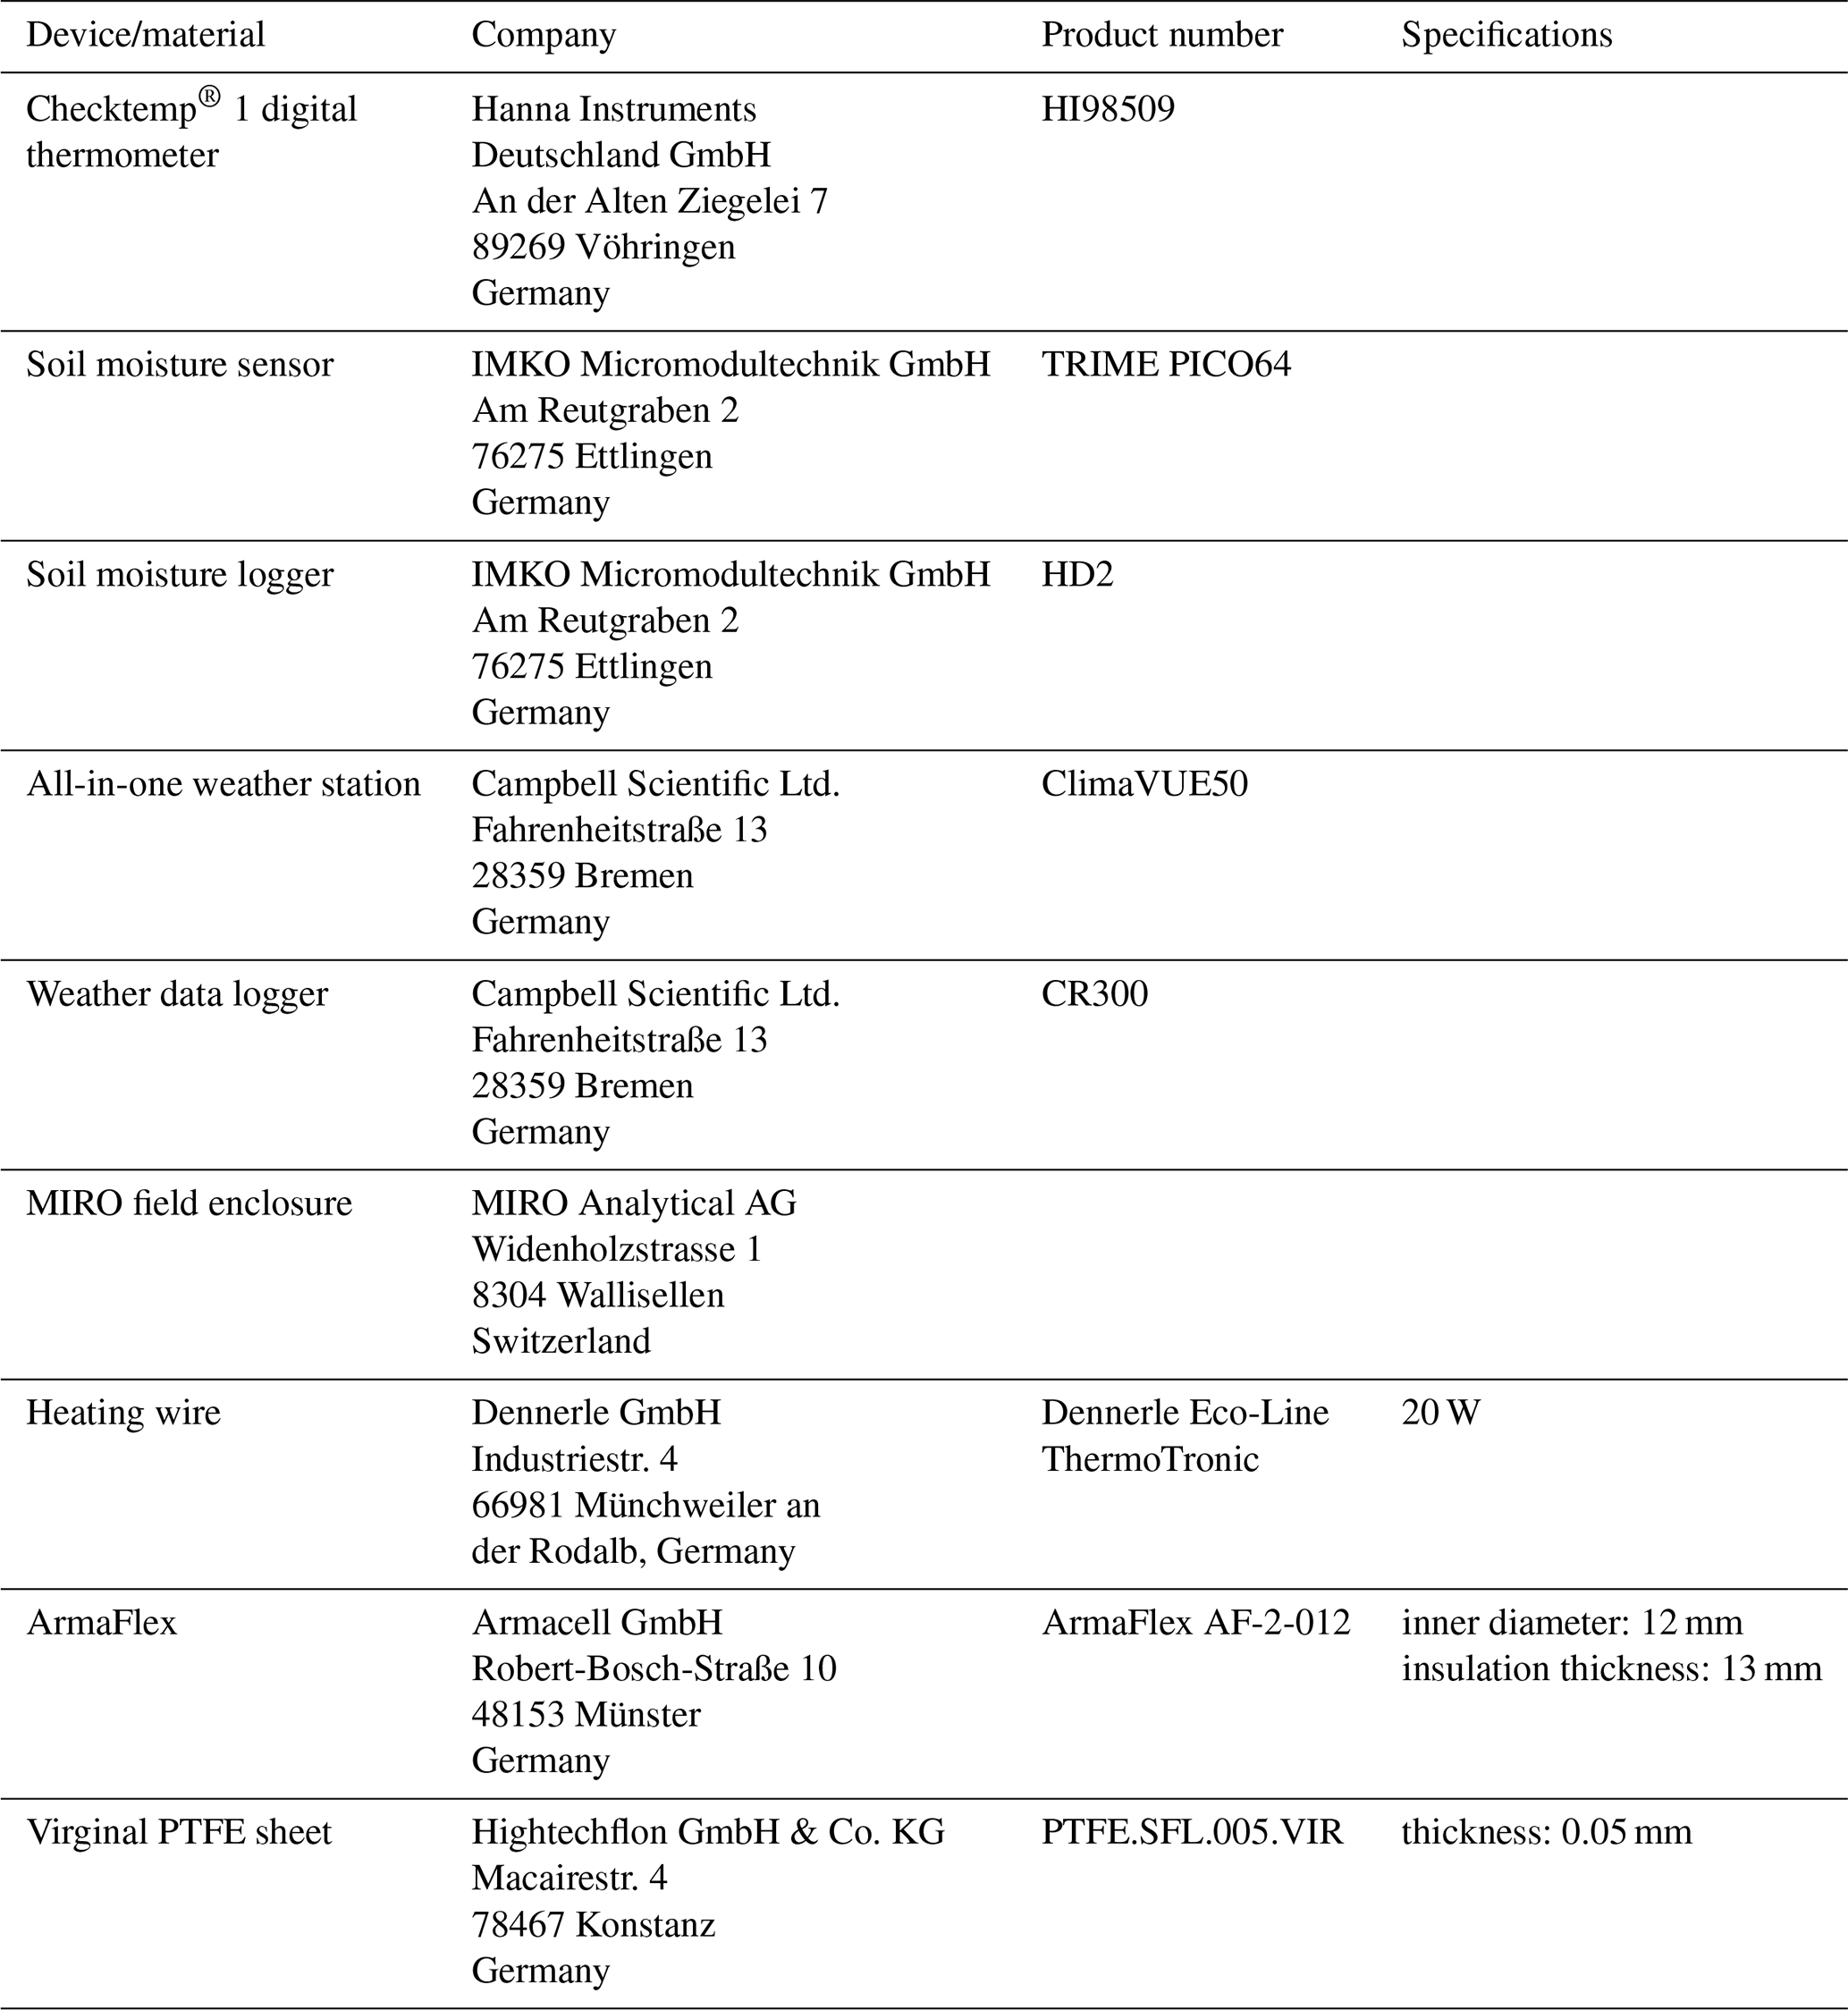
The response time of the QCLS to NH3 was tested using different tubing materials. We selected PTFE (CS-Chromatographie Service GmbH, Langerwehe, Germany), PUR (Landefeld Druckluft und Hydraulik GmbH, Kassel, Germany) and Synflex 1300 (Megaflex Limited, Bideford, England) tubing for the tests. The tubing had an outer diameter of 6.35 mm and an inner diameter of 4.3 mm for PTFE and Synflex 1300 and an inner diameter of 4.2 mm for PUR. The same laboratory setup was used as described in Sect. 2.2, but with a fixed NH3 mixing ratio of 600 ppb. A 3 m segment of the respective tubing was connected between the excess port next to the QCLS and the mass flow meter (Fig. 1). The tubing performance was tested at an ambient temperature of roughly 24 °C and then in a heated state at roughly 50 °C by wrapping a 5 m long 20 W aquarium heating cable (Dennerle Eco-Line ThermoTronic, Dennerle GmbH, Münchweiler an der Rodalb, Germany) around the tubing and covering it with insulation material ArmaFlex AF-2-012 (inner diameter 12 mm, insulation thickness 13 mm). The response time was defined as the time required for the sensor to detect 10 %–90 % of total NH3 at increasing mixing ratios, and the time required for the sensor to detect 90 %–10 % at decreasing mixing ratios.
2.4 Outdoor experimental setup
We tried different modifications to the chamber system for the outdoor experiment and compared the differences in the measured mixing ratios of the Dräger Tubes and the QCLS. The chamber system for DTM and QCLS was the same as that used in Pacholski et al. (2006), and the modification changes were applied to the chamber systems of both devices. In the first trial, we compared the NH3 mixing ratios of both devices without any changes to the chamber system. In the second trial, we wiped the inner surface of the chamber with 99 % ethanol before each measurement. Since NH3 has a lower solubility in ethanol than in water, this was intended to replace the water film on the inner chamber surface. In the third trial, we replaced the PTFE tubing with PUR tubing. Both PTFE and PUR are hydrophobic. However, PUR is much less expensive and more flexible, making it more practical to use during measurements. In the final trial, in an attempt to minimize potential water films on the inner surface of the chamber, the inside of the chambers was covered with 0.05 mm thick PTFE sheet. The PTFE sheet was attached to the surface of the chamber with a double-sided adhesive tape.
Four boxes, with dimensions of 56.5 × 36.0 × 17 cm, containing agricultural soil were situated in close proximity to a laboratory building on the campus of Forschungszentrum Jülich, Germany. The location ensured that the QCLS had both power and shelter nearby in the event of rain. The soil used was agricultural soil (silty loam, pH 6.4), collected from arable land at the agricultural research site Klein Altendorf near Bonn, Germany. The coordinates of the soil collection point were 50.61618° N, 6.99489° E. A ClimaVUE50 all-in-one weather sensor from Campbell Scientific (Logan, USA) and a CR300 data logger from Campbell Scientific (Logan, USA) were stationed near the soil boxes to record real-time weather data with a measurement interval of 1 min. Soil moisture was recorded with a TRIME PICO64 moisture sensor from IMKO Micromodultechnik GmbH (Ettlingen, Germany) connected to an HD2 mobile reader from IMKO Micromodultechnik GmbH (Ettlingen, Germany), and soil temperature was recorded with a digital thermometer (Checktemp® 1 HI98509, Hanna Instruments, Woonsocket, RI, USA) prior to each NH3 measurement. Four stainless-steel soil rings with a diameter of 11.5 cm were placed on the soil of each box. A solid urea fertilizer with 46 % nitrogen content (Piagran 46, SKW Stickstoffwerke Piesteritz GmbH, Lutherstadt Wittenberg, Germany) was used for the fertilized plots. Urea was applied only within the soil rings, and approximately 0.135 g was applied to each soil ring, corresponding to 60 kg N ha−1. After fertilization, each soil box was evenly irrigated with 1–2 mm of water whenever the soil was determined to be too dry to dissolve the urea. Soil boxes were re-fertilized when NH3 was no longer detectable by the Dräger Tubes. A list of the materials used during the outdoor experiment can be found in Tables A3 and A4.
2.5 Outdoor measurements
The QCLS and its chamber system were connected to an electric pump and flow meter to maintain an air exchange rate of approximately 1.0 L min−1. The Dräger X-act® 5000 Basic pump used for the DTM takes approximately 1 min for 10 strokes of 0.1 L of air each stroke, which also corresponds to an air exchange rate of approximately 1.0 L min−1. Prior to the start of each measurement with the QCLS, the chamber system was placed on the soil rings of the respective box and flushed with air for 30 min. After a further 30 min, the indicated mixing ratio was recorded. At the same time, a second identical chamber system was flushed with another electric pump on another set of soil rings in preparation for the next measurement. While we waited a total of 60 min during each measurement cycle, we only recorded the last few minutes of the QCLS readings. This ensured that the system reached a steady state before data collection began. DTM measurements were taken immediately after the completion of each QCLS measurement using the same chamber system. Measurements were performed according to the instructions from Pacholski (2016).
The air volume passing through the Dräger Tube depends on the number of pump strokes performed and was therefore always converted back to 10 pump strokes (equivalent to 1.0 L of air) for comparability.
2.6 Data analysis
Data transformation and statistical analysis were performed using R version 4.3.2. In the intercomparison test of all instruments for NH3 mixing ratios, the detection accuracy (yi), where i is either Dräger Tubes or QCLS, was defined as
Detection precision was defined as the relative standard deviation of the measurements. Detection sensitivity was defined as the β coefficient of a linear regression fitted to predict measured CRDS NH3 mixing ratios from measured NH3 mixing ratios of either the QCLS or Dräger Tubes.
A modified Hill function with an offset (Hill1; see Eq. 2) was fitted to the NH3 response curves of the response time tests using OriginPro 2022b (64-bit) SR1 version 9.9.5.171. Below, x is the duration in seconds, y is the NH3 mixing ratio at a given duration, START is the NH3 mixing ratio at x0, END is the maximum NH3 mixing ratio for rising response curves or the minimum for falling response curves, k is the duration to reach 50 % of maximum NH3 mixing ratios, and n is the Hill coefficient. Response time was defined as the duration from y10 % (EC10) to y90 % (EC90) for rising curves and from EC90 to EC10 for falling curves (see Eqs. 3 and 4). To test the response time of rising response curves for statistical significance, a one-way ANOVA was used. For falling response curves, which did not follow a normal distribution, the Kruskal–Wallis rank sum test was used.
Finally, linear regression was used to compare the differences between the DTM and QCLS NH3 measurements for each outdoor modification trial.
3.1 Quantification of the Dräger Tube detection accuracy, precision and sensitivity for NH3
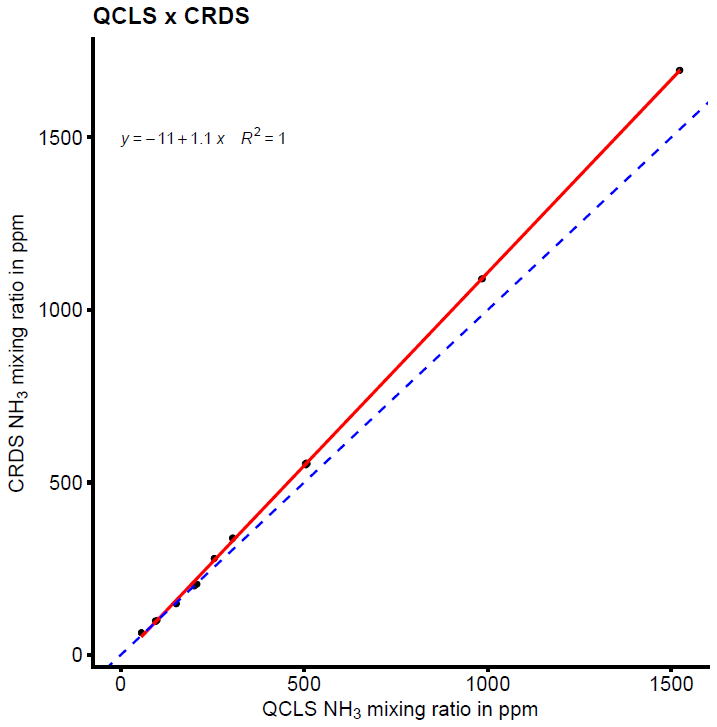
The detection accuracy and precision of the Dräger Tubes and QCLS measurements are displayed in Fig. 2. The QCLS measured slightly higher NH3 mixing ratios compared to the CRDS and Dräger Tubes and had a detection accuracy of 97 %–114 % across the different NH3 levels. The Dräger Tubes, on the other hand, measured lower mixing ratios and had a detection accuracy of 0 %–72 % across the different NH3 levels. The detection accuracy was higher at high NH3 levels and decreased to 0 % at lower levels. The detection precision ranged between 0.02 %–1.80 % for the QCLS measurements and between 0 %–115.47 % for the Dräger Tubes (Table 1).
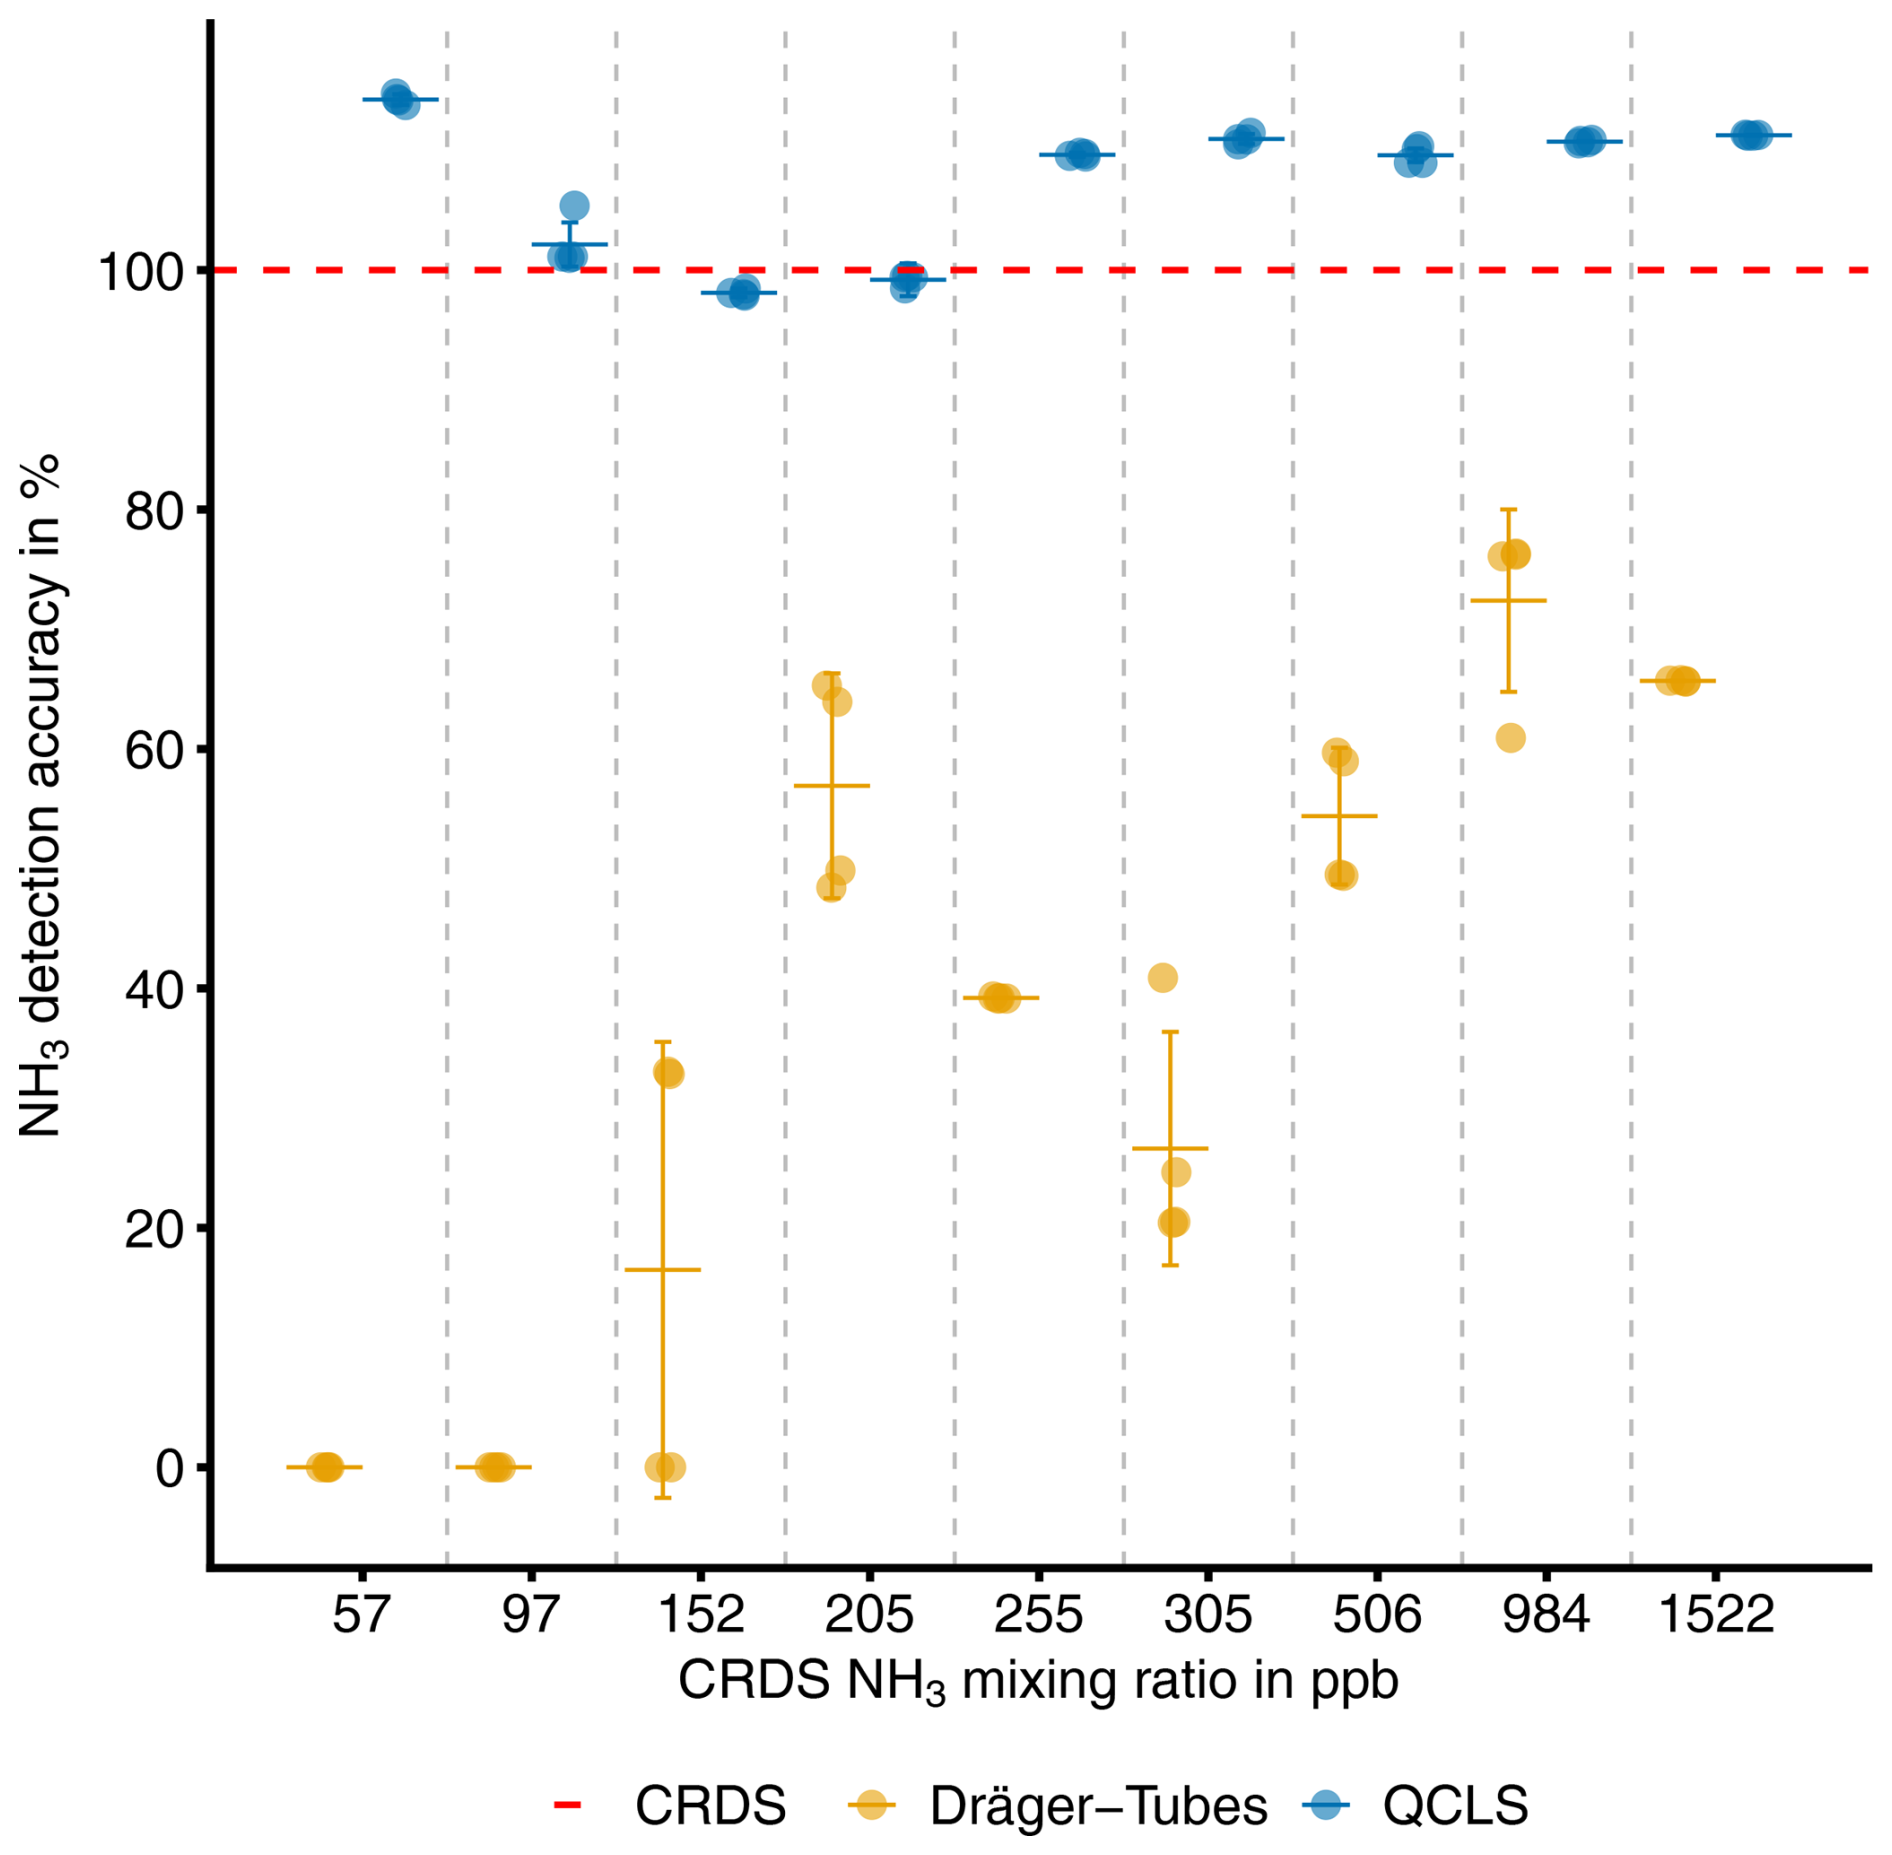
Figure 2Detection accuracy of NH3 with the Dräger Tube and QCLS relative to the NH3 mixing ratio measurement of the CRDS. Error bars indicate the detection precision as 1 standard deviation.
Table 1Relevant statistical information for the detection accuracy and precision of the Dräger Tubes and QCLS measurements; df represents degrees of freedom.
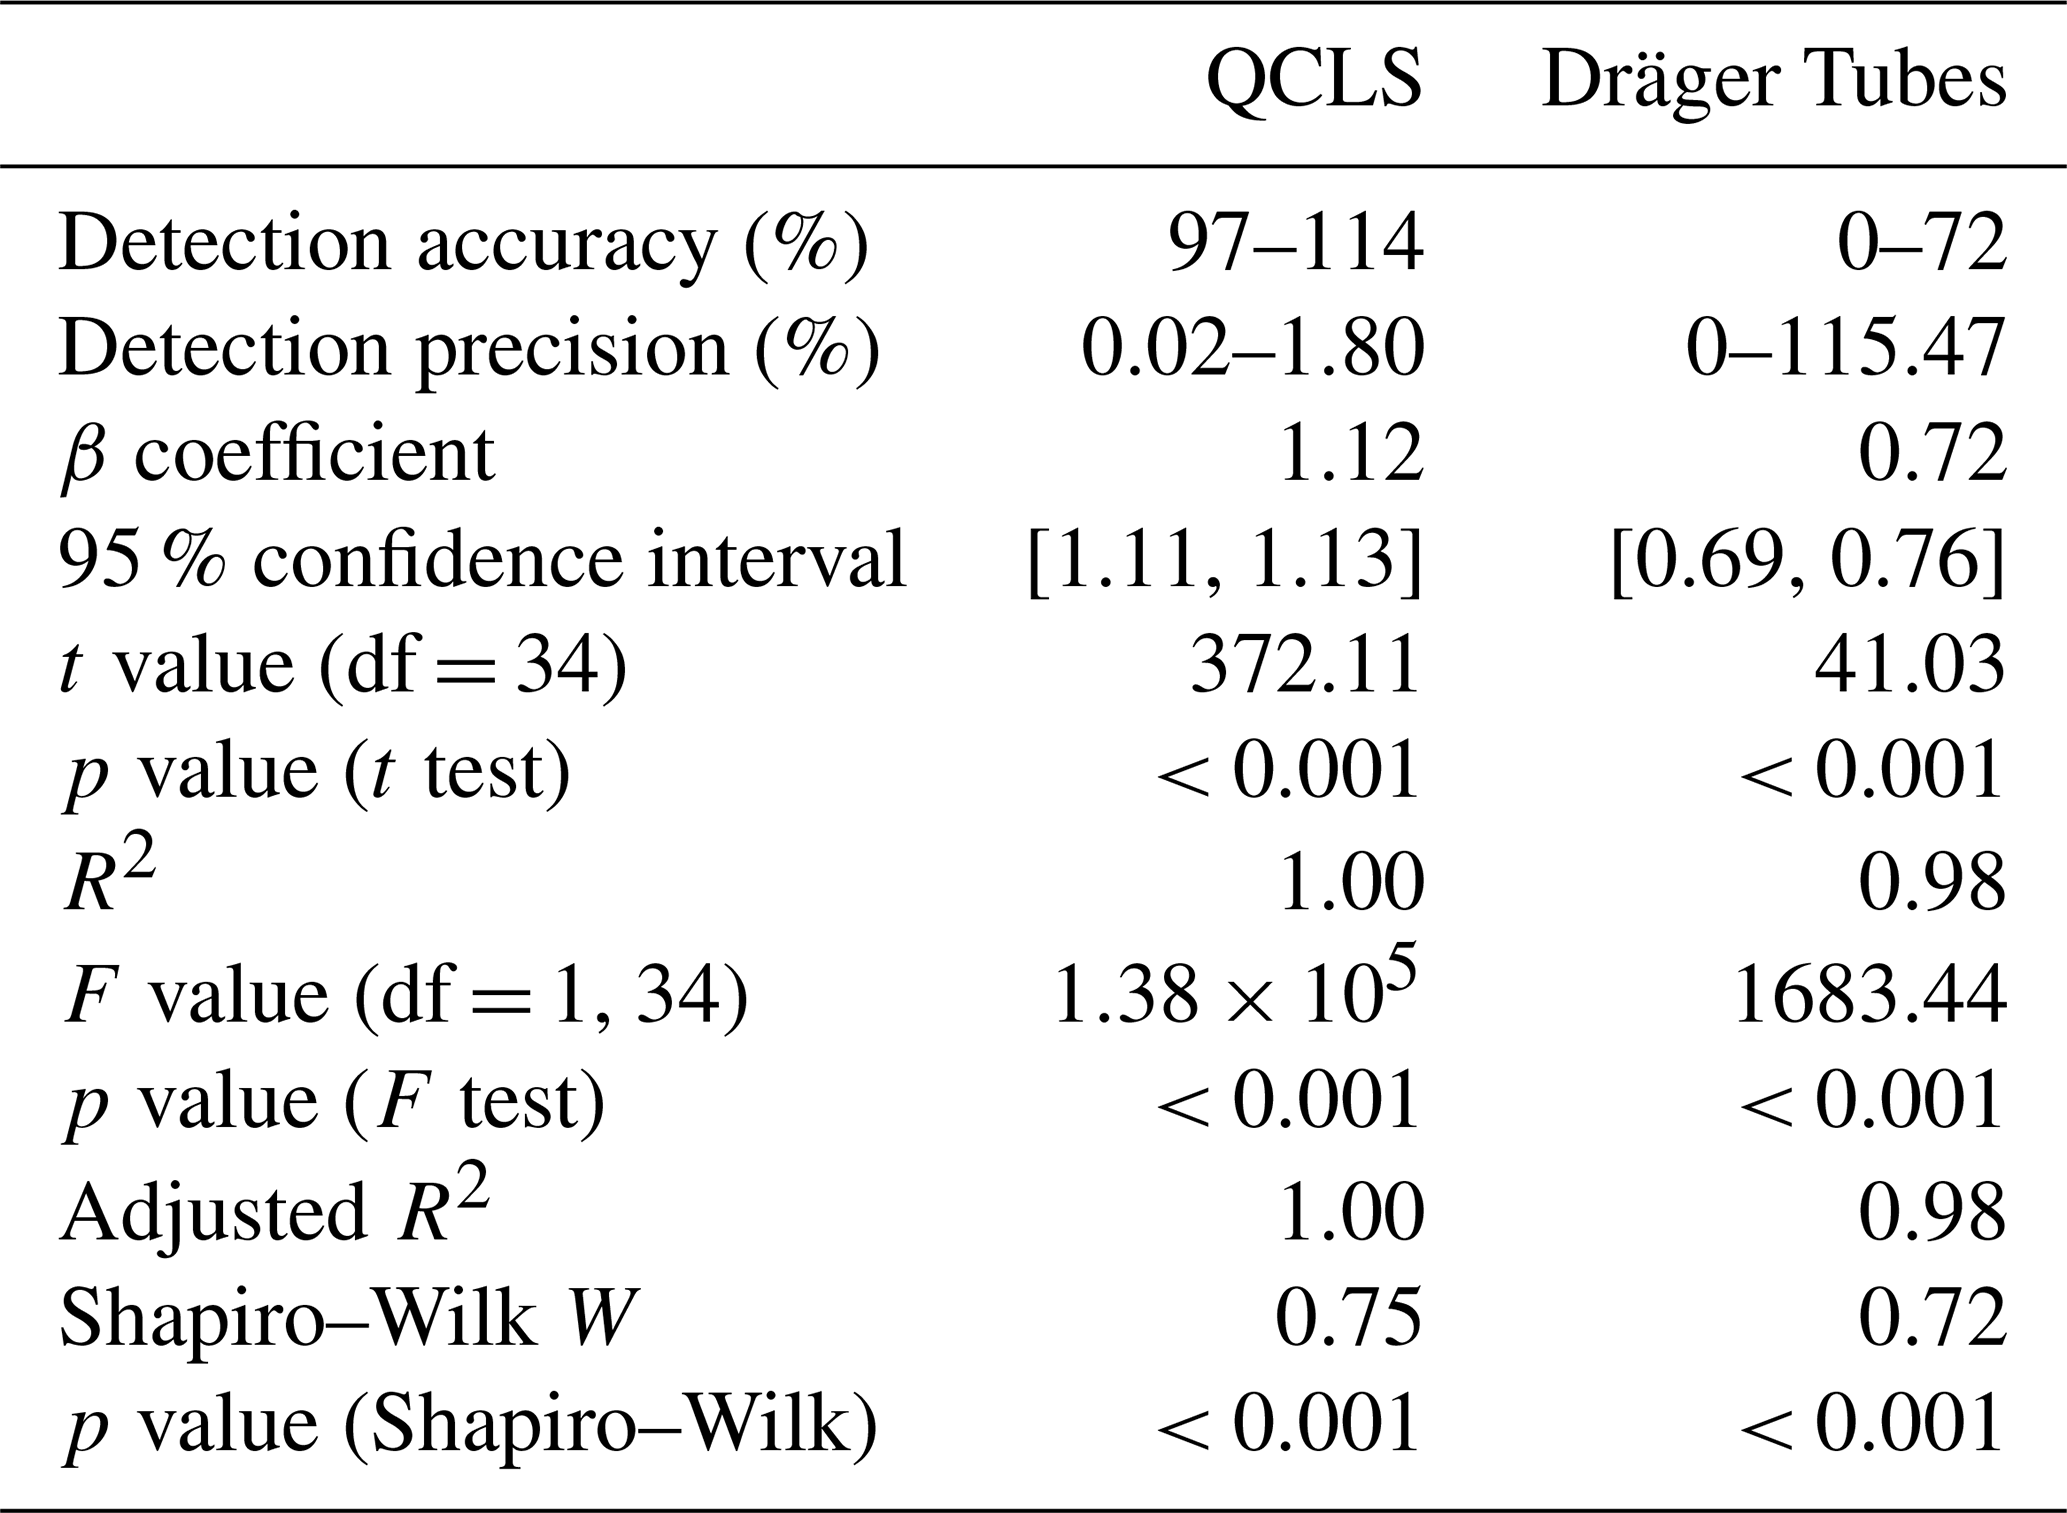
The mean NH3 detection sensitivity determined a β coefficient of a fitted linear model to predict measured CRDS NH3 mixing ratios with measured NH3 mixing ratios using the QCLS or Dräger Tubes, which was statistically significant, and it was 1.12 for the QCLS and 0.72 for the Dräger Tubes. However, the data of both the QCLS and Dräger Tube mixing ratios did not follow a normal distribution.
3.2 Influence of tubing material and tubing temperature on NH3 response time
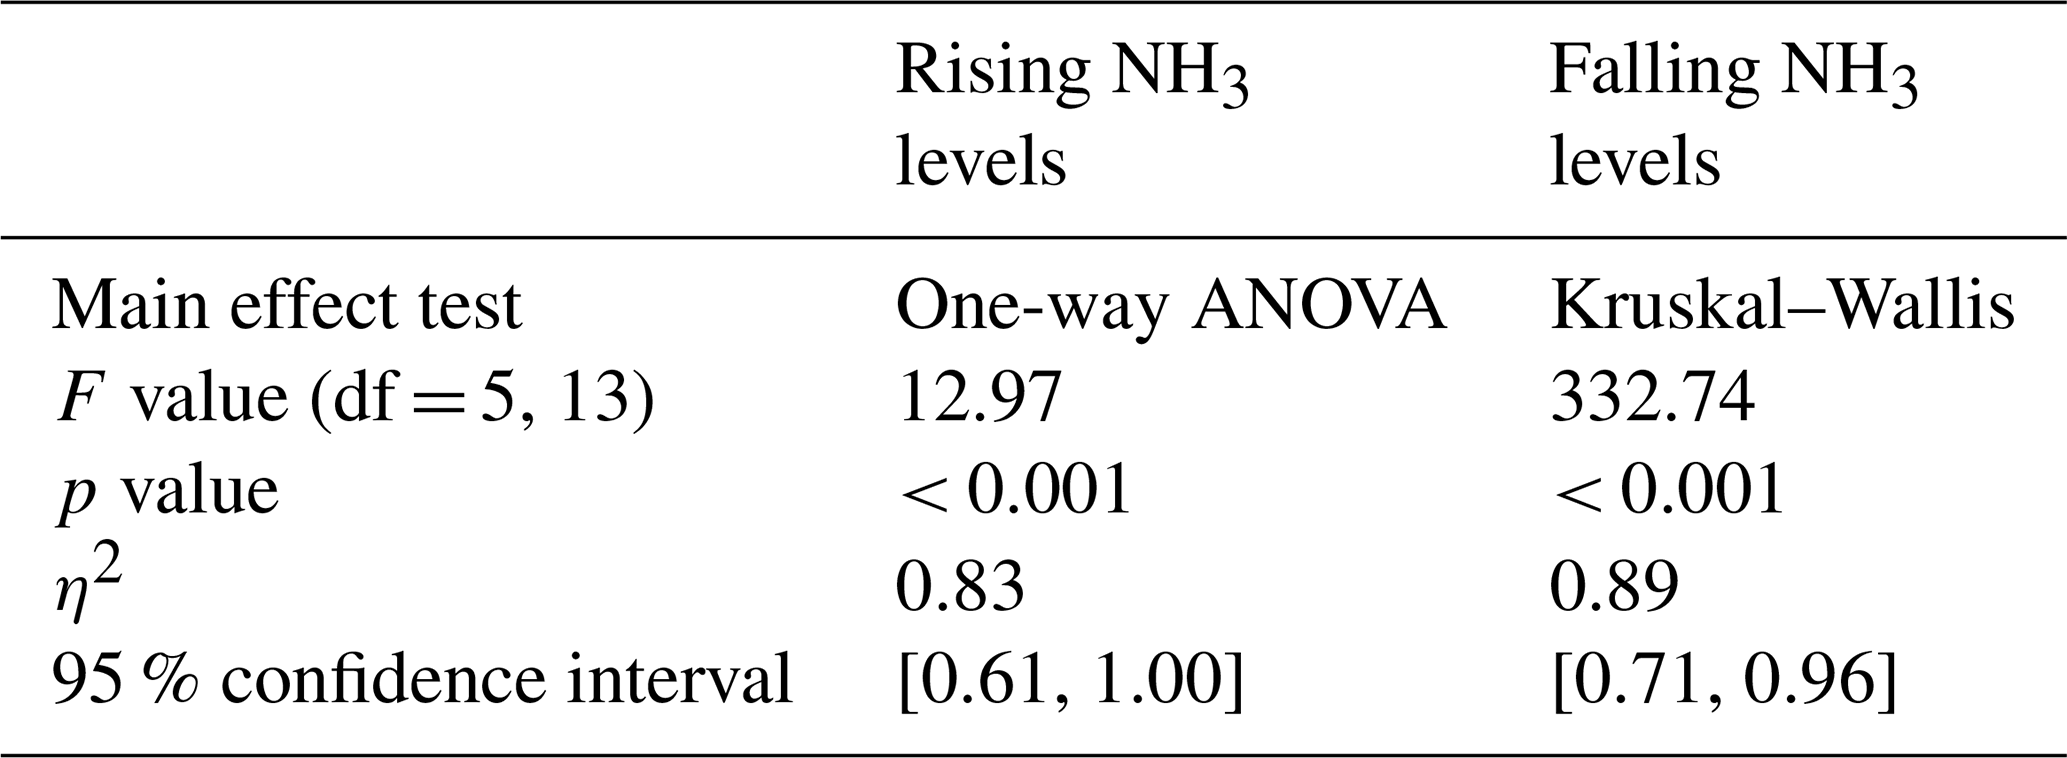
The main effect of the tubing material and temperature for rising NH3 levels (Fig. 3a) was significant and large according to the performed one-way ANOVA (Table 2). The response time of heated PTFE tubing was 10.71 min (standard deviation (SD) 0.92) and significantly shorter than both unheated and heated PUR and Synflex tubing but not significantly shorter than unheated PTFE tubing. The response time of unheated Synflex tubing was 51.25 min (SD 8.25) and significantly longer than both heated and unheated PTFE tubing and heated PUR tubing. The main effect was significant for falling NH3 levels (Fig. 3b), according to the performed Kruskal–Wallis test (Table 2). The response time of heated PTFE tubing was 6.39 min (SD 0.23) and significantly shorter than both unheated and heated Synflex tubing but not significantly shorter than the other tubing materials. The response time of unheated Synflex tubing was 25.11 min (SD 0.81) and significantly longer than unheated PUR and heated PTFE tubing.
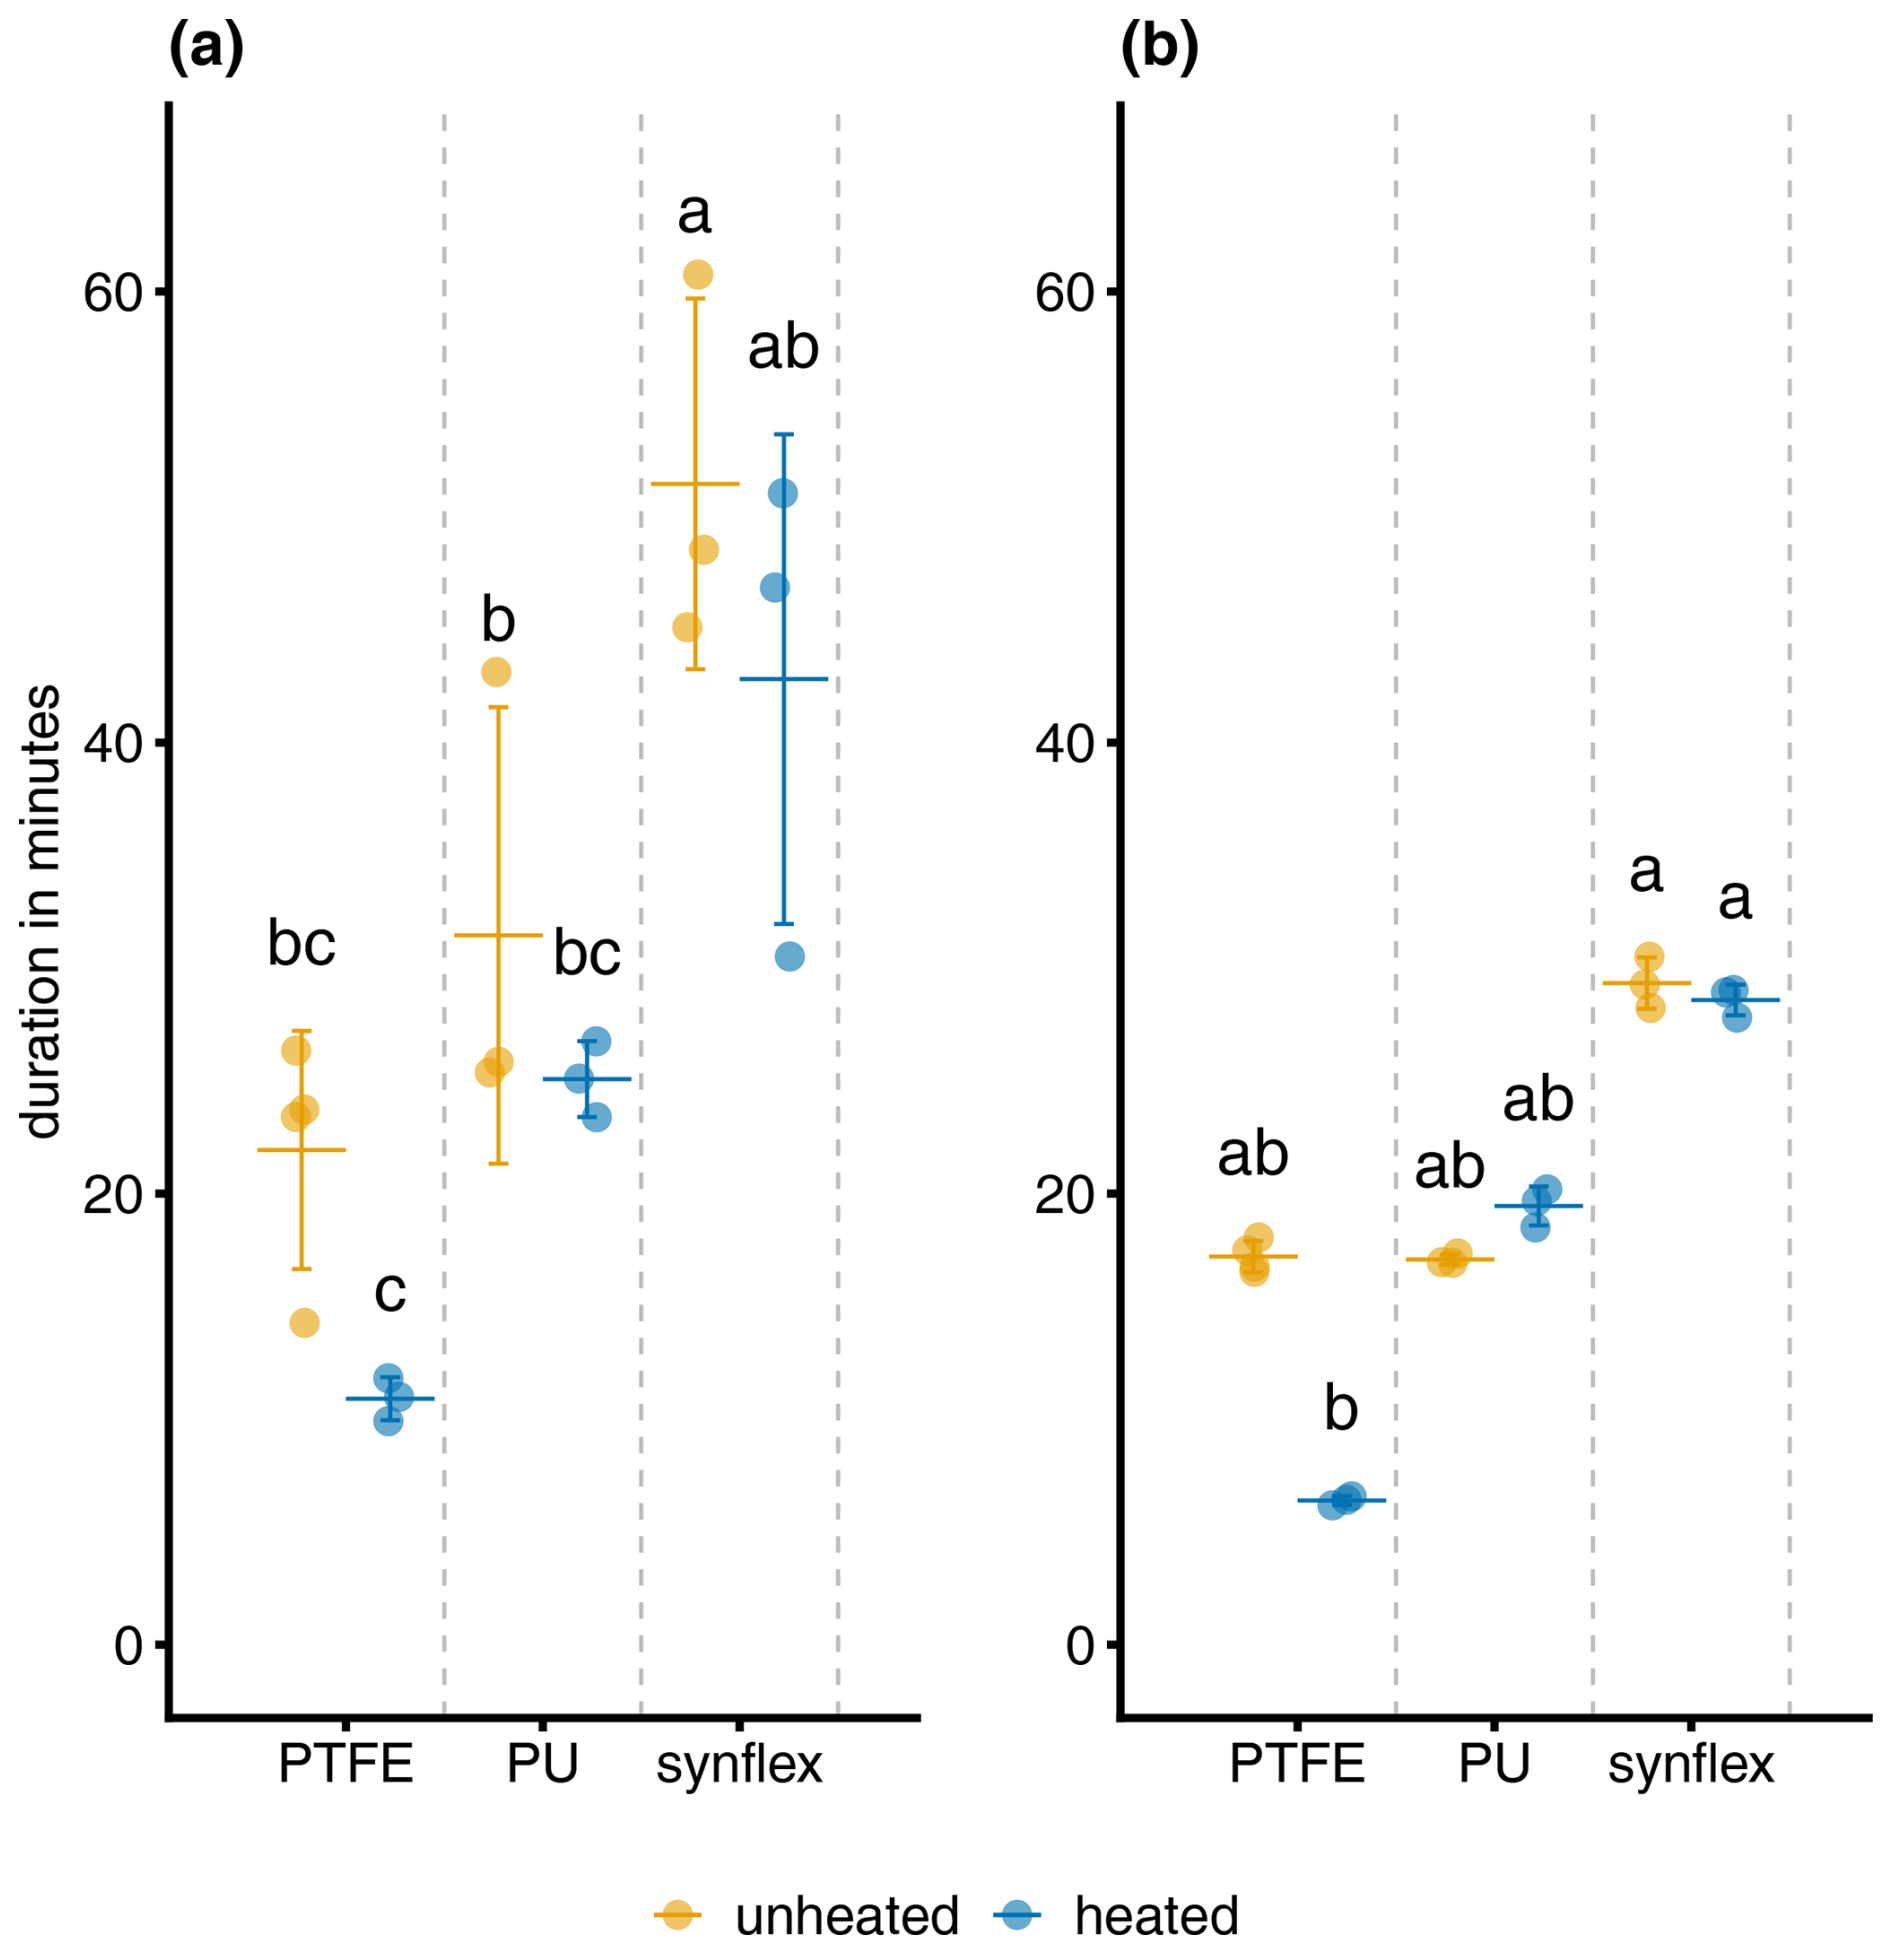
Figure 3Response time for NH3 mixing ratios measured with the QCLS for (a) increasing from 10 %–90 % and (b) decreasing from 90 %–10 % of the NH3 target level, using different tubing materials unheated at ambient temperature or heated with a wire to 50 °C. Letters above error bars indicate significant differences between groups, as determined by one-way ANOVA (a) and Kruskal–Wallis test (b). Groups sharing the same letter are not significantly different. Error bars indicate the standard deviation.
Table 2Relevant statistical information for the effect of tubing material and temperature on rising and falling NH3 levels; df represents degrees of freedom.
3.3 Chamber system modifications during outdoor measurements
A linear model was fitted to predict DTM NH3 measurements from QCLS NH3 measurements during four different trials where the chamber system was left unchanged or was slightly modified (Fig. 4). In the unchanged chamber system trial, the model explained a statistically significant and substantial proportion of variance. The model's intercept, corresponding to QCLS = 0 ppm, was at −0.09 ppm. The unchanged chamber system had the highest β coefficient of the four trials (Table 3).
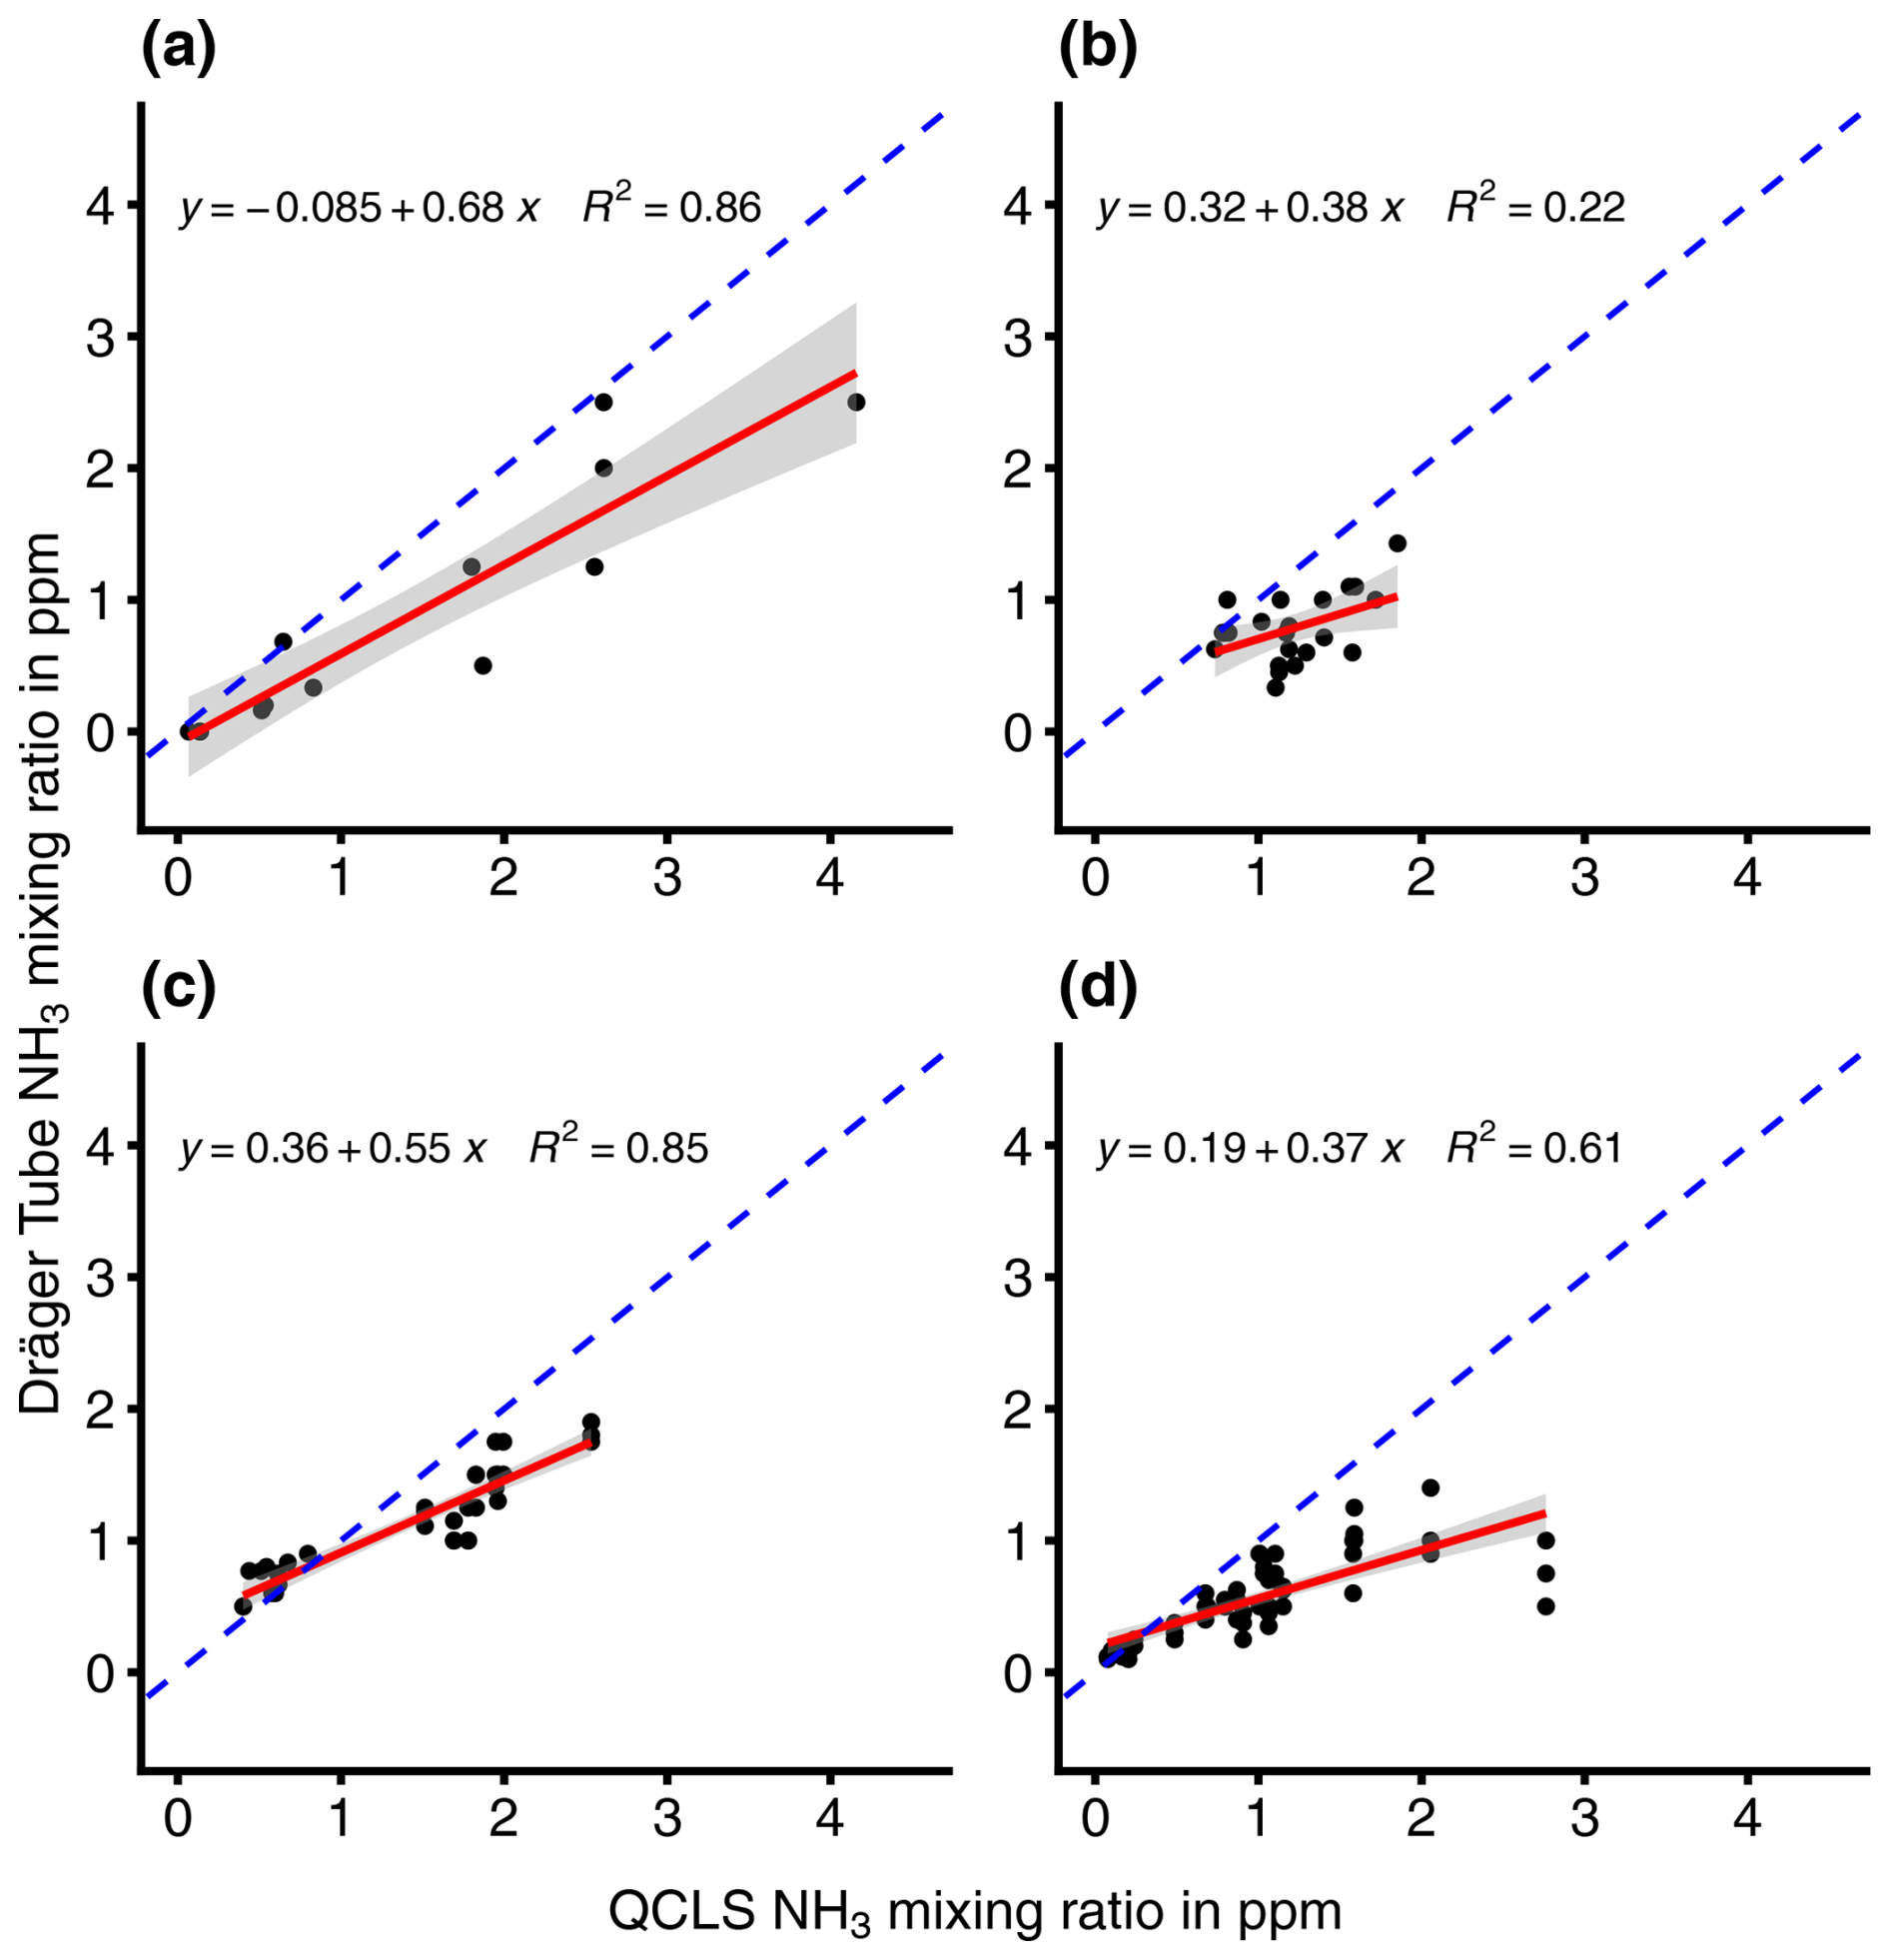
Figure 4Linear regression relationships between Dräger Tube and MIRO measurements of the NH3 mixing ratio (in ppb) under different measurement conditions. (a) Unchanged DTM chambers connected to PTFE tubing, (b) wiping of chambers with ethanol, (c) connected to PUR tubing and (d) chambers with PTFE film attached to the inner surface.
Table 3Relevant statistical information for the chamber system modifications during outdoor measurements.
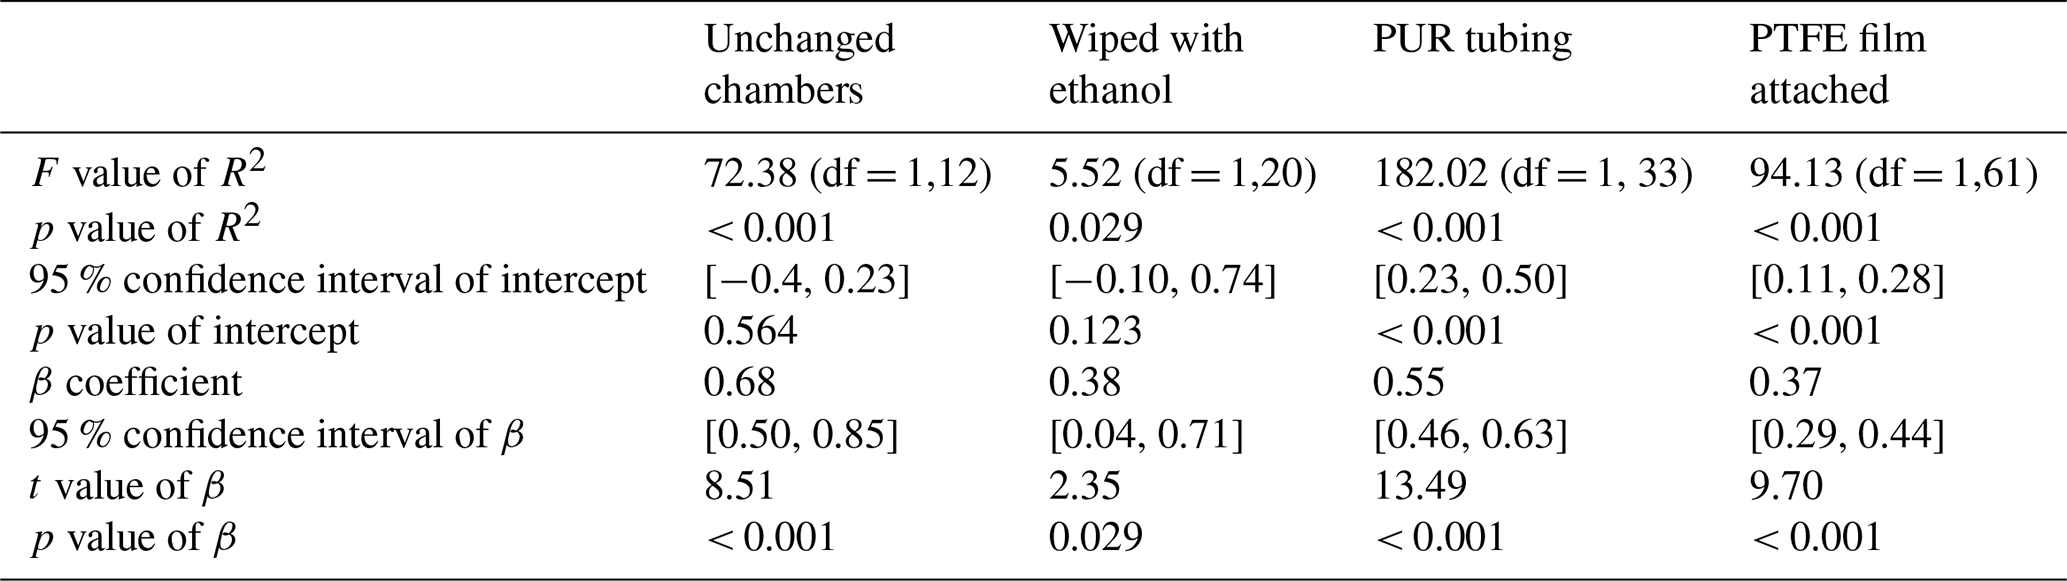
During the trial where the inner chamber surfaces were cleaned with ethanol, the model explained a statistically significant but only moderate proportion of the variance. The model's intercept was at 0.32 ppm. This trial had the second lowest β coefficient of the four trials.
During the trial where the PTFE tubing was replaced with PUR tubing, the model explained a statistically significant and substantial proportion of variance. The model's intercept was at 0.36 ppm. This trial had the second highest β coefficient of the four trials.
During the trial where a PTFE film was attached to the inner chamber surfaces, the model explained a statistically significant and substantial proportion of variance. The model's intercept was at 0.19 ppm. This trial had the lowest β coefficient of the four trials.
4.1 Quantification of the Dräger Tube detection accuracy, precision and sensitivity for NH3
Slightly higher NH3 mixing ratios were measured with the QCLS than with the CRDS. The detection accuracy was between 97 % and 114 % for the various NH3 values. The mean detection sensitivity was 0.89. This means that the QCLS slightly overestimated the NH3 mixing ratios in most cases compared to the CRDS. This is in line with the results of the case study by the manufacturer of the QCLS (MIRO Analytical, 2021), which also compared NH3 measurements of the MGA7 with a cavity ring-down spectroscopy device and found an average detection sensitivity of 0.748 at mixing ratios between 3 and 9 ppb. Since the detection accuracy was good even at low NH3 mixing ratios and comparable to that of the CRDS, it was concluded that the QCLS could be safely used for response time and field measurements.
A significant drop in detection accuracy in Dräger Tubes was observed between 205 and 305 ppb. Measurements at 97, 152 and 205 ppb were conducted later in March 2023, while the other measurements were performed in October 2022. The laboratory temperature in March was 5 °C lower, which may have influenced the results. Additionally, differences in the batches of Dräger Tubes used could have affected the measurement quality. However, the most likely explanation is observer error. Dräger Tubes lack the sensitivity to detect changes within a range of ±100 ppb. NH3 concentrations are determined by measuring the distance of discoloration on the detector tubes, leaving the precise endpoint of the discoloration subject to observer judgment. In some cases, the discoloration was only a very light blue, further complicating accurate observations.
The Dräger Tubes had a detection accuracy of 0 % at lower NH3 mixing ratios and a detection accuracy of up to 72 % at higher mixing ratios. This means that the Dräger Tubes considerably and significantly underestimated the NH3 mixing ratios compared to the CRDS device, with a trend of increasing underestimation at decreasing NH3 levels. It was already known that the uncalibrated DTM underestimates NH3 and is not suitable for quantitative measurements of NH3, but previous work on the DTM has cited the low air flow rate of the pump as the most likely reason for the underestimation of NH3 mixing ratios (Pacholski et al., 2006; Roelcke et al., 2002). Svensson and Ferm (1993) also found a direct relationship between NH3 concentrations in their chamber and the air flow rate. To address this limitation, Pacholski et al. (2006) proposed a calibration approach that accounts for wind speed, which could potentially make the DTM suitable for quantitative measurements. However, the flow rate of the pumps in this test was set to that of the Dräger pump, which was approximately 1.0 L min−1, for all instruments, and NH3 was constantly flowing at a uniform rate throughout the entire tubing line, so there must be other factors contributing to the lower detection accuracy of the Dräger Tubes compared to the other devices.
One reason for this could be the short measuring time of the Dräger Tubes. While we gave the other devices sufficient time to measure 100 % of the NH3 target value, this was not possible with the Dräger Tubes, as the tubes would be saturated with NH3 if air was pumped through the tubes for too long. Another reason could be that the Dräger Tubes were not designed for precise atmospheric measurements. According to the official instructions, only 10 strokes are intended for the measurement with the Dräger Tubes, which corresponds to an air volume of 1.0 L. Throughout the experiment, we used NH3 detector tubes whose indicator line ranged from 250–3000 ppb (Dräger Tube: ammonia 0.25/a, Table A1). At values below 300 ppb, therefore, more than the recommended amount of 1.0 L of air would have to be pumped through the Dräger Tube for NH3 to be detectable. This would explain the sharp drop in detection accuracy in the Dräger Tubes for mixing ratios below 200 ppb, where 5 L of air had to be pumped through the Dräger Tube instead of 1.0 L (Fig. 2). The original use of the Dräger Tubes was to measure excess NH3 concentrations after fumigation of enclosed spaces, such as containers (Drägerwerk AG, 2011). The Dräger Tubes were therefore not designed for high detection accuracy, especially at lower NH3 concentrations.
The originally assumed detection limit of the Dräger Tubes, as used in the DTM, was 50 ppb. However, the results suggest that the detection limit is instead somewhere between 152 and 205 ppb. The originally proposed detection limit was based on the assumption that increasing the number of pump strokes per measurement to 50 instead of 10 would proportionally improve the detection limit of the Dräger Tubes, which indicated 250 ppb on the lowest indicator line, down to 50 ppb (Roelcke, 1994). Since the previous detection limit was based on an assumption and not on empirical measurements, we suggest that a detection limit between 152 and 205 ppb is more correct.
A higher detection limit than originally assumed could lead to erroneous NH3 flux measurements from the calibrated DTM in two different ways. The first is that the actual NH3 mixing ratios at the fertilized soil surface are below the detection limit and are no longer detectable. This case would cause a higher flux detection limit, and the NH3 fluxes would be underestimated. The second case is that the mixing ratios at the fertilized soil surface are detectable and the background mixing ratios are unusually high, but still below the detection limit. In this case, the NH3 fluxes would be overestimated. Therefore, instruments with high measurement sensitivity are preferred.
To calculate the flux detection limit of the calibrated DTM from the mixing ratio detection limit, we chose to apply the above-mentioned calibration equation (Eq. 6) from Pacholski et al. (2006), which was recently identified by Kamp et al. (2024) to have considerable uncertainty and lead to an underestimation of NH3 fluxes. Since NH3 fluxes derived from this equation are strongly influenced by wind speed during the measurement period; the flux detection limit also varies significantly depending on the wind conditions at the time of measurement. Table 4 shows an estimate of the effect that a detection limit of 175 ppb can have on the daily NH3 fluxes measured and calculated with the calibrated DTM. Typically, DTM measurements should be taken multiple times throughout the day, and the fluxes are then interpolated between measurement points to account for diurnal variation. However, for our estimates, we assumed constant NH3 concentrations over the course of the day. NH3 mixing ratios above the soil surface were assumed to be near the detection limit of 175 ppb, with constant wind speeds maintained throughout the day. This number was divided by the β coefficient of 1.36 from the detection sensitivity experiment and converted to an observed mixing ratio of 126 ppb. Average wind speed levels were set starting at 0.1 m s−1 and then matching the upper limits of the Beaufort scale, ranging from calm to gentle breeze. They were capped at 4 m s−1, since that is the upper limit for which the DTM was calibrated (Pacholski et al., 2006). In addition, the temperature was kept constant at 20 °C, and the air pressure was kept at 1013 hPa. The calibrated DTM flux rate FDTM (in kg N ha−1) was calculated according to Pacholski et al. (2006) as follows:
where “volume” is the air volume sucked through the chambers, in this case 5 L; “|conc.| × 10−9” is the mixing ratio of NH3 (in ppb) as was displayed in the Dräger Tubes, in this case 630 ppb for 5 L; is the temperature-dependent density of NH3 at 20 °C (in kg L−1); UN is the molecular weight conversion factor of NH3 to N; UF is the surface area conversion factor from the chamber surface area of 415 cm−2 to hectare (ha); and UZ is the time conversion factor from seconds to days. Finally, the calibrated flux rate Fcal was calculated by incorporating wind speed ν according to the following equation:
Table 4Detection limit of daily NH3 fluxes at different wind speed levels, assuming a constant wind speed throughout the day and a mixing ratio detection limit of 175 ppb.
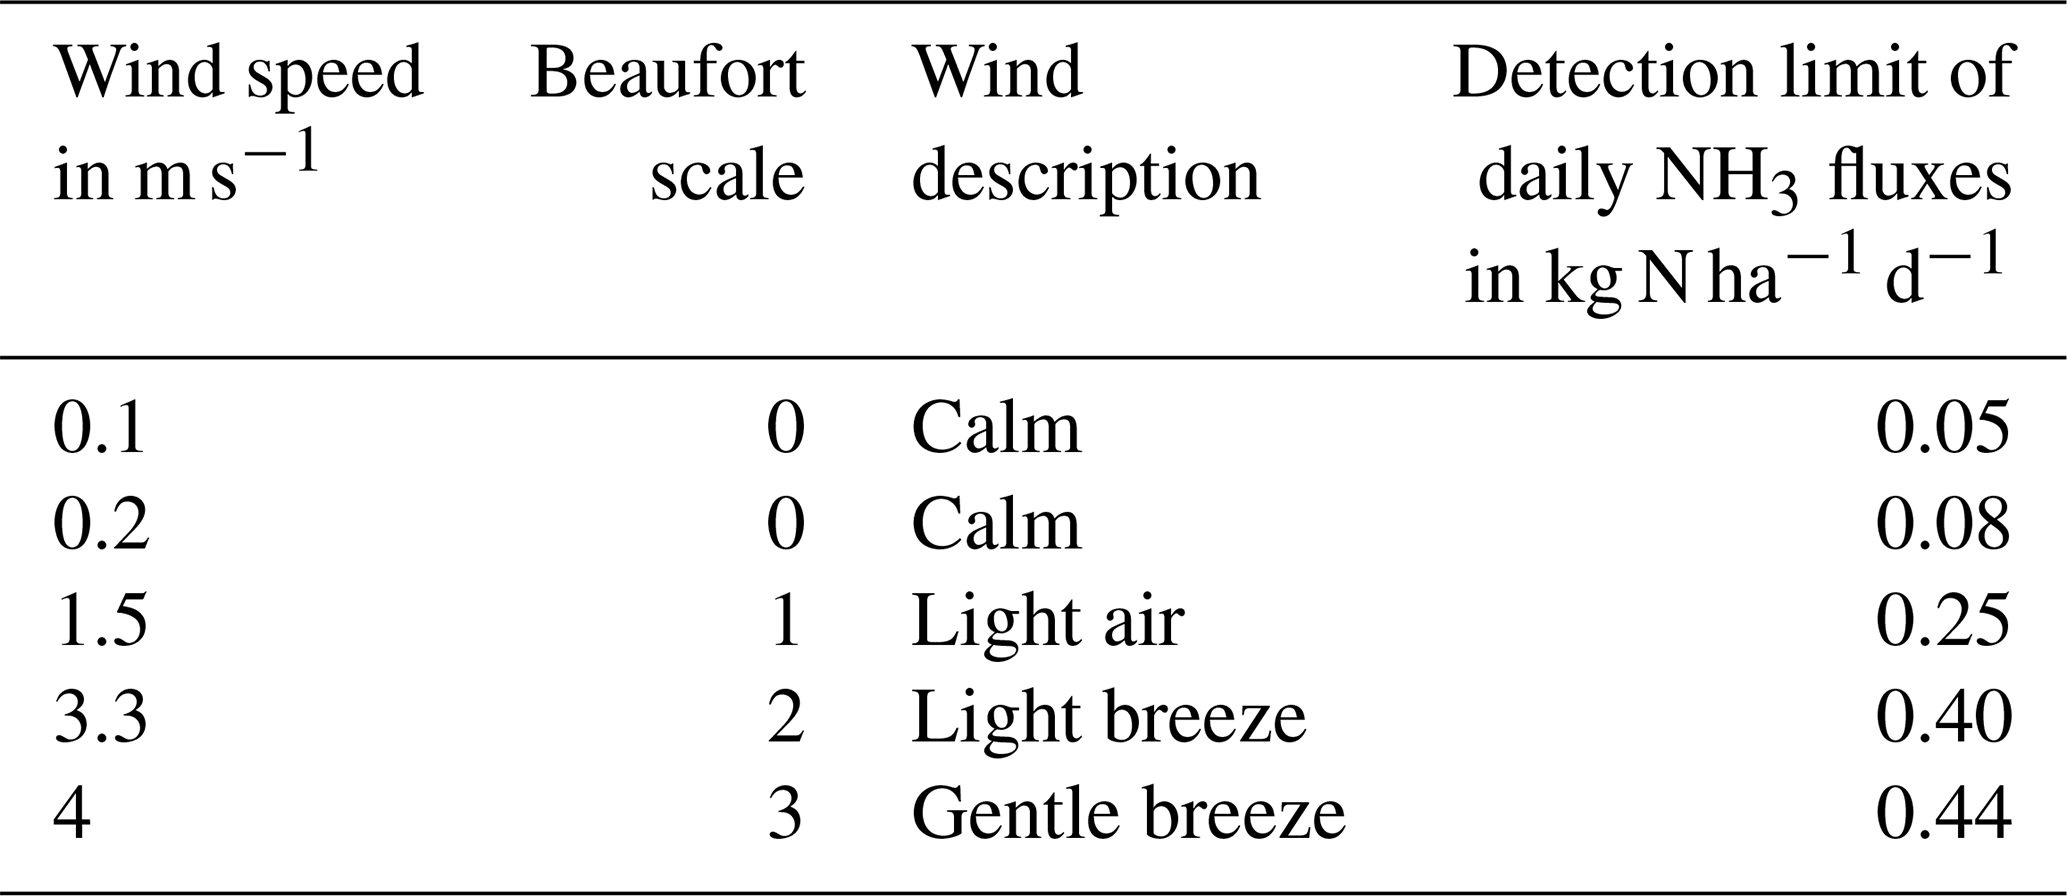
It can be seen that a detection limit of 175 ppb could lead to a detection limit of daily NH3 fluxes of 0.05–0.44 kg N ha−1 d−1. If these numbers were applied to an emission factor of 15 % for urea (Asman, 1992) and an application rate of 60 kg N ha−1, it would lead to a daily flux error of between 0.06 % and 4.8 % in relation to the application rate. If, on the other hand, these figures were applied to a fertilizer with a low NH3 emission factor, such as calcium ammonium sulfate with an emission factor of 2 % (Asman, 1992), this would lead to a daily flux error of between 6 % and 36.7 % in relation to an application rate of 60 kg N ha−1. Pacholski et al. (2006) previously determined a mean relative error of 17 ± 5 % for NH3 losses using the calibrated DTM. Undetectable NH3 fluxes due to the less sensitive detection limit would, however, result in a higher mean relative error than previously assumed. Daily underestimation of NH3 fluxes while using fertilizer with an emission factor of 15 % and average wind speeds of 1.5 m s−1 would exceed the mean relative error of 17 ± 5 % for NH3 losses after 6 d. Daily underestimation of NH3 fluxes while using fertilizer with an emission factor of 2 %, on the other hand, and average wind speeds of 1.5 m s−1 would exceed the mean relative error of 17 ± 5 % for NH3 losses after just 1 d. The use of the calibrated DTM should therefore only be considered if other measurement alternatives are not feasible and if high NH3 fluxes are to be expected during the entire measurement campaign. Therefore, when combined with passive samplers, it was recommended to use the calibrated DTM with a high emission source for measurements of absolute emissions (Pacholski, 2016). In a recent comparative study by Kamp et al. (2024), the calibrated DTM also underestimated emissions compared to micrometeorological measurements while wind tunnel measurements tended to depend on the air exchange rate. Between micrometeorological methods, final emission varied by 30 %. The error evaluation in Table 4 assumes the calibration is accurate and unbiased. To fully validate this approach, the calibration itself must also be tested. Since the calibration heavily depends on accurate wind speed measurements, any inaccuracies could introduce additional bias to the NH3 readings. Moreover, the calibration equation may not be universally applicable to varying field conditions, including differences in soil types, fertilizer application methods, or environmental factors. Consequently, additional comparative measurements are required for a more comprehensive and conclusive assessment of the calibrated DTM.
In addition to the inherent measurement errors associated with the Dräger Tubes themselves, field implementation of the method introduces further sources of potential error. One significant limitation is the relatively small surface area of the chambers, which prevents the DTM from accounting for soil heterogeneity when estimating emissions over larger plots. Furthermore, the application of slurry or granular fertilizers may not be uniform across the plot, adding to variability. Another concern is the risk of missing diurnal variability in fluxes if sampling intervals are too infrequent. Pacholski (2016) recommends placing chambers on soil rings to minimize soil disturbance and to ensure precise application of fertilizers within the measured area. The area within the soil rings can be covered with a lid during fertilizer application and then manually fertilized with a precise amount. Measurements should be taken five times a day: early morning (shortly after sunrise), late morning, early afternoon, late afternoon and shortly before sunset. Whether larger chambers, a greater number of soil rings distributed across the plot or more frequent measurements would enhance the accuracy of the DTM in field conditions remains uncertain and requires further investigation.
4.2 Influence of tubing material and tubing temperature on NH3 response time
The response time was longest in both heated and unheated Synflex tubing for both increasing and decreasing NH3 mixing ratios. The response time was shortest in heated PTFE tubing, although we could not find a significant reduction in response time between heated and unheated tubing and between PTFE and PUR. Whitehead et al. (2008), on the other hand, was able to find a reduction in response time for heated PTFE tubing. However, they measured the response time at lower NH3 mixing ratios, a much shorter measurement interval of 300 s and with a quantum cascade laser absorption spectrometer, which has a resolution of up to 10 Hz, which might together contribute to the differences in results. The lower sample size of three might have also caused a possible false negative in the results. It was also difficult to keep NH3 levels constant between comparisons, but they did not differ by more than 20 %. On the other hand, Shah et al. (2006) could not find a significant difference in NH3 adsorption to other plastic tubing materials at air flow rates of 10 L min−1 either.
4.3 Chamber system modifications during outdoor measurements
In both the unchanged and PUR tubing chamber systems, the linear model of the DTM was able to predict QCLS measurements with the highest coefficient of determination, followed by PTFE coated chamber and finally by chambers wiped with ethanol. The unchanged chamber system also had the highest β coefficient out of the four trials, closely followed by PUR tubing, then PTFE coating, and finally wiping with ethanol. Continuing to use unchanged chamber systems is therefore the best choice out of the four options. While PUR tubing performed similarly to PTFE tubing and is less expensive, PTFE tubing is well known for its low water absorption and low permeability to gases and moisture vapor (Harper, 2000). The advantage of the lower cost of PUR is negligible in the case of the DTM as the total length of tubing does not exceed 3 m. However, it is recommended that the PTFE tubing be replaced periodically as degradation over time is known to increase response time and increase losses of gases such as H2O (Lee et al., 1991; Whitehead et al., 2008).
Wiping the inner surface of the chamber with ethanol reduced the performance of the chamber system. Dry wiping of the chamber surfaces is therefore preferred. The lower performance compared to the QCLS is likely due to the fact that the ethanol did not completely evaporate from the surface during the Dräger Tube measurements, while the ethanol from the chamber system used for the QCLS completely or mostly evaporated during the 30 min measuring period. The use of a PTFE sheet for the inner chamber surface also decreased the detection sensitivity. A halocarbon wax coating could be used instead of a PTFE film for future testing, as it was found that a halocarbon wax coating of a stainless-steel surface was able to improve the travel time of NH3 to a similar level as PTFE, even at lower temperatures (Yokelson et al., 2003). It is also worth exploring whether active passivation of the chamber surface and inner tubing surface with 1H,1H-perfluorooctylamine could similarly enhance the sensitivity of Dräger Tubes, since Roscioli et al. (2016) discovered a reduction in response time from 30 to 2 s of their dual quantum cascade laser instrument for 90 % NH3 recovery.
4.4 Potential future options for quantifying NH3 emissions in heterogeneous small plots without power supply
A similar method to the calibrated DTM that could be considered for the quantification of NH3 in heterogeneous small plots without power supply is the “dositube method” (van Andel et al., 2017). It uses an NH3 detector tube similar to the calibrated DTM but instead places the tube directly into a semi-open chamber and allows it to passively absorb the NH3 over a longer period of time. The advantages over the calibrated DTM would be less labor and a longer time-weighted average of NH3 loss. This would allow for detection of lower fluxes. The dositube method showed good agreement in NH3 loss estimates when compared to wind tunnel measurements but has not yet been validated with a micrometeorological or mass-balance method. The use of diffusive passive samplers, such as ALPHA samplers from the UK Centre for Ecology & Hydrology, in combination with a backward Lagrangian stochastic (bLs) model, presents a promising option for future NH3 flux measurements, provided there is experienced laboratory staff. Carozzi et al. (2013) reported that the uncertainty associated with ALPHA samplers combined with bLs was comparable to other direct flux measurement techniques. Furthermore, Pedersen et al. (2018) demonstrated that emission fluxes derived from ALPHA samplers and bLs were consistent with those obtained through classical mass-balance measurement methods.
This paper evaluated the detection accuracy, precision and sensitivity of the uncalibrated DTM NH3 measurements and explored potential chamber system improvements. It was found that the Dräger Tubes used for the uncalibrated DTM were underestimating the measured concentrations, had decreasing detection accuracy at lower mixing ratios and had higher detection limits in the range of 152–205 ppb than initially assumed. This conversely also has an influence on the NH3 flux detection limit of the calibrated DTM. The calibrated DTM is therefore unsuitable for measurements on low-NH3-emitting (acidic) soils, under low temperature conditions, with low-NH3-emitting N fertilizers such as calcium ammonium nitrate or fertilizers combined with inhibitors, or for experiments with low N application rates. However, the use of the calibrated DTM could still be considered in field experiments where high emissions are expected and other more reliable alternatives are not feasible. Unfortunately, there are no feasible alternatives for small-plot NH3 measurements yet. The development of similar chamber or easy-to-use measurement methods that are inexpensive, mobile and have a low detection limit is therefore encouraged. Methods like the dositube approach and the ALPHA sampler combined with the bLs model show promise as future options for NH3 flux measurements. However, they require further validation through experiments under diverse field conditions and in comparison with alternative measurement techniques. Detection accuracy, precision and sensitivity should be compared with high-precision real-time measurement techniques such as cavity ring-down spectroscopy or direct laser absorption spectroscopy. Further assessment of the DTM in comparison with a reference method also involving the calibration approach is desirable for a comprehensive and conclusive evaluation of this measurement approach.
This study also identified options that should be excluded or used in the development of a new chamber method. Dry wiping of the chambers should be preferred over the use of ethanol. The use of an external heating source in combination with PTFE could improve response times for NH3 measurements and could be implemented for outdoor use of open and dynamic chamber systems. However, the additional use of heating wires around the tubing would require careful preparation of the tubing and an additional portable power supply, which would complicate handling and limit the mobility of the chamber system.
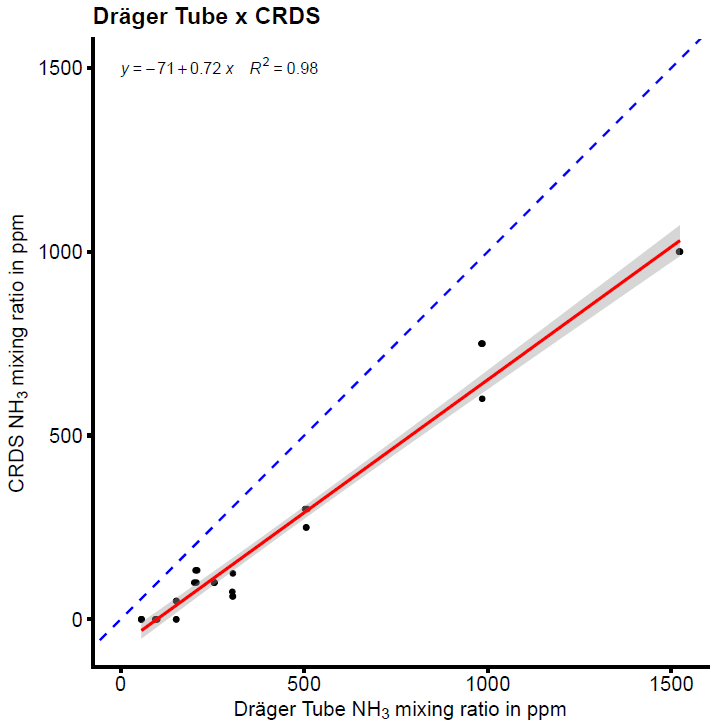
Figure A1Linear regression plot between Dräger Tube and CRDS NH3 measurements for Sect. 3.1.
All the data and R scripts used in this work can be accessed from https://doi.org/10.26165/JUELICH-DATA/0LAIFH (Kelsch, 2024).
AK, MC and NB designed the experiments, and AK and MC carried them out. AK wrote the first version of the manuscript, did the formal analysis and created the figures. MC installed and wrote the section on the laboratory setup, assisted with the QCLS measurements, and provided advice on the experimental design. NB gave advice on performing the experiment and the statistical analysis, formulated the research idea, acquired the funding, and helped with the planning and execution of the experiment. All authors reviewed and revised the manuscript.
The contact author has declared that none of the authors has any competing interests.
Publisher's note: Copernicus Publications remains neutral with regard to jurisdictional claims made in the text, published maps, institutional affiliations, or any other geographical representation in this paper. While Copernicus Publications makes every effort to include appropriate place names, the final responsibility lies with the authors.
We want to thank Muhammad Humza for their contribution to the execution of the experiments described in this paper. Their assistance was instrumental in the completion of this research. We also appreciate the anonymous reviewers for their insightful comments and suggestions, which have helped enhance the quality of this paper.
This research has been supported by the Landwirtschaftliche Rentenbank (grant no. 894820).
The article processing charges for this open-access publication were covered by the Forschungszentrum Jülich.
This paper was edited by Huilin Chen and reviewed by two anonymous referees.
Asman, W. A.: Ammonia emission in Europa: Upyeard emission and emission variations, Tech. rep., National Institute fo Public Health and Environmental Protection, http://hdl.handle.net/10029/258542 (last access: 25 June 2024), 1992. a, b
Behera, S. N., Sharma, M., Aneja, V. P., and Balasubramanian, R.: Ammonia in the Atmosphere: A Review on Emission Sources, Atmospheric Chemistry and Deposition on Terrestrial Bodies, Environ. Sci. Pollut. R., 20, 8092–8131, https://doi.org/10.1007/s11356-013-2051-9, 2013. a, b, c
Cameron, K., Di, H., and Moir, J.: Nitrogen losses from the soil/plant system: A review, Ann. Appl. Biol., 162, 145–173, https://doi.org/10.1111/aab.12014, 2013. a
Carozzi, M., Loubet, B., Acutis, M., Rana, G., and Ferrara, R. M.: Inverse Dispersion Modelling Highlights the Efficiency of Slurry Injection to Reduce Ammonia Losses by Agriculture in the Po Valley (Italy), Agr. Forest Meteorol., 171–172, 306–318, https://doi.org/10.1016/j.agrformet.2012.12.012, 2013. a
Dammers, E., McLinden, C. A., Griffin, D., Shephard, M. W., Van Der Graaf, S., Lutsch, E., Schaap, M., Gainairu-Matz, Y., Fioletov, V., Van Damme, M., Whitburn, S., Clarisse, L., Cady-Pereira, K., Clerbaux, C., Coheur, P. F., and Erisman, J. W.: NH3 emissions from large point sources derived from CrIS and IASI satellite observations, Atmos. Chem. Phys., 19, 12261–12293, https://doi.org/10.5194/acp-19-12261-2019, 2019. a
Di Perta, S. E., Fiorentino, N., Carozzi, M., Cervelli, E., and Pindozzi, S.: A Review of Chamber and Micrometeorological Methods to Quantify NH3 Emissions from Fertilisers Field Application, Int. J. Agron., 2020, 1–16, https://doi.org/10.1155/2020/8909784, 2020. a, b, c
Drägerwerk AG: Dräger-Tube Handbook – Soil, Water and Air Investigations as Well as Technical Gas Analysis, Tech. rep., Drägerwerk Aktiengesellschaft Lübeck, ISBN 3926762063, 2011. a, b, c
EU Directive: Directive (EU) 2016/2284 of the European Parliament and of the Council of 14 December 2016 on the reduction of national emissions of certain atmospheric pollutants, Publications Office of the European Union, https://eur-lex.europa.eu/eli/dir/2016/2284/oj (last access: 25 June 2024), 2016. a
European Environment Agency: European Union emission inventory report 1990–2021 under the UNECE convention on long-range transboundary air pollution (air convention), Tech. rep., Publications Office of the European Union, https://doi.org/10.2800/68478, 2023. a, b
Fogg, P. C.: Solubility of gases in liquids : A critical evaluation of gas/liquid systems in theory and practice, 1st edn., Wiley, ISBN 0471929255, 1991. a
Gericke, D., Pacholski, A., and Kage, H.: Measurement of Ammonia Emissions in Multi-Plot Field Experiments, Biosyst. Eng., 108, 164–173, https://doi.org/10.1016/j.biosystemseng.2010.11.009, 2011. a
Harper, C. A.: Modern plastics handbook, 1st edn., McGraw Hill Professional, ISBN 0070267146, 2000. a
Kamp, J. N., Hafner, S. D., Huijsmans, J., van Boheemen, K., Götze, H., Pacholski, A., and Pedersen, J.: Comparison of two micrometeorological and three enclosure methods for measuring ammonia emission after slurry application in two field experiments, Agr. Forest Meteorol., 354, 110077, https://doi.org/10.1016/j.agrformet.2024.110077, 2024. a, b, c
Kelsch, A.: Replication Data for: Accuracy and sensitivity of NH3 measurements using the Dräger Tube Method, V2, Jülich DATA [data set], https://doi.org/10.26165/JUELICH-DATA/0LAIFH, 2024. a
Lee, J. H., Chen, Y., and Tang, I. N.: Heterogeneous Loss of Gaseous H2O2 in an Atmospheric Air Sampling System, Environ. Sci. Technol., 25, 339–342, https://doi.org/10.1021/es00014a019, 1991. a
Lelieveld, J., Evans, J., Fnais, M., Giannadaki, D., and Pozzer, A.: The contribution of outdoor air pollution sources to premature mortality on a global scale, Nature, 525, 367–371, https://doi.org/10.1038/nature15371, 2015. a
Lim, S. S., Vos, T., Flaxman, A. D., Danaei, G., Shibuya, K., Adair-Rohani, H., AlMazroa, M. A., Amann, M., Anderson, H. R., Andrews, K. G., Aryee, M., Atkinson, C., Bacchus, L. J., Bahalim, A. N., Balakrishnan, K., Balmes, J., Barker-Collo, S., Baxter, A., Bell, M. L., Blore, J. D., Blyth, F., Bonner, C., Borges, G., Bourne, R., Boussinesq, M., Brauer, M., Brooks, P., Bruce, N. G., Brunekreef, B., Bryan-Hancock, C., Bucello, C., Buchbinder, R., Bull, F., Burnett, R. T., Byers, T. E., Calabria, B., Carapetis, J., Carnahan, E., Chafe, Z., Charlson, F., Chen, H., Chen, J. S., Cheng, A. T.-A., Child, J. C., Cohen, A., Colson, K. E., Cowie, B. C., Darby, S., Darling, S., Davis, A., Degenhardt, L., Dentener, F., Des Jarlais, D. C., Devries, K., Dherani, M., Ding, E. L., Dorsey, E. R., Driscoll, T., Edmond, K., Ali, S. E., Engell, R. E., Erwin, P. J., Fahimi, S., Falder, G., Farzadfar, F., Ferrari, A., Finucane, M. M., Flaxman, S., Fowkes, F. G. R., Freedman, G., Freeman, M. K., Gakidou, E., Ghosh, S., Giovannucci, E., Gmel, G., Graham, K., Grainger, R., Grant, B., Gunnell, D., Gutierrez, H. R., Hall, W., Hoek, H. W., Hogan, A., Hosgood III, H. D., Hoy, D., Hu, H., Hubbell, B. J., Hutchings, S. J., Ibeanusi, S. E., Jacklyn, G. L., Jasrasaria, R., Jonas, J. B., Kan, H., Kanis, J. A., Kassebaum, N., Kawakami, N., Khang, Y.-H., Khatibzadeh, S., Khoo, J.-P., Kok, C., Laden, F., Lalloo, R., Lan, Q., Lathlean, T., Leasher, J. L., Leigh, J., Li, Y., Lin, J. K., Lipshultz, S. E., London, S., Lozano, R., Lu, Y., Mak, J., Malekzadeh, R., Mallinger, L., Marcenes, W., March, L., Marks, R., Martin, R., McGale, P., McGrath, J., Mehta, S., Memish, Z. A., Mensah, G. A., Merriman, T. R., Micha, R., Michaud, C., Mishra, V., Hanafiah, K. M., Mokdad, A. A., Morawska, L., Mozaffarian, D., Murphy, T., Naghavi, M., Neal, B., Nelson, P. K., Nolla, J. M., Norman, R., Olives, C., Omer, S. B., Orchard, J., Osborne, R., Ostro, B., Page, A., Pandey, K. D., Parry, C. D. H., Passmore, E., Patra, J., Pearce, N., Pelizzari, P. M., Petzold, M., Phillips, M. R., Pope, D., Pope III, C. A., Powles, J., Rao, M., Razavi, H., Rehfuess, E. A., Rehm, J. T., Ritz, B., Rivara, F. P., Roberts, T., Robinson, C., Rodriguez-Portales, J. A., Romieu, I., Room, R., Rosenfeld, L. C., Roy, A., Rushton, L., Salomon, J. A., Sampson, U., Sanchez-Riera, L., Sanman, E., Sapkota, A., Seedat, S., Shi, P., Shield, K., Shivakoti, R., Singh, G. M., Sleet, D. A., Smith, E., Smith, K. R., Stapelberg, N. J. C., Steenland, K., Stöckl, H., Stovner, L. J., Straif, K., Straney, L., Thurston, G. D., Tran, J. H., Van Dingenen, R., van Donkelaar, A., Veerman, J. L., Vijayakumar, L., Weintraub, R., Weissman, M. M., White, R. A., Whiteford, H., Wiersma, S. T., Wilkinson, J. D., Williams, H. C., Williams, W., Wilson, N., Woolf, A. D., Yip, P., Zielinski, J. M., Lopez, A. D., Murray, C. J. L., and Ezzati, M.: A comparative risk assessment of burden of disease and injury attributable to 67 risk factors and risk factor clusters in 21 regions, 1990–2010: a systematic analysis for the Global Burden of Disease Study 2010, Lancet, 380, 2224–2260, https://doi.org/10.1016/S0140-6736(12)61766-8, 2012. a
Luo, Z., Zhang, Y., Chen, W., Van Damme, M., Coheur, P.-F., and Clarisse, L.: Estimating global ammonia (NH3) emissions based on IASI observations from 2008 to 2018, Atmos. Chem. Phys., 22, 10375–10388, https://doi.org/10.5194/acp-22-10375-2022, 2022. a
Martin, N., Ferracci, V., Cassidy, N., and Hoffnagle, J.: The application of a cavity ring-down spectrometer to measurements of ambient ammonia using traceable primary standard gas mixtures, Appl. Phys. B-Lasers O., 122, 1–11, https://doi.org/10.17863/CAM.1182, 2016. a
MIRO Analytical: Single Device for Monitoring of All Greenhouse Gases & Pollutants, Comparison with Other Methods, Tech. rep., MIRO Analytical AG, https://miro-analytical.com/resources/casestudies/case-studies-3/ (last access: 26 March 2025), 2021. a
Ni, K., Köster, J. R., Seidel, A., and Pacholski, A.: Field Measurement of Ammonia Emissions after Nitrogen Fertilization – A Comparison between Micrometeorological and Chamber Methods, Eur. J. Agron., 71, 115–122, https://doi.org/10.1016/j.eja.2015.09.004, 2015. a
Pacholski, A.: Calibrated passive sampling - Multi-plot field measurements of NH3 emissions with a combination of dynamic tube method and passive samplers, J. Vis. Exp., 109, 1–15, https://doi.org/10.3791/53273, 2016. a, b, c, d
Pacholski, A., Cai, G., Nieder, R., Richter, J., Fan, X., Zhu, Z., and Roelcke, M.: Calibration of a simple method for determining ammonia volatilization in the field – Comparative measurements in Henan Province, China, Nutr. Cycl. Agroecosys., 74, 259–273, https://doi.org/10.1007/s10705-006-9003-4, 2006. a, b, c, d, e, f, g, h, i, j, k
Pedersen, S., di Perta, E., Hafner, S., Pacholski, A., and Sommer, S.: Evaluation of a Simple, Small-Plot Meteorological Technique for Measurement of Ammonia Emission: Feasibility, Costs, and Recommendations, T. ASABE, 61, 103–115, https://doi.org/10.13031/trans.12445, 2018. a
Quakernack, R., Pacholski, A., Techow, A., Herrmann, A., Taube, F., and Kage, H.: Ammonia volatilization and yield response of energy crops after fertilization with biogas residues in a coastal marsh of Northern Germany, Agr. Ecosyst. Environ., 160, 66–74, https://doi.org/10.1016/j.agee.2011.05.030, 2012. a
Rees, R., Roelcke, M., Li, S., Wang, X., Li, S., Stockdale, E., McTaggart, I., Smith, K., and Richter, J.: The effect of fertilizer placement on nitrogen uptake and yield of wheat and maize in Chinese loess soils, Nutr. Cycl. Agroecosys., 47, 81–91, https://doi.org/10.1007/BF01985721, 1996. a
Rella, C. W.: SI2103 and SI2306: Traceable calibration of Ammonia (NH3), Tech. rep., Picarro, Inc., https://www.picarro.com/sites/default/files/2017-05/Traceable%20Calibration%20of%20Ammonia%20%28NH3%29_0.pdf (last access: 26 March 2025), 2017. a
Richter, J.: Zur Methodik des Bodengashaushaltes. II. Ergebnisse und Diskussion, Z. Pflanzenernähr. Bodenkd., 132, 220–239, https://doi.org/10.1002/jpln.19721320306, 1972. a
Roelcke, M.: Die Ammoniak-Volatilisation nach Ausbringung von Mineraldünger-Stickstoff in carbonatreichen chinesischen Löss-Ackerböden, PhD thesis, Institut für Pflanzenbau und Tierhygiene in den Tropen und Subtropen, University of Göttingen, ISBN 3884527487, 1994. a
Roelcke, M., Li, S., Tian, X., Gao, Y., and Richter, J.: In situ comparisons of ammonia volatilization from N fertilizers in Chinese loess soils, Nutr. Cycl. Agroecosys., 62, 73–88, https://doi.org/10.1023/A:1015186605419, 2002. a, b, c, d, e, f
Roscioli, J. R., Zahniser, M. S., Nelson, D. D., Herndon, S. C., and Kolb, C. E.: New Approaches to Measuring Sticky Molecules: Improvement of Instrumental Response Times Using Active Passivation, J. Phys. Chem. A, 120, 1347–1357, https://doi.org/10.1021/acs.jpca.5b04395, 2016. a
Rothman, L., Gordon, I., Babikov, Y., Barbe, A., Chris Benner, D., Bernath, P., Birk, M., Bizzocchi, L., Boudon, V., Brown, L., Campargue, A., Chance, K., Cohen, E., Coudert, L., Devi, V., Drouin, B., Fayt, A., Flaud, J.-M., Gamache, R., Harrison, J., Hartmann, J.-M., Hill, C., Hodges, J., Jacquemart, D., Jolly, A., Lamouroux, J., Le Roy, R., Li, G., Long, D., Lyulin, O., Mackie, C., Massie, S., Mikhailenko, S., Müller, H., Naumenko, O., Nikitin, A., Orphal, J., Perevalov, V., Perrin, A., Polovtseva, E., Richard, C., Smith, M., Starikova, E., Sung, K., Tashkun, S., Tennyson, J., Toon, G., Tyuterev, V., and Wagner, G.: The HITRAN2012 molecular spectroscopic database, J. Quant. Spectosc. Ra., 130, 4–50, https://doi.org/10.1016/j.jqsrt.2013.07.002, 2013. a
Shah, S. B., Grabow, G. L., and Westerman, P. W.: Ammonia adsorption in five types of flexible tubing materials, Appl. Eng. Agric., 22, 919–923, 2006. a, b
Sintermann, J., Neftel, A., Ammann, C., Häni, C., Hensen, A., Loubet, B., and Flechard, C. R.: Are ammonia emissions from field-applied slurry substantially over-estimated in European emission inventories?, Biogeosciences, 9, 1611–1632, https://doi.org/10.5194/bg-9-1611-2012, 2012. a
Svensson, L. and Ferm, M.: Mass Transfer Coefficient and Equilibrium Concentration as Key Factors in a New Approach to Estimate Ammonia Emission from Livestock Manure, J. Agr. Eng. Res., 56, 1–11, https://doi.org/10.1006/jaer.1993.1056, 1993. a
van Andel, M., Warland, J., Zwart, P., Van Heyst, B., and Lauzon, J.: Development of a simple and affordable method of measuring ammonia volatilization from land applied manures, Can. J. Soil Sci., 97, 541–551, https://doi.org/10.1139/cjss-2016-0103, 2017. a
Wang, J., Yin, Q., Tong, S., Ren, Z., Hu, M., and Zhang, H.: Prolonged continuous exposure to high fine particulate matter associated with cardiovascular and respiratory disease mortality in Beijing, China, Atmos. Environ., 168, 1–7, https://doi.org/10.1016/j.atmosenv.2017.08.060, 2017. a
Wang, Z.-H., Liu, X.-J., Ju, X.-T., Zhang, F.-S., and Malhi, S.: Ammonia volatilization loss from surface-broadcast urea: comparison of vented-and closed-chamber methods and loss in winter wheat–summer maize rotation in North China Plain, Commun. Soil Sci. Plan., 35, 2917–2939, 2004. a
Whitehead, J. D., Twigg, M., Famulari, D., Nemitz, E., Sutton, M. A., Gallagher, M. W., and Fowler, D.: Evaluation of laser absorption spectroscopic techniques for eddy covariance flux measurements of ammonia, Environ. Sci. Technol., 42, 2041–2046, https://doi.org/10.1021/es071596u, 2008. a, b
Yang, Y., Ni, X., Liu, B., Tao, L., Yu, L., Wang, Q., Yang, Y., Liu, J., and Wu, Y.: Measuring field ammonia emissions and canopy ammonia fluxes in agriculture using portable ammonia detector method, J. Clean. Prod., 216, 542–551, https://doi.org/10.1016/j.jclepro.2018.12.109, 2019. a
Yokelson, R. J., Christian, T. J., Bertschi, I. T., and Hao, W. M.: Evaluation of adsorption effects on measurements of ammonia, acetic acid, and methanol, J. Geophys. Res.-Atmos., 108, 1–9, https://doi.org/10.1029/2003JD003549, 2003. a, b
Yver Kwok, C., Laurent, O., Guemri, A., Philippon, C., Wastine, B., Rella, C. W., Vuillemin, C., Truong, F., Delmotte, M., Kazan, V., Darding, M., Lebègue, B., Kaiser, C., Xueref-Rémy, I., and Ramonet, M.: Comprehensive laboratory and field testing of cavity ring-down spectroscopy analyzers measuring H2O, CO2, CH4 and CO, Atmos. Meas. Tech., 8, 3867–3892, https://doi.org/10.5194/amt-8-3867-2015, 2015. a
Zhang, X., Gu, B., van Grinsven, H., Lam, S. K., Liang, X., Bai, M., and Chen, D.: Societal benefits of halving agricultural ammonia emissions in China far exceed the abatement costs, Nat. Commun., 11, 1–10, https://doi.org/10.1038/s41467-020-18196-z, 2020. a