the Creative Commons Attribution 4.0 License.
the Creative Commons Attribution 4.0 License.
Gravity waves above the northern Atlantic and Europe during streamer events using Aeolus
Lisa Küchelbacher
Franziska Trinkl
Michael Bittner
Information about the energy density of gravity waves (GWs) is crucial for improving atmosphere models. So far, most space-based studies report the potential energy, Epot, of GWs, as temperature measurements from satellites are more common.
We use Aeolus wind data to derive the kinetic energy density, Ekin, of GWs above the northern Atlantic and Europe. Assuming perfect instrument performance, this would be a lower limit for the kinetic energy density, as Aeolus only measures the horizontal line-of-sight wind. Aeolus, the European Space Agency's (ESA's) fourth Earth Explorer Mission, was the first Doppler wind lidar in space and measured vertical profiles of the horizontal line-of-sight wind from the ground to an altitude of ∼ 20–30 km between 2018 and 2023. With a vertical resolution of 0.25–2 km, Aeolus measurements are in principle well suited for the analysis of GWs. However, the data quality is a challenge for such analyses, as the error in the data is in the range of typical GW amplitudes in the troposphere and stratosphere.
In this study, we derive daily resolved time series of Ekin before, during, and after two streamer events above the northern Atlantic and Europe. Streamers are large-scale tongue-like structures of meridionally deflected air masses, which are caused by enhanced planetary wave activity. They are linked to vertical shear of horizontal wind and a pressure system, two possible GW generation mechanisms. We find that there is a temporal coincidence between the enhanced daily averaged Ekin and occurrence of the streamer events, which we identified in total column ozone measurements. The derivation of GW signals based on Aeolus data is possible, however: we collected about 100 profiles to statistically reduce the uncertainty in the daily averaged Ekin. Compared to non-satellite measurements, those daily averaged values are at the upper border.
- Article
(6112 KB) - Full-text XML
- BibTeX
- EndNote
Gravity waves (GWs) transport energy and momentum over large distances in the atmosphere without net mass transport. Primary GWs are mostly excited in the lower atmosphere (e.g. Fritts and Alexander, 2003; Pramitha et al., 2015, for a case study). Especially above 75 km in height, GWs dominate atmospheric dynamics through the deposition of energy and momentum, even though wave phenomena with larger periods and wavelengths exist in the atmosphere (Holton, 1982; Houghton, 2002). In the absence of background wind, energy and momentum are conserved quantities; if the background wind is not zero, the pseudo-energy and pseudo-momentum, which can be derived from the energy and some wave parameters, are conserved (Nappo, 2013). Deviations indicate regions in the atmosphere where GWs irreversibly influence temperature (through (pseudo-)energy deposition) and wind (through (pseudo-)momentum deposition) while they lead to reversible changes elsewhere. Therefore, two of the main questions when investigating GWs are how much (pseudo-)energy and (pseudo-)momentum are transported and where are they deposited. Answers to those questions and a proper parameterization are key to improving weather and climate models (Eichinger et al., 2020; Alexander et al., 2010).
Information about kinetic and potential energy is often provided as densities in the literature (e.g. Ern et al., 2018; Rauthe et al., 2008; Wüst et al., 2016), i.e. energy per unit mass (in J kg−1) or per unit volume (in J m−3). Those quantities are calculated as follows:
where represent the wind fluctuations due to GWs averaged over one phase, and
where g is the acceleration of gravity, N is the Brunt–Väisälä frequency, T′ is the temperature fluctuation, and the background temperature. The overbar denotes the average over one period or multiples of it. The pseudo-energy can be derived by multiplying the sum of the kinetic and potential energy density (per volume) by (Nappo, 2013), where is the intrinsic frequency (, with k and l as the zonal and meridional wavenumbers and u and v as the zonal and meridional background wind).
Information about the pseudo-momentum is usually provided in terms of the vertical flux of horizontal pseudo-momentum, which is
Fpx and Fpy are the zonal and meridional pseudo-momentum flux components, is the atmospheric background density, and f is the Coriolis parameter.
From Eqs. (1) to (3), it is apparent that an ideal GW satellite mission would measure both temperature and wind in three dimensions. The data would need to be decomposed into the background and GW-induced fluctuations. From the fluctuations, the wave vector and the period could be derived. However, for parts of the GW spectrum, Eq. (3) can be simplified to a version without wind information using linear polarization equations (Ern et al., 2018).
Temperature and wind have been measured by satellite for many years. However, temperature information is available much more frequently than wind measurements. A comprehensive overview of the past satellite-based wind missions in the upper mesosphere and lower thermosphere (UMLT) is given in the introduction of Dhadly et al. (2021). By the end of 2022, three wind missions were in orbit. They all use the Doppler principle to derive horizontal wind information, but they target different species and therefore different altitudes. Two systems are passive and use different airglow emissions, and only one is active. The two passive ones were MIGHTI (Michelson Interferometer for Global High-resolution Thermospheric Imaging) on the NASA Ionospheric Connection Explorer (ICON) mission and the TIMED Doppler Interferometer (TIDI; Niciejewski et al., 2006) on the Thermosphere Ionosphere Mesosphere Energetics and Dynamics (TIMED) satellite. MIGHTI delivered vertical profiles of the horizontal wind (height ranges vary from 90–300 km during the day to 90–105 and 200–300 km at night) from 2019 until the end of 2022. It used a Doppler asymmetric spatial heterodyne spectrometer, which measures the Doppler shift in the oxygen red and green airglow lines at 630.0 and 557.7 nm (Englert et al., 2017). TIDI started its operation more than 20 years ago in 2002. It uses a Fabry–Pérot interferometer to measure the Doppler shift in individual emission features of the O2 (0,0) airglow band. From these shifts, horizontal winds between 70 and 120 km during the day and between 80 and 105 km at night can be derived (Dhadly et al., 2021). Aeolus (Tan et al., 2008), the European Space Agency's (ESA's) fourth Earth Explorer Mission, was an active mission and the first Doppler wind lidar in space. Starting in 2018, it measured vertical profiles of the horizontal line-of-sight (hlos) wind from the ground to the lower stratosphere (20–30 km) (Reitebuch et al., 2020; Tan et al., 2008). It carried the Atmospheric LAser Doppler INstrument (ALADIN), which emitted in the UV range (354.8 nm). The Doppler shift in the backscattered radiation (Rayleigh and Mie) was analysed. Aeolus stopped operation on 30 April 2023 (https://www.eumetsat.int/end-nominal-aeolus-mission-operations, last access: 3 July 2023).
Aeolus wind measurements in principle enable the global derivation of the kinetic energy density, Ekin. These data have a vertical resolution of 0.25–2 km, which is well-suited for the analysis of GWs. In the upper troposphere and lower stratosphere (UTLS), GWs typically show amplitudes of 5–10 m s−1 at maximum (e.g. Dutta et al., 2017; Kramer et al., 2015). One challenge is the error (especially the precision since it still influences the detrended data in contrast to the bias) of Aeolus, which is higher than originally planned for and is now on the same order of magnitude as typical GW fluctuations.
This study concentrates on specific dynamical situations, called streamers, in the upper troposphere and lower stratosphere. Streamers are large-scale tongue-like structures of meridionally deflected air masses (Hocke et al., 2017; Krüger et al., 2005; Offermann et al., 1999); they are linked to enhanced or breaking planetary waves (PWs). PWs are associated with the formation of pressure systems and influence the position of the tropospheric jet. Enhanced or breaking PWs lead to strong shears of the horizontal wind. Pressure systems, wind shears, and the jet are possible sources of GWs (e.g. Plougonven and Zhang, 2014; Zülicke and Peters, 2008; Fritts and Nastrom, 1992).
On a case study basis, we investigate whether enhanced daily averaged Ekin can be observed during two pronounced streamer events above the Atlantic in February and November 2020, based on Aeolus measurements. The streamer events were identified in auxiliary data, namely satellite-based total column ozone measurements. Of all the space-based wind sensors listed above, Aeolus is the only one that addresses a prominent region where streamers exist and therefore the region of potential GW generation. The others measure too high up in the atmosphere. Aeolus is therefore the only satellite-based sensor that allows the analysis of Ekin in relation to streamers in the height region where GWs are likely to be generated. In this case, Aeolus is also superior to ground-based and balloon-based wind measurements, as these are generally not carried out over the Atlantic, one of the regions where streamers preferentially form. As mentioned above, satellite-based vertical temperature profiles have been available in the correct geographical region and at a suitable height for many years. They allow for the investigation of the potential energy density of gravity waves. However, the ratio of horizontal or vertical kinetic energy density to the potential energy density depends on the vertical orientation of the gravity wave and therefore on its intrinsic frequency, which cannot be deduced from satellite-based data or at least can only under very specific circumstances (e.g. by the phase difference method). The use of wind data can therefore not be avoided when Ekin is to be calculated.
The paper is structured as follows. The selection and identification of the streamer events that were analysed with respect to GWs are given in Sect. 2. Section 3 comprises a description of the data basis, which consists of Aeolus wind data. In Sect. 4, we explain the Aeolus data that we accepted for analysis and how we extracted GW signatures and calculated Ekin, as well as its error. In Sect. 5, the temporal evolution of Ekin is presented before, during, and after two pronounced streamer events. In Sect. 6, the results are discussed. The paper ends with a summary and conclusion (Sect. 7).
As mentioned in the introduction, we focus on streamer events as a generation mechanism for GWs (at their flanks due to strong wind shear but also convective GWs, as a streamer event is linked to a strong pressure system). When using the term “streamer”, one has to provide some further information since this expression is not uniquely defined, as pointed out by Krüger et al. (2005) in their introduction. Those authors provide a comprehensive overview of the research on streamers, their effect on mixing, the different definitions, etc. We refer here to large-scale tongue-like structures of meridionally deflected air masses as described by Offermann et al. (1999).
Those streamer events can be separated into tropical–subtropical streamers, which transport air from low latitudes into the midlatitudes, and polar vortex streamers leading to a mixing of polar air in the midlatitudes. Krüger et al. (2005) published a climatology of both streamer types based on 10-year model runs: these events mainly occur during October and May (in the Northern Hemisphere) over eastern Asia and the Atlantic.
Streamers can be traced by ozone, as it has a comparatively long lifetime in the lower stratosphere. The reason for streamer events is planetary waves, which are the main drivers of the extratropical circulation. They lead to an irreversible mixing of air masses between the equatorial and polar regions (e.g. McIntyre and Palmer, 1983; Polvani and Plumb, 1992). Normally, streamers can be observed for some days.
Our identification of streamer events is based on global maps of total ozone column measurements (TO3), which are available as a service by the German Aerospace Center (DLR; https://atmos.eoc.dlr.de/app/calendar, last access: 28 May 2024). TO3 is retrieved by the Tropospheric Monitoring Instrument (TROPOMI) on the Sentinel-5 Precursor (S5P) satellite. Whenever no data from TROPOMI/S5P are available, TO3 measurements from the Global Ozone Monitoring Experiment-2 (GOME-2) on the MetOp series of satellites are considered. The instruments are nadir-viewing on a near-polar sun-synchronous orbit. TROPOMI/S5P was launched in 2017 and has a spatial resolution of 7 × 7 km2, with daily global coverage and a repeat cycle of 17 d (Veefkind et al., 2012). Details on TO3 from TROPOMI/S5P are given by Spurr et al. (2022). The TO3 retrieval is based on the processor of the previous GOME instrument, GOME-2 on MetOp-A, which was launched in 2006 (MetOp-B in 2012). It has a spatial resolution of 80 × 40 km2 and almost-daily global coverage, with a repeat cycle of 29 d. See Munro et al. (2006) and Munro et al. (2016) for an overview of the instrument and data processing. Details of the GOME-2 retrieval algorithm can be found in Loyola et al. (2011).
In this study, we focus on tropical–subtropical streamers over the northern Atlantic. The events are identified manually by considering the daily TO3 global maps from January 2020 to March 2021. We found three events (approximately 6–11 February, 4–8 September, and 1–8 November 2020) that are, from our perspective, the strongest in their evolution; i.e. they have a comparably large spatial size and high intensity (low-TO3 concentration), the TO3 low air masses are irreversibly mixed into the surrounding atmosphere (cut-off), and they can be clearly distinguished from other dynamical mixing and vortices.
Figure 1 shows a streamer event over the northern Atlantic in November 2020. The flanks are relatively parallel to the longitudes, so it has a strong meridional structure. It reaches latitudes of 70° N. A smaller streamer (which is not considered in this study) can be detected over western North America. There are also ozone-poor air masses above eastern Europe.
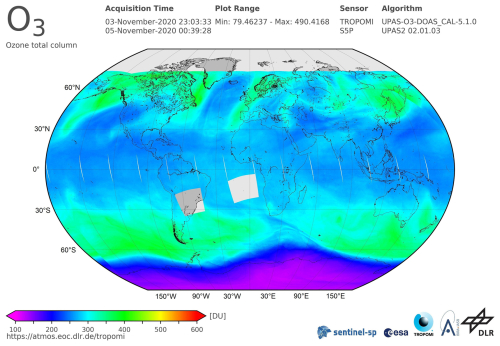
Figure 1The TO3 measurements taken by TROPOMI/S5P on 4 November 2020, indicating a large-streamer event. The starting date cannot be clearly specified due to data gaps. On 1 November a slight signature was already visible above the eastern coast of North America. The streamer moved eastward with time. It was most pronounced above the northern Atlantic on 4 November. On 8 November, it was not visible any more. These data/products were generated under the auspices of the AC SAF (Satellite Application Facility on Atmospheric Composition Monitoring) project of the EUMETSAT. The image is provided by DLR (https://atmos.eoc.dlr.de/app/calendar, last access: 28 May 2024) under CC-BY 3.0, and the authors made slight changes (moved the colour bar downward, enlarged the latitude and longitude labels).
Figure 2 shows a streamer event over the northern Atlantic in February 2020. It is characterized by a diagonal spatial extent from the Sargasso Sea in the south-west to the southern parts of Ireland in the north-east at approximately 50° N. Compared to the streamer in November 2020, this one stands out more from its surroundings. This is due to the fact that the ozone content of the surrounding air is higher in February 2020 than in November 2020, while the ozone concentration within the streamer is roughly the same.
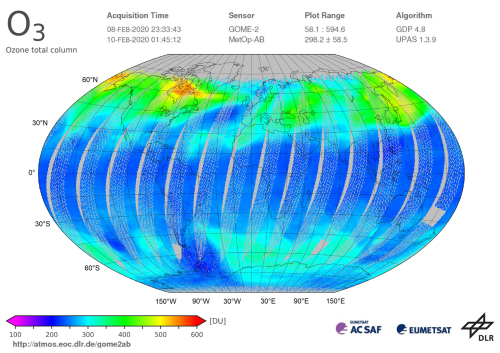
Figure 2The TO3 measurements taken by GOME-2/MetOp-A and B on 9 February 2020, indicating a large-streamer event. It started to evolve on 6 February off the eastern coast of North America and moved eastward with time. It was most pronounced above the northern Atlantic on 9 February. On 12 February, it was not visible any more. These data/products were generated under the auspices of the AC SAF project of the EUMETSAT, and image processing was done by the authors analogously to Fig. 1.
The streamer observed in September 2020 is not shown here, as the Aeolus data coverage is not good enough for further analysis (see also Sect. 3).
Detailed information about the Aeolus instrument is given on the ESA home page: https://www.esa.int/Applications/Observing_the_Earth/FutureEO/Aeolus/Documents_publications (last access: 16 September 2022). Here, only the very basics are summarized. Aeolus was launched on 22 August 2018. It carried a Doppler wind lidar (ALADIN, Atmospheric LAser Doppler INstrument), which emitted in the UV range (354.8 nm). The backscattered radiation was collected by a telescope, and its Doppler shift was derived and analysed. Aeolus measured both Rayleigh and Mie backscattering. The first one originates from molecules and the second one from particles.
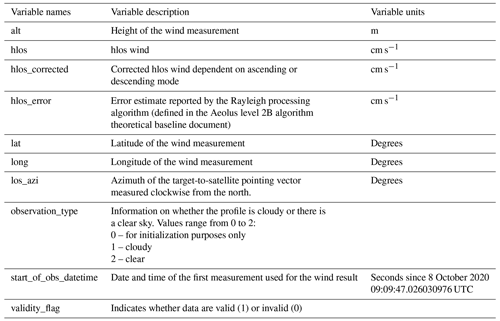
Aeolus data are provided as dbl (data block) files from ESA. They contain, among other information, vertical profiles of the hlos (horizontal line of sight) wind velocity. We downloaded the level 2B (L2B) data and added a variable that contains the hlos wind corrected for the satellite observation geometry (more information below). We selected the variables that we needed for our analyses using the CODA software in Python (https://atmospherictoolbox.org/coda/, last access: 26 February 2021 and https://github.com/stcorp/codadef-aeolus/releases/tag/20231201, last access: 26 February 2021). Finally, we converted everything to netCDF files. The list of the variables in the netCDF files is given in Table 1.
In the following, we explain how we did the correction of the wind for the satellite geometry. Firstly, a correction of the sign of the wind measurements is necessary, since the hlos wind is given relative to the satellite. Therefore, distinguishing between the ascending and descending modes is necessary to provide the hlos wind independent of the satellite observation geometry. Information about the horizontal orientation of the satellite relative to the target in degrees is provided by the variable los_azimuth: the target is in the centre of the coordinate system, and the azimuth is the angle between the vector pointing from the target to the north and the vector pointing from the target to the satellite. If this angle is larger than 180°, the satellite is west of the target. Since the instrument looks to the right side of the satellite with respect to the flight direction, the satellite is in this case in its ascending orbit branch and vice versa. hlos has a positive sign if the wind blows away from the instrument and vice versa. A positive hlos wind is a wind to the east in the ascending branch and to the west in the descending branch. So, in order to become independent of the satellite observation geometry and follow the conventions of atmospheric physics (a wind to the east has a positive sign and vice versa), the sign of the hlos wind must be changed if the azimuth angle is smaller than 180°.
hlos wind is available as four observational products: Rayleigh clear, Rayleigh cloudy, Mie clear, and Mie cloudy. For the Rayleigh wind measurements, which represent the majority of the wind measurements, 30 individual measurements are averaged; therefore, each hlos wind value is the horizontal average over 86.4 km (Martin et al., 2021). For our analyses, we used only Rayleigh clear wind measurements that were marked as valid (validity_flag variable equal to 1). Rayleigh clear and Mie cloudy winds have the best quality of the four different wind products. Even though Mie cloudy winds have smaller random errors than Rayleigh clear winds (Rennie et al., 2021), they are rare above the upper troposphere, especially as the stratosphere is very suitable for gravity wave analysis, as it is stably stratified. Therefore, Rayleigh clear winds are preferable to Mie cloudy winds for gravity wave analysis. According to the geographical position of the streamer events, which was discussed in the previous section, the spatial focus for the investigation of GWs in this paper is on 25–70° N and 45° W–20° E (see Fig. 3). For Aeolus, different processor baselines are available, which cover different observation periods. In this study, we used data referring to the year 2020; this is baseline 11 (2B11). A consistent reprocessed data set covering the whole Aeolus observation time was not available for the time of our calculations.
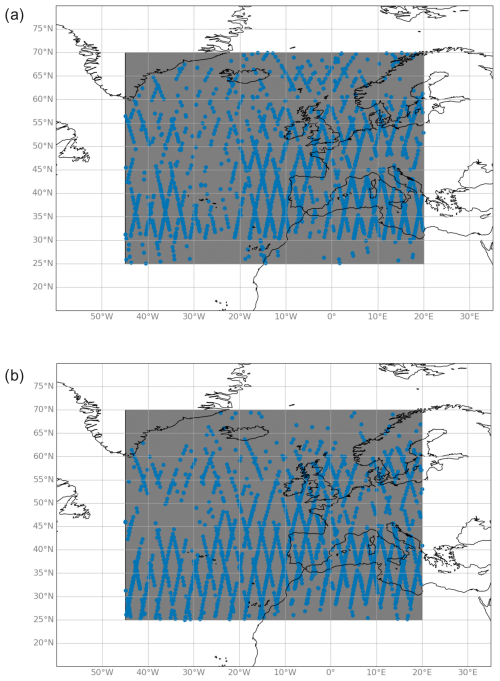
Figure 3Maps showing the region investigated for GWs and the geographical position of the vertical wind profiles of Aeolus used for the investigation of streamer 1, which was observed in this region from 3 to 7 November 2020 (a), and streamer 2, observed from 8 to 11 February 2020 (b). The blue dots refer to the positions of all profiles used to generate the time series shown in Figs. 8 and 9.
For our purposes, only the statistical error in the hlos wind (the precision) is of importance, as long as the systematic one (the bias) stays approximately constant with height, which we will explain later. Unfortunately, ESA does not provide information about the individual magnitudes of the different error types; only an integrated value (hlos_error; see Table 1) is given. Martin et al. (2021) separated this error into systematic and statistical errors. In their study, the authors used Rayleigh winds with an estimated error of 6 m s−1 at maximum; they refer to 2B02–2B07 (September 2018 until December 2019), thus to earlier baselines than we do. The absolute bias averaged over the analysed time period is ∼ 2 m s−1, but it depends on the data set used for validation and on the ascending or descending orbit (see Table 1 of Martin et al., 2021). To some extent, this is due to the six different processor baselines. Furthermore, there were several updates to the calibration files. The estimated Aeolus instrumental error is given as 4.0–4.4 m s−1 for Rayleigh winds (see Table 2 of Martin et al., 2021). It shows a temporal variation, which mainly depends on the laser output energy. Ratynski et al. (2023) compared Aeolus to radiosonde and ground-based lidar data during a longer time period (September 2018–January 2022, which means 2B02 to 2B13) than Martin et al. (2021) did but only at two stations. Furthermore, they did not apply any hlos error threshold. Those authors report an averaged systematic error of −0.92 and −0.79 m s−1 and a mean random error of 6.49 and 5.37 m s−1 for lidar and radiosondes, respectively. They state that the bias correction of the Aeolus data that took place around mid-April 2020 did not affect the random error. The random error depends on different factors, and the shot noise from the detection process of the signal photons is the dominant one (Rennie et al., 2021). The stronger the signal, the smaller the random error. The atmospheric signal depends on the laser pulse energy output and the optical efficiency of the transmit-and-receive path, the distance between the satellite and the target, and finally on the signal accumulation (Rennie et al., 2021). The first factor (laser pulse energy output and the optical efficiency of the transmit-and-receive path) varied during the mission, but as we are focussing here on relatively short time intervals, we assume that the influence is approximately constant. The second factor shows a geographical dependence. The atmospheric signal is indirectly proportional to the distance between the satellite and the target, and the distance has a minimum at the Equator but a maximum at the two poles. As our region of investigation is relatively large, ranging from 25 to 70° N, there will be some influence. The signal accumulation depends on the horizontal accumulation length and on the vertical thickness of the bins. The thickness of the bins varies over the profile. It has a minimum at ∼ 10 km and at the lower limit of the vertical profile (investigated for November 2020, 25–70° N, 0–20° E. We calculated the difference in the mean bin heights for bins 1–21). Nevertheless, one cannot say that the error shows a linear dependence on the thickness; in our case it shows a height dependence, being high at the lower part of the profile up to ∼ 6 km and approximately constant above. Further information about the Aeolus data, changes to this processing, and the error can be found in Rennie and Isaksen (2024).
Aeolus 2B data are delivered in 24 height bins. Data at high altitude levels are not available for each Aeolus profile; data at low altitudes suffer from slightly larger errors than other heights (investigated for November 2020, 25–70° N, 0–20° E). The histogram of the error in all height bins shows a structure with three maxima (see Fig. 4). From this plot, one can conclude that accepting an error larger than ∼ 4.5 m s−1 will not enlarge the data basis significantly. In order to find a compromise between profiles that are as long and as accurate as possible, we decided on two quality criteria: the profiles must cover all height bins (1–21, with height level 1 being the highest altitude), and the error has to be better than 4.5 m s−1 at each height bin.
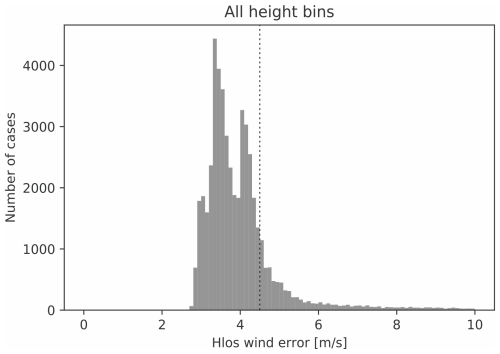
Figure 4The histogram for the whole of November 2020 shows a characteristic structure with three maxima at ∼ 2.9, 3.3, and 4.1 m s−1. None of the profiles in the investigated geographical area (25–70° N, 0–20° E) has a lower error than ∼ 2.7 m s−1. These values refer to all height bins (1–24). The vertical dashed line marks an error of 4.5 m s−1.
As mentioned above, three pronounced streamer events from January 2020 to March 2021 exist. In this study, the events in February and November 2020 are analysed. For the streamer in September 2020, there are not enough Aeolus data available to meet our quality criteria.
We rely here on cubic splines for the approximation of the atmospheric background: piecewise third-order polynomials that are stitched together at the spline sampling points following some mathematical specifications. A cubic spline is adapted individually to each vertical wind profile and subtracted from it. The residuals are analysed further.
The distance of the spline sampling points determines the sensitivity of the spline: according to the Nyquist sampling theorem, a signal with a vertical wavelength of x km must be sampled at least every 0.5 ⋅ x km in order to resolve it. Transferred to the spline, this means that a spline sampling point must be set every 0.5 ⋅ x km. An alternative formulation is a spline with sampling points every 0.5 ⋅ x km that is sensitive to wavelengths of x km or longer. The residuals include only signals with a vertical wavelength of x km at maximum.
Two main challenges for splines exist. The first one, which is common to all adaptation techniques, is the insufficient approximation of extrema in the background, e.g. the wind maximum in the tropopause. In this case, the spline is too smooth, and its subtraction from the original data leads to an artificial signature in the residuals. Secondly, a spline can generate artificial oscillations (at the beginning and the end of a vertical profile or also over the whole height range if the vertical wavelength to which the spline is sensitive is approximately equal to the vertical wavelength of the GW that is present in the data; see Wüst et al., 2017). These undesired effects are less pronounced when using the repeating spline approach; i.e. the profile is adapted by splines with the same distance between their sampling points but with varying starting points. Their mean is used as a final approximation. This approach is introduced and discussed for the derivation of GW signals in particular in Wüst et al. (2017). It is applied here.
The profiles chosen for the GW analysis due to our quality criteria have a length of approximately 16 km and a vertical resolution of ∼ 0.8–1.0 km. Therefore, the minimal vertical wavelength to which the spline is sensitive, and therefore the maximal vertical wavelength of the residuals, can range between ∼ 2 km (Nyquist criterion) and 16 km. Since GWs with a short vertical wavelength also have small amplitudes in most cases and since the error in Aeolus is relatively large for the investigation of GWs in the troposphere, the choice of 2 km as the maximal wavelength in the residuals will probably not deliver useful results. The same holds for the other extremum: the choice of a maximal wavelength of 16 km will lead to a coarse approximation of the tropopause wind extremum and therefore to relatively strong artificial signatures in the residuals at the tropopause height. That is why we decided on three different and more moderate maximal vertical wavelengths (5, 7.5, and 10 km). The splines are adapted, and the residuals are calculated. For the calculation of the density of kinetic energy Ekin, knowledge about 3D wind variations is necessary (see Eq. 1).
As mentioned above, Aeolus measures the line-of-sight wind. Due to the orientation of the instrument and the satellite orbit, this is to a large extent the zonal wind (this does not hold for polar latitudes; see Krisch et al., 2022). Using L2B data, one can, strictly speaking, only calculate a lower bound for Ekin. Ekin is derived for every height bin. Since the profiles cover different height ranges, Ekin is summed up and divided by the number of values. We call the result the mean Ekin. It has the unit J kg−1. The algorithm is sketched in Fig. 5. Based on this algorithm, maxima of mean Ekin over the area or time period defined at the beginning of the algorithm can be identified, thus showing the GW hotspots in place or time.
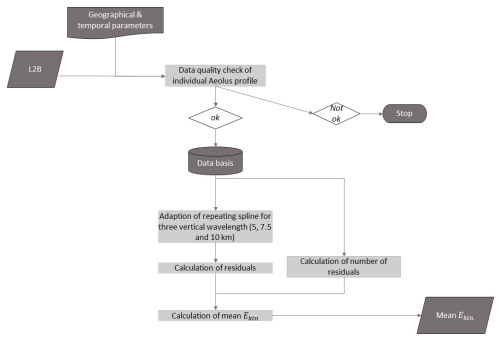
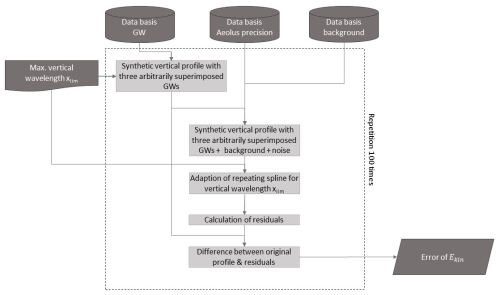
Figure 5Scheme of the algorithm for the derivation of the mean Ekin from Aeolus L2B wind measurements.
An important point in this context is the estimation of the error in Ekin. This can be done in a similar way to that already demonstrated by Kramer et al. (2016) in their Appendix A; they used a (non-repeating) cubic spline in order to derive GW signatures from radiosonde-based measurements in the lower stratosphere. Those authors generated a data basis with simulated GW signatures (five different starting amplitudes (0.5, 1.0,…, 2.5 K), five different values used to increase the amplitudes linearly with height (0.05, 0.01,…, 0.25) from 0 to 29.7 km in height, 13 different wavelengths (1.0, 1.5,…, 7 km), and eight different phases (, ,…, π)). They arbitrarily constructed five GWs, superimposed them on a realistic atmospheric background, and detrended the generated profiles with a spline sensitive to wavelengths of 7 km or longer. So, in principle this spline should be able to remove all GW signatures from the background. They repeated this approach about 1000 times, calculated the difference between the original background and the retrieved one, and derived the mean over these differences depending on height in order to estimate the error induced by the spline.
We do some adaptations for our error calculation; the algorithm is sketched in Fig. 6. Since the vertical resolution of Aeolus data is coarser compared to radiosondes and therefore fewer GWs are visible in Aeolus profiles, we superimpose only three oscillations with maximal wavelengths between 2.0 and 10 km. The height range we investigate covers 1–17 km, and the vertical resolution is 800 m. We assume that the amplitudes (here in m s−1 instead of K as in Kramer et al., 2016) can grow linearly between 0.05 and 1.95 over the height range. As shown later in Sect. 5 (see Fig. 7), this is a valid assumption overall. As background data, we use CIRA (COSPAR International Reference Atmosphere). Since the vertical resolution of CIRA is different to the vertical resolution of Aeolus, a spline is used to adapt the resolution of CIRA to the one of Aeolus. Since we not only are interested in the error due to the spline approximation but also would like to include the error in Aeolus, we add a value for the measurement uncertainty to the background and the superimposed GW signatures. We accept a maximal error of 4.5 m s−1. As mentioned above, Martin et al. (2021) showed for Aeolus data with an error of 6 m s−1 or better that approximately two-thirds of the error is due to random processes and approximately one-third can be attributed to bias. A systematic bias approximately constant with height is not important for the GW derivation since it will be taken out through the detrending procedure. We check the distribution of the Aeolus error with height for November 2020. Although it shows some height-dependent variation (in general lower in the lower part and higher in the upper), it cannot be modelled by a simple function such as a linear one. Therefore, we calculate the mean value over the height bins used (1–21), which is ∼ 3.7 m s−1, and its standard deviation (∼ 0.3 m s−1). Since we already use Aeolus data of relatively high quality, we make the conservative assumption that 1 m s−1 of the 3.7 m s−1 is caused by systematic effects and derive normally distributed values based on a mean of 2.7 m s−1 and the standard deviation mentioned above. For each height, the algorithm arbitrarily chooses the precision from the normally distributed values and the sign.
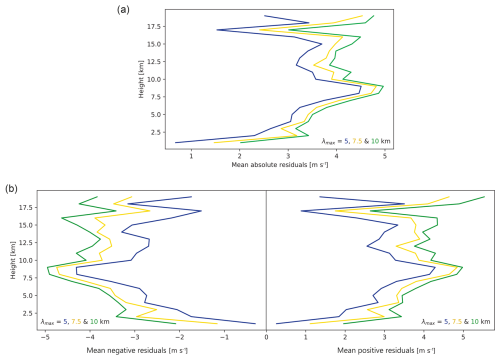
Figure 7Shown are the absolute residuals with their maximum vertical wavelengths λmax according to height (a) averaged over 15 October–29 November 2020 (2750 profiles). The colours refer to the different maximal vertical wavelengths (blue – 5 km; yellow – 7.5 km; and green – 10 km). The profiles originate from the geographical area shown in Fig. 3 (25–70° N, 45° W–20° E). Panel (b) splits the residuals into positive and negative ones.
Then, we detrend the profile using the repeating spline approach, which is sensitive to 10 km at minimum, and calculate the residuals, which we compare to the original GW signatures. We repeat this process 100 times for different latitudes (40, 50, and 60° N) and use these values in order to calculate the error for Ekin.
We start with the event in November 2020, which shows a more meridional structure than the streamer in February 2020 (see Sect. 2). The November streamer is referred to as streamer 1 in the following. Accordingly, the February streamer is denoted streamer 2.
Figure 7a shows the vertical profile of the absolute residuals averaged over time for different maximal vertical wavelengths (2750 profiles from 15 October to 29 November 2020, including the time of occurrence of streamer 1 as well as the approximately 2 to 3 weeks before and after the event). The values of up to 5 m s−1 are on the same order of magnitude as the values reported in the literature (e.g. by Kramer et al., 2015, or Nath et al., 2009). Both negative and positive residuals versus height (Fig. 7b) are highly symmetrical: this suggests that, at least on average, the detrending does not introduce strong biases.
However, two limitations can be seen in Fig. 7.
-
The first one is that the Aeolus error, which ranges between 2.8 and 4.5 m s−1, covers the range of the mean residuals. This makes individual Aeolus profiles challenging to use for GW analysis. So either only very pronounced events are investigated based on Aeolus data, such as what Banyard et al. (2021) showed for wind perturbations larger than 10 m s−1, or a larger number of profiles are collected and the mean residuals are analysed. In the latter case, instead of the individual error, the mean error in the averaged residuals can be used, which is a factor of smaller than the individual error. We rely on the latter solution here.
-
The second limitation is that a maximum in the vertical profile of the mean absolute residuals exists between 7.5 and 10 km in height. Even though the repeating spline performs better than the non-repeating one, we cannot excluded the possibility that we are seeing an artificial signature, which should not be interpreted as a GW signature. To exclude this effect of the wind maximum, the residuals are only analysed below 7 km (tropospheric part) and above 11 km (stratospheric part) in the following.
For Fig. 7, we calculated the temporal average and showed vertically resolved data. Now in Fig. 8, we do it the other way around: we focus on vertically averaged data (split into a tropospheric and a stratospheric part, as mentioned above) and show a time series with a daily resolution.
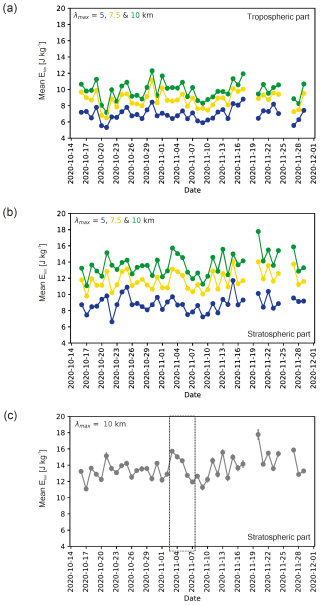
Figure 8Shown is development of the mean Ekin over time. While panel (a) refers to the tropospheric part, panels (b) and (c) depict the stratospheric part. The colour code is the same as in Fig. 7 (blue – 5 km; yellow – 7.5 km; and green – 10 km, the maximal vertical wavelength). Panel (c) shows only the time series for the maximal vertical wavelength of 10 km. Additionally, error bars are included and the time period of 3–7 November 2020, where the streamer was observable in TO3 measurements above the investigated region, is marked by the dotted lines.
Both the tropospheric and the stratospheric parts (Fig. 8a and b) are not characterized by a single pronounced maximum during mid-October to late November 2020, but there are a number of local maxima. Within the stratosphere or troposphere, the curves for the different wavelengths agree quite well. The agreement is slightly worse if, for example, the mean Ekin of GW with a 10 km maximal vertical wavelength of the stratosphere (Fig. 8a, green curve) is compared to the corresponding tropospheric curve (Fig. 8b, green curve).
The mean Ekin in the stratosphere shows a local maximum during 3 to 5 November for all vertical wavelengths, while this is not the case for the troposphere. The stratospheric maximum is less pronounced for a maximal vertical wavelength of 5 km. Figure 8c depicts only the maximum vertical wavelength of 10 km, this time shown with error bars. It is clear that the maximum during 3 to 5 November is significant.
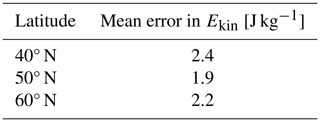
The values of the error bars come from the algorithm sketched in Fig. 6. The error analysis described there was done for different latitudes since the background wind (from CIRA) varies to some extent depending on the latitude. For Ekin derived from an individual profile, an error of 1.9–2.4 J kg−1, or 2.2 J kg−1 on average, can be expected (see Table 2). We use this mean value of 2.2 J kg−1 for the calculation of the error bars. Since our analysis relies on approximately 100 profiles per day, the mean error is approximately .
Table 2Provided is the error in Ekin for one individual profile based on 100 arbitrarily generated and detrended vertical GW profiles. The latitudinal dependence is in the range of 11 %.
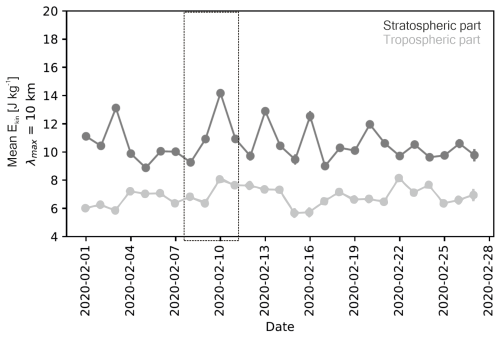
For streamer 2, the development of the mean Ekin is calculated from 1 to 28 February 2020 for a maximal vertical wavelength of 10 km and separated into the tropospheric and stratospheric parts (Fig. 9). Also in this case, both the tropospheric and the stratospheric Ekin are not characterized by a single maximum during the occurrence of the streamer but by a number of local maxima. The stratosphere shows a pronounced and significant maximum on 10 February. For the Ekin of the troposphere, this is not the case; here Ekin is high from 10 to 14 February.
GWs can be generated by a number of processes related to air experiencing vertical momentum (which can be up- or downward). Additionally, GWs can originate due to unstable shears or geostrophic adjustment (accompanying frontal evolution, for example), or they can be the result of an interaction between other GWs (Fritts and Alexander, 2003). Several of those processes occur at the same time as a streamer, such as vertical movements, wind shear, and fronts. GFS data (Global Forecast System) at 250 hPa, for example, show a strong anticyclone, which is linked to downward vertical movement in the centre near the position of the streamer in both cases investigated here (e.g. https://earth.nullschool.net/#2020/11/04/0600Z/wind/isobaric/250hPa/orthographic=-29.56,45.15,312 for streamer 1 and https://earth.nullschool.net/#2020/02/09/0600Z/wind/isobaric/250hPa/orthographic=-29.56,45.15,312 for streamer 2, last access: 27 May 2024). Additionally, strong vertical shear of the horizontal wind can be observed at different heights. Frontal activity is also present (https://www.wetterzentrale.de/reanalysis.php?jaar=2020&maand=11&dag=4&uur=000&var=45&map=1&model=dwd for streamer 1 and https://www.wetterzentrale.de/reanalysis.php?jaar=2020&maand=2&dag=9&uur=000&var=45&map=1&model=dwd for streamer 2, last access: 27 May 2024). As shown in the section above, we focus on data of the lower stratosphere, which is a stably stratified part of the atmosphere. Besides the vertical momentum of an air parcel, stable stratification of the surrounding atmosphere is the second prerequisite for the existence of GWs. So, in principle, it is not surprising to observe enhanced GW activity in the stratosphere during a streamer event. However, to our knowledge, such a study has not been published so far.
Additionally, we use Aeolus wind data here. As already mentioned before, the data quality of Aeolus is a challenge for the analysis of GWs when they are not very pronounced. While publications on the validation of Aeolus data exist (e.g. Khaykin et al., 2020; Ratynski et al., 2023; Witschas et al., 2022), to our knowledge only one article that focuses on the analysis of GWs from Aeolus data has been published: Banyard et al. (2021) presented a case study for GWs above the tip of South America using Aeolus data among other sources. There, the authors took advantage of a very pronounced GW event with an amplitude in the range of 10 m s−1, which is approximately twice as large as the averaged amplitude of the waves analysed in this case study (compare to Fig. 7, for example). As the error in the Aeolus data is in the range of these averaged amplitudes, the Aeolus data are not per se suitable for individual GW case studies. Focusing on pronounced events as Banyard et al. (2021) did or handling this challenge statistically by covering a large area (see Fig. 3) and collecting around 100 profiles per day as we do are two possibilities to make use of Aeolus data for GW analyses.
As already briefly mentioned at the beginning of Sect. 5, the mean residuals of the Aeolus measurements (see Fig. 7) are on the same order of magnitude as those reported for other measurements in the literature (e.g. Fig. 5 of Kramer et al., 2015; Figs. 4 and 6 of Nath et al., 2009; or Fig. 5 of Moffat-Griffin et al., 2017). However, it must be mentioned here that those literature values are mostly residuals of individual measurements or amplitudes of GWs from radiosonde-based measurements and non-averaged residuals. Thus, there might be a difference in the range of a small factor larger than 1. In comparison with the literature values for the density of kinetic energy, the values derived here appear somewhat high (compare Fig. 9 of Murphy et al., 2014, who mainly focus on vertical wavelengths of 2–3 km or shorter, for example, or Figs. 7 and 8 of Moffat-Griffin et al., 2017, who focus on vertical wavelengths of 13 km or shorter). Despite the same order of magnitude of the residuals, this is possible because quadratic residuals are used to calculate the kinetic energy density. Thus, small differences will be amplified nonlinearly. They could be the results of the relatively high Aeolus error, specifically if the error is due to low precision. However, there are some radiosonde stations that show the same order of magnitude for the density of kinetic energy (101 J kg−1) in their averaged values (see Figs. 4 and 5 of Yoshiki and Sato, 2000). Nevertheless, a conclusive comparison is difficult here. Firstly, the comparative measurements (radiosondes) are based on a different technique; i.e. they may address different volumes of air than Aeolus (mis-integration error). In addition, there is the movement of the measuring devices during the measurement and the different retrievals of the data. This can lead to different sensitivities with regard to GWs. Aeolus measures a horizontal line-of-sight velocity; this means that it is particularly sensitive to GWs whose air parcels oscillate horizontally (inertia and mid-frequency GWs) and parallel to the line of sight. Finally, the measurements were taken at different times and in different locations.
We find that Ekin shows local maxima while a streamer event was present in the geographical region investigated. Nevertheless, Ekin is not enhanced during the entire time period (8–11 February 2020 and 3–7 November 2020). This can be due to the position of the specific wave sources or to the direction of wave propagation, which can be oblique, for example. To investigate whether enhanced spatial resolution, at the cost of temporal resolution, could restrict the potential sources, we gridded the region with a resolution of 7.5° in latitude and 10° in longitude. This corresponds to roughly 800 km in each direction from the midpoint of the geographical region addressed. If a temporal resolution of 1 week is chosen, the values per pixel range between 2 and 76 (14–24 values on average per pixel, varying with the calendar week). Lower values would not be reasonable. The amount of Aeolus data of sufficient quality (as defined above) is not enough to provide maps that are free of gaps. Decreasing the spatial resolution to improve the pixel coverage is not useful for the purpose of identifying possible wave sources. Therefore, this approach is not followed further here.
Comparing Figs. 8c and 9b, it is noticeable that the structure of Fig. 9b looks more regular: maxima (of different heights) can be observed every 3–4 d. In Fig. 8c, the time interval between two successive maxima varies, and one dominating oscillation cannot be identified. As mentioned earlier, streamers are due to enhanced planetary waves, and streamers are not the only GW source. The dominance of the 3–4 d signature in the time series of Ekin during February 2020 suggests the conclusion that maxima of Ekin are due to pronounced travelling planetary waves with a period of 3–4 d and that other GW sources are less important during that time period. According to Forbes (1995), 3–4 d is typical of a travelling planetary wave with zonal wavenumber 2. So Fig. 9b might show a regular effect of a planetary wave 2 on the generation of GWs, and the streamer event identified in February 2020 might be due to the most pronounced activity of this planetary wave.
Here, it should also be stressed that only a part of the GW spectrum can be observed by Aeolus, as is the case for all instruments (e.g. Preusse et al., 2002; Wüst et al., 2016). Aeolus, as an off-nadir viewer (35° incidence angle), looks obliquely through the atmosphere and collects all information along the line of sight. GWs with phase fronts not oriented parallel to the line of sight are displayed as attenuated in the Aeolus data. Along the track, Aeolus averages over approximately 86 km (see Sect. 3); i.e. only GWs with (in our case) meridional wavelengths larger than 172 km can be detected in Aeolus data (Nyquist criterion). In conclusion, this underlines that Ekin is, strictly speaking, only a lower limit: this is due to the effects just mentioned and to the fact that the instrument measures only along the line of sight and therefore not the whole 3D wind vector. However, the low precision of the Aeolus measurements can lead to a significant high bias in the Ekin values derived.
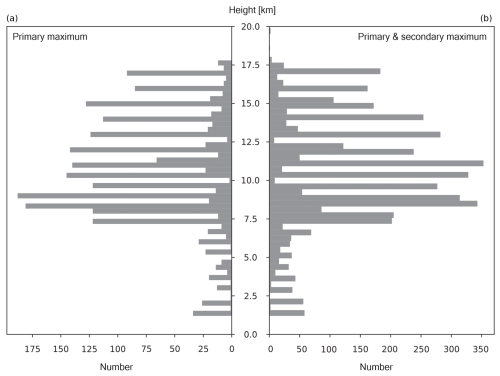
Finally, we come back to Fig. 7, which depicts the averaged absolute residuals according to height. When extracting GWs from vertical profiles (this includes not only wind but also other parameters such as temperature or ozone), it is unfortunately a common problem: not every signal in the residuals can necessarily be attributed to a GW. For individual profiles, this can be solved at least in part by checking the respective residual profiles for non-GW signals, so for signals that do not match the observed vertical wavelength. For a large number of profiles, some thousands as is the case here, this is only possible in part. In order to reduce the risk of signals in the residuals that are not attributable to GWs, it is helpful to exclude typical height regions that lead to the generation of “artificial” signals in the residuals. The most important areas here are the atmospheric pauses, in our case the tropopause. That is why we restricted the analysis to the height range below 7 km and above 11 km. Additionally, we used a method (repeating spline) that can reproduce strong deflections better than the classic spline method due to the variation in its starting points. However, we can neither exclude the possibility that we generate no artificial signals nor be sure that the maximum in the residuals at about 9 km in altitude (Fig. 7), which roughly corresponds to the height of the wind maximum, is an artefact. It could also have a physical explanation. GWs generated at lower altitudes increase in amplitude as they propagate to higher altitudes. A horizontal wind that also increases with height will filter the upward propagating GWs. Compared to lower altitudes, the greatest proportion of the upward propagating GWs will be filtered out at the height of the wind maximum. This means that it is possible that an increase in the average GW amplitude will be followed by a minimum. The same applies to the average residuals extracted from Aeolus. At higher altitudes, the decrease in air density can lead to an increase in the average GW amplitudes and therefore in the Aeolus residuals. Another possibility that could explain the increase in the averaged GW amplitudes is the generation of secondary GWs, the generation of GWs due to strong wind shear at the height of the wind maximum.
Figure 10a depicts the height of the primary wind maximum of each vertical wind profile used for the derivation of Ekin; panel (b) also includes the height of the secondary maximum. Both plots show lower numbers below 7 km in height and strongly enhanced values above. Critical-layer filtering will therefore mainly affect the height range above 7 km; below 7 km the GW can grow in amplitude. The latter can be observed in Fig. 7. The global maximum of the Aeolus wind profiles can indeed be found mainly at 8–9 km in height but also to a large part at higher altitudes. Arguing that the wind maximum is on average 8–9 km and that this leads to the maximum of the residuals at this height due to possible insufficient detrending might therefore be too conservative. Including the second-highest maximum as well does not change the overall view tremendously.
The question that we addressed in this paper was whether enhanced values of GW kinetic energy density estimates over the northern Atlantic and parts of Europe and Africa (25–70° N and 45° W–20° E) can be observed during the passage of two streamers, one in February and the other in November 2020, based on Aeolus data after the streamers had been identified in auxiliary data (total column ozone measurements).
Streamers, which are linked to several possible GW sources such as a pressure system, frontal activity, and wind shear, are due to enhanced planetary waves. They can be identified very well in TO3 maps from GOMOS or TROPOMI, for example. To the best of our knowledge, they have not been analysed in the context of GW sources.
Aeolus measurements allow the derivation of Ekin in the altitude regions where streamers are present. However, this is challenging, as the GW-induced wind variations, which we derived by applying a repeating spline, lie on the same order of magnitude as the error in Aeolus. We tried to handle this challenge statistically by covering a large area and collecting around 100 profiles per day. Comparison of this daily averaged Ekin with the literature shows that those values are at the upper border. This can be the result of the low precision of the Aeolus measurements, which emphasizes the need for validation campaigns to take place at the same time and in the same place and underlines the importance of specifying the systematic and random parts of an error.
In both streamer cases, we found significant local maxima in the daily resolved time series of Ekin in the lower stratosphere when the streamer passed the geographical region addressed. We also did a spatial analysis with a relatively coarse spatial resolution of 7.5° in latitude and 10° in longitude (roughly 800 km in each direction from the midpoint of the area addressed). In order to get a reasonable amount of data per pixel, we applied a temporal resolution of 1 week. However, this resolution is not good enough to get more precise information about the region of enhanced Ekin and therefore about the possible GW generation mechanism.
In this paper, we focused only on the kinetic energy; however, GWs transport not only kinetic energy but also potential energy. For low-frequency waves, the relation of the horizontal kinetic energy densities and the potential energy density, Ekin, h and Epot, is determined by
(Geller and Gong, 2010). In their Appendix B, Geller and Gong (2010) provide the abovementioned relation using the full GW dispersion relation. The authors state that the asymptotic behaviour of the equation above, based on the full dispersion relation and the dispersion relation for low-frequency waves, is similar. Since a succeeding mission for Aeolus is planned, which will also reach higher altitudes, information about Ekin, h might be available even higher up in future. For the calculation of Epot, vertical temperature profiles are needed. Those are currently available through TIMED-SABER or GPS radio occultation satellites, for example. Given that the wind and the temperature measurements address approximately the same air volume at the same time, which is not the case for TIMED-SABER and Aeolus in the vast majority of cases, can be estimated. is an important parameter for the calculation of further GW information such as the ratio of the vertical to the horizontal group velocity for low-frequency waves or the angle between lines of constant phase and the vertical for high-frequency waves, etc. In conclusion, it would be helpful for GW analyses if Aeolus were synchronized with a temperature mission.
The detrending algorithm is described in Wüst et al. (2017). The Aeolus data were downloaded from the ESA Aeolus Online Dissemination System (https://aeolus-ds.eo.esa.int/oads/access/, ESA, 2020).
This work was funded by two projects: LISA and WAVE. The first one was acquired by LK, SW, and MB, the second one by SW and MB. The streamer events were identified by FT and LK and checked by SW. The GW analyses were performed by SW. The paper was written by SW. All authors have read and agreed to the published version of the paper.
The contact author has declared that none of the authors has any competing interests.
Publisher’s note: Copernicus Publications remains neutral with regard to jurisdictional claims made in the text, published maps, institutional affiliations, or any other geographical representation in this paper. While Copernicus Publications makes every effort to include appropriate place names, the final responsibility lies with the authors.
The work of Sabine Wüst was funded by the European Space Agency, ESA (project LISA, ESA contract no. 4000133567/20/I-BG), and the Bavarian State Ministry for the Environment and Consumer Protection (WAVE, TKO01KPB-73893). The work of Lisa Küchelbacher was funded in part by the European Space Agency, ESA (project LISA).
We thank Oleg Goussev and Isabell Krisch (both from DLR) for their support concerning the Aeolus data download.
Finally, we would like to thank the anonymous reviewers for their valuable comments.
This research has been supported by the European Space Agency (grant no. 4000133567/20/I-BG) and the Bayerisches Staatsministerium für Umwelt und Verbraucherschutz (WAVE; grant no. TKO01KPB-73893).
The article processing charges for this open-access publication were covered by the German Aerospace Center (DLR).
This paper was edited by Gerd Baumgarten and reviewed by four anonymous referees.
Alexander, M. J., Geller, M., McLandress, C., Polavarapu, S., Preusse, P., Sassi, F., Eckermann, S., Ern, M., Hertzog, A., Kawatani, Y., Pulido, M., Shaw, T. A., Sigmond, M., Vincent, R., and Watanabe, S.: Recent developments in gravity-wave effects in climate models and the global distribution of gravity-wave momentum flux from observations and models, Q. J. Roy. Meteor. Soc., 136, 1103–1124, https://doi.org/10.1002/qj.637, 2010.
Banyard, T. P., Wright, C. J., Hindley, N. P., Halloran, G., Krisch, I., Kaifler, B., and Hoffmann, L.: Atmospheric gravity waves in Aeolus wind lidar observations, Geophys. Res. Lett., 48, e2021GL092756, https://doi.org/10.1029/2021GL092756, 2021.
Dhadly, M. S., Englert, C. R., Drob, D. P., Emmert, J. T., Niciejewski, R., and Zawdie, K. A.: Comparison of ICON/MIGHTI and TIMED/TIDI neutral wind measurements in the lower thermosphere, J. Geophys. Res.-Space, 126, e2021JA029904, https://doi.org/10.1029/2021JA029904, 2021.
Dutta, G., Vinay Kumar, P., and Mohammad, S.: Retrieving characteristics of inertia gravity wave parameters with least uncertainties using the hodograph method, Atmos. Chem. Phys., 17, 14811–14819, https://doi.org/10.5194/acp-17-14811-2017, 2017.
Eichinger, R., Garny, H., Šácha, P., Danker, J., Dietmüller, S., and Oberländer-Hayn, S.: Effects of missing gravity waves on stratospheric dynamics; part 1: climatology, Clim. Dynam., 54, 3165–3183, https://doi.org/10.1007/s00382-020-05166-w, 2020.
Englert, C. R., Harlander, J. M., Brown, C. M., Marr, K. D., Miller, I. J., Stump, J. E., Hancock, J., Peterson, J. Q., Kumler, J., Morrow, W. H., Mooney, T. A., Ellis, S., Mende, S. B., Harris, S. E., Stevens, M. H., Makela, J. J., Harding, B. J., and Immel, T. J.: Michelson Interferometer for Global High-Resolution Thermospheric Imaging (MIGHTI): Instrument Design and Calibration, Space Sci. Rev., 212, 553–584, https://doi.org/10.1007/s11214-017-0358-4, 2017.
Ern, M., Trinh, Q. T., Preusse, P., Gille, J. C., Mlynczak, M. G., Russell III, J. M., and Riese, M.: GRACILE: a comprehensive climatology of atmospheric gravity wave parameters based on satellite limb soundings, Earth Syst. Sci. Data, 10, 857–892, https://doi.org/10.5194/essd-10-857-2018, 2018.
ESA: Aeolus Online Dissemination System, https://aeolus-ds.eo.esa.int/oads/access/, last access: 1 December 2020.
Forbes, J. M.: Tidal and planetary waves, The upper mesosphere and lower thermosphere: A review of experiment and theory, in: Geophysical Monograph Series, edited by: Johnson, R. M. and Killeen, T. L., American Geophysical Union (AGU), 87, 67–87, https://doi.org/10.1029/GM087, 1995.
Fritts, D. C. and Alexander, M. J.: Gravity wave dynamics and effects in the middle atmosphere, Rev. Geophys., 41, 1003, https://doi.org/10.1029/2001RG000106, 2003.
Fritts, D. C. and Nastrom, G. D.: Sources of Mesoscale Variability of Gravity Waves. Part II: Frontal, Convective, and Jet Stream Excitation, J. Atmos. Sci., 49, 111–127, https://doi.org/10.1175/1520-0469(1992)049<0111:SOMVOG>2.0.CO;2, 1992.
Geller, M. A. and Gong, J.: Gravity wave kinetic, potential, and vertical fluctuation energies as indicators of different frequency gravity waves, J. Geophys. Res.-Atmos., 115, D11111, https://doi.org/10.1029/2009JD012266, 2010.
Hocke, K., Schranz, F., Maillard Barras, E., Moreira, L., and Kämpfer, N.: An Atlantic streamer in stratospheric ozone observations and SD-WACCM simulation data, Atmos. Chem. Phys., 17, 3445–3452, https://doi.org/10.5194/acp-17-3445-2017, 2017.
Holton, J. R.: The role of gravity wave induced drag and diffusion in the momentum budget of the mesosphere, J. Atmos. Sci., 39, 791–799, 1982.
Houghton, J.: The Physics of Atmospheres, Cambridge University Press, ISBN: 9780521011228, 2002.
Khaykin, S. M., Hauchecorne, A., Wing, R., Keckhut, P., Godin-Beekmann, S., Porteneuve, J., Mariscal, J.-F., and Schmitt, J.: Doppler lidar at Observatoire de Haute-Provence for wind profiling up to 75 km altitude: performance evaluation and observations, Atmos. Meas. Tech., 13, 1501–1516, https://doi.org/10.5194/amt-13-1501-2020, 2020.
Kramer, R., Wüst, S., Schmidt, C., and Bittner, M.: Gravity wave characteristics in the middle atmosphere during the CESAR campaign at Palma de Mallorca in 2011/2012: Impact of extratropical cyclones and cold fronts, J. Atmos. Sol.-Terr. Phy., 128, 8–23, https://doi.org/10.1016/j.jastp.2015.03.001, 2015.
Kramer, R., Wüst, S., and Bittner, M.: Investigation of gravity wave activity based on operational radiosonde data from 13 years (1997–2009): Climatology and possible induced variability, J. Atmos. Sol.-Terr. Phy., 140, 23–33, https://doi.org/10.1016/j.jastp.2016.01.014, 2016.
Krisch, I., Hindley, N. P., Reitebuch, O., and Wright, C. J.: On the derivation of zonal and meridional wind components from Aeolus horizontal line-of-sight wind, Atmos. Meas. Tech., 15, 3465–3479, https://doi.org/10.5194/amt-15-3465-2022, 2022.
Krüger, K., Langematz, U., Grenfell, J. L., and Labitzke, K.: Climatological features of stratospheric streamers in the FUB-CMAM with increased horizontal resolution, Atmos. Chem. Phys., 5, 547–562, https://doi.org/10.5194/acp-5-547-2005, 2005.
Loyola, D. G., Koukouli, M. E., Valks, P., Balis, D. S., Hao, N., Van Roozendael, M., Spurr, R. J. D., Zimmer, W., Kiemle, S. Lerot, C., and Lambert, J. C.: The GOME-2 total column ozone product: Retrieval algorithm and ground-based validation, J. Geophys. Res.-Atmos., 116, D07302, https://doi.org/10.1029/2010JD014675, 2011.
Martin, A., Weissmann, M., Reitebuch, O., Rennie, M., Geiß, A., and Cress, A.: Validation of Aeolus winds using radiosonde observations and numerical weather prediction model equivalents, Atmos. Meas. Tech., 14, 2167–2183, https://doi.org/10.5194/amt-14-2167-2021, 2021.
McIntyre, M. E. and Palmer, T. N.: Breaking planetary waves in the stratosphere, Nature, 305, 593–600, https://doi.org/10.1038/305593a0, 1983.
Moffat-Griffin, T., Wright, C. J., Moss, A. C., King, J. C., Colwell, S. R., Hughes, J. K., and Mitchell, N. J.: The South Georgia Wave Experiment (SG-WEX): Radiosonde observations of gravity waves in the lower stratosphere. Part I: Energy density, momentum flux and wave propagation direction, Q. J. Roy. Meteor. Soc., 143, 3279–3290, https://doi.org/10.1002/qj.3181, 2017.
Munro, R., Eisinger, M., Anderson, C., Callies, J., Corpaccioli, E., Lang, R., Lefebvre, A., Livschitz, Y., and Albinana, A. P.: GOME-2 on MetOp, in: Proceedings of the 2006 EUMETSAT Meteorological Satellite Conference, Helsinki, Finland, 12–16 June 2006, EUMETSAT, 1216, 48 pp., 2006.
Munro, R., Lang, R., Klaes, D., Poli, G., Retscher, C., Lindstrot, R., Huckle, R., Lacan, A., Grzegorski, M., Holdak, A., Kokhanovsky, A., Livschitz, J., and Eisinger, M.: The GOME-2 instrument on the Metop series of satellites: instrument design, calibration, and level 1 data processing – an overview, Atmos. Meas. Tech., 9, 1279–1301, https://doi.org/10.5194/amt-9-1279-2016, 2016.
Murphy, D. J., Alexander, S. P., Klekociuk, A. R., Love, P. T., and Vincent, R. A.: Radiosonde observations of gravity waves in the lower stratosphere over Davis, Antarctica, J. Geophys. Res.-Atmos., 119, 11973–11996, https://doi.org/10.1002/2014JD022448, 2014.
Nappo, C. J.: An Introduction to Atmospheric Gravity Waves, 2nd edn., Elsevier Science, Netherlands, ISBN: 978-0-12-385223-6, 2013.
Nath, D., Venkat Ratnam, M., Jagannadha Rao, V. V. M., Krishna Murthy, B. V., and Vijaya Bhaskara Rao, S.: Gravity wave characteristics observed over a tropical station using high-resolution GPS radiosonde soundings, J. Geophys. Res., 114, D06117, https://doi.org/10.1029/2008JD011056, 2009.
Niciejewski, R., Wu, Q., Skinner, W., Gell, D., Cooper, M., Marshall, A., Killeen, T., Solomon, S., and Ortland, D.: TIMED Doppler Interferometer on the Thermosphere Ionosphere Mesosphere Energetics and Dynamics satellite: Data product overview, J. Geophys. Res.-Space, 111, A11S90, https://doi.org/10.1029/2005JA011513, 2006.
Offermann, D., Grossmann, K.-U., Barthol, P., Knieling, P., Riese, M., and Trant, R.: Cryogenic Infrared Spectrometers and Telescopes for the Atmosphere (CRISTA) experiment and middle atmosphere variability, J. Geophys. Res.-Atmos., 104, 16311–16325, https://doi.org/10.1029/1998JD100047, 1999.
Plougonven, R. and Zhang, F.: Internal gravity waves from atmospheric jets and fronts, Rev. Geophys., 52, 33–76, https://doi.org/10.1002/2012RG000419, 2014.
Polvani, L. M. and Plumb, R. A.: Rossby wave breaking, microbreaking, filamentation, and secondary vortex formation: The dynamics of a perturbed vortex, J. Atmos. Sci., 49, 462–476, https://doi.org/10.1175/1520-0469(1992)049<0462:RWBMFA>2.0.CO;2, 1992.
Pramitha, M., Venkat Ratnam, M., Taori, A., Krishna Murthy, B. V., Pallamraju, D., and Vijaya Bhaskar Rao, S.: Evidence for tropospheric wind shear excitation of high-phase-speed gravity waves reaching the mesosphere using the ray-tracing technique, Atmos. Chem. Phys., 15, 2709–2721, https://doi.org/10.5194/acp-15-2709-2015, 2015.
Preusse, P., Dörnbrack, A., Eckermann, S. D., Riese, M., Schaeler, B., Bacmeister, J. T., Broutman, D., and Grossmann, K. U.: Space-based measurements of stratospheric mountain waves by CRISTA 1. Sensitivity, analysis method, and a case study, J. Geophys. Res.-Atmos., 107, CRI 6-1–CRI 6-23, https://doi.org/10.1029/2001JD000699, 2002.
Ratynski, M., Khaykin, S., Hauchecorne, A., Wing, R., Cammas, J.-P., Hello, Y., and Keckhut, P.: Validation of Aeolus wind profiles using ground-based lidar and radiosonde observations at Réunion island and the Observatoire de Haute-Provence, Atmos. Meas. Tech., 16, 997–1016, https://doi.org/10.5194/amt-16-997-2023, 2023.
Rauthe, M., Gerding, M., and Lübken, F.-J.: Seasonal changes in gravity wave activity measured by lidars at mid-latitudes, Atmos. Chem. Phys., 8, 6775–6787, https://doi.org/10.5194/acp-8-6775-2008, 2008.
Reitebuch, O., Lemmerz, C., Lux, O., Marksteiner, U., Rahm, S., Weiler, F., Witschas, B., Meringer, M., Schmidt, K., Huber, D., Nikolaus, I., Geiss, A., Vaughan, M., Dabas, A., Flament, T., Stieglitz, H., Isaksen, L., Rennie, M., Kloe, J. D., Marseille, G.-J., Stoffelen, A., Wernham, D., Kanitz, T., Straume, A.-G., Fehr, T., Bismarck, J. von, Floberghagen, R., and Parrinello, T.: Initial Assessment of the Performance of the First Wind Lidar in Space on Aeolus, EPJ Web Conf., 237, 1010, https://doi.org/10.1051/epjconf/202023701010, 2020.
Rennie, M. P. and Isaksen, L.: The NWP impact of Aeolus Level-2B winds at ECMWF, ESA Contract Report, 02/2024, https://doi.org/10.21957/d4ea1c09d4, 2024.
Rennie, M. P., Isaksen, L., Weiler, F., de Kloe, J., Kanitz, T., and Reitebuch, O.: The impact of Aeolus wind retrievals on ECMWF global weather forecasts, Q. J. Roy. Meteor. Soc., 147, 3555–3586, https://doi.org/10.1002/qj.4142, 2021.
Spurr, R., Loyola, D., Heue, K.-P., Van Roozendael, M., and Lerot, C.: S5P/TROPOMI Total Ozone ATBD, No. S5P-L2-DLR-ATBD-400A, https://sentinel.esa.int/documents/247904/2476257/Sentinel-5P-TROPOMI-ATBD-Total-Ozone (last access: 27 March 2025), 2022.
Tan, D. G. H., Andersson, E., Kloe, J. D., Marseille, G.-J., Stoffelen, A., Poli, P., Denneulin, M.-L., Dabas, A., Huber, D., Reitebuch, O., Flamant, P., Le Rille, O., and Nett, H.: The Aeolus wind retrieval algorithms, Tellus A, 60, 191–205, https://doi.org/10.1111/j.1600-0870.2007.00285.x, 2008.
Veefkind, J. P., Aben, I., McMullan, K., Förster, H., de Vries, J., Otter, G., Claas, J., Eskes, H. J., de Haan, J. F., Kleipool, Q., van Weele, M., Hasekamp, O., Hoogeveen, R., Landgraf, J., Snel, R., Tol, P., Ingmann, P., Voors, R., Kruizinga, B., Vink, R., Visser, H., and Levelt, P. F.: TROPOMI on the ESA Sentinel-5 Precursor: A GMES mission for global observations of the atmospheric composition for climate, air quality and ozone layer applications, Remote Sens. Environ., 120, 70–83, https://doi.org/10.1016/j.rse.2011.09.027, 2012.
Witschas, B., Lemmerz, C., Geiß, A., Lux, O., Marksteiner, U., Rahm, S., Reitebuch, O., Schäfler, A., and Weiler, F.: Validation of the Aeolus L2B wind product with airborne wind lidar measurements in the polar North Atlantic region and in the tropics, Atmos. Meas. Tech., 15, 7049–7070, https://doi.org/10.5194/amt-15-7049-2022, 2022.
Wüst, S., Wendt, V., Schmidt, C., Lichtenstern, S., Bittner, M., Yee, J.-H., Mlynczak, M. G., and Russell III, J. M.: Derivation of gravity wave potential energy density from NDMC measurements, J. Atmos. Sol.-Terr. Phy., 138, 32–46, https://doi.org/10.1016/j.jastp.2015.12.003, 2016.
Wüst, S., Wendt, V., Linz, R., and Bittner, M.: Smoothing data series by means of cubic splines: quality of approximation and introduction of a repeating spline approach, Atmos. Meas. Tech., 10, 3453–3462, https://doi.org/10.5194/amt-10-3453-2017, 2017.
Yoshiki, M. and Sato, K.: A statistical study of gravity waves in the polar regions based on operational radiosonde data, J. Geophys. Res.-Atmos., 105, 17995–18011, 2000.
Zülicke, C. and Peters, D.: Parameterization of strong stratospheric inertia–gravity waves forced by poleward-breaking Rossby waves, Mon. Weather Rev., 136, 98–119, https://doi.org/10.1175/2007MWR2060.1, 2008.


