the Creative Commons Attribution 4.0 License.
the Creative Commons Attribution 4.0 License.
 | 24 Apr 2025
Characterizing urban planetary boundary layer dynamics using 3-year Doppler wind lidar measurements in a western Yangtze River Delta city, China
Tianwen Wei
Mengya Wang
Jinlong Yuan
Simone Lolli
The planetary boundary layer (PBL) dynamics play a critical role in shaping urban atmospheric processes by governing the exchange of energy, momentum, and mass within the lower atmosphere. This study investigates PBL dynamics in Hefei, a city in the western Yangtze River Delta (YRD), using 3 years (June 2019 to June 2022) of Doppler wind lidar data. Seasonal and diurnal variations in key parameters, including wind profiles, shear intensity, turbulent mixing, low-level jets (LLJs), and mixing layer height (MLH), are analyzed. Results show that horizontal wind speeds accelerate more rapidly above 3 km with the predominant westerly winds (270°±15°) in all seasons. The vertical depth of the high-wind zone (>8 m s−1) during the day is found to be generally deeper than at night, particularly in winter. In Hefei, LLJs primarily form at sunset and dissipate by noon, typically at altitudes between 0.5 and 0.6 km throughout the year, except in July. LLJ occurrences are the most frequent in spring (31.7 %), followed by summer (24.7 %), autumn (22.3 %), and winter (21.3 %). Summer LLJs are the most intensified, extending up to 1.5 km. The larger wind gradient below the jets significantly enhances turbulence and shear intensity near the ground at night. The seasonal average MLH peaks between 14:00 and 15:00 UTC+8, reaching approximately 1.2 km in spring and summer. Cloud cover raises MLH by about 100 m at night but decreases it by 200 m at the afternoon peak. This study provides insights into lidar-based PBL dynamics and highlights implications for local standards concerning low-altitude economic activities.
- Article
(7383 KB) - Full-text XML
- BibTeX
- EndNote


The planetary boundary layer (PBL) refers to the lowest 1–3 km of the atmosphere that is directly influenced by the presence of the underlying surface and typically responds to surface forcings in an hour or less (Stull, 1988). These surface forcings include frictional drag, heat exchange, pollutant emission, evaporation and transpiration, and terrain-induced flow modifications (Garratt, 1994). The depth and structure of the PBL are determined by the physical and thermal properties of the underlying surface as well as the dynamics and thermodynamics of the lower atmosphere (Madala et al., 2014; Barlow, 2014). One of the most important characteristic of the PBL is turbulence, which dominates the vertical exchange of heat, moisture, momentum, trace gases, and aerosols between the free atmosphere and the Earth's surface or regolith (Baklanov et al., 2011; Petrosyan et al., 2011). In the PBL, the sources of turbulent mixing exhibit significant temporal and spatial variations, which include buoyancy (convective mixing), wind shear (mechanical mixing), entrainment at the top of boundary layer, and radiative cooling in stratocumulus clouds (top-down convective mixing) (Ortiz-Amezcua et al., 2022). Such turbulent motion in the PBL has been demonstrated to be inherently connected to air pollution by modulating the dispersion, transport, and accumulation process and have critical impacts on land–atmosphere energy balance, as well as aerosol–cloud–precipitation–radiation interactions (Kim and Entekhabi, 1998; Wang et al., 2001; Chen et al., 2011; Wood et al., 2015; Li et al., 2017; Su et al., 2020, 2018; Pérez-Ramírez et al., 2019, 2021; Christensen et al., 2024).
Hefei, the capital of Anhui province, has experienced incredible economic growth and urban sprawl over the past 2 decades (Zhao and Zou, 2018). Situated between the Yangtze River and Huaihe River, in what is known as the Jianghuai region, the Hefei metropolitan circle plays a pivotal role in the Yangtze River–Huaihe River water transfer project to provide benefits for water supply, transportation, agriculture, and power generation (Li et al., 2019; Zhang et al., 2023). Apart from tremendous economic benefits achieved in Hefei, intense human activities create a profound influence on the local climate, affecting the thermal, hydrological, and wind environments in the PBL within and beyond city limits (Shi et al., 2008; Li et al., 2022a). In this context, the PBL study is vital for better understanding the exchange process between the atmosphere and land over complex underlying surfaces and improving the parameterization schemes in numerical weather prediction models. However, previous studies mainly focused on surface air pollution characteristics and its associations with meteorological parameters as well as the impacts on human health based on in situ monitoring measurements or air quality modeling (Hu et al., 2025; Qin et al., 2017; Shen et al., 2022; Zhang et al., 2017; Zhu et al., 2019). Among various observation techniques, the lidar is a powerful tool and has been applied in retrieve vertical profiles of PBL properties, such as aerosols, winds, turbulence, precipitation, temperature, and water vapor during a period (Zhou, 2002; Xia et al., 2015, 2016; Wei et al., 2021, 2022, 2025; Jiang et al., 2022; Yuan et al., 2020; Wang et al., 2015b). Therefore, it is essential to utilize the long-term lidar measurements to characterize the PBL dynamics such as winds and turbulence sources to further understand the land–atmosphere interaction.
The key parameter of PBL meteorology is the PBL height (PBLH), which displays significant spatiotemporal variability under different atmospheric and surface conditions (Guo et al., 2019; Zhang et al., 2022; Zhao et al., 2023). It strongly depends on surface characteristics, such as surface heating rate, strength of winds, topography, surface roughness, free atmospheric characteristics, and amount of clouds and moisture (Kotthaus et al., 2023; Zhang et al., 2020). Multiple approaches have been developed to determine the PBLH based on observations, such as in situ radiosonde (Gu et al., 2022; Guo et al., 2021; Yue et al., 2021) and aerosol-based and dynamic-based lidar techniques (Chen et al., 2022; Huang et al., 2017; Vivone et al., 2021; Wang et al., 2020, 2021; Yang et al., 2020; Yin et al., 2019). In the practical measurements of PBLH, it is necessary to consider its distinct diurnal cycle of PBL. The PBL can be categorized into three dominant regimes: convective boundary layer (CBL), stable boundary layer (SBL), and residual layer (RL) based on the thermodynamic stability in the lower atmosphere (Caughey and Palmer, 1979). After sunrise, increasing radiative heating triggers the development of near-surface turbulent eddies and leads to the formation of CBL, which grows with time and reaches its maximum in the early afternoon. The CBL consists of a convective surface layer, mixing layer (ML) above, and entrainment zone (EZ) at the top (Wyngaard, 1988). After sunset, the radiative cooling creates the SBL close to the surface, and its depth grows as night progresses. The RL lies above the SBL; meanwhile, a capping inversion overlies the RL (Fochesatto et al., 2001). However, studies in diurnal and seasonal characteristics of the PBLH under different stable conditions in Hefei based on long-term measurements have not been documented yet to the best of our knowledge at the time of writing of this work.
Turbulence in the PBL is generated mechanically by wind shear, and convectively by buoyancy. Wind shear is the main source of turbulence in the nocturnal boundary layer (NBL, also known as the SBL), which can be enhanced in the presence of low-level jets (LLJs). Yang et al. (2023) found that wind shears induced by LLJs often enhanced the vertical mixing processes, reduced the atmospheric stability, and resulted in small, weak direction shifts in eastern Idaho, USA. The formation of LLJ can provide a driving force for the development of a deeper CBL on the Tibet Plateau (Su et al., 2024). Many studies investigated the prominent role of LLJs in heavy rainfall events in the Jianghuai region (Chen et al., 2020; Yan et al., 2021; Liu et al., 2022; Cui et al., 2023), but there has been a lack of research specifically focusing on Hefei. The Huaihe River region, including Hefei, is one of the six high-frequency regions of LLJs in China (Yan et al., 2021). The LLJs over China are usually classified into two types: boundary layer jets (BLJs; below 1 km) and synoptic-system-related LLJs (SLLJs; within 1–4 km) (Du et al., 2014). The occurrence of BLJs is associated with significant vertical shear of horizontal wind and diurnal variation. On the contrary, SLLJs are usually related to synoptic-scale weather systems. This study addresses a previous research gap by investigating the characteristics of LLJs formation and types and vertical wind shear (VWSH) in Hefei, with a focus on their monthly variations across different times and altitudes.
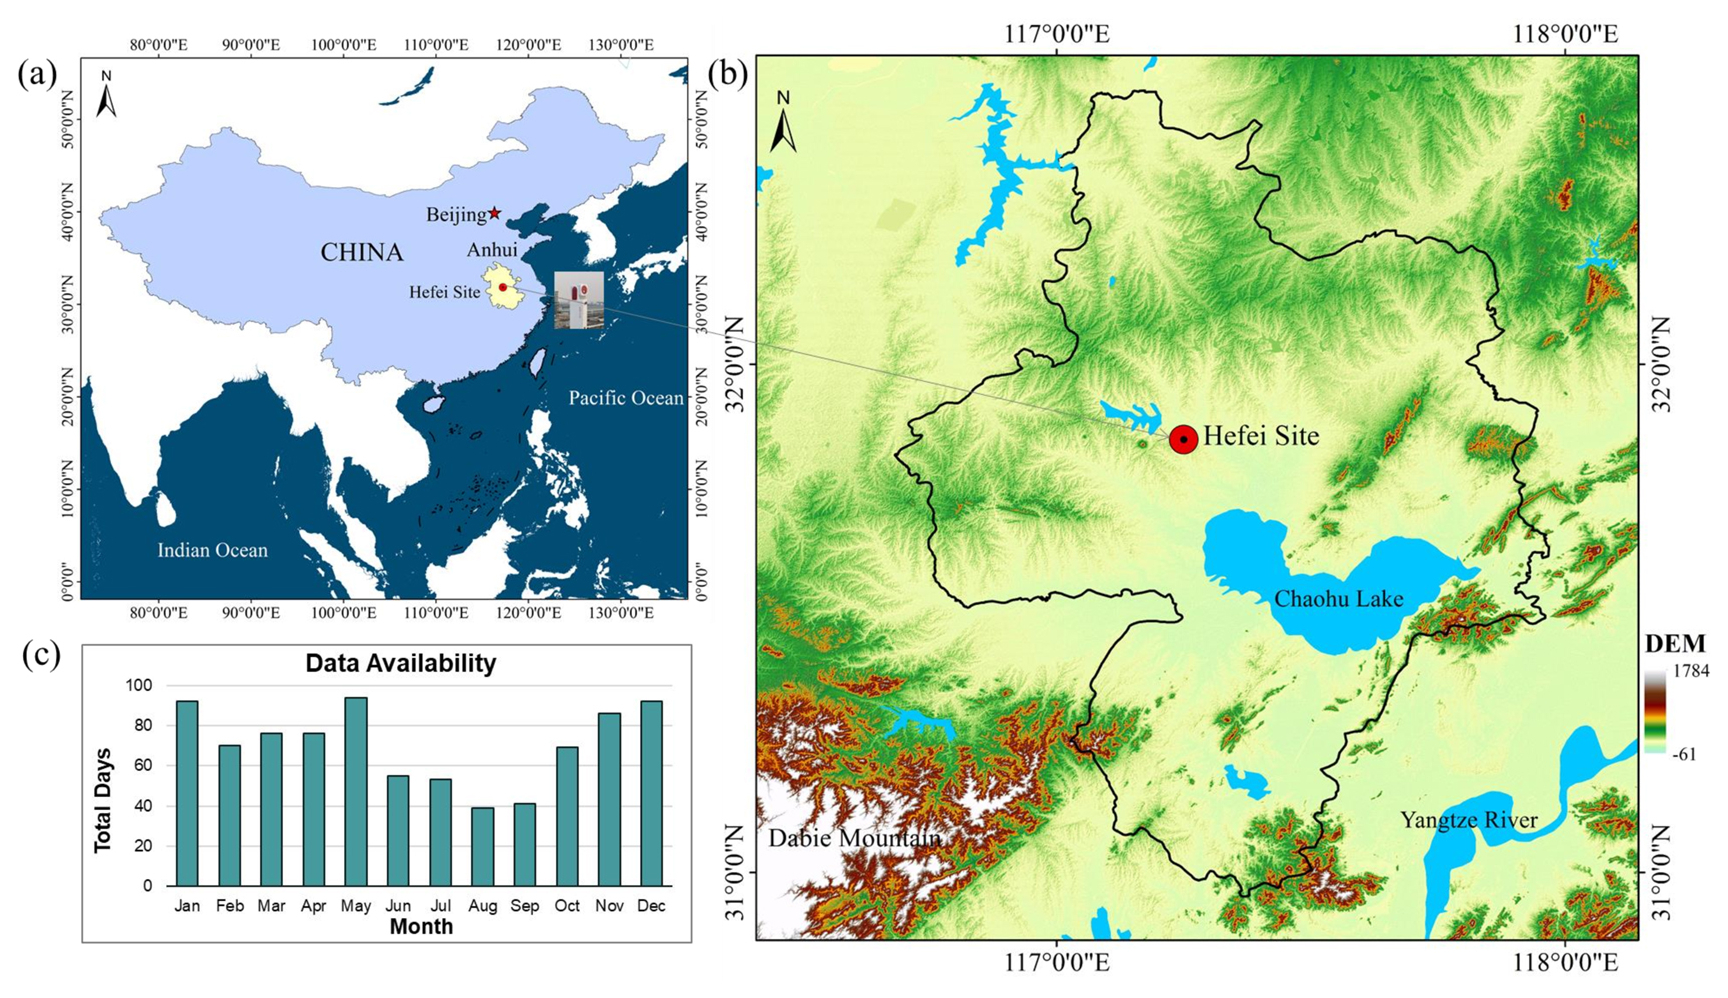
Figure 1Study area and location of the Doppler wind lidar system. (a) Location (31.83° N, 117.25° E) of the Hefei site and administrative boundary of Anhui province, (b) digital elevation model (DEM) showing topographical features with the solid black line representing the administrative boundary of Hefei, and (c) data availability of 3-year Doppler wind lidar measurements. Total days with valid lidar measurements are accounted for each month. Publisher's remark: please note that the above figure contains disputed territories.
In this paper, we utilize 3-year Doppler wind lidar measurements to characterize the PBL dynamics in Hefei. The horizontal wind speeds and direction, LLJs, VWSH, turbulent kinetic energy dissipation rate (TKEDR), mixing layer height (MLH), and PBLH are thoroughly analyzed. Remote sensing retrieval of the above PBL parameters has been fully illustrated and validated in our previous studies (Wang et al., 2019, 2021, 2024; Wei et al., 2019, 2022). This paper aims to shed new light on the diurnal and seasonal characteristics of PBL meteorology and turbulence influenced by the diurnal cycles, general circulation, Asian monsoon, and synoptic systems.
2.1 Study area and instruments
Hefei, a rapidly developing new first-tier city, is located in eastern China within central Anhui province in Fig. 1a. It covers an area of 11 465 km2, comprising four urban districts, one county-level Chaohu city, and four counties. Its topography includes flat plains, gently rolling hills, and major waterbodies such as Chaohu Lake to the southeast in Fig. 1b. The city altitude mainly ranges from 15 to 81 m, with the highest point reaching 595 m (Sun and Ongsomwang, 2021). The Dabie Mountains in the southwest introduces varied elevations and complex topographical features that influence regional atmospheric dynamics in Hefei. Anhui province, including Hefei, is located across both the eastern monsoon region and the north–south climate transition zone of China. Hence, Hefei is characterized by the typical subtropical monsoon climate with four distinct seasons. The city receives an annual precipitation of ∼ 1000 mm and average temperature of 15.7 °C, with prevailing southeast winds in spring and summer and northwest winds in autumn and winter (Li et al., 2024).
A compact coherent Doppler wind lidar (CDWL) system was deployed on the roof of the School of Earth and Space Science (SESS) building of the University of Science and Technology of China (31.83° N, 117.25° E) in the urban area of Hefei to monitor the vertical profiles of aerosols, clouds, and wind fields. The lidar location is denoted as the Hefei site in Fig. 1a and b. The lidar system operates at 1.5 µm eye-safe wavelength and uses a 300 µJ pulse energy and a 10 kHz repetition rate to achieve a maximum detection range of up to 15 km. During the long-term experiment, the lidar performed a continuous velocity azimuth display (VAD) scanning mode for high spatial–temporal resolution wind profile measurement. The azimuth angle ranges from 0 to 300° with an interval of 5°, and the elevation angle is 60°. The key operating parameters of the Doppler lidar system are summarized in Table 1. Detailed information about the validation and application of the lidar system can be found in our previous works (Jia et al., 2019; Wei et al., 2020, 2021). The data availability is presented in Fig. 1c with monthly statistics of total valid days. Note that the lower data availability during the summer seasons is primarily due to frequent rainfall and high temperatures, which caused instability in the lidar systems. However, these issues have been significantly improved in the recently updated systems (Xia et al., 2024).
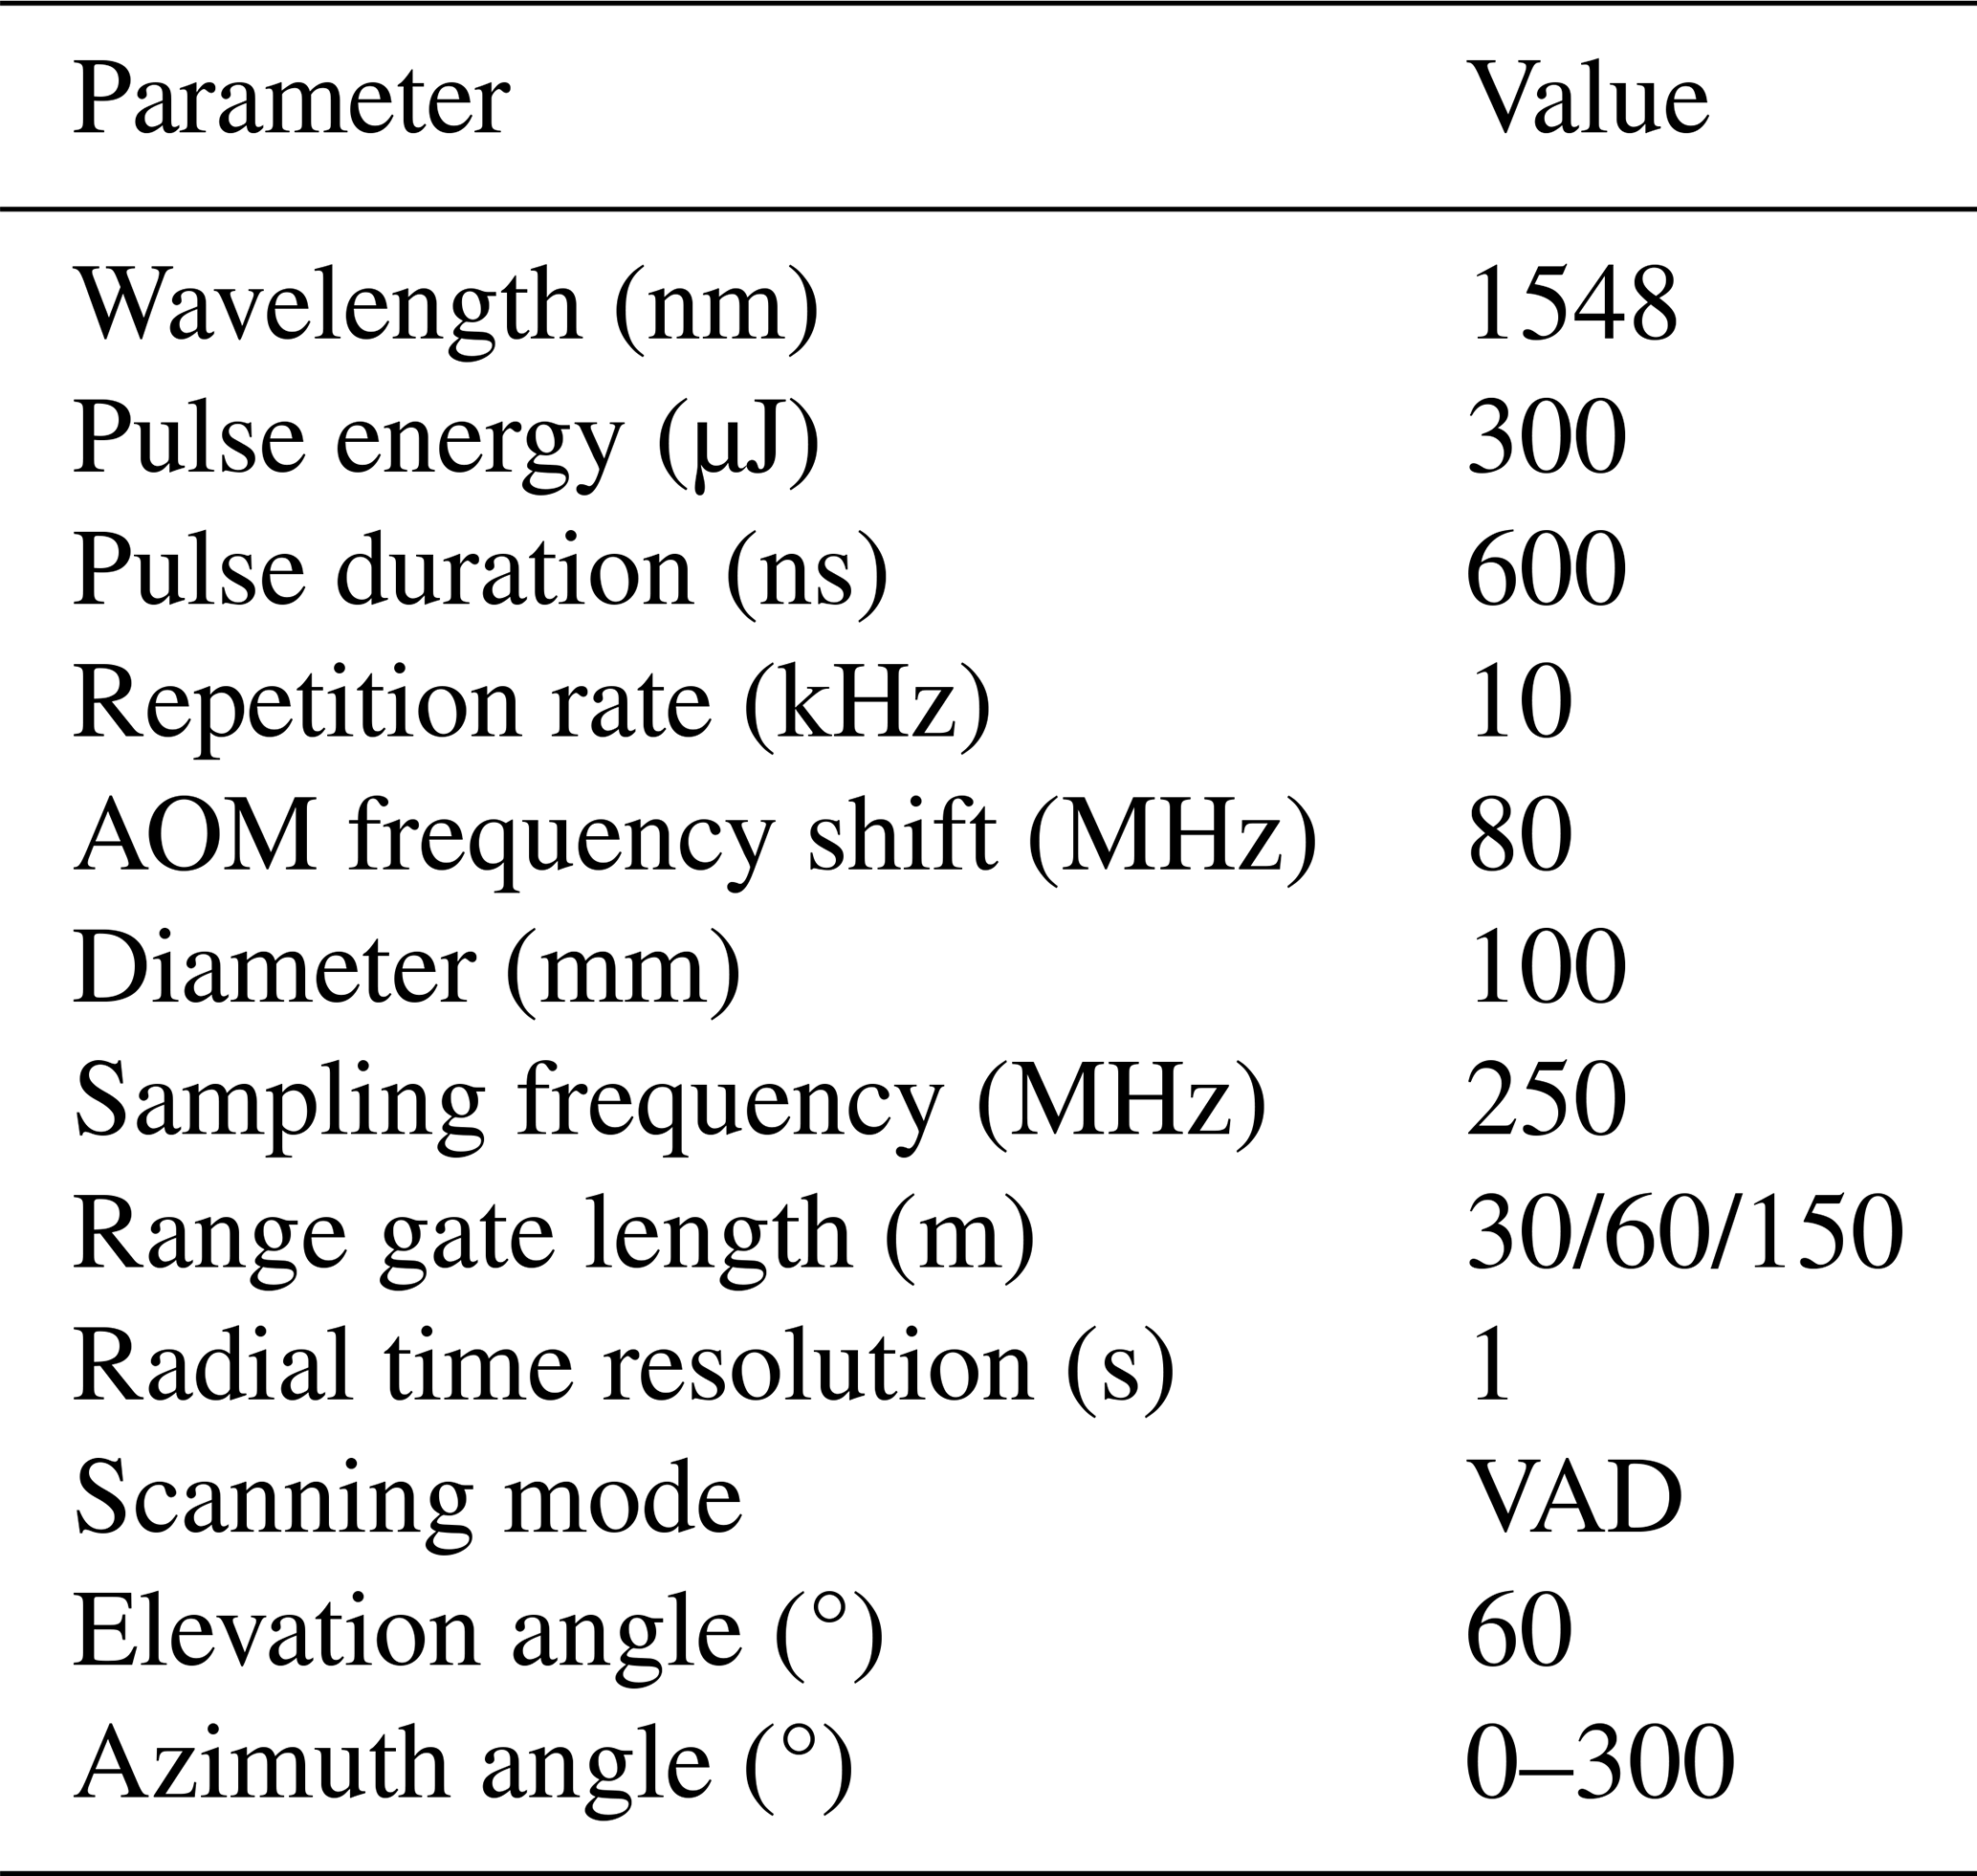
Table 2Observation days by weather type during Doppler lidar operations.
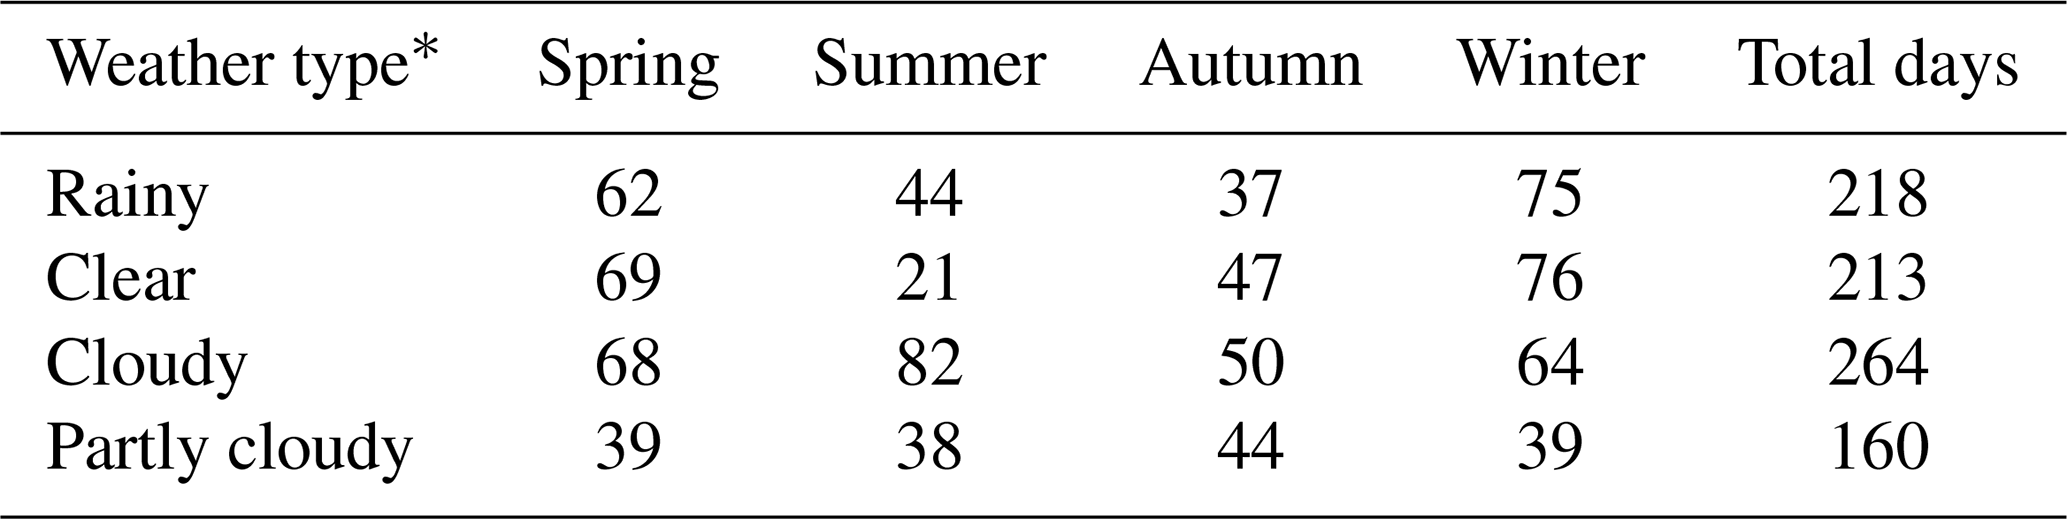
* Rainy: rain persists for more than 2 h. Clear: clouds are present for less than 2 h. Cloudy: cloud coverage exceeds 8 h. Partly cloudy: cloud coverage lasts between 2 and 8 h.
2.2 Datasets and methods
The CDWL system operated for 3 consecutive years from June 2019 to June 2022, except for some maintenance interruptions (Wang et al., 2024). Table 2 presents the number of available observation days for each season and weather type.
The time resolution and range gate resolution of the original radial measurements are 1 s and 30 m, respectively. Horizontal wind speed (HWS), horizontal wind direction (HWD), and vertical wind speed (VWS) are retrieved from the measured radial speeds at different azimuth angles using a filtered sine-wave fitting method based on the assumption of horizontally homogenous wind field (Smalikho, 2003; Banakh et al., 2010; Wei et al., 2020). Considering the duration of one VAD scan, the time resolution of the wind profile becomes about 2 min. Here, the wind direction of 0° represents the horizontal wind coming from the north, and the angle increases clockwise. The negative (positive) vertical wind speed was defined as upward (downward) motion in this study.
Turbulence activity can be expressed by vertical velocity variance, spectrum width, turbulent kinetic energy, and TKEDR (O'Connor et al., 2010). In this study, we estimate TKEDR using the turbulence statistical model based on the relation between the structure function of the measured radial velocity and theoretical value (Banakh et al., 2017). MLH is a significant parameter for presenting the vertical turbulent exchange within the PBL. On the basis of the characteristics of decreasing convective turbulence intensity along with height, the threshold method can effectively determine a typical turbulence height. Here, MLH is defined as the height up to which TKEDR m2 s−3 is reached (Banakh et al., 2021; Wang et al., 2021). In addition, the aerosol-based PBLH, shown in Sect. 3.6, is also calculated for comparison. It is determined from the aerosol backscatter coefficient using a Haar wavelet method (Caicedo et al., 2017; Kotthaus et al., 2023).
LLJ is a fast airstream with a wind speed maximum in the lowest kilometers of the troposphere (Stull, 1988). Referring the previous studies (Qiu et al., 2023; Zhang et al., 2018; Tuononen et al., 2017) and considering the local characteristics, we identify the LLJs at Hefei using the following criteria: (1) the maximum wind speed, Umax>8 m s−1, and, (2) the wind speed difference, m s−1, where Umin is the minimum wind speed above the height of Umax. The LLJ height is then defined as the height of Umax. In addition, when a two-layer LLJ exists, the lower one will be selected. Each wind profile was applied to identify the LLJ event. In the statistics procedure of Sect. 3.3, a time window of 1 h is used to filter out the outliers, and those with fewer than 60 % within the window are abandoned.
Vertical wind shear (VWSH) is defined as the change in wind speed and/or direction with height. It can be calculated from the vertical wind profiles using the following equation (Manninen et al., 2018):
where the difference in vectors of the wind components u and v is divided by the height difference Δz between the two altitude levels used to compute the wind shear.
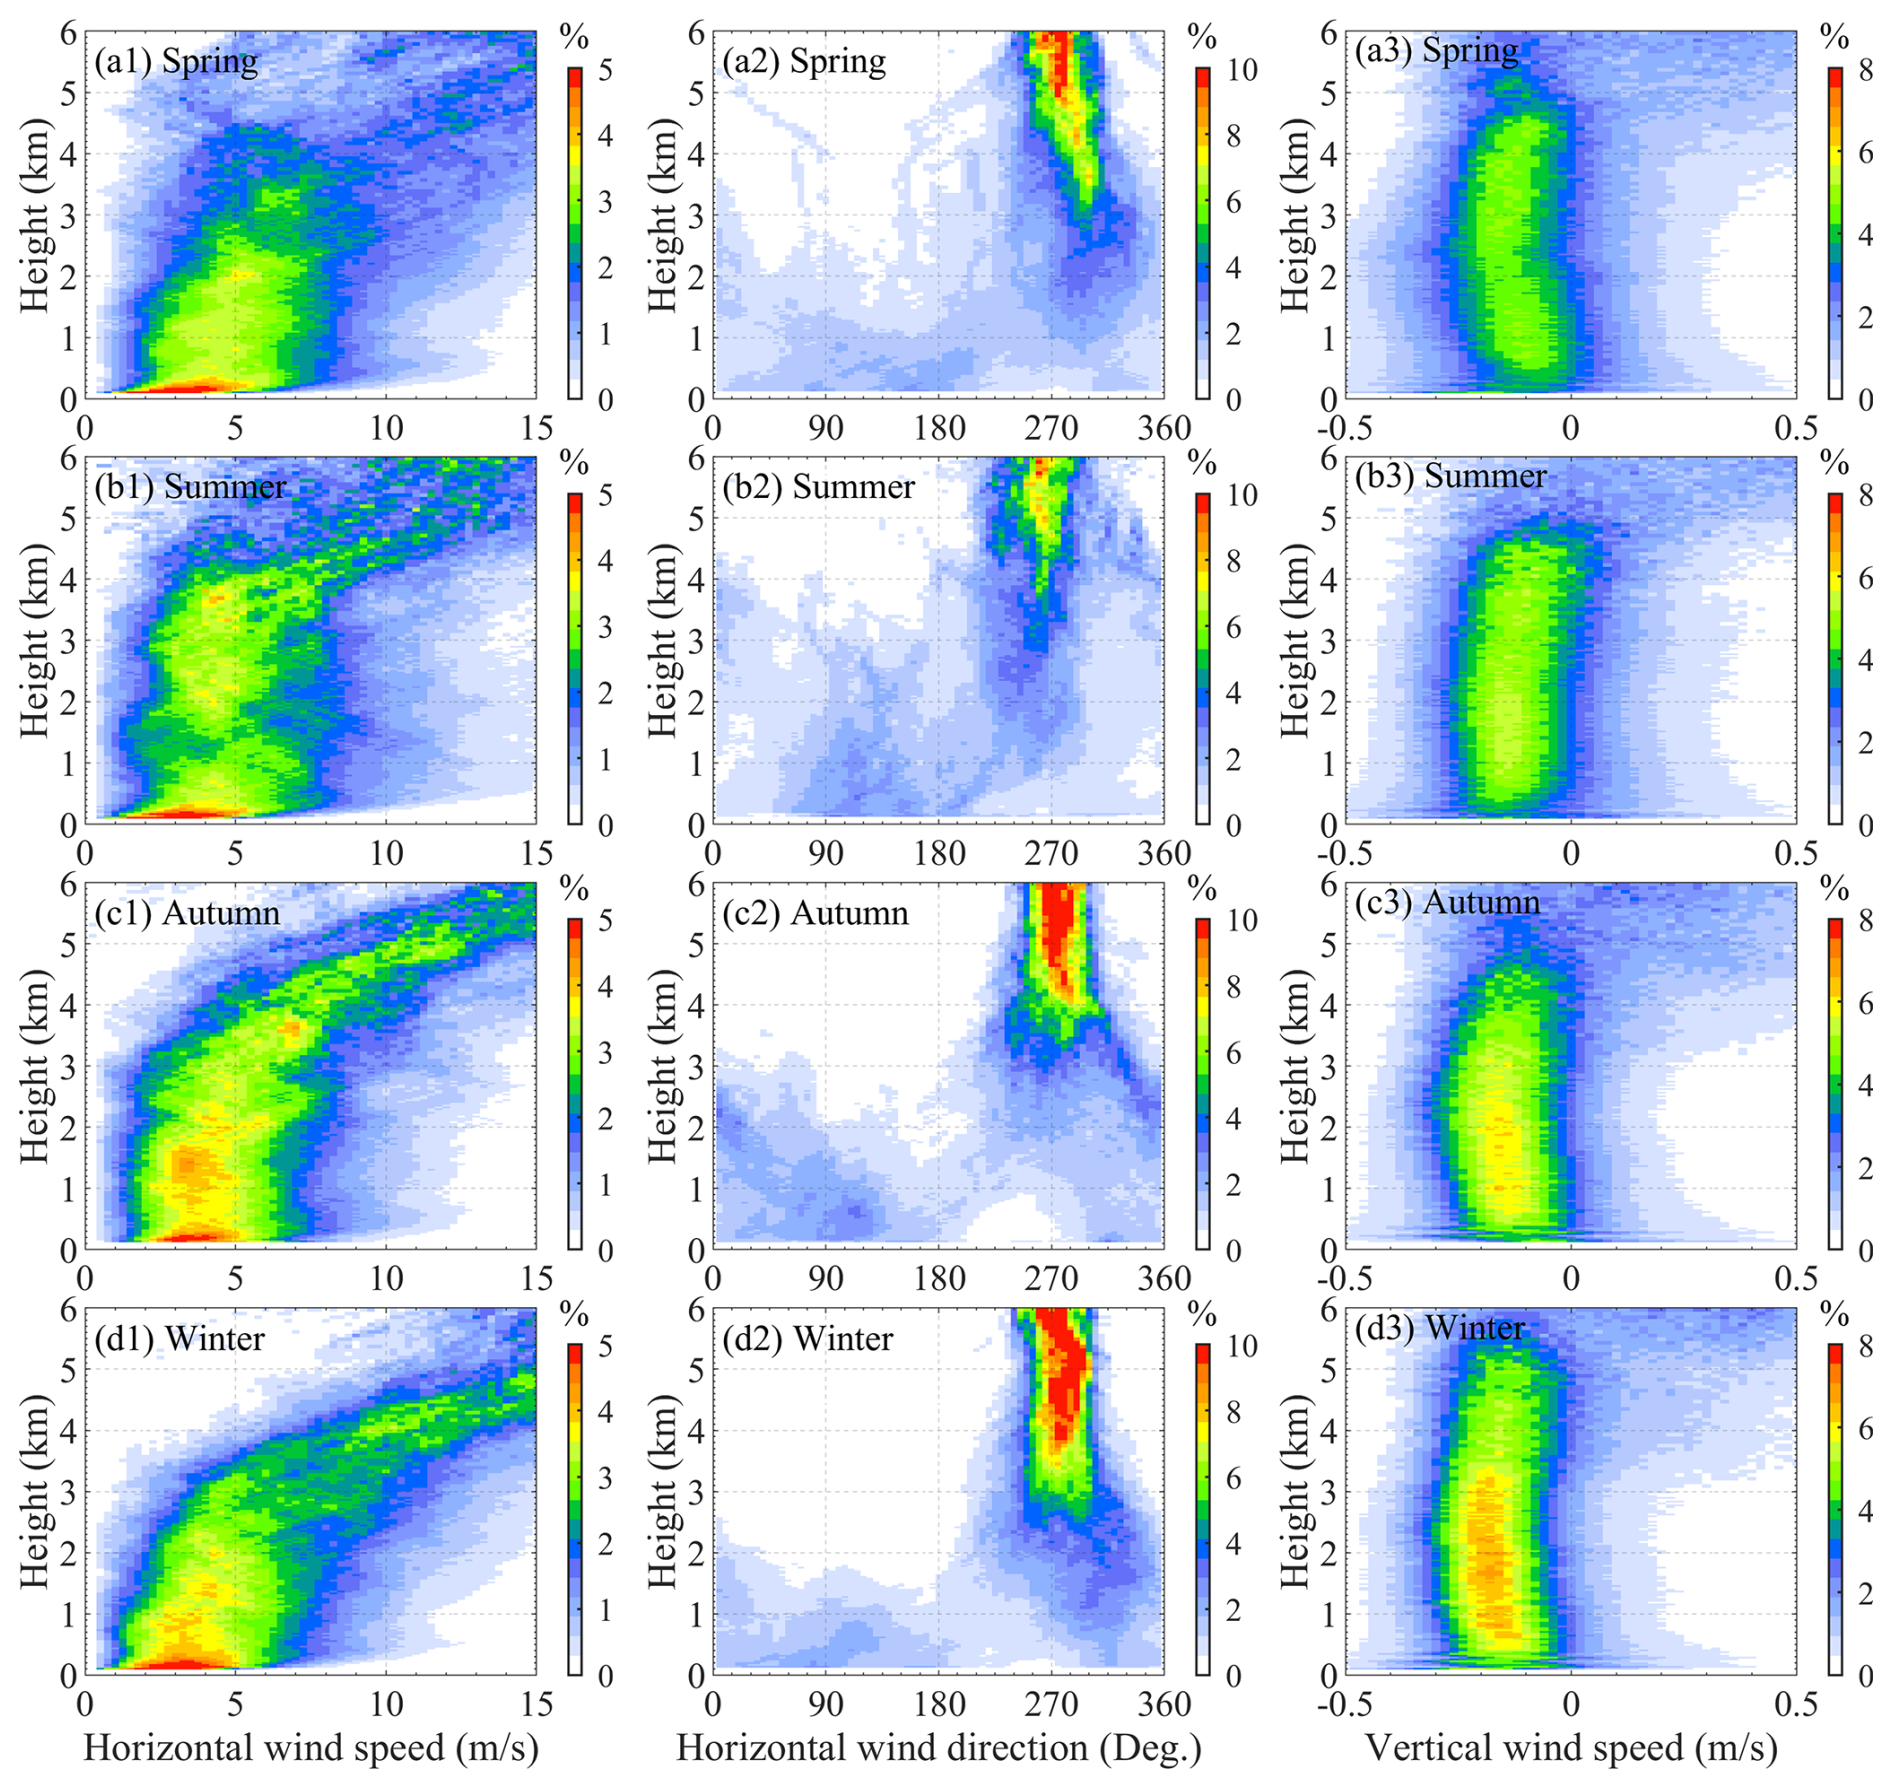
Figure 2Seasonal frequency distributions of (a1–d1) horizontal wind speed, (a2–d2) horizontal wind direction, and (a3–d3) vertical wind speed below 6 km in Hefei. Panels (a)–(d) represent spring (March–May), summer (June–August), autumn (September–November), and winter (December–February), respectively. Frequencies along the x axis are normalized to 100 % at each height. Negative vertical wind speeds indicate upward motion.
3.1 The 3-year seasonal profiles of the wind frequency
Vertical wind profiles are influenced by surface friction, terrain, local pressure systems, and global atmospheric circulation patterns. We retrieve the vertical profiles of HWS, HWD, and VWS and calculate the frequency (%) of their occurrence at different heights above ground level (a.g.l.), as shown in Fig. 2. The frequency distribution represents the ratio of wind speeds within each x-axis bin to the total valid counts at a given height. Therefore, the sum of all frequency values along the x axis is 100 % at any specific height. To represent close-up details, the bin size or resolution (i.e., the width of each column) is set to 0.25 m s−1, 5°, and 0.02 m s−1 for HWS, HWD, and VWS, respectively.
In the left panel of Fig. 2, the frequency distribution of HWS (hereafter referred to as HWS %) exhibits a rightward skew in all seasons, a characteristic often modeled using a Weibull or lognormal distribution due to the non-negative nature of wind speed (Justus et al., 1978; Pobočíková et al., 2017). Close to the ground, the majority of HWS values are clustered at the lower end, mainly as a result of surface friction. Below ∼300 m a.g.l., HWS increases rapidly as surface friction decreases. From 300 m to 3 km a.g.l., HWS increases steadily while becoming more dispersed, with the overall distribution (HWS %) spanning between 2 and 7 m s−1. Above 3 km, HWS accelerates more rapidly, particularly in autumn and winter, where HWS % remains relatively concentrated. In contrast, HWS % in spring and summer is more dispersed, with a lower frequency of high HWS occurrences (>10 m s−1). Many studies have demonstrated a significant decreasing trend of near-surface wind speed in eastern China including Anhui province, induced by large-scale circulation and local land-use and land cover change (Li et al., 2018, 2022a, b, c; Liu et al., 2023). Wang et al. (2015a) observed that the value of annual mean surface wind speed in Hefei city during 1981–2012 was between 2.0 and 2.6 m s−1 and the highest frequency of maximum surface wind speed occurred in spring. A recent study by Li et al. (2022a) analyzed the maximum daily wind speed of 10 min from 51 meteorological stations in Anhui province from 2006 to 2020, which showed that the average maximum wind speed in the city of Hefei was between 9.1 and 17.6 m s−1. Therefore, our results of seasonal HWS values near the ground correspond to previous studies.
The frequency distribution of HWD (hereafter referred to as HWD %) exhibits distinct vertical characteristics, as shown in the middle panel of Fig. 2. At higher altitudes (>3 km), the distribution of HWD is much more concentrated, with predominant westerly winds (270°±15°) in all seasons because Hefei is located between 31°4′ N and 32°38′ N, which is affected by westerly circulation. The finding of prevailing westerlies throughout the year in Hefei is consistent with Sun et al. (2021). In contrast, the influence of westerly on HWD % below the PBL is insignificant due to the impact of the underlying surface roughness, terrain distribution, and airflow turbulence. Below 3 km a.g.l., we can discover notable southwest winds in summer compared to the other seasons. In the summer monsoon season, eastern China (including Hefei city) is mainly dominated by southwest winds, as has been reported in many studies (Liu et al., 2015; Yan et al., 2022; Zhao et al., 2007). Wind directions in the PBL tend to be more variable and chaotic compared to those at higher altitudes. And westerly winds above 1.5 km consistently strengthen with increasing altitude in all seasons.
The right panel of Fig. 2 illustrates seasonal profiles of VWS frequency (hereafter referred to as VWS %). The frequency distribution of VWS % is right-skewed, and its center lays in the negative values between −0.2 and −0.1 m s−1. The results show that most VWS values are negative below 5 km in all seasons, representing upward motion in the atmosphere. It demonstrates the asymmetric nature of vertical velocities in the atmosphere, where upward movements are stronger than downward movements (Tamarin-Brodsky and Hadas, 2019). Furthermore, Fig. 2d3 shows that winter has the highest frequency of negative VWS, with most VWS % values ranging from 4 % to 7 % below 3 km a.g.l. A climatology study of cold frequency suggests that cold fronts most frequently occur in cold seasons over Hefei city (Xue et al., 2022). In winter, cold fronts associated with the winter monsoon can enhance upward motion of the air as the heavier (more dense) cool air pushes under the lighter (less dense) warm air (Kang et al., 2019; Parsons, 1992). The upward motion intensifies and is vigorous along the frontal boundaries, leading to cloud formation and precipitation. The higher positive values in the asymmetric distribution of VWS, particularly above 3 km, are attributed to the contribution of falling precipitation particles (Wei et al., 2019). Under these conditions, the detected vertical speed reflects the movement of larger hydrometeors rather than the air motion itself.
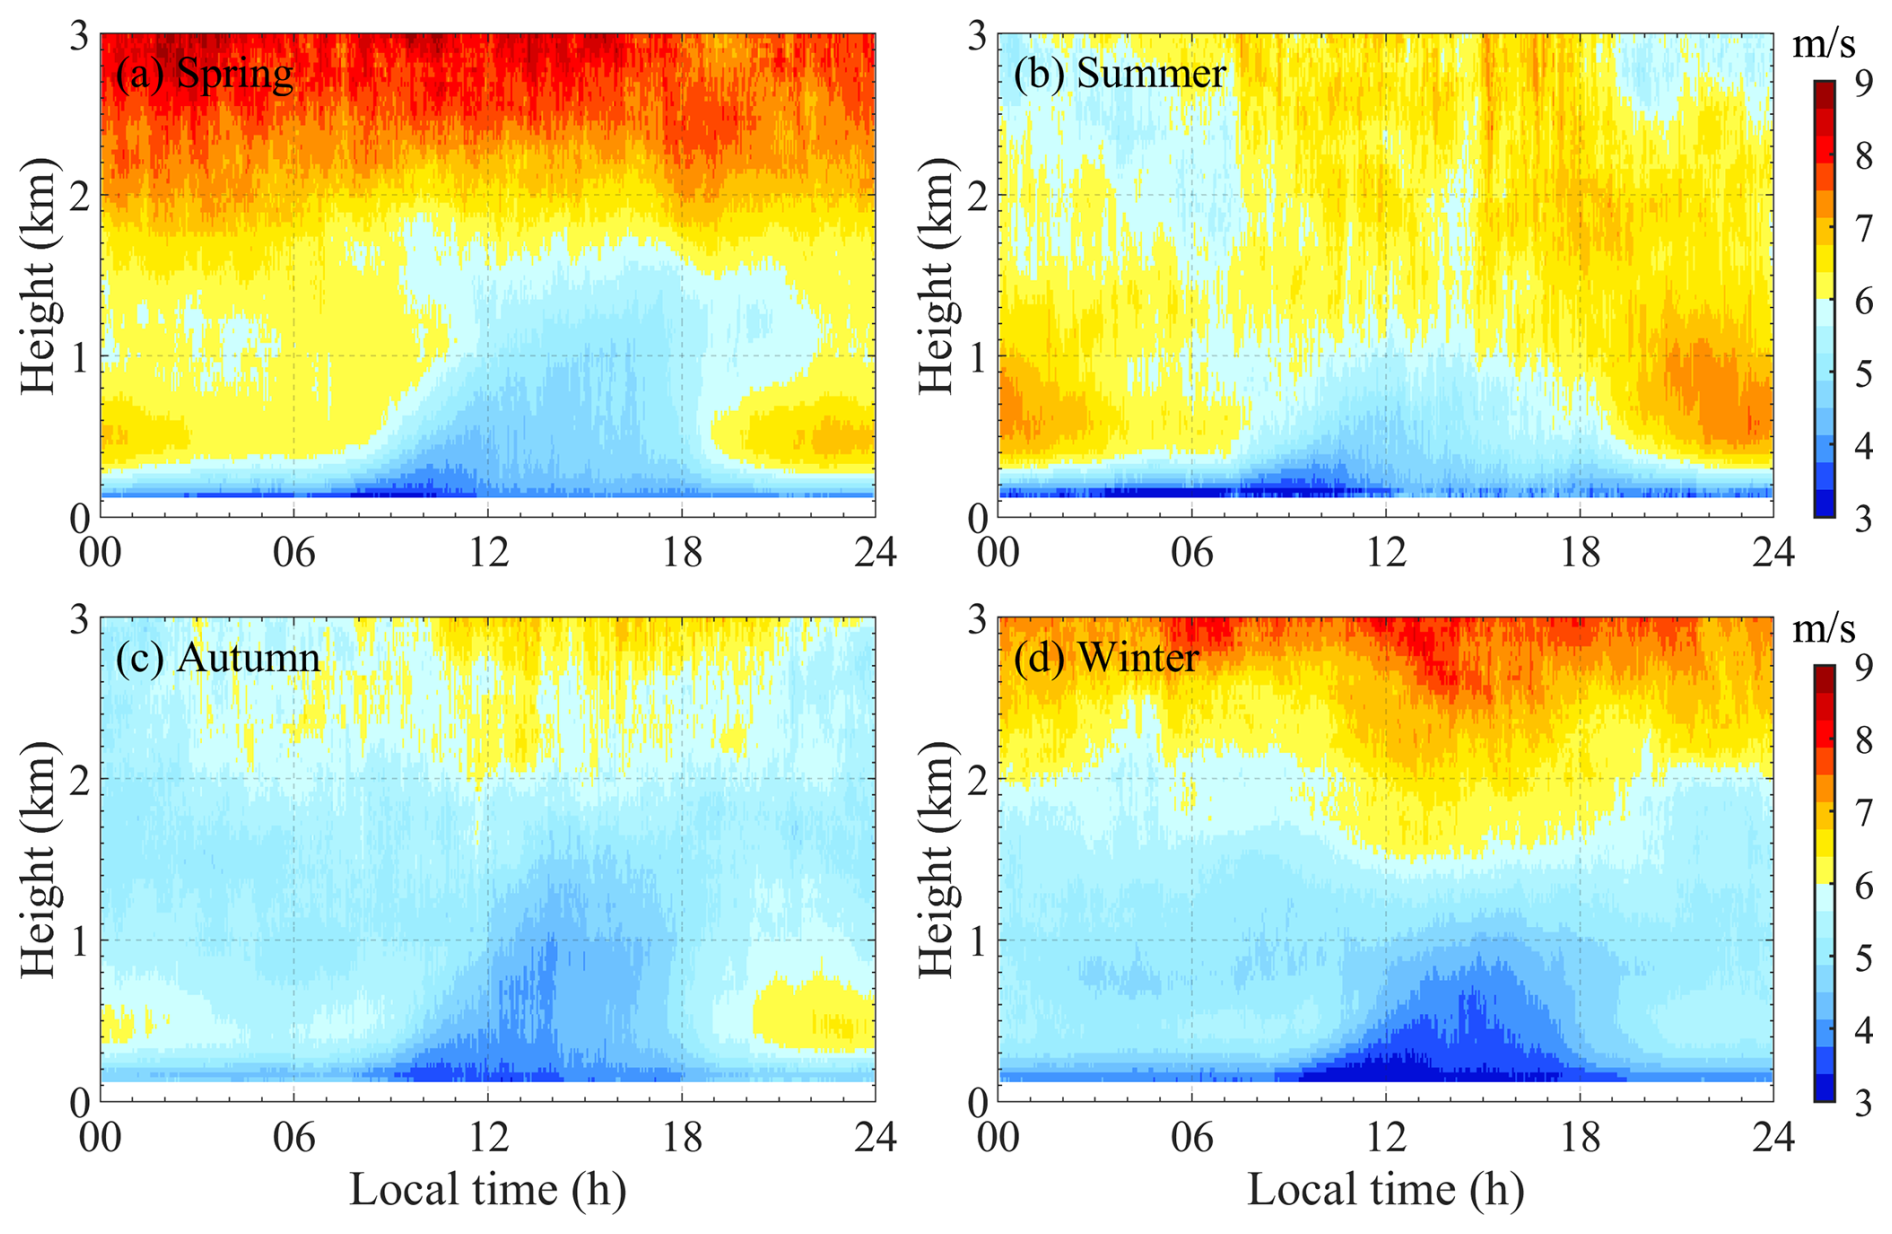
Figure 3Time-height diagrams of seasonal average horizontal wind speed profiles below 3 km. (a) Spring: March–May, (b) summer: June–August, (c) autumn: September–November, and (d) winter: December–February.
3.2 Diurnal HWS profiles in different seasons
The diurnal variation of the vertical wind profile within the PBL is intricately linked to the dynamics and thermodynamics driven by the daily cycle of solar heating and longwave cooling. Figure 3 illustrates how the HWS profile varies with local time (LT) on a seasonal scale. Minimum HWS values are observed near the surface due to the influence of surface roughness.
During the day, solar heating induces turbulence and convection, which increases surface friction and slows down the high-level horizontal wind. This results in the formation of a gentle wind zone (GWZ), characterized by wind speeds below 5 m s−1, a feature that can be observed in all seasons. And the diurnal variation of the GWZ strongly correlates with the development of the mixing layer. At night, radiative cooling generates a temperature inversion, inhibiting vertical mixing and fostering laminar flow with increased shear intensity. Consequently, nocturnal winds are generally stronger than daytime winds at the same height below 1.5 km a.g.l. throughout all seasons. Above this height, the HWS profile is usually more uniform and stronger due to the reduced frictional drag in the free atmosphere. It is interesting to find that the vertical height of the high-wind zone (>8 m s−1) during the day is much lower than at night, particularly in winter. In Fig. 3d, an appreciable enhancement of HWS at 1.5 km is discovered during the day, particularly between 11:00 and 16:00 UTC+8, when the PBL tends to grow and become deeper due to radiative heating of the surface. In general, the HWS increases with height. However, as seen in Fig. 3a to c, a distinct local maximum in HWS, occurring between approximately 0.4 and 0.8 km, is observed after 20:00 UTC+8 and before 07:00 UTC+8 the next day. This is especially pronounced in summer, where the highest values and the highest vertical extent of the wind are recorded. These winds are typically associated with the nocturnal LLJs, a narrow band of strong winds that forms in the lower PBL. Although the seasonal average HWS reflects the overall wind conditions, the pronounced notch structure in the profile underscores the frequent occurrence of LLJs, which is explored in more detail in the next section.
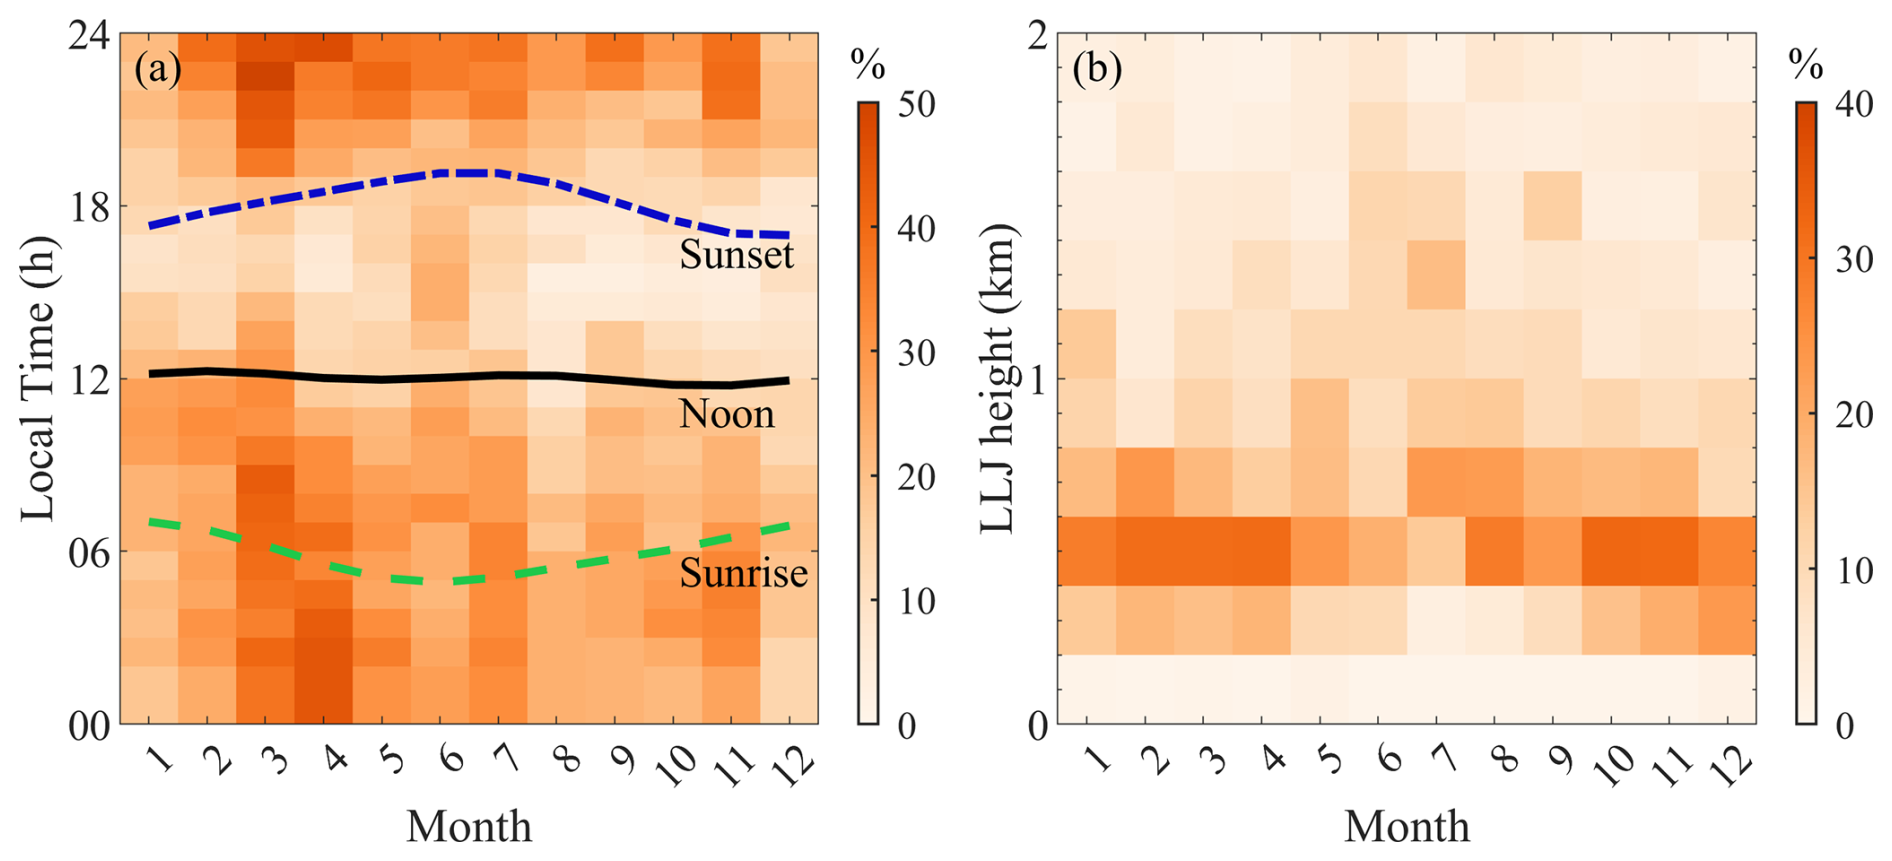
Figure 4(a) Monthly frequency (%) of LLJ occurrences over time. The dotted–dashed blue line indicates the mean sunset time, the solid black line marks noon, and the long-dashed green line represents the sunrise. (b) Height distribution of LLJ occurrence frequency by month, with normalized column totals (100 %).
3.3 Monthly characteristics of LLJs at different times and heights
LLJ is characterized by a concentrated band of strong winds located in the lower part of the atmosphere. The diurnal variation in its formation and occurrence is influenced by the interaction between surface heating/cooling cycles, atmospheric stability, and synoptic-scale weather patterns.
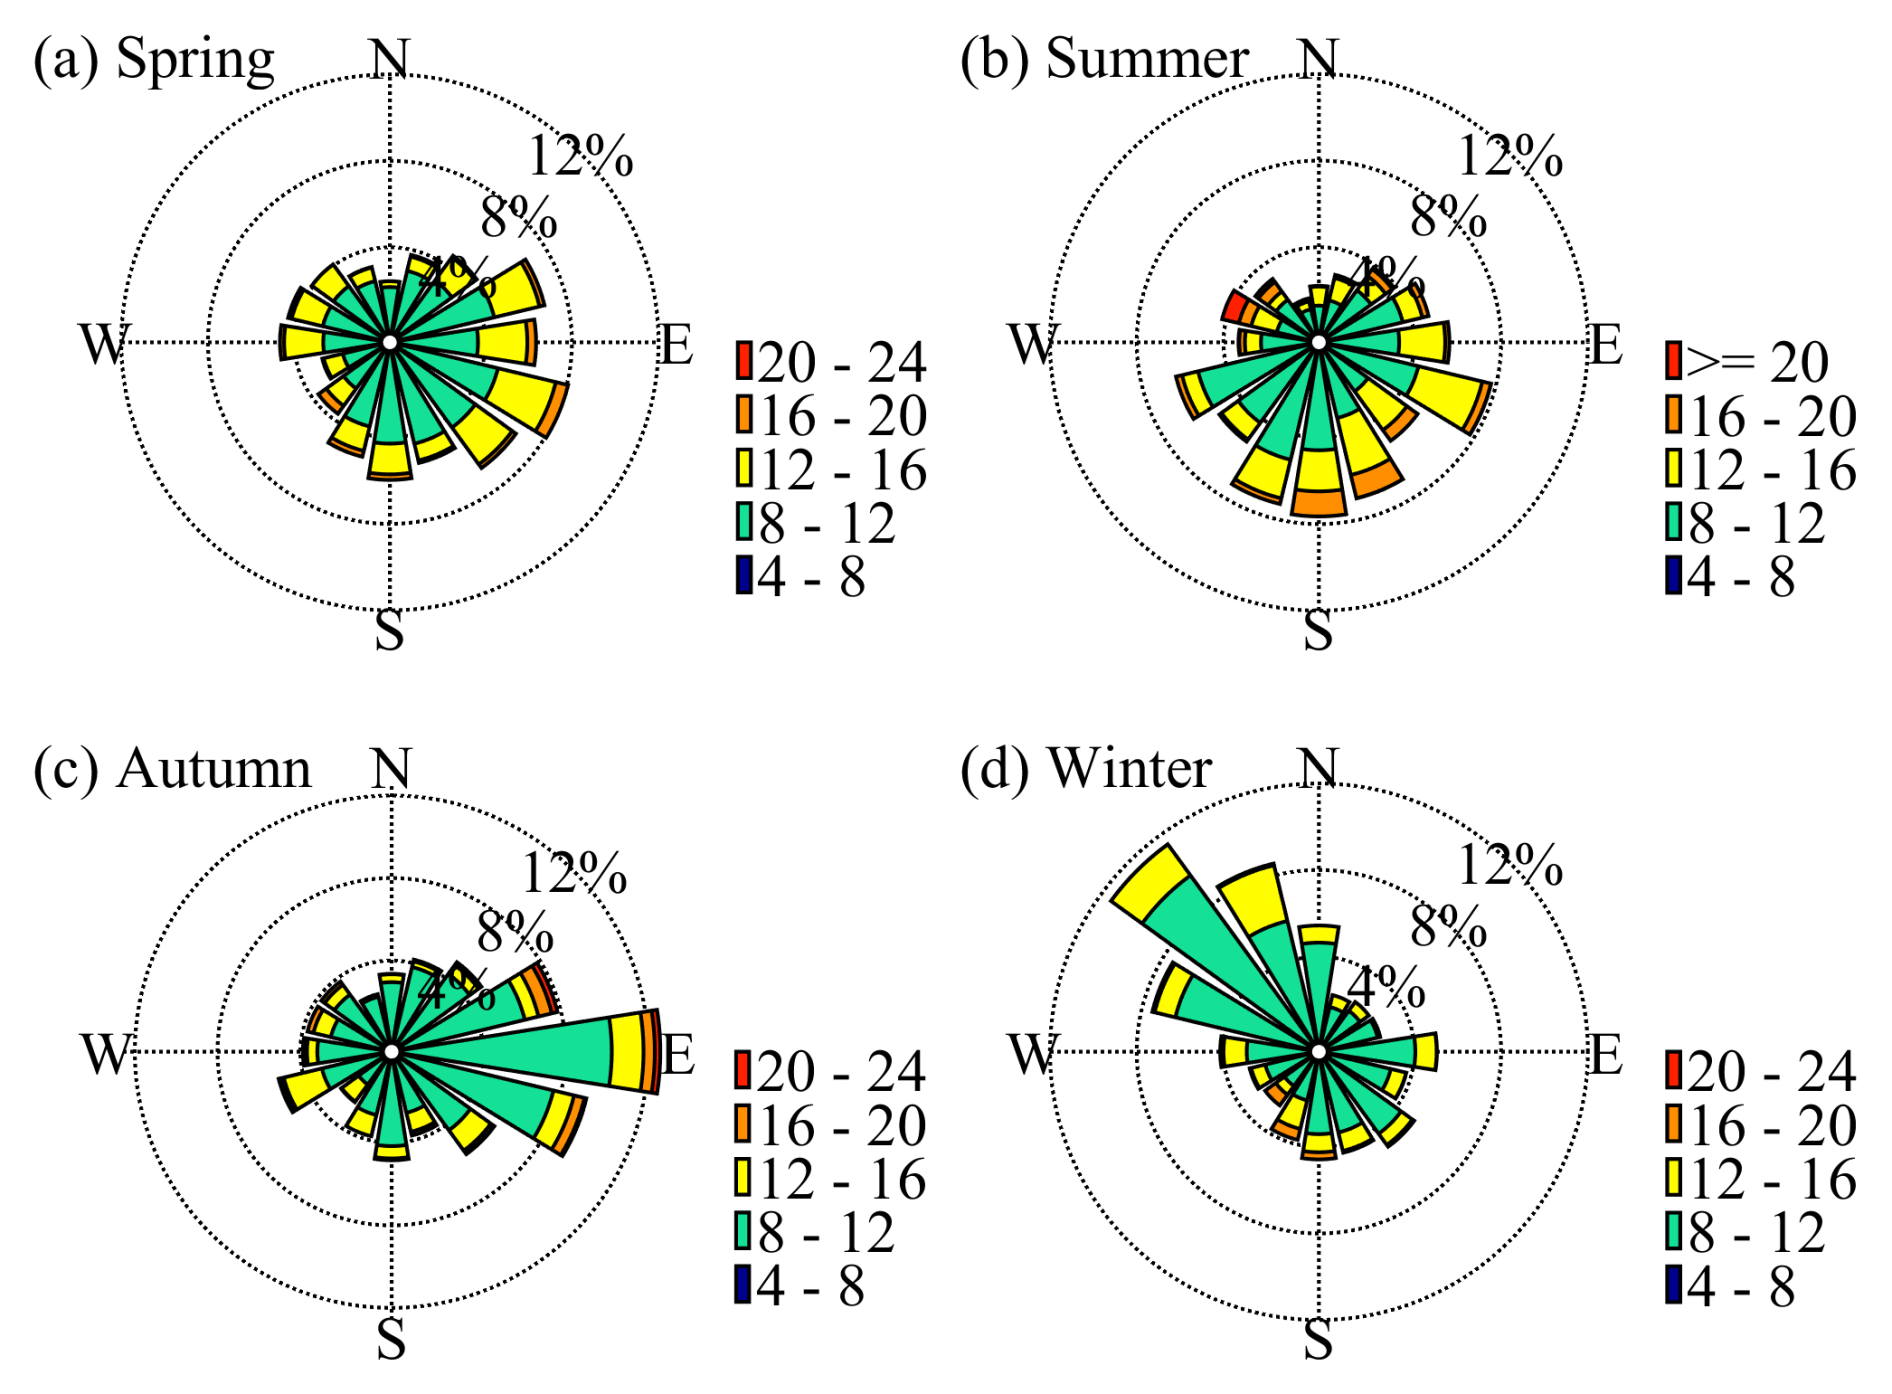
Figure 4a illustrates the statistical frequency (%) of the occurrences of LLJs at different hours for each month. Frequency values are calculated as the ratio of the total number of LLJ occurrences to the total number of available days in a specific month over a 3-year period. Additionally, the monthly variation between the sunrise, noon, and sunset times was also plotted. Figure 4b presents the frequency distribution (%) of LLJs occurrences over the height for each month, with the sum of each column equaling 100 %. The seasonal wind rose charts of the LLJ events are presented in Fig. 5a–d. The seasonal and intraseasonal variability of predominant wind directions and wind speeds of LLJs are influenced by the general circulation, East Asian monsoon, and synoptic systems.
As shown in Fig. 4a, the results indicate that LLJs occur most frequently in spring in Hefei, which aligns with findings by Yan et al. (2021) based on long-term radiosonde observations in the Huaihe River Basin from 2011 to 2017. The seasonal average frequency of LLJ occurrences is the highest in spring (31.7 %), followed by summer (24.7 %), autumn (22.3 %), and winter (21.3 %). LLJs are predominantly observed during the night and early morning throughout the year. According to the classical theoretical description of inertial oscillations, nocturnal LLJs (NLLJs) form due to the decoupling of nocturnal winds from surface friction, facilitated by the development of a near-surface temperature inversion (Blackadar, 1957). At night, the ground cools more rapidly than the air above, giving rise to the formation of temperature inversions. This inversion effectively reduces the influence of surface friction on the air above it (Mirza et al., 2024). The reduced friction allows the wind aloft to accelerate, leading to the development of a pronounced super-geostrophic wind speed maximum. Such undisturbed inertial oscillations are widely recognized as a primary mechanism for the formation of NLLJs (Sisterson and Frenzen, 1978). LLJs are typically most pronounced during the early morning hours, just before the onset of daytime heating, when the temperature inversion is the strongest due to prolonged nocturnal cooling. After sunrise, daytime heating gradually disrupts the stable boundary layer, reducing the conditions favorable for LLJ formation. Consequently, LLJs are less frequent between noon and sunset.
Figure 4b shows that more than 70 % of LLJs occur at heights ranging from 0.3 to 0.8 km a.g.l. in all seasons except summer. The vertical distribution agrees with previous studies. For instance, Yan et al. (2021) reported that 400 m a.g.l. was the most frequent height for the jet nose appearing in the Huaihe River Basin. Wei et al. (2013) revealed that 76 % of the observed LLJs occurred at an average altitude below 600 m in the Yangtze River Delta (YRD) region. Following the classification of Rife et al. (2010), the dominant type of LLJs in Hefei can be identified as BLJs that occur mainly in the PBL below 1 km a.g.l. The highest occurrence frequency of LLJs appeared between 0.5 and 0.6 km a.g.l. in most months, with peak heights between 0.7 and 0.8 km a.g.l. in July.
The frequent occurrence of LLJs at heights below 1 km a.g.l. enhances vertical mixing and turbulence within the lower atmosphere, breaking the decoupled boundary layer structure and restoring vertical heat, momentum, and pollutant exchanges. During the nighttime, when stable stratification dominates, LLJs can reduce the accumulation of air pollutants near the surface by transporting them to higher altitudes. This mechanism is particularly important for urban areas like Hefei, where industrial and vehicular emissions often lead to air quality concerns. The temporal and vertical distribution of LLJs also has practical implications for low-altitude economic activities. For example, understanding LLJ dynamics provides valuable insights for designing safe and efficient drone flight routes, especially in areas with complex terrain or during nighttime operations. Additionally, the strong wind velocities associated with LLJs make them a key consideration for wind energy planning, particularly in optimizing the placement of wind turbines to maximize energy capture and efficiency.
The mechanisms driving LLJs include inertial oscillations under stable stratification, fronts and baroclinic weather patterns in flat terrain, and orographic and thermal effects in complex terrain. Considering the topography and weather patterns, Hefei is prone to cyclones throughout the year, so the Asian monsoon system and synoptic processes may be the most important influential factors in LLJ activities. In contrast, previous studies on the LLJ climatology over other typical regions or cities showed different seasonal variations of LLJ occurrences. For example, LLJs occur more often in spring and winter in Beijing, while they appear more frequently from October to December and from February to April in Guangzhou using long-term wind profiler observations (Miao et al., 2018).
Figure 5 shows the wind characteristics at the nose height of LLJs across different seasons. The dominant wind directions are southeast in spring, south in summer, and more concentrated in autumn (easterly) and winter (northwesterly). These characteristics in Hefei are closely related to the East Asian monsoon system and associated large-scale atmospheric circulations. In spring, LLJs occur most frequently due to the interaction between cold northerly air masses and warm, moist southerly flows during the transition from the East Asian winter monsoon (EAWM) to the East Asian summer monsoon (EASM). This dynamic interaction generates strong baroclinic conditions that are favorable for LLJ formation. In summer, the fully developed EASM and the northwestward expansion of the western Pacific subtropical high (WPSH) (Wang et al., 2023; Yang et al., 2022) stabilize the boundary layer structure, leading to fewer LLJs compared to spring but with greater intensity (more than half of HWS exceeding 12 m s−1). The predominant wind directions during summer are southerly or southeasterly, reflecting the influence of the monsoonal flow. During autumn and winter, LLJs are less frequent as the WPSH retreats, and the EAWM becomes dominant. Autumn marks the gradual transition, with occasional easterly LLJs influenced by the lingering WPSH. In winter, the stable conditions induced by the EAWM and associated high-pressure systems suppress LLJ formation, resulting in weak and infrequent northwesterly LLJs.
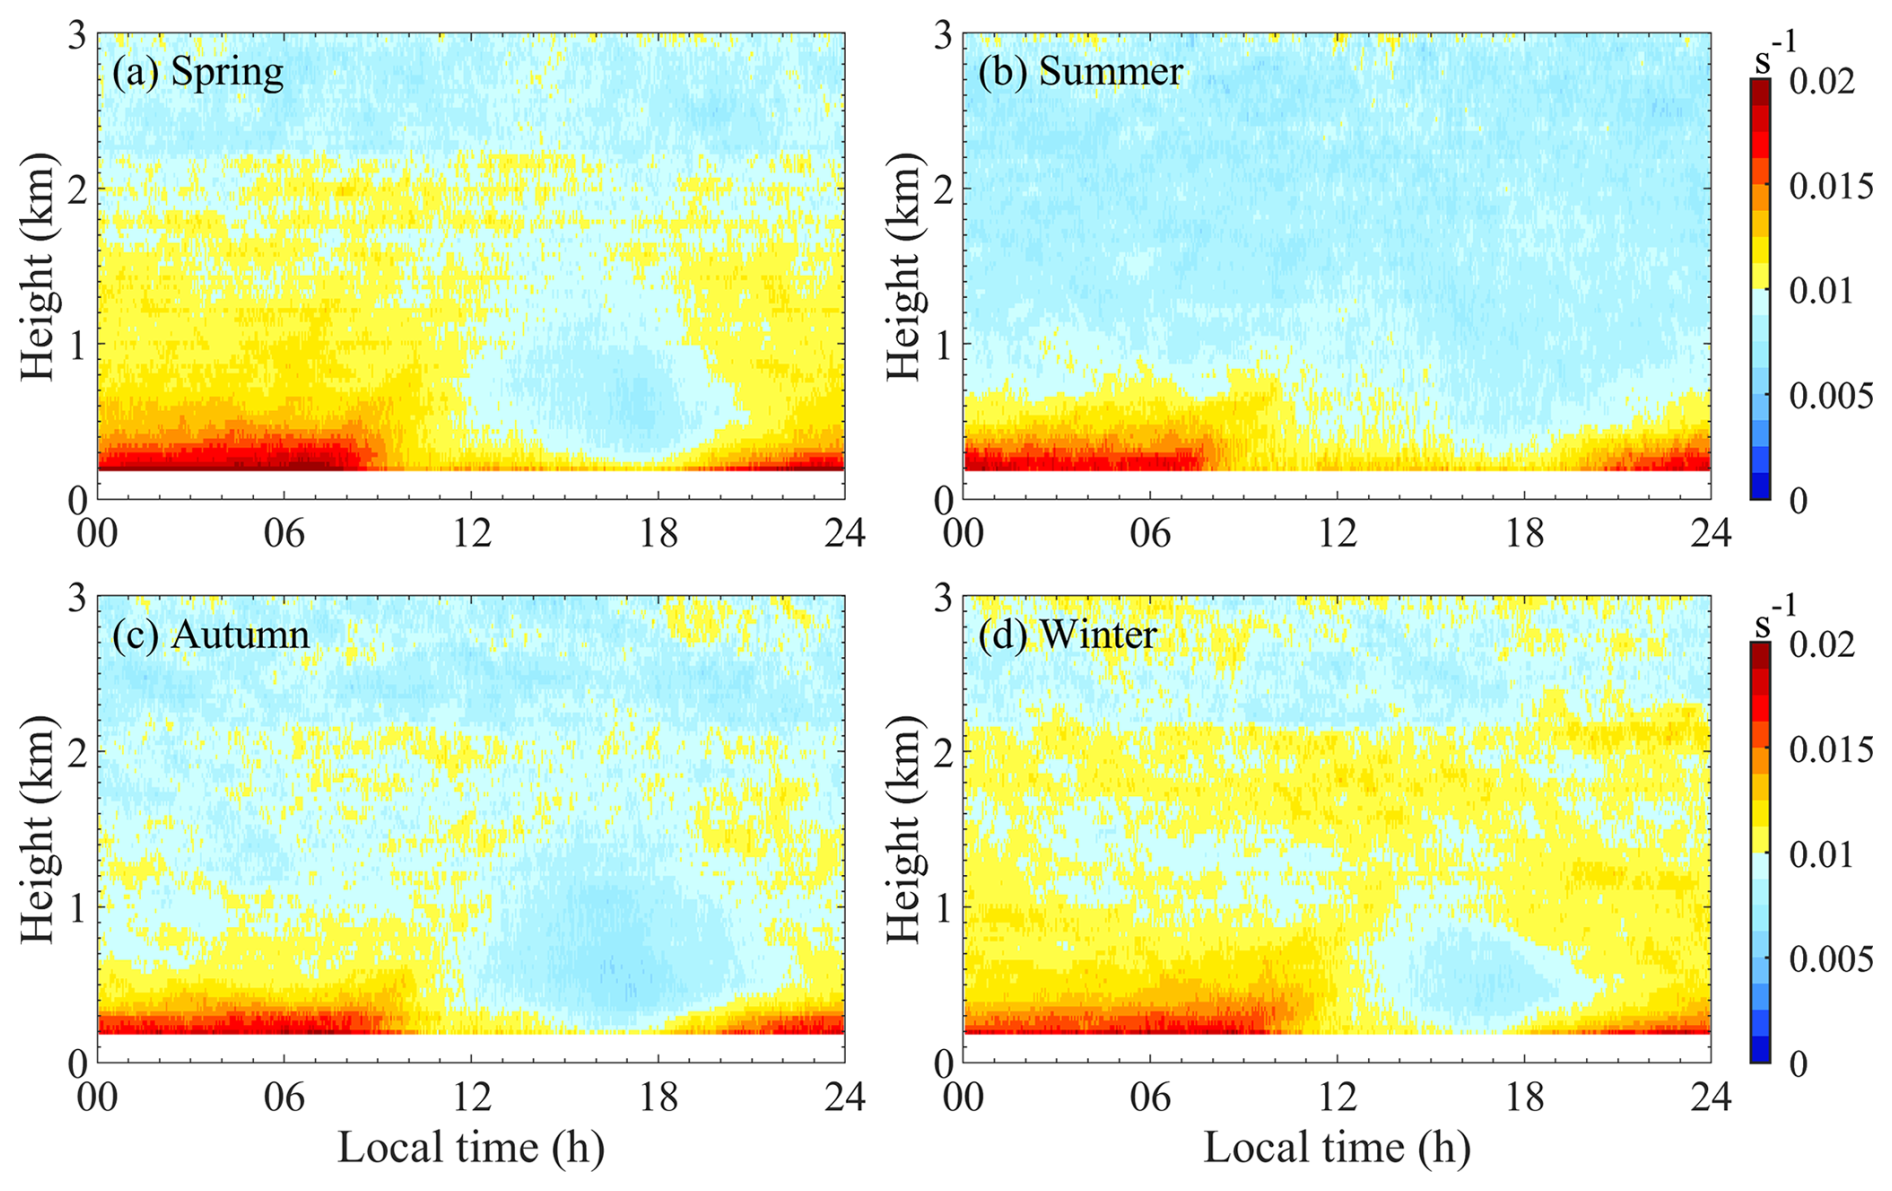
3.4 Diurnal cycle of VWSH profiles for each season
VWSH depends directly on vertical wind profiles and exhibits both diurnal and seasonal variations within the boundary layer, as shown in Fig. 6a–d. Due to surface friction, the wind speeds decrease within the urban canopy, eventually reaching zero at ground level. These rapid changes in wind speed create a large wind speed gradient, resulting in an increased shear intensity in the surface layer. Throughout all seasons in Hefei, high VWSH values exceeding 0.015 m s−1 m−1 (hereafter denoted by s−1) are typically observed below 0.4 km.
Below 0.5 km, VWSH decreases from sunrise to the afternoon due to surface heating and increased atmospheric mixing, which consequently led to a more uniform wind profile (Fig. 3). In contrast, it increases from sunset to early morning as surface cooling induces a temperature inversion, which creates a stable boundary layer where winds aloft decouple from the surface. At night, a sharper wind speed gradient with height is created under a fully developed stable boundary layer, leading to maximum VWSH in this layer. In the low to mid-level atmosphere (0.5–1 km), VWSH also varies diurnally, with relatively lower values compared to VWSH below 0.5 km. Daytime VWSH in this layer is generally due to the well-mixed boundary layer, but it can vary depending on local weather conditions and synoptic influences. At night, high VWSH values above 0.01 s−1 is usually associated with the presence of a LLJs and/or a strong temperature inversion, with the maximum VWSH typically occurring just below the core of the LLJs. In the upper level (>1 km), VWSH is less influenced by the diurnal cycle and remains relatively stable throughout the day. However, high VWSH can still occur in this layer when it is coupled with LLJs or influenced by large-scale synoptic systems.
The seasonal variation in VWSH is closely linked to the region's climatic patterns, particularly the influence of the East Asian monsoons, which drive significant changes in temperature, wind patterns, and atmospheric stability throughout the year. In general, high VWSH values (>0.015 s−1) near the surface are related to LLJ occurrences across all seasons. On the contrary, VWSH values above 1 km in spring and winter are significantly larger compared to summer and autumn, during which the spatial pattern also corresponds to vertical distributions of seasonal HWS profiles. During the two seasons, Hefei often receives an invasion of cold air/surge events, leading to strong winds. In winter, Hefei experiences strong VWSH, primarily due to the impact of the EAWM and large-scale synoptic systems, such as cold fronts and jet streams. Weaker solar heating in winter results in less pronounced diurnal variation in VWSH. These synoptic systems also lead to significant VWSH (>0.01 s−1) above 1 km, which is characterized by strong winds aloft. In spring, Hefei experiences strong VWSH due to the transitional atmospheric conditions of the season. The diurnal variation shows a decrease in VWSH after 08:00 UTC+8 in the morning compared to winter (Fig. 6a). The variability in wind directions and speeds contributed to fluctuating VWSH above 1 km influenced by shifting synoptic-scale systems and developing convective activity in late spring.
In contrast, relatively lower VWSH values between 0.005 and 0.01 s−1 above 1 km are observed in summer. The weather is dominated by the summer monsoon flow and localized convective systems. These conditions result in a generally weaker VWSH with less pronounced diurnal variation compared to other seasons. Due to significant vertical convective mixing, the wind profile becomes more uniform, resulting in weaker VWSH above 1 km (Fig. 6b). As the influence of the winter monsoon begins to dominate, the strong winds aloft and weak surface winds contribute to increasing VWSH in autumn compared to summer (Fig. 6c). Similar to winter, VWSH in autumn is more pronounced at night and early morning due to the formation of temperature inversions. During the day, the reduction in VWSH driven by vertical mixing is less noticeable than in summer, as the overall atmospheric stability increases.
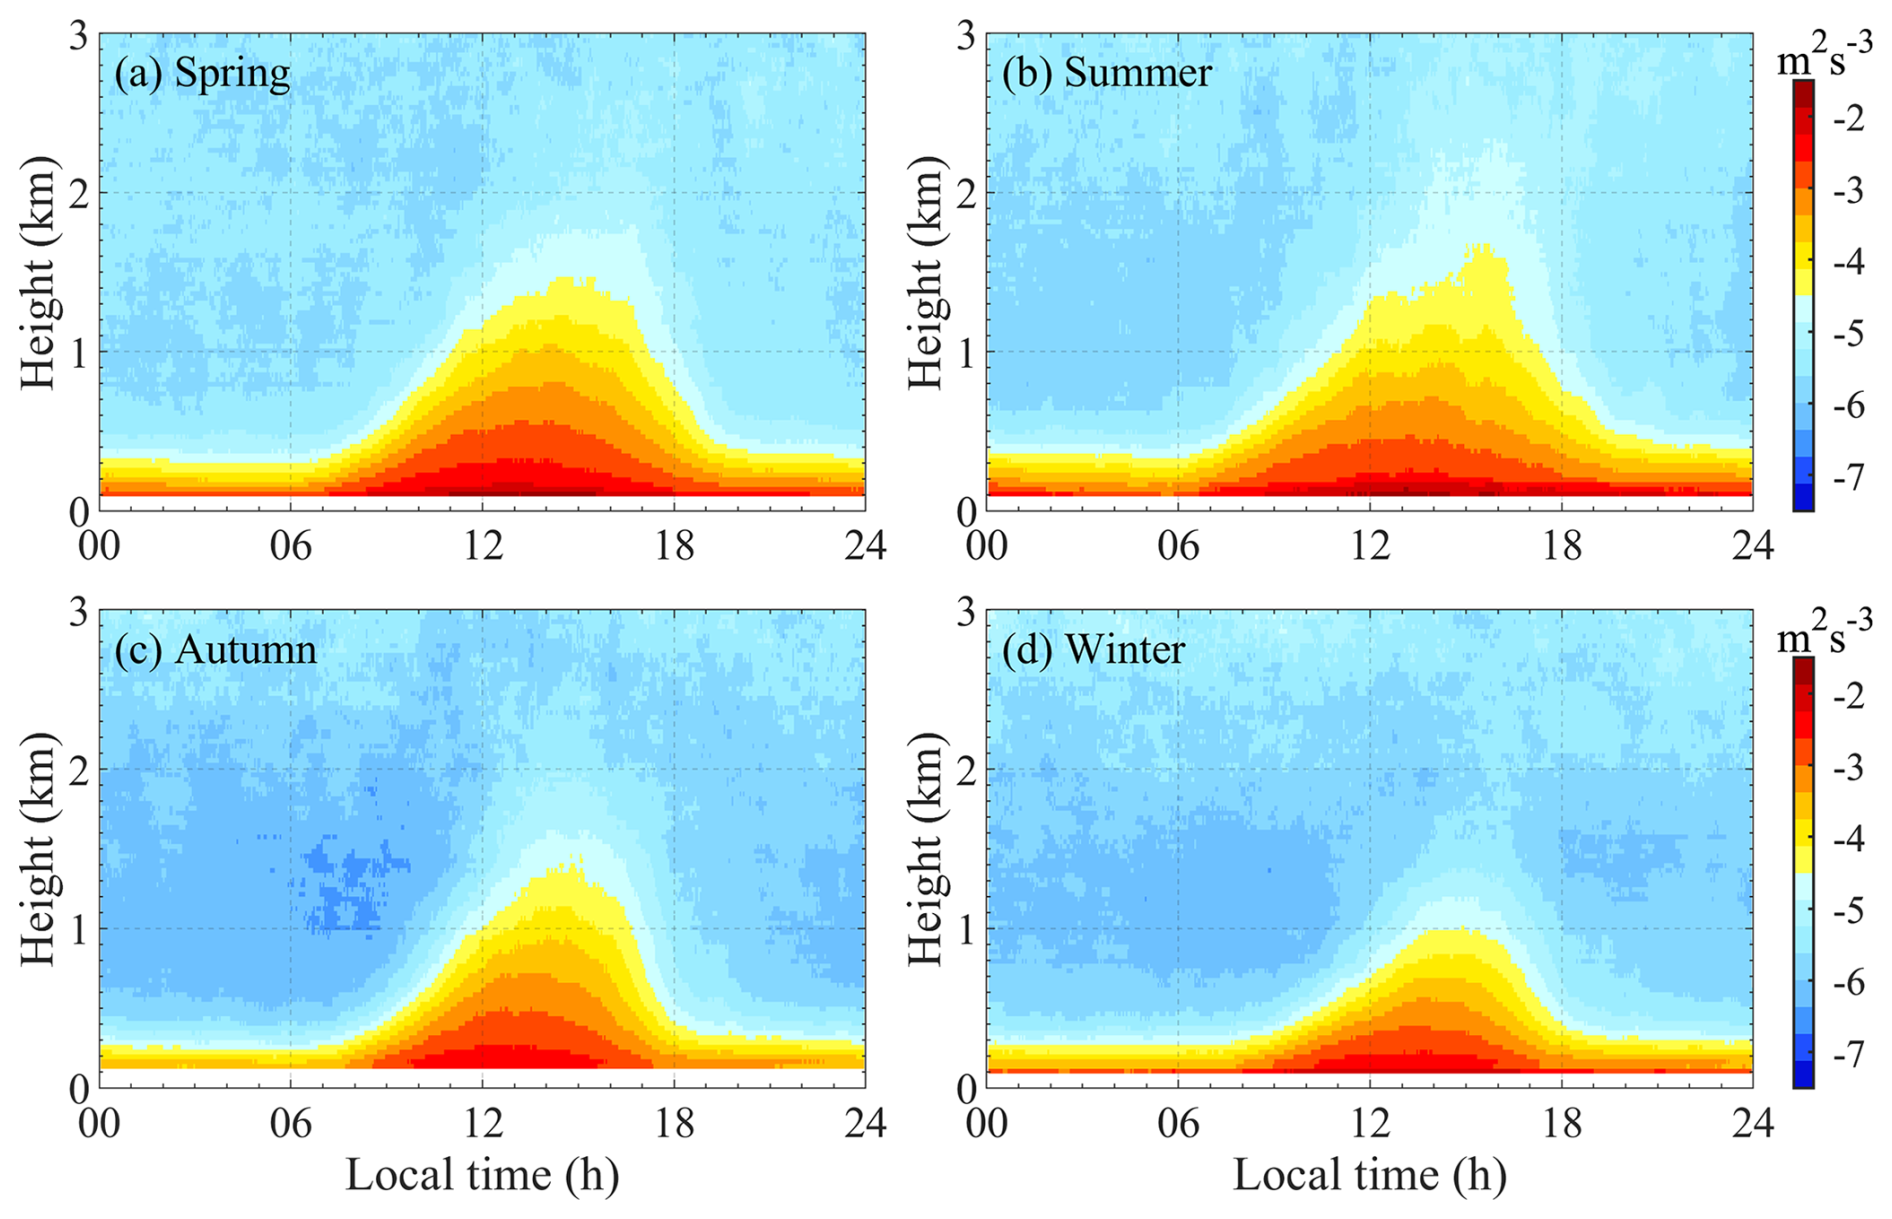
3.5 Seasonal characteristics of the diurnal TKEDR profiles
As one of the characteristic features of atmospheric turbulence, TKEDR plays a crucial role in boundary layer parameterization schemes. It determines the rate at which turbulent kinetic energy is converted to thermal energy, directly influencing the vertical fluxes of momentum, heat, and mass. Long-term measurements of TKEDR will enhance our understanding of boundary layer dynamic processes and lead to more accurate simulations in atmospheric models.
Figure 7 illustrates the typical diurnal and seasonal cycles of the TKEDR profile. TKEDR is the highest near the surface, with typical values ranging from approximately 10−3 to 10−2 m2 s−3 depending on the time of day and season. It decreases with height due to the diminishing influence of surface friction and thermal stratification. The convective boundary layer (or mixing layer) is clearly visible by noting where TKEDR is high. Diurnal variation starts from sunrise, as the increased temperature gradient between the surface and the above air enhances thermal buoyancy, which in turn promotes vertical convective mixing and turbulence. This causes TKEDR near the surface to grow and extend toward higher altitudes. In spring and summer, stronger and longer solar radiation leads to a more developed convective boundary layer, in terms of both duration and height, compared to autumn and winter. The convective boundary layer reaches its peak in the early afternoon and then begins to decay after 16:00 UTC+8, eventually returning to a shallow well-mixed layer near the ground, approximately 350 m in spring and summer and around 250 m in autumn and winter. During the night, a stable atmospheric layer was formed near the surface, and turbulence was primarily driven by mechanical factors (e.g., wind shear) rather than thermal convection. The complex urban surface roughness enhances wind friction, resulting in intensified turbulence, particularly during spring and summer, when nocturnal LLJs occur more frequently. This increased turbulence contributes to the elevated TKEDR observed at night during these seasons.
As TKEDR decreases with altitude, its contour lines (though not explicitly plotted but evident from the color gradations in Fig. 7) display a right-skewed shape, with a delayed peak time. This delay can be attributed to two factors: first, convective mixing activity takes time to propagate upward from the surface. Second, the ground cools more rapidly than the air in the late afternoon. Consequently, turbulence at higher altitudes lags low-level activity, reflecting the thermally driven development of turbulence and energy within the atmospheric boundary layer.
Here, we define the top of the convective boundary layer as the height where TKEDR reaches 10−4 m2 s−3. It should be noted that this height can be different from MLH given in the next section (Sect. 3.6), where the seasonal average MLH is calculated using the daily MLHs. We can see that the top of the convective boundary layer during the daytime in summer exhibits dramatic fluctuations, as shown in Fig. 7b, which could be attributed to the deep convective activities in the afternoon. Unstable atmospheric stratification enhances vertical convection, leading to the formation of local convective clouds and thunderstorms. These clouds reduce the amount of solar radiation reaching the surface, causing localized cooling. Additionally, this process exacerbates the unevenness in the horizontal distribution of temperature in the affected areas.
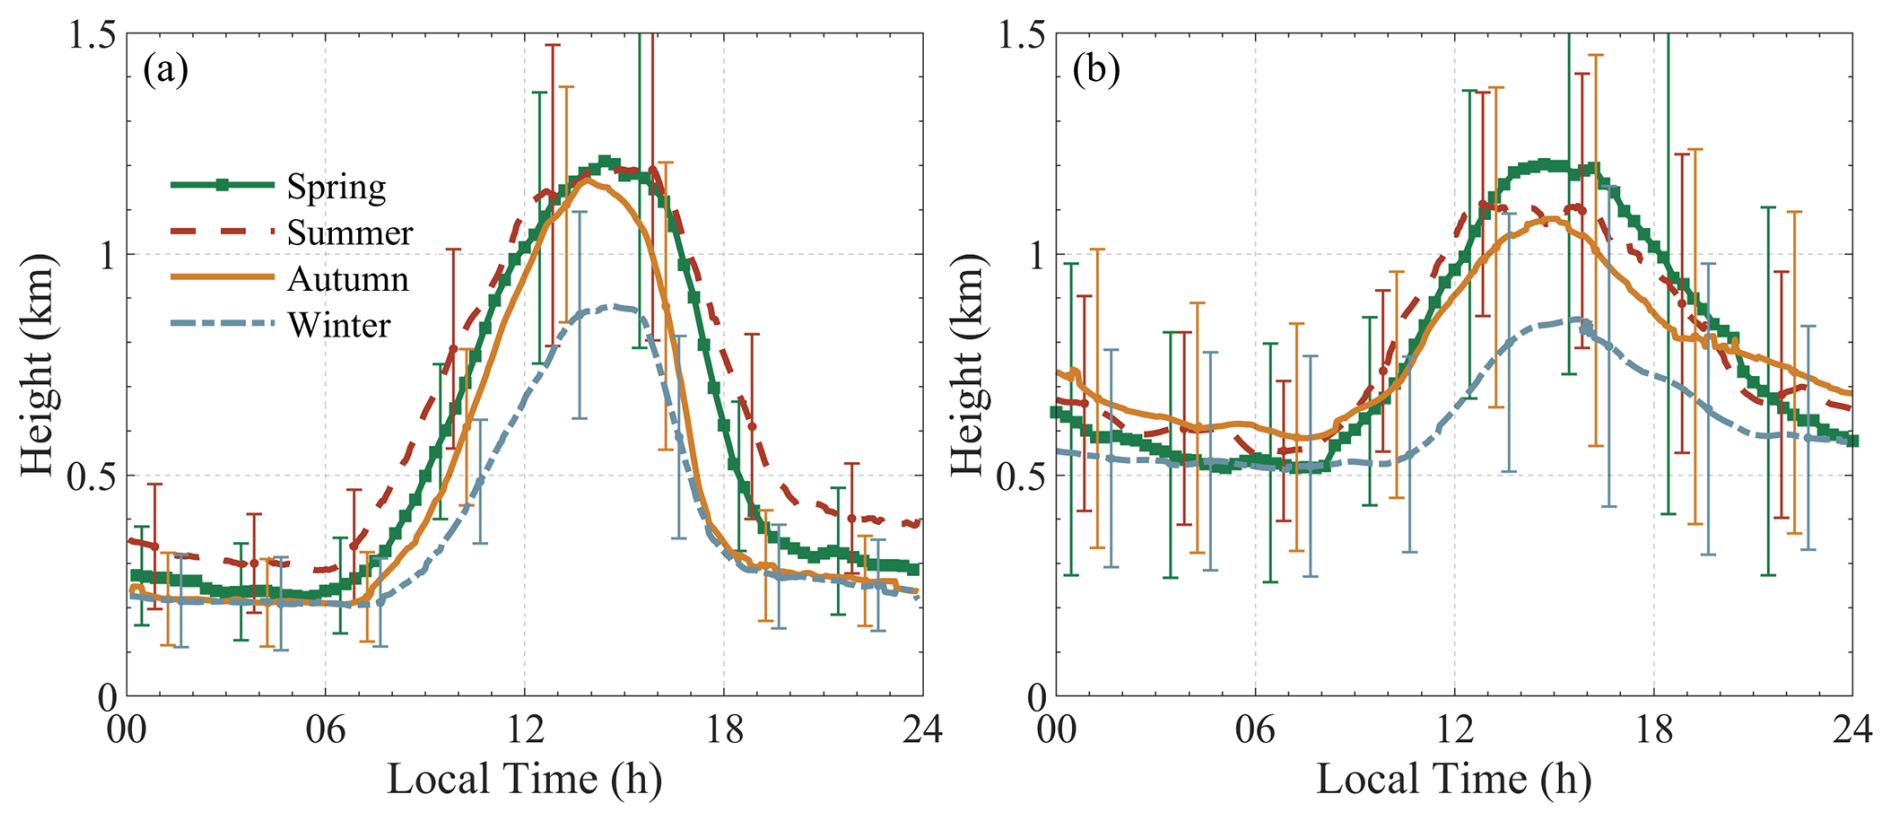
Figure 8Time series of seasonal average (a) MLH and (b) BLH at Hefei. The error bars represent 1 standard deviation ±σ, and their positions (corresponding to time) vary slightly in different seasons to facilitate comparison.
Overall, these seasonal and diurnal variations in TKEDR highlight the complex interactions between surface properties, atmospheric stability, and weather systems in shaping the turbulence characteristics within the boundary layer.
3.6 Seasonal variation in diurnal MLH for clear and cloudy days
The diurnal variations in MLH and BLH across different seasons in Hefei are depicted in Fig. 8a and b, respectively. MLH is based on turbulence activities, while BLH is based on the vertical distribution of material (here aerosol). Therefore, both reflect the diurnal cycle of atmospheric boundary layer dynamics, but there are some differences.
After sunrise, surface heating induced by solar radiation promotes the development of vertical convective mixing and drives the surface aerosols upward. When the temperature gradient between the surface and air reaches its maximum, MLH rises fastest, which appears at about 09:00–10:00 UTC+8 This time varies with seasons, just as the sunrise time, with the earliest being in summer, followed by spring, autumn, and winter. The value of MLH at a certain time also shows the same seasonal relationship, except for the afternoon in summer. Although solar radiation is highest at noon, the shortwave incident radiation received by the surface in the afternoon is still greater than the longwave outgoing radiation. Therefore, MLH continues to grow, reaching its maximum between 14:00 and 15:00 UTC+8 at about 1.2 km in spring and summer, which is slightly lower in autumn, and 0.8 km in winter.
The similar afternoon peak of MLH between summer and spring could be attributed to several factors. In the Northern Hemisphere, the summer solstice which occurs around 21 or 22 June, is relatively close to the spring period. This timing means that the transition from spring to summer is not always abrupt. Furthermore, high surface temperatures and increased evapotranspiration during summer lead to frequent convective clouds and precipitation. These factors reduce solar radiation received by the ground and weaken convective mixing, which can suppress MLH. As a result, the seasonally average MLH reflects these cloudy conditions, leading to a peak height that may not be as high as one might expect on clear days.
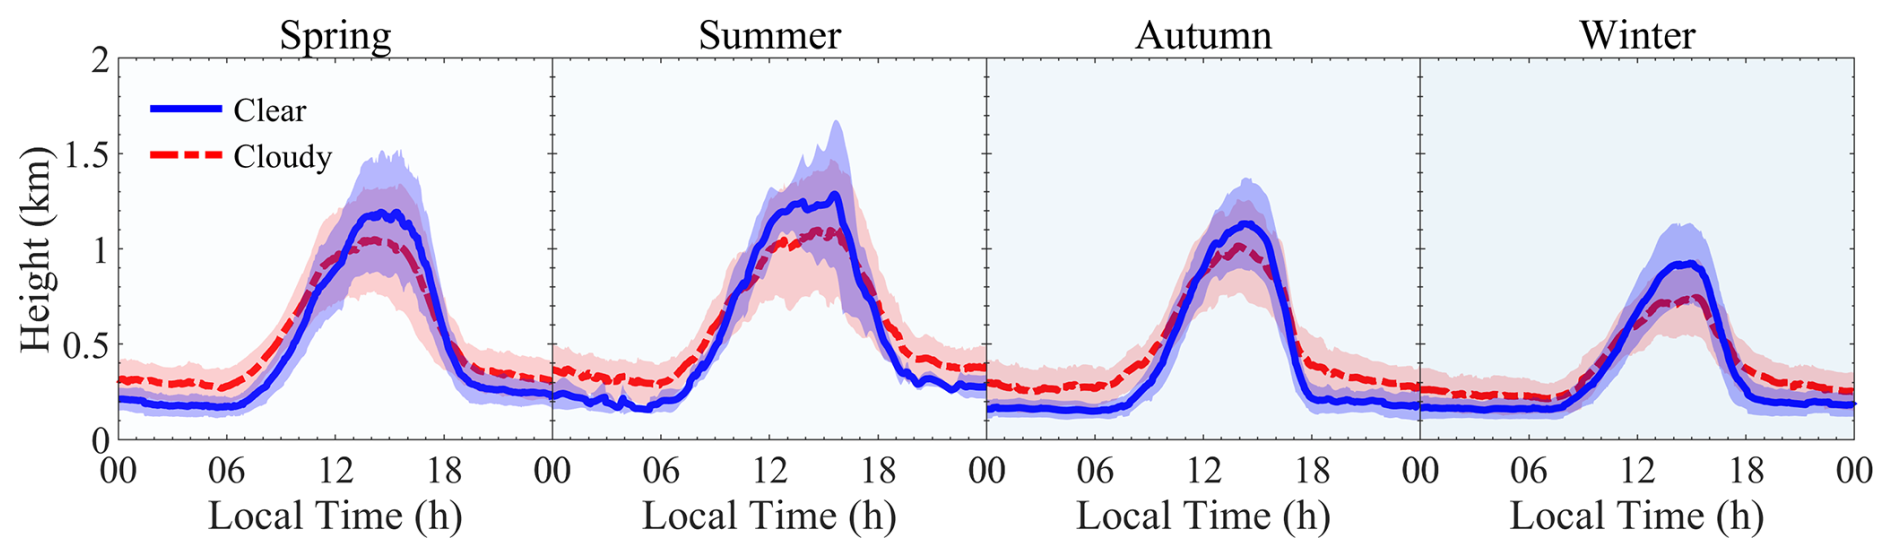
Figure 9Time series of seasonal average MLH (lines) and 1σ standard deviation (shaded areas) for clear days and cloudy days at Hefei.
In the late afternoon, as surface temperatures decrease due to radiative cooling, vertical convection weakens, and turbulence kinetic energy dissipates more rapidly, leading to a faster decline in MLH compared to its increase in the morning. Meanwhile, the decrease in BLH is more gradual due to the slower rate of dry deposition of aerosols. It is noteworthy to state that the BLH curves exhibit larger fluctuations and significantly higher standard deviations compared to the MLH curves. This is primarily due to the considerable retrieval uncertainty in BLH measurements, which are influenced by aerosol distribution. Transboundary aerosols, clouds, and multilayer aerosols (e.g., residual layer) frequently affect these measurements, which is a well-recognized issue with aerosol-based BLH retrieval methods (Dang et al., 2019; Mei et al., 2022; Kotthaus et al., 2023; Barlow et al., 2011).
During the night, the temperature inversion layer inhibits vertical thermal convection and mixing. Instead, mechanical mixing driven by wind shear becomes predominant, especially in the presence of low-level jets. Consequently, MLH is typically the highest in summer at about 0.3 km, followed by spring, and the lowest in autumn and winter at about 0.2 km. In contrast, BLH remains higher than MLH at approximately 0.5–0.7 km. The higher nocturnal BLH in autumn may be related to the transboundary transport of aerosols and meteorological factors. Both MLH and BLH continue to decrease and reach their minimum at sunrise in the next diurnal cycle.
To further investigate the influence of clouds on the development of MLH, we compared the seasonally averaged diurnal MLH under different weather conditions, as shown in Fig. 9. The diurnal MLH showed significant differences between clear and cloudy days and exhibited similar characteristics in each season. Overall, the diurnal variation in MLH was less pronounced on cloudy days with a flatter curve due to the modulation of clouds on the surface radiation budget. During the daytime, the presence of clouds typically reduces surface heating by solar radiation, which inhibits the development of vertical convective mixing and results in a shallower mixed layer compared to clear weather conditions. The difference in MLH reaches its maximum of about 200 m in the afternoon. While during the night, clouds act as a greenhouse by absorbing longwave radiation from the ground and slowing down the radiative cooling, which results in a higher MLH compared to clear days. The mean difference in MLH between cloudy and clear days is about 100 m.
Note that the diurnal MLH in summer showed relatively large variations, particularly on clear days. This variability can be attributed to strong and variable convective activity as well as to the limited number of data samples. Plum rains and frequent convective clouds in summer lead to a much lower proportion of sunny days than in other seasons.
This study utilized 3 years of Doppler wind lidar measurements (from June 2019 to June 2022) to characterize the PBL dynamics over Hefei, a rapidly developing city in the western YRD, China. By analyzing key parameters such as wind profiles, low-level jets, turbulence, and boundary layer height, this study provides a detailed characterization of the seasonal and diurnal variability of urban PBL dynamics in a monsoon-influenced subtropical environment.
The results show that HWS steadily increases from 2 to 7 m s−1 between 300 m and 3 km a.g.l., with a more rapid acceleration above 3 km, particularly in autumn and winter. Westerly winds (270°±15°) dominate above 3 km, while wind directions within the PBL are more variable, influenced by local topography and surface roughness. LLJs primarily formed at sunset and dissipated by noon, typically occurring at altitudes between 0.5 and 0.6 km throughout the year, except in July. LLJ occurrences are the most frequent in spring (31.7 %), followed by summer (24.7 %), autumn (22.3 %), and winter (21.3 %), with the strongest LLJs being observed in summer, extending to up to 1.5 km.
Strong wind speed gradients below the LLJ-induced large VWSH (up to 0.02 s−1) and the elevated TKEDR (up to 10−2 m2 s−3) in the near-surface layer at night, promoting vertical mixing of pollutants. Seasonal wind direction shifts in LLJ nose (e.g., southerly in summer and northeasterly in winter) reflected the interplay between monsoonal flows and local topography. During the daytime, TKEDR increases and extends toward higher altitudes with the transport of heat, momentum, and mass. Turbulence mixing slows down wind speeds by increasing surface friction, forming a gentler wind zone and reducing shear intensity. An interesting fluctuation in TKEDR above MLH top during early summer afternoons is attributed to atmospheric instability after continuous surface heating.
The dynamics-based MLH exhibits smaller fluctuations and lower standard deviations compared to the aerosol-based BLH. MLH peaked between 14:00 and 15:00 UTC+8, reaching ∼1.2 km in spring and summer, with slightly lower values in autumn and values around 0.8 km in winter. After sunset, it eventually returns to a shallow well-mixed layer near the ground (∼350 m in spring and summer, and ∼250 m in autumn and winter). Compared to clear days, cloud cover reduces MLH by about 200 m at the afternoon peak time while increasing it by approximately 100 m at night. These results quantify the different influence of cloud coverage to the development of MLH during day and night.
In conclusion, this study leverages the high temporal and spatial resolution of Doppler wind lidar to provide a detailed characterization of urban PBL dynamics, offering valuable insights into their complex interactions with surface heating and cooling, atmospheric stability, clouds, and synoptic-scale weather systems. Long-term lidar observations of LLJs, MLH, and TKEDR provide critical insights into vertical mixing, turbulence, and pollutant transport in a monsoon-influenced subtropical environment, enriching the climatological understanding of LLJs and PBL processes over the western Yangtze River Delta. These results have also significant practical implications, serving as valuable references for local standards and regional planning by supporting strategies for urban air quality management and the development of low-altitude economic activities. Specifically, the results inform vertical zoning for applications such as wind energy development and drone logistics, guiding optimal turbine placement and flight route planning. Overall, this study underscores the importance of lidar-based observations in addressing regional atmospheric challenges and advancing environmental and economic sustainability.
Despite these insights, this study is constrained to a single urban observational site and focuses on statistical analysis. Future research will extend observations to multiple sites, including urban, suburban, and rural to comprehensively capture the spatial variability of PBL processes and LLJ characteristics across different land-use types and topographic conditions. Additionally, subsequent studies will conduct specific case analyses under varying meteorological scenarios, integrating aerosol observations and high-resolution numerical models. These efforts aim to enhance our understanding of the interactions between aerosols, clouds, radiation, and PBL dynamics, particularly their influence on vertical mixing and boundary layer evolution.
The Doppler wind lidar data used in this study can be provided for non-commercial research purposes upon request to the first author (Tianwen Wei, twwei@nuist.edu.cn).
TW: conceptualization, methodology, data curation, formal analysis, visualization, and writing (review and editing). MW: conceptualization, writing (original draft), methodology, and investigation. KW: resources, data curation. JY: resources and data curation. HX: conceptualization, supervision, resources, and validation. SL: writing (review and editing), and validation.
At least one of the (co-)authors is a member of the editorial board of Atmospheric Measurement Techniques. The peer-review process was guided by an independent editor, and the authors also have no other competing interests to declare.
Publisher’s note: Copernicus Publications remains neutral with regard to jurisdictional claims made in the text, published maps, institutional affiliations, or any other geographical representation in this paper. While Copernicus Publications makes every effort to include appropriate place names, the final responsibility lies with the authors.
This work was supported by the National Natural Science Foundation of China (grant no. 42405136), the China Meteorological Administration Xiong'an Atmospheric Boundary Layer Key Laboratory (grant no. 2023LABL-B11), and the Natural Science Research of Jiangsu Higher Education Institutions of China (grant no. 23KJB170012).
This paper was edited by Daniel Perez-Ramirez and reviewed by two anonymous referees.
Baklanov, A. A., Grisogono, B., Bornstein, R., Mahrt, L., Zilitinkevich, S. S., Taylor, P., Larsen, S. E., Rotach, M. W., and Fernando, H. J. S.: The nature, theory, and modeling of atmospheric planetary boundary layers, B. Am. Meteor. Soc., 92, 123–128, https://doi.org/10.1175/2010BAMS2797.1, 2011.
Banakh, V. A., Brewer, A., Pichugina, E. L., and Smalikho, I. N.: Measurements of wind velocity and direction with coherent doppler lidar in conditions of a weak echo signal, Atmospheric Ocean. Opt., 23, 381–388, https://doi.org/10.1134/S1024856010050076, 2010.
Banakh, V. A., Smalikho, I. N., and Falits, A. V.: Estimation of the turbulence energy dissipation rate in the atmospheric boundary layer from measurements of the radial wind velocity by micropulse coherent doppler lidar, Opt. Express, 25, 22679, https://doi.org/10.1364/oe.25.022679, 2017.
Banakh, V. A., Smalikho, I. N., and Falits, A. V.: Estimation of the height of the turbulent mixing layer from data of Doppler lidar measurements using conical scanning by a probe beam, Atmos. Meas. Tech., 14, 1511–1524, https://doi.org/10.5194/amt-14-1511-2021, 2021.
Barlow, J. F.: Progress in observing and modelling the urban boundary layer, Urban Clim., 10, 216–240, https://doi.org/10.1016/j.uclim.2014.03.011, 2014.
Barlow, J. F., Dunbar, T. M., Nemitz, E. G., Wood, C. R., Gallagher, M. W., Davies, F., O'Connor, E., and Harrison, R. M.: Boundary layer dynamics over London, UK, as observed using Doppler lidar during REPARTEE-II, Atmos. Chem. Phys., 11, 2111–2125, https://doi.org/10.5194/acp-11-2111-2011, 2011.
Blackadar, A. K.: Boundary layer wind maxima and their significance for the growth of nocturnal inversions, B. Am. Meteor. Soc., 38, 283–290, https://doi.org/10.1175/1520-0477-38.5.283, 1957.
Caicedo, V., Rappenglück, B., Lefer, B., Morris, G., Toledo, D., and Delgado, R.: Comparison of aerosol lidar retrieval methods for boundary layer height detection using ceilometer aerosol backscatter data, Atmos. Meas. Tech., 10, 1609–1622, https://doi.org/10.5194/amt-10-1609-2017, 2017.
Caughey, S. J. and Palmer, S. G.: Some aspects of turbulence structure through the depth of the convective boundary layer, Q. J. Roy. Meteor. Soc., 105, 811–827, https://doi.org/10.1002/qj.49710544606, 1979.
Chen, S., Tong, B., Russell, L. M., Wei, J., Guo, J., Mao, F., Liu, D., Huang, Z., Xie, Y., Qi, B., Zhang, H., Sun, Y., Zhang, B., Xu, C., Wu, L., and Liu, D.: Lidar-based daytime boundary layer height variation and impact on the regional satellite-based PM2.5 estimate, Remote Sens. Environ., 281, 113224, https://doi.org/10.1016/j.rse.2022.113224, 2022.
Chen, Y., Zhang, A., Zhang, Y., Cui, C., Wan, R., Wang, B., and Fu, Y.: A heavy precipitation event in the Yangtze River basin led by an eastward moving tibetan plateau cloud system in the summer of 2016, J. Geophys. Res.-Atmos., 125, e2020JD032429, https://doi.org/10.1029/2020JD032429, 2020.
Chen, Y.-C., Xue, L., Lebo, Z. J., Wang, H., Rasmussen, R. M., and Seinfeld, J. H.: A comprehensive numerical study of aerosol-cloud-precipitation interactions in marine stratocumulus, Atmos. Chem. Phys., 11, 9749–9769, https://doi.org/10.5194/acp-11-9749-2011, 2011.
Christensen, M. W., Wu, P., Varble, A. C., Xiao, H., and Fast, J. D.: Aerosol-induced closure of marine cloud cells: enhanced effects in the presence of precipitation, Atmos. Chem. Phys., 24, 6455–6476, https://doi.org/10.5194/acp-24-6455-2024, 2024.
Cui, C., Zhou, W., Yang, H., Wang, X., Deng, Y., Wang, X., Xu, G., and Wang, J.: Analysis of the characteristics of the low-level jets in the middle reaches of the Yangtze River during the mei-yu season, Adv. Atmos. Sci., 40, 711–724, https://doi.org/10.1007/s00376-022-2107-1, 2023.
Dang, R., Yang, Y., Li, H., Hu, X.-M., Wang, Z., Huang, Z., Zhou, T., and Zhang, T.: Atmosphere boundary layer height (ABLH) determination under multiple-layer conditions using micro-pulse lidar, Remote Sens., 11, 263, https://doi.org/10.3390/rs11030263, 2019.
Du, Y., Zhang, Q., Chen, Y., Zhao, Y., and Wang, X.: Numerical simulations of spatial distributions and diurnal variations of low-level jets in China during early summer, J. Climate, 27, 5747–5767, https://doi.org/10.1175/JCLI-D-13-00571.1, 2014.
Fochesatto, G. J., Drobinski, P., Flamant, C., Guedalia, D., Sarrat, C., Flamant, P. H., and Pelon, J.: Evidence of dynamical coupling between the residual layer and the developing convective boundary layer, Bound.-Layer Meteorol., 99, 451–464, https://doi.org/10.1023/A:1018935129006, 2001.
Garratt, J.: Review: the atmospheric boundary layer, Earth-Sci. Rev., 37, 89–134, https://doi.org/10.1016/0012-8252(94)90026-4, 1994.
Gu, L., Yao, J., Hu, Z., Ma, Y., Sun, F., Yu, H., Wang, S., Yang, Y., Guo, R., and Qin, Y.: Characteristics of the atmospheric boundary layer's structure and heating (cooling) rate in summer over the northern Tibetan Plateau, Atmos. Res., 269, 106045, https://doi.org/10.1016/j.atmosres.2022.106045, 2022.
Guo, J., Li, Y., Cohen, J. B., Li, J., Chen, D., Xu, H., Liu, L., Yin, J., Hu, K., and Zhai, P.: Shift in the temporal trend of boundary layer height in China using long-term (1979–2016) radiosonde data, Geophys. Res. Lett., 46, 6080–6089, https://doi.org/10.1029/2019GL082666, 2019.
Guo, J., Zhang, J., Yang, K., Liao, H., Zhang, S., Huang, K., Lv, Y., Shao, J., Yu, T., Tong, B., Li, J., Su, T., Yim, S. H. L., Stoffelen, A., Zhai, P., and Xu, X.: Investigation of near-global daytime boundary layer height using high-resolution radiosondes: first results and comparison with ERA5, MERRA-2, JRA-55, and NCEP-2 reanalyses, Atmos. Chem. Phys., 21, 17079–17097, https://doi.org/10.5194/acp-21-17079-2021, 2021.
Hu, F., Xie, P., Xu, J., Li, A., Lv, Y., Zhang, Z., Zheng, J., and Tian, X.: Impacts of synoptic weather patterns on Hefei's ozone in warm season and analysis of transport pathways during extreme pollution events, J. Environ. Sci., 156, 371–384, https://doi.org/10.1016/j.jes.2024.06.032, 2025.
Huang, M., Gao, Z., Miao, S., Chen, F., LeMone, M. A., Li, J., Hu, F., and Wang, L.: Estimate of boundary-layer depth over beijing, china, using doppler lidar data during SURF-2015, Bound.-Lay. Meteorol., 162, 503–522, https://doi.org/10.1007/s10546-016-0205-2, 2017.
Jia, M., Yuan, J., Wang, C., Xia, H., Wu, Y., Zhao, L., Wei, T., Wu, J., Wang, L., Gu, S.-Y., Liu, L., Lu, D., Chen, R., Xue, X., and Dou, X.: Long-lived high-frequency gravity waves in the atmospheric boundary layer: observations and simulations, Atmos. Chem. Phys., 19, 15431–15446, https://doi.org/10.5194/acp-19-15431-2019, 2019.
Jiang, P., Yuan, J., Wu, K., Wang, L., and Xia, H.: Turbulence detection in the atmospheric boundary layer using coherent doppler wind lidar and microwave radiometer, Remote Sens., 14, 2951, https://doi.org/10.3390/rs14122951, 2022.
Justus, C. G., Hargraves, W. R., Mikhail, A., and Graber, D.: Methods for estimating wind speed frequency distributions, J. Appl. Meteorol., 17, 350–353, https://doi.org/10.1175/1520-0450(1978)017<0350:MFEWSF>2.0.CO;2, 1978.
Kang, H., Zhu, B., Gao, J., He, Y., Wang, H., Su, J., Pan, C., Zhu, T., and Yu, B.: Potential impacts of cold frontal passage on air quality over the Yangtze River Delta, China, Atmos. Chem. Phys., 19, 3673–3685, https://doi.org/10.5194/acp-19-3673-2019, 2019.
Kim, C. P. and Entekhabi, D.: Feedbacks in the land-surface and mixed-layer energy budgets, Bound.-Lay. Meteorol., 88, 1–21, https://doi.org/10.1023/A:1001094008513, 1998.
Kotthaus, S., Bravo-Aranda, J. A., Collaud Coen, M., Guerrero-Rascado, J. L., Costa, M. J., Cimini, D., O'Connor, E. J., Hervo, M., Alados-Arboledas, L., Jiménez-Portaz, M., Mona, L., Ruffieux, D., Illingworth, A., and Haeffelin, M.: Atmospheric boundary layer height from ground-based remote sensing: a review of capabilities and limitations, Atmos. Meas. Tech., 16, 433–479, https://doi.org/10.5194/amt-16-433-2023, 2023.
Li, C., Li, H., Zhang, Y., Zha, D., Zhao, B., Yang, S., Zhang, B., and De Boer, W. F.: Predicting hydrological impacts of the Yangtze-to-huaihe water diversion project on habitat availability for wintering waterbirds at caizi lake, J. Environ. Manage., 249, 109251, https://doi.org/10.1016/j.jenvman.2019.07.022, 2019.
Li, L., Zhu, A., Huang, L., Wang, Q., Chen, Y., Ooi, M. C. G., Wang, M., Wang, Y., and Chan, A.: Modeling the impacts of land use/land cover change on meteorology and air quality during 2000–2018 in the Yangtze River delta region, china, Sci. Total Environ., 829, 154669, https://doi.org/10.1016/j.scitotenv.2022.154669, 2022a.
Li, L., Wang, Y., Lu, J., Wang, X., Wu, P., and Tao, Y.: Spatial and temporal variability of maximum wind speed and extreme wind speed in Anhui Province during different recurrence intervals from 1981 to 2020, J. Trop. Meteorol., 38, 662–670, https://doi.org/10.16032/j.issn.1004-4965.2022.060, 2022b.
Li, X., Li, Q.-P., Ding, Y.-H., and Wang, M.: Near-surface wind speed changes in eastern China during 1970–2019 winter and its possible causes, Adv. Clim. Change Res., 13, 228–239, https://doi.org/10.1016/j.accre.2022.01.003, 2022c.
Li, X.-B., Han, Y.-X., Fu, Z.-Y., Zhang, Y.-C., Fan, M., Sang, S.-J., Chen, X.-X., Liang, B.-Y., Liu, Y.-C., Lu, P.-C., Li, H.-W., Pan, H.-F., and Yang, J.-M.: Association of sudden sensorineural hearing loss with meteorological factors: a time series study in hefei, china, and a literature review, Environ. Sci. Pollut. Res., 31, 42970–42990, https://doi.org/10.1007/s11356-024-33943-1, 2024.
Li, Z., Guo, J., Ding, A., Liao, H., Liu, J., Sun, Y., Wang, T., Xue, H., Zhang, H., and Zhu, B.: Aerosol and boundary-layer interactions and impact on air quality, Natl. Sci. Rev., 4, 810–833, https://doi.org/10.1093/nsr/nwx117, 2017.
Li, Z., Song, L., Ma, H., Xiao, J., Wang, K., and Chen, L.: Observed surface wind speed declining induced by urbanization in east China, Clim. Dynam., 50, 735–749, https://doi.org/10.1007/s00382-017-3637-6, 2018.
Liu, H., Huang, X., Fei, J., Zhang, C., and Cheng, X.: Spatiotemporal features and associated synoptic patterns of extremely persistent heavy rainfall over china, J. Geophys. Res.-Atmos., 127, e2022JD036604, https://doi.org/10.1029/2022JD036604, 2022.
Liu, L., Liang, Y., He, C., Li, B., Chu, L., and Li, J.: Evaluating the contribution of climate change and urbanization to the reversal in maximum surface wind speed decline: case study in the Yangtze River economic belt, china, Urban Clim., 52, 101713, https://doi.org/10.1016/j.uclim.2023.101713, 2023.
Liu, X., Guo, Q., Guo, Z., Yin, Z.-Y., Dong, B., and Smith, R.: Where were the monsoon regions and arid zones in Asia prior to the Tibetan Plateau uplift?, Natl. Sci. Rev., 2, 403–416, https://doi.org/10.1093/nsr/nwv068, 2015.
Madala, S., Satyanarayana, A. N. V., and Rao, T. N.: Performance evaluation of PBL and cumulus parameterization schemes of WRF ARW model in simulating severe thunderstorm events over gadanki MST radar facility — case study, Atmos. Res., 139, 1–17, https://doi.org/10.1016/j.atmosres.2013.12.017, 2014.
Manninen, A. J., Marke, T., Tuononen, M., and O'Connor, E. J.: Atmospheric boundary layer classification with doppler lidar, J. Geophys. Res.-Atmos., 123, 8172–8189, https://doi.org/10.1029/2017JD028169, 2018.
Mei, L., Wang, X., Gong, Z., Liu, K., Hua, D., and Wang, X.: Retrieval of the planetary boundary layer height from lidar measurements by a deep-learning method based on the wavelet covariance transform, Opt. Express, 30, 16297, https://doi.org/10.1364/OE.454094, 2022.
Miao, Y., Guo, J., Liu, S., Wei, W., Zhang, G., Lin, Y., and Zhai, P.: The climatology of low-level jet in beijing and guangzhou, china, J. Geophys. Res.-Atmos., 123, 2816–2830, https://doi.org/10.1002/2017JD027321, 2018.
Mirza, A. K., Dacre, H. F., and Lo, C. H. B.: A case study analysis of the impact of a new free tropospheric turbulence scheme on the dispersion of an atmospheric tracer, Q. J. Roy. Meteor. Soc., 150, 1907–1925, https://doi.org/10.1002/qj.4681, 2024.
O'Connor, E. J., Illingworth, A. J., Brooks, I. M., Westbrook, C. D., Hogan, R. J., Davies, F., and Brooks, B. J.: A method for estimating the turbulent kinetic energy dissipation rate from a vertically pointing doppler lidar, and independent evaluation from balloon-borne in situ measurements, J. Atmos. Ocean. Tech., 27, 1652–1664, https://doi.org/10.1175/2010jtecha1455.1, 2010.
Ortiz-Amezcua, P., Andújar-Maqueda, J., Manninen, A. J., Pentikäinen, P., O'Connor, E. J., Stachlewska, I. S., De Arruda Moreira, G., Benavent-Oltra, J. A., Casquero-Vera, J. A., Poczta, P., Wang, D., Harenda, K. M., Chojnicki, B. H., Szczepanik, D. M., Janicka, Ł., Schüttemeyer, D., Alados-Arboledas, L., and Guerrero-Rascado, J. L.: Dynamics of the atmospheric boundary layer over two middle-latitude rural sites with doppler lidar, Atmos. Res., 280, 106434, https://doi.org/10.1016/j.atmosres.2022.106434, 2022.
Parsons, D. B.: An explanation for intense frontal updrafts and narrow cold-frontal rainbands, J. Atmos. Sci., 49, 1810–1825, https://doi.org/10.1175/1520-0469(1992)049<1810:AEFIFU>2.0.CO;2, 1992.
Pérez-Ramírez, D., Whiteman, D. N., Veselovskii, I., Colarco, P., Korenski, M., and da Silva, A.: Retrievals of aerosol single scattering albedo by multiwavelength lidar measurements: Evaluations with NASA langley HSRL-2 during discover-AQ field campaigns, Remote Sens. Environ., 222, 144–164, https://doi.org/10.1016/j.rse.2018.12.022, 2019.
Pérez-Ramírez, D., Whiteman, D. N., Veselovskii, I., Ferrare, R., Titos, G., Granados-Muñoz, M. J., Sánchez-Hernández, G., and Navas-Guzmán, F.: Spatiotemporal changes in aerosol properties by hygroscopic growth and impacts on radiative forcing and heating rates during DISCOVER-AQ 2011, Atmos. Chem. Phys., 21, 12021–12048, https://doi.org/10.5194/acp-21-12021-2021, 2021.
Petrosyan, A., Galperin, B., Larsen, S. E., Lewis, S. R., Määttänen, A., Read, P. L., Renno, N., Rogberg, L. P. H. T., Savijärvi, H., Siili, T., Spiga, A., Toigo, A., and Vázquez, L.: The martian atmospheric boundary layer, Rev. Geophys., 49, 2010RG000351, https://doi.org/10.1029/2010RG000351, 2011.
Pobočíková, I., Sedliačková, Z., and Michalková, M.: Application of four probability distributions for wind speed modeling, Procedia Eng., 192, 713–718, https://doi.org/10.1016/j.proeng.2017.06.123, 2017.
Qin, R. X., Xiao, C., Zhu, Y., Li, J., Yang, J., Gu, S., Xia, J., Su, B., Liu, Q., and Woodward, A.: The interactive effects between high temperature and air pollution on mortality: a time-series analysis in hefei, china, Sci. Total Environ., 575, 1530–1537, https://doi.org/10.1016/j.scitotenv.2016.10.033, 2017.
Qiu, Z., Xian, J., Yang, Y., Lu, C., Yang, H., Hu, Y., Sun, J., and Zhang, C.: Characteristics of coastal low-level jets in the boundary layer of the pearl river estuary, J. Mar. Sci. Eng., 11, 1128, https://doi.org/10.3390/jmse11061128, 2023.
Rife, D. L., Pinto, J. O., Monaghan, A. J., Davis, C. A., and Hannan, J. R.: Global distribution and characteristics of diurnally varying low-level jets, J. Climate, 23, 5041–5064, https://doi.org/10.1175/2010jcli3514.1, 2010.
Shen, L., Cheng, Y., Bai, X., Dai, H., Wei, X., Sun, L., Yang, Y., Zhang, J., Feng, Y., Li, Y. J., Chen, D.-R., Liu, J., and Gui, H.: Vertical profile of aerosol number size distribution during a haze pollution episode in hefei, china, Sci. Total Environ., 814, 152693, https://doi.org/10.1016/j.scitotenv.2021.152693, 2022.
Shi, C., Roth, M., Zhang, H., and Li, Z.: Impacts of urbanization on long-term fog variation in anhui province, china, Atmos. Environ., 42, 8484–8492, https://doi.org/10.1016/j.atmosenv.2008.08.002, 2008.
Sisterson, D. L. and Frenzen, P.: Nocturnal boundary-layer wind maxima and the problem of wind power assessment, Environ. Sci. Technol., 12, 218–221, https://doi.org/10.1021/es60138a014, 1978.
Smalikho, I.: Techniques of wind vector estimation from data measured with a scanning coherent doppler lidar, J. Atmos. Ocean. Tech., 20, 276–291, https://doi.org/10.1175/1520-0426(2003)020<0276:TOWVEF>2.0.CO;2, 2003.
Stull, R. B.: An introduction to boundary layer meteorology, Springer Science & Business Media, 688 pp., https://doi.org/10.1007/978-94-009-3027-8, 1988.
Su, L., Lu, C., Yuan, J., Wang, X., He, Q., and Xia, H.: Measurement report: The promotion of the low-level jet and thermal effects on the development of the deep convective boundary layer at the southern edge of the Taklimakan Desert, Atmos. Chem. Phys., 24, 10947–10963, https://doi.org/10.5194/acp-24-10947-2024, 2024.
Su, T., Li, Z., and Kahn, R.: Relationships between the planetary boundary layer height and surface pollutants derived from lidar observations over China: regional pattern and influencing factors, Atmos. Chem. Phys., 18, 15921–15935, https://doi.org/10.5194/acp-18-15921-2018, 2018.
Su, T., Li, Z., and Kahn, R.: A new method to retrieve the diurnal variability of planetary boundary layer height from lidar under different thermodynamic stability conditions, Remote Sens. Environ., 237, 111519, https://doi.org/10.1016/j.rse.2019.111519, 2020.
Sun, J. and Ongsomwang, S.: Impact of multitemporal land use and land cover change on land surface temperature due to urbanization in hefei city, china, ISPRS Int. J. Geo-Inf., 10, 809, https://doi.org/10.3390/ijgi10120809, 2021.
Sun, Y., Yin, H., Liu, C., Mahieu, E., Notholt, J., Té, Y., Lu, X., Palm, M., Wang, W., Shan, C., Hu, Q., Qin, M., Tian, Y., and Zheng, B.: The reduction in C2H6 from 2015 to 2020 over Hefei, eastern China, points to air quality improvement in China, Atmos. Chem. Phys., 21, 11759–11779, https://doi.org/10.5194/acp-21-11759-2021, 2021.
Tamarin-Brodsky, T. and Hadas, O.: The asymmetry of vertical velocity in current and future climate, Geophys. Res. Lett., 46, 374–382, https://doi.org/10.1029/2018GL080363, 2019.
Tuononen, M., O'Connor, E. J., Sinclair, V. A., and Vakkari, V.: Low-level jets over utö, finland, based on doppler lidar observations, J. Appl. Meteorol. Clim., 56, 2577–2594, https://doi.org/10.1175/JAMC-D-16-0411.1, 2017.
Vivone, G., D'Amico, G., Summa, D., Lolli, S., Amodeo, A., Bortoli, D., and Pappalardo, G.: Atmospheric boundary layer height estimation from aerosol lidar: a new approach based on morphological image processing techniques, Atmos. Chem. Phys., 21, 4249–4265, https://doi.org/10.5194/acp-21-4249-2021, 2021.
Wang, C., Zhou, J., Zhou, S., Zhang, Y., and Zhang, M.: Distribution characteristics of wind in anhui province during 1981 -2012, J. Arid Meteorol., 33, 236–243, http://www.ghqx.org.cn/EN/10.11755/j.issn.1006-7639(2015)-02-0236, 2015a.
Wang, C., Jia, M., Xia, H., Wu, Y., Wei, T., Shang, X., Yang, C., Xue, X., and Dou, X.: Relationship analysis of PM2.5 and boundary layer height using an aerosol and turbulence detection lidar, Atmos. Meas. Tech., 12, 3303–3315, https://doi.org/10.5194/amt-12-3303-2019, 2019.
Wang, H., Li, Z., Lv, Y., Zhang, Y., Xu, H., Guo, J., and Goloub, P.: Determination and climatology of the diurnal cycle of the atmospheric mixing layer height over Beijing 2013–2018: lidar measurements and implications for air pollution, Atmos. Chem. Phys., 20, 8839–8854, https://doi.org/10.5194/acp-20-8839-2020, 2020.
Wang, L., Qiang, W., Xia, H., Wei, T., Yuan, J., and Jiang, P.: Robust solution for boundary layer height detections with coherent doppler wind lidar, Adv. Atmos. Sci., 38, 1920–1928, https://doi.org/10.1007/s00376-021-1068-0, 2021.
Wang, M., Fang, X., Hu, S., Hu, H., Li, T., and Dou, X.: Variation characteristics of water vapor distribution during 2000-2008 over hefei (31.9° N, 117.2° E) observed by L625 lidar, Atmos. Res., 164–165, 1–8, https://doi.org/10.1016/j.atmosres.2015.04.003, 2015b.
Wang, M., Wei, T., Lolli, S., Wu, K., Wang, Y., Hu, H., Yuan, J., Tang, D., and Xia, H.: A long-term doppler wind LiDAR study of heavy pollution episodes in western Yangtze River delta region, china, Atmos. Res., 310, 107616, https://doi.org/10.1016/j.atmosres.2024.107616, 2024.
Wang, S., Wang, Q., Jordan, R. E., and Persson, P. O. G.: Interactions among longwave radiation of clouds, turbulence, and snow surface temperature in the arctic: a model sensitivity study, J. Geophys. Res.-Atmos., 106, 15323–15333, https://doi.org/10.1029/2000JD900358, 2001.
Wang, Y., Hu, H., Ren, X., Yang, X.-Q., and Mao, K.: Significant northward jump of the western pacific subtropical high: The interannual variability and mechanisms, J. Geophys. Res.-Atmos., 128, e2022JD037742, https://doi.org/10.1029/2022JD037742, 2023.
Wei, T., Xia, H., Hu, J., Wang, C., Shangguan, M., Wang, L., Jia, M., and Dou, X.: Simultaneous wind and rainfall detection by power spectrum analysis using a VAD scanning coherent doppler lidar, Opt. Express, 27, 31235–31245, https://doi.org/10.1364/OE.27.031235, 2019.
Wei, T., Xia, H., Wu, Y., Yuan, J., Wang, C., and Dou, X.: Inversion probability enhancement of all-fiber CDWL by noise modeling and robust fitting, Opt. Express, 28, 29662, https://doi.org/10.1364/oe.401054, 2020.
Wei, T., Xia, H., Yue, B., Wu, Y., and Liu, Q.: Remote sensing of raindrop size distribution using the coherent doppler lidar, Opt. Express, 29, 17246–17257, https://doi.org/10.1364/OE.426326, 2021.
Wei, T., Xia, H., Wu, K., Yang, Y., Liu, Q., and Ding, W.: Dark/bright band of a melting layer detected by coherent doppler lidar and micro rain radar, Opt. Express, 30, 3654–3663, https://doi.org/10.1364/OE.450714, 2022.
Wei, T., Wang, M., Jiang, P., Wu, K., Zhang, Z., Yuan, J., Xia, H., and Lolli, S.: Retrieving aerosol backscatter coefficient using coherent doppler wind lidar, Opt. Express, 33, 6832–6849, https://doi.org/10.1364/OE.551730, 2025.
Wei, W., Wu, B. G., Ye, X. X., Wang, H. X., and Zhang, H. S.: Characteristics and mechanisms of low-level jets in the Yangtze River delta of China, Bound.-Lay. Meteorol., 149, 403–424, https://doi.org/10.1007/s10546-013-9852-8, 2013.
Wood, R., Wyant, M., Bretherton, C. S., Rémillard, J., Kollias, P., Fletcher, J., Stemmler, J., De Szoeke, S., Yuter, S., Miller, M., Mechem, D., Tselioudis, G., Chiu, J. C., Mann, J. A. L., O'Connor, E. J., Hogan, R. J., Dong, X., Miller, M., Ghate, V., Jefferson, A., Min, Q., Minnis, P., Palikonda, R., Albrecht, B., Luke, E., Hannay, C., and Lin, Y.: Clouds, aerosols, and precipitation in the marine boundary layer: an arm mobile facility deployment, B. Am. Meteor. Soc., 96, 419–440, https://doi.org/10.1175/BAMS-D-13-00180.1, 2015.
Wyngaard, J. C.: Structure of the PBL, in: Lectures on Air Pollution Modeling, edited by: Venkatram, A. and Wyngaard, J. C., American Meteorological Society, Boston, MA, 9–61, https://doi.org/10.1007/978-1-935704-16-4_2, 1988.
Xia, H., Shentu, G., Shangguan, M., Xia, X., Jia, X., Wang, C., Zhang, J., Pelc, J. S., Fejer, M. M., Zhang, Q., Dou, X., and Pan, J.: Long-range micro-pulse aerosol lidar at 1.5 μm with an upconversion single-photon detector, Opt. Lett., 40, 1579–1582, https://doi.org/10.1364/OL.40.001579, 2015.
Xia, H., Shangguan, M., Wang, C., Shentu, G., Qiu, J., Zhang, Q., Dou, X., and Pan, J.: Micro-pulse upconversion doppler lidar for wind and visibility detection in the atmospheric boundary layer, Opt. Lett., 41, 5218, https://doi.org/10.1364/ol.41.005218, 2016.
Xia, H., Chen Y., Yuan J., Su L., Yuan Z., Huang S., and Zhao D.: Windshear detection in rain using a 30 km radius coherent doppler wind lidar at mega airport in plateau, Remote Sens., 16, 924, https://doi.org/10.3390/rs16050924, 2024.
Xue, L., Zhou, D., Huang, X., Lou, S., and Ding, A.: Climatological characteristics of cold fronts and their impacts on air quality in cold seasons over the eastern China, J. Geophys. Res.-Atmos., 127, e2022JD037488, https://doi.org/10.1029/2022JD037488, 2022.
Yan, Y., Cai, X., Wang, X., Miao, Y., and Song, Y.: Low-level jet climatology of China derived from long-term radiosonde observations, J. Geophys. Res.-Atmos., 126, e2021JD035323, https://doi.org/10.1029/2021JD035323, 2021.
Yan, Y., Cai, X., Miao, Y., and Yu, M.: Synoptic condition and boundary layer structure regulate PM2.5 pollution in the huaihe river basin, china, Atmos. Res., 269, 106041, https://doi.org/10.1016/j.atmosres.2022.106041, 2022.
Yang, B., Finn, D., Rich, J., Gao, Z., and Liu, H.: Effects of low-level jets on near-surface turbulence and wind direction changes in the nocturnal boundary layer, J. Geophys. Res.-Atmos., 128, e2022JD037657, https://doi.org/10.1029/2022JD037657, 2023.
Yang, K., Cai, W., Huang, G., Hu, K., Ng, B., and Wang, G.: Increased variability of the western pacific subtropical high under greenhouse warming, P. Natl. Acad. Sci. USA, 119, e2120335119, https://doi.org/10.1073/pnas.2120335119, 2022.
Yang, Y., Fan, S., Wang, L., Gao, Z., Zhang, Y., Zou, H., Miao, S., Li, Y., Huang, M., Yim, S. H. L., and Lolli, S.: Diurnal evolution of the wintertime boundary layer in urban beijing, china: insights from doppler lidar and a 325-m meteorological tower, Remote Sens., 12, 3935, https://doi.org/10.3390/rs12233935, 2020.
Yin, J., Gao, C. Y., Hong, J., Gao, Z., Li, Y., Li, X., Fan, S., and Zhu, B.: Surface meteorological conditions and boundary layer height variations during an air pollution episode in nanjing, china, J. Geophys. Res.-Atmos., 124, 3350–3364, https://doi.org/10.1029/2018JD029848, 2019.
Yuan, J., Xia, H., Wei, T., Wang, L., Yue, B., and Wu, Y.: Identifying cloud, precipitation, windshear, and turbulence by deep analysis of the power spectrum of coherent doppler wind lidar, Opt. Express, 28, 37406, https://doi.org/10.1364/OE.412809, 2020.
Yue, M., Wang, M., Guo, J., Zhang, H., Dong, X., and Liu, Y.: Long-term trend comparison of planetary boundary layer height in observations and CMIP6 models over china, J. Climate, 34, 8237–8256, https://doi.org/10.1175/JCLI-D-20-1000.1, 2021.
Zhang, C., Ding, R., Xiao, C., Xu, Y., Cheng, H., Zhu, F., Lei, R., Di, D., Zhao, Q., and Cao, J.: Association between air pollution and cardiovascular mortality in hefei, china: a time-series analysis, Environ. Pollut., 229, 790–797, https://doi.org/10.1016/j.envpol.2017.06.022, 2017.
Zhang, F., Zhang, Q., Du, Y., and Kong, H.: Characteristics of coastal low-level jets in the bohai sea, china, during the early warm season, J. Geophys. Res.-Atmos., 123, 13763–13774, https://doi.org/10.1029/2018JD029242, 2018.
Zhang, H., Zhang, X., Li, Q., Cai, X., Fan, S., Song, Y., Hu, F., Che, H., Quan, J., Kang, L., and Zhu, T.: Research progress on estimation of the atmospheric boundary layer height, J. Meteorol. Res., 34, 482–498, https://doi.org/10.1007/s13351-020-9910-3, 2020.
Zhang, L., Zhang, H., Li, Q., Wei, W., Cai, X., Song, Y., Mamtimin, A., Wang, M., Yang, F., Wang, Y., and Zhou, C.: Turbulent mechanisms for the deep convective boundary layer in the taklimakan desert, Geophys. Res. Lett., 49, e2022GL099447, https://doi.org/10.1029/2022GL099447, 2022.
Zhang, Y., Zuo, Q., Wu, Q., Han, C., and Tao, J.: An integrated diagnostic framework for water resource spatial equilibrium considering water-economy-ecology nexus, J. Clean. Prod., 414, 137592, https://doi.org/10.1016/j.jclepro.2023.137592, 2023.
Zhao, P., Zhang, R., Liu, J., Zhou, X., and He, J.: Onset of southwesterly wind over eastern China and associated atmospheric circulation and rainfall, Clim. Dynam., 28, 797–811, https://doi.org/10.1007/s00382-006-0212-y, 2007.
Zhao, S., He, J., Dong, L., Qi, S., Yin, D., Chen, J., and Yu, Y.: Contrasting vertical circulation between severe and light air pollution inside a deep basin: results from the collaborative experiment of 3D boundary-layer meteorology and pollution at the sichuan basin (BLMP-SCB), B. Am. Meteor. Soc., 104, E411–E434, https://doi.org/10.1175/BAMS-D-22-0150.1, 2023.
Zhao, W. and Zou, Y.: Hefei: an emerging city in inland china, Cities, 77, 158–169, https://doi.org/10.1016/j.cities.2018.01.008, 2018.
Zhou, J.: Lidar observations of asian dust over hefei, china, in spring 2000, J. Geophys. Res., 107, 4252, https://doi.org/10.1029/2001JD000802, 2002.
Zhu, F., Ding, R., Lei, R., Cheng, H., Liu, J., Shen, C., Zhang, C., Xu, Y., Xiao, C., Li, X., Zhang, J., and Cao, J.: The short-term effects of air pollution on respiratory diseases and lung cancer mortality in hefei: a time-series analysis, Resp. Med., 146, 57–65, https://doi.org/10.1016/j.rmed.2018.11.019, 2019.