the Creative Commons Attribution 4.0 License.
the Creative Commons Attribution 4.0 License.
 | 30 Apr 2025
Influence of ambient NO and NO2 on the quantification of total peroxy nitrates (ΣPNs) and total alkyl nitrates (ΣANs) by thermal dissociation cavity ring-down spectroscopy (TD-CRDS)
Laura Wüst
Patrick Dewald
Gunther N. T. E. Türk
Jos Lelieveld
Measurement of total peroxy nitrates (ΣPNs) and alkyl nitrates (ΣANs) by instruments that use thermal dissociation (TD) inlets to convert the organic nitrate to detectable NO2 may suffer from systematic bias (both positive and negative) resulting from unwanted secondary chemistry in the heated inlets. Here we review the sources of the bias and the methods used to reduce it and/or correct for it and report new experiments using (for the first time) atmospherically relevant, unsaturated, biogenic alkyl nitrates as well as two different peroxyacetyl nitrate (PAN) sources. We show that the commonly used commercial C3 alkyl nitrate (isopropyl nitrate, IPN) for characterising the chemistry of ANs is not appropriate for real-air samples that contain longer-chain nitrates. Mixing ratios of ANs generated in the NO3-induced oxidation of limonene are strongly positively biased in the presence of NO. By detecting NOx rather than NO2, we provide a simple solution to avoid the bias caused by the conversion of NO to NO2 by primary and secondary peroxy radicals resulting from the complex chemistry in the thermal degradation of long-chain, alkyl nitrates in air at TD temperatures. We also show that using a photochemical source of PAN to characterise the TD inlets can result in a much stronger apparent bias from NO to NO2 conversion than for a diffusion source of synthesised (“pure”) PAN at similar mixing ratios, especially if high acetone concentrations (and thus radical concentrations) are involved. This is explained by the presence of thermally labile trace gases such as peracetic acid (CH3C(O)OOH) and hydrogen peroxide (H2O2).
- Article
(1569 KB) - Full-text XML
-
Supplement
(626 KB) - BibTeX
- EndNote


Nitrogen monoxide (NO) and nitrogen dioxide (NO2), together known as NOx, have a significant impact on air quality and human health (Crutzen, 1979; Lelieveld et al., 2015). Measurements of trace gases that act as NOx reservoirs or sinks are essential to gain a deeper insight into the degradation and transport mechanisms of NOx. Organic compounds with nitrate functionality, such as alkyl (aliphatic) nitrates (ANs; RONO2) and peroxy nitrates (PNs; RO2NO2), influence the lifetime and transport of NOx in the atmosphere (Perring et al., 2013; Horowitz et al., 2007) and represent a large fraction of the tropospheric nitrogen reservoir (Roberts, 1990). PNs are formed by the reaction between organic peroxy radicals (RO2) and NO2 (Reaction R1), while ANs are formed by the reaction between RO2 and NO (Reaction R2) in competition with the formation of alkoxy radicals (Reaction R3), which is usually the dominant reaction pathway (Orlando and Tyndall, 2012). PNs with a carbonyl group on the α-carbon, such as PAN, have lifetimes with respect to thermal dissociation to NO2 of minutes to hours in the boundary layer, extending to years in the cold upper troposphere (Atkinson et al., 2006). In contrast, RO2NO2, which do not possess a α-carbonyl group, decompose within seconds in the temperate boundary layer, and these PNs have only been detected at ground level in polar regions (Slusher et al., 2002) or at high altitudes (Murphy et al., 2004).
Organic peroxy radicals are formed during the day by the OH-initiated oxidation of volatile organic compounds (VOCs) (Reaction R4) (Lightfoot et al., 1992). During the night, OH levels are much lower, and the O3-initiated oxidation of VOCs (Reaction R5) gains importance as a source of RO2 (Ng et al., 2017).
Nitrate radicals (NO3) and dinitrogen pentoxide (N2O5) play important roles in atmospheric nitrogen chemistry, especially at nighttime (Brown and Stutz, 2012). The reaction of NO2 with O3 produces the NO3 radical (Reaction R6), which is in thermal equilibrium with NO2 and N2O5 (Reaction R7) (Wayne et al., 1991).
During the day, NO3 is rapidly photolysed (Liebmann et al., 2018) or reacts with NO to form NO2 (Wayne et al., 1991). At night, however, NO3 can reach concentrations of up to several tens of parts per trillion by volume (pptv) (Brown et al., 2003; Geyer et al., 2001; Dewald et al., 2022; Heintz et al., 1996) and initiates the oxidation of many unsaturated VOCs (Reaction R8), especially terpenoids (Ng et al., 2017). In environments with high levels of biogenic VOCs, NO3 also contributes to their oxidation during the day (Liebmann et al., 2019; Dewald et al., 2024).
PNs and ANs have often been measured using chromatographic (Flocke et al., 2005) and mass spectrometric methods (Wu et al., 2021; Zheng et al., 2011; Slusher et al., 2004) that allow identification and quantification of the individual components. An alternative method for measuring total non-speciated PNs and ANs (i.e. ΣPNs and ΣANs) is thermal dissociation to NO2 (Reactions R9–R10) and subsequent detection by cavity ring-down spectroscopy (TD-CRDS) or laser-induced fluorescence (TD-LIF) (Paul and Osthoff, 2010; Paul et al., 2009; Day et al., 2002; Sobanski et al., 2016; Thieser et al., 2016).
This method makes use of the very different bond strengths of ROO–NO2 and RO–NO2 to separate their detection in inlets at appropriate temperatures (Day et al., 2002), typically around 473 K for PNs and 673 K for ANs for instruments developed in this group for example (Thieser et al., 2016; Sobanski et al., 2016). As discussed below, the thermal dissociation of PNs and ANs to NO2 can however result in deviation from ideal (1 : 1) conversion as a result of unwanted secondary chemistry.
The quantitative measurement of ΣANs and ΣPNs as NO2 following thermal dissociation can be influenced by secondary reactions that either generate or consume the NO2 product. The origin of the bias and the various methods that have been used to reduce it or correct for it are summarised below.
The three types of reactions that can modify the concentration of NO2 formed in thermal dissociation of ΣANs or ΣPNs are its reduction to NO (Reactions R11–R12), the oxidation of ambient NO to NO2 via reaction with O3 or with RO2 formed in the TD inlet (Reactions R3, R13), and the conversion of NO2 back to an organic/inorganic nitrate (Reactions R14, R15) (Day et al., 2002; Paul et al., 2009; Paul and Osthoff, 2010; Di Carlo et al., 2013; Thieser et al., 2016; Sobanski et al., 2016).
The size of the bias caused by these reactions depends sensitively on characteristics of the heated inlet, in particular the pressure at which it is operated. Instruments that use CRDS setups to detect NO2 are usually operated at cavity pressures (and thus inlet pressures) above 500 hPa, whereas the TD inlets of instruments using LIF to detect NO2 can be operated at any pressure above that of the LIF module, which is typically at 3–5 hPa (Day et al., 2002). Operation at low pressures is generally preferred as it enhances the rate of diffusive loss of radicals to the inlet walls, minimising the bias. A potential disadvantage of operation at low temperatures is the enhancement of the O(3P) concentration as its (termolecular) reaction with O2 (the reverse of Reaction R11) to reform O3 is greatly reduced (Lee et al., 2014). Recognising that many of the secondary processes involve radicals and atoms formed in the heated inlets, Sobanski et al. (2016) added glass beads in the TD section of the inlet of their CRD-based device to scavenge peroxy and OH radicals. While this successfully reduced the impact of O(3P), OH and RO2 radical reactions (reducing the observed bias), the use of glass beads with a large surface area was later shown to reduce the temperature at which unsaturated (e.g. biogenic) ANs are converted to NO2 in the presence of O3, resulting in the partial detection of ANs in the PNs channel with an inlet at 473 K (Dewald et al., 2021). This effect was weaker but still apparent when using a quartz inlet without glass beads. This observation led Dewald et al. (2021) to switch to a Teflon (PFA) inlet, which does not support the formation of reactive surface sites (S–O) that catalyse the multistep conversion of ANs to NO2. Note that such effects are not observed for saturated ANs (e.g. isopropyl nitrate, which has often been used as an easily available “standard” to test inlet effects), which do not react with O3.
An alternative approach to the physical reduction of bias (e.g. by removing radicals in the TD inlet) is a correction based on laboratory characterisation of the effects of adding O3, NO and NO2 to the inlets in the presence of PNs and ANs followed by numerical simulation of the results using reaction schemes that describe the gas-phase and heterogeneous reactions taking place (Thieser et al., 2016; Sobanski et al., 2016).
Table 1 presents a summary of the bias measured by various groups using TD inlets coupled to various NO2 detection schemes and the approaches used to minimise and/or correct them.
Table 1Overview of the bias from secondary chemistry occurring when using TD inlets and various detection methods for NO2.
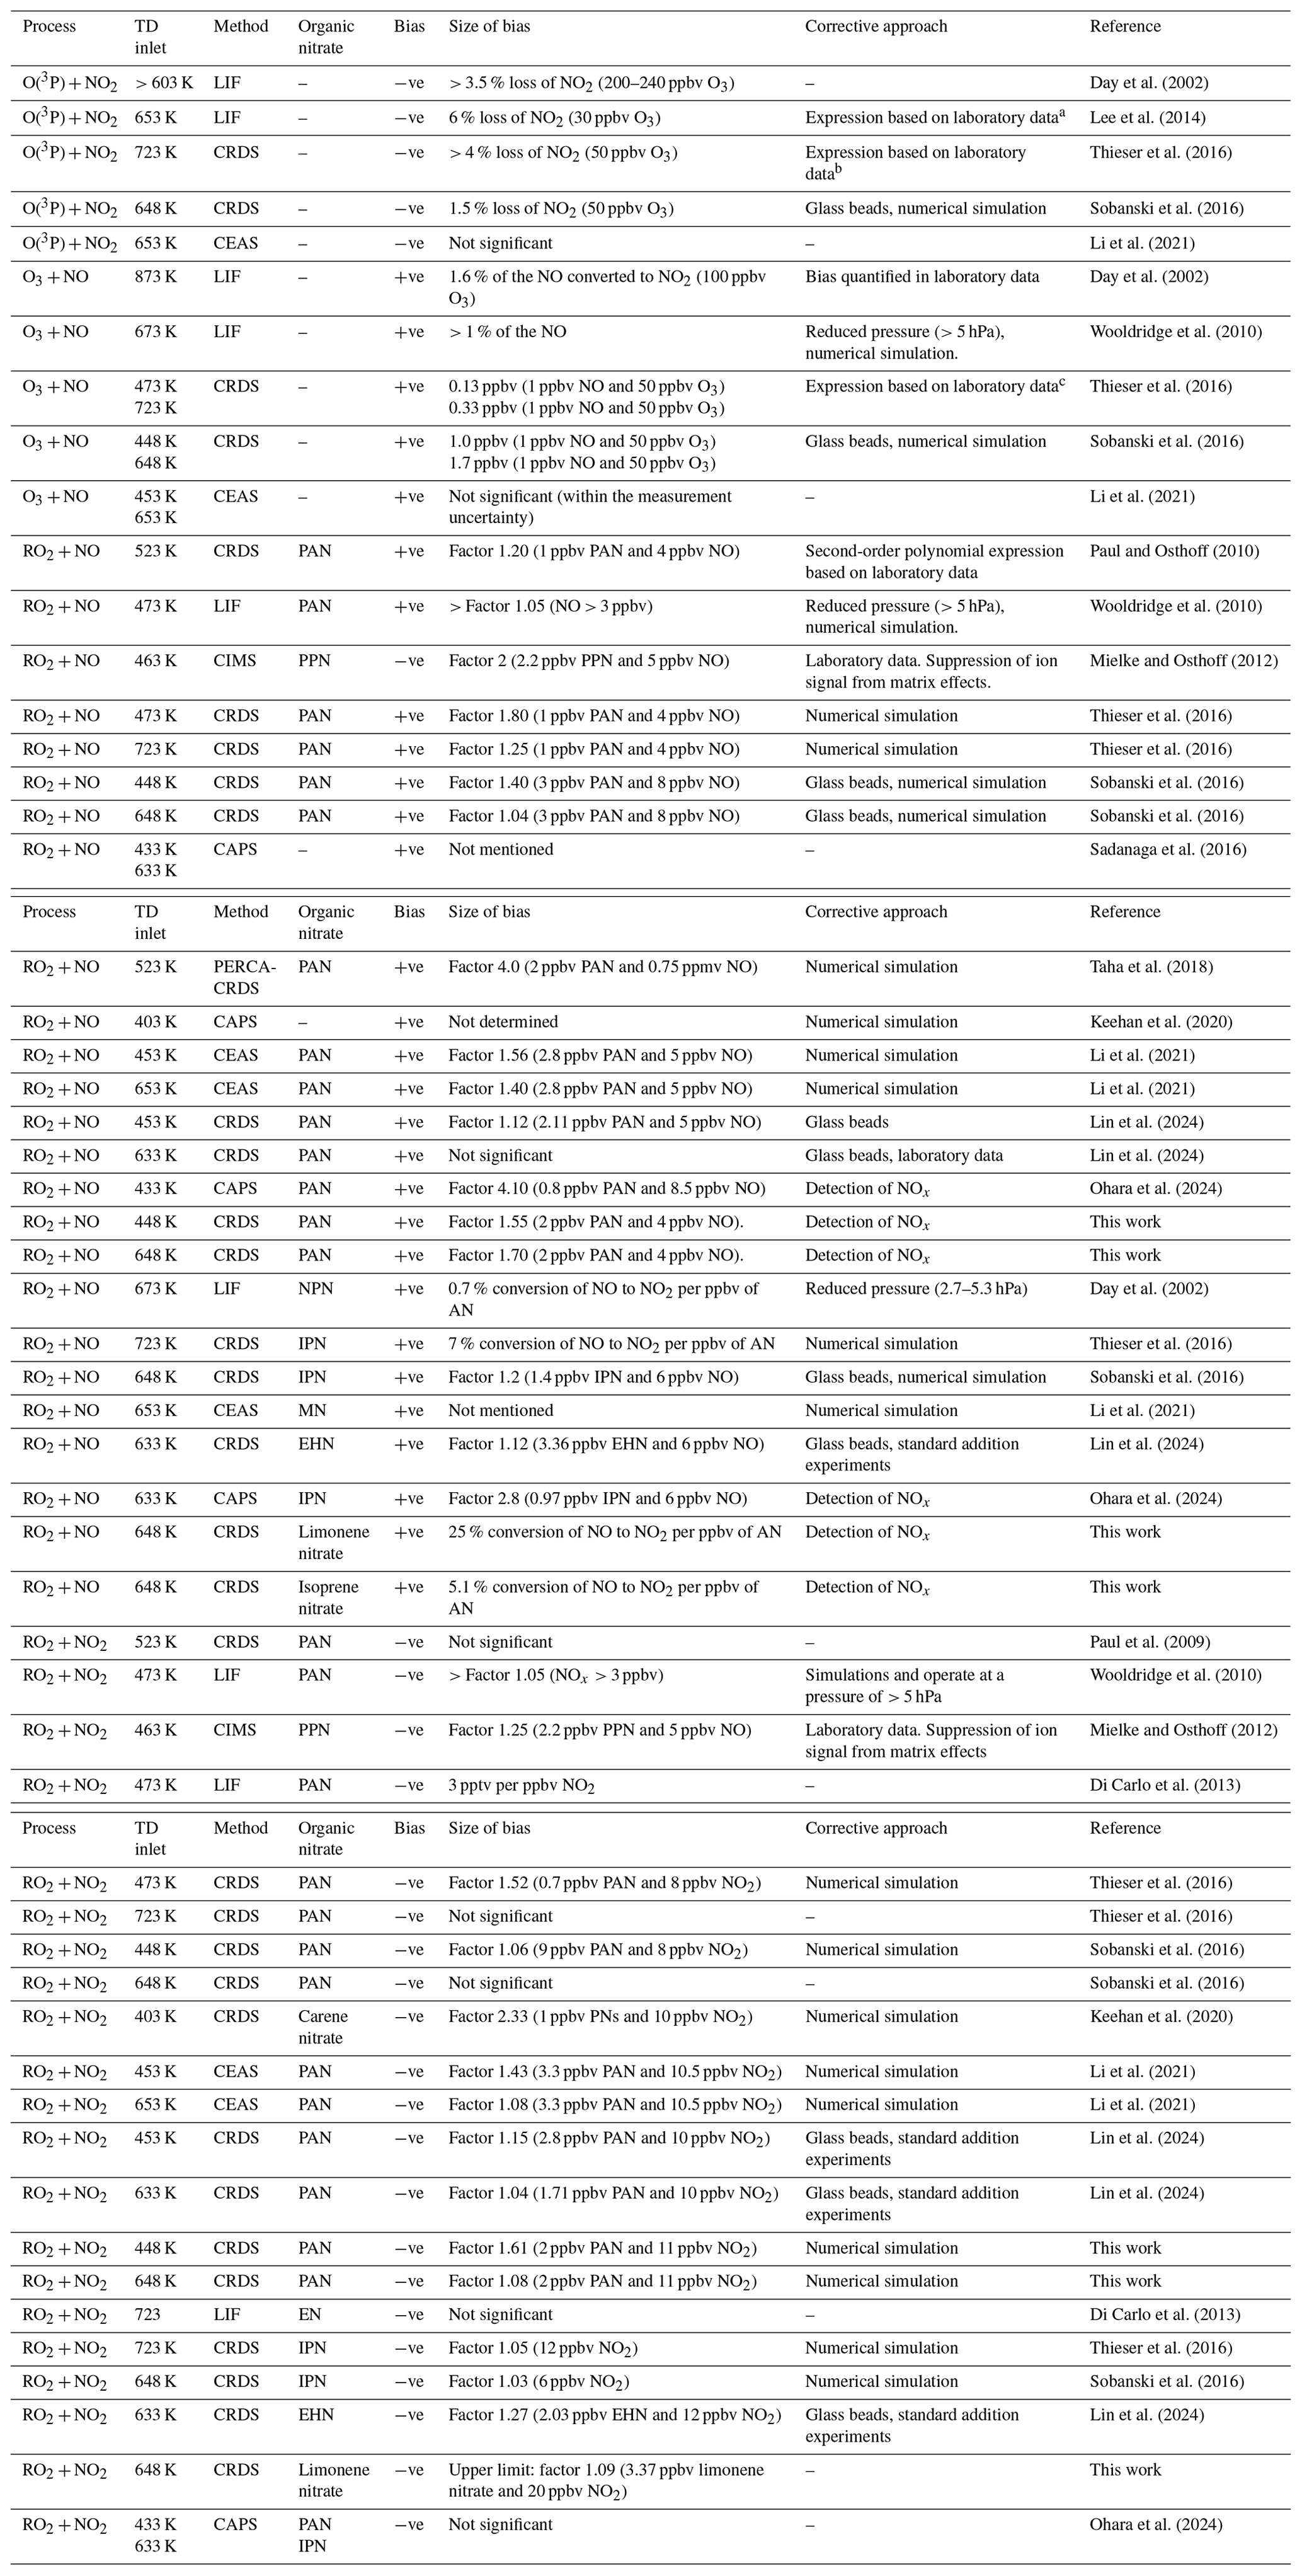
CRDS is cavity ring-down-spectroscopy, CAPS is cavity-attenuated phase shift spectroscopy, CEAS is cavity-enhanced absorption spectroscopy, CIMS is chemical ionisation mass spectrometry, LIF is laser-induced fluorescence and PERCA is peroxy radical amplifier. PAN is CH3C(O)OONO2, PPN is C2H5C(O)OONO2, IPN is isopropyl nitrate ((CH3)2CH2ONO2,CH3), MN is methyl nitrate (CH3ONO2), EN is ethyl nitrate (C2H5ONO2), NPN is n-propyl nitrate (CH3CH2CH2ONO2), and EHN is 2-ethylhexyl nitrate. a , where S380 is the observed total signal and is the corrected signal. b NO2 loss ( (ppbv) = 7.43 × 10⁻⁴ [NO2][O3]). c keff (473 K) = 2.5 × 10⁻¹⁴ cm3 molec.−1 s−1 and keff (723 K) = 6.2 × 10⁻¹⁴ cm3 molec.−1 s−1, where keff is an effective rate coefficient for the reaction between O3 and NO.
In this study we assess the bias caused by ambient NO on the measurements of ΣPNs and ΣANs, with a focus on biogenically derived ANs formed in the NO3-induced oxidation of isoprene and limonene, which so far have been neglected in the studies reviewed in Table 1. We show that the use of saturated surrogate alkyl nitrates (e.g. IPN) to estimate bias in TD inlets leads to a different effect compared to alkyl nitrates derived from the oxidation of common biogenic trace gases such as terpenoids and as such is inappropriate for estimating and correcting bias.
3.1 TD cavity ring-down spectrometer
The measurements were performed using a five-channel cavity ring-down spectrometer, which has been described in detail previously (Sobanski et al., 2016; Dewald et al., 2021). In this study, we only use the three cavities that detect NO2. Each cavity consists of a stainless steel tube (70 cm length and inner diameter 8 mm) that is internally coated with Teflon (Chemours, FEP, TE 9568) to reduce losses of trace gases during transmission. Perfluoroalkoxy polymer (PFA) T-pieces at both ends of the tubes provide connections to the sample inlet line (see Fig. 1) and the outlet to the pump. Sample air enters the cavities at a flow rate of 2.1 L (STP) min−1 (slpm) in each channel. Two highly reflective mirrors (transmission of 20 ppm at 409 nm, FiveNine Optics) are located behind each PFA T-piece at a distance of 93.5 cm (d) apart. The mirrors are purged with dry zero air (CAP 180, Fuhr GmbH), which results in a reduction of the effective optical path length, l, compared to the mirror distance. To record a ring-down signal, light emitted by a laser diode is coupled into the cavities using 50 µm core optical fibres and collimators. Using a photomultiplier tube, which converts the transmitted light intensity into an analogue electrical signal, an exponential decay can be observed when the laser is modulated off. The concentration of NO2 in each cavity is calculated from
where k0 and k are the decay rate coefficients without and with absorbing/scattering medium, c is the speed of light, and σλ is the effective absorption cross section resulting from the overlap of the laser emission and the NO2 absorption spectrum (Vandaele et al., 1998). The effective cross-section was obtained by regularly measuring the laser spectrum using a dedicated CCD camera (Ocean Optics HR4000) and was typically close to 6.4 × 10⁻¹⁹ cm2 molec.−1.
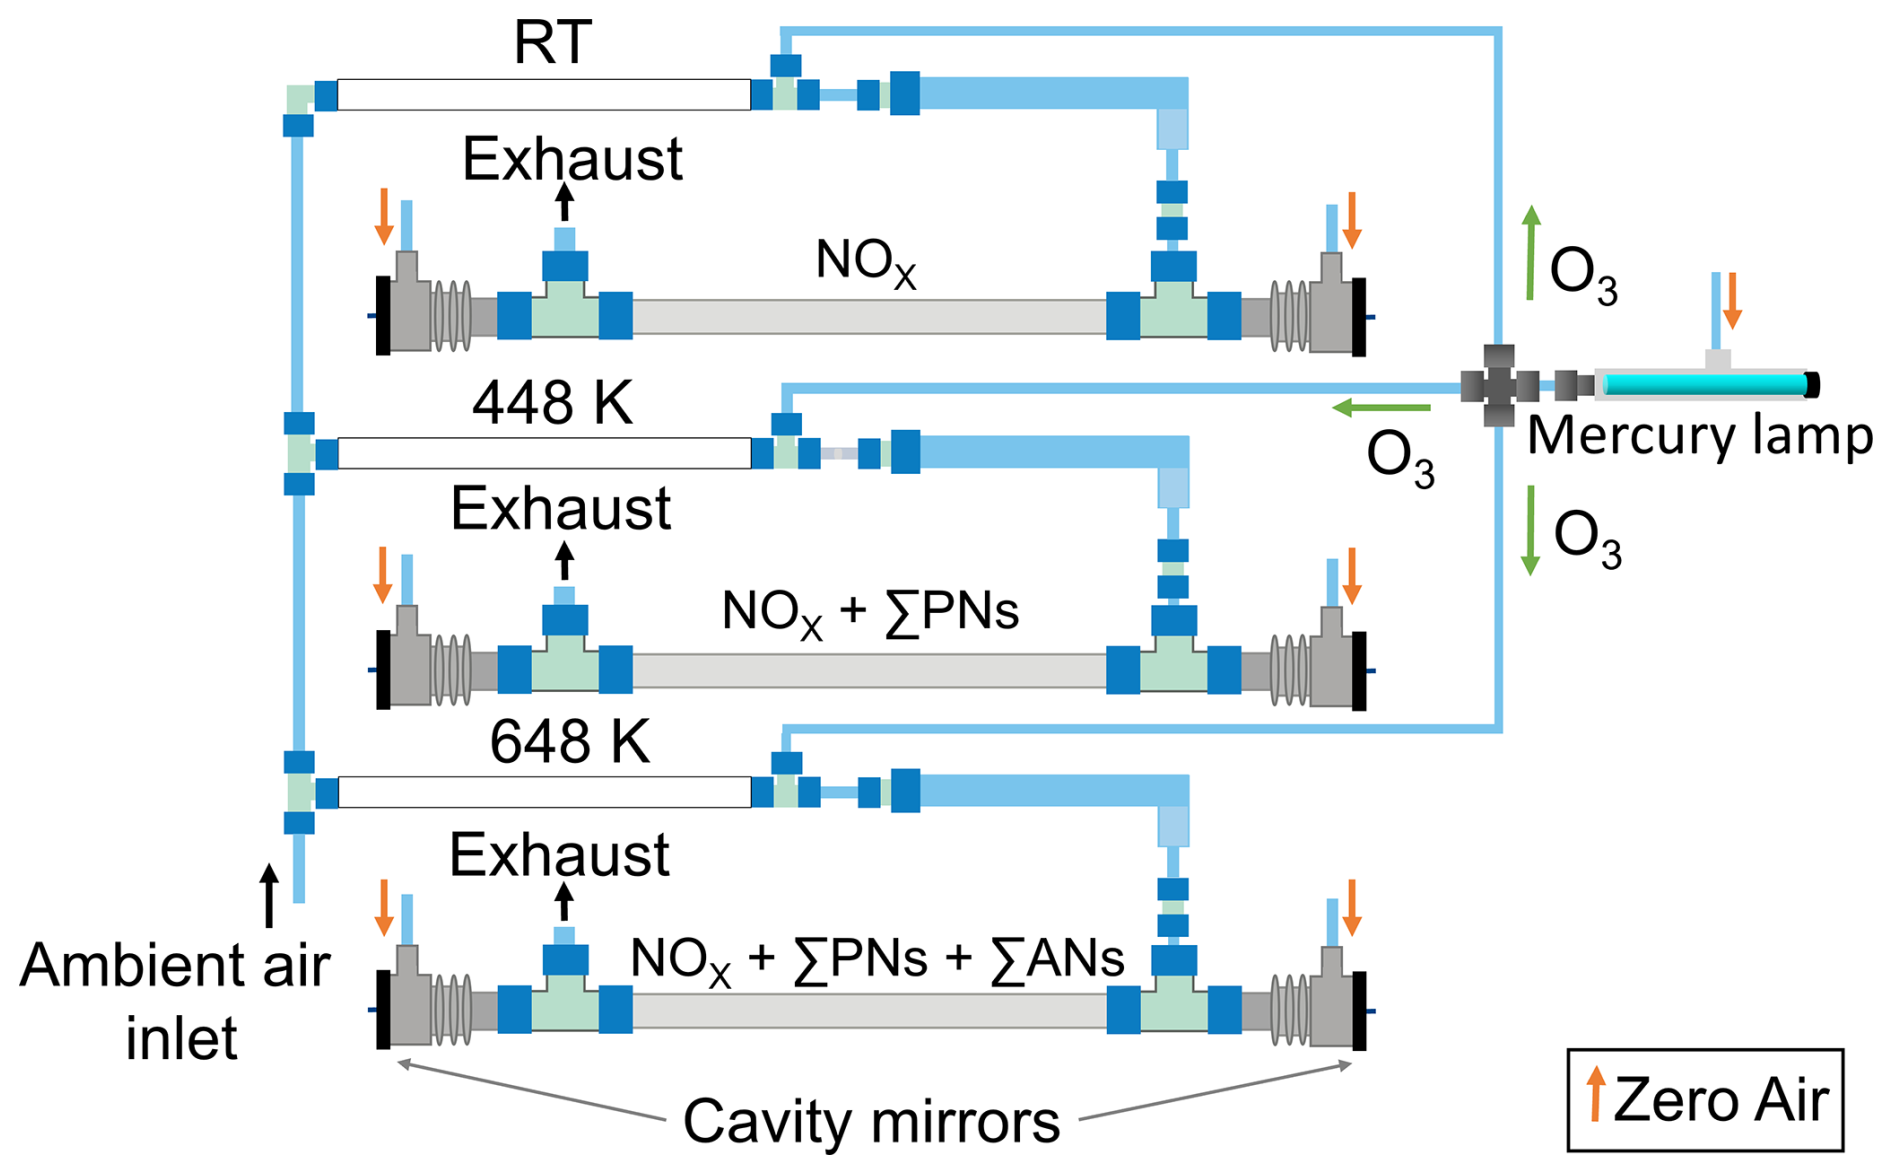
Figure 1Schematic representation of the 409 nm cavities of the five-channel TD-CRDS for measuring mixing ratios of NOx, NOx + ΣPNs and NOx + ΣPNs + ΣANs (Hg lamp on). Alternatively, when the Hg lamp is off, NO2 is measured instead of NOx. The coloured arrows represent the gas flows. The temperatures of the different TD inlets (measured at the outside surface) are shown for each channel.
In the original version of this instrument (Dewald et al., 2021; Sobanski et al., 2016), three cavities were operated at 409 nm to detect either NO2 or ΣPNs + NO2 or ΣANs + ΣPNs + NO2. We refer to these as the “NO2 cavity”, the “PN cavity” and the “AN cavity”, respectively. The NO2 cavity sampled air via a 60 cm long PFA inlet (8 mm inner diameter) at ambient temperature. The PN cavity sampled via a 55 cm long PFA tubular (8 mm inner diameter), the first 20 cm of which was heated to 448 K to convert PNs to NO2. The AN cavity sampled air via a 55 cm long quartz tube (12 mm inner diameter), where the first 20 cm was heated to 648 K, to convert ANs to NO2.
In this work, we examine the advantages of detecting NOx rather than NO2 when using a TD-CRDS to measure peroxy nitrates and alkyl nitrates derived from biogenic precursors. The instrument was modified to detect NOx by adding O3 (Fig. 1), which was generated by passing zero air over a low-pressure Hg lamp emitting at 185 nm. The O3 was divided equally by critical orifices into three identical reaction volumes made of 88 cm long PFA tubing (0.5 in. outer diameter, residence time of 1.8 s). About 12 ppmv O3 was needed to fully convert NO to NO2. This was determined experimentally by changing the flow through the critical orifices while monitoring NO2 for a fixed amount of NO. A numerical simulation of the reactions describing the formation and loss of NO2 (Fig. S1 in the Supplement) indicated a conversion efficiency of 98.7 %.
3.2 PAN sources
Two different sources of PAN were used in this study. In the first, PAN was prepared via the photolysis of acetone in air in the presence of NO as described originally by Warneck and Zerbach (1992) and improved by, for example, Flocke et al. (2005). In this case, 5 cm3 (STP) min−1 (sccm) of acetone (4.6 % in synthetic air, Air Liquide) and 10 sccm of NO (1 ppmv, Air Liquide) were mixed with 100 sccm of zero air before flowing into a quartz reactor equipped with a phosphor-coated, low-pressure mercury lamp (Pen-Ray) to photolyse acetone at ∼ 285 nm (Reaction R16). Based on the volume flow rate and the volume of the reactor (∼ 243 cm3), the residence time of the gas flowing through the reactor was calculated to be ∼ 120 s. PAN is formed at a yield of ∼ 90 %–95 % (relative to NO consumed) by the sequence of reactions (Reaction R16–R19). The yield may be improved by using UV-LED sources that do not generate heat and thus cause PAN to thermally dissociate (Rider et al., 2015).
The mixture exiting the photochemical reactor was diluted with 5.2 slpm zero air to provide PAN mixing ratios of ∼ 2 ppbv.
In order to ensure a known concentration of PAN, such photochemical PAN sources are operated in the NO-limited chemical regime; i.e. sufficient peroxyl radicals are present to initially convert each NO to NO2 and then to PAN. High radical densities result in chemical processes involving peroxyl radicals: in Sect. 4.1, we discuss the concentrations and role of the organic and inorganic photochemical products other than PAN that are generated in the reactor.
Alternatively, PAN was synthesised using wet-chemical methods (Gaffney et al., 1984; Talukdar et al., 1995). Tridecane (10 mL, ≥ 99 %, Sigma-Aldrich) and peroxyacetic acid (PAA) (2.5 mL, 35 % by weight in dilute acetic acid, Acros Organics) were placed in a 100 mL wide-necked round-bottom flask and cooled to 273 K in an ice-water bath. Cold sulfuric acid (2.5 mL, 98 %, Roth) and then cold nitric acid (1.3 mL, ≥ 65 %, Sigma-Aldrich) were added dropwise while stirring. The contents of the flask were allowed to stand for 25 min at 273 K with vigorous stirring and then transferred to a separator funnel containing ice-cold Milli-Q water (25 mL). The aqueous phase was discarded, and the organic phase was shaken four times with 25 mL of cold Milli-Q water each time. The organic phase was then dried for 30 min at 273 K with magnesium sulfate (1 spatula, Alfa Aesar). After filtration, PAN was obtained as a colourless liquid in tridecane and stored at 243 K until use. During experiments, PAN was cooled to 273 K in a cryostat and evaporated into the gas phase by flowing 100 sccm of air over the sample, with further dilution with 5.2 slpm zero air resulting in mixing ratios between ∼ 2 and 6 ppbv. Note that safety precautions must be taken when working with samples of PAN, which has been known to explode under certain circumstances (e.g. when distilled from its tridecane solvent).
3.3 AN sources
Limonene nitrates and isoprene nitrates were formed by the reaction of limonene or isoprene with NO3 in air in the 1 m3 simulation chamber SCHARK (Simulation Chamber for Atmospheric Reactions and Kinetics), which was operated at ambient pressure and temperature (1 atm, 298 K) in dynamic-flow mode (Dewald et al., 2021). Residence times in the chamber were between 57 and 92 min depending on the flow rate. Gases entering the chamber passed through a circular loop of PFA tubing (located at the bottom of the chamber) with 10 equally spaced 1 mm diameter holes pointing upwards. The velocity of gas at the exit of the holes is estimated at ∼ 2 m s−1, which causes rapid turbulent mixing. Mixing is also assisted by a ∼ 5 cm diameter Teflon-coated fan located centrally at the bottom of the chamber. Experiments with pulsed addition of O3 showed that the mixing time in the chamber was > 40 s, which is negligible compared to the overall residence time.
Two methods were used to produce NO3. In the first, NO3 was formed by the thermal decomposition of N2O5 (Reaction R7), which was evaporated into the chamber by passing zero air (50–600 sccm) over N2O5 crystals held at temperatures between 205 and 195 K (acetone-dry ice bath). N2O5 was synthesised by allowing 150 sccm of NO (5 % in N2, Westfalen) and 200 sccm of O3 in O2 (∼ 10 % O3, generated via electrical discharge in O2) to flow through a ∼ 2 L glass reaction vessel that is trapped as colourless crystals at 195 K (acetone-dry ice bath). N2O5 crystals formed this way were stored at 243 K until use. Alternatively, NO3 was obtained by bubbling 50–200 sccm of zero air through a 0.5 M solution of cerium(IV) ammonium nitrate (CAN) in 6 M HNO3 that was irradiated at 365 nm (Lambe et al., 2023). The flow containing the NO3 was diluted by 15 slpm zero air before entering the chamber. The thermal decomposition of N2O5 has the advantage that the lifetime of N2O5 is sufficiently long (∼ 23 s at 298 K) to ensure that NO3 is formed reasonably homogeneously throughout the chamber. The disadvantage of using N2O5 is the release of NO2 during its thermal decomposition. The photochemical CAN source suffers from the disadvantage that the NO3 (added via a point source) may react before mixing is complete; i.e. the lifetime of NO3 in the presence of (typically) 30 ppbv of limonene or isoprene is only 0.1–2 s, which is shorter than the mixing time. Isoprene and limonene were introduced into the chamber via flow controllers attached to steel canisters containing isoprene (98 %, Acros Organics, 45 ppmv in He) or limonene (96 %, Sigma-Aldrich, 44 ppmv in He) in He (5.0, Westfalen), resulting in ANs mixing ratios up to ∼ 4 ppbv (see later).
The nitrates generated in this manner from isoprene are a mixture of C5 nitrooxyhydroperoxides, C5 nitrooxycarbonyl, C5 hydroxynitrate and also C10 nitrooxyperoxide (ROOR), with the relative concentrations depending on the fate of the initially formed nitrooxyperoxy radicals (Schwantes et al., 2015; Ng et al., 2017; IUPAC Task Group on Atmospheric Chemical Kinetic Data Evaluation et al., 2024). The limonene nitrates formed are mainly C10 hydroxynitrates at yields of ∼ 20 % (Spittler et al., 2006).
3.4 Experimental procedure
In order to investigate the influence of NO and NO2 on the detection of PAN and biogenically derived ANs via TD-CRDS, different amounts of NO (0–22.5 ppbv) and NO2 (0–20 ppbv) were added to the TD inlet of the CRDS along with various amounts of PAN, isoprene-derived ANs and limonene-derived ANs. These experiments were carried out with the cavities operating in both “NO2 mode” and “NOx mode” by adding O3 (see Sect. 3.2).
4.1 The influence of NO on the measurement of PNs (photochemical PAN source, PAN measured as NO2)
The presence of NO during the measurement of PNs using TD inlets leads to a positive bias in ambient PN concentration, which is related to the oxidation of NO to NO2 via reactions with peroxyl radicals (see Sect. 2) (Sobanski et al., 2016; Thieser et al., 2016). To re-investigate this measurement artefact, extend previous studies from this group and provide a solution to improve the reliability of TD-CRDS instruments designed to measure ΣPNs, we have performed experiments using both a photochemical source and a diffusion PAN source (see Sect. 3.2). Figure 2 summarises the results of an experiment in which NO was added to photochemically produced PAN (∼ 2 ppbv). In these experiments, O3 was not added to the tubing in front of the cavities (low-pressure Hg lamp off); therefore the cavities only detected NO2 (and not NOx). The mixing ratios of NO2 measured in the cavities with inlet temperatures of 448 and 648 K are plotted against the amount of NO added, which was calculated from its partial flow and mixing ratio in the bottle (1 ppmv in N2). For both datasets, the NO2 measured in the room temperature cavity (present as an impurity in the PAN sample) has already been subtracted.
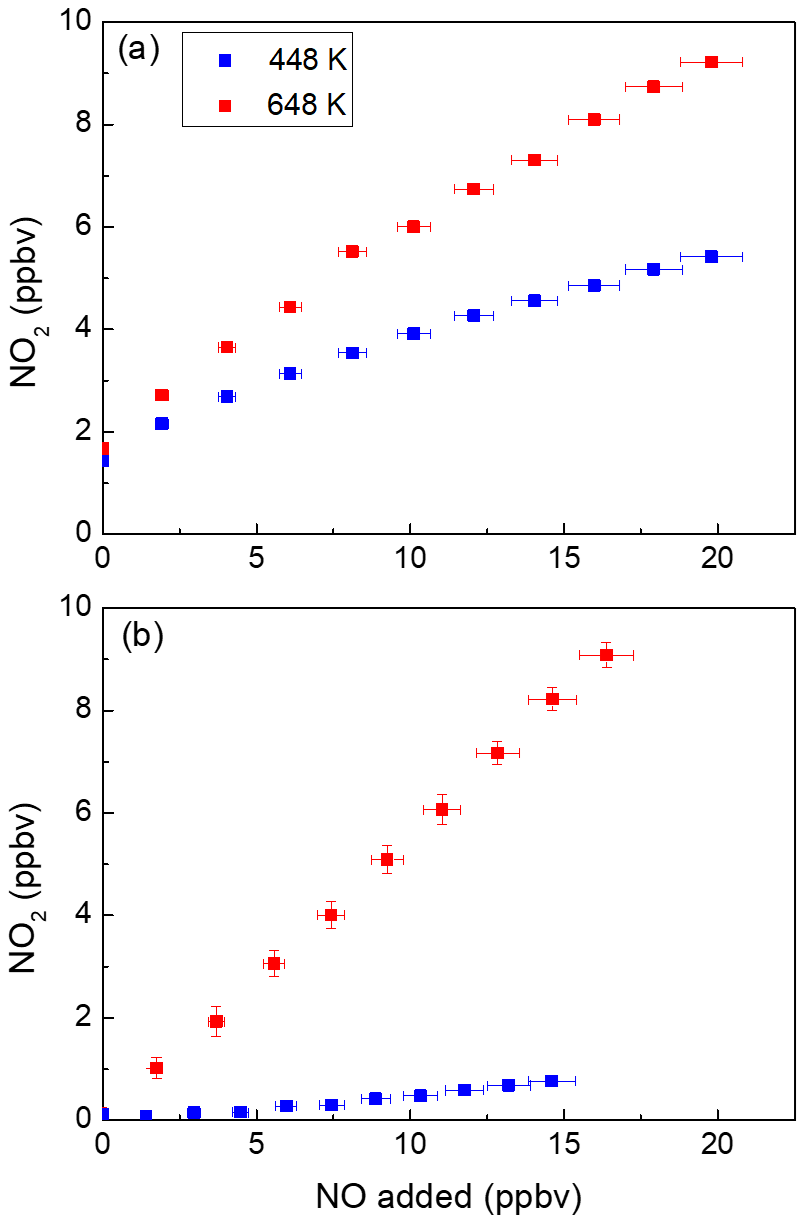
Figure 2NO2 measured in the cavities with inlet temperatures of 448 and 648 K in the presence of different amounts of NO with (a) and without (b) PAN present. For each dataset, the NO2 measured in the room temperature cavity has already been subtracted. The error bars in the x direction include uncertainty in the mass flow controllers (1 % of the maximum flow of the MFC) and the uncertainty in the mixing ratio of the NO bottle (5 %). The error bars in the y direction (smaller than the symbols in panel (b)) include the standard deviations (1σ) of the NO2 mixing ratios both at 648 K and at room temperature.
Ideally, only one molecule of NO2 would be generated for each PAN molecule thermally dissociated, and the data would form a horizontal line at ∼ 2 ppbv. As Fig. 2a shows, this is clearly not the case. In both cavities with heated inlets the addition of NO leads to the formation of additional NO2. This is related to co-formation of the acetyl peroxy radical from PAN in the heated inlet at 448 K (Reaction R20), which reacts with NO (Reaction R21) to form NO2 and (in air) a methyl peroxy radical (Reaction R21a–b). The methyl peroxy radical can react with NO to form a further NO2 and HO2 (Reaction R22); the latter can form a third NO2 in the reaction between HO2 and NO (Reaction R23). The OH radical formed in this process reacts either with NO to form HONO or with NO2 to form HNO3, both of which are thermally stable in the 448 K TD inlet (Thieser et al., 2016; Friedrich et al., 2020).
Additionally, the radicals involved (e.g. RO2, RO, OH) can be lost to the walls of the TD inlet, which modifies the extent of conversion of NO to NO2. In our experiments with a TD inlet at 448 K and ∼ 2 ppbv PAN, the addition of 20 ppbv NO results in detection of > 5 ppbv NO2. At this temperature, the increase in NO2 per NO added is lower at high NO than at low NO (i.e. the curve flattens at high NO).
At 648 K the chemistry is different as the acetyl peroxy radical decomposes into an acetyl radical and oxygen (Reaction R24) or isomerises to CH2C(O)OOH (Reaction R25) (Thieser et al., 2016; Lee et al., 2002; Carr et al., 2011), which decomposes thermally to OH and a singlet α-lactone (Reaction R26) (Carr et al., 2011; Thieser et al., 2016). The acetyl radical from Reaction (R24) can decompose to CH3 and CO (Reaction R27), react with O2 to form an acetyl peroxy radical (Reaction R28), or form OH and the singlet α-lactone (Reaction R29) (Papadimitriou et al., 2015; Carr et al., 2011, 2007; Groß et al., 2014; Chen and Lee, 2010; Thieser et al., 2016; Tyndall et al., 1995). The methyl radical formed in Reaction (R27) reacts with oxygen to form a methyl peroxy radical (Reaction R21b), which reacts with NO to form NO2 (Reaction R22).
For the 648 K inlet, the bias is even larger (a factor > 5 increase in NO2 going from zero to 20 ppbv NO) and appears to flatten off more slowly. This result was unexpected as previous studies from this laboratory have indicated that at high temperatures, the bias is weaker, owing to thermal decomposition of CH3C(O)O2.
In order to explore this effect, a thermogram of the photochemical PAN source was measured while continuously adding 13 ppbv of NO to the TD inlet. The result is displayed in Fig. 3, which confirms that NO to NO2 conversion continues past the PAN maximum close to 440 K, with a doubling of the NO2 mixing ratio at 648 K.
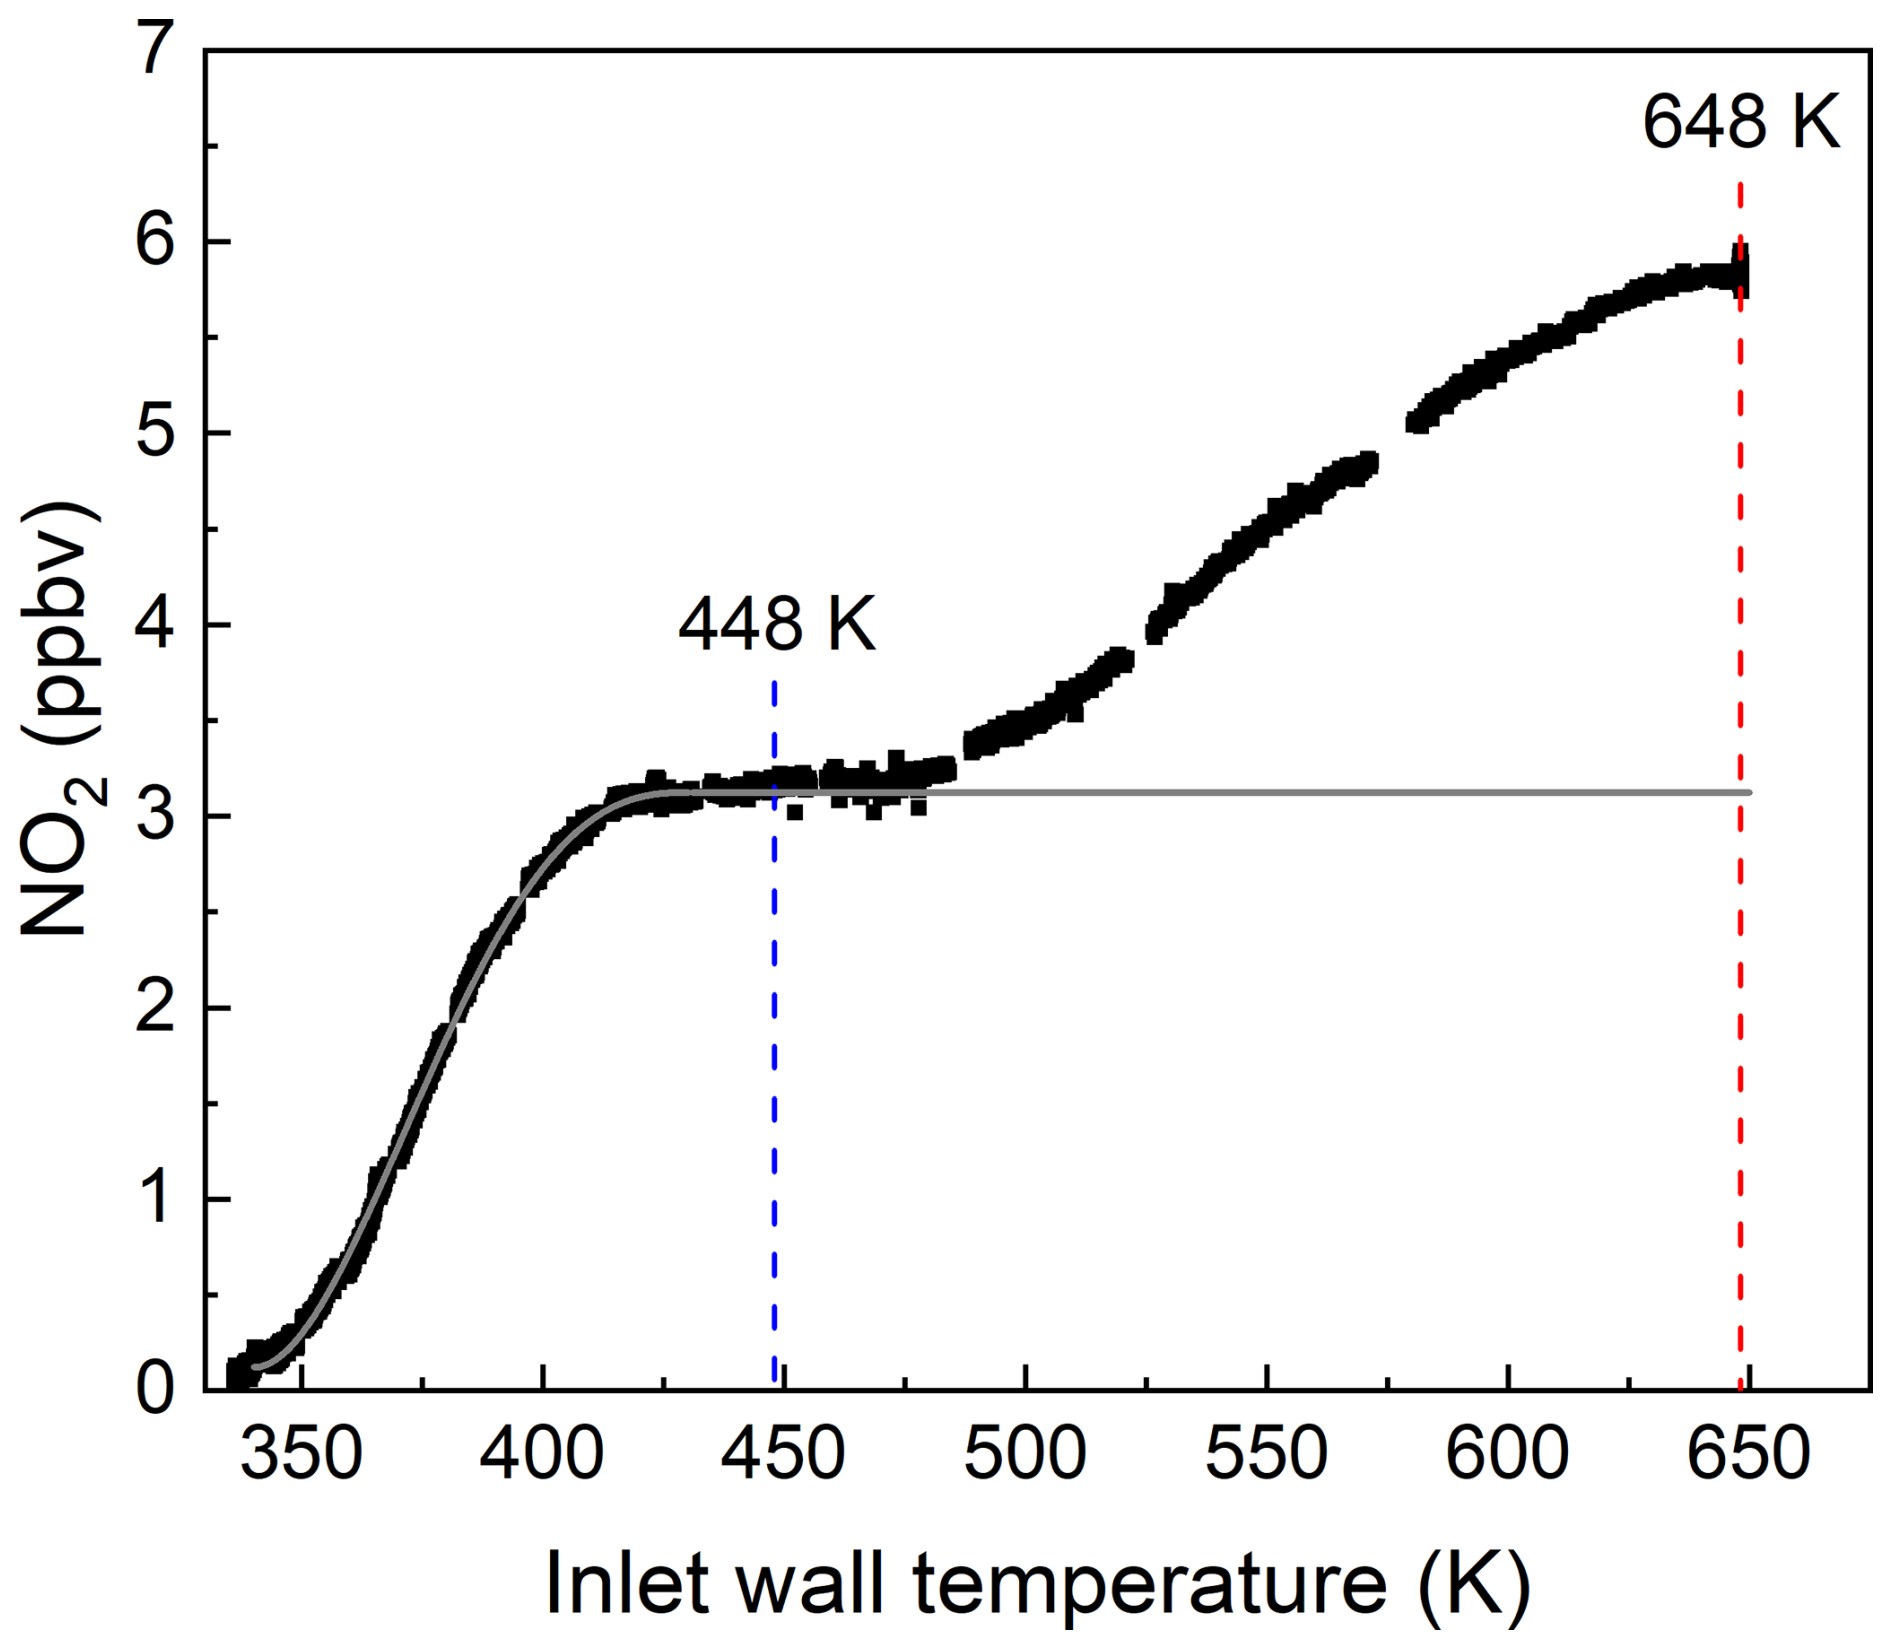
Figure 3Thermogram obtained by adding 13 ppbv NO to ∼ 1 ppbv PAN from the photochemical PAN source. The vertical red and blue lines indicate the normal operating temperatures of the two heated inlets associated with the ΣANs and ΣPNs cavities, respectively. Note that the NO2 measured in the room temperature cavity (impurity present in the NO and PAN flows) has already been subtracted. The grey line represents the expected thermogram for PAN (i.e. no increase after full dissociation at ∼ 450 K).
In order to understand the origin of the additional NO2 signal at high temperatures, a further experiment was carried out in which the photochemical PAN source was switched on but without adding NO to produce PAN. This can be seen in Fig. 2b and shows that the conversion of NO to NO2 in the 648 K cavity continues despite the absence of PAN and thus cannot be explained solely by reactions initiated by formation of the acetyl peroxy radical. A smaller conversion of NO to NO2 is also observed in the 448 K cavity in the absence of PAN.
In the absence of NO, peroxy radicals formed by acetone photolysis in the photochemical reactor undergo a series of self- and cross-reactions that lead to a number of organic end-products that can be transported from the photochemical reactor to the TD inlets. Note that within the photochemical reactor, significant concentrations of hydroxy and peroxy radicals are only present when the sample is irradiated and do not survive transport through the tubing (∼ 2 m of in. PFA) to the TD inlets.
The two initially formed peroxyl radicals (Reactions R16–R17 and R21b) CH3C(O)O2 and CH3O2 can undergo self- and cross-reactions in the photochemical reactor, a subset of which are shown below:
The CH3CO2 thermally decomposes in air to form CH3 and CO2 (Reaction R21a); therefore CH3C(O)O2, CH3O2 and HO2 are initially present. HO2, formed in Reaction (R33), reacts with all organic peroxy radicals in both radical termination and radical propagation steps:
The OH formed in Reaction (R37) will react with acetone (which is present in large excess) to form another peroxy radical:
The acetonyl peroxy radical (CH3C(O)CH2O2) will also undergo reaction with other RO2, eventually forming peroxides and C1 and C2 peroxyl radicals. In summary, the chemistry taking place in the PAN photochemical source generates a large variety of oxidised organic trace gases (not only PAN) that may enter the TD inlet at 648 K. Of particular interest with respect to explaining the data of Fig. 2 are the thermally unstable peroxides such as CH3C(O)OOH, CH3OOH and H2O2. These trace gases are stable at room temperature but CH3OOH and CH3C(O)OOH have lifetimes with respect to thermal dissociation of the order of seconds at ∼ 650 K (Sahetchian et al., 1992; Kirk, 1965). In contrast, the thermal lifetime of H2O2 at 650 K is several minutes (Baulch et al., 2005), which strongly suggests that its decomposition in our heated inlet is catalysed by the quartz tubing. The thermal dissociation of CH3C(O)OOH in the TD inlet leads (via the thermal dissociation of initially formed CH3CO2; Reaction R21) to the formation of an OH radical and CH3O2 (Reaction R40) (Schmidt and Sehon, 1963; Atkinson et al., 2006):
The CH3O2 thus formed can, via Reactions (R22) and (R23), account for some of the conversion of NO to NO2 observed. However, both Reactions (R23) and (R40) generate OH radicals, which can react with acetone in the TD inlet. The rate coefficient for OH + acetone at 648 K is 1.4 × 10⁻¹² cm3 molec.−1 s−1 (Vasudevan et al., 2005) which results in an OH-lifetime in the heated inlet of ∼ 1 ms with respect to reaction with acetone. This results in the formation of the acetonyl peroxy radical (Reaction R39) which then also reacts with NO (Reaction R41) to form other peroxyl radicals (HO2, CH3C(O)O2 and CH3O2 via Reactions R42 and R43) that can also convert NO to NO2.
The hypothesised role of the thermal dissociation of CH3C(O)OOH (PAA) and H2O2 at 648 K as source of peroxyl radicals in the TD inlet was tested by flowing CH3C(O)OOH (∼ 1 ppbv from a permeation source) or H2O2 (2–10 ppmv, calculated from vapour pressure) sample through the TD inlet in the presence of various amounts of NO (Fig. 4). Note that the NO2 measured in the room temperature cavity (present as an impurity of 3.5 % in the NO bottle) has been subtracted from the data obtained in the 648 K TD inlet. As can be seen in Fig. 4a, the addition of up to 17.5 ppbv NO to ∼ 1 ppbv PAA or 2–10 ppmv H2O2 results in 0.6 or 5 ppbv NO2, respectively, confirming that the thermal decomposition of PAA and H2O2 at 648 K is a source of peroxyl radicals. The hypothesis was further tested by varying the TD inlet temperature when flowing either PAA or H2O2 in the presence of 12 ppbv NO. As shown in Fig. 4b, in both cases we observed efficient conversion of NO to NO2 at temperatures above 500 K for PAA and above 400 K for H2O2. In separate experiments, we observed that (in the presence of NO) the thermal dissociation of acetone also accounts for a small fraction of the excess of NO2 formed (400 pptv NO2 at 43 ppmv acetone and 16 ppbv NO), which is confirmed by its thermogram (Fig. S2). This is presumably a result of surface catalysed dissociation of acetone to form (in the presence of air) peroxy radicals that convert NO to NO2.
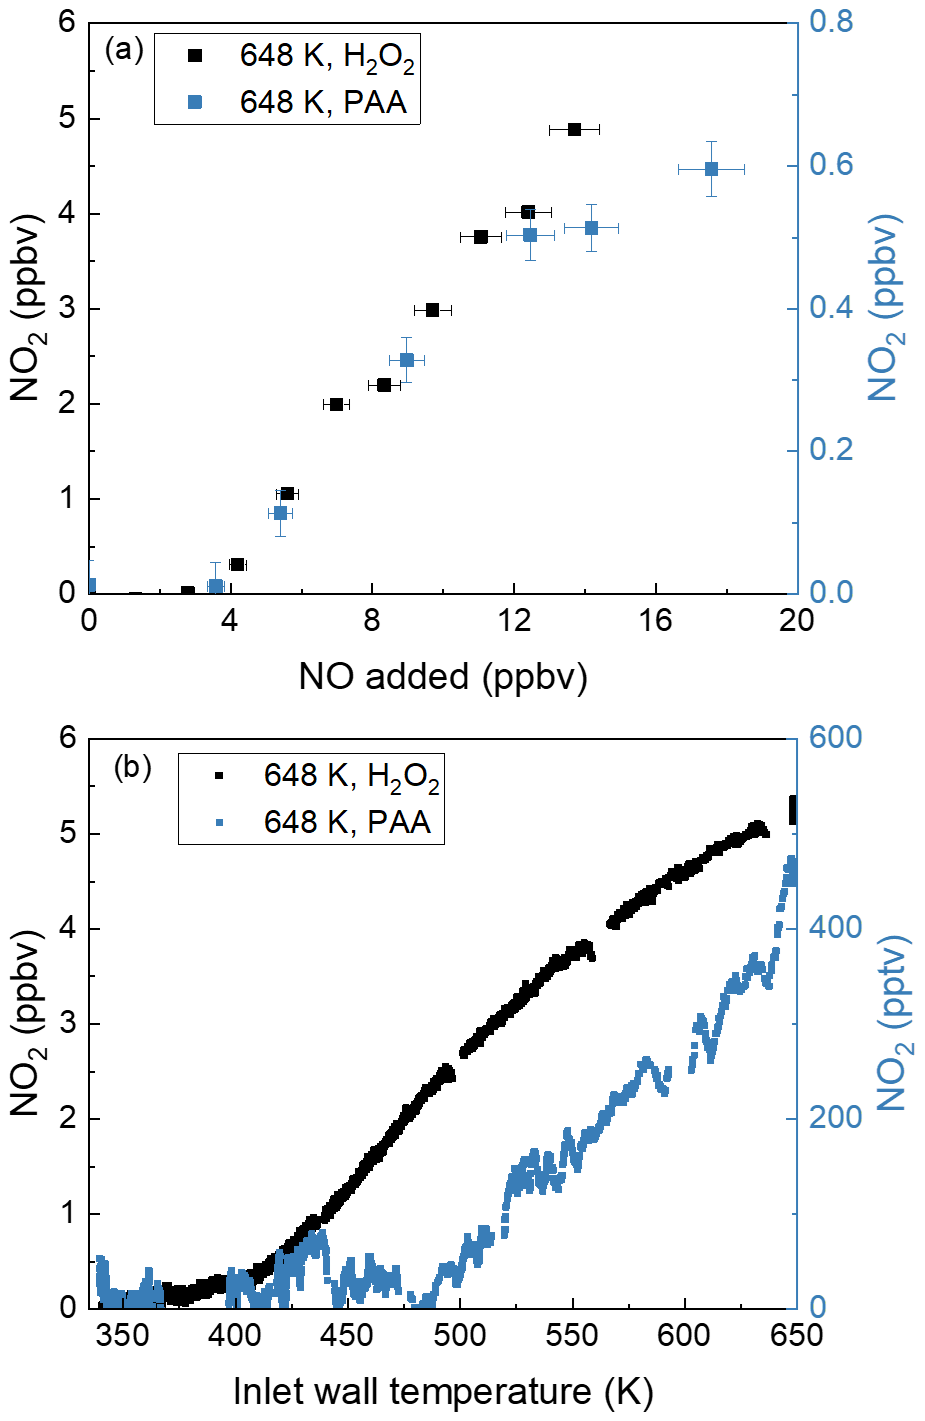
Figure 4(a) NO2 measured in the cavity with an inlet temperature at 648 K while adding NO to PAA (∼ 1 ppbv) and H2O2 (2–10 ppmv). For both datasets, the NO2 measured in the room temperature cavity has already been subtracted. The error bars in the x direction account for uncertainty in the mass flows (1 % of the maximum flow of the MFC) and the uncertainty of the mixing ratio of the NO bottle (5 %). The error bars in the y direction account for uncertainty (1σ) in the NO2 mixing ratios both at 648 K and at room temperature. (b) Thermograms measured in the AN cavity while adding 12 ppbv NO to PAA (∼ 0.3 ppbv) and H2O2 (2–10 ppmv). For both datasets, the NO2 measured in the room temperature cavity has already been subtracted.
In order to gain insight into the identity and relative concentrations of the trace gases exiting the photochemical reactor, numerical simulations (Table S1) were carried out with FACSIMILE (Curtis and Sweetenham, 1987). The results are summarised in Fig. S3, which displays the evolution of products in the photochemical reactor as a function of time. At 89 ppbv NO (Fig. S3) 88 ppbv PAN is produced. Note that, following dilution, this would result in ∼ 2 ppbv of acetone in the TD inlets as observed experimentally. The simulation indicates ppmv mixing ratios of several organic trace gases in the photochemical reactor, with 570 ppmv HCHO, 60 ppmv CH3OOH and 1 ppmv H2O2 after 120 s reaction time.
In summary, use of a photochemical PAN source using high levels of acetone and high radical densities is not well suited for characterising the inlet chemistry for alkyl nitrate detection via thermal decomposition to NO2 as it results in significant NO to NO2 conversion, owing to the presence of thermally labile trace gases such as peracetic acid and hydrogen peroxide. Used at high acetone concentrations, the photochemical source is also likely to cause matrix effects when deployed as a calibration source for mass-spectrometric detection of PAN. Indeed, the presence of organic acids and their possible interference in chemical-ionisation mass spectrometric studies of PAN have been documented previously (Mielke and Osthoff, 2012). This can be alleviated using much lower acetone concentrations (and thus radical production rates), which, however, limits the amount of PAN that can be generated.
4.2 The influence of NO and NO2 on the measurement of PNs (PAN diffusion source)
The results presented above clearly demonstrate that the photochemical PAN source generates not only PAN but a number of oxidised organics that can influence the chemistry in the TD inlet. This precludes an accurate assessment of the bias caused by the presence of NO or NO2 when attempting to measure ΣPNs in real air masses. For this reason, further experiments were performed with a PAN diffusion source which is not expected to have any significant impurities. The IR spectrum (Fig. S4) of a gas sample evaporated from the PAN diffusion source is in good agreement with the literature and does not reveal the presence of high levels of impurities.
Figure 5 shows the results of three experiments in which PAN was added to zero air at mixing ratios of ∼ 2 and ∼ 6 ppbv and detected (following thermal dissociation) in both the 448 and 648 K inlets as NO2. As described in the experiments above, the addition of various amounts of NO to the inlet results in a strong positive bias to the measurement, with a factor ∼ 2 more NO2 measured at 15 ppbv NO. Compared to the photochemical PAN source, the bias (NO2 formed per ppbv NO added) is smaller, which is related to the absence of thermally unstable products such as CH3C(O)OOH. The solid lines in these plots are the results of numerical simulations that consider the formation and loss of radicals (both gas-phase and heterogeneous) in the TD inlets and the resultant oxidation of NO to NO2. The simulations are described in detail in previous publications from this group (Thieser et al., 2016; Sobanski et al., 2016). While the simulations reproduce the bias caused by NO oxidation to NO2 reasonably well in these laboratory experiments with only one major trace gas present (PAN) apart from NO, the situation in the real atmosphere will be more complex, with potentially several different PAN species and many other trace gases that also interact with OH in the TD inlets to form other peroxyl radicals that may react with NO.
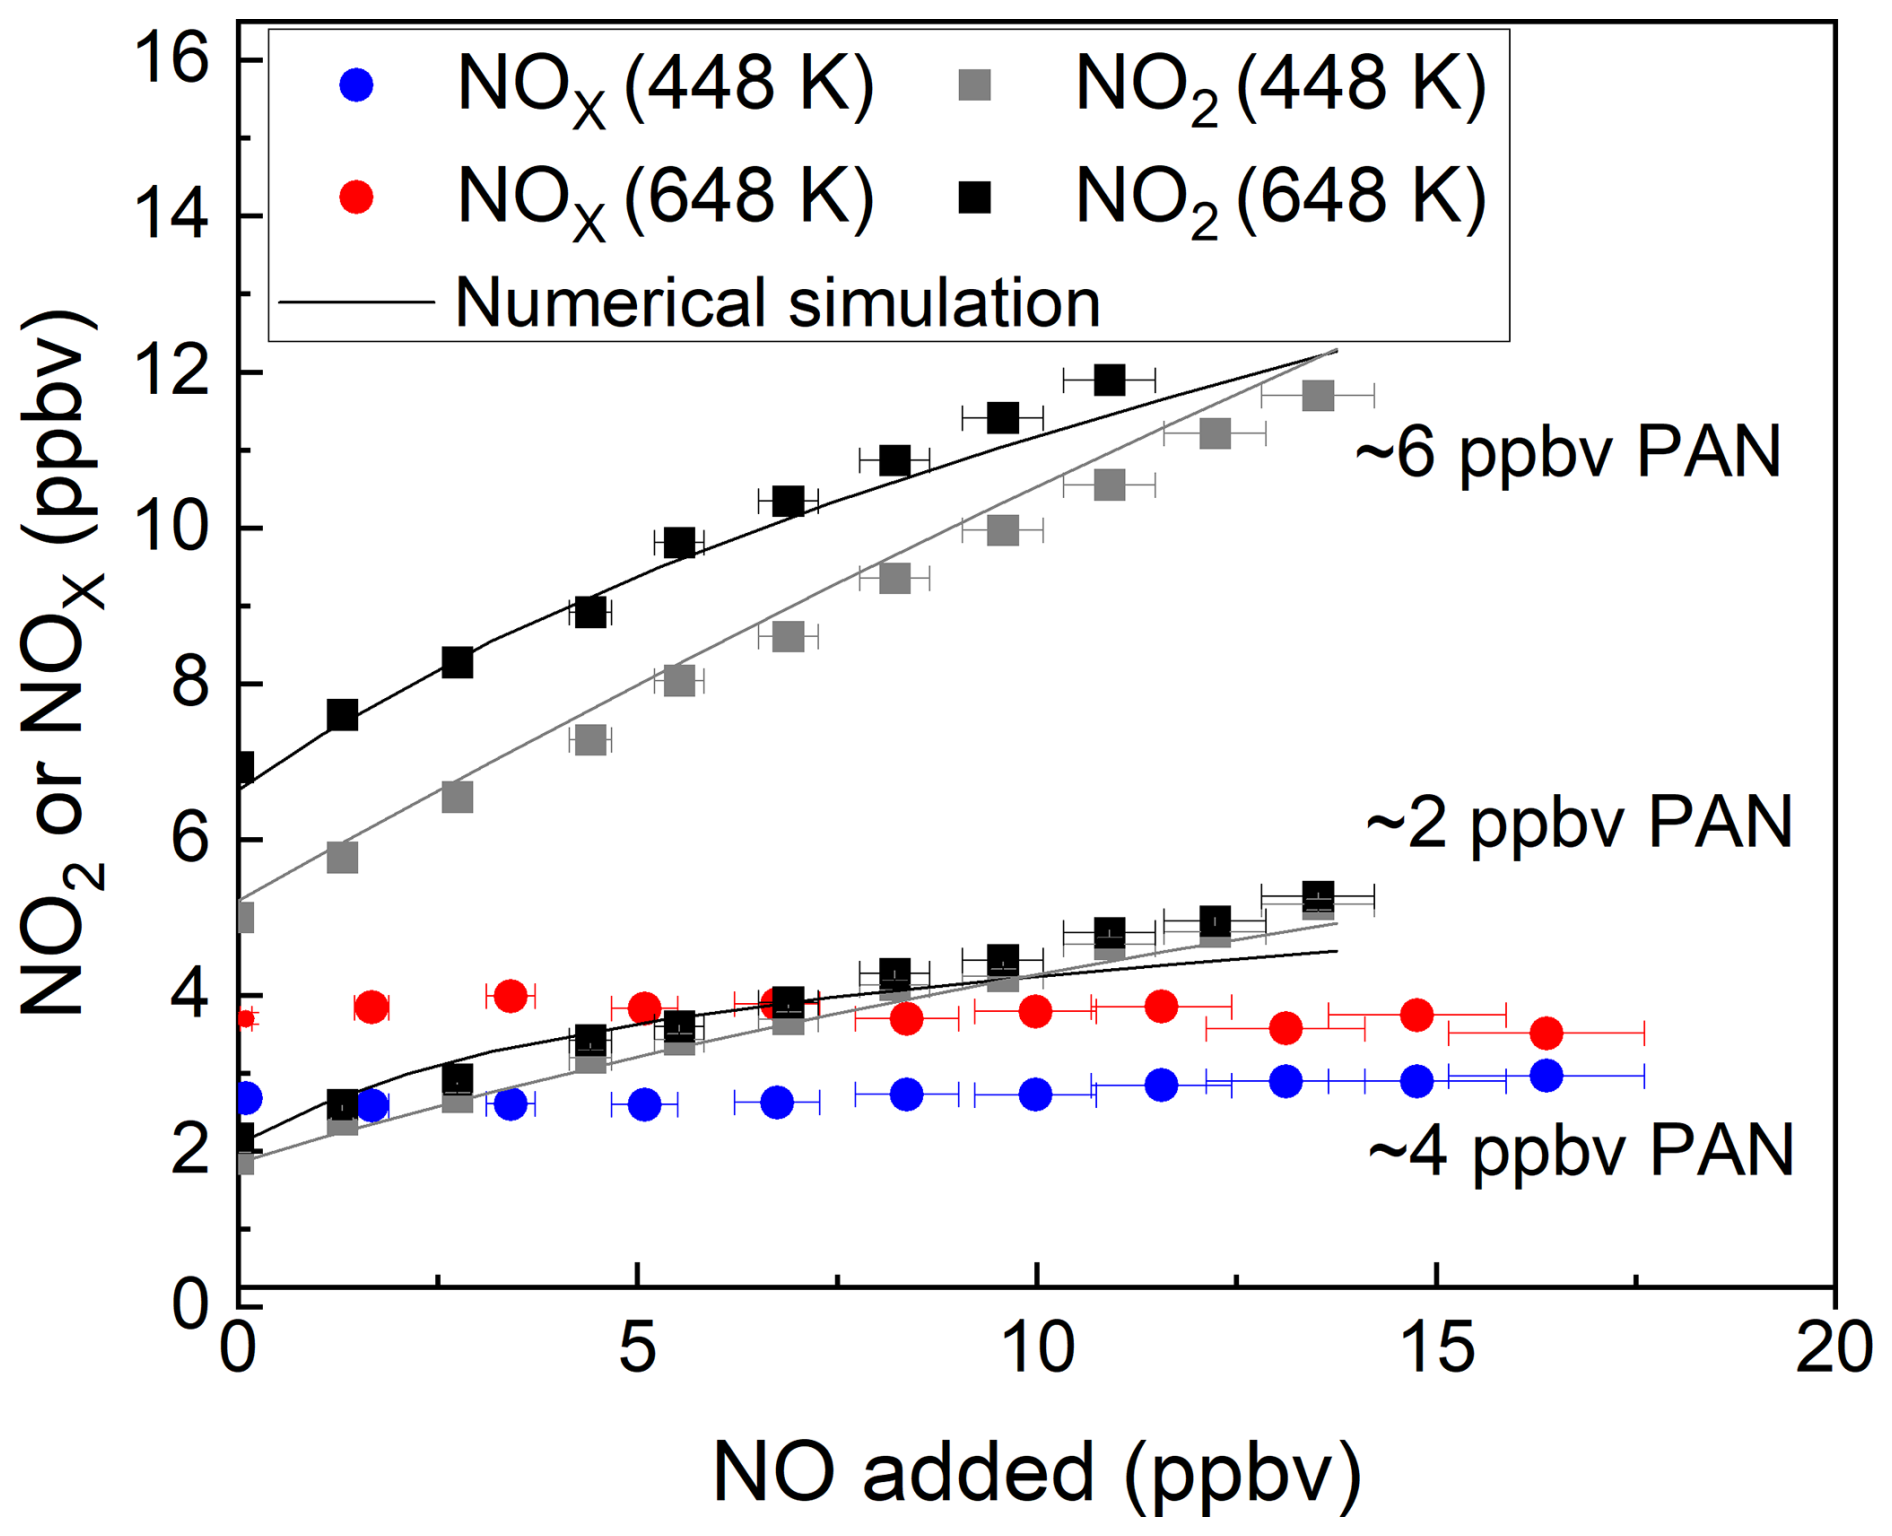
Figure 5Measured mixing ratios of NO2 and NOx during the addition of NO to PAN from the diffusion source for the cavities with inlet temperatures of 448 and 648 K. For each dataset, the NO2 or NOx measured in the room temperature cavity has already been subtracted.The error bars in the x direction consider uncertainty in the mass flows (1 % of the maximum flow of the MFC) and uncertainty in the mixing ratio of the NO bottle (5 %). The error bars in the y direction for 448 K consider the standard deviations (1σ) of the NO2 mixing ratios both at 448 K and at room temperature. The error bars in the y direction for 648 K account for the standard deviations (1σ) of the NO2 mixing ratios both at 648 K and at room temperature. The solid black and grey lines show the numerical simulation.
An effective approach to remove the bias caused by NO oxidation to NO2 has been described for TD inlet systems designed to detect NOy via conversion to NO2 (Friedrich et al., 2020; Wild et al., 2014). In this case, the air exiting the TD inlet is allowed to cool before adding sufficient O3 to convert NO to NO2 (see Sect. 3.1), and PAN is measured as NOx rather than NO2. The results of an experiment in which PAN was detected as NOx are displayed as the red and blue lines in Fig. 5. In this case, ∼ 4 ppbv PAN was initially present, and up to 17 ppbv of NO was added. The clear dependence of the retrieved PAN mixing ratio on the NO mixing ratio is no longer apparent when using either the 448 or 648 K TD inlet and alleviates the need to perform numerical simulations to correct the data.
The bias caused by the recombination of NO2 with CH3C(O)O2 (Sect. 2) was investigated when both NO2 and NOx were detected. The results of two experiments in which either ∼ 2 or ∼ 6 ppbv PAN from the diffusion source was sampled into the TD-CRDS with the addition of various amount of NO2 are shown in Fig. 6. The effect of the recombination of the acetyl peroxy radical with NO2 at 448 K can be seen in the data. Initial mixing ratios of PAN of ∼ 2 ppbv and ∼ 6 ppbv are detected as only 1.1 and 3.4 ppbv NO2, respectively. At 648 K the effect is significantly smaller than at 448 K, reflecting the thermal instability of CH3C(O)O2 at the higher temperature. The solid black and grey lines in this plot are the results of numerical simulations (Thieser et al., 2016; Sobanski et al., 2016). For the detection of NOx (blue and red symbols in Fig. 6), a similar effect was observed as for the detection of NO2. Thus, numerical simulations are still required to correct for the bias caused by the recombination of the acetyl peroxy radical with NO2. Within the experimental uncertainty, there is no significant difference in the size of the negative bias when detecting PAN as either NO2 or NOx. This is readily understandable, as the recombination of CH3C(O)O2 with NO2 to reform PAN after the gas flow cools down (after the heated inlets) is not influenced by the presence of O3 which is added later.
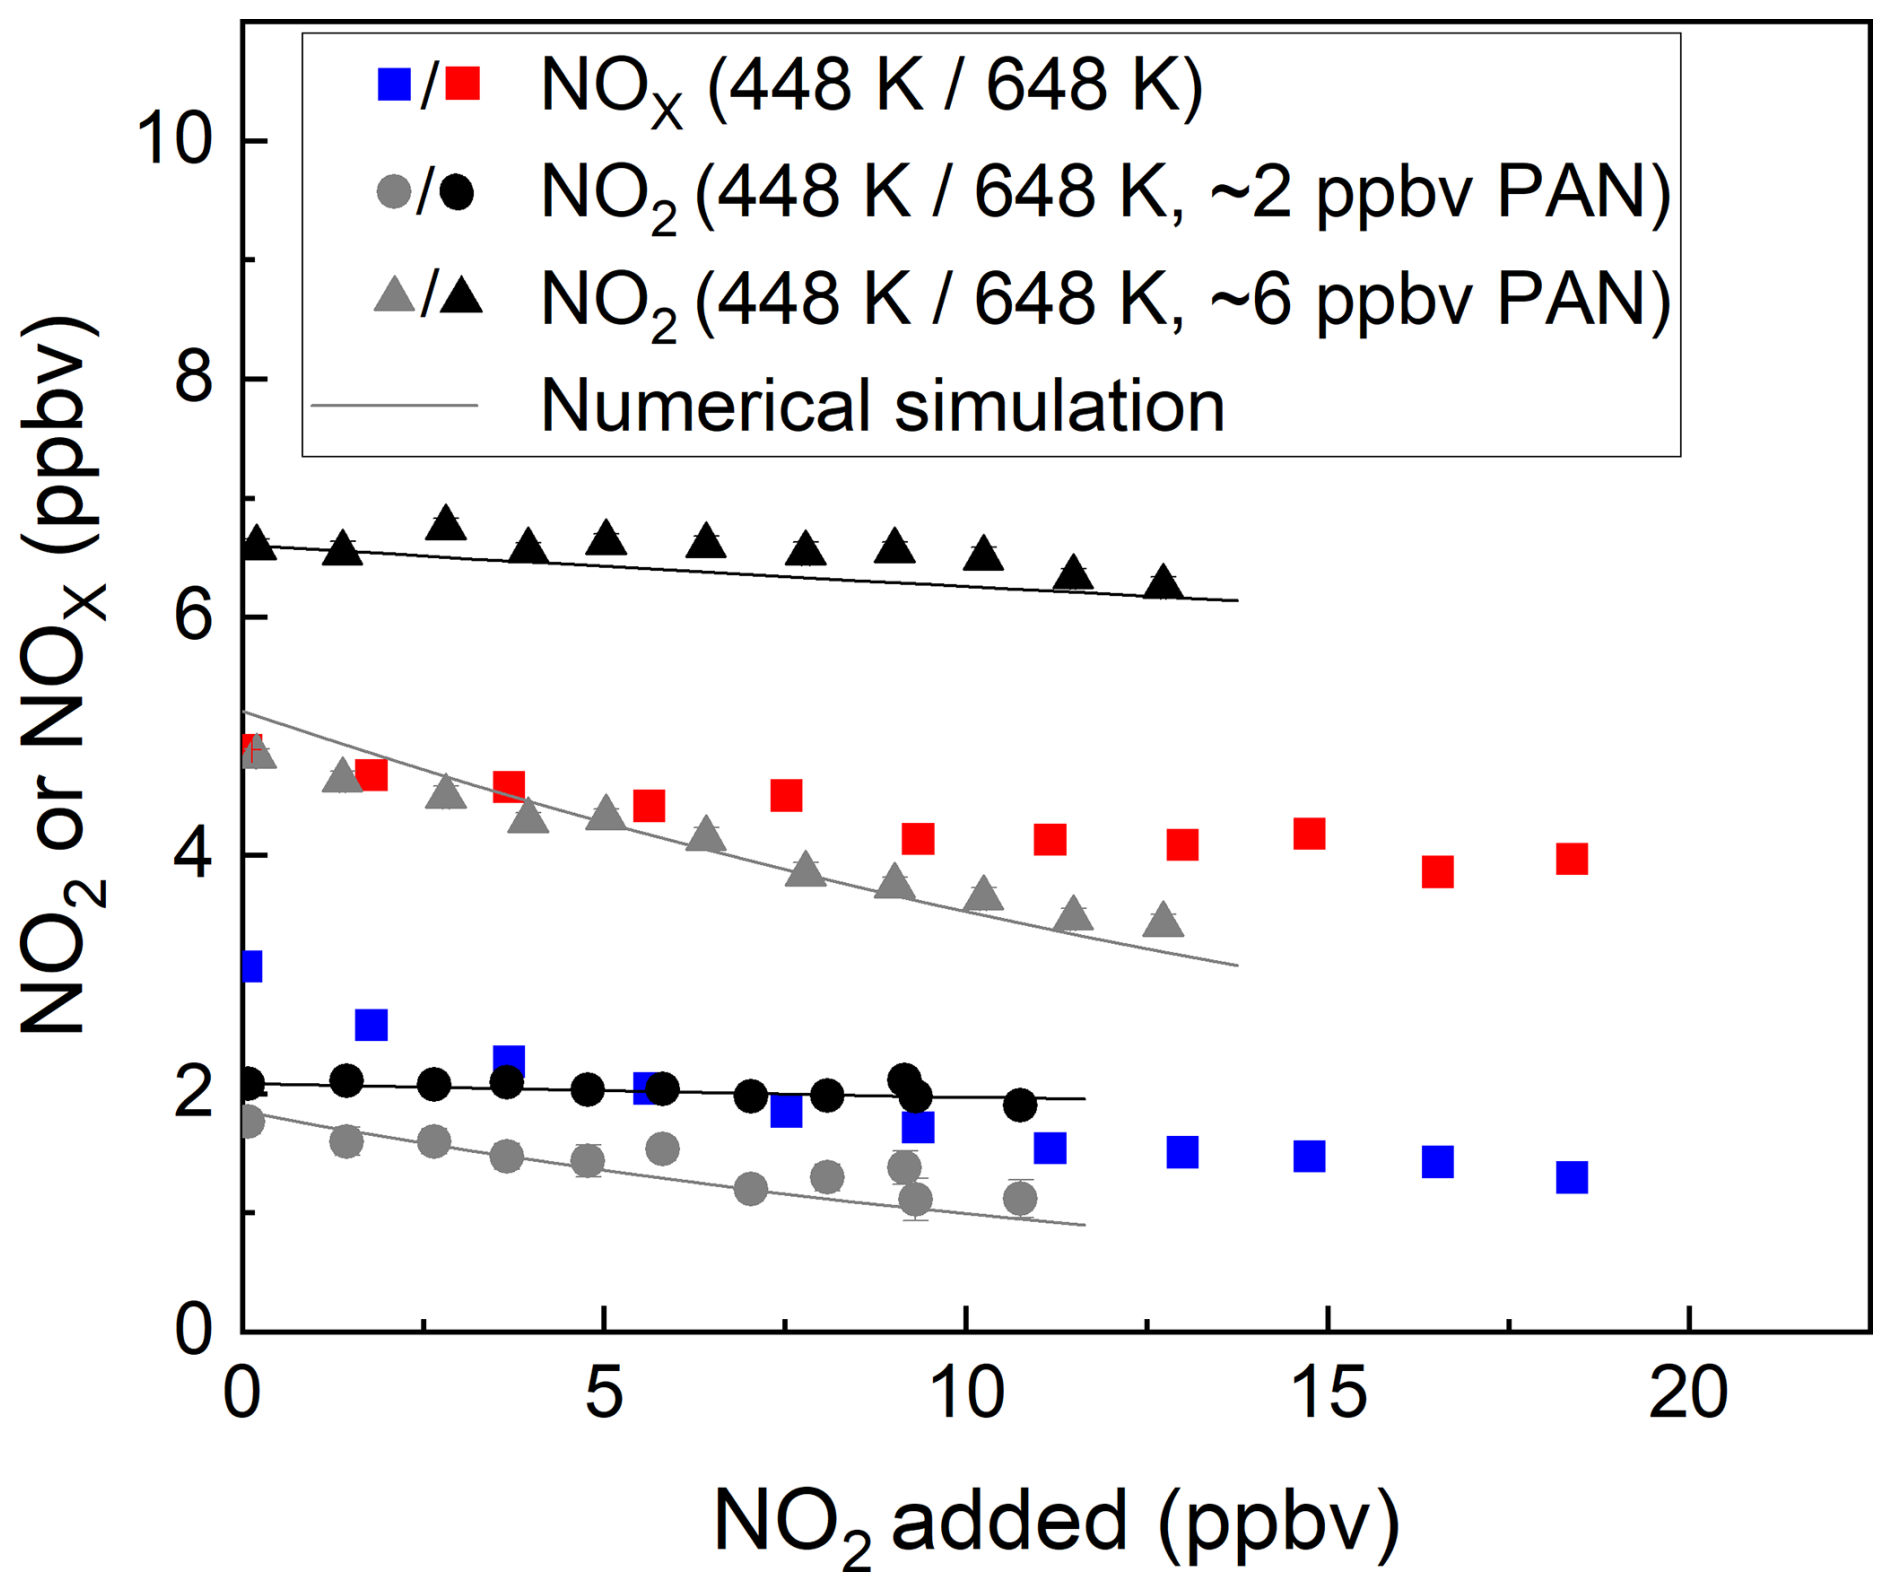
Figure 6Measured mixing ratios of NOx and NO2 during the addition of NO2 (measured with the cavity with inlet at room temperature) to PAN from the diffusion source. For each dataset, the NO2 or NOx measured in the room temperature cavity has already been subtracted. The inlet temperatures were 448 and 648 K. The error bars in the x direction represent standard deviation (1σ) of the NO2 mixing ratio at room temperature, those in the y direction for 648 K account for uncertainty (1σ) in the NO2 mixing ratios both at 648 K and at room temperature. The error bars in the y direction for 448 K account for the standard deviations (1σ) of the NO2 mixing ratios both at 448 K and at room temperature. The solid black and grey lines are the results of numerical simulations.
4.3 Influence of NO on the measurement of ΣANs
As described in Sect. 2, a saturated, C3 alkyl nitrate (IPN) has been widely used to characterise instruments using thermal dissociation to convert alkyl nitrates to (detectable) NO2. In previous work (Dewald et al., 2021), we have shown that IPN differs in its TD inlet chemistry from biogenically derived, unsaturated nitrates which undergo surface catalysed reactions (e.g. with ozone) on hot quartz surfaces at 448 K, resulting in the unwanted detection of ANs in the PNs channel and a bias to measurements obtained in environments dominated by biogenic nitrates. Dewald et al. (2021) were able to remove this effect in their measurements of ΣPNs using a 448 K inlet made of PFA rather than quartz. The instrument still however suffered from the positive bias caused by reactions of peroxyl radicals with NO, which was enhanced compared to a quartz inlet, as the RO2 radical losses to the PFA-tubing were reduced. Correction of the data obtained with that configuration thus required numerical simulations, which were based on laboratory experiments using IPN (Ohara et al., 2024; Thieser et al., 2016; Sobanski et al., 2016). We have extended these experiments using atmospherically more relevant (unsaturated) alkyl nitrates formed by the NO3-initiated degradation of isoprene and limonene.
The results of experiments in which ∼ 0.5 or ∼ 4 ppbv isoprene nitrate (derived by mixing N2O5 with isoprene in a reaction chamber, see Sect. 3.3) was sampled into the TD-CRDS with the addition of various amounts of NO are illustrated in Fig. 7a. In these experiments, either NOx (blue symbols) or NO2 (i.e. the O3 source was switched off, orange symbols) was measured. For the NO2-mode experiments, NO2 was present at (14.8 ± 0.2) ppbv, which is a consequence of using N2O5 in the chamber to generate NO3.
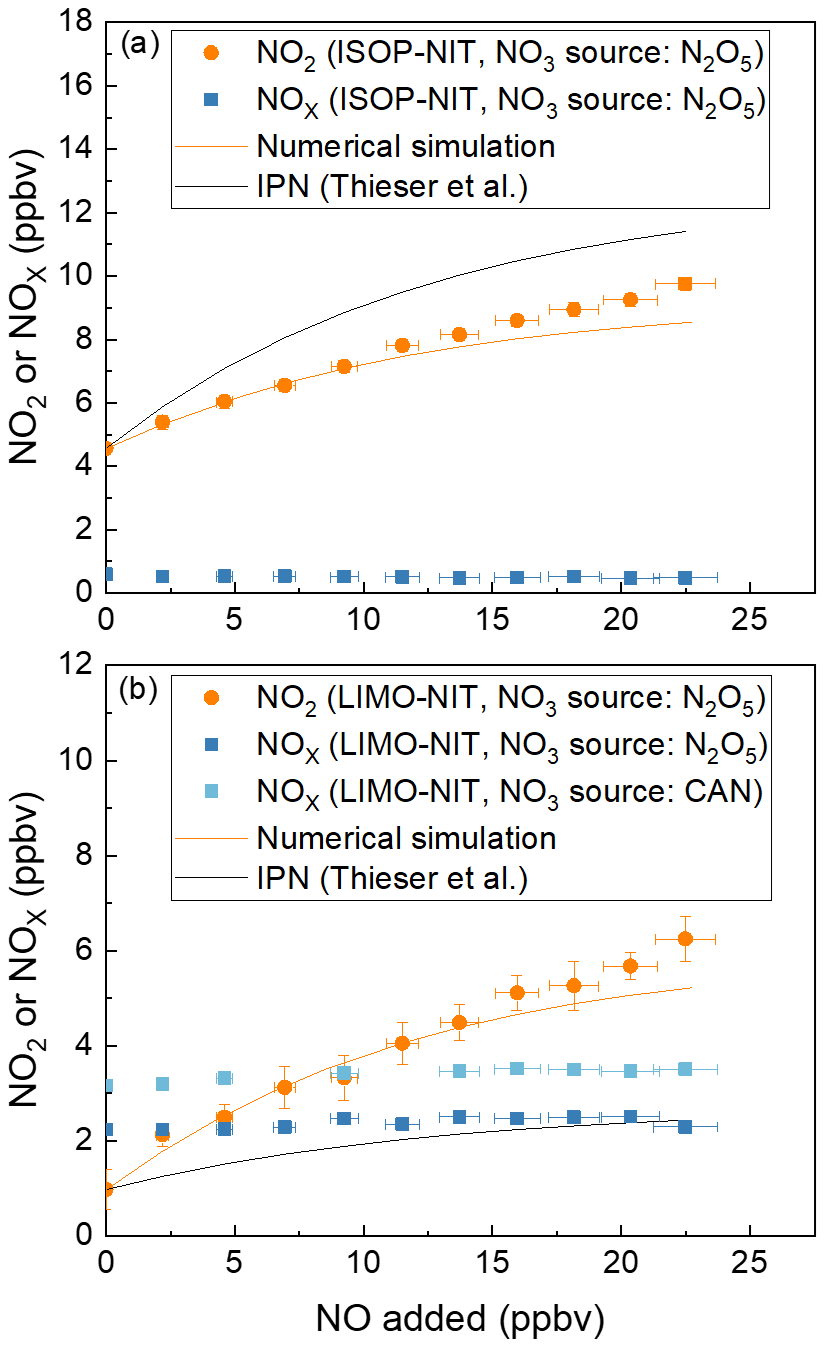
Figure 7Addition of NO to flowing samples of either (a) isoprene-derived nitrates (ISOP-NIT) or (b) limonene-derived nitrates (LIMO-NIT). NO3 was generated either with an N2O5 diffusion source or via cerium(IV) ammonium nitrate photolysis (CAN). The error bars in the x direction consider uncertainty in the mass flows (1 % of the maximum flow of the MFC) and uncertainty in the mixing ratio of the NO bottle (5 %). The error bars in the y direction consider the standard deviations (1σ) of the NO2 mixing ratios both at 648 K and at room temperature. The orange lines are the results of numerical simulations of the data at 648 K. The black lines are calculated from the expression NO (Thieser et al., 2016), as derived for addition of NO to IPN. The NO2 or NOx measured in the room temperature cavity has been subtracted from that measured in the cavity associated with the 648 K TD inlet.
In the NO2-mode experiment using isoprene-derived nitrate(s), the addition of ∼ 22 ppbv of NO results in a doubling of the NO2 signal (factor 2.3). This contrasts the results of Thieser et al. (2016), who, using IPN as a surrogate for alkyl nitrate, observed larger effects, as represented by the black line in Fig. 7a (Thieser et al., 2016).
For limonene-derived nitrate(s) (hereafter LIMO-NIT), the bias when measuring in NO2 mode is very large with the addition of the same amount of NO (22 ppbv), resulting in a 690 % overestimation of LIMO-NIT (in the presence of (19.3 ± 0.2) ppbv NO2). This contrasts previous results from this group obtained using IPN as surrogate alkyl nitrate and observed much smaller effects, which are represented by the black line in Fig. 7b (Thieser et al., 2016). In summary, at a NO mixing ratio of 20 ppbv (and NO2 ∼ 20 ppbv), the fractional conversion of NO to NO2 per 1 ppb of AN present in the sample flow is 7.0 % for IPN, 5.1 % for ISOP-NIT and 25 % for LIMO-NIT. Clearly, the conversion of NO to NO2 in the heated TD inlet is not only dependent on the amount of NO available to react but also on the nature of the alkyl nitrate. This result is partially intuitive, as the secondary chemistry resulting from degradation of the longer-chain alkyl nitrates will generate more organic peroxy radicals (to oxidise NO to NO2) than IPN. In order to gain some insight into the secondary chemistry involved, numerical simulations of the laboratory data were conducted. The starting point was the reaction scheme used to correct the PNs data as described previously. Rather than attempt to simulate all of the processes occurring at 648 K in the TD inlet (for which rate coefficients are not available), we varied the number of peroxy radicals generated from the decomposition of the alkoxy radicals formed in the first reaction of the biogenic-derived RO2 with NO and allowed them to react with NO at a rate coefficient of 2.55 × 10⁻¹² × exp() cm3 molec.−1 s−1).
To approximately simulate the data, a value of n = 1 was sufficient for isoprene nitrate, whereas a value of 5 was required to reproduce the very large effect observed for limonene nitrate. This is related to the different number of carbon atoms and chemical structure and the different chemical reactions in the presence of NO in the TD inlet. From our results, it is apparent, that, when TD-CRDS instruments are operated in NO2 mode, (1) IPN is not a suitable surrogate molecule for the correction of ΣANs, as has previously been practised, and (2) given that ambient measurements will normally mixture of many alkyl nitrates, corrections based on numerical simulations that have been optimised for IPN will not provide reliable data unless NO levels are very low. This would limit the usefulness of such devices to locations with NO > ∼ 2 ppbv (Sobanski et al., 2016) as found in remote/rural environments or at nighttime when NO levels are often low unless nearby emission sources are present (as, for example, in urbanised regions).
Experiments in NOx mode (Fig. 7, blue symbols), in which 22.5 ppbv NO was added to either limonene nitrates (Fig. 7b) or isoprene nitrate (Fig. 7a, both formed by the reaction of NO3 and the corresponding terpene) in the simulation chamber, were also conducted, and the results are strikingly different to those when NO2 was detected. As expected, there is no significant dependence on NO added between zero and 22 ppbv.
We have shown that the use of a conventional, photochemical (acetone-based) source of PAN can result in incorrect characterisation of TD inlets when used to detect PANs and ANs, especially when high concentrations of acetone are used. This is caused (at least in part) by the presence of thermally labile, peroxidic trace gases, which lead to a strong positive bias of NO to NO2 conversion in the ANs inlet. The use of “pure” PAN samples is considered to be superior as it results in more accurate thermograms and NO dependencies in the heated inlet designed to detect ANs.
For the first time, we have quantified the potential bias from secondary chemistry (e.g. oxidation of ambient NO to NO2) when using biogenic nitrates derived from terpenoids. The results indicate a larger bias for limonene nitrates and a smaller bias for isoprene nitrates than obtained using a saturated organic nitrate such as IPN. While IPN has the undoubted advantage of being commercially available and easy to handle, its use to characterise TD inlets to detect ANs will not lead to results that can be transferred to other (longer-chain) nitrates, as has been frequently assumed. The effect is partially understood in terms of the sequential breakdown of the C10 backbone (e.g. for terpenes) to peroxy radicals that convert NO to NO2.
Inspired by the success of our instrument to detect inorganic and organic NOY species as NOx subsequent to thermal dissociation (Friedrich et al., 2020), we have modified our PAN/AN instrument in a similar manner (i.e. by detecting NOx rather than NO2). The results indicate that, when sampling the real atmosphere with NO present, this mode of operation is to be preferred over NO2 detection as the positive bias caused when RO2 that is formed, for example, from biogenic precursors reacts with ambient NO is eliminated.
In the instrument configuration described here with the PANs TD inlet made of PFA, the ANs TD inlet made of quartz and the addition of O3 downstream of the TD inlets to convert NO to NO2, corrections for the oxidation of NO by O3 and RO2 are no longer necessary, and channel cross-talk (i.e. the detection of a fraction of ANs at the PANs inlet) is avoided. The only requirement for simulation is to remove the (negative) bias caused by the recombination of acyl peroxy radicals with NO2 downstream of the TD inlets. As the dominant atmospheric acyl peroxy nitrate is PAN itself, for which detailed experiments exist to characterise the system, this does not introduce significant uncertainty into the measurement of ΣPNs unless NO2 levels are very large.
The FACSIMILE code used for the numerical simulations can be found in the Supplement. The data underlying the figures in this publication are available at the Max Planck repository (EDMOND) at https://doi.org/10.17617/3.YERCC6 (Wüst, 2025).
The supplement related to this article is available online at https://doi.org/10.5194/amt-18-1943-2025-supplement.
LW and PD performed the experiments, and GNTET assisted with development and deployment of NO3 sources and data acquisition. LW evaluated the data and wrote the first draft of the manuscript. JNC conceptualised the SCHARK experiments and with JL contributed to the manuscript. This study was carried out in part fulfilment of the PhD of LW at the Johannes Gutenberg University Mainz.
The contact author has declared that none of the authors has any competing interests.
Publisher's note: Copernicus Publications remains neutral with regard to jurisdictional claims made in the text, published maps, institutional affiliations, or any other geographical representation in this paper. While Copernicus Publications makes every effort to include appropriate place names, the final responsibility lies with the authors.
We thank Chemours for provision of a FEP sample used to coat the cavities.
Patrick Dewald gratefully acknowledges funding from the Deutsche Forschungsgemeinschaft (project “MONOTONS”, project number 522970430).
This research has been supported by the Deutsche Forschungsgemeinschaft (project “MONOTONS”, project number 522970430).
The article processing charges for this open-access publication were covered by the Max Planck Society.
This paper was edited by Anna Novelli and reviewed by Hans Osthoff and one anonymous referee.
Atkinson, R., Baulch, D. L., Cox, R. A., Crowley, J. N., Hampson, R. F., Hynes, R. G., Jenkin, M. E., Rossi, M. J., Troe, J., and IUPAC Subcommittee: Evaluated kinetic and photochemical data for atmospheric chemistry: Volume II – gas phase reactions of organic species, Atmos. Chem. Phys., 6, 3625–4055, https://doi.org/10.5194/acp-6-3625-2006, 2006.
Baulch, D. L., Bowman, C. T., Cobos, C. J., Cox, R. A., Just, T., Kerr, J. A., Pilling, M. J., Stocker, D., Troe, J., Tsang, W., Walker, R. W., and Warnatz, J.: Evaluated kinetic data for combustion modeling: Supplement II, J. Phys. Chem. Ref. Data, 34, 757–1397, 2005.
Brown, S. S. and Stutz, J.: Nighttime radical observations and chemistry, Chem. Soc. Rev., 41, 6405–6447, 2012.
Brown, S. S., Stark, H., Ryerson, T. B., Williams, E. J., Nicks, D. K., Trainer, M., Fehsenfeld, F. C., and Ravishankara, A. R.: Nitrogen oxides in the nocturnal boundary layer: Simultaneous in situ measurements of NO3, N2O5, NO2, NO, and O3, J. Geophys. Res.-Atmos., 108, 4299, https://doi.org/10.1029/2002JD002917, 2003.
Carr, S. A., Baeza-Romero, M. T., Blitz, M. A., Pilling, M. J., Heard, D. E., and Seakins, P. W.: OH yields from the CH3CO + O2 reaction using an internal standard, Chem. Phys. Lett., 445, 108–112, 2007.
Carr, S. A., Glowacki, D. R., Liang, C.-H., Baeza-Romero, M. T., Blitz, M. A., Pilling, M. J., and Seakins, P. W.: Experimental and modeling studies of the pressure and temperature dependences of the kinetics and the OH yields in the acetyl + O2 reaction, J. Phys. Chem. A, 115, 1069–1085, 2011.
Chen, S.-Y. and Lee, Y.-P.: Transient infrared absorption of t-CH3C(O)OO, c-CH3C(O)OO, and α-lactone recorded in gaseous reactions of CH3CO and O2, J. Chem. Phys., 132, 114303, https://doi.org/10.1063/1.3352315, 2010.
Crutzen, P. J.: The role of NO and NO2 in the chemistry of the troposphere and stratosphere, Ann. Rev. Earth Planet. Sci., 7, 443–472, 1979.
Curtis, A. R. and Sweetenham, W. P.: Facsimile, Atomic Energy Research Establishment, Report R-12805, 1987.
Day, D. A., Wooldridge, P. J., Dillon, M. B., Thornton, J. A., and Cohen, R. C.: A thermal dissociation laser-induced fluorescence instrument for in situ detection of NO2, peroxy nitrates, alkyl nitrates, and HNO3, J. Geophys. Res.-Atmos., 107, ACH 4-1–ACH 4-14, https://doi.org/10.1029/2001jd000779, 2002.
Dewald, P., Dörich, R., Schuladen, J., Lelieveld, J., and Crowley, J. N.: Impact of ozone and inlet design on the quantification of isoprene-derived organic nitrates by thermal dissociation cavity ring-down spectroscopy (TD-CRDS), Atmos. Meas. Tech., 14, 5501–5519, https://doi.org/10.5194/amt-14-5501-2021, 2021.
Dewald, P., Nussbaumer, C. M., Schuladen, J., Ringsdorf, A., Edtbauer, A., Fischer, H., Williams, J., Lelieveld, J., and Crowley, J. N.: Fate of the nitrate radical at the summit of a semi-rural mountain site in Germany assessed with direct reactivity measurements, Atmos. Chem. Phys., 22, 7051–7069, https://doi.org/10.5194/acp-22-7051-2022, 2022.
Dewald, P., Seubert, T., Andersen, S. T., Türk, G. N. T. E., Schuladen, J., McGillen, M. R., Denjean, C., Etienne, J.-C., Garrouste, O., Jamar, M., Harb, S., Cirtog, M., Michoud, V., Cazaunau, M., Bergé, A., Cantrell, C., Dusanter, S., Picquet-Varrault, B., Kukui, A., Xue, C., Mellouki, A., Lelieveld, J., and Crowley, J. N.: NO3 reactivity during a summer period in a temperate forest below and above the canopy, Atmos. Chem. Phys., 24, 8983–8997, https://doi.org/10.5194/acp-24-8983-2024, 2024.
Di Carlo, P., Aruffo, E., Busilacchio, M., Giammaria, F., Dari-Salisburgo, C., Biancofiore, F., Visconti, G., Lee, J., Moller, S., Reeves, C. E., Bauguitte, S., Forster, G., Jones, R. L., and Ouyang, B.: Aircraft based four-channel thermal dissociation laser induced fluorescence instrument for simultaneous measurements of NO2, total peroxy nitrate, total alkyl nitrate, and HNO3, Atmos. Meas. Tech., 6, 971–980, https://doi.org/10.5194/amt-6-971-2013, 2013.
Flocke, F. M., Weinheimer, A. J., Swanson, A. L., Roberts, J. M., Schmitt, R., and Shertz, S.: On the measurement of PANs by gas chromatography and electron capture detection, J. Atmos. Chem., 52, 19–43, 2005.
Friedrich, N., Tadic, I., Schuladen, J., Brooks, J., Darbyshire, E., Drewnick, F., Fischer, H., Lelieveld, J., and Crowley, J. N.: Measurement of NOx and NOy with a thermal dissociation cavity ring-down spectrometer (TD-CRDS): instrument characterisation and first deployment, Atmos. Meas. Tech., 13, 5739–5761, https://doi.org/10.5194/amt-13-5739-2020, 2020.
Gaffney, J. S., Fajer, R., and Senum, G. I.: An improved procedure for high-purity gaseous peroxyacyl nitrate production - use of heavy lipid solvents, Atmos. Environ., 18, 215–218, https://doi.org/10.1016/0004-6981(84)90245-2, 1984.
Geyer, A., Ackermann, R., Dubois, R., Lohrmann, B., Muller, T., and Platt, U.: Long-term observation of nitrate radicals in the continental boundary layer near Berlin, Atmos. Environ., 35, 3619–3631, https://doi.org/10.1016/S1352-2310(00)00549-5, 2001.
Groß, C. B. M., Dillon, T. J., Schuster, G., Lelieveld, J., and Crowley, J. N.: Direct Kinetic Study of OH and O3 Formation in the Reaction of CH3C(O)O2 with HO2, J. Phys. Chem. A, 118, 974–985, https://doi.org/10.1021/jp412380z, 2014.
Heintz, F., Platt, U., Flentje, H., and Dubois, R.: Long-term observation of nitrate radicals at the tor station, Kap Arkona (Rugen), J. Geophys. Res.-Atmos., 101, 22891–22910, 1996.
Horowitz, L. W., Fiore, A. M., Milly, G. P., Cohen, R. C., Perring, A., Wooldridge, P. J., Hess, P. G., Emmons, L. K., and Lamarque, J.-F.: Observational constraints on the chemistry of isoprene nitrates over the eastern United States, J. Geophys. Res., 112, D12S08, https://doi.org/10.1029/2006JD007747, 2007.
IUPAC Task Group on Atmospheric Chemical Kinetic Data Evaluation, Ammann, M., Cox, R. A., Crowley, J. N., Herrmann, H., Jenkin, M. E., McNeill, V. F., Mellouki, A., Rossi, M. J., Troe, J., and Wallington, T. J.: https://iupac.aeris-data.fr/, last access: October 2024.
Keehan, N. I., Brownwood, B., Marsavin, A., Day, D. A., and Fry, J. L.: A thermal-dissociation–cavity ring-down spectrometer (TD-CRDS) for the detection of organic nitrates in gas and particle phases, Atmos. Meas. Tech., 13, 6255–6269, https://doi.org/10.5194/amt-13-6255-2020, 2020.
Kirk, A. D.: The Thermal Decomposition of Methyl Hydroperoxide, Can. J. Chem., 43, 2236–2242, 1965.
Lambe, A. T., Bai, B., Takeuchi, M., Orwat, N., Zimmerman, P. M., Alton, M. W., Ng, N. L., Freedman, A., Claflin, M. S., Gentner, D. R., Worsnop, D. R., and Liu, P.: Technical note: Gas-phase nitrate radical generation via irradiation of aerated ceric ammonium nitrate mixtures, Atmos. Chem. Phys., 23, 13869–13882, https://doi.org/10.5194/acp-23-13869-2023, 2023.
Lee, J., Chen, C.-J., and Bozzelli, J. W.: Thermochemical and kinetic analysis of the acetyl radical (CH3CO) + O2 Reaction System, J. Phys. Chem. A, 106, 7155–7170, https://doi.org/10.1021/jp014443g, 2002.
Lee, L., Wooldridge, P. J., Gilman, J. B., Warneke, C., de Gouw, J., and Cohen, R. C.: Low temperatures enhance organic nitrate formation: evidence from observations in the 2012 Uintah Basin Winter Ozone Study, Atmos. Chem. Phys., 14, 12441–12454, https://doi.org/10.5194/acp-14-12441-2014, 2014.
Lelieveld, J., Evans, J. S., Fnais, M., Giannadaki, D., and Pozzer, A.: The contribution of outdoor air pollution sources to premature mortality on a global scale, Nature, 525, 367–371, https://doi.org/10.1038/nature15371, 2015.
Li, C., Wang, H., Chen, X., Zhai, T., Chen, S., Li, X., Zeng, L., and Lu, K.: Thermal dissociation cavity-enhanced absorption spectrometer for measuring NO2, RO2NO2, and RONO2 in the atmosphere, Atmos. Meas. Tech., 14, 4033–4051, https://doi.org/10.5194/amt-14-4033-2021, 2021.
Liebmann, J., Karu, E., Sobanski, N., Schuladen, J., Ehn, M., Schallhart, S., Quéléver, L., Hellen, H., Hakola, H., Hoffmann, T., Williams, J., Fischer, H., Lelieveld, J., and Crowley, J. N.: Direct measurement of NO3 radical reactivity in a boreal forest, Atmos. Chem. Phys., 18, 3799–3815, https://doi.org/10.5194/acp-18-3799-2018, 2018.
Liebmann, J., Sobanski, N., Schuladen, J., Karu, E., Hellén, H., Hakola, H., Zha, Q., Ehn, M., Riva, M., Heikkinen, L., Williams, J., Fischer, H., Lelieveld, J., and Crowley, J. N.: Alkyl nitrates in the boreal forest: formation via the NO3-, OH- and O3-induced oxidation of biogenic volatile organic compounds and ambient lifetimes, Atmos. Chem. Phys., 19, 10391–10403, https://doi.org/10.5194/acp-19-10391-2019, 2019.
Lightfoot, P. D., Cox, R. A., Crowley, J. N., Destriau, M., Hayman, G. D., Jenkin, M. E., Moortgat, G. K., and Zabel, F.: Organic Peroxy-radicals – Kinetics, Spectroscopy and Tropospheric Chemistry, Atmos. Environ. A-Gen., 26, 1805–1961, 1992.
Lin, C., Hu, R., Xie, P., Zhang, G., Liu, X., Tong, J., and Liu, W.: A three-channel thermal dissociation cavity ring-down spectrometer for simultaneous measurement of ambient total peroxy nitrates, total alkyl nitrates, and NO2, Talanta, 270, 125524, https://doi.org/10.1016/j.talanta.2023.125524, 2024.
Mielke, L. H. and Osthoff, H. D.: On quantitative measurements of peroxycarboxylic nitric anhydride mixing ratios by thermal dissociation chemical ionization mass spectrometry, Int. J. Mass Spectrom., 310, 1–9, https://doi.org/10.1016/j.ijms.2011.10.005, 2012.
Murphy, J. G., Thornton, J. A., Wooldridge, P. J., Day, D. A., Rosen, R. S., Cantrell, C., Shetter, R. E., Lefer, B., and Cohen, R. C.: Measurements of the sum of HO2NO2 and CH3O2NO2 in the remote troposphere, Atmos. Chem. Phys., 4, 377–384, https://doi.org/10.5194/acp-4-377-2004, 2004.
Ng, N. L., Brown, S. S., Archibald, A. T., Atlas, E., Cohen, R. C., Crowley, J. N., Day, D. A., Donahue, N. M., Fry, J. L., Fuchs, H., Griffin, R. J., Guzman, M. I., Herrmann, H., Hodzic, A., Iinuma, Y., Jimenez, J. L., Kiendler-Scharr, A., Lee, B. H., Luecken, D. J., Mao, J., McLaren, R., Mutzel, A., Osthoff, H. D., Ouyang, B., Picquet-Varrault, B., Platt, U., Pye, H. O. T., Rudich, Y., Schwantes, R. H., Shiraiwa, M., Stutz, J., Thornton, J. A., Tilgner, A., Williams, B. J., and Zaveri, R. A.: Nitrate radicals and biogenic volatile organic compounds: oxidation, mechanisms, and organic aerosol, Atmos. Chem. Phys., 17, 2103–2162, https://doi.org/10.5194/acp-17-2103-2017, 2017.
Ohara, N., Shioji, T., Matsumoto, J., Inomata, S., Sakamoto, Y., Kajii, Y., Shiigi, H., and Sadanaga, Y.: Improved continuous measurement system for atmospheric total peroxy and total organic nitrate under the high NOx condition, Rev. Sci. Instrum., 95, 045101, https://doi.org/10.1063/5.0172219, 2024.
Orlando, J. J. and Tyndall, G. S.: Laboratory studies of organic peroxy radical chemistry: an overview with emphasis on recent issues of atmospheric significance, Chem. Soc. Rev., 41, 6294–6317, 2012.
Papadimitriou, V. C., Karafas, E. S., Gierczak, T., and Burkholder, J. B.: CH3CO + O2 + M (M = He, N2) reaction rate coefficient measurements and implications for the OH radical product yield, J. Phys. Chem. A, 119, 7481–7497, https://doi.org/10.1021/acs.jpca.5b00762, 2015.
Paul, D. and Osthoff, H. D.: Absolute Measurements of Total Peroxy Nitrate Mixing Ratios by Thermal Dissociation Blue Diode Laser Cavity Ring-Down Spectroscopy, Anal. Chem., 82, 6695–6703, https://doi.org/10.1021/ac101441z, 2010.
Paul, D., Furgeson, A., and Osthoff, H. D.: Measurements of total peroxy and alkyl nitrate abundances in laboratory-generated gas samples by thermal dissociation cavity ring-down spectroscopy, Rev. Sci. Instrum., 80, 114101, https://doi.org/10.1063/1.3258204 2009.
Perring, A. E., Pusede, S. E., and Cohen, R. C.: An observational perspective on the atmospheric impacts of alkyl and multifunctional nitrates on ozone and secondary organic aerosol, Chem. Rev., 113, 5848–5870, https://doi.org/10.1021/cr300520x, 2013.
Rider, N. D., Taha, Y. M., Odame-Ankrah, C. A., Huo, J. A., Tokarek, T. W., Cairns, E., Moussa, S. G., Liggio, J., and Osthoff, H. D.: Efficient photochemical generation of peroxycarboxylic nitric anhydrides with ultraviolet light-emitting diodes, Atmos. Meas. Tech., 8, 2737–2748, https://doi.org/10.5194/amt-8-2737-2015, 2015.
Roberts, J. M.: The atmospheric chemistry of organic nitrates, Atmos. Environ. A-Gen., 24, 243–287, https://doi.org/10.1016/0960-1686(90)90108-y, 1990.
Sadanaga, Y., Takaji, R., Ishiyama, A., Nakajima, K., Matsuki, A., and Bandow, H.: Thermal dissociation cavity attenuated phase shift spectroscopy for continuous measurement of total peroxy and organic nitrates in the clean atmosphere, Rev. Sci. Instrum., 87, 074102, https://doi.org/10.1063/1.4958167, 2016.
Sahetchian, K. A., Rigny, R., Tardieu de Maleissye, J., Batt, L., Anwar Khan, M., and Mathews, S.: The pyrolysis of organic hydroperoxides (ROOH), Symposium (International) on Combustion, 24, 637–643, https://doi.org/10.1016/S0082-0784(06)80078-0, 1992.
Schmidt, C. and Sehon, A. H.: Themal decomposition of peracetic acid in vapor phase, Can. J. Chem., 41, 1819–1825, https://doi.org/10.1139/v63-261, 1963.
Schwantes, R. H., Teng, A. P., Nguyen, T. B., Coggon, M. M., Crounse, J. D., St Clair, J. M., Zhang, X., Schilling, K. A., Seinfeld, J. H., and Wennberg, P. O.: Isoprene NO3 Oxidation Products from the RO2 + HO2 Pathway, J. Phys. Chem. A, 119, 10158–10171, https://doi.org/10.1021/acs.jpca.5b06355, 2015.
Slusher, D. L., Huey, L. G., Tanner, D. J., Chen, G., Davis, D. D., Buhr, M., Nowak, J. B., Eisele, F. L., Kosciuch, E., Mauldin, R. L., Lefer, B. L., Shetter, R. E., and Dibb, J. E.: Measurements of pernitric acid at the South Pole during ISCAT 2000, Geophys. Res. Lett., 29, 2011, https://doi.org/10.1029/2002gl015703, 2002.
Slusher, D. L., Huey, L. G., Tanner, D. J., Flocke, F. M., and Roberts, J. M.: A thermal dissociation-chemical ionization mass spectrometry (TD-CIMS) technique for the simultaneous measurement of peroxyacyl nitrates and dinitrogen pentoxide, J. Geophys. Res.-Atmos., 109, D19315, https://doi.org/10.1029/2004JD004670, 2004.
Sobanski, N., Schuladen, J., Schuster, G., Lelieveld, J., and Crowley, J. N.: A five-channel cavity ring-down spectrometer for the detection of NO2, NO3, N2O5, total peroxy nitrates and total alkyl nitrates, Atmos. Meas. Tech., 9, 5103–5118, https://doi.org/10.5194/amt-9-5103-2016, 2016.
Spittler, M., Barnes, I., Bejan, I., Brockmann, K. J., Benter, T., and Wirtz, K.: Reactions of NO3 radicals with limonene and alpha-pinene: Product and SOA formation, Atmos. Environ., 40, S116–S127, https://doi.org/10.1016/j.atmosenv.2005.09.093, 2006.
Taha, Y. M., Saowapon, M. T., Assad, F. V., Ye, C. Z., Chen, X., Garner, N. M., and Osthoff, H. D.: Quantification of peroxynitric acid and peroxyacyl nitrates using an ethane-based thermal dissociation peroxy radical chemical amplification cavity ring-down spectrometer, Atmos. Meas. Tech., 11, 4109–4127, https://doi.org/10.5194/amt-11-4109-2018, 2018.
Talukdar, R. K., Burkholder, J. B., Schmoltner, A. M., Roberts, J. M., Wilson, R. R., and Ravishankara, A. R.: Investigation of the loss processes for peroxyacetyl nitrate in the atmosphere: UV photolysis and reaction with OH, J. Geophys. Res.-Atmos., 100, 14163–14173, https://doi.org/10.1029/95jd00545, 1995.
Thieser, J., Schuster, G., Schuladen, J., Phillips, G. J., Reiffs, A., Parchatka, U., Pöhler, D., Lelieveld, J., and Crowley, J. N.: A two-channel thermal dissociation cavity ring-down spectrometer for the detection of ambient NO2, RO2NO2 and RONO2, Atmos. Meas. Tech., 9, 553–576, https://doi.org/10.5194/amt-9-553-2016, 2016.
Tyndall, G. S., Staffelbach, T. A., Orlando, J. J., and Calvert, J. G.: Rate coefficients for the reactions of OH radicals with methylglyoxal and acetaldehyde, Int. J. Chem. Kinet., 27, 1009–1020, 1995.
Vandaele, A. C., Hermans, C., Simon, P. C., Carleer, M., Colin, R., Fally, S., Merienne, M. F., Jenouvrier, A., and Coquart, B.: Measurements of the NO2 absorption cross-section from 42 000 cm−1 to 10 000 cm−1 (238–1000 nm) at 220 K and 294 K, J. Quant. Spectrosc. Ra., 59, 171–184, 1998.
Vasudevan, V., Davidson, D. F., and Hanson, R. K.: High temperature measurements of the reactions of OH with toluene and acetone, J. Phys. Chem. A, 109, 3352–3359, 2005.
Warneck, P. and Zerbach, T.: Synthesis of peroxyacetyl nitrate in air by acetone photolysis, Environ. Sci. Technol., 26, 74–79, 1992.
Wayne, R. P., Barnes, I., Biggs, P., Burrows, J. P., Canosa-Mas, C. E., Hjorth, J., Le Bras, G., Moortgat, G. K., Perner, D., Poulet, G., Restelli, G., and Sidebottom, H.: The nitrate radical: Physics, chemistry, and the atmosphere, Atmos. Environ. A, 25A, 1–206, 1991.
Wild, R. J., Edwards, P. M., Dube, W. P., Baumann, K., Edgerton, E. S., Quinn, P. K., Roberts, J. M., Rollins, A. W., Veres, P. R., Warneke, C., Williams, E. J., Yuan, B., and Brown, S. S.: A measurement of total reactive nitrogen, NOy, together with NO2, NO, and O3 via cavity ring-down spectroscopy, Environ. Sci. Technol., 48, 9609–9615, https://doi.org/10.1021/es501896w, 2014.
Wooldridge, P. J., Perring, A. E., Bertram, T. H., Flocke, F. M., Roberts, J. M., Singh, H. B., Huey, L. G., Thornton, J. A., Wolfe, G. M., Murphy, J. G., Fry, J. L., Rollins, A. W., LaFranchi, B. W., and Cohen, R. C.: Total Peroxy Nitrates (∑PNs) in the atmosphere: the Thermal Dissociation-Laser Induced Fluorescence (TD-LIF) technique and comparisons to speciated PAN measurements, Atmos. Meas. Tech., 3, 593–607, https://doi.org/10.5194/amt-3-593-2010, 2010.
Wu, R., Vereecken, L., Tsiligiannis, E., Kang, S., Albrecht, S. R., Hantschke, L., Zhao, D., Novelli, A., Fuchs, H., Tillmann, R., Hohaus, T., Carlsson, P. T. M., Shenolikar, J., Bernard, F., Crowley, J. N., Fry, J. L., Brownwood, B., Thornton, J. A., Brown, S. S., Kiendler-Scharr, A., Wahner, A., Hallquist, M., and Mentel, T. F.: Molecular composition and volatility of multi-generation products formed from isoprene oxidation by nitrate radical, Atmos. Chem. Phys., 21, 10799–10824, https://doi.org/10.5194/acp-21-10799-2021, 2021.
Wüst, L.: Influence of ambient NO and NO2 on the quantification of total peroxy nitrates and total alkyl nitrates by thermal dissociation cavity ring-down spectroscopy (TD-CRDS), V1, Edmond [data set], https://doi.org/10.17617/3.YERCC6, 2025.
Zheng, W., Flocke, F. M., Tyndall, G. S., Swanson, A., Orlando, J. J., Roberts, J. M., Huey, L. G., and Tanner, D. J.: Characterization of a thermal decomposition chemical ionization mass spectrometer for the measurement of peroxy acyl nitrates (PANs) in the atmosphere, Atmos. Chem. Phys., 11, 6529–6547, https://doi.org/10.5194/acp-11-6529-2011, 2011.