the Creative Commons Attribution 4.0 License.
the Creative Commons Attribution 4.0 License.
Performance of a low-cost optical particle counter (Alphasense OPC-N3) in estimating size-resolved dust emission flux using eddy covariance
Sylvain Dupont
Eric Lamaud
Mark R. Irvine
Jean-Marc Bonnefond
Adolfo González-Romero
Andrés Alastuey
Cristina González-Flórez
Xavier Querol
Konrad Kandler
Martina Klose
Carlos Pérez García-Pando
The recent development of low-cost optical particle counters (OPCs) presents new opportunities for improving spatial coverage of particle concentration in the atmosphere as they are more affordable, compact, and energy efficient than traditional OPCs. In particular, these OPCs could improve our ability to quantify dust emissions in complex environments during aeolian soil erosion. The high-frequency sampling capacity (1 Hz) of some sensors may make them suitable for estimating dust emissions using the eddy-covariance method. Here, the capability of the low-cost OPC-N3 from Alphasense to estimate size-resolved dust flux using the eddy-covariance method is evaluated. During the Jordan Wind erosion And Dust Investigation (J-WADI) experiment, we tested one OPC-N3 against two traditional reference OPCs, the Promo and Fidas, from Palas GmbH. The N3 and Promo OPCs were located in close proximity to a sonic anemometer, enabling the correlation of dust concentration and vertical velocity fluctuations for estimating dust fluxes. Despite the high-temperature and dusty wind conditions of the campaign, the N3 monitored the dynamics and magnitude of dust concentration with reasonable precision. The turbulence characteristics of the dust concentration fluctuations measured by the N3, including variance, skewness, kurtosis, and energy spectrum, were similar to those from the Promo. However, the N3 flow rate exhibited variations under these outdoor conditions that affected the concentration of fine dust particles, and certain particles around 1 µm appeared to be misclassified in the upper size bin. After correcting the N3 dust concentration to address these discrepancies and after calibrating it against a reference OPC, the N3 accurately estimated the dust emission flux, with differences of less than 30 % compared to the reference OPC. Our results confirm the potential of low-cost OPCs for dust erosion research. Nonetheless, further evaluation of low-cost OPCs is still needed across different environments and weather conditions.
- Article
(10644 KB) - Full-text XML
- BibTeX
- EndNote
Mineral dust represents an important component of the particles present in the atmosphere. Its presence affects air chemistry, cloud formation, sunlight radiation reaching the Earth's surface, and nutrient availability for ecosystems (Shao, 2008). As a consequence, mineral dust plays a crucial role in Earth's climate system (Petit et al., 1990; Tegen and Lacis, 1996; Mahowald et al., 2014), as well as in the growth of land and oceanic organisms (Mahowald et al., 2011; Knippertz and Stuut, 2014). These environmental impacts are influenced by the number, size range, and chemical composition of dust particles in the air (Mahowald et al., 2014; Kok et al., 2017; Adebiyi and Kok, 2020), which, in turn, are closely related to the mechanism of dust release from (and deposed on) the ground.
Our comprehension of dust emission and deposition is partial because of the complexity of the involved processes and their intermittent nature, as well as the variety of erosive surfaces and their spatial heterogeneity, especially in semiarid regions. Deploying enough optical particle counters (OPCs) in complex environments to continuously measure size-resolved dust concentration is challenging. This limitation makes it difficult to determine dust fluxes with good spatial resolution. Estimating dust fluxes is crucial for quantifying dust sources and deposition and for developing and evaluating dust emission–deposition parameterisations for global climate models. Focusing only on dust concentration is insufficient as concentration integrates both locally emitted particles and particles emitted far upwind from the surface.
Field experiments that estimated dust emission fluxes were mainly limited to two levels of expensive OPCs to evaluate dust fluxes at only one point from the vertical gradients of dust concentration (e.g. Gillette et al., 1972; Nickling and Gillies, 1993; Sow et al., 2009; Shao et al., 2011; Ishizuka et al., 2014; González-Flórez et al., 2023). This approach, known as the flux-gradient (FG) method, requires accurate measurements of dust concentration to produce a meaningful gradient. Following Fratini et al. (2007), Dupont et al. (2021) developed an eddy-covariance (EC) approach for estimating the near-surface dust flux by utilising only one OPC sampling at 1 Hz. This approach derives the flux from the correlation at one point between the dust concentration fluctuations and the vertical velocity fluctuations, rather than from a difference between two dust concentration levels. This more localised flux estimation makes it better suited to complex environments, allowing for an in-depth investigation of surface heterogeneity impacts on dust fluxes at various scales (e.g. Dupont et al., 2024). This EC approach has been evaluated on soil erosion in Tunisia (Dupont et al., 2019; Dupont, 2020; Dupont et al., 2021; Dupont, 2022) and has more recently been used in Iceland and Jordan (Dupont et al., 2024). The EC approach offers new perspectives to more easily obtain a detailed spatial resolution of dust fluxes from a limited number of OPCs in order to better estimate the environmental impacts of dust events.
In recent years, low-cost OPCs have been developed to measure airborne particles ranging from submicrons to several tens of micrometres in diameter. Here, low-cost refers to sensors that cost around EUR 50 to 1000 compared to EUR 20 000–25 000 for traditional OPCs. Their affordability, small size, and low energy consumption make them very attractive for monitoring airborne particle concentrations over complex environments with high spatial resolution. These OPCs are based on the same principles of light-scattering properties of particles as more expensive and bulkier traditional OPCs (Dubey et al., 2022). They detect particles individually, offering details about their quantity and size.
One of these low-cost OPCs, the Alphasense OPC-N3 (≈ EUR 600), possesses a frequency sampling capacity of 1 Hz, equivalent to the traditional OPC used by Dupont et al. (2021). This means that dust fluxes could potentially be estimated via the EC method from this OPC combined with a high-frequency anemometer. We used the opportunity of the Jordan Wind erosion And Dust Investigation (J-WADI) campaign (see https://www.imk-tro.kit.edu/english/11800.php, last access: 14 May 2025, and Dupont et al., 2024) to install OPC-N3, hereafter referred to as the N3, at the same level as two traditional OPCs, the Promo 2000 and Fidas 200 S, both from Palas GmbH. The N3 and Promo OPCs were collocated with a high-frequency sonic anemometer, allowing us to compare the estimated dust fluxes using the EC method.
Some comparative studies between Alphasense OPC-N series and reference OPCs have already shown promising performances, showing that low-cost OPCs can be suitable to monitor aerosols after a calibration correction (e.g. Crilley et al., 2018; Dubey et al., 2022; Nurowska et al., 2022). These comparisons were mainly done on particulate matter (PM10 or PM2.5) for air quality monitoring through indoor and outdoor experiments, especially in urban areas or near roads, and for fog monitoring, but less so in the context of aeolian soil erosion and mineral dust emission (Kaur and Kelly, 2023). The goal of this study is to evaluate the ability of the low-cost Alphasense OPC-N3 to estimate size-resolved dust flux using the EC approach during the erosion events of the J-WADI campaign.
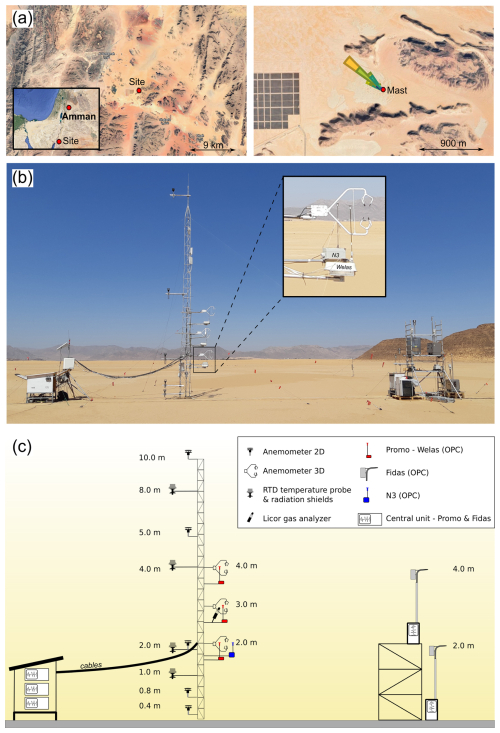
Figure 1(a) J-WADI experiment site in Jordan, with the location of the 10 m high mast (red dot) and wind rose during the main erosion event (29 September 2022). (b) Picture of the mast on which the sonic anemometers and the N3 and Promo OPCs were mounted, among others, with a zoomed-in view of the 2 m high N3 and Welas (Promo) devices coupled to a sonic anemometer. The two Fidas OPCs were mounted on the scaffolding on the right at two levels. (c) Schematic description of the mast and scaffolding, with the sensors mounted on them. Satellite views are from © Google Maps.
2.1 Field experiment
The J-WADI campaign took place in the north of the Wadi Rum desert in Jordan from 9 September to 5 October 2022. The campaign was co-organised by the FRontiers in dust minerAloGical coMposition and its Effects upoN climaTe (FRAGMENT) and Helmholtz Young Investigator Group “Mineral Dust” projects. The site was located between two gentle hills in the north and south, with wind channelling between them most of the time (Fig. 1a). The site between these two hills was flat and lacked significant roughness elements, with an extended fetch in the main wind direction.
During the campaign, several measurements were performed to characterise aerosols and the meteorology. In particular, a 10 m high mast (Fig. 1) was equipped with 3D and 2D sonic anemometers and temperature sensors to measure the mean horizontal wind velocity and temperature profiles, momentum and heat fluxes, and the main characteristics of flow turbulence. For our purposes here, the N3 and Promo 2000 OPCs were installed close to each other at 2 m height, with their sampling heads at a distance of approximately 20–30 cm behind a 3D sonic anemometer (Campbell® Scientific CSAT3) to compare the estimated EC dust fluxes from both OPCs (Fig. 1b). At about 20 m from the mast, the Fidas 200 S OPC was placed at a height of 2 m on a scaffolding. An additional Fidas 200 S OPC was placed on the same scaffolding at a height of 4 m but is not used here.
During a previous campaign in Iceland in 2021 (Dupont et al., 2024), 17 N3 OPCs were intercompared during 3 d following their deployment over several months across the Vatnajökull National Park. This campaign was organised by the FRAGMENT and HiLDA (Iceland as a model for high-latitude dust sources – a combined experimental and modelling approach for characterisation of dust emission and transport processes) projects. All N3 OPCs were placed at the same height and in close proximity (within a few metres). Despite the absence of notable erosion events during this intercomparison period, a short nighttime period with high particle concentrations, probably corresponding to fog droplets rather than mineral dust, permitted the investigation of the variability of particle concentrations between the N3 OPCs (Sect. 3.5).
2.2 Optical particle counters
The low-cost N3 OPC from Alphasense was evaluated for its ability to measure dust concentration magnitude and fluctuations to derive an EC dust flux afterward. The N3 is a miniaturised OPC (75 × 63.5 × 60 mm, Fig. 2) that determines particle concentrations ranging from 0.35 to 40 µm divided into 24 bins, based on single-particle light scattering using a laser source. Its sampling rate reaches up to 1 Hz. For outdoor use, the N3 was installed inside a small homemade waterproof plastic box (see Figs. 1b and 2). Conversely to traditional OPCs, it does not have a pump but a small aspirator fan, which explains its low consumption (0.9 W). The sensor measures up to 10 000 particles s−1. At each time step, the number of detected particles nb per size bin b was converted into particle concentration (in particles m−3) as follows: , where Fr is the flow rate and Ts is the sampling time. During the J-WADI campaign, Ts was nearly constant, with a value of around 0.46 s for an acquisition period of 1 s, meaning that half of the acquisition time step was used for measurements. The flow rate Fr was about 0.16 L min−1 but with some fluctuations (see Sect. 3.2).
The Promo 2000 OPC from Palas GmbH was used as a reference OPC to evaluate the N3 OPC. This OPC is a light-scattering aerosol spectrometer system for particle size analysis and concentration determination using a xenon light source. The Promo 2000 was equipped with the aerosol sensor Welas 2300, sampling at up to 1 Hz, similar to the N3. This Welas sensor was installed on the mast and covered by a white metallic box for outdoor protection. The sensor was connected to the Promo 2000 control unit through two 10 m long fibre optic cables that transmitted white light to the measuring volume and received the measured scattered-light pulse. In addition, a 10 m long flexible tube connected the Welas sensor to the pump located inside the control unit. The Promo 2000 central unit was located in a small wooden structure near the mast. The Welas sensor measures number concentrations of up to 40 000 particles cm−3. Its energy consumption is about 100 W. For this experiment, the Welas measured particles in the range of 0.2–10 µm, with 32 intervals per decade. The spectrometers determined the size and number of particles in sampled air in the optical chamber, delivered by a pump with a stable flow rate of 5 L min−1 (see Sect. 3.2).
Both the N3 and Promo were equipped with the same small sampling heads especially designed (a) to minimise disruption of the air near the sonic anemometers while sampling dust particles within the air and (b) to minimise the time lag between wind and dust measurements (Dupont et al., 2021). This head consisted of a 45 cm long and 0.5 cm diameter tube with a drilled cover that allows particles to enter while protecting the inlet from rain. Although this sampling head is well suited for performing eddy covariance, it underestimates the concentration of coarse particles (>5 µm in diameter) (Dupont et al., 2021).
The Fidas 200 S OPC from Palas GmbH is a certified optical analyser for continuous outdoor monitoring of PM2.5 and PM10, employing an LED source. It has a sampling frequency of up to 1 Hz. The Fidas is mounted in a splash-proof stainless steel control cabinet for outdoor use. The sampling system of the Fidas operates with a volume flow of 4.8 L min−1. Its normal consumption is about 60 W. The measuring range was 0.4 to 40 µm, with 32 intervals per decade during the J-WADI campaign. The sensor measures number concentrations of up to 20 000 particles cm−3. Compared to the N3 and Promo, the Fidas was equipped with a conical sampling head with a 4.5 mm entry diameter, designed for near-isokinetic operation at a wind speed of 5 m s−1. To improve collection efficiency for larger particles, the sampling head is fitted with a wind vane, allowing it to continuously align with the wind direction.
The lack of detailed information provided by constructors regarding their OPCs complicates the ability to fully explain the price differences among them. The lower price of the N3 is likely due to (1) the absence of an acquisition system and software for data plotting and statistical calculations; (2) the absence of a flow control and a sheath-flow system for stabilising the aerosol flow prior to entering the optical chamber; (3) larger production tolerances; and (4) the use of less expensive materials, optical components, etc.
Each of the three OPCs has undergone calibration with monodisperse, non-absorbing polystyrene latex spheres (PSLs). The refractive index is 1.50+0i for the N3 (default value) and 1.59+0i for the Promo and Fidas (latex value). The particle density is assumed to be equal to 1650 µgm−3. The Promo and Fidas underwent calibration at the start of the experiment, whereas the N3 came pre-calibrated from the factory. Hence, the three OPCs consider spherical particles with size corresponding to optical diameters and provide particle size distributions in terms of PSL-equivalent diameters, producing the same scattered-light intensity as the measured (absorbing and irregular) dust particles but at a different wavelength range depending on the OPC. Since the three OPCs have been calibrated using the same particles, we assume that the calibrations of the N3 and Promo relative to the Fidas, as described in Sect. 3.3, will inherently account for differences in optical diameters due to the different wavelengths of each instrument, along with other factors like the inlet design. Given this calibration, we propose that the conversion of N3 particle size distributions (PSDs) to dust geometric diameters, following Huang et al. (2021), may use the same conversion as the reference OPC.
Data from the three OPCs and sonic anemometers were acquired and stored simultaneously from a synchronised Raspberry Pi 3 assembled in a local network from a Python script. Each OPC had its own Raspberry Pi.
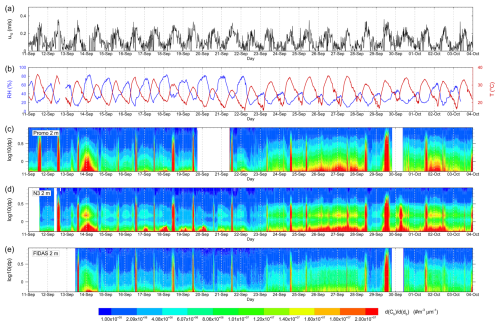
Figure 3 Time variations in the (a) surface friction velocity (u*0) deduced from the sonic anemometers according to Dupont et al. (2018); (b) air temperature (T) at 4 m height and relative humidity (RH) at 0.5 m height; and (c–e) mean size-resolved dust concentration (expressed in number) recorded by the Promo, N3, and Fidas OPCs, respectively, at a height of approximately 2 m and focusing on the particle size range of the Promo, which is 0.5 to 9 µm. The white areas correspond to periods without measurements.
3.1 Long-term dust concentration measurements
Figure 3 presents the time series of the 15 min averaged size-resolved airborne particle number concentrations measured by the three OPCs during 23 consecutive days of the J-WADI campaign. These values of the concentrations are uncorrected. The figure also displays the surface friction velocity (u*0) deduced by eddy covariance following Dupont et al. (2018), the air temperature (T) at 4 m height, and the relative humidity (RH) at 0.5 m height. During the campaign, the daily weather patterns were relatively constant, with clear skies and stronger northwesterly winds in the afternoon, combined with a peak in air temperature and a minimum in relative humidity. The most significant change occurred from 23 September to 1 October with drier air, especially at night.
The dust concentration dataset has a few gaps due to several factors: the Fidas was installed on 13 September, the data acquisition of the N3 had to be re-initialised on 12 September, the pump of the Promo had to be replaced on 20–21 September, and there was a power cut that affected both the Promo and Fidas from late 29 to early 30 September. Despite being exposed to strong afternoon solar radiation, high air temperatures, and dusty winds, the N3 ran quite well during these 23 d.
The stronger afternoon winds produced almost daily dust emissions during a couple of hours. This is visible in Fig. 3c–e as peaks in the dust concentration of particles larger than 0.8 µm (−0.1 in log 10), which are superimposed on a slowly fluctuating background concentration. The N3 device captured the same concentration dynamics as the two reference OPCs remarkably well, including both the peaks in concentration related to dust events and the more slowly varying background particle concentrations. Visually, the magnitude of the N3 dust concentration seems close to the Promo concentration, with a higher fine dust concentration (<0.8 µm) than the Fidas. However, the N3 concentration appears underestimated around the 1.0 µm size bin as compared to the two reference OPCs. This translates in Fig. 3d into a suspicious line depicting a lower concentration around 1 µm, which is not apparent in the data of the other OPCs. Conversely, the N3 overestimates the concentration of particles around 1.4 µm. This discrepancy around 1.0 µm was also observed for the 17 N3 OPCs deployed in Iceland (result not shown). This suggests that the N3 may erroneously classify 1.0 µm particles into the larger size bin of around 1.4 µm.
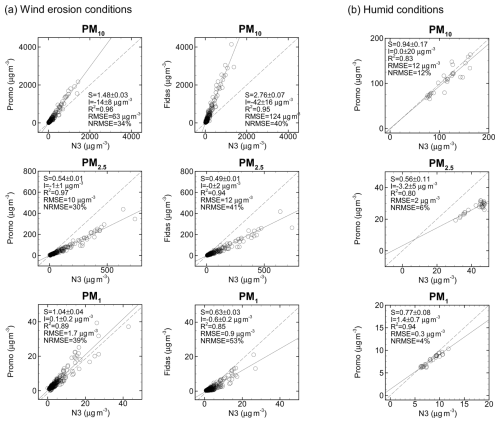
Figure 4 Comparison of the 15 min averaged PM10 (top), PM2.5 (middle), and PM1 (bottom) concentrations between the N3 and Promo and between the N3 and Fidas, for (a) periods with significant wind ( m s−1) during the J-WADI campaign and (b) the humid night of 13–14 September (RH>70 %). In humid conditions (b), the Fidas results are not comparable to those of the N3 and Promo due to the fact that the Fidas dries the sample air. The solid lines represent the linear fits, while the dashed lines represent the 1:1 line. The performance of the linear fit is indicated in each plot with the slope (S), the intercept (I), the coefficient of determination (R2), the root mean square error (RMSE), and the normalised RMSE (NRMSE).
The evaluation of OPCs typically focuses on their capacity to estimate PM10 or PM2.5 concentrations. Without any correction, the 15 min average PM10, PM2.5, and PM1 concentrations obtained by the N3 appear to be strongly correlated with those obtained from the two reference OPCs during the J-WADI campaign (Fig. 4). Only 15 min periods with notable wind speeds ( m s−1), indicative of significant dust concentrations, are considered in Fig. 4a. These periods correspond to dry conditions with a mean relative humidity of 26±9 %. The performance of the N3 is slightly better when compared to the Promo because both OPCs were equipped with the same sampling head. The two OPCs exhibited high levels of correlation, with coefficients of determination (R2) exceeding 0.89 and normalised root mean square errors (NRMSEs) below 39 %. The N3 tends to underestimate coarse particles (lower PM10) and overestimate particles between 1 and 2.5 µm (higher PM2.5, while PM1 is similar). These values of R2 and NRMSE are consistent with those reported by Kaur and Kelly (2023) for PM10 against the GRIMM aerosol spectrometer. This confirms the possibility of correcting the N3 concentration against one of the reference OPCs. To evaluate the N3 under more humid conditions, Fig. 4b focuses on the night of 13–14 September, characterised by high humidity levels (RH>70 %) and notable particle concentrations. Under these humid conditions, the performance of the N3 does not appear to be diminished when compared to that observed during the drier conditions of wind erosion events.
A notable erosion event occurred on 29 September (Fig. 3), lasting more than 5 h. This event is used hereafter to evaluate the N3 OPC's ability to estimate dust flux in comparison to the Promo OPC (Sect. 3.6). Prior to this, the N3 dust concentration is corrected from a reference OPC (Sect. 3.2 and 3.3), and the fluctuations in the dust concentration measured by the N3 are evaluated (Sect. 3.4), both of which are essential for estimating the dust flux by eddy covariance.
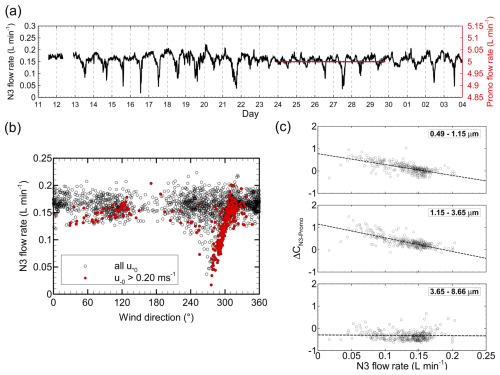
Figure 5 Evaluation of the N3 flow rate. (a) Time variations in the N3 flow rate (in black) during the 23 consecutive days of the J-WADI campaign compared to the Promo flow rate (in red) during the period of 24 to 29 September. (b) N3 flow rate as a function of the 2 m wind direction for all 15 min periods (empty black dots) and for 15 min periods where the friction velocity u*0 exceeded 0.20 m s−1. (c) Relative difference ΔCN3-Promo in measured dust concentration between the N3 and Promo, as a function of the N3 flow rate, for 15 min periods where m s−1 and for three particle size ranges: 0.49–1.15, 1.15–3.65, and 3.65–8.66 µm. The dashed line represents a linear fit.
3.2 N3 flow rate – first N3 concentration correction
Given that the N3 does not have a pump, whereas the Promo does, but instead a small aspirator fan, it is interesting to examine the temporal variation in the flow rate of this fan throughout the course of the J-WADI campaign (Fig. 5a). Overall, the N3 flow rate Fr was approximately 0.16 L min−1. This value is lower than the typical value mentioned by Alphasense, 0.28 L min−1, and can be attributed, at least in part, to the tube of the sampling head. Some notable decreases in the flow rate to as little as 0.05 L min−1 occurred during erosion events but not consistently. For instance, Fr does not exhibit a notable decline during the most intense event on 29 September in comparison to the majority of the other events. These variations in the N3 flow rate are in contrast to the near-constant 5 L min−1 flow rate of the Promo (Fig. 5a). Note that for comparison purposes, the same amplitude of variation in the flow rates around their mean values is used for both OPCs on the vertical axis of Fig. 5a. This demonstrates that the absence of a pump in the N3 results in a more variable flow rate.
A more detailed examination of the N3 flow rate suggests a possible correlation between its decline and the wind direction during periods of high wind speed ( m s−1). Figure 5b shows a clear decline in Fr as the wind direction shifted from 310 to 270°. This shift frequently happened during erosion events, except on 29 September, where the wind direction remained approximately 300–310° (not shown). We suspect that this behaviour is related to a pressure effect within the box where the N3 was located. This may have occurred specifically when the wind was blowing against the side of the box where an air outlet was located, at around 270° (see Fig. 2). This was confirmed by laboratory tests performed after the experiment. Installing a small exhaust system on the inlet or redesigning the box containing the N3 would remove this pressure effect and the associated flow rate decline.
This reduction in the N3 flow rate appears correlated with an overestimation of the concentration in small particles (less than 4 µm) by the N3. Indeed, the relative difference ΔCN3-Promo in the concentration of small particles between the N3 and Promo increases as the N3 flow rate declines (Fig. 5c). Here, , where and are the dust concentrations of particle size bin b measured by the N3 and Promo, respectively. For particles larger than 4 µm, the concentration may have been too low to observe a consistent effect of the decrease in the N3 flow rate on the measured concentration.
To correct this overestimation of the N3 dust concentration due to the flow rate reduction, we conducted a linear correlation analysis between ΔCN3-Promo and Fr for each particle size bin over the entire campaign, focusing exclusively on 15 min periods where u*0 exceeded 0.20 m s−1:
where Δ0 is the intercept, ΔF is the slope, and is the mean N3 flow rate over the campaign (0.16 L min−1). For consistency, the size-resolved N3 concentration was interpolated to match the particle size bins of the Promo between 0.49 and 8.66 µm. Unlike , the intercept Δ0 represents the difference between the N3 and Promo concentrations not related to the flow rate variations. This latter term is investigated in the following section. Here, we focus on the correction of the N3 concentration due to the flow rate variations (referred to as the N3 first correction), i.e. the term .
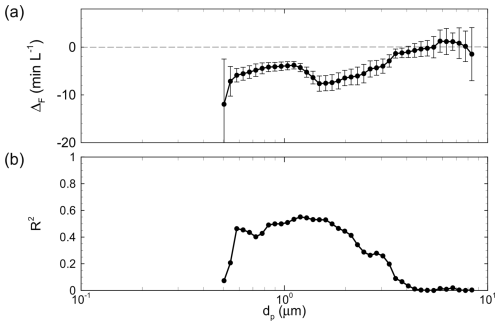
Figure 6 Results of the linear fit between the relative difference ΔCN3-Promo in dust concentration between the N3 and Promo and the N3 flow rate as a function of the particle diameter dp. ΔF is the slope (a), and R2 is the coefficient of determination (b) of the linear fit analysis. The error bars represent the 95 % confidence intervals.
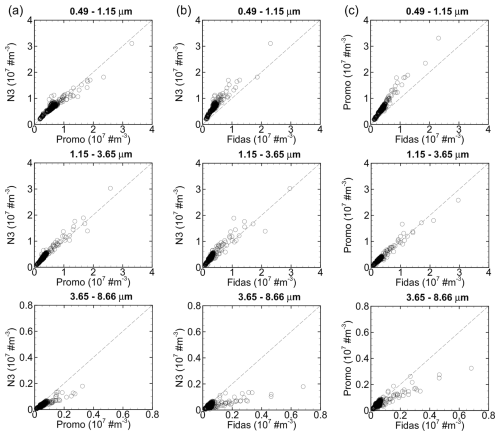
Figure 7 Comparison of the 15 min averaged dust concentrations between the N3 and Promo (a), between the N3 and Fidas (b), and between the Promo and Fidas (c) during erosion events of the 24–28 September period for three particle size ranges: 0.49–1.15, 1.15–3.65, and 3.65–8.66 µm.
For particles larger than 4 µm, the slope ΔF is near zero (Fig. 6a), meaning that the relative difference in concentration between the N3 and Promo is not related to the flow rate variations. For smaller particles, ΔF decreases with particle size, with a slight rise around 1.3 µm. The values of ΔF were obtained with a reasonable coefficient of determination (R2>0.3) between 0.6 and 2.5 µm (Fig. 6b). To correct the N3 concentration, we used the obtained values of ΔF for particle sizes between 0.54 and 5.42 µm, where the confidence intervals of ΔF are small (error bars in Fig. 6a). Above we considered ΔF=0 min L−1 and below min L−1. This led to the following corrected N3 dust concentration:
where the index “1” in refers to the N3 concentration after the first correction.
3.3 Calibration of the N3 dust concentration – second N3 concentration correction
After the first N3 concentration correction, the remaining difference in concentration between the N3 and Promo, corresponding to Δ0 in Eq. (1), is evaluated. For this purpose, we selected a calibration period corresponding to the 5 d period prior to the 29 September erosion event, i.e. 24–28 September. This period was chosen for the occurrence of significant dust events and also because it followed the replacement of the Promo pump, which required recalibration of the instrument. The purpose of selecting a dust concentration calibration period that differs from the dust-flux evaluation period (29 September) is to replicate the conditions of potential future experiments involving multiple low-cost OPCs and one reference OPC in a heterogeneous environment. The idea of such an experiment would be, first, to estimate a calibration factor of the concentrations measured by the low-cost OPCs against the concentration of the reference OPC during an intercomparison period and, second, to apply this calibration factor to the low-cost OPCs once they are deployed at different locations from the reference OPC in a heterogeneous environment.
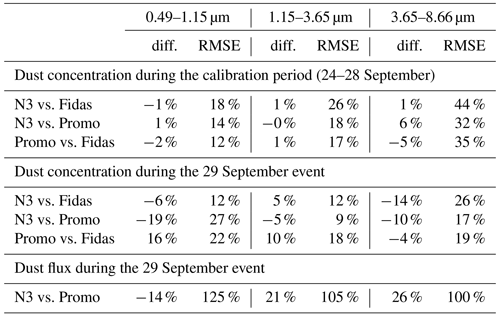
Table 1Comparison between calibrated dust concentrations obtained from the N3, Promo, and Fidas OPCs and between dust fluxes obtained from the N3 and Promo OPCs for three particle size ranges, 0.49–1.15, 1.15–3.65, and 3.65–8.66 µm, during the 29 September erosion event in Jordan. The comparison between calibrated dust concentrations is also presented during the calibration period (24–28 September). Comparisons are done using differences and root mean square errors (RMSEs) between dust concentrations and fluxes expressed in number. Both quantities are expressed in percentage of the dust concentration or flux of the last OPC. See Figs. 9a and 14a for the concentration and flux time variation during the erosion event, respectively.
The performance of the N3 in measuring dust concentration is first evaluated against the Promo during the 24–28 September period. As both OPCs used the same sampling head, conversely to the Fidas, any differences would only be related to differences between sensors themselves. Figure 7a presents the 15 min average dust concentrations obtained from both the N3 and Promo in a scatter plot. To simplify the comparison, the concentrations are grouped into three size ranges common to the three OPCs (N3, Promo, and Fidas): 0.49–1.15, 1.15–3.65, and 3.65–8.66 µm. For consistency, the N3 and Promo concentrations were interpolated to match the same size bin partition, the one corresponding to the Fidas. As observed for PM10, PM2.5, and PM1 concentrations (Fig. 4), a distinct correlation exists between the N3 and Promo concentrations. The N3 appears to overestimate dust concentrations for particles smaller than 3.65 µm and underestimate them for larger particles.
Calibrating the N3 dust concentration against the Promo concentration would lead to the calibration factors presented in Fig. 8a as a function of the particle diameter. These calibration factors, denoted (where the upper arrow points to the reference), have been calculated based on the linear correlation (slope value) between and . For particles smaller than 5 µm, the concentrations of the two OPCs correlate well with each other (R2>0.7, Fig. 8b), enabling an accurate estimation of the calibration factor. For larger particles, the dust concentration was too low to achieve a good correlation between OPCs. Over the entire particle size range, varies from 0.5 to 3.0; i.e. the N3 concentration is about +50 % to −200 % of the Promo concentration. Around 1 µm, reaches a peak value larger than 1, followed by values lower than 1 for larger particles in the range between 1.5 and 2.5 µm. This behaviour is consistent with Fig. 3c–d, where we suspect an erroneous classification of 1 µm particles into the upper size bin.
As mentioned previously, the sampling head used by the N3 and Promo is well suited for performing eddy covariance when the OPCs are collocated with a sonic anemometer. However, this sampling head is known to underestimate the concentration of coarse particles (>4 µm). The sampling head employed by the Fidas was more suitable for coarse particles, but its size was not adapted for eddy covariance. Moreover, the Fidas is expected to be less accurate for submicron particles as its sampling range started at 0.4 compared to 0.3 µm for the Promo. It would be possible to correct the N3 concentration against the Promo for submicron particles and against the Fidas for supermicron particles; however, this would introduce an element of confusion into this comparison exercise. For this reason, the decision was taken to calibrate the N3 and Promo dust concentrations against the Fidas concentration. The additional advantage of calibrating the N3 and Promo against the Fidas is to enable a comparison of the stability of the N3 calibration against that of the Promo for a period outside the calibration period.
The calibration factors of the N3 and Promo against the Fidas, and , respectively, were deduced using the same approach as . These calibration factors account for differences in concentration due to the sensors themselves, the sampling heads, and the difference in location between the N3 and Promo and the Fidas. The calibration factors were then extrapolated or interpolated to the initial size bins of the N3 and Promo. This led to the calibrated N3 and Promo dust concentrations, and , defined as follows:
where was already corrected for the N3 flow rate variability (Eq. 2).
Figure 8a presents and as a function of the particle diameter. For particles smaller than 1.5–3 µm, exhibits the same behaviour with particle size as , although is larger. For larger particles, increases almost exponentially up to about 8. increases almost linearly with a particle size of up to 4 µm, with values going from 0.5 to 1.5. Like for coarser particles, increases exponentially with particle size. This last behaviour should be related to the difference in sampling heads.
After calibration, the remaining discrepancy between the calibrated concentrations ( and ) and the Fidas concentration during the calibration period is roughly of the same order (<5 % in absolute value) between the N3 and Promo (Table 1). Against the Promo dust concentration, the N3 dust concentration is on average overestimated (6 %) for the coarsest particle size range (3.65–8.66 µm), while for smaller particles the difference between both OPCs is low (<1 % in absolute value) (Table 1).
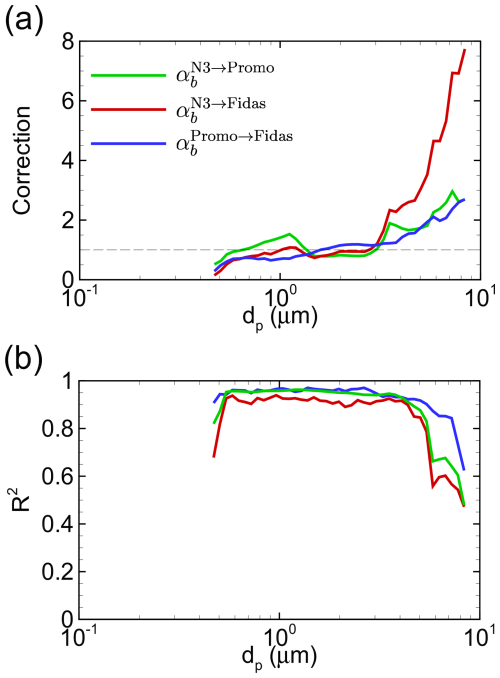
Figure 8(a) Linear correction factors between the N3 and Promo (), N3 and Fidas (), and Promo and Fidas (), as deduced from the dust concentration intercomparison of the three OPCs during the 24–28 September period as a function of particle diameter dp. (b) Coefficient of determination (R2) obtained from the intercomparison exercise. The horizontal dashed black lines indicate the perfect-match values between OPCs: a correction factor equal to 1.
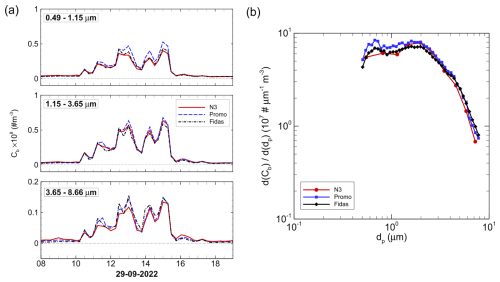
Figure 9 Comparison of the 2 m high dust concentration measured by the three OPCs during the 29 September erosion event, after calibration of the N3 and Promo OPCs to the Fidas OPC during the 24–28 September period. (a) Time variation in the 15 min average dust concentration for three particle size ranges: 0.49–1.15, 1.15–3.65, and 3.65–8.66 µm. (b) Mean particle size distribution of dust concentrations during the erosion event. In (b) the concentration size distributions follow each OPC's own particle size discretisation.
To evaluate and outside the calibration period, their time variation is compared against in Fig. 9a during the 29 September erosion event for three particle size ranges: 0.49–1.15, 1.15–3.65, and 3.65–8.66 µm. Overall, the N3 accurately predicts the temporal dynamics of dust concentrations in comparison to the two reference OPCs. The difference does not exceed 19 % in absolute value (27 % in root mean square error) (Table 1). The Promo appears to agree even less with the Fidas than the N3. Compared to the Promo, the N3 underestimates the dust concentration for all particle size ranges. The shape of the average size distribution of the dust concentration obtained from the N3 during the 29 September erosion event shows two main modes, similar to the reference OPCs (Fig. 9b), with one around 0.7–0.8 µm and the other around 1.5–2 µm. However, the N3 seems to underestimate the finest mode, which could be a consequence of the lower size bin resolution of the N3.
3.4 Concentration fluctuations
The concentration fluctuations measured by the N3 are evaluated against those obtained by the Promo during the 29 September erosion event. The Fidas was not included in this comparison because its sampling head introduced noise in high-frequency concentration fluctuations (not shown), rendering it unsuitable for performing eddy covariance.

Figure 10 Time series of the high-frequency (1 Hz) PM10 measured by the N3 and Promo, without any correction, during the initial hour of the 29 September erosion event.
The high-frequency (1 Hz) PM10 fluctuations recorded by the N3 and Promo without any correction are illustrated in Fig. 10 for the initial hour of the 29 September erosion event. Despite the high intermittency of the dust concentration, the time response of the N3 aligns closely with that of the Promo. The timing of the main peaks of dust concentration recorded by the Promo seems to be captured well by the N3.
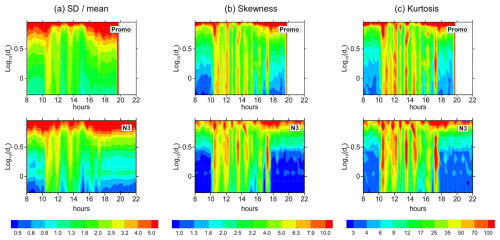
Figure 11Comparison of the main turbulence characteristics of the corrected dust concentration from the Promo (top) and N3 (bottom) OPCs during the 29 September erosion event as a function of time and particle size. These characteristics include (a) the standard deviation normalised by the mean concentration, (b) the skewness, and (c) the kurtosis, all calculated across 15 min periods. The white areas correspond to periods without measurements.
To delve deeper into the comparison, the main properties of the fluctuations after concentration correction are compared between the two OPCs over the entire event by examining the time variation in the size-resolved standard deviation, skewness, and kurtosis of the dust concentration fluctuations over 15 min periods (Fig. 11). In general, the turbulent features of the N3 concentration seem comparable to those of the Promo, with similar dynamics and close amplitudes of statistical measures. During the erosion event, the fluctuations in submicron particles from the N3 seem less energetic (lower standard deviation) and less intermittent than those from the Promo.
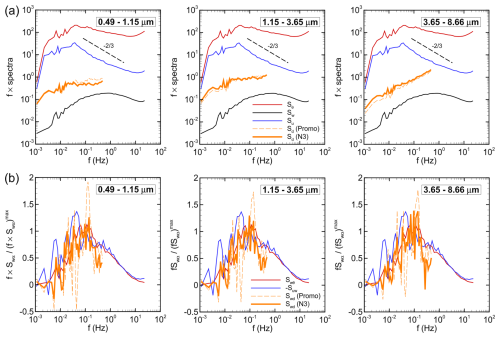
Figure 12(a) Ensemble-averaged 15 min energy spectra of the longitudinal velocity (Su), vertical velocity (Sw), air temperature (Sθ), and dust number concentration (Sd) at 2 m height for the 29 September event. Temperature, longitudinal velocity, and dust spectra are shifted upward to allow for comparison. (b) Comparison of the ensemble-averaged 15 min normalised cospectra of the momentum (Suw), heat (Swθ), and dust (Swd) fluxes, at 2 m height, for the 29 September event. Cospectra are normalised by their maximum. The dust concentration spectra and dust-flux cospectra have been obtained for three particle size ranges (from left to right) and from both the Promo and the N3 OPCs.
To compare the distribution of fluctuation energy according to the fluctuation timescales, the ensemble-averaged 15 min energy spectra of dust concentration obtained from both OPCs are presented in Fig. 12a. The figure also displays the 2 m high streamwise velocity u, vertical velocity w, and air temperature θ spectra. The spectra of meteorological variables exhibit the characteristic shape of atmospheric surface-layer spectra, as, for example, observed in Dupont et al. (2019) over a bare surface in Tunisia. Like meteorological variables, the dust spectra display a well-defined energy-containing range with a near-+1 power law, up to about 0.03 Hz where u and θ spectra reach their peak values. It is worth noting that at these low frequencies, the dust spectra exhibit fluctuations that are more comparable to those of the u spectra than to those of the θ spectra. This suggests that the fluctuations in the streamwise wind velocity at these frequencies drive those of the dust concentrations, potentially initiating dust emission. At high frequencies, dust spectra are flatter, lacking a peak. For coarse particles, the spectra continue to increase with frequency, following a power law of +1, indicating that white noise fluctuations dominate. The dust concentration was probably too low to identify a peak in the spectra, as observed in Dupont et al. (2021). Both OPCs lead to dust concentration spectra with comparable amplitudes and shapes.
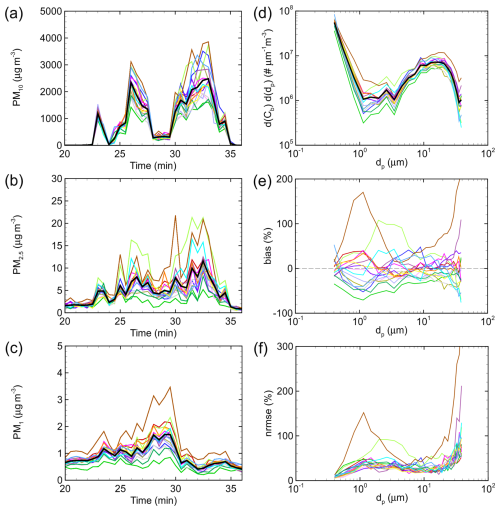
Figure 13 Variability of the measured particle concentrations between 17 N3 OPCs over a 16 min period. (a–c) Time variation in 1 min average PM10, PM2.5, and PM1 concentrations recorded by the N3 OPCs. (d) Mean size distributions of the particle concentrations obtained from the 17 OPCs. (e–f) Size-resolved biases and normalised root mean square error (NRMSE) of the 1 min average concentrations measured by each N3 against the mean concentration of the 17 N3 OPCs during the 16 min period. Each thin line represents one N3 OPC, and the thick black lines in (a)–(d) represent the average concentration from the 17 OPCs.
3.5 Variability of particle concentrations between N3 OPCs
The variability between the N3 OPCs in measuring particle concentrations is evaluated from the intercomparison performed in Iceland between 17 N3 OPCs (see Sect. 2.1). Only a nighttime 16 min period with notable coarse particle concentration was observed during this intercomparison. Over this period, the flow rate of the N3 OPCs was on average 0.32 ± 0.04 L min−1. All N3 OPCs exhibit similar dynamics of the 1 min average PM10, PM2.5, and PM1 concentrations, albeit with some discrepancy in amplitude, reaching up to ± 100 % of the mean concentration (Fig. 13a–c). Furthermore, the mean number concentration particle size distributions during this 16 min period are similar between OPCs (Fig. 13d), with a predominant mode of around 10 µm and a significant proportion of submicron particles. These size distributions may be more representative of fog droplets than mineral dust (see, for example, Mazoyer et al., 2022, for fog droplets against Dupont et al., 2024, for mineral dust in Iceland). Nonetheless, the type of particle is not relevant for the purposes of this intercomparison between N3 OPCs. Larger bias and NRMSE against the 17 N3 mean concentrations are observed for particles within the 1 µm range and for the coarsest particles (Fig. 13e–f). Two N3 OPCs differ more from the others (brown and light-green lines in Fig. 13). One of them had the lowest flow rate (0.24 L min−1, brown line), while the flow rate of the other was close to the mean value (0.34 L min−1, light-green line). This evaluation of the concentration variability between N3 OPCs suggests that size-specific correction factors could be estimated for each N3.
3.6 Dust flux
Before comparing the dust fluxes obtained from the N3 and Promo, we first compare their dust-flux cospectra. The dust-flux cospectra allow us to identify the timescale of the main turbulent structures contributing to the vertical dust fluxes. Figure 12b compares the ensemble-averaged 15 min dust-flux cospectra (Swd) obtained at 2 m height from the N3 and Promo OPCs during the 29 September erosion event for three particle size ranges. The figure also displays the momentum- and heat-flux cospectra (−Suw and Swθ) for the same event and height. The cospectra were normalised by their maximum values to facilitate the comparison of their distribution. Momentum- and heat-flux cospectra have similar shapes, although the momentum-flux cospectra display greater fluctuations at low frequencies. The dust-flux cospectra obtained from the N3 exhibit similar shapes to those from the Promo, with even less fluctuations, suggesting that the high-frequency sampling of the N3 is as good as or even better (less perturbed) than that of the Promo. For both OPCs, the Swd cospectra present a peak close to the Suw and Swθ cospectrum peaks, at approximately 0.1 Hz, for all particle size ranges. In the energy-containing range, the Swd and Swθ cospectra have a similar distribution, suggesting that dust is vertically transported or emitted by the same large-scale motions as heat. Passing the cospectrum peak, the Swd cospectra decrease on the high-frequency side, similar to the Suw and Swθ cospectra, but with a steeper slope in the inertial subrange, indicating a possible loss of the dust flux at high frequencies due to the limited high frequency of the OPCs (1 Hz).
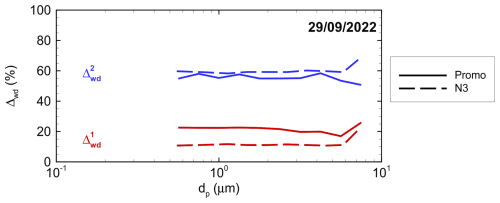
Figure 14Variation in the high-frequency corrections of the dust flux as a function of the particle size, when corrections are based either on a standard cospectrum shape fitted on the obtained dust-flux cospectrum () or on comparing the dust-flux cospectrum with the momentum-flux one (), for the 29 September erosion event and for the 2 m high Promo and N3 OPCs.
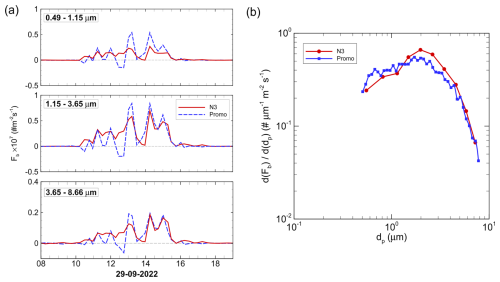
Figure 15Comparison of the dust flux obtained from the N3 and Promo OPCs during the 29 September erosion event, after calibration of the N3 and Promo concentrations to the Fidas one during the 24–28 September period. (a) Time variation in the 15 min average dust flux for three particle size ranges: 0.49–1.15, 1.15–3.65, and 3.65–8.66 µm. (b) Mean particle size distribution of dust flux during the erosion event. The Promo and N3 dust fluxes have been deduced using the eddy-covariance method. In (b) the dust-flux size distributions are discretised following each OPC's own particle size resolution.
The missing dust flux at high frequencies has been assessed using two approaches outlined in Dupont et al. (2024). The first method involves comparing the dust-flux cospectra with the typical shape of the scalar-flux cospectrum, while considering an attenuation on the high-frequency side due to the slow response of the OPC. The second method estimates the high-frequency losses of the dust-flux cospectra based on momentum-flux cospectra, assuming similar transport mechanisms for dust and momentum at high frequencies. Figure 14 illustrates the high-frequency losses of dust flux, denoted as and , respectively, for the 29 September erosion event as a function of the particle size. On average, represents about +20 % of the dust flux for the Promo and only +10 % for the N3, with no evident pattern with particle size for both OPCs, as observed in Dupont et al. (2021). The second method yields a higher correction compared to the first method. On average, represents between +50 % and +55 % of the dust flux for the Promo and N3, respectively, with no clear trend with particle size, similar to . This higher correction can be attributed to the larger contribution of low frequencies to the momentum-flux cospectra than to the dust-flux cospectra. A correction based on the heat-flux cospectra would have been lower.
Figure 15a compares the EC dust fluxes obtained from the N3 and Promo during the 29 September erosion event. Both fluxes have been corrected for high-frequency losses using the first method correction (), as done in Dupont et al. (2021). Overall, the dust flux obtained from the N3 is comparable to that obtained from the Promo, with a difference of less than 26 % (125 % in RMSE) (Table 1). The size distribution of the dust flux is also relatively well captured by the N3, with a more pronounced dominant mode of around 2 µm (Fig. 15b). The N3 dust flux is lower for particles smaller than 1.15 µm and higher for those above. The N3 flux displays slightly less fluctuations than that of the Promo, with fewer periods without dust flux during the event (Fig. 15a). We suspect that the N3 acquires the 1 Hz fluctuations in dust concentration better than the Promo, as suggested by the less fluctuating N3 dust-flux cospectra (Fig. 12b). This implies a more continuous correlation between the dust concentration and vertical velocity fluctuations and thus a more continuous dust flux during the event for the N3.
The low-cost OPC-N3 (Alphasense) was evaluated for its ability to estimate size-resolved dust fluxes during aeolian soil erosion events when combined with a sonic anemometer, using the eddy-covariance method. This evaluation involved a comparison with the reference OPC Promo 2000, focusing on particle diameters ranging from 0.5 to 9 µm.
Overall, the low-cost OPC was able to measure the particle concentration over 23 consecutive days in the Wadi Rum desert of Jordan surprisingly well, despite the challenging environmental conditions, including dusty winds and warm temperatures. Two main discrepancies were identified. Firstly, the N3 flow rate presented fluctuations over time, which resulted in an overestimation of the concentration of fine dust particles as the N3 flow rate decreased. Fluctuations in the flow rate of the reference OPC were not observed, with the pump of this latter OPC ensuring a more stable flow rate. Secondly, some of the particles near 1 µm in diameter were classified by the N3 into the upper size bin, resulting in an underestimation of the 1 µm size bin and an overestimation of the bin above it. This last discrepancy is not expected to impact the N3 PM10 and PM2.5 estimations. After correction for both discrepancies, the predicted N3 concentration was found to be as good as that of the Promo compared to a third OPC (Fidas 200 S). Furthermore, the low-cost OPC yielded a similar concentration particle size distribution to the reference OPC. The turbulence characteristics of the dust concentration measured by the N3, namely the concentration high-frequency fluctuations, were also comparable to those of the reference OPC in terms of amplitude distribution and energy density spectrum. Between several N3 OPCs, the variability in measured particle concentrations can be significant, with a potential range of up to ±100 %. However, the high correlation between OPCs suggests that this variability can be mitigated by the application of correction factors deduced during an intercomparison exercise from size-specific linear regression.
Unlike some previous studies, the performance of the N3 OPC during the J-WADI campaign appeared unaffected by humidity conditions. This can be attributed to the similar meteorological conditions observed during dust emission events, with a relative humidity ranging from approximately 20 % to 30 %. The comparison of the N3 with the Promo on a humid night (RH>70 %) did not reveal any performance degradation of the N3 relative to drier periods. Unlike the Fidas, the fact that the N3 and Promo do not dry the sampled air renders both OPCs sensitive to water droplets, potentially explaining why the N3 concentration seemed unaffected by air humidity in comparison to the Promo concentration. However, measurements in prolonged humid conditions are required to confirm our observation.
The dust fluxes obtained from the N3, by correlating the dust concentration fluctuations with vertical wind velocity fluctuations, were consistent with those obtained from the reference Promo OPC. This leads to close size distributions of the emission dust flux. Differences were in the range of ±30 %.
This study demonstrated the ability of the OPC-N3 to estimate size-resolved dust fluxes via the eddy-covariance method, after calibrating the dust concentration from a reference OPC. Due to their lower cost, compact size, and low power consumption, these devices appear promising for expanding the spatial resolution of dust emission in complex environments.
The processed data used in this study are available from the corresponding author upon reasonable request.
SD drafted the paper with input from EL, KK, MK, and CPGP. SD analysed the data and prepared all figures. MRI and JMB designed the OPC-N3 acquisition and setup. KK conducted the OPC-N3 intercomparison in Iceland. AA, AGR, CGF, CPGP, KK, MK, MRI, SD, and XQ implemented the field campaign. CPGP and MK proposed and designed the J-WADI campaign with contributions from AA, KK, SD, and XQ.
The contact author has declared that none of the authors has any competing interests.
Publisher’s note: Copernicus Publications remains neutral with regard to jurisdictional claims made in the text, published maps, institutional affiliations, or any other geographical representation in this paper. While Copernicus Publications makes every effort to include appropriate place names, the final responsibility lies with the authors.
We acknowledge the European Research Council under the Horizon 2020 research and innovation programme through the ERC Consolidator Grant FRAGMENT (grant agreement no. 773051) and the AXA Research Fund through the AXA Chair on Sand and Dust Storms at BSC for financial support of the field campaigns. We also thank the Helmholtz Association's Initiative and Networking Fund (grant agreement no. VH-NG-1533) for financial support of the field campaign in Jordan. Sylvain Dupont acknowledges the financial support of the Department of Agroecosystems of INRAE. Konrad Kandler is funded by the Deutsche Forschungsgemeinschaft (DFG; German Research Foundation) (grant nos. 416816480 and 417012665). We acknowledge efforts by the staff at Wadi Rum Protected Area, the Aqaba Special Economic Zone Authority, and the Directorate of Environmental Monitoring and Assessment at the Ministry of Environment. Finally, the authors thank Amato Evan and Dimitrios Bousiotis for their helpful comments.
This research has been supported by the Department of Agroecosystems of INRAE, the European Research Council under the H2020 programme (grant no. 773051), the AXA Research Fund through the AXA Chair on Sand and Dust Storms at BSC, the Helmholtz Association’s Initiative and Networking Fund (grant no. VH-NG-1533), and the Deutsche Forschungsgemeinschaft (DFG; German Research Foundation) (grant nos. 416816480 and 417012665).
This paper was edited by Francis Pope and reviewed by Dimitrios Bousiotis and Amato Evan.
Adebiyi, A. A. and Kok, J. F.: Climate models miss most of the coarse dust in the atmosphere, Sci. Adv., 6, https://doi.org/10.1126/sciadv.aaz9507, 2020. a
Crilley, L. R., Shaw, M., Pound, R., Kramer, L. J., Price, R., Young, S., Lewis, A. C., and Pope, F. D.: Evaluation of a low-cost optical particle counter (Alphasense OPC-N2) for ambient air monitoring, Atmos. Meas. Tech., 11, 709–720, https://doi.org/10.5194/amt-11-709-2018, 2018. a
Dubey, R., Patra, A. K., Joshi, J., Blankenberg, D., Kolluru, S. S. R., Madhu, B., and Raval, S.: Evaluation of low-cost particulate matter sensors OPC N2 and PM Nova for aerosol monitoring, Atmos. Pollut. Res., 13, 101335, https://doi.org/10.1016/j.apr.2022.101335, 2022. a, b
Dupont, S.: Scaling of Dust Flux With Friction Velocity: TimeResolution Effects, J. Geophys. Res.-Atmos., 125, e2019JD031192, https://doi.org/10.1029/2019JD031192, 2020. a
Dupont, S.: On the influence of thermal stratification on emitted dust flux, J. Geophys. Res., 127, e2022JD037364, https://doi.org/10.1029/2022jd037364, 2022. a
Dupont, S., Rajot, J.-L., Labiadh, M., Bergametti, G., Alfaro, S., Bouet, C., Fernandes, R., Khalfallah, B., Lamaud, E., Marticorena, B., Bonnefond, J.-M., Chevaillier, S., Garrigou, D., Henry-des-Tureaux, T., Sekrafi, S., and Zapf, P.: Aerodynamic parameters over an eroding bare surface: reconciliation of the Law-of-the-wall and Eddy-Covariance determinations, J. Geophys. Res., 123, 4490–4508, https://doi.org/10.1029/2017jd027984, 2018. a, b
Dupont, S., Rajot, J.-L., Labiadh, M., Bergametti, G., Lamaud, E., Irvine, M., Alfaro, S., Bouet, C., Fernandes, R., Khalfallah, B., Marticorena, B., Bonnefond, J.-M., Chevaillier, S., Garrigou, D., Henry-des-Tureaux, T., Sekrafi, S., and Zapf, P.: Dissimilarity between dust, heat, and momentum turbulent transports during aeolian soil erosion, J. Geophys. Res., 124, 1064–1089, https://doi.org/10.1029/2018jd029048, 2019. a, b
Dupont, S., Rajot, J.-L., Lamaud, E., Bergametti, G., Labiadh, M., Khalfallah, B., Bouet, C., Marticorena, B., and Fernandes, R.: Comparison Between Eddy-Covariance and Flux-Gradient Size-Resolved Dust Fluxes During Wind Erosion Events, J. Geophys. Res.-Atmos., 126, e2021JD034735, https://doi.org/10.1029/2021jd034735, 2021. a, b, c, d, e, f, g, h
Dupont, S., Klose, M., Irvine, M. R., González-Flórez, C., Alastuey, A., Bonnefond, J., Dagsson-Waldhauserova, P., Gonzalez-Romero, A., Hussein, T., Lamaud, E., Meyer, H., Panta, A., Querol, X., Schepanski, K., Vergara Palacio, S., Wieser, A., Yus-Díez, J., Kandler, K., and Pérez García-Pando, C.: Impact of Dust Source Patchiness on the Existence of a Constant Dust Flux Layer During Aeolian Erosion Events, J. Geophys. Res.-Atmos., 129, e2023JD040657, https://doi.org/10.1029/2023jd040657, 2024. a, b, c, d, e, f
Fratini, G., Ciccioli, P., Febo, A., Forgione, A., and Valentini, R.: Size-segregated fluxes of mineral dust from a desert area of northern China by eddy covariance, Atmos. Chem. Phys., 7, 2839–2854, https://doi.org/10.5194/acp-7-2839-2007, 2007. a
Gillette, D. A., Blifford Jr., I. H., and Fenster, C. R.: Measurements of aerosol size distributions and vertical fluxes of aerosols on land subject to wind erosion, J. Appl. Meteorol., 11, 977–987, 1972. a
González-Flórez, C., Klose, M., Alastuey, A., Dupont, S., Escribano, J., Etyemezian, V., Gonzalez-Romero, A., Huang, Y., Kandler, K., Nikolich, G., Panta, A., Querol, X., Reche, C., Yus-Díez, J., and Pérez García-Pando, C.: Insights into the size-resolved dust emission from field measurements in the Moroccan Sahara, Atmos. Chem. Phys., 23, 7177–7212, https://doi.org/10.5194/acp-23-7177-2023, 2023. a
Huang, Y., Adebiyi, A. A., Formenti, P., and Kok, J. F.: Linking the Different Diameter Types of Aspherical Desert Dust Indicates That Models Underestimate Coarse Dust Emission, Geophysi. Res. Lett., 48, e2020GL092054, https://doi.org/10.1029/2020gl092054, 2021. a
Ishizuka, M., Mikami, M., Leys, J. F., Shao, Y., Yamada, Y., and Heidenreich, S.: Power law relation between size-resolved vertical dust flux and friction velocity measured in a fallow wheat field, Aeolian Res., 12, 87–99, 2014. a
Kaur, K. and Kelly, K. E.: Performance evaluation of the Alphasense OPC-N3 and Plantower PMS5003 sensor in measuring dust events in the Salt Lake Valley, Utah, Atmos. Meas. Tech., 16, 2455–2470, https://doi.org/10.5194/amt-16-2455-2023, 2023. a, b
Knippertz, P. and Stuut, J.: Mineral Dust: A Key Player in the Earth System, Springer Netherlands, ISBN 9789401789776, 2014. a
Kok, J. F., Ridley, D. A., Zhou, Q., Miller, R. L., Zhao, C., Heald, C. L., Ward, D. S., Albani, S., and Haustein, K.: Smaller desert dust cooling effect estimated from analysis of dust size and abundance, Nat. Geosci., 10, 274–278, https://doi.org/10.1038/ngeo2912, 2017. a
Mahowald, N., Lindsay, K., Rothenberg, D., Doney, S. C., Moore, J. K., Thornton, P., Randerson, J. T., and Jones, C. D.: Desert dust and anthropogenic aerosol interactions in the Community Climate System Model coupled-carbon-climate model, Biogeosciences, 8, 387–414, https://doi.org/10.5194/bg-8-387-2011, 2011. a
Mahowald, N., Samuel, A., Kok, J., Engelstaeder, S., Scanza, R., Ward, D. S., and Flanner, M. G.: The size distribution of desert dust aerosols and its impact on the Earth system, Aeolian Res., 15, 53–71, https://doi.org/10.1016/j.aeolia.2013.09.002, 2014. a, b
Mazoyer, M., Burnet, F., and Denjean, C.: Experimental study on the evolution of droplet size distribution during the fog life cycle, Atmos. Chem. Phys., 22, 11305–11321, https://doi.org/10.5194/acp-22-11305-2022, 2022. a
Nickling, W. G. and Gillies, J. A.: Dust emission and transport in Mali, West Africa, Sedimentology, 40, 859–868, 1993. a
Nurowska, K., Mohammadi, M., Malinowski, S., and Markowicz, K.: Applicability of the low-cost OPC-N3 optical particle counter for microphysical measurements of fog, Atmos. Meas. Tech., 16, 2415–2430, https://doi.org/10.5194/amt-16-2415-2023, 2023. a
Petit, J. R., Mourner, L., Jouzel, J., Korotkevich, Y. S., Kotlyakov, V. I., and Lorius, C.: Palaeoclimatological and chronological implications of the Vostok core dust record, Nature, 343, 56–58, https://doi.org/10.1038/343056a0, 1990. a
Shao, Y.: Physics and Modelling of Wind Erosion, vol. 2nd revised and expanded edition, Springer, ISBN 978-1-4020-8894-0, 2008. a
Shao, Y., Ishizuka, M., Mikami, M., and Leys, J. F.: Parameterization of size-resolved dust emission and validation with measurements, J. Geophys. Res., 116, https://doi.org/10.1029/2010JD014527, 2011. a
Sow, M., Alfaro, S. C., Rajot, J. L., and Marticorena, B.: Size resolved dust emission fluxes measured in Niger during 3 dust storms of the AMMA experiment, Atmos. Chem. Phys., 9, 3881–3891, https://doi.org/10.5194/acp-9-3881-2009, 2009. a
Tegen, I. and Lacis, A. A.: Modeling of particle size distribution and its influence on the radiative properties of mineral dust aerosol, J. Geophys. Res., 101, 19237–19244, https://doi.org/10.1029/95JD03610, 1996. a


