the Creative Commons Attribution 4.0 License.
the Creative Commons Attribution 4.0 License.
 | 26 May 2025
Retrieval algorithm for aerosol effective height from the Geostationary Environment Monitoring Spectrometer (GEMS)
Sang Seo Park
Jhoon Kim
Yeseul Cho
Hanlim Lee
Junsung Park
Dong-Won Lee
Won-Jin Lee
Deok-Rae Kim
An algorithm for aerosol effective height (AEH) was developed for operational use with observations from the Geostationary Environment Monitoring Spectrometer (GEMS). The retrieval technique uses the slant column density of the oxygen dimer (O2–O2) at 477 nm, which is converted into AEH after retrieval of aerosol and surface optical properties from GEMS operational algorithms. The retrieved AEHs provide continuous vertical information on severe dust plumes over East Asia with reasonably good validation results and the collection of plume height information for anthropogenic aerosol pollutants over India. Compared to the AEH retrieved from Cloud–Aerosol Lidar with Orthogonal Polarization (CALIOP), the retrieval results show a bias of −0.03 km with a standard deviation of 1.4 km for the AEH difference over the GEMS observation domain from January to June 2021. The AEH difference depends on aerosol optical properties and surface reflectance. Compared to the aerosol layer height obtained from the Tropospheric Monitoring Instrument (TROPOMI), differences of 1.50±1.08 km, 1.59±1.22 km, and 1.71±1.24 km were obtained for pixels with single-scattering albedo (SSA) <0.90, 0.90 < SSA < 0.95, and SSA > 0.95, respectively.
- Article
(14596 KB) - Full-text XML
-
Supplement
(1683 KB) - BibTeX
- EndNote


Since the launch of the Total Ozone Mapping Spectrometer (TOMS) on Nimbus-7, ultraviolet (UV)–visible satellite measurements have been used for environmental monitoring of the distribution and reaction processes of pollutants (e.g., anthropogenic aerosols, tropospheric ozone, NO2, and SO2). Measurements from environmental satellites have been used to estimate gaseous species in the atmosphere, resulting in vertical column-integrated amounts. However, these column-integrated amounts and associated surface concentrations have uncertainty due to simultaneous changes in optical path length associated with the vertical distribution of target species and quantities of scattering materials (clouds and aerosols) present. In addition, aerosol vertical information is also important for the application of the tropospheric concentration of aerosols. For example, aerosol height information in the free troposphere is particularly important for aviation safety because it affects visibility. Also, scientific applications including radiative forcing studies, long-range transport modeling, and studies of cloud formation processes have used aerosol vertical information as an input parameter.
Environmental satellite sensors that measure UV–visible wavelength have used the UV aerosol index (UVAI) for aerosol detection (e.g., Buchard et al., 2015; Herman et al., 1997; Torres et al., 1998, 2002; Prospero et al., 2000; de Graaf et al., 2005). Furthermore, scattering radiative index values were investigated for the possibility of cloud signal detection (Penning de Vries et al., 2009, 2015; Kooreman et al., 2020; Kim et al., 2018). However, these indices only have qualitative characteristics and limitations in identifying aerosol amounts.
For the quantitative estimation, measurements of aerosol optical depth (AOD) and radiative cloud fraction have also been retrieved from pixel-based radiance data in the UV–visible wavelength range. Recently, various aerosol retrieval algorithms have been developed to be applied in passive satellite sensors. These algorithms focus on improved trace gas retrieval as well as direct monitoring of aerosol properties, such as AOD and single-scattering albedo (SSA) (e.g., Ahn et al., 2014; Kim et al., 2020; Torres et al., 2020).
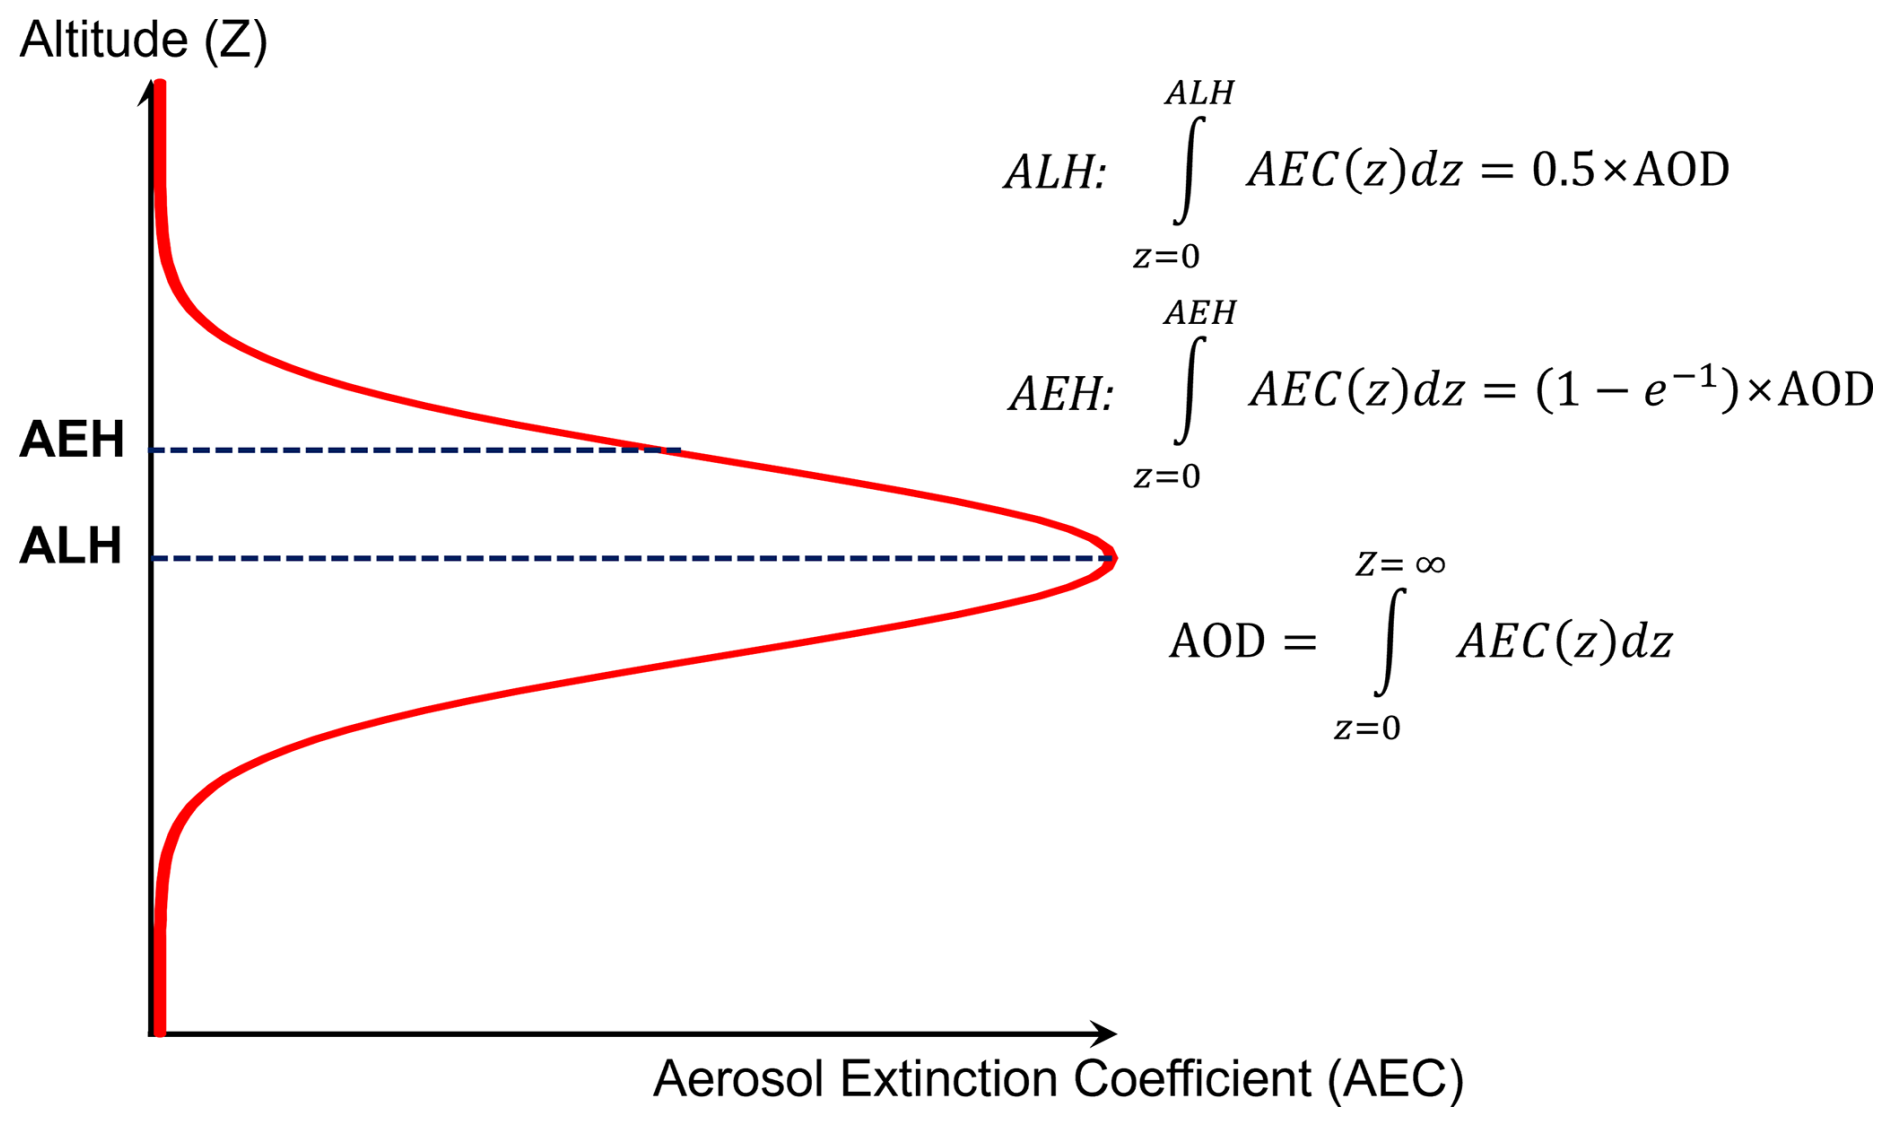
Figure 1A schematic illustration of AEH and ALH definitions in an idealized Gaussian shape of aerosol vertical distribution.
Although the algorithms developed for environmental satellite sensors indicate the presence and quantities of scattering materials, the accuracy of these retrieval algorithms for trace gases is affected by the relative vertical distributions between trace gases and scattering materials (e.g., Lorente et al., 2017; Hong et al., 2017). For this reason, estimating cloud vertical parameters is important. For cloud vertical information, cloud height information has been estimated simultaneously with cloud optical depth and radiative cloud fraction data using rotational Raman scattering (Joiner and Vasilkov, 2006; Vasilkov et al., 2008; Joiner and Bhartia, 1995) and the absorption intensity of the oxygen dimer (O2–O2) (Accarreta et al., 2004; Vasilkov et al., 2018; H. Choi et al., 2021) combined with normalized radiance.
Similarly, the aerosol vertical distribution can be estimated using the oxygen absorption bands, such as the O2–O2 (Park et al., 2016; Chimot et al., 2017; Choi et al., 2019, 2020), O2-A (Dubisson et al., 2009; Geddes and Bösch, 2015; Sanders et al., 2015; Xu et al., 2017; Zeng et al., 2020), and O2-B (Chen et al., 2021; Ding et al., 2016), as well as combinations of these bands (Sanghavi et al., 2012; Chen et al., 2021). In addition, an algorithm for aerosol vertical information has been developed based on hyperspectral UV–visible radiance from satellite observations. Nanda et al. (2018) demonstrated the possibility of aerosol height retrieval from the O2-A band, developed an algorithm using the Tropospheric Monitoring Instrument (TROPOMI) (de Graaf et al., 2024; Nanda et al., 2020), and implemented the algorithm operationally.
However, the vertical distribution of aerosol is difficult to assess because of its large spatiotemporal variability. Although the Cloud–Aerosol Lidar with Orthogonal Polarization (CALIOP) provided the aerosol vertical distribution with high vertical resolution (Omar et al., 2009), other passive satellite sensors are only able to estimate the representative parameter of aerosol height. Veihelmann et al. (2007) showed that the number of degrees of freedom for signal of aerosol is 2–4 for most satellite observation conditions of the Ozone Monitoring Instrument (OMI). In addition, the number of degrees of freedom does not exceed 3 from shortwave satellite measurements (e.g., Rao et al., 2019; W. Choi et al., 2021). It means that the amount of information for aerosol vertical distribution has a limitation for satellite sensors. Because of limitations in describing aerosol vertical information, aerosol layer height (ALH) (e.g., Nanda et al., 2018) and aerosol effective height (AEH) (Park et al., 2016) were defined to retrieve the aerosol vertical information from passive satellite sensors.
The Geostationary Environment Monitoring Spectrometer (GEMS), which was launched by South Korea in February 2020, provides column density of ozone, aerosol, and their precursors (Kim et al., 2020). The main purpose of GEMS is to monitor air quality, and aerosol properties are targets of such monitoring over East Asia. For this reason, the GEMS aerosol algorithm was developed as a multiple operational product. The aerosol algorithm adopted the optimal estimation method (Rogers, 2000) to retrieve AOD, SSA, and ALH. Aerosol properties are obtained for the purposes of monitoring air quality and aerosol effects for the air mass factor (AMF) calculation. In addition to these aerosol products, AEH is provided to represent the upper layer of the peak. Both ALH and AEH help understand the vertical structure of the aerosol layer. For the possibility to develop an AEH retrieval algorithm, Park et al. (2016) conducted theoretical sensitivity testing of AEH retrieval using solely the O2–O2 absorption band along with aerosol and surface properties. Overall, the sensitivity of AEH retrieval was strongly affected by SSA, AOD, and aerosol types including optical and size properties. In addition, case studies of AEH during dust transport over East Asia were conducted using radiance data from the OMI and aerosol optical properties from the Moderate Resolution Imaging Spectroradiometer (MODIS).
Based on theoretical considerations and case study results, we introduce an operational retrieval algorithm for AEH. Section 2 introduces the details of satellite sensors for the comparison and colocation method in this study. Section 3 describes the details of the AEH retrieval algorithm for GEMS and provides a list of the detailed input parameters. Section 4 reports retrieval results based on case studies of aerosol transport, and Sect. 5 contains long-term validation results based on CALIOP and TROPOMI data. Finally, in Sect. 6, the summary and main conclusions are presented.
Table 1Details of fitting parameters for O2–O2 SCD estimation via the DOAS method.
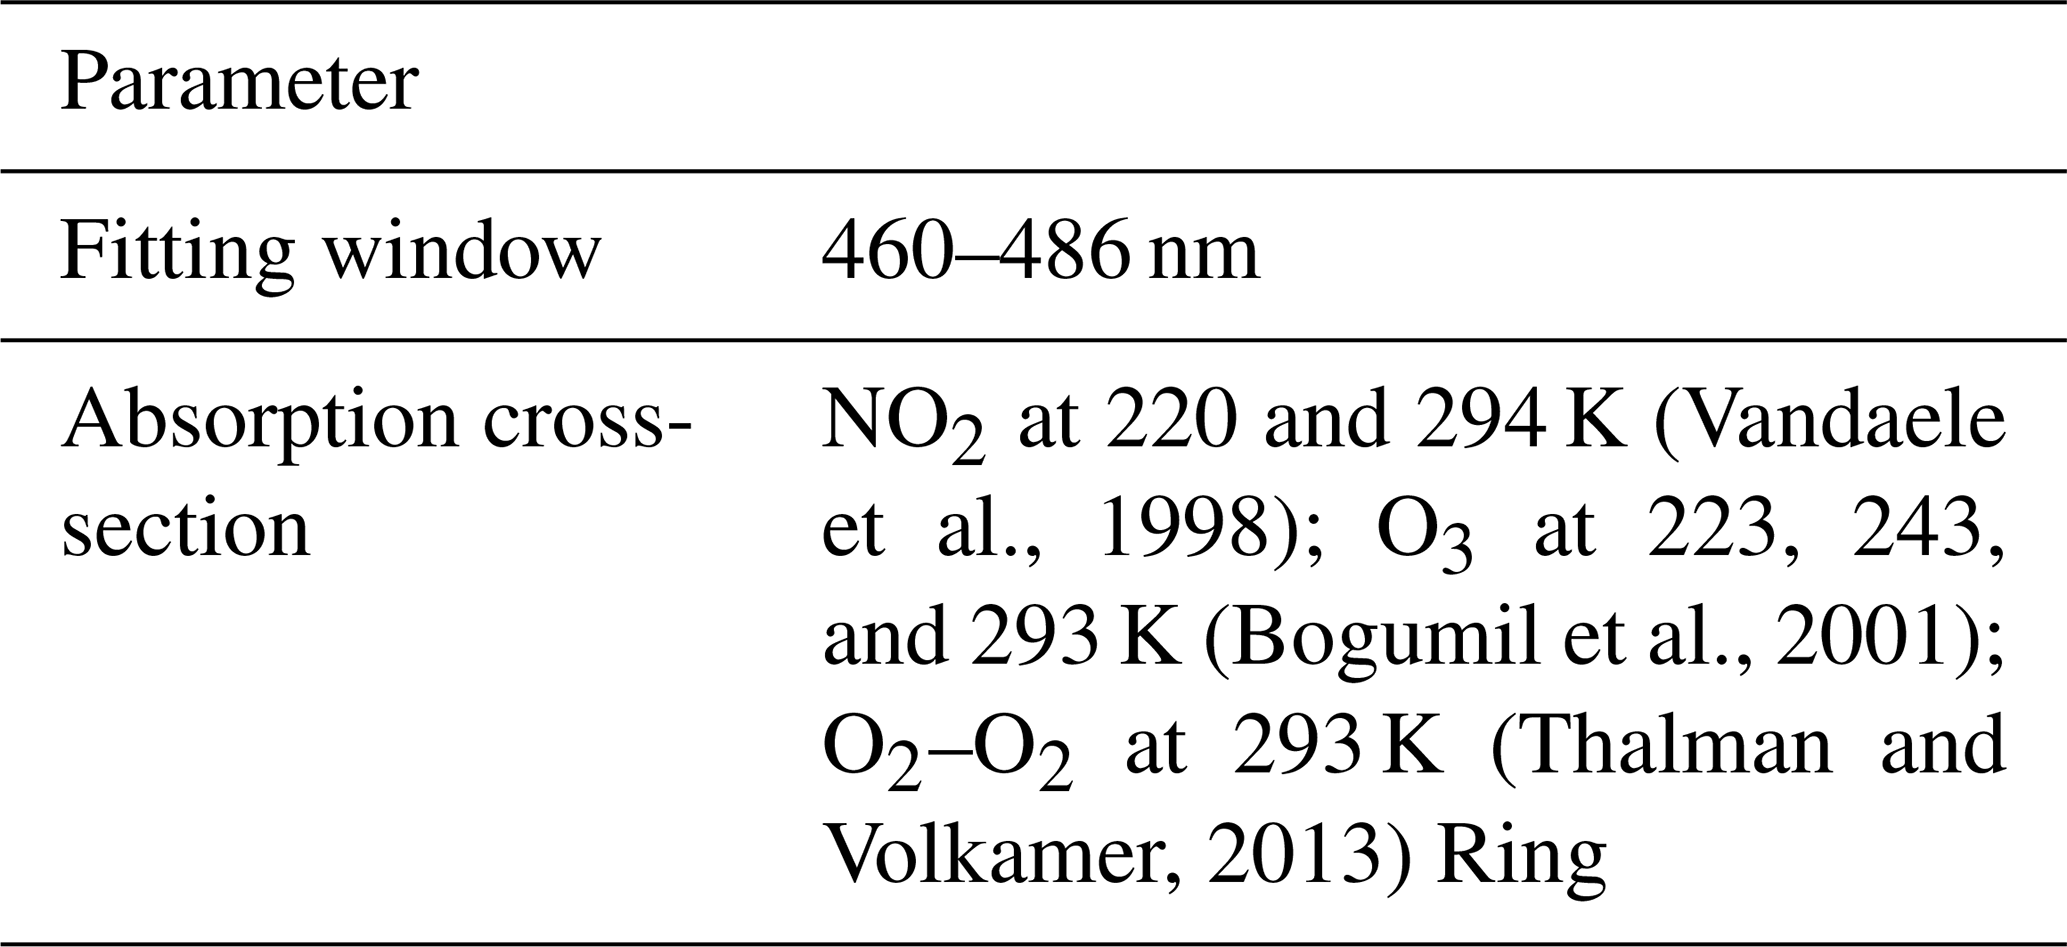
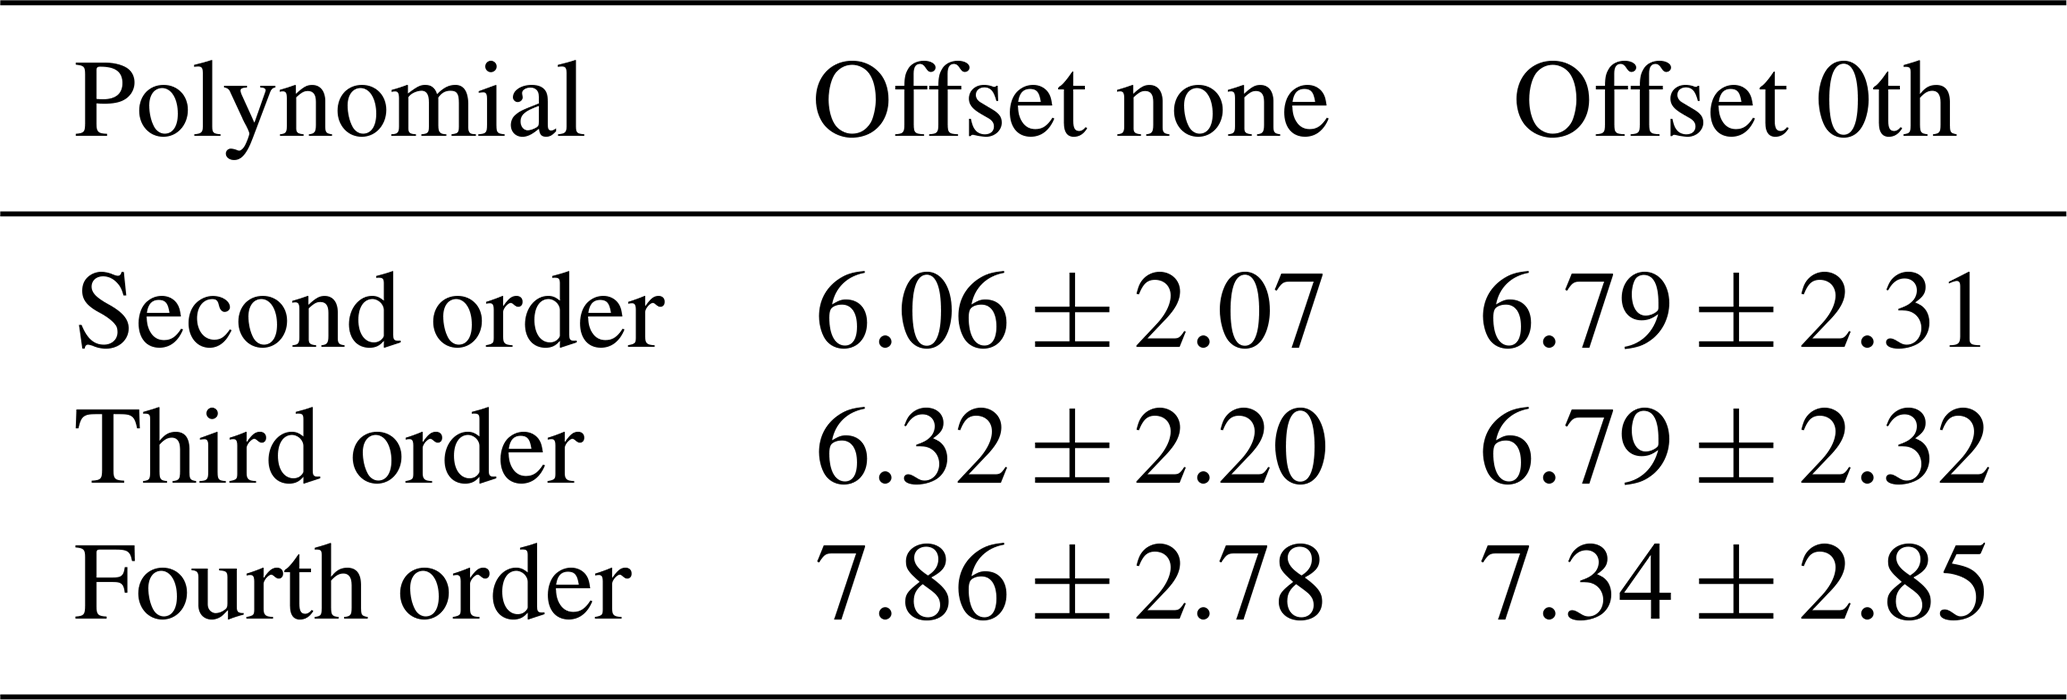
Table 2Ratio between SCD error and the SCD of O2–O2 according to the polynomial order and offset settings used for DOAS fitting.
2.1 GEMS
The GEMS instrument on board the Geostationary Korea multipurpose satellite 2B (GK2B) is located at 128.2° E and scans from 145 to 75° E with north–south coverage of 5° S–45° N. The GK2B observation schedule shares the GEMS and the Geostationary Ocean Color Imager 2 (GOCI2), and the GEMS scans for a 30 min duration every hour from 45 to 15 min during daytime. The spatial resolution of GEMS is 3.5 km (north–south) ×8 km (east–west) for aerosol and gaseous products at 38° N. The spectral range of 300–500 nm is covered with a spectral resolution (as defined by the full-width and half-maximum of the spectral response function) of 0.6 nm and a spectral sampling of 0.2 nm.
The GEMS Level 2 aerosol operational algorithm (L2AERAOD) retrieves the aerosol index (AI) values for UV and visible wavelengths, as well as AOD and SSA after determining the aerosol types (National Institute of Environmental Research, 2024). The aerosol types are defined as absorbing, non-absorbing, and dust types by using AI-based classification methods exploiting measurements in the UV and visible (e.g., Go et al., 2020). Park et al. (2016) noted that the error budget of AEH is significantly affected by uncertainty in AOD and SSA and by the misclassification of aerosol types, which is directly related to the optical property and size information. Overall, uncertainties of 0.2 in AOD, 20 % in particle size, 10 % in SSA, and 0.02 in surface albedo cause AEH errors in the range 739–1276 m (Park et al., 2016). In this study, the L2AERAOD results for AOD at 550 nm and SSA at 443 nm were adopted as input data for aerosol properties, and the AOD and SSA values were spectrally converted to those values at an assumed wavelength for the inversion calculation process after considering the spectral dependence of the aerosol optical properties by the aerosol models. In addition, we also used the minimum reflectance under the Lambertian assumption to retrieve AOD and AEH to coincide with the use of surface information on L2AERAOD and AEH retrieval.
2.2 TROPOMI
TROPOMI is a nadir-viewing spectrometer, the only payload of the Sentinel-5 Precursor (S5P), measuring radiance in the UV, visible, near-infrared, and shortwave IR (Veefkind et al., 2012). The S5P is a polar-orbiting satellite that crosses the Equator at 13:30 local time on an ascending node. The aerosol layer height product from TROPOMI (AER_LH) provides vertically localized aerosol layers in the free troposphere with cloud-free conditions by using the Level 1b Earth radiance measurements from 758 to 770 nm (de Graaf et al., 2022). The definition of ALH from TROPOMI is the optical centroid layer height of the plume above sea level. The spectral fit employs a fast forward model based on a neural network for simulated conditions of reflectance around the O2-A band. After cloud masking, an optimal estimation method is used to retrieve the ALH and AOD by using the inversion method from observations. Other aerosol parameters, such as SSA, layer thickness, and scattering phase function, are assumed to be fixed values (Nanda et al., 2020). Furthermore, the ALH retrieval has a limitation for aerosol plumes higher than 12 km because the ALH neural network product currently provides the plume pressure range of 75–1000 hPa (Michailidis et al., 2023).
The main purpose of the AER_LH product is the retrieval of aerosol layers in the free troposphere (desert dust, biomass burning, and volcanic ash) (Michailidis et al., 2023). The target requirement for the accuracy and precision is 0.5 km or 50 hPa, and the threshold requirement is 1 km or 100 hPa under elevated aerosol plumes with cloud-free conditions for the layer height and for the associated pressure, respectively (de Graaf et al., 2024; Veefkind et al., 2012). However, the TROPOMI ALH product has a strong dependence on the surface albedo, especially bright surfaces (Sanders et al., 2015). From Michailidis et al. (2023), a mean bias of −0.51 ± 0.77 and −2.27 ± 1.17 km is estimated over ocean and land, respectively. In this study, we use version 02.04.00 of the TROPOMI offline Level 2 AER_LH product (European Space Agency, 2021) with a spatial resolution of 3.5 km × 5.5 km at nadir-viewing geometry.
Table 3The dimensions of the LUT for the GEMS AEH retrieval algorithm used to estimate AEH from O2–O2 SCD (SZA: solar zenith angle, VZA: viewing zenith angle, RAA: relative azimuth angle, SUR: surface reflectance).
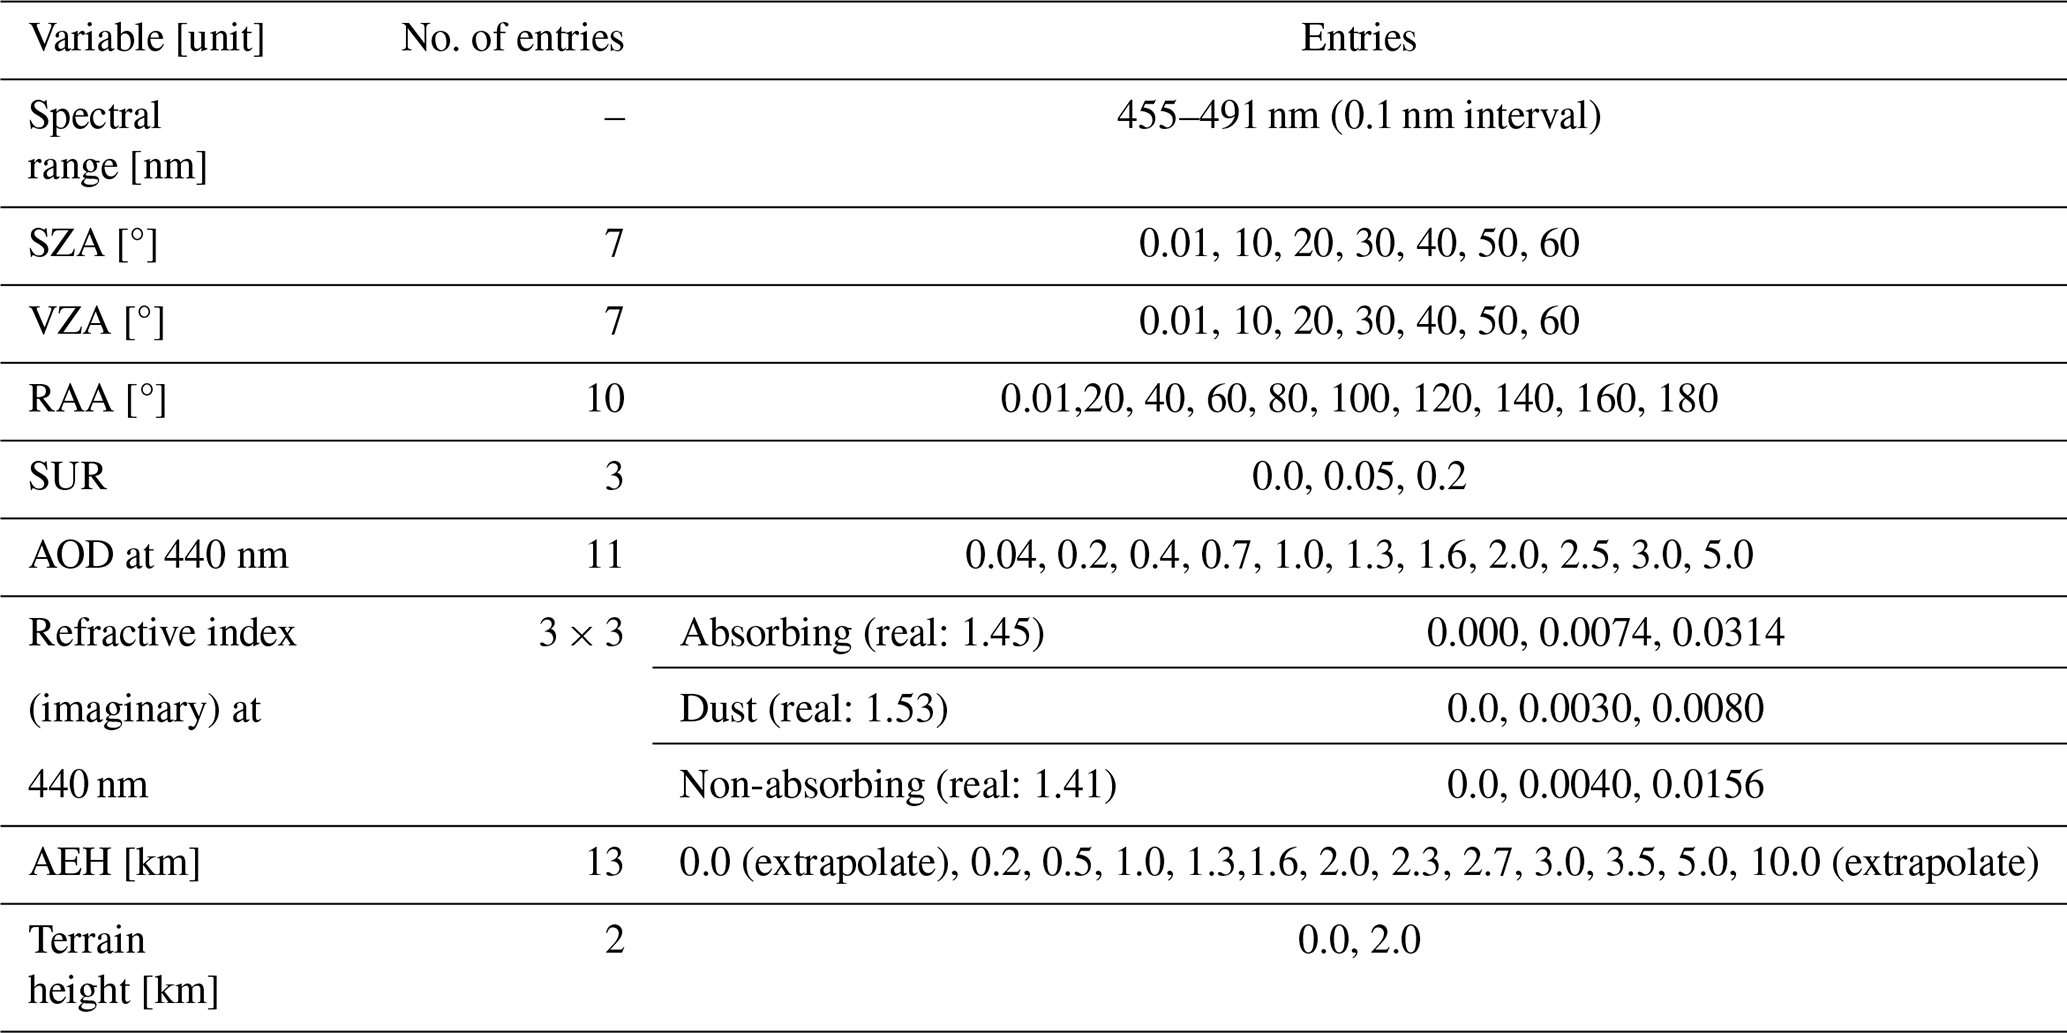
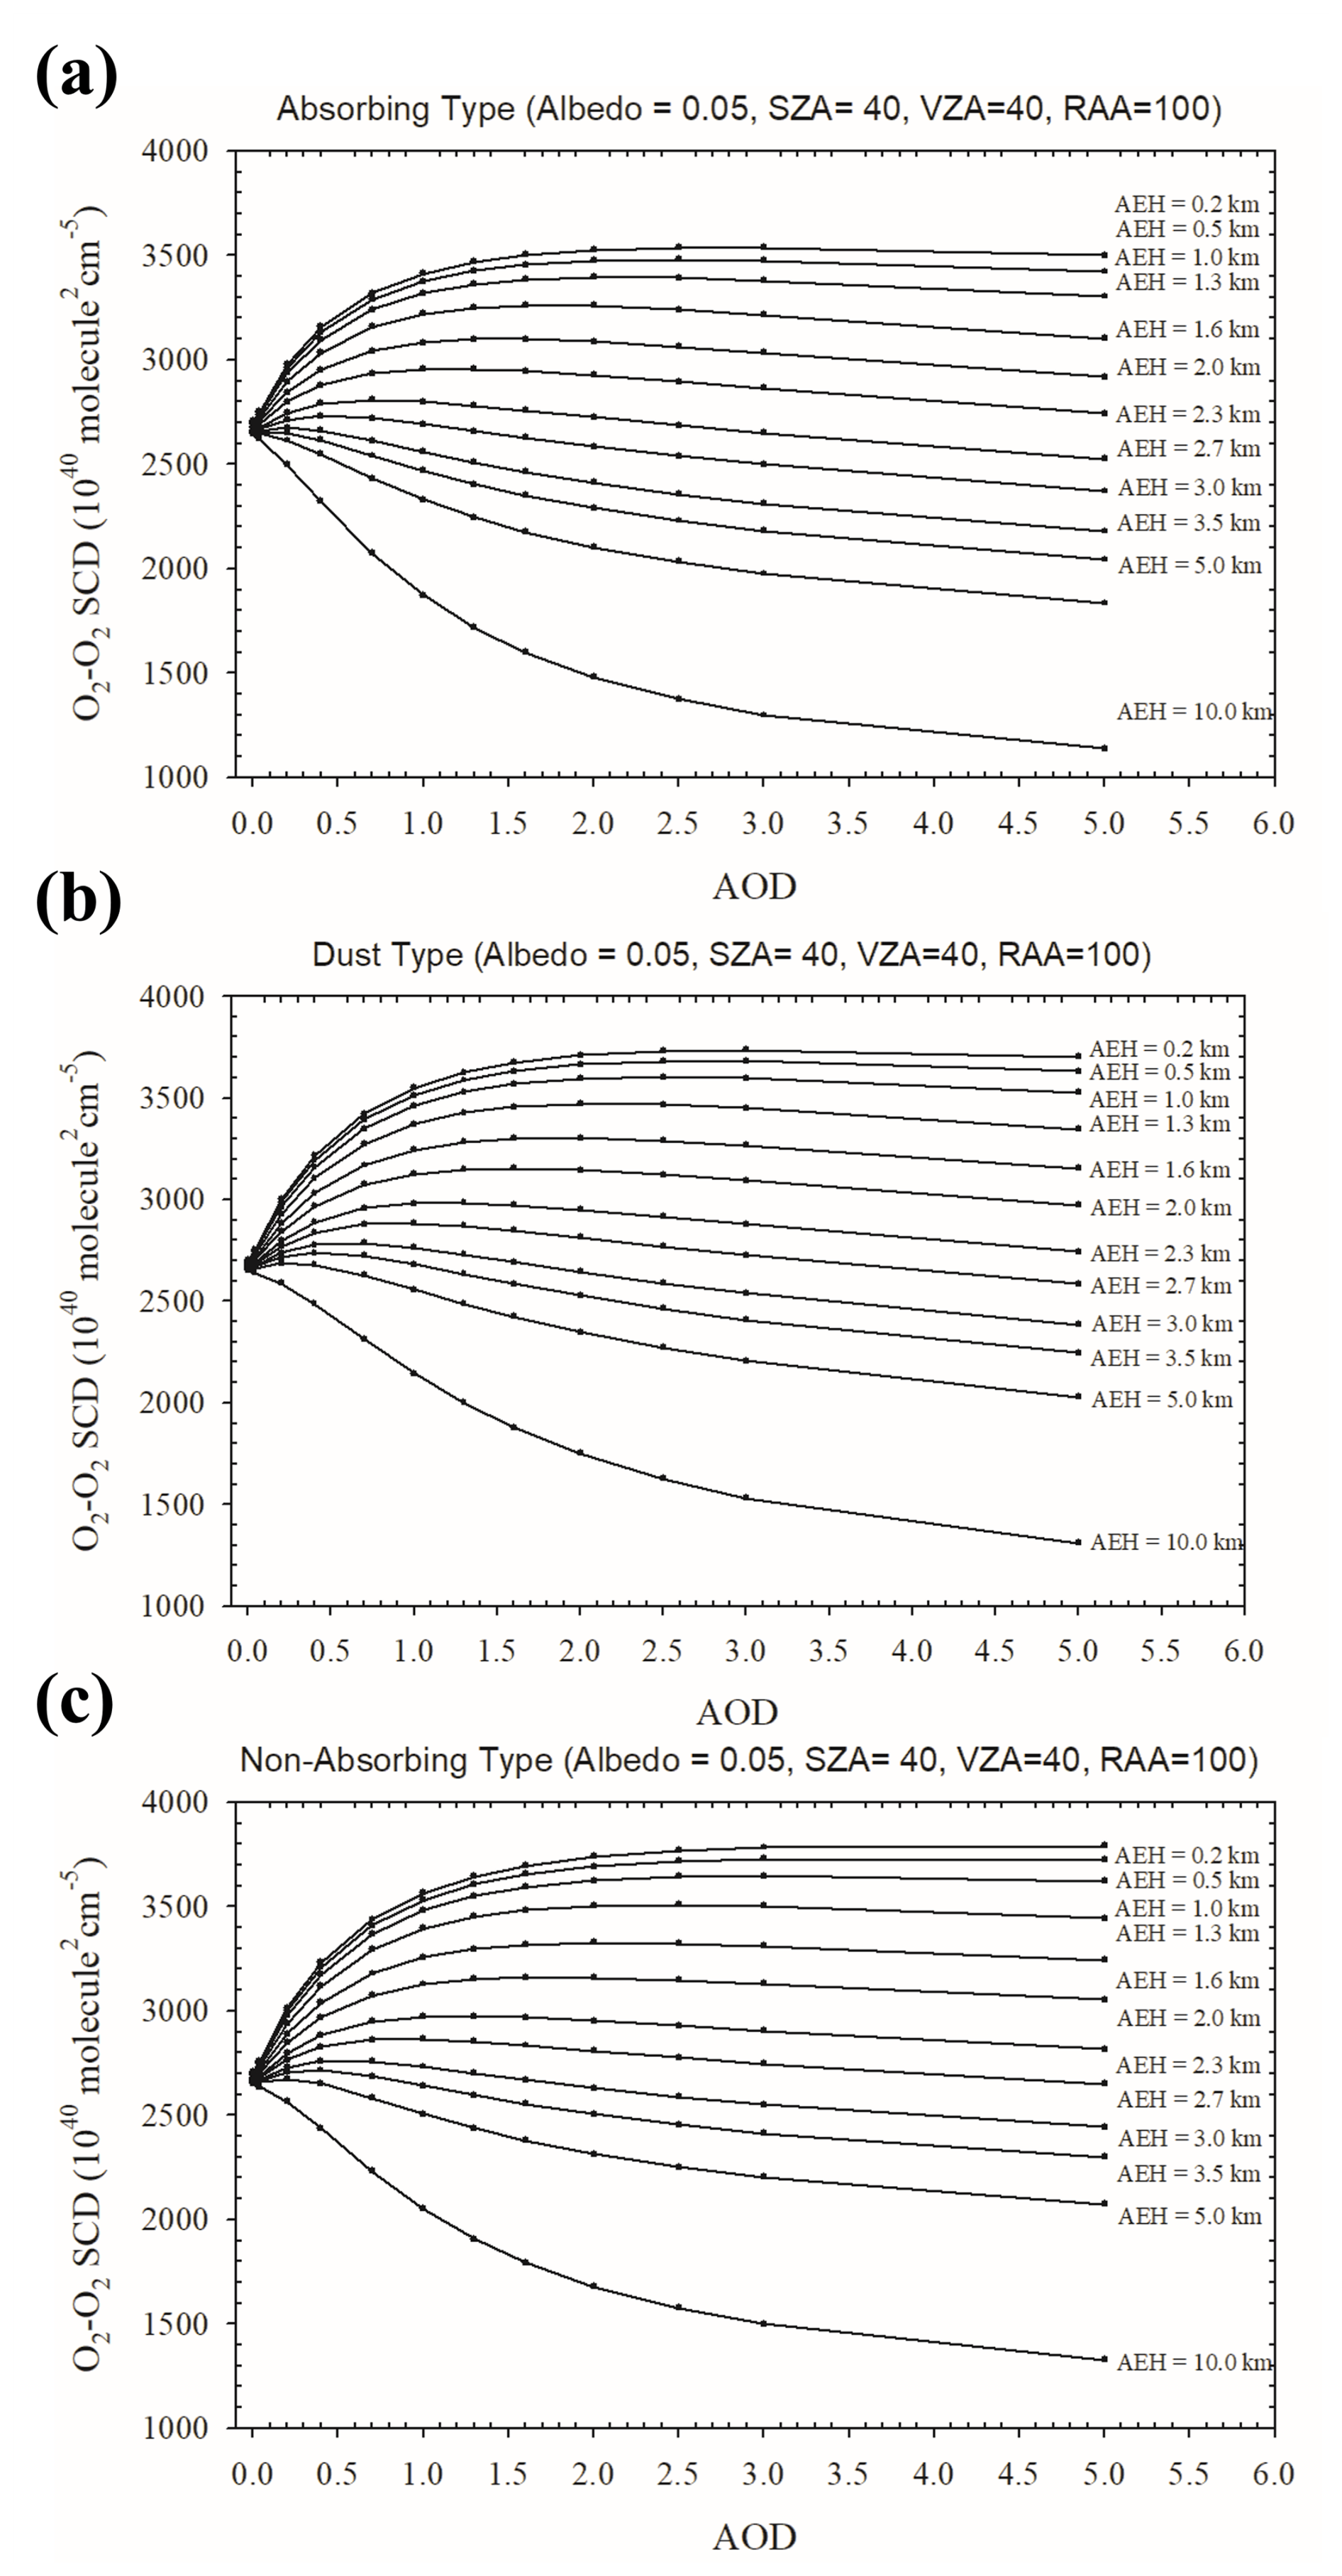
Figure 3O2–O2 SCD dependence as a function of AOD and AEH for (a) absorbing, (b) dust, and (c) non-absorbing aerosol types.
2.3 CALIOP
CALIOP is a spaceborne lidar on board the Cloud–Aerosol Lidar and Infrared Pathfinder Satellite Observations (CALIPSO) to measure vertical information on aerosols and clouds, with an estimation of the optical properties. The CALIOP has two different wavelength channels (532 and 1064 nm) using an Nd:YAG laser to generate signals (Winker et al., 2009). The CALIPSO is in a Sun-synchronous orbit constellated to the A-train with a period of 98.3 min. It crosses the Equator at 13:30 local time on an ascending node. To cover the GEMS observation area, we used CALIOP data from three to four orbits per day. For the vertical information, the resolution for vertical sampling is 30 m below 8 km altitude and 60 m from 8 to 20 km altitude. Although the CALIOP retrieves data with extremely high horizontal and vertical resolutions, the spatial coverage is narrow because the footprint of the CALIOP is about 90 m at the Earth's surface. In this study, the data from the Level 2 aerosol profile product (APro, version 3.41) were used (Tackett et al., 2018). The aerosol profile product simultaneously includes both aerosol and cloud optical depth. In addition, extinction quality flag (Extinction_QC_Flag) data show the quality of the extinction profile. In this study, we checked and used the quality flag value at 532 nm for the aerosol extinction coefficient profile data. The AOD from CALIOP is the vertically integrated aerosol extinction coefficient from the surface to the top of the atmosphere, and representative layer height parameters (ALH and AEH) are directly estimated by using the vertical profile of the aerosol extinction coefficient at 532 nm to minimize the spectral discrepancy of aerosol extinction. For the ALH retrieval, we adopted the mean extinction height from the CALIOP extinction coefficient profile (e.g., Koffi et al., 2012; Xu et al., 2019). Similarly, the AEH estimation from CALIOP is also used to the extinction coefficient profile.
2.4 Data selection and colocation
In this study, we used data within 75–145° E for east–west and 5° S–45° N for the north–south direction, which is the observation area of GEMS. From Park et al. (2020), the spatial range of highly coincident AOD is 30–40 km. To ensure that the number of retrieved observation pixels that can be analyzed in this study is sufficiently high, we relax the spatial limits for colocation matching. For spatial colocation, we selected pixels for which the distance between GEMS and CALIOP (or TROPOMI) observations was less than 50 km. In addition, only the closest 10 % of pixels were used. Given the different orbital characteristics of CALIOP (or TROPOMI) and GEMS, temporal colocation was also considered. During the period of image scanning from east to west over Asia by GEMS, CALIOP and TROPOMI pass through the GEMS observation area from south to north every 98.3 min. On average, two low-Earth orbit (LEO) satellites make three to four orbits through the GEMS scan area during a single day of daytime observation. To consider these different orbital characteristics, only observations taken within ± 1 h of the GEMS observation time were selected for temporal colocation. As GEMS observes hourly, colocated pixels between the two satellites shift from east to west over time.
To ensure the accuracy of ALH from TROPOMI, only pixels with quality assurance (QA) values of 1.0 were used. To minimize cloud contamination, the TROPOMI ALH product uses the VIIRS cloud mask information and cloud parameters from the Fast Retrieval Scheme for Clouds from the Oxygen A-band (FRESCO). To consider cloud contamination for the aerosol products, in addition, the VIIRS cirrus cloud reflectance (viirs_cirrus_ reflectance < 0.4), VIIRS cloud mask (viirs_cloud_mask < 0.1), and cloud fraction from the FRESCO (cloud_fraction < 0.1) are considered in this study (Michailidis et al., 2023). However, de Graaf et al. (2024) showed that respective cloud-masking methods have difficulty detecting various clouds. For this reason, cloud contamination remains a critical source of uncertainty in the ALH retrieval. From previous studies, the UVAI is used to detect the presence of absorbing aerosol (e.g., Chen et al., 2021; Griffin et al., 2020; Michailidis et al., 2023; Sanders et al., 2015), and the aerosol height information was only retrieved on the absorbing aerosol pixels. However, the GEMS aerosol product retrieves not only absorbing aerosols, but also non-absorbing aerosols. For this reason, the pixels for which an AOD at 443 nm (AOD443 hereafter) taken from the GEMS aerosol product exceeds 0.3 are selected for AEH retrieval.
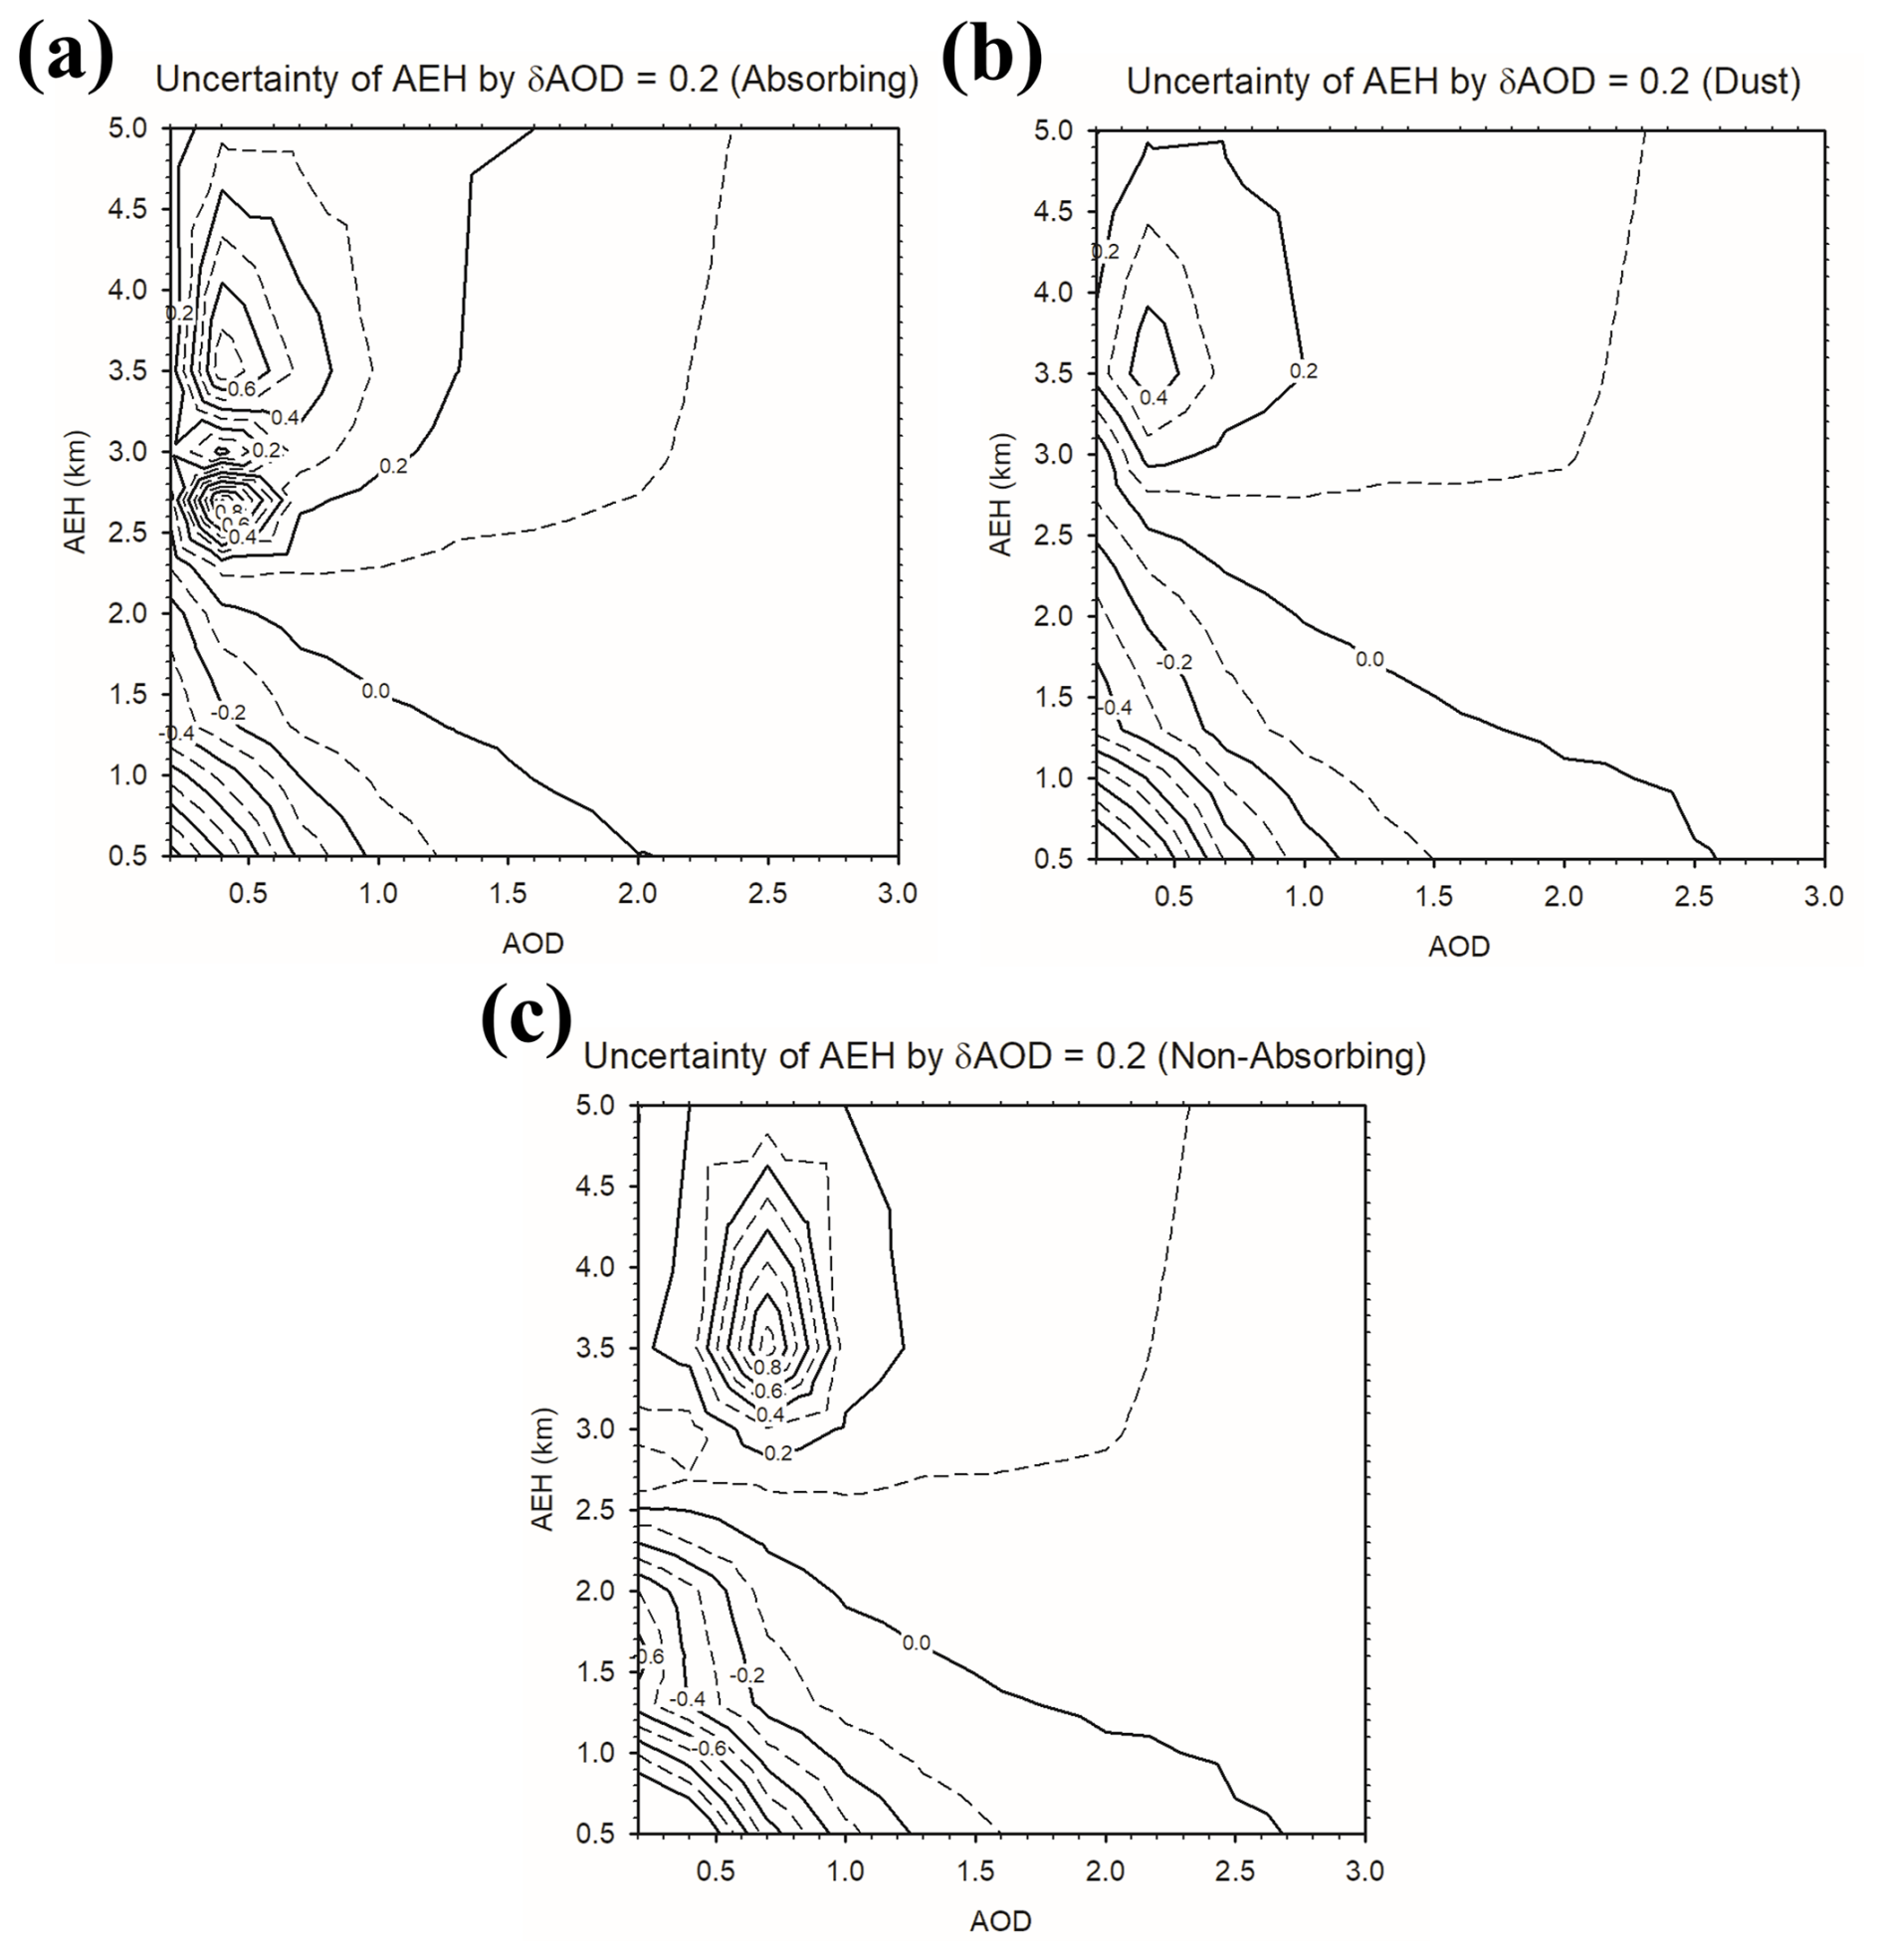
Figure 4AEH retrieval uncertainty due to the AOD error of 0.2 for cases with (a) absorbing, (b) dust, and (c) non-absorbing aerosol types.
AEH is a layer height parameter that considers the penetration of photons into the aerosol layer. It is defined such that the integral of the vertical aerosol extinction profile from the surface to the AEH is equal to () × AOD, as defined by Park et al. (2016). Numerous previous studies have used the aerosol top layer height (Kokhanovsky and Rozanov, 2010) or middle layer height (i.e., ALH or centroid height) (e.g., Sanders et al., 2015; Nanda et al., 2020) as the aerosol vertical layer parameter. AEH is similar to the aerosol top layer height but with a slight bias.
For AEH retrieval, the vertical distribution assumption is also important. The Gaussian density fitting (GDF) distribution, which is a modified Gaussian distribution structure considering the range of upper and lower boundary height, is assumed for AEH retrieval. The full-width at half-maximum (FWHM) of the aerosol layer is assumed to be 1 km. A schematic description of AEH and other aerosol vertical parameters is shown in Fig. 1. Based on the assumptions about the aerosol vertical distribution, the AEH value is higher than the peak height of the Gaussian distribution and lower than the aerosol top layer height. Otherwise, the ALH is defined as the integral of the vertical aerosol extinction profile from the surface to the ALH and is equal to 0.5 × AOD. This assumption is used by Nanda et al. (2016). Therefore, the ALH equals the peak height of the profile in the conditions shown in Fig. 1.
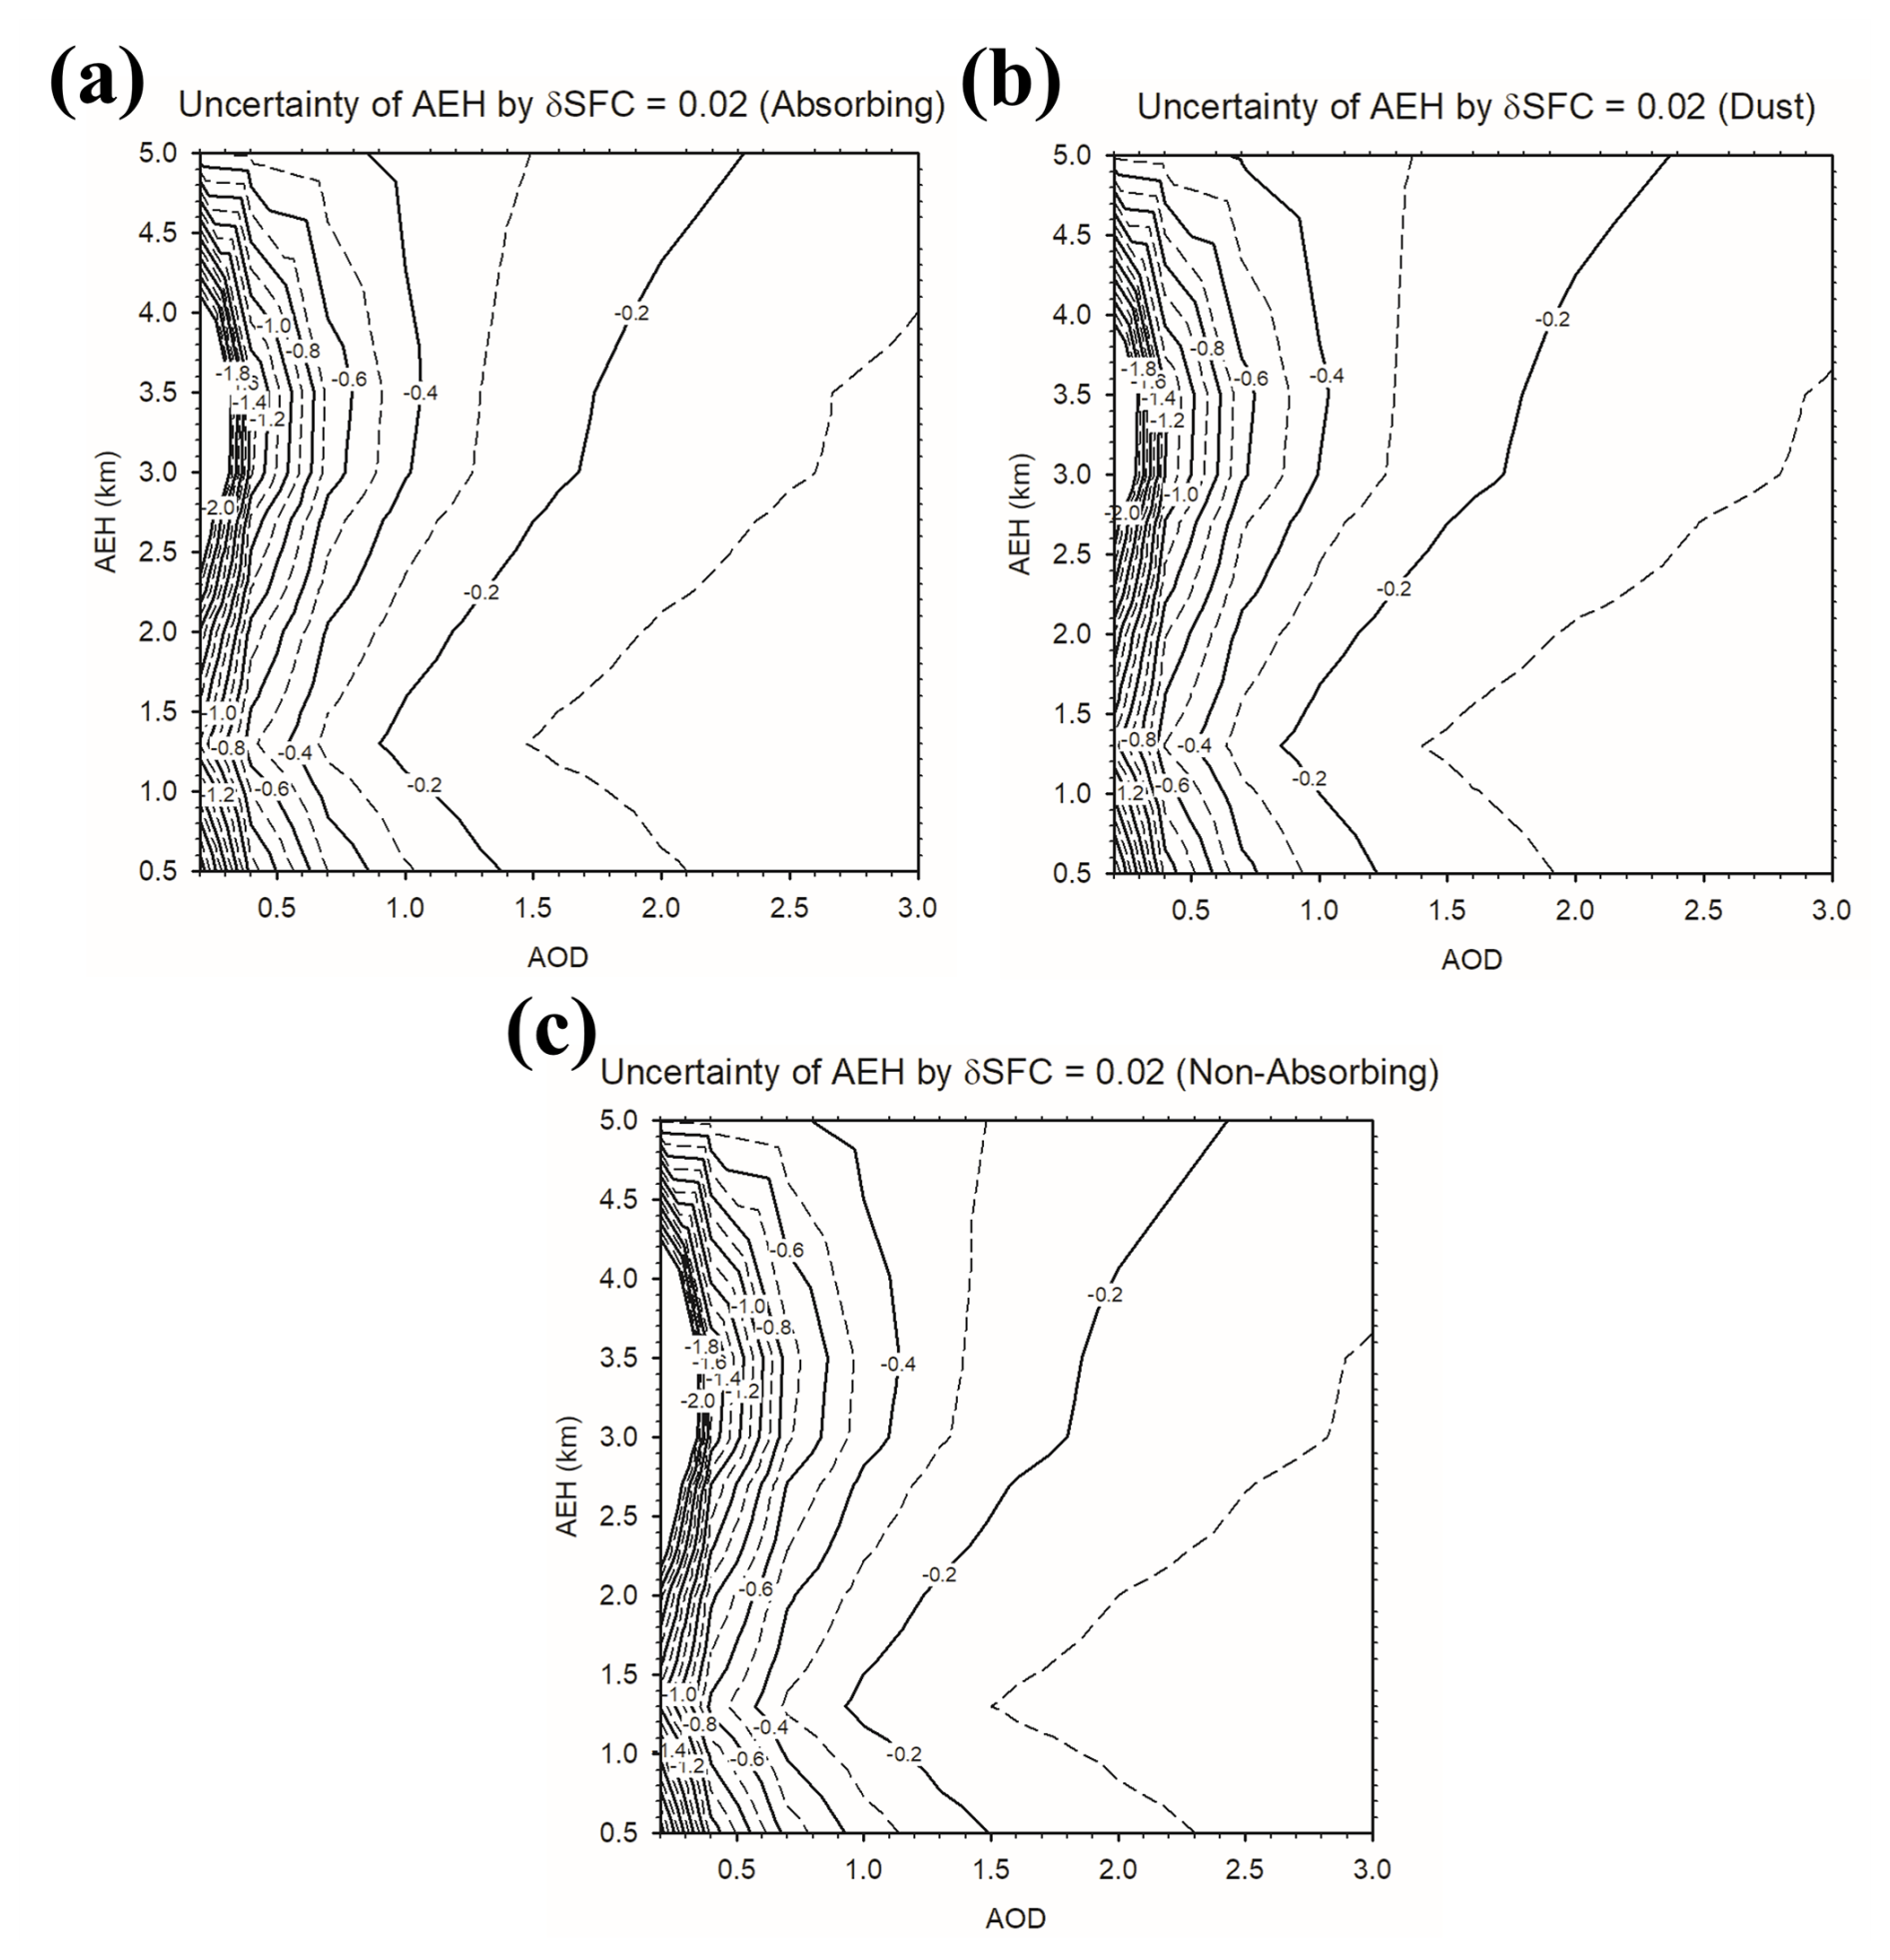
Figure 5AEH retrieval uncertainty due to the surface reflectance error of 0.02 for cases with (a) absorbing, (b) dust, and (c) non-absorbing aerosol types.
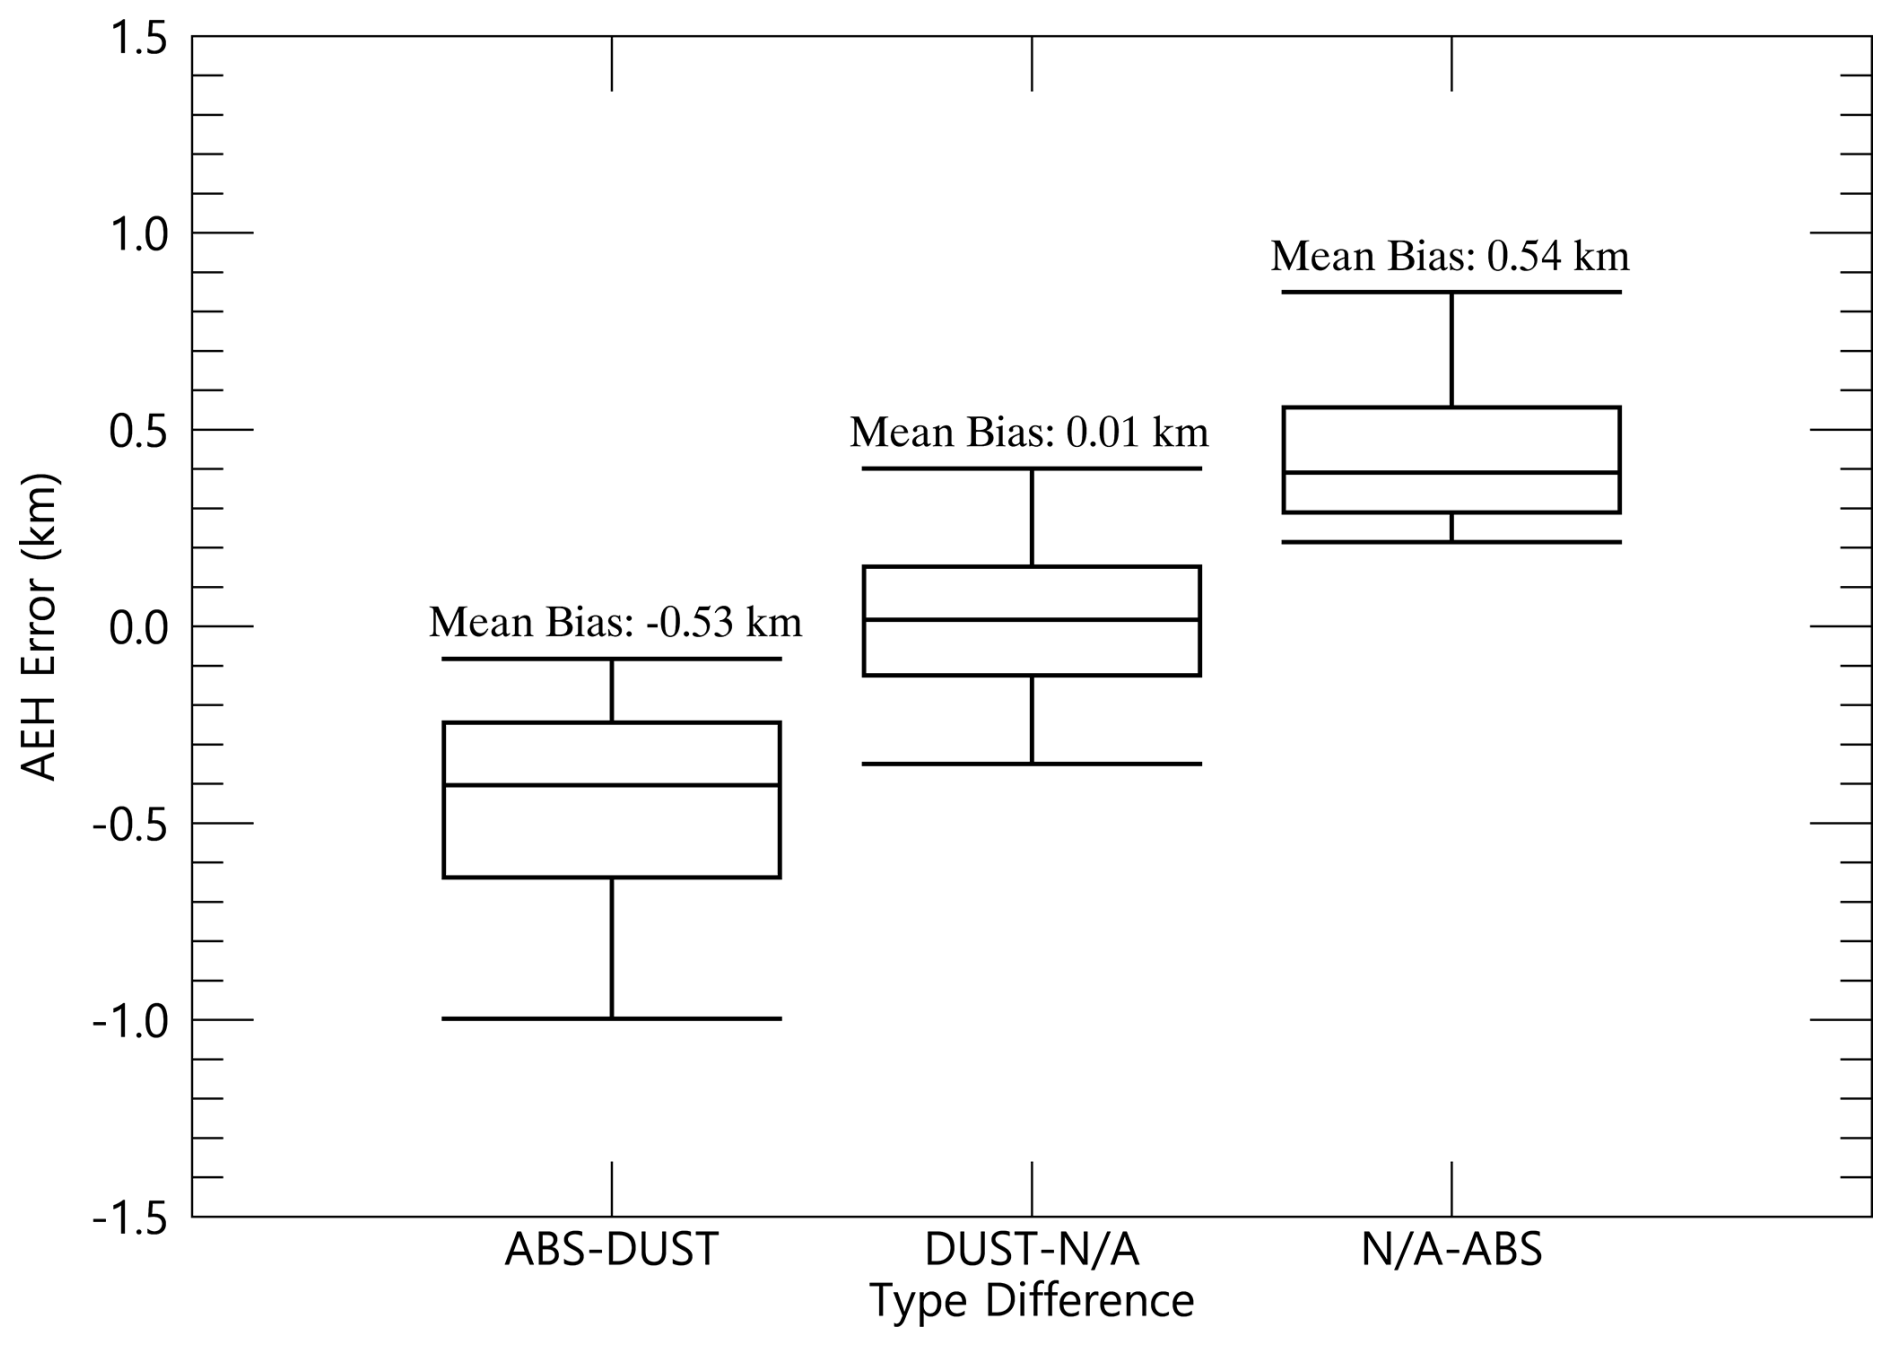
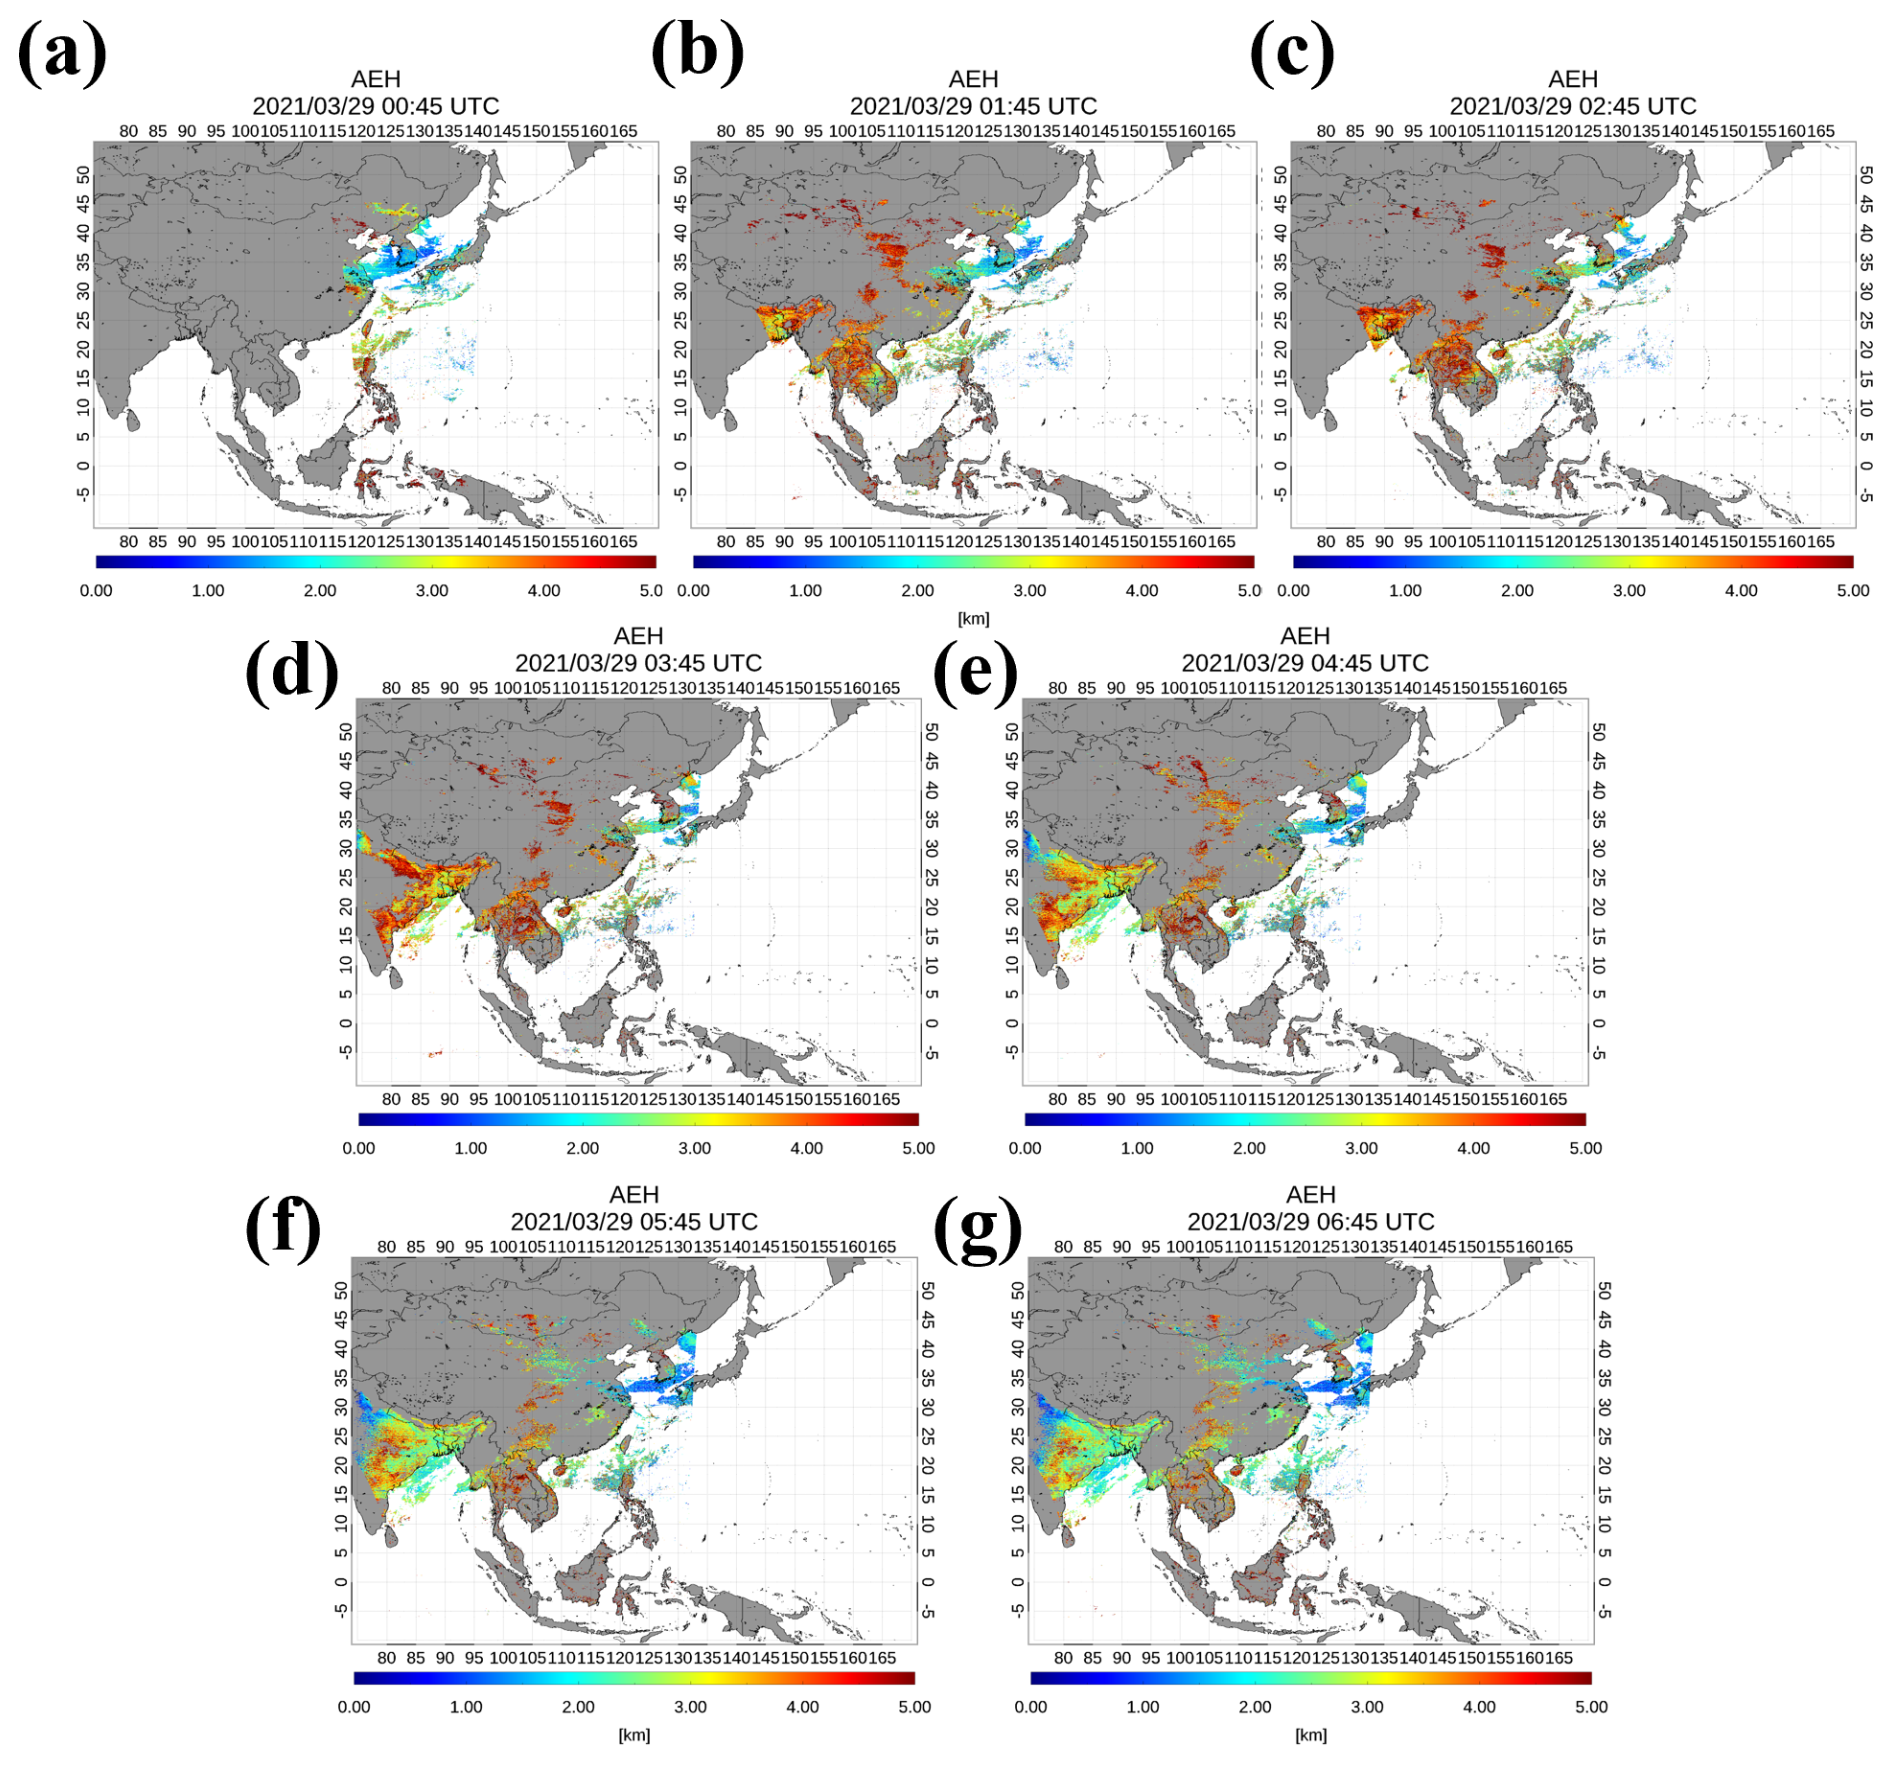
Figure 7Case study results for AEH based on GEMS observations on 29 March 2021 at (a) 00:45 UTC, (b) 01:45 UTC, (c) 02:45 UTC, (d) 03:45 UTC, (e) 04:45 UTC, (f) 05:45 UTC, and (g) 06:45 UTC.
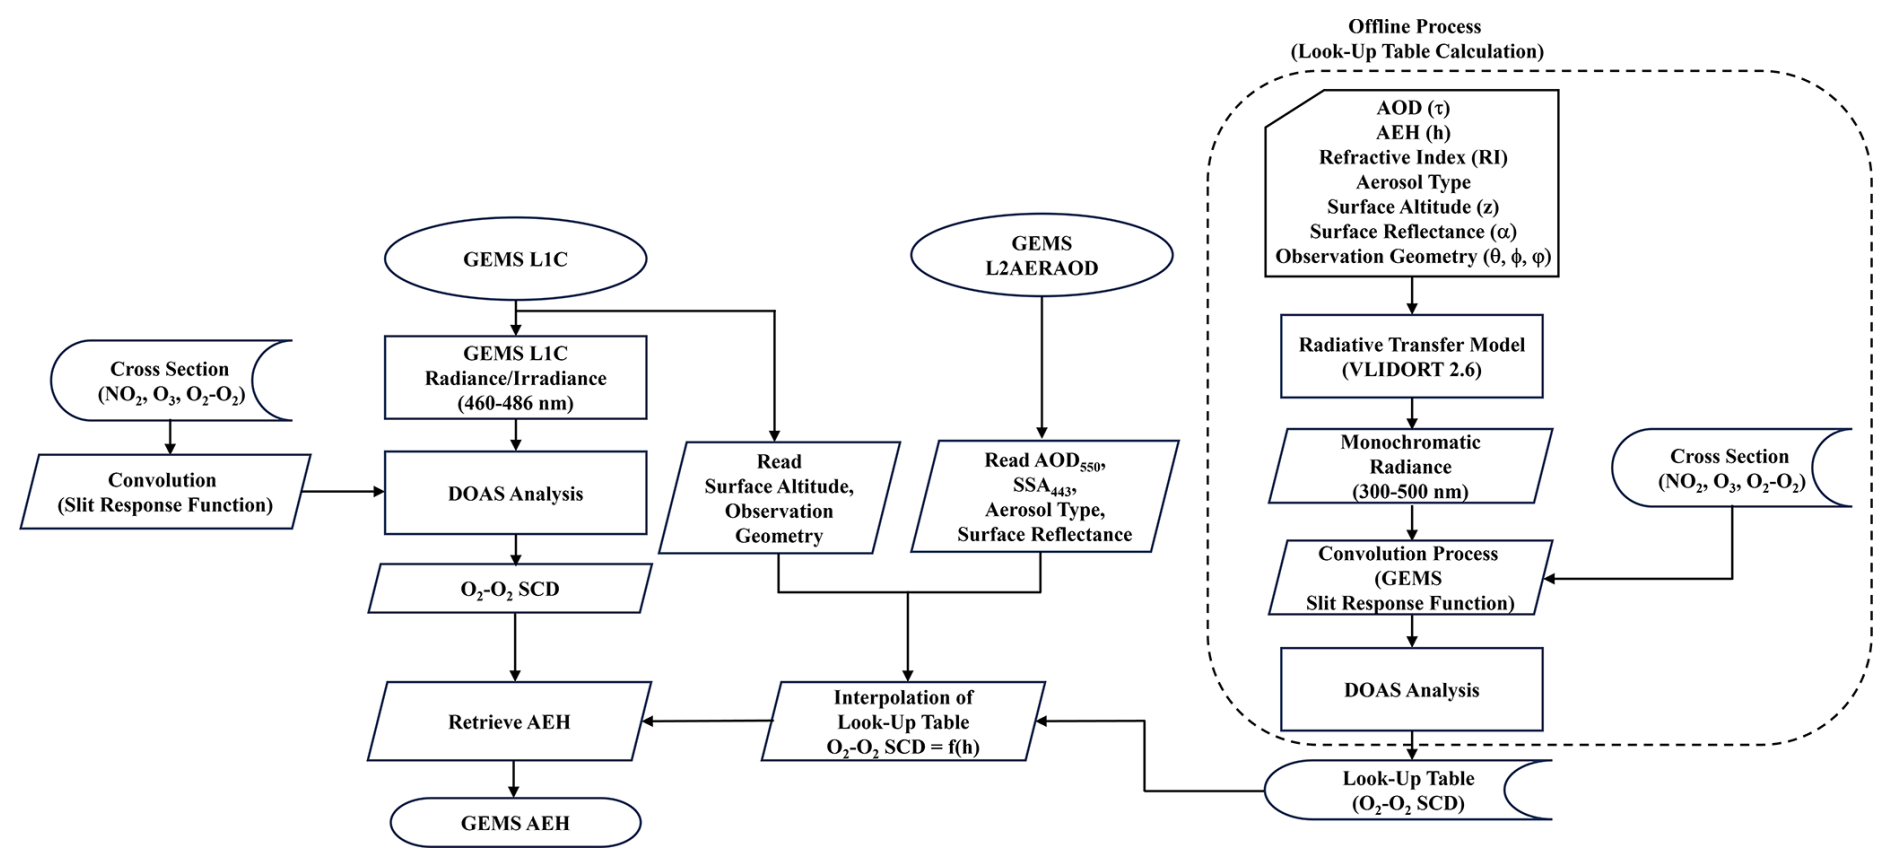
For AEH retrieval, the basic idea is the identification of changes in optical path length caused by effective aerosol layer height variation. To measure the optical path length change, O2–O2 slant column density (SCD) retrieved by the differential optical absorption spectroscopy (DOAS) method was used because the spectral coverage is limited to 300–500 nm (Park et al., 2016; Kim et al., 2020). In the GEMS product, the O2–O2 SCD at the 477 nm absorption band is the most useful absorption band because this absorption band is the strongest absorption band within the GEMS spectral observation range. Figure 2 shows the overall flowchart of the AEH algorithm for the GEMS satellite. The AEH algorithm for GEMS employs a look-up table (LUT) that contains O2–O2 SCD values for many scenarios with a variety of observation geometries (solar zenith angle, SZA – θ; viewing zenith angle, VZA – Φ; relative azimuth angle, RAA – φ), surface altitude (z), surface reflectance (α), AOD (τ), AEH (h), refractive index (RI) for SSA, and aerosol type. During the radiance simulation, the radiance is monochromatically simulated and then convolved with the GEMS instrument spectral response function. Finally, the radiance information is converted to the O2–O2 SCD from the differential optical absorption spectroscopy (DOAS) method (Platt, 1994).
The DOAS method has been frequently used to estimate the quantity of trace gases (i.e., SCD of trace gas) from ground (e.g., Cheng et al., 2023; Irie et al., 2008; Platt and Stutz, 2008; Wagner et al., 2011; Wang et al., 2017) and satellite (e.g., Kwon et al., 2019; Li et al., 2023; Wagner et al., 2007, 2010) measurements. Detailed DOAS fitting parameters and setting information are provided in Table 1 for the estimation of O2–O2 SCD from both the simulation and observation data. For the O2–O2 SCD estimation at 477 nm, the fitting window ranges from 460 to 486 nm to cover the full absorption structure of O2–O2. Within the fitting window, the absorptions of NO2 and O3 are significant. To describe these two absorbing species, temperature-dependent cross-section information is adopted. The temperature-dependent cross-section setting considers the stratosphere and troposphere simultaneously.
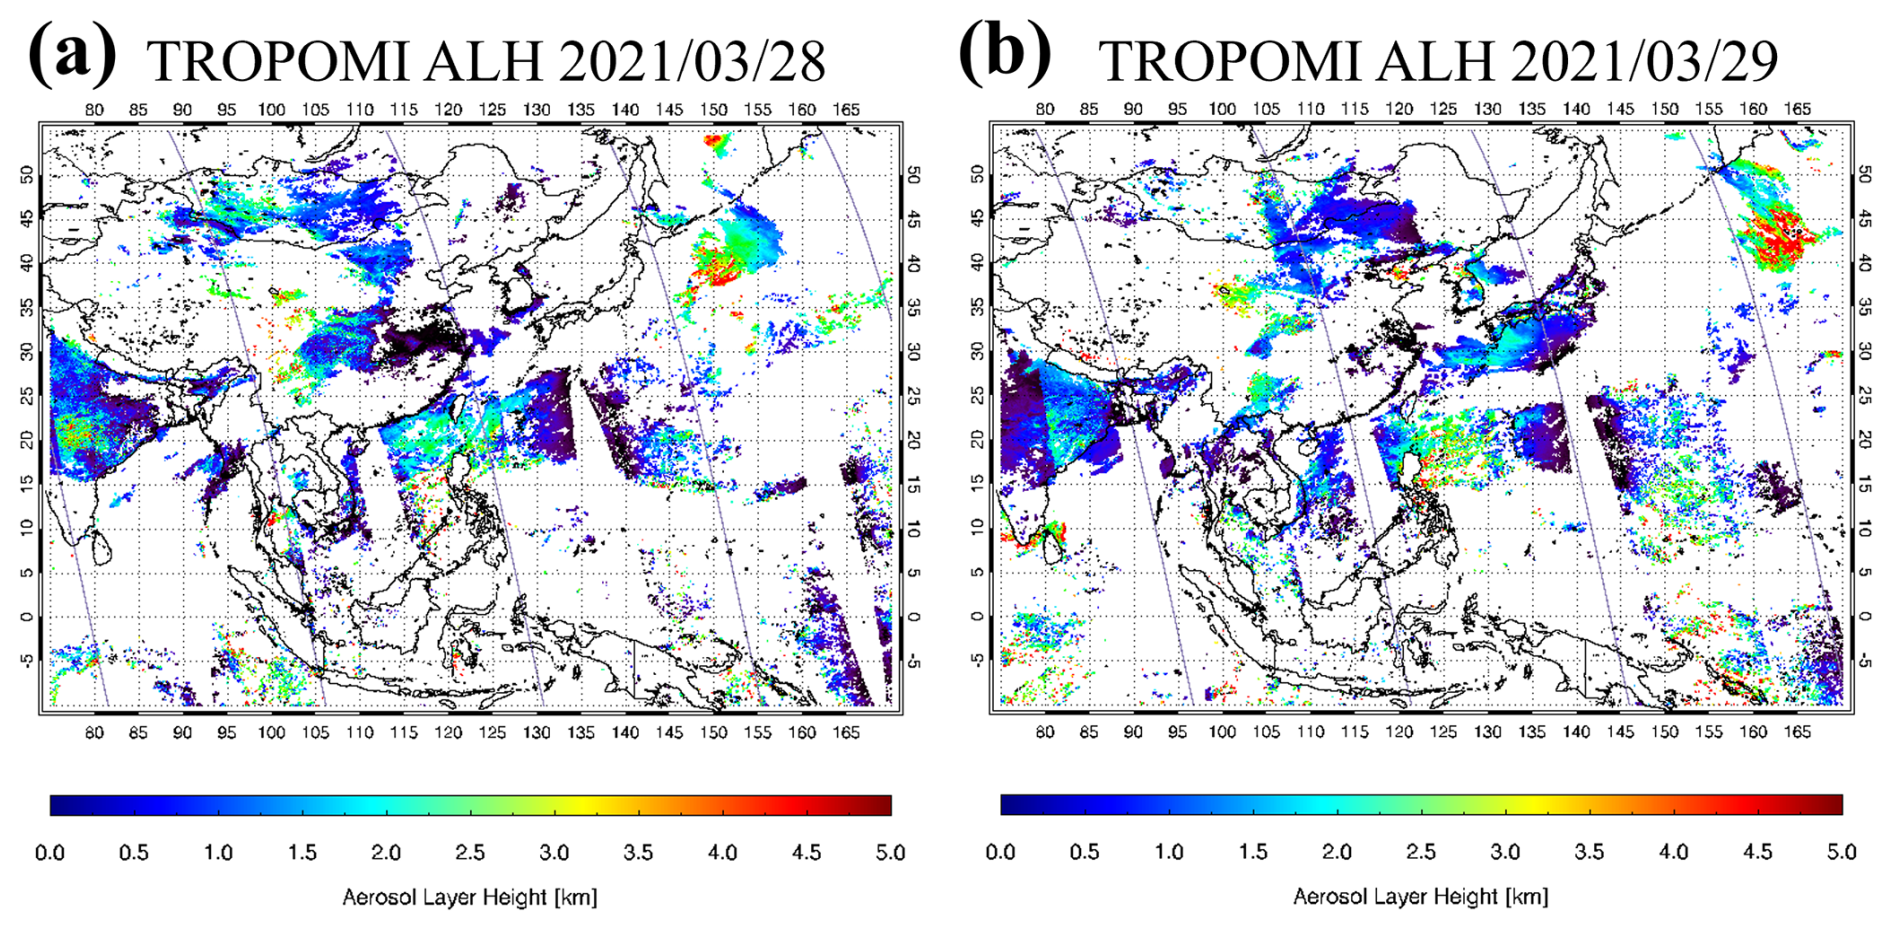
Figure 8ALH retrieved from TROPOMI and the orbit path of CALIOP on (a) 28 March and (b) 29 March 2021 (unit: km).
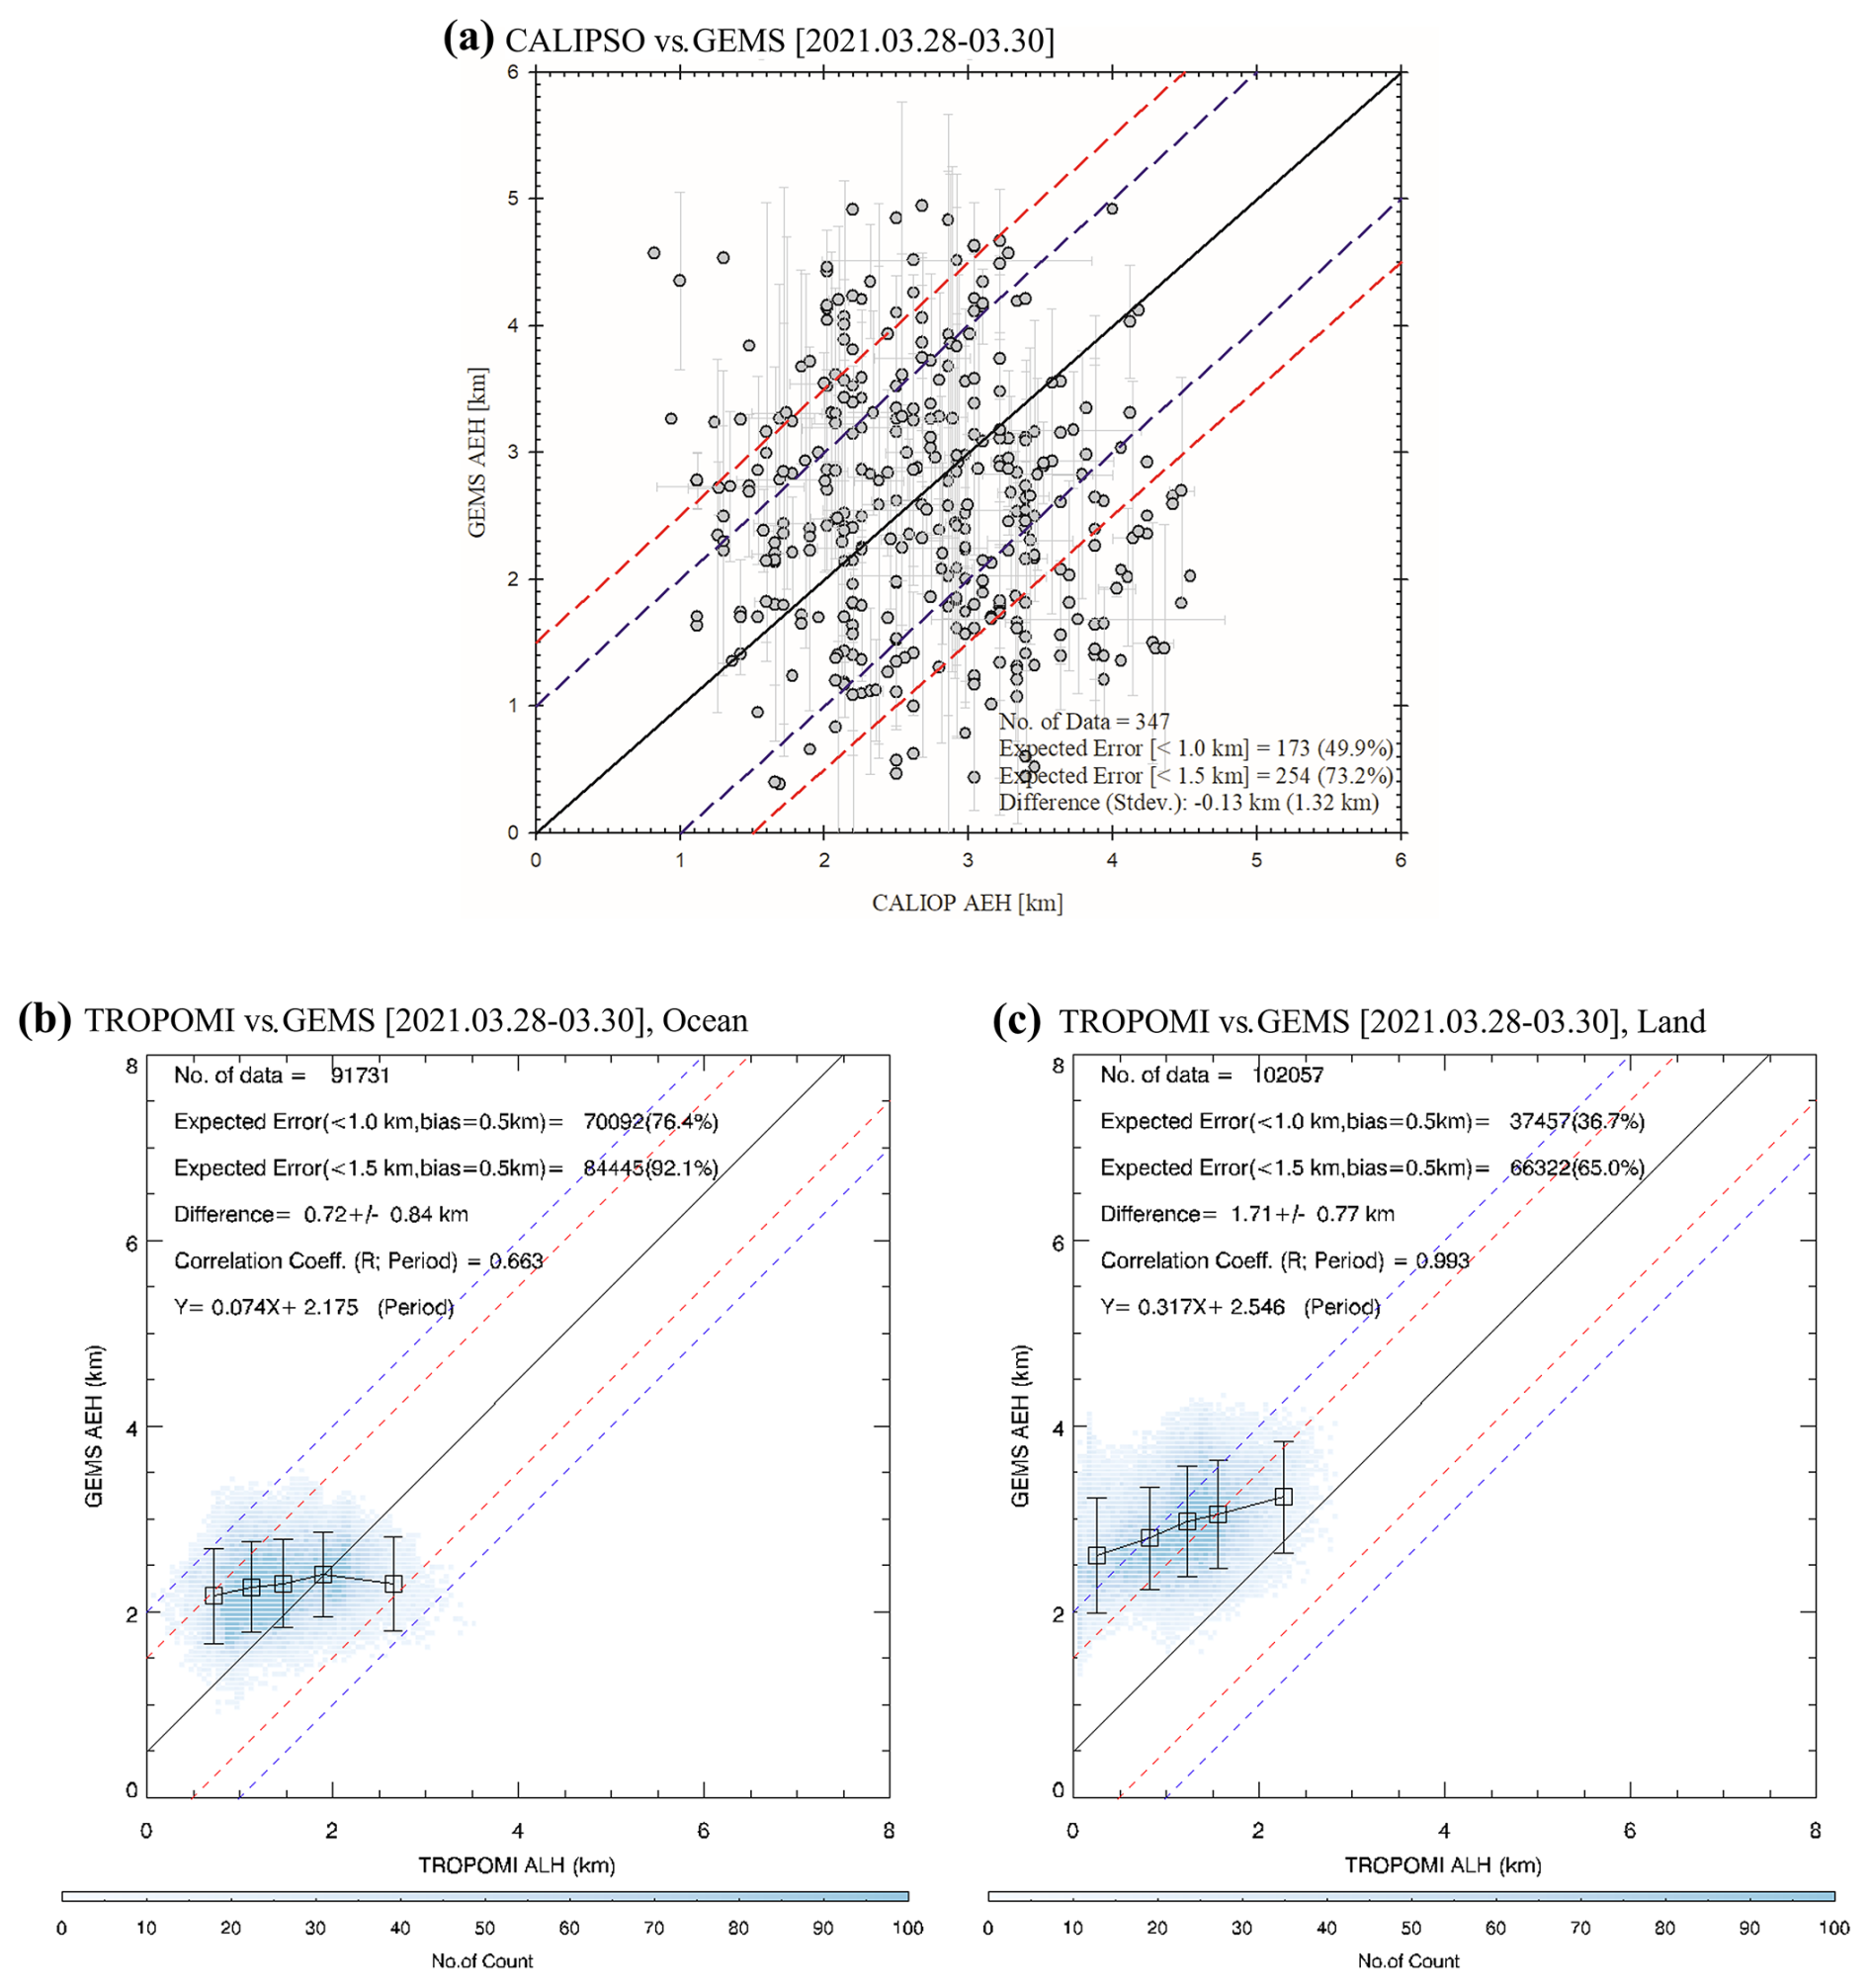
Figure 9Intercomparison of (a) AEH between CALIOP and GEMS as well as (b) ALH from TROPOMI and AEH from GEMS over ocean and (c) over land (the black box and error bar represent the mean and standard deviation in 20 % intervals of each TROPOMI ALH) over the period from 28 to 30 March 2021.
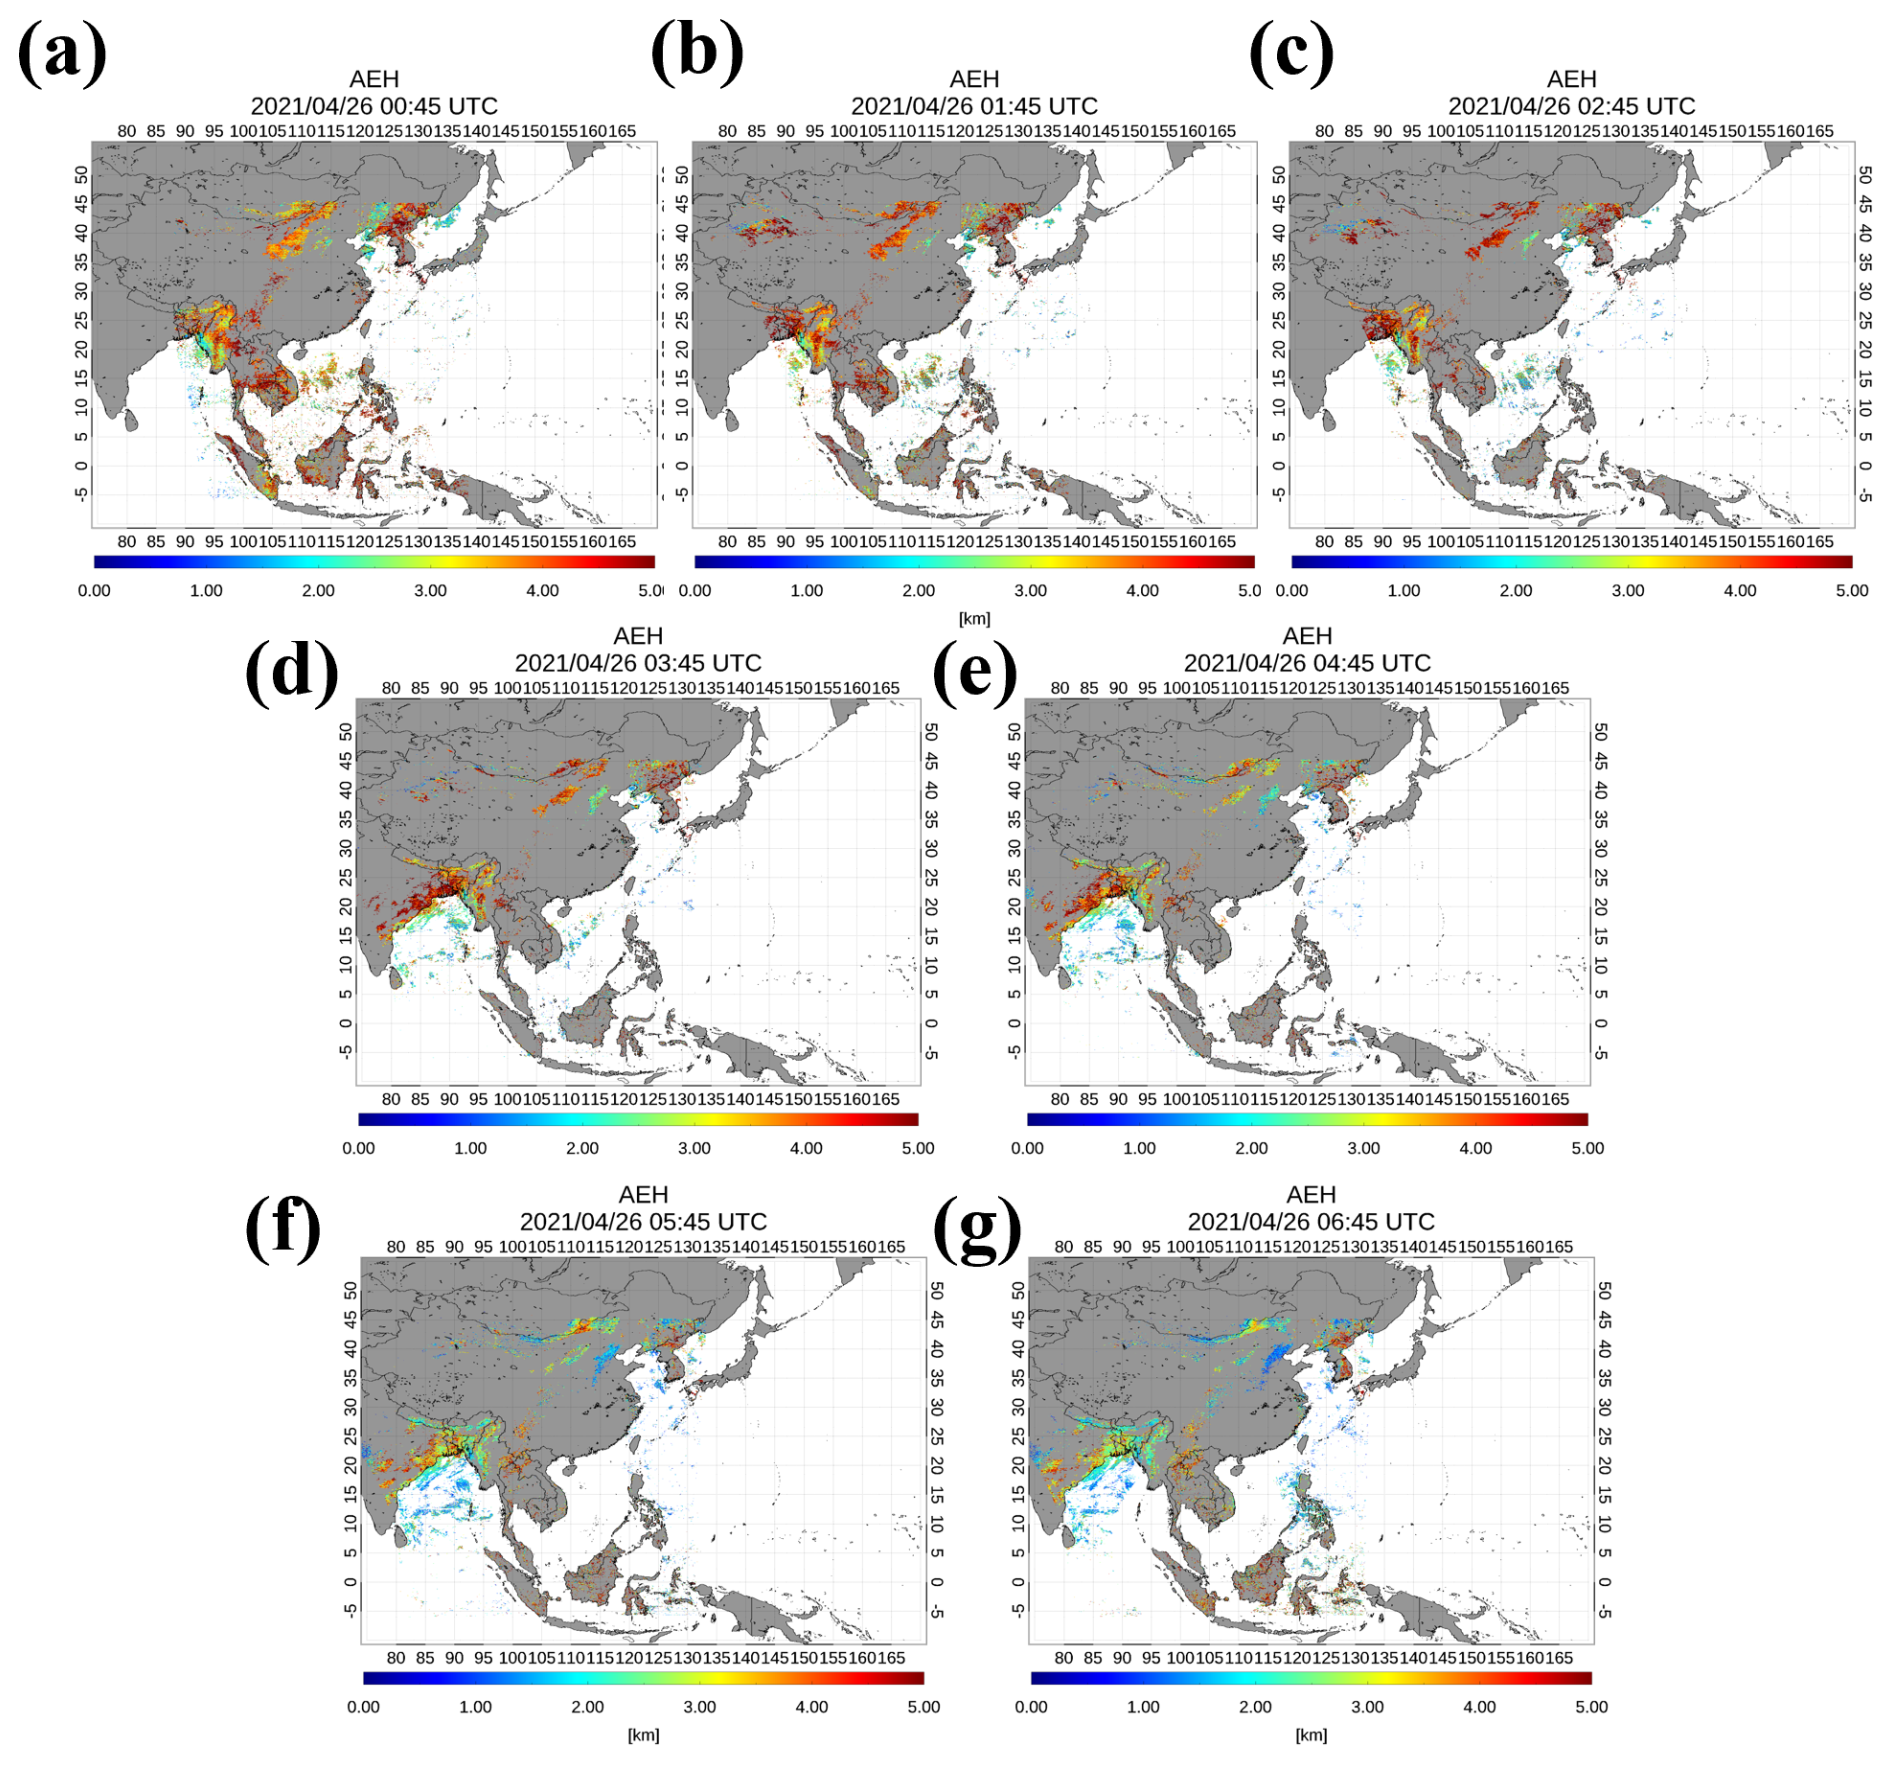
Figure 10Case study results for AEH based on GEMS observations on 26 April 2021 at (a) 00:45 UTC, (b) 01:45 UTC, (c) 02:45 UTC, (d) 03:45 UTC, (e) 04:45 UTC, (f) 05:45 UTC, and (g) 06:45 UTC.
To minimize the noise effect and improve DOAS fitting quality, the optimal settings for fitting were also analyzed. Table 2 shows ratios of O2–O2 SCD error to the O2–O2 SCD for various polynomial and bias orders from observed radiance. The polynomial and offset are basic fitting parameters for the DOAS fitting. The two parameters describe the broadband spectral feature of radiance before identifying the gas absorption structure. The ratio between SCD error and the SCD of O2–O2 is important to determine the AEH retrieval quality. When the fitting error increases, the uncertainty of AEH is also enhanced during the retrieval. The smallest AEH fitting errors are obtained by a DOAS fit with a second-order polynomial and an offset of “none”. These settings are used in the GEMS AEH algorithm.
In estimating AEH, other aerosol characteristics, including AOD and aerosol optical properties, affect retrieval accuracy. Park et al. (2016) have shown that the largest contributor to the AEH uncertainty is associated with the uncertainty in SSA. In addition, the AEH retrieval uncertainty due to error in the aerosol optical properties (e.g., AOD and phase function) and surface reflectance has a dependence on observation geometries. After the estimation of O2–O2 SCD, for this reason, conversion from O2–O2 SCD to AEH is an essential process. Table 3 shows dimensions of the LUT for the AEH retrieval algorithm. To calculate the LUT, the linearized pseudo-spherical Vector Discrete Ordinate Radiative Transfer (VLIDORT) model version 2.6 was used (Spurr, 2013). During the radiative transfer model simulation, the reference wavelength for the SSA and AOD is assumed to be 440 nm. The aerosol type is defined by the radiative absorptivity and particle size information. The aerosol type is classified as absorbing, dust, and non-absorbing aerosol. Absorbing and non-absorbing aerosol types are assumed to be the fine-mode-dominant particles. For the spectral conversion of AOD, Ångström exponents of 1.186, 0.222, and 1.179 are used for absorbing, dust, and non-absorbing aerosol, respectively. The SSA is assumed to be spectrally constant within the spectral range for O2–O2 estimation. Although the spectral O2–O2 absorption band is around 477 nm, the spectral discrepancy between the reference wavelength for aerosol optical properties and the center wavelength of O2–O2 absorption is assumed to be ignored in this study. After calculating spectral radiance with 0.1 nm sampling, the convolution with the GEMS slit response function was applied, and the spectra were sampled on the spectral grid of the GEMS radiance data (Level 1C) prior to the DOAS fitting. Radiative transfer calculations were performed accounting for the temperature dependence of the absorption cross-section for O2–O2 (e.g., Park et al., 2017).
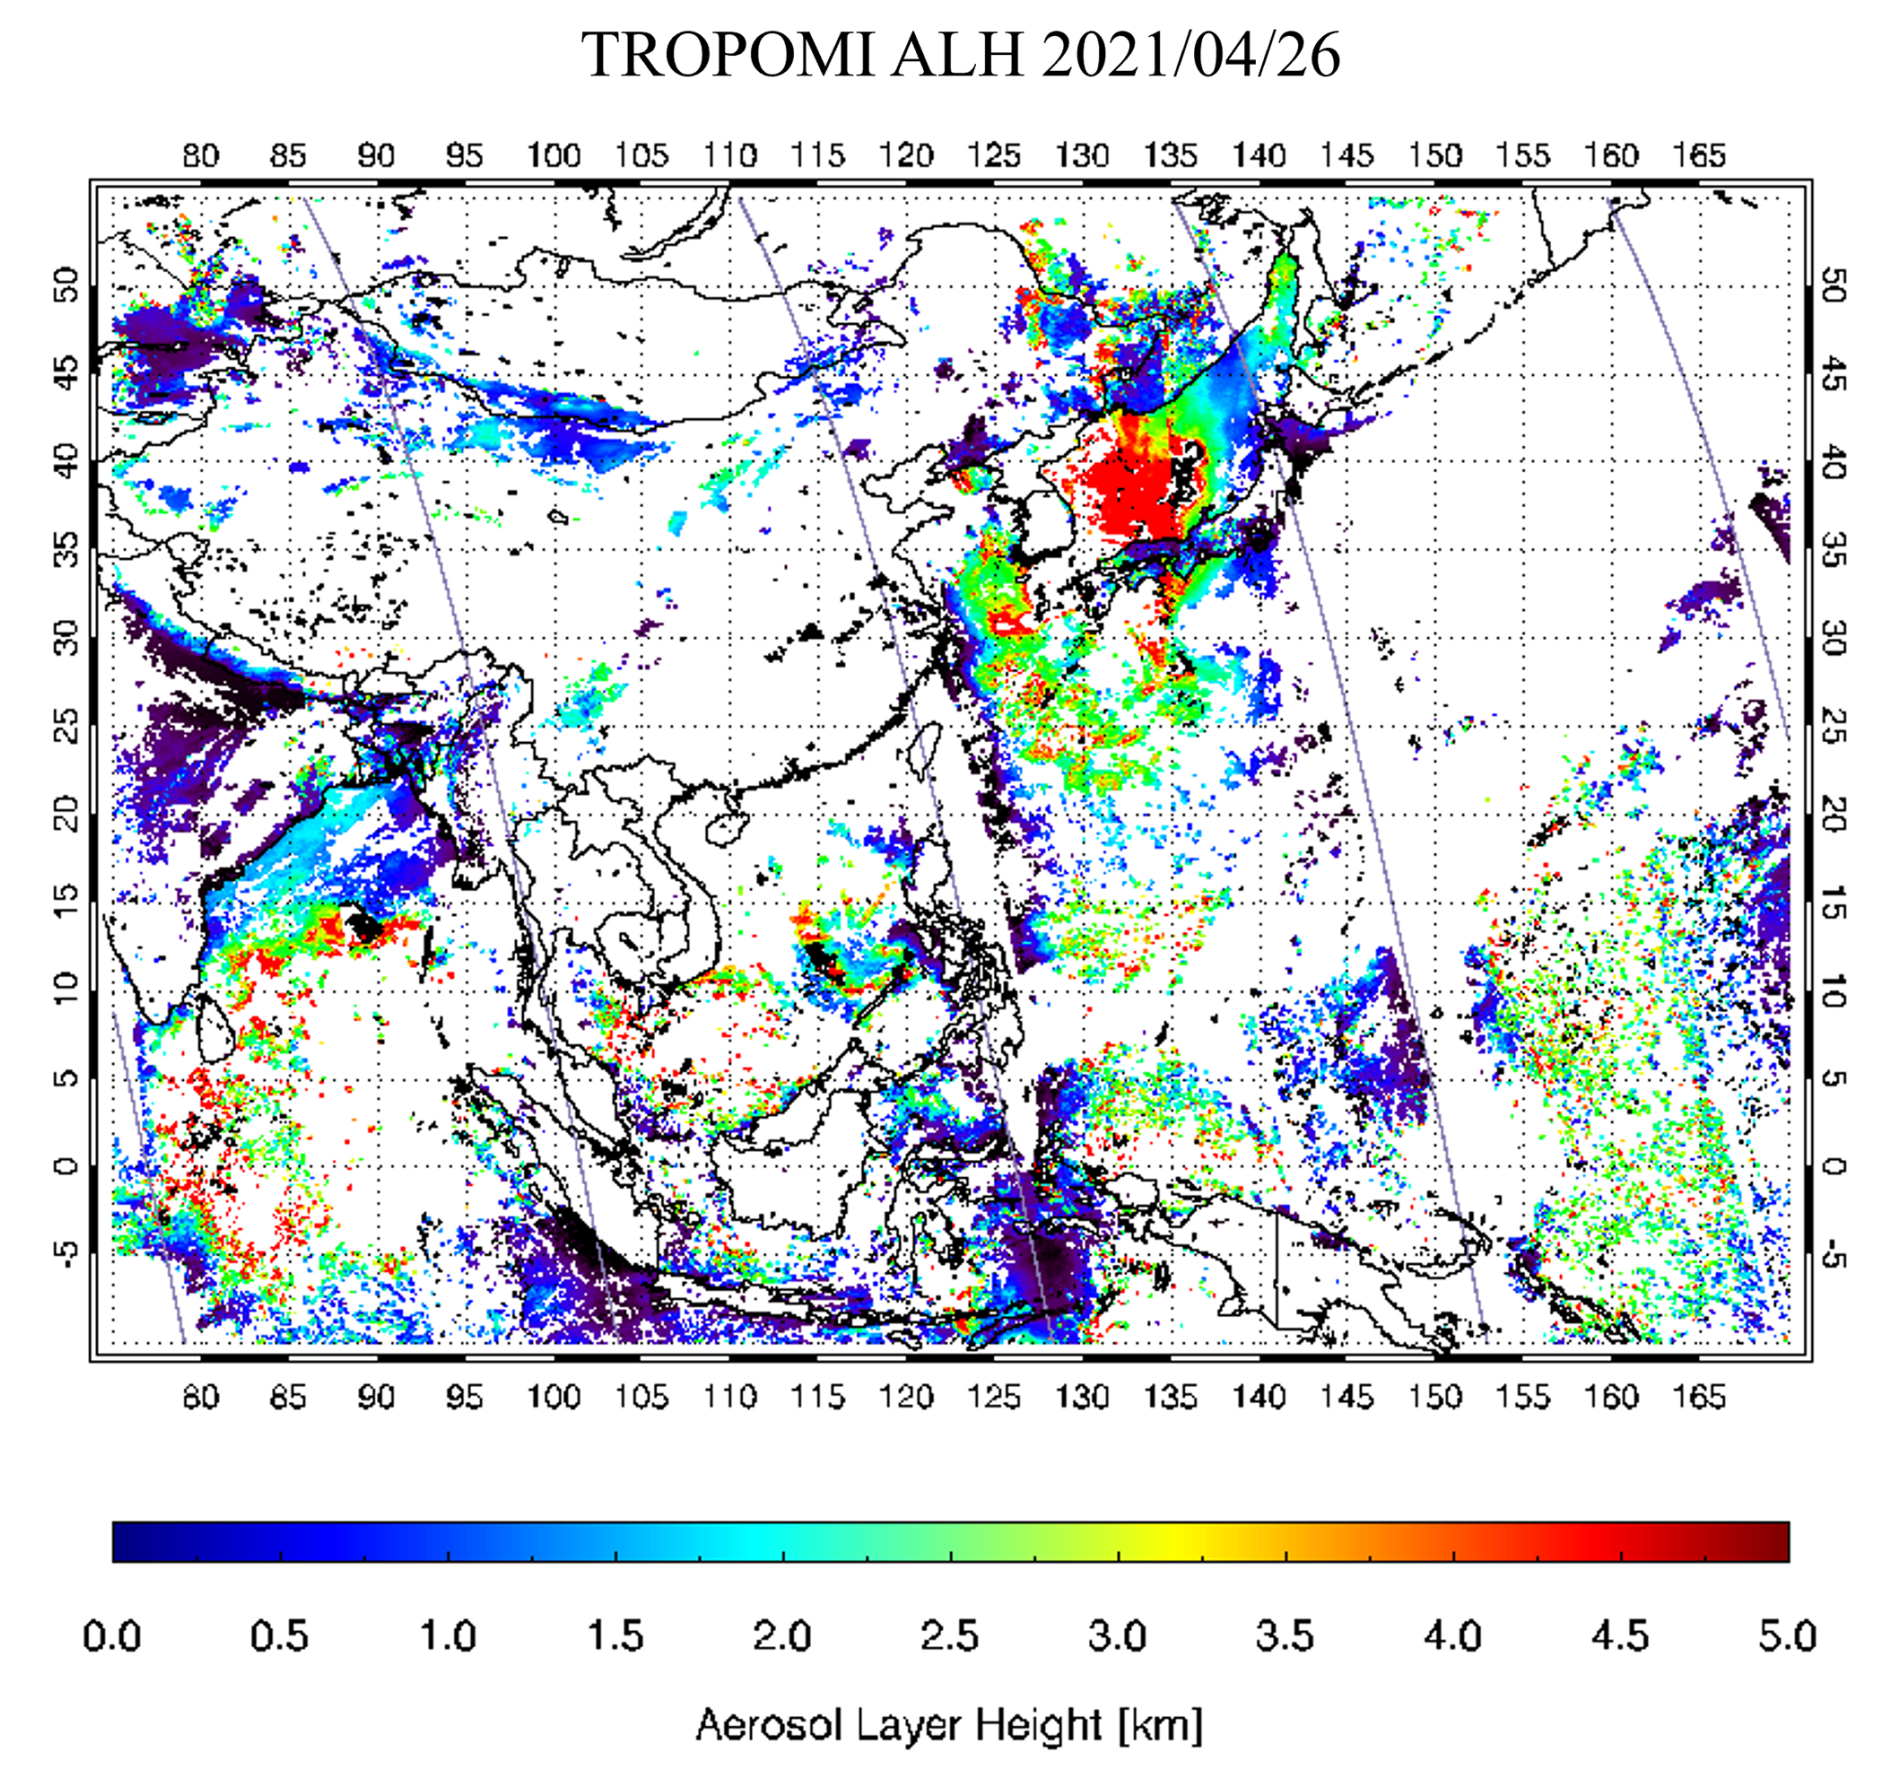
Figure 11ALH retrieved from TROPOMI and the orbit path of CALIOP on 26 April 2021 (unit: km).
Figure 3 shows the example of O2–O2 SCD dependence as a function of AOD and AEH from the LUT according to the respective aerosol types and AOD. O2–O2 SCD decreases with increasing AEH for all aerosol types and AOD (Park et al., 2016). Similar to previous studies, the O2–O2 SCD sensitivity is enhanced at high AOD and in absorbing aerosol cases from GEMS LUT. In addition, the contrast of O2–O2 SCD is greater for absorbing aerosols than non-absorbing aerosols. While the radiance is passing through the aerosol layer, the absorbing aerosol more efficiently absorbs the radiance. For this reason, the effective optical path length is significantly shorter for absorbing aerosols.
The AEH algorithm used the GEMS operational AOD and surface reflectance. However, those retrieval results include uncertainties. Figure 4 shows the AEH retrieval uncertainty based on the O2–O2 SCD LUT with an AOD error of 0.2. The retrieval uncertainty of AEH was evaluated as the relative ratio of SCD changes with respect to input variables. This ratio is defined by the relationship between changes in SCD per unit AEH and changes in SCD due to uncertainties in input variables. The AOD error of 0.2 is twice the target accuracy of the GEMS standard algorithm product. Because the O2–O2 SCD change is small in high AOD, the AEH retrieval uncertainty is relatively small in high AOD conditions. In addition, the SCD sensitivity in high AEH is weak due to the vertical distribution characteristics of O2–O2. Thus, the AEH uncertainty is up to 0.9 km at high AEH in the moderate AOD cases (around 0.5–1.0).
Figure 5 shows the AEH retrieval uncertainty with the surface reflectance error of 0.02. Because surface reflection and aerosol scattering simultaneously affect the increase in optical path length, surface reflectance uncertainty has a significant impact, especially on low AOD. The AEH retrieval error due to uncertainty in surface reflectance is larger than 1 km in cases with AOD < 0.4. In addition, the AEH error by the surface reflectance uncertainty linearly decreases with increasing AOD, indicating a relatively small impact with aerosol height change.
Figure 6 shows the retrieval uncertainty caused by misclassification of the aerosol types. On average, the AEH retrieval uncertainty takes values up to 0.5 km, but this uncertainty is larger than 2 km under low AOD and short optical path length conditions. From the sensitivity analysis, aerosol type (in terms of SSA), AOD, and surface reflectance are carefully considered input parameters for AEH retrieval.
In the AEH retrieval, the AOD, aerosol type, and SSA are obtained from the L2AERAOD, which is a standard aerosol product of GEMS. The aerosol vertical distribution is always fixed as GDF function profiles as shown in Spurr and Christi (2014).
Figure 7 shows retrieval results for AEH from GEMS on 29 March over East Asia. Because the operational schedule is hourly during the daytime, the GEMS retrieval results are shown at 1 h intervals from 01:00 to 07:00 Universal Time Coordinated (UTC). AOD443 and SSA at 443 nm (SSA443 hereafter) are also shown in Figs. S1 and S2 in the Supplement, respectively. Pixels with low AOD443 values have large AEH uncertainty due to weak aerosol scattering information (see also Park et al., 2016). For this reason, only AEH retrieval results with AOD greater than 0.3 are shown in this study. In addition, the AEH retrieval results are only shown for the “reliable” quality flag of L2AERAOD, which is estimated for the aerosol optical properties with a significant averaging kernel for optimal estimation in L2AERAOD. A case was analyzed in which a dust plume was located along the coast of China and South Korea with AOD443 of 0.8–1.2. Simultaneously, another plume was also present over the northeastern Korean Peninsula with AOD443 of 1.0–2.0. SSA443 was 0.90–0.93 for the plume over South Korea and 0.87–0.90 for the plume over the northeastern Korean Peninsula. Retrieved AEH results from these different plumes show similar ranges. For both detected plumes, the AEH shows similar patterns and takes values ranging between 1.0 and 2.0 km in this case.
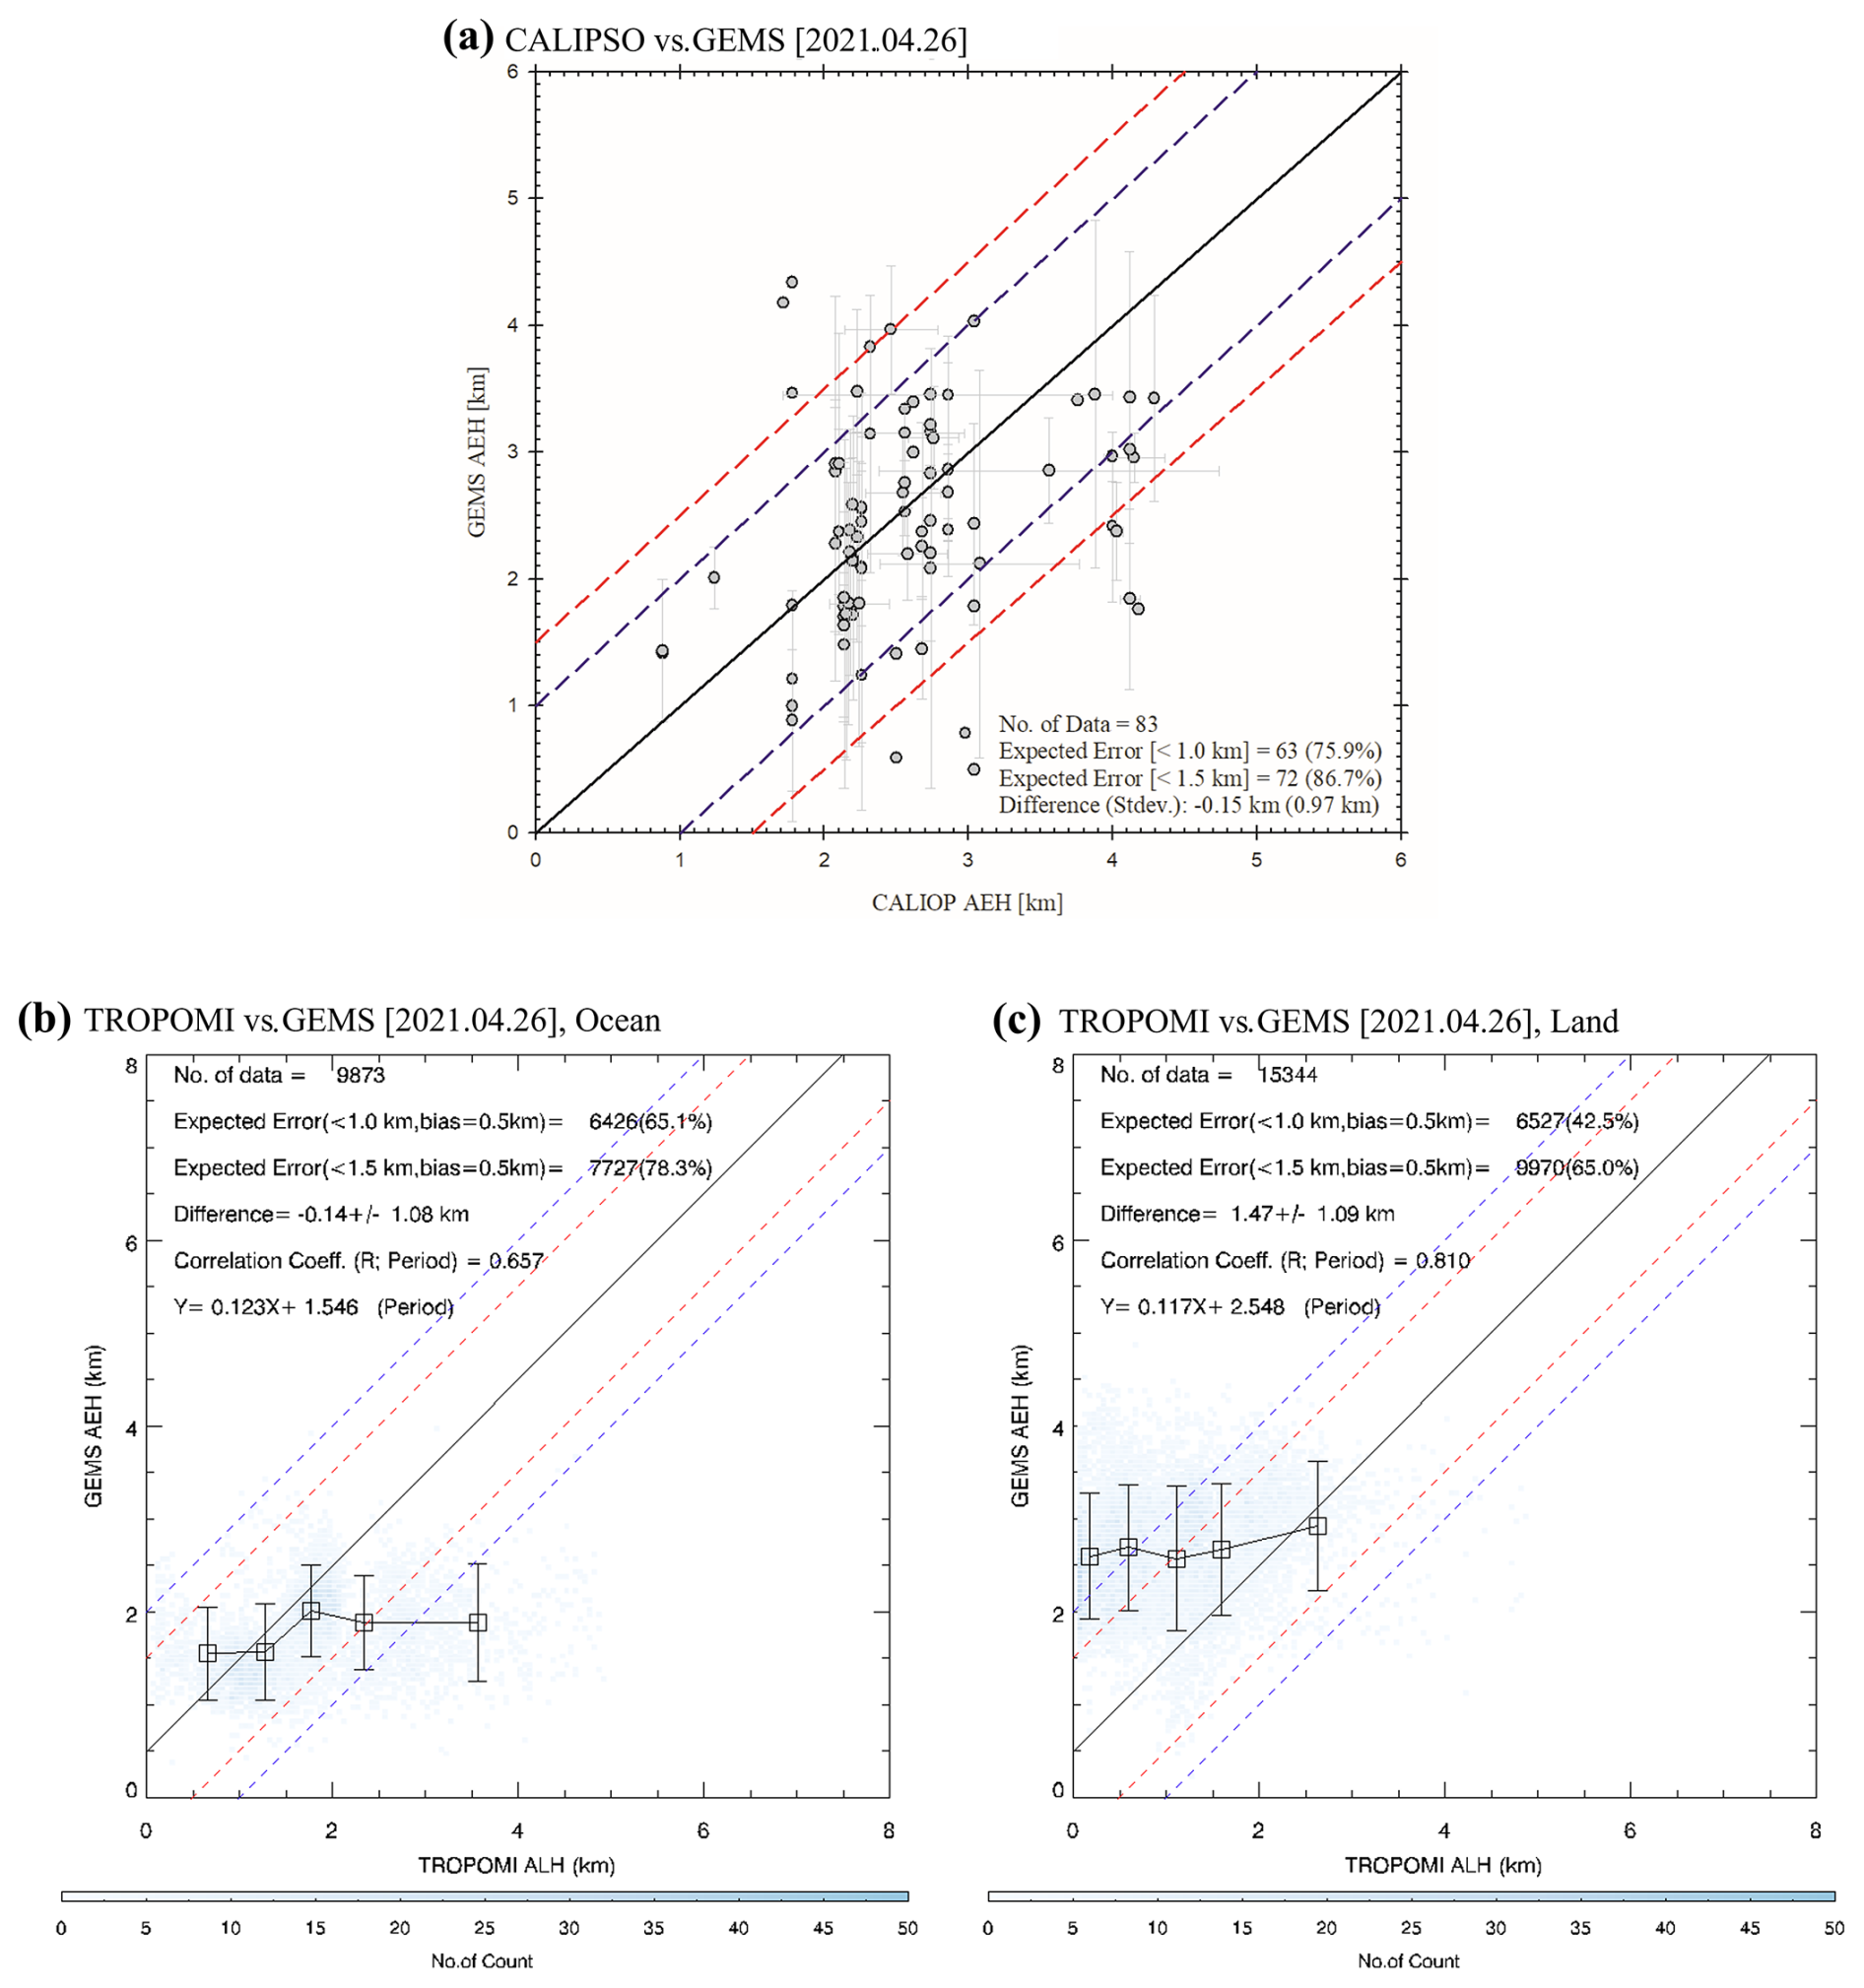
Figure 12Intercomparison of (a) AEH between CALIOP and GEMS as well as (b) ALH from TROPOMI and AEH from GEMS over ocean and (c) over land (the black dot and error bar represent the mean and standard deviation in 20 % intervals of each TROPOMI ALH) on 26 April 2021.
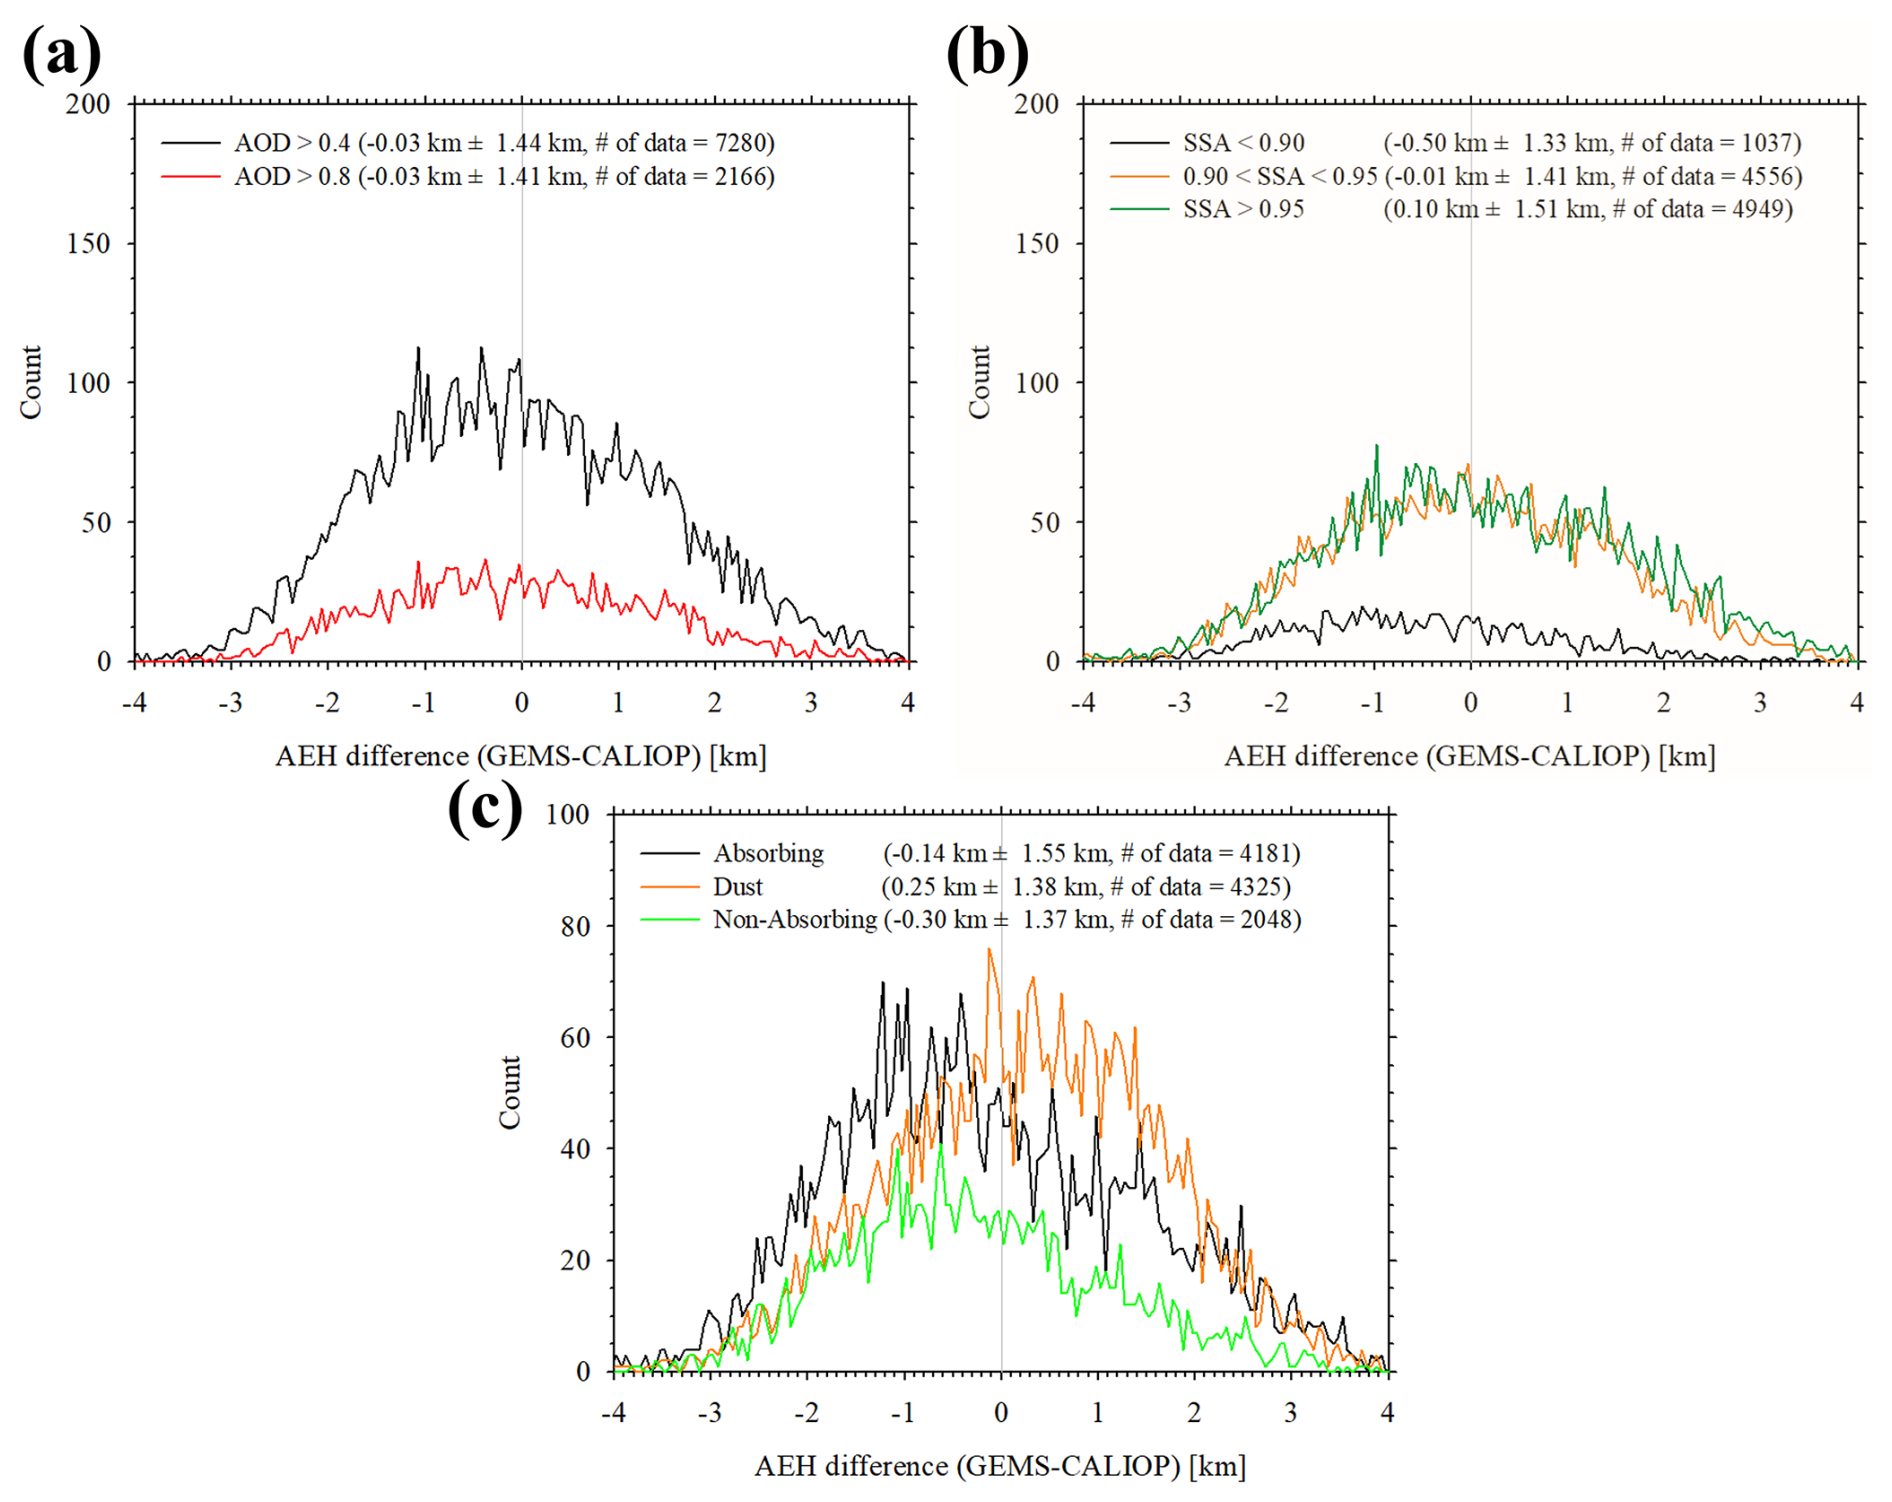
Figure 13Histogram of AEH difference between CALIOP and GEMS with respect to (a) AOD, (b) SSA, and (c) TYPE from GEMS over the period from 1 January to 30 June 2021.
An additional severe aerosol plume was present over northeastern India, with AOD443 of 1.0–2.0 and SSA443 of 0.85–0.90. According to Rana et al. (2019), metropolitan cities and industrial clusters in India are heavy emitters of black carbon, and high concentrations of black carbon are distributed over the Indo-Gangetic Plain (IGP). Therefore, the aerosol plume with high AOD and low SSA (highly absorbing) is considered to be physical rather than an artifact due to the edge of the GEMS observation field. Except for the inland parts of India, AEH in high AOD pixels ranged from 1.5 to 3.5 km.
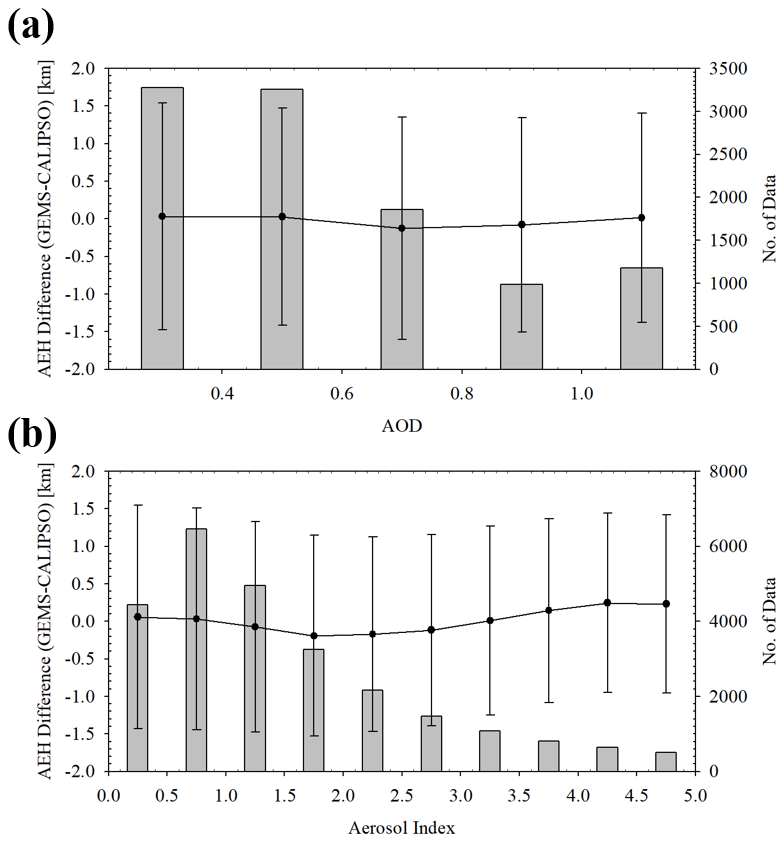
Figure 14AEH difference between CALIOP and GEMS with respect to ranges of (a) AOD and (b) AI obtained from GEMS from 1 January to 30 June 2021 (black dots and error bars denote the mean and standard deviation of AEH difference, while the gray box indicates the number of data points).
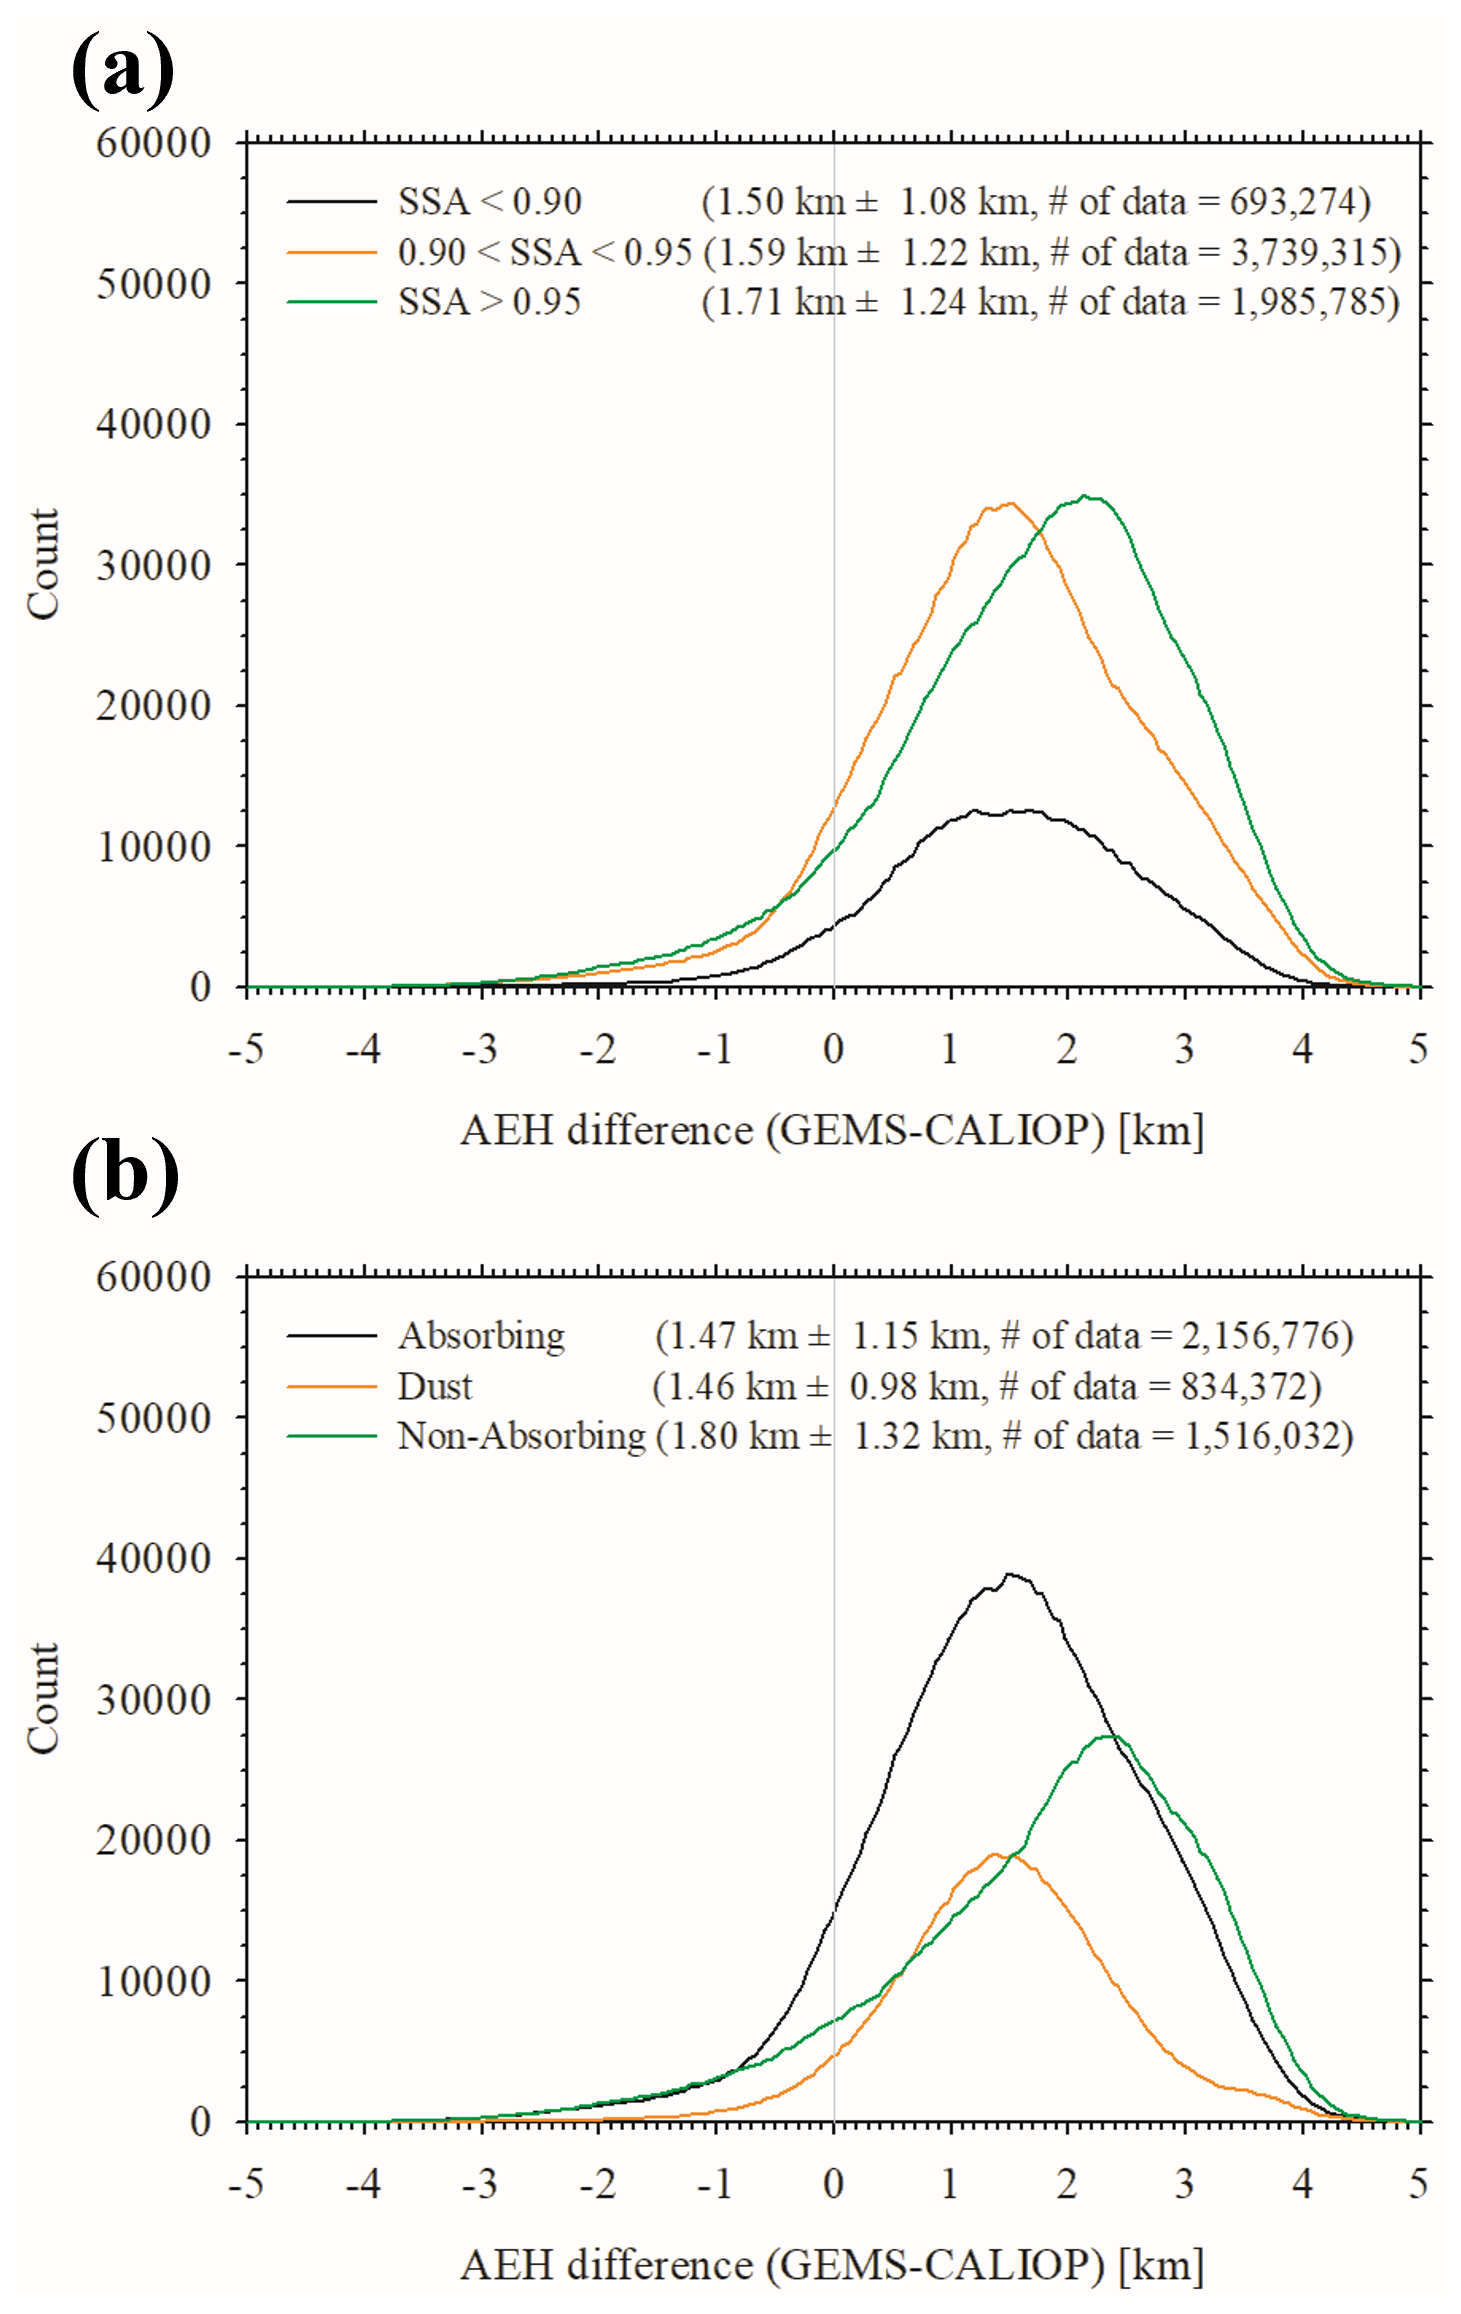
Figure 15Histograms of differences between TROPOMI ALH and GEMS AEH with respect to (a) SSA and (b) TYPE from GEMS in the period from 1 January to 30 June 2021.
For comparison of the retrieval, Fig. 8 shows the ALH retrieved from TROPOMI on 28 and 29 March 2021 over East Asia. A dust plume was transported from China to South Korea during this period, then split into two distinct plumes over northeastern China and the coastal area of South Korea. The ALH retrieved from TROPOMI for both plumes ranges between 0.5 and 1.5 km. Given the difference in definition for the aerosol height parameters between ALH and AEH as shown in Fig. 1, AEH values retrieved from GEMS were higher than the ALH values retrieved from TROPOMI. In an ideal case under a symmetric Gaussian distribution with a width of 1 km, the AEH from GEMS was around 0.5 km higher than the peak height of the aerosol layer. The ALH expresses the center (or peak) height; thus, the AEH from GEMS was overestimated by around 0.5 km relative to the ALH from TROPOMI. Although AEH had higher values than ALH from TROPOMI, the GEMS AEH retrieval provided meaningful physical results for the dust transport case study.
Figure 9 shows intercomparison results for aerosol plume height among GEMS, CALIOP, and TROPOMI during the case study of dust transport in East Asia from 28 to 30 March 2021. For the direct comparison shown in Fig. 9a, the difference in AEH between GEMS and CALIOP was km. Nanda et al. (2020) reported that the difference in ALH between TROPOMI and CALIOP was 0.53 km for four cases of thick Saharan dust plumes. Large AEH uncertainty occurred mostly over the inland area of China. Because AEH from GEMS uses only the O2–O2 absorption band, the accuracy of AEH is sensitive to uncertainty in surface reflectance and AOD. From Park et al. (2016), the total error budget of AEH is 0.74–1.28 km, and the total error budget considered the uncertainty of AOD, SSA, aerosol particle size, and surface reflectance in the aerosol retrieval process. The total error budget amount from a previous study has a similar value of the standard deviation of the AEH difference between GEMS and CALIOP.
Figure 9b and c illustrate the comparison results between GEMS AEH and TROPOMI ALH for the period of 28–30 March 2021 over land and ocean surface, respectively. The difference between GEMS AEH and TROPOMI ALH was 0.72 ± 0.84 km and 1.71 ± 0.77 km over ocean and land in this case, respectively. In addition, 82.4 % and 37.3 % of all pixels had differences of less than 1.5 km over ocean and land, respectively. However, the ALH from TROPOMI is generally lower than the AEH from GEMS because of the discrepancy in definitions. Based on the assumption of aerosol vertical distribution for AEH retrieval, the difference between AEH and the center height of the aerosol extinction profile is around 0.5 km. Considering the inconsistency in definition between ALH and AEH, the difference between the two retrieval results decreased to 0.5 km bias. After consideration of definition inconsistency, the proportion of pixels within the expected error ranges of 1.5 km was enhanced to 92.1 % and 65.0 % over ocean and land, respectively.
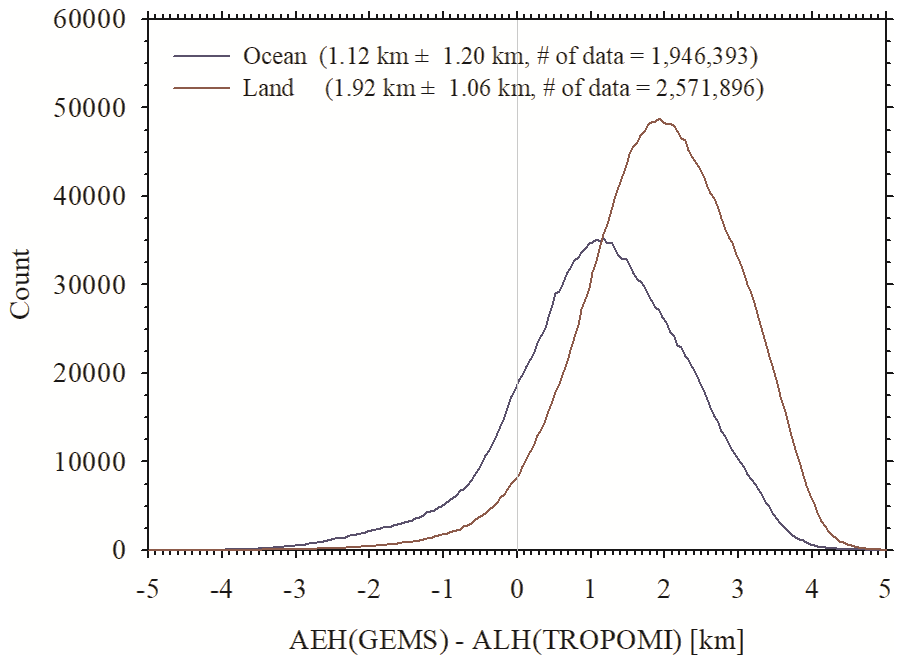
Figure 16Histogram of the difference between TROPOMI ALH and GEMS AEH over land and ocean pixels, respectively, from 1 January to 30 June 2021.
An additional intercomparison case of 26 April 2021 is shown in Figs. 10 (GEMS) and 11 (TROPOMI). During the transport of the dust plume from inland China to the coastal area, AEH changed from 4.0 km at 02:00 UTC to 2.0 km at 06:00 UTC. By contrast, TROPOMI only observed the 1.5–2.5 km ALH over East Asia around 04:00 UTC. Although the AEH from GEMS had spatiotemporal uncertainty, this case demonstrates the advantage of AEH retrieval from GEMS for continuous monitoring of changes in plume height during dust transport, in particular. As shown in Fig. 12, AEH from GEMS showed differences in height of −0.15 ± 0.97 km (compared to CALIOP). In addition, there were differences in height of −0.14 ± 1.06 and 1.47 ± 1.09 km over ocean and land compared to TROPOMI ALH.
From the two different case results, proportion values within 1.0 km (or 1.5 km) height difference between TROPOMI and GEMS have a strong dependence on surface types. The proportion over land (over ocean) was lower (higher) than the corresponding result from the comparison of GEMS and CALIOP. The TROPOMI ALH from version 2 exhibits a strong surface type dependence compared to the ground lidar data (Michailidis et al., 2023). However, the relationship between TROPOMI ALH and GEMS AEH in 20 % intervals of each TROPOMI ALH has high correlation coefficients. In the case of 28–30 March, the correlation coefficients between TROPOMI and GEMS are 0.663 and 0.993 over ocean and land, respectively. In the case of 26 April, the correlation coefficients are 0.657 and 0.810 over ocean and land, respectively.
For long-term validation, we used the AEH retrieval results from January to June 2021. The CALIOP and TROPOMI satellites passed over the study area around 13:30 local time, which is around 04:30 UTC for East Asia and around 06:30 UTC for India. Most temporal colocation pixels aligned with observation times of 04:00–06:00 UTC. To check the dependence of several retrieval variables, the UVAI, AOD, SSA, and dominant aerosol type in each pixel (TYPE) were obtained from the L2AERAOD. Although the GEMS algorithm retrieved AEH in the range of 0–10 km, the sensitivity of O2–O2 SCD to the optical path length was weak in cases of high AEH because the vertical distribution of O2–O2 SCD is related to the square of the air molecule densities. To ensure sufficient quality of retrieved data, therefore, the AEHs from GEMS and CALIOP and the ALH from TROPOMI were used only in pixels where the AEH from GEMS was lower than 5 km.
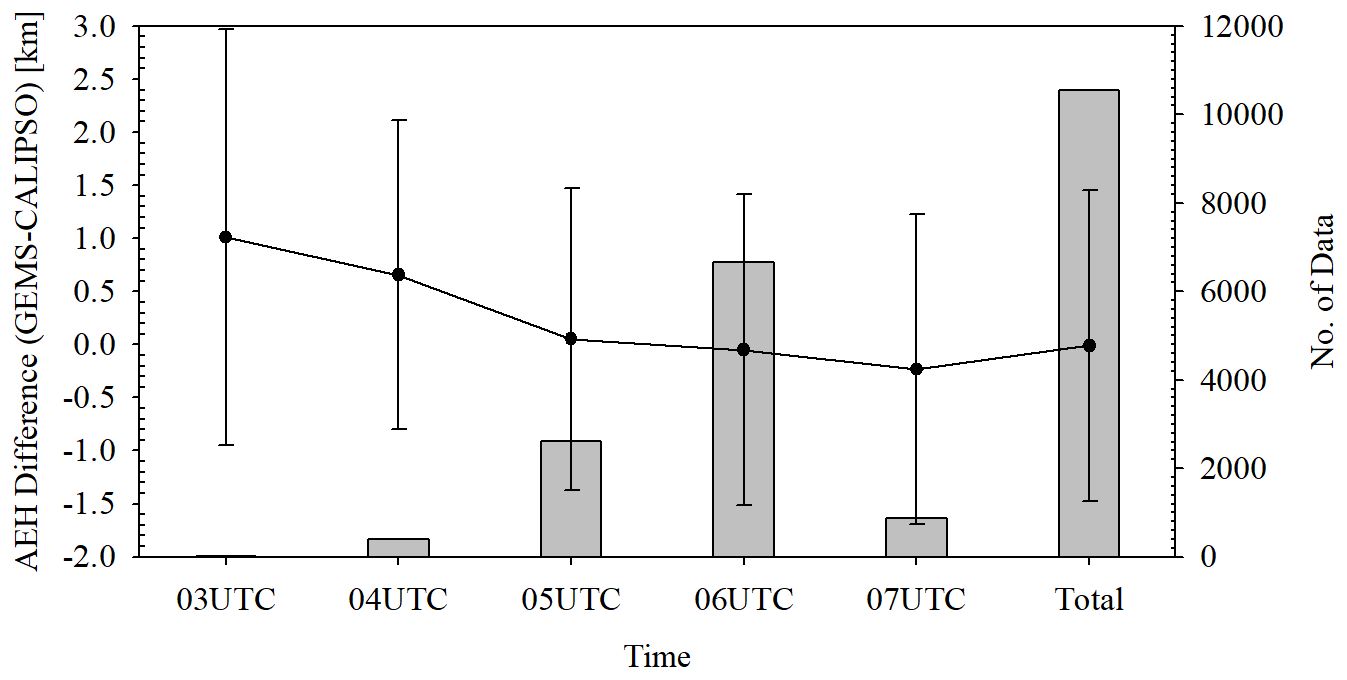
Figure 17Diurnal dependence of AEH difference between CALIOP and GEMS from 1 January to 30 June 2021 (black dots and error bars denote the mean and standard deviation of AEH difference, while the gray box indicates the number of data points).
Figure 13 shows histograms of the difference in AEH between GEMS and CALIOP according to AOD443, SSA443, and TYPE from GEMS. From Fig. 13a, the dependence on AOD threshold is insignificant; the average estimated AEH difference was −0.03 km, but the variation in AEH difference was around 1.4 km based on the standard deviation for AOD443 > 0.4. Because of uncertainty in GEMS aerosol operational products, AEH from GEMS exhibits large variability. Although L2AERAOD from GEMS retrieved the AOD, SSA, and aerosol types, the retrieved results from L2AERAOD include significant uncertainty. Go et al. (2020) reported that the root mean square error (RMSE) of AOD between MODIS and the OMI UV aerosol algorithm is 0.276–0.341.
In addition, fitting error perturbs the fitting signals and tends to result in the underestimation of SCD. Although the fitting error of O2–O2 SCD from GEMS radiance was minimized, the fitting error has still remained around 6 %, as indicated in Table 2. The discrepancy in fitting condition between the simulated and observed radiance biased the SCD estimation, which in turn led to bias and variation in the AEH retrieval. Combined with the high sensitivity of AEH errors to aerosol optical properties, uncertainty arising from L2AERAOD causes AEH variability.
The variation in AEH difference between observation platforms is shown in Fig. 13b as a histogram according to SSA threshold. Across the entire SSA threshold range, the standard deviation of the AEH difference was 1.33–1.51 km. In particular, this standard deviation decreased slightly with decreasing SSA. The aerosol height parameter is more sensitive to absorbing-dominant aerosols than scattering-dominant aerosols (e.g., Park et al., 2016; Nanda et al., 2020). For this reason, the variability of AEH is smaller in absorbing-dominant aerosols than scattering-dominant aerosols if the uncertainty of other aerosol parameters (AOD, SSA, and TYPE) is the same.
Figure 13c shows the dependence of AEH difference on TYPE. The TYPE product included dependence on the aerosol size and optical absorptivity. For this reason, the AEH difference graphs for the dust and absorbing types differ, despite both types being absorbing-dominant aerosols. The AEH difference for the absorbing type showed a negative bias with a large standard deviation, whereas a positive bias with a small standard deviation was obtained for the dust type. The AEH difference for the non-absorbing aerosol type showed the largest negative bias in this comparison. These results suggest that the aerosol size distribution of fine particles affects the negative bias of AEH. Combined with the AEH difference bias illustrated in Fig. 8b, these findings indicate that the bias in AEH difference for absorbing aerosols is weakened by their absorbing-dominant property.
Figure 14 shows means and standard deviations for AEH difference between CALIOP and GEMS according to AOD and AI values from GEMS. For AOD, the mean AEH difference ranged from −0.13 to 0.03 km with a standard deviation of approximately 1.45 km. Similar to Fig. 13a, the variation in AEH difference with AOD change was insignificant. For the AI, the lowest AEH difference was −0.19 km, obtained for the AI range of 1.5–2.0. The largest AEH difference was 0.24 km for the AI range of 4.0–4.5. Although the AEH difference varied slightly, no consistent tendency in AEH variation with AI was observed. Overall, the standard deviation of AEH difference ranged from 1.49 km (0.0 < AI < 0.5) to 1.18 km (4.5 < AI < 5.0), and a consistent tendency of decreasing variance in AEH difference was found with increasing AI.
Figure 15 shows histograms of differences between GEMS AEH and TROPOMI ALH according to the SSA443 and TYPE obtained from GEMS. The difference between GEMS AEH and TROPOMI ALH depends on both SSA and TYPE. The mean difference value between GEMS AEH and TROPOMI ALH decreased as the aerosol absorptivity increased. This difference was 1.50 ± 1.08, 1.59 ± 1.22, and 1.71 ± 1.24 km for pixels of SSA443 < 0.90, 0.90 < SSA443 < 0.95, and SSA443 > 0.95, respectively. Comparing these results to Fig. 13b, we find that the standard deviation of the comparison with TROPOMI is approximately 75 % of the corresponding value for CALIOP. It is because both TROPOMI and GEMS are passive sensors that use similar retrieval methods for oxygen absorption bands. Nanda et al. (2020) showed that the operational algorithm of TROPOMI can provide ALH pixel retrievals only for scenes dominated by absorbing aerosol particles. In addition, Griffin et al. (2020) reported that the pixels with low positive UVAI values (weak absorbing cases) are identified with low QA values (QA ≤ 0.5) in the offline product of ALH. Although the TROPOMI ALH algorithm has been updated for the expansion of the retrieval range, the contrast of O2–O2 SCD to the aerosol layer height change shows fundamentally weak sensitivity in scattering-dominant aerosols (e.g., Park et al., 2016). For this reason, the bias and standard deviation of height difference between GEMS and ALH are generally larger in high SSA.
In addition, the difference between GEMS AEH and TROPOMI ALH depends on TYPE, as shown in Fig. 15b. The difference was 1.47 ± 1.15, 1.46 ± 0.98, and 1.80 ± 1.32 km for absorbing, dust, and non-absorbing aerosols, respectively. Similar to Fig. 13c, the TYPE dependence of aerosol height information was influenced by both absorptivity and size information. The dust type of aerosol is mainly transported in the free troposphere with Gaussian-like vertical distribution, and the associated plume thickness is highly variable. However, absorbing aerosols mainly originate from anthropogenic emissions in East Asia and are mostly distributed near the surface with homogeneous concentration (e.g., Gao et al., 2014; Wang et al., 2012; Peng et al., 2016). Transport patterns and vertical distribution shape depending on aerosol types can affect the accuracy of aerosol height retrieval results.
The non-Lambertian effect on the land surface impacted surface reflectance uncertainty during AEH retrieval, and this effect led to bias and variance in AEH. In this study, the minimum Lambertian equivalent reflectance was used as the reference reflectance value. However, surface reflectivity has a geometric dependence due to non-Lambertian effects, which leads to a bias of 0.01–0.02 for surface reflectance over the land surface (e.g., Qin et al., 2019). To identify the sensitivity of the surface property, a histogram was constructed of the difference between GEMS AEH and TROPOMI ALH after classification into land and ocean surface types, as shown in Fig. 16. From the statistical results, the mean differences were estimated to be 1.12 ± 1.20 and 1.92 ± 1.06 km for ocean and land pixels, respectively. The bias has a significant difference between the two different surface types. Michailidis et al. (2023) explained that the experimental retrieval range of ALH from TROPOMI is 0.27–6.5 km and 0.06–2.15 km over ocean and land, respectively. The constrained retrieval range over land by TROPOMI influences the negative bias of aerosol height retrieval and increases the mean difference of aerosol height between GEMS and TROPOMI. In addition, the non-Lambertian effect of surface reflectance also affects the increasing discrepancy of aerosol height information.
The results of hourly statistical analyses are presented in Fig. 17. Because they use a consistent definition of AEH, we show only a comparison of GEMS and CALIOP. The diurnal variation in AEH difference ranged from −0.23 ± 1.45 km (07:00 UTC, 867 data points) to 1.01 ± 1.96 km (03:00 UTC, 23 data points). However, the number of pixels observed at 03:00 UTC was insufficient for the identification of the diurnal variation of the retrieval uncertainty. The AEH difference of 0.66 ± 1.45 km was the next highest value obtained at 04:00 UTC (395 data points). The inhomogeneous number of data points is mainly due to the lack of spatial homogeneity among retrieval pixels. Over India, very high AOD values were consistently observed during the comparison period. Otherwise, the AEH was only retrieved under conditions of severe anthropogenic emissions over East Asia. In addition, the diurnal variation in AEH difference was caused by spatial characteristics of AEH difference. From 03:00 to 05:00 UTC, CALIOP mainly passed over East Asia, which has numerous sources of aerosol emissions, including biomass burning, dust, and industrial activity. In addition, GEMS observed only the eastern part of India, which is dominated by anthropogenic aerosols. The spatial distribution of the dominant aerosol types may impact the diurnal variation in AEH difference.
Based on the possibility of retrieving AEH from environmental satellite sensors, an AEH retrieval algorithm for GEMS was developed that solely uses the O2–O2 absorption band considering aerosol and surface properties. Because the sensitivity of AEH retrieval is strongly affected by the optical depth and properties of aerosols, as well as surface reflectivity, the AEH retrieval algorithm for GEMS uses the GEMS operational product, L2AERAOD. With the newly developed retrieval algorithm, GEMS can be used to monitor aerosol vertical information with high temporal and spatial resolution.
For dust plumes over East Asia, AEH retrieval results from GEMS indicated appropriate aerosol vertical information. After spatial and temporal colocation, the AEH from GEMS aligned well with the AEH information obtained from CALIOP. The differences in AEH between GEMS and CALIOP for dust plume cases were −0.13 ± 1.32 and −0.15 ± 0.97 km, with 49.9 %–75.9 % and 73.2 %–86.7 % of all pixels showing differences less than 1.0 and 1.5 km, respectively. Large AEH uncertainty was found mostly over inland China due to uncertainty in surface reflectance and AOD over the land surface. In addition, AEH from GEMS was overestimated compared to the TROPOMI ALH results. The overestimation is partially caused by different definitions of ALH from TROPOMI and AEH from GEMS.
In the long-term intercomparison with CALIOP, the average AEH difference was estimated to be −0.03 km, with a standard deviation of 1.4 km under the scenario of AOD > 0.4. The large variation in AEH difference between GEMS and CALIOP was caused by uncertainty in the input parameters estimated from L2AERAOD. In the long-term intercomparison against TROPOMI, this difference was dependent on both SSA and TYPE. The difference was 1.50 ± 1.08 km, 1.59 ± 1.22 km, and 1.71 ± 1.24 km for pixels with SSA < 0.90, 0.90 < SSA < 0.95, and SSA > 0.95, respectively. In addition, differences of 1.47 ± 1.15 km, 1.46 ± 0.98 km, and 1.80 ± 1.32 km were obtained for the absorbing, dust, and non-absorbing types of aerosols, respectively. The AEH difference also has a diurnal dependence, which ranged from −0.23 ± 1.45 km to 1.01 ± 1.96 km, due to the spatial characteristics of dominant aerosol types.
The case studies and results of the long-term validation show that AEH retrieved from GEMS can provide information on aerosol vertical distribution, with applications in diverse research fields. The AEH results with long-term statistical accuracy make it possible to use the application study for AMF calculation of GEMS trace gas retrieval. In addition, AEH considerably affects the surface particulate matter (PM) concentration obtained from satellite-based AOD because PM estimation is significantly affected by the mixing layer height of aerosols. For this reason, the AEH can provide an effective mixing layer height of aerosols for anthropogenic aerosols and also provide the vertical patterns for long-range transport of aerosols.
Although several fields of study may apply AEH retrieval results, retrieval uncertainty in AEH remains due to the uncertainty of retrieved AOD and SSA. In addition, the uncertainty in surface reflectance and the discrepancy in O2–O2 SCD values between the simulation results and observations can be affected by the potential error sources of AEH from GEMS. To minimize the AEH retrieval uncertainty, further analysis related to the optimized input parameters of AOD, SSA, and aerosol type information is essential. For this reason, the quantitative analysis of AEH uncertainty due to aerosol and surface properties is important for the improvement of the AEH retrieval algorithm. In addition, aerosol optical property retrieval by the visible channel will be needed for further study to improve the aerosol type determination. Although the UV and visible aerosol indices provide the aerosol type information, developing an aerosol type classification algorithm is necessary to create synergy with AEH retrieval. AEH provides representative layer height information as only one variable because of its sole reliance on O2–O2 SCD for direct estimation of aerosol height information. This method is limited to the consideration of aerosol vertical structures (i.e., Gaussian or exponential vertical distribution structures). To increase the information contents, it would be valuable to combine other oxygen absorption bands from other satellite instruments together with extinction information for aerosols.
The TROPOMI ALH product is available from https://doi.org/10.5270/S5P-7g4iapn (ESA, 2025), and the CALIOP aerosol extinction profile product is available from https://doi.org/10.5067/CALIOP/CALIPSO/CAL_LID_L2 (NASA/LARC/SD/ASDC, 2020). The GEMS AEH and AERAOD products are available from the Environmental Satellite Center at the National Institute of Environmental Research (NIER) of the Republic of Korea (https://nesc.nier.go.kr/en/html/datasvc/index.do, NIER, 2024).
The supplement related to this article is available online at https://doi.org/10.5194/amt-18-2241-2025-supplement.
SP, JK, and HL contributed to the design and implementation of this research. SP developed the methodology and writing of the manuscript. YC and JP contributed the software development and validation. DL, WL, and DK contributed the resources.
The contact author has declared that none of the authors has any competing interests.
Publisher's note: Copernicus Publications remains neutral with regard to jurisdictional claims made in the text, published maps, institutional affiliations, or any other geographical representation in this paper. While Copernicus Publications makes every effort to include appropriate place names, the final responsibility lies with the authors.
This article is part of the special issue “GEMS: first year in operation (AMT/ACP inter-journal SI)”. It is not associated with a conference.
We thank the National Institute of Environmental Research of South Korea for the financial support and for providing GEMS Level 2 data. We thank the TROPOMI and CALIOP science team for providing the satellite datasets. We also acknowledge the editor and the five anonymous referees for their valuable comments.
This research has been supported by the National Institute of Environmental Research (grant no. NIER-2025-04-02-063).
This paper was edited by Ben Veihelmann and reviewed by five anonymous referees.
Accarreta, J. R., de Haan, J. F., and Stammes, P.: Cloud pressure retrieval using the O2-O2 absorption band at 477 nm, J. Geophys. Res., 109, D05204, https://doi.org/10.1029/2003JD003915, 2004.
Ahn, C., Torres, O., and Jethva, H.: Assessment of OMI near-UV aerosol optical depth over land, J. Geophys. Res., 119, 2457–2473, 2014.
Bogumil, K., Orphal, J., Burrows, J. P., and Flaud, J. M.: Vibrational progressions in the visible and near-ultraviolet absorption spectrum of ozone, Chem. Phys. Lett., 349, 241–248, 2001.
Buchard, V., da Silva, A. M., Colarco, P. R., Darmenov, A., Randles, C. A., Govindaraju, R., Torres, O., Campbell, J., and Spurr, R.: Using the OMI aerosol index and absorption aerosol optical depth to evaluate the NASA MERRA Aerosol Reanalysis, Atmos. Chem. Phys., 15, 5743–5760, https://doi.org/10.5194/acp-15-5743-2015, 2015.
Chen, X., Wang, J., Xu, X., Zhou, M., Zhang, H., Garcia, L. C., Colarco, P. R., Janz, S. J., Yorks, J., McGill, M., Reid, J. S., de Graaf, M., and Kondragunta, S.: First retrieval of absorbing aerosol height over dark target using TROPOMI oxygen B band: Algorithm development and application for surface particulate matter estimates, Remote Sens. Env., 265, 112674, https://doi.org/10.1016/j.rse.2021.112674, 2021a.
Chen, X., Xu, X., Wang, J., and Diner, D. J.: Can Multi-angular polarimetric measurements in the oxygen-A and B bands improve the retrieval of aerosol vertical distribution?, J. Quant. Spec. Ra., 270, 107679, https://doi.org/10.1016/j.jqsrt.2021.107679, 2021b.
Cheng, S., Pu, G., Ma, J., Hong, H., Du, J., Yudron, T., and Wagner, T.: Retrieval of tropospheric NO2 vertical column densities from ground-based MAX-DOAS measurements in Lhasa, a city on the Tibetan Plateau, Remote Sens., 15, 4689, https://doi.org/10.3390/rs15194689, 2023.
Chimot, J., Veefkind, J. P., Vlemmix, T., de Haan, J. F., Amiridis, V., Proestakis, E., Marinou, E., and Levelt, P. F.: An exploratory study on the aerosol height retrieval from OMI measurements of the 477 nm O2-O2 spectral band using a neural network approach, Atmos. Meas. Tech., 10, 783–809, https://doi.org/10.5194/amt-10-783-2017, 2017.
Choi, H., Liu, X., Abad, G. G., Seo, J., Lee, K.-M., and Kim, J.: A fast retrieval of cloud parameters using a Triplet of wavelengths of oxygen dimer band around 477 nm, Remote Sens., 13, 152, https://doi.org/10.3390/rs13010152, 2021.
Choi, W., Lee, H., Kim, J., Ryu, J.-Y., Park, S. S., Park, J., and Kang, H.: Effects of spatiotemporal O4 column densities and temperature-dependent O4 absorption cross-section on an aerosol effective height retrieval algorithm using the O4 air mass factor from the ozone monitoring instrument, Remote Sens. Env., 229, 223–233, 2019.
Choi, W., Lee, H., and Kim, J.: First TROPOMI retrieval of aerosol effective height using O4 absorption band at 477 nm and aerosol classification, IEEE Trans. Geosci. Remote Sens., 59, 9873–9886, 2021.
de Graaf, M., Stammes, P., Torres, O., and Koelemeijer, R. B. A.: Absorbing aerosol index: Sensitivity analysis, application to GOME and comparison with TOMS, J. Geophys. Res., 110, D01201, https://doi.org/10.1029/2004JD005178, 2005.
de Graaf, M., de Haan, J. F., and Sanders, A. F. J.: TROPOMI ATBD of the Aerosol Layer Height, issue 2.4.0, 2022-04-08, 75 pp., Royal Netherlands Meteorological Institute, Netherland, https://sentinel.esa.int/documents/247904/2476257/Sentinel-5P-TROPOMI-ATBD-Aerosol-Height (last access: 15 June 2024), 2024.
Ding, S., Wang, J., and Xu, X.: Polarimetric remote sensing in oxygen A and B bands: sensitivity study and information content analysis for vertical profile of aerosols, Atmos. Meas. Tech., 9, 2077–2092, https://doi.org/10.5194/amt-9-2077-2016, 2016.
Dubisson, P., Frouin, R., Dessaily, D., Duforet, L., Leon, J.-F., Voss, K., and Antoine, D.: Estimating the altitude of aerosol plumes over the ocean from reflectance ratio measurements in the O2 A-band, Remote Sens. Environ., 113, 1899–1911, https://doi.org/10.1016/j.rse.2009.04.018, 2009.
ESA: S5P Products, Products Overview, European Union [data set], https://doi.org/10.5270/S5P-7g4iapn, 2025.
European Space Agency: L TROPOMI Level 2 Aerosol Layer Height products, Version 02, https://doi.org/10.5270/S5P-7g4iapn, 2021.
Gao, Y., Zhao, C., Liu, X., Zhang, M., and Leung, L. R.: WRF-Chem simulations of aerosols and anthropogenic aerosol radiative forcing in East Asia, Atmos. Environ., 92, 250–266, 2014.
Geddes, A. and Bösch, H.: Tropospheric aerosol profile information from high-resolution oxygen A-band measurements from space, Atmos. Meas. Tech., 8, 859–874, https://doi.org/10.5194/amt-8-859-2015, 2015.
Go, S., Kim, J., Park, S. S., Kim, M., Lim, H., Kim, J.-Y., Lee, D.-W., and Im, J.: Synergistic use of hyperspectral UV-visible OMI and broadband meteorological imager MODIS data for a merged aerosol product, Remote Sens., 12, 3987, https://doi.org/10.3390/rs12233987, 2020.
Griffin, D., Sioris, C., Chen, J., Dickson, N., Kovachik, A., de Graaf, M., Nanda, S., Veefkind, P., Dammers, E., McLinden, C. A., Makar, P., and Akingunola, A.: The 2018 fire season in North America as seen by TROPOMI: aerosol layer height intercomparisons and evaluation of model-derived plume heights, Atmos. Meas. Tech., 13, 1427–1445, https://doi.org/10.5194/amt-13-1427-2020, 2020.
Herman, J. R., Bhartia, P. K., Torres, O., Hsu, C., Seftor, C., and Celarier, E.: Global distribution of UV-absorbing aerosols from Nimbus-7/TOMS data, J. Geophys. Res., 102, 16911–16922, 1997.
Hong, H., Lee, H., Kim, J., Jeong, U., Ryu, J., and Lee, D. S.: Investigation of simultaneous effects of aerosol properties and aerosol peak height on the air mass factors for space-borne NO2 retrievals, Remote Sens., 9, 208, https://doi.org/10.3390/rs9030208, 2017.
Irie, H., Kanaya, Y., Akimoto, H., Tanimoto, H., Wang, Z., Gleason, J. F., and Bucsela, E. J.: Validation of OMI tropospheric NO2 column data using MAX-DOAS measurements deep inside the North China Plain in June 2006: Mount Tai Experiment 2006, Atmos. Chem. Phys., 8, 6577–6586, https://doi.org/10.5194/acp-8-6577-2008, 2008.
Joiner, J. and Bhartia, P. K.: The determination of cloud pressures from rotational Raman scattering in satellite backscatter ultraviolet measurements, J. Geophys. Res., 100, 23019–23026, 1995.
Joiner, J. and Vasilkov, A. P.: First results from the OMI rotational Raman scattering cloud pressure algorithm, IEEE T. Geosci. Remote Sens., 44, 1272–1282, 2006.
Kim, J., Jeong, U., Ahn, M.-H., Kim, J. H., Park, R. J., Lee, H., Song, C. H., Choi, Y.-S., Lee, K.-H., Yoo, J.-M., Jeong, M.-J., Park, S. K., Lee, K.-M., Song, C.-K., Kim, S.-W., Kim, Y. J., Kim, S.-W., Kim, M., Go, S., Liu, X., Chance, K., Chan Miller, C., Al-Saadi, J., Veihelmann, B., Bhartia, P. K., Torres, O., González Abad, G., Haffner, D. P., Ko, D. H., Lee, S. H., Woo, J.-H., Chong, H., Park, S. S., Nicks, D., Choi, W. J., Moon, K.-J., Cho, A., Yoon, J., Kim, S.-K., Hong, H., Lee, K., Lee, H., Lee, S., Choi, M., Veefkind, P., Levelt, P. F., Edwards, D. P., Kang, M., Eo, M., Bak, J., Baek, K., Kwon, H.-A., Yang, J., Park, J., Han, K. M., Kim, B.-R., Shin, H.-W., Choi, H., Lee, E., Chong, J., Cha, Y., Koo, J.-H., Irie, H., Hayashida, S., Kasai, Y., Kanaya, Y., Liu, C., Lin, J., Crawford, J. H., Carmichael, G. R., Newchurch, M. J., Lefer, B. L., Herman, J. R., Swap, R. J., Lau, A. K. H., Kurosu, T. P., Jaross, G., Ahlers, B., Dobber, M., McElroy, C. T., and Choi, Y.: New era of air quality from Space: Geostationary Environment Monitoring Spectrometer (GEMS), B. Am. Meteorol. Soc., 101, E1–E22, 2020.
Kim, M., Kim, J., Torres, O., Ahn, C., Kim, W., Jeong, U., Go, S., Liu, X., Moon, K. J., and Kim, D.-R.: Optimal estimation-based algorithm to retrieve aerosol optical properties for GEMS measurements over Asia, Remote Sens., 10, 162, https://doi.org/10.3390/rs10020162, 2018.
Koffi, B., Schulz, M., Bréon, F.-M., Griesfeller, J., Winker, D., Balkanski, Y., Bauer, S., Berntsen, T., Chin, M., Collins, W. D., Dentener, F., Diehl, T., Easter, R., Ghan, S., Ginoux, P., Gong, S., Horowitz, L. W., Iversen, T., Kirkevåg, A., Koch, D., Krol, M., Myhre, G., Stier, P., and Takemura, T.: Application of the CALIOP layer product to evaluate the vertical distribution of aerosols estimated by global models: AeroCom phase I results, J. Geophys. Res.-Atmos., 117, D10201, https://doi.org/10.1029/2011jd016858, 2012.
Kokhanovsky, A. A. and Rozanov, V. V.: The determination of dust cloud altitudes from a satellite using hyperspectral measurements in the gaseous absorption band, Int. J. Rem. Sens., 31, 2729–2744, 2010.
Kooreman, M. L., Stammes, P., Trees, V., Sneep, M., Tilstra, L. G., de Graaf, M., Stein Zweers, D. C., Wang, P., Tuinder, O. N. E., and Veefkind, J. P.: Effects of clouds on the UV Absorbing Aerosol Index from TROPOMI, Atmos. Meas. Tech., 13, 6407–6426, https://doi.org/10.5194/amt-13-6407-2020, 2020.
Kwon, H.-A., Park, R. J., González Abad, G., Chance, K., Kurosu, T. P., Kim, J., De Smedt, I., Van Roozendael, M., Peters, E., and Burrows, J.: Description of a formaldehyde retrieval algorithm for the Geostationary Environment Monitoring Spectrometer (GEMS), Atmos. Meas. Tech., 12, 3551–3571, https://doi.org/10.5194/amt-12-3551-2019, 2019.
Li, Y., Xing, C., Peng, H., Song, Y., Zhang, C., Xue, J., Niu, X., and Liu, C.: Long-term observations of NO2 using GEMS in China: Validations and regional transport, Sci. Total Environ., 904, 166762, https://doi.org/10.1016/j.scitotenv.2023.166762, 2023.
Lorente, A., Folkert Boersma, K., Yu, H., Dörner, S., Hilboll, A., Richter, A., Liu, M., Lamsal, L. N., Barkley, M., De Smedt, I., Van Roozendael, M., Wang, Y., Wagner, T., Beirle, S., Lin, J.-T., Krotkov, N., Stammes, P., Wang, P., Eskes, H. J., and Krol, M.: Structural uncertainty in air mass factor calculation for NO2 and HCHO satellite retrievals, Atmos. Meas. Tech., 10, 759–782, https://doi.org/10.5194/amt-10-759-2017, 2017.
Michailidis, K., Koukouli, M.-E., Balis, D., Veefkind, J. P., de Graaf, M., Mona, L., Papagianopoulos, N., Pappalardo, G., Tsikoudi, I., Amiridis, V., Marinou, E., Gialitaki, A., Mamouri, R.-E., Nisantzi, A., Bortoli, D., João Costa, M., Salgueiro, V., Papayannis, A., Mylonaki, M., Alados-Arboledas, L., Romano, S., Perrone, M. R., and Baars, H.: Validation of the TROPOMI/S5P aerosol layer height using EARLINET lidars, Atmos. Chem. Phys., 23, 1919–1940, https://doi.org/10.5194/acp-23-1919-2023, 2023.
Nanda, S., de Graaf, M., Sneep, M., de Haan, J. F., Stammes, P., Sanders, A. F. J., Tuinder, O., Veefkind, J. P., and Levelt, P. F.: Error sources in the retrieval of aerosol information over bright surfaces from satellite measurements in the oxygen A band, Atmos. Meas. Tech., 11, 161–175, https://doi.org/10.5194/amt-11-161-2018, 2018.
Nanda, S., de Graaf, M., Veefkind, J. P., Sneep, M., ter Linden, M., Sun, J., and Levelt, P. F.: A first comparison of TROPOMI aerosol layer height (ALH) to CALIOP data, Atmos. Meas. Tech., 13, 3043–3059, https://doi.org/10.5194/amt-13-3043-2020, 2020.
NASA/LARC/SD/ASDC: CALIPSO Lidar Level 2 Aerosol Profile, Provisional V3-41, EarthData [data set], https://doi.org/10.5067/CALIOP/CALIPSO/CAL_LID_L2, 2020.
National Institute of Environmental Research: Geostationary Environment Monitoring Spectrometer (GEMS) Algorithm Theoretical Basis Document, Aerosol Retrieval Algorithm, 49 pp., Ministry of Environment, Korea, https://nesc.nier.go.kr/ko/dwld/base/cmmn/pdf.do?fileInnb=AF_0000000458 (last access: 25 March 2025), 2024.
NIER: Data Services, NIER [data set], https://nesc.nier.go.kr/en/html/datasvc/index.do (last access: 18 January 2025), 2024.
Omar, A., Winker, D. M., Vaughan, M. A., Ju, Y., Trepte, C. R., Ferrare, R. A., Lee, K.-P., Hostetler, C. A., Kittaka, C., Rogers, R. R., Kuehn, R. E., and Liu, Z.: The CALIPSO automated aerosol classification and Lidar ratio selection algorithm, J. Atmos. Ocean. Tech., 26, 1994–2014, 2009.
Park, S. S., Kim, J., Lee, H., Torres, O., Lee, K.-M., and Lee, S. D.: Utilization of O4 slant column density to derive aerosol layer height from a space-borne UV–visible hyperspectral sensor: sensitivity and case study, Atmos. Chem. Phys., 16, 1987–2006, https://doi.org/10.5194/acp-16-1987-2016, 2016.
Park, S. S., Takemura, T., and Kim, J.: Effect of temperature-dependent cross sections on O4 slant column density estimation by a space-borne UV-visible hyperspectral sensor, Atmos. Environ., 152, 98–110, 2017.
Park, S. S., Kim, S.-W., Song, C.-K., Park, J.-U., and Bae, K.-H.: Spatio-temporal variability of aerosol optical depth, total ozone, and NO2 over East Asia: Strategy for the validation to the GEMS Scientific Products, Remote Sens., 12, 2256, https://doi.org/10.3390/rs12142256, 2020.
Peng, J., Hu, M., Guo, S., Du, Z., Zheng, J., Shang, D., Zamora, M. L., Zeng, L., Shao, M., Wu, Y.-S., Zheng, J., Wang, Y., Glen, C. R., Collins, D. R., Molina, M. J., and Zhang, R.: Markedly enhanced absorption and direct radiative forcing of black carbon under polluted urban environments, P. Natl. Acad. Sci. USA, 113, 4266–4271, 2016.
Penning de Vries, M. J. M., Beirle, S., and Wagner, T.: UV Aerosol Indices from SCIAMACHY: introducing the SCattering Index (SCI), Atmos. Chem. Phys., 9, 9555–9567, https://doi.org/10.5194/acp-9-9555-2009, 2009.
Penning de Vries, M. J. M., Beirle, S., Hörmann, C., Kaiser, J. W., Stammes, P., Tilstra, L. G., Tuinder, O. N. E., and Wagner, T.: A global aerosol classification algorithm incorporating multiple satellite data sets of aerosol and trace gas abundances, Atmos. Chem. Phys., 15, 10597–10618, https://doi.org/10.5194/acp-15-10597-2015, 2015.
Platt, U.: Differential optical absorption spectroscopy (DOAS), Air Monit, by Spectrosc. Tech., 127, 27–84, 1994.
Platt, U. and Stutz, J.: Differential Absorption Spectroscopy, Springer, Berlin Heidelberg, ISBN 978-3-540-21193-8, 2008.
Prospero, J. M., Ginoux, P., Torres, O., Nicholson, S. E., and Gill T. E.: Environmental characterization of global sources of atmospheric soil dust identified with the Nimbus 7 total ozone mapping spectrometer (TOMS) absorbing aerosol product, Rev. Geophys., 40, 1002, https://doi.org/10.1029/2000RG000095, 2002.
Qin, W., Fasnacht, Z., Haffner, D., Vasilkov, A., Joiner, J., Krotkov, N., Fisher, B., and Spurr, R.: A geometry-dependent surface Lambertian-equivalent reflectivity product for UV–Vis retrievals – Part 1: Evaluation over land surfaces using measurements from OMI at 466 nm, Atmos. Meas. Tech., 12, 3997–4017, https://doi.org/10.5194/amt-12-3997-2019, 2019.
Rana, A., Jia, S., and Sarkar, S.: Black carbon aerosol in India: A comprehensive review of current status and future prospects, Atmos. Res., 218, 207–230, 2019.
Sanders, A. F. J., de Haan, J. F., Sneep, M., Apituley, A., Stammes, P., Vieitez, M. O., Tilstra, L. G., Tuinder, O. N. E., Koning, C. E., and Veefkind, J. P.: Evaluation of the operational Aerosol Layer Height retrieval algorithm for Sentinel-5 Precursor: application to O2 A band observations from GOME-2A, Atmos. Meas. Tech., 8, 4947–4977, https://doi.org/10.5194/amt-8-4947-2015, 2015.
Sanghavi, S., Martonchik, J. V., Landgraf, J., and Platt, U.: Retrieval of the optical depth and vertical distribution of particulate scatterers in the atmosphere using O2 A- and B-band SCIAMACHY observations over Kanpur: a case study, Atmos. Meas. Tech., 5, 1099–1119, https://doi.org/10.5194/amt-5-1099-2012, 2012.
Spurr, R.: “User's Guide VLIDORT Version 2.6, RT Solutions”, Cambridge, MA, USA, 2013.
Spurr, R. and Christri, M.: On the generation of atmospheric property Jacobians from the (V)LIDORT linearized radiative transfer models, J. Quant. Spectrosc. Rad., 142, 109–115, 2014.
Tackett, J. L., Winker, D. M., Getzewich, B. J., Vaughan, M. A., Young, S. A., and Kar, J.: CALIPSO lidar level 3 aerosol profile product: version 3 algorithm design, Atmos. Meas. Tech., 11, 4129–4152, https://doi.org/10.5194/amt-11-4129-2018, 2018.
Thalman, R. and Volkamer, R.: Temperature dependent absorption cross-sections of O2-O2 collision pairs between 340 and 630 nm and at atmospherically relevant pressure, Phys. Chem. Chem. Phys., 15, 15371–15381, https://doi.org/10.1039/C3CP50968K, 2013.
Torres, O., Bhartia, P. K., Herman, J. R., Ahmad, Z., and Gleason, J.: Derivation of aerosol properties from satellite measurements of backscattered ultraviolet radiation: Theoretical basis, J. Geophys. Res., 103, 17099–17110, 1998.
Torres, O., Decae, R., Veefkind, P., and de Leeuw, G.: OMI Aerosol Retrieval Algorithm, OMI Algorithm Theoretical Basis Document, Vol. III, Clouds, Aerosols and Surface UV Irradiance, NASA-KNMI ATBD-OMI-03, 47–71 pp., https://eospso.gsfc.nasa.gov/sites/default/files/atbd/ATBD-OMI-03.pdf (last access: 25 March 2025), 2002.
Torres, O., Jethva, H., Ahn, C., Jaross, G., and Loyola, D. G.: TROPOMI aerosol products: evaluation and observations of synoptic-scale carbonaceous aerosol plumes during 2018–2020, Atmos. Meas. Tech., 13, 6789–6806, https://doi.org/10.5194/amt-13-6789-2020, 2020.
Vandaele, A. C., Hermans, C., Simon, P. C., Carleer, M., Colin, R., Fally, S., Merienne, M. F., Jenouvrier, A., and Coquart, B.: Measurements of the NO2 absorption cross-section from 42000 cm−1 to 10000 cm−1 (238–1000 nm) at 220 K and 294 K, J. Quant. Spectrosc. Ra., 59, 171–184, 1998.
Vasilkov, A., Joiner, J., Spurr, R., Bhartia, P. K., Levelt, P., and Stephens, G.: Evaluation of the OMI cloud pressures derived from rotational Raman scattering by comparisons with other satellite data and radiative transfer simulations, J. Geophys. Res., 113, D15S19, https://doi.org/10.1029/2007JD008689, 2008.
Vasilkov, A., Yang, E.-S., Marchenko, S., Qin, W., Lamsal, L., Joiner, J., Krotkov, N., Haffner, D., Bhartia, P. K., and Spurr, R.: A cloud algorithm based on the O2-O2 477 nm absorption band featuring an advanced spectral fitting method and the use of surface geometry-dependent Lambertian-equivalent reflectivity, Atmos. Meas. Tech., 11, 4093–4107, https://doi.org/10.5194/amt-11-4093-2018, 2018.
Veefkind, J. P., Aben, I., McMullan, K., Foerster, H., de Vries, J., Otter, G., Claas, J., Eskes, H. J., de Haan, J. F., Kleipool, Q., van Weele, M., Hasekamp, O., Hoogeveen, R., Landgraf, J., Snel, R., Tol, P., Ingmann, P., Voors, R., Kruizinga, B., Vink, R., Visser, H., and Levelt, P. F.: TROPOMI on the ESA Sentinel-5 Precursor: A GMES mission for global observations of the atmospheric composition for climate, air quality and ozone layer applications, Remote Sens. Env., 120, 70–83, 2012.
Veihelmann, B., Levelt, P. F., Stammes, P., and Veefkind, J. P.: Simulation study of the aerosol information content in OMI spectral reflectance measurements, Atmos. Chem. Phys., 7, 3115–3127, https://doi.org/10.5194/acp-7-3115-2007, 2007.
Wagner, T., Beirle, S., Deutschmann, T., Grzegorski, M., and Platt, U.: Satellite monitoring of different vegetation types by differential optical absorption spectroscopy (DOAS) in the red spectral range, Atmos. Chem. Phys., 7, 69–79, https://doi.org/10.5194/acp-7-69-2007, 2007.
Wagner, T., Beirle, S., Deutschmann, T., and Penning de Vries, M.: A sensitivity analysis of Ring effect to aerosol properties and comparison to satellite observations, Atmos. Meas. Tech., 3, 1723–1751, https://doi.org/10.5194/amt-3-1723-2010, 2010.
Wagner, T., Beirle, S., Brauers, T., Deutschmann, T., Frieß, U., Hak, C., Halla, J. D., Heue, K. P., Junkermann, W., Li, X., Platt, U., and Pundt-Gruber, I.: Inversion of tropospheric profiles of aerosol extinction and HCHO and NO2 mixing ratios from MAX-DOAS observations in Milano during the summer of 2003 and comparison with independent data sets, Atmos. Meas. Tech., 4, 2685–2715, https://doi.org/10.5194/amt-4-2685-2011, 2011.
Wang, R., Tao, S., Wang, W., Liu, J., Shen, H., Shen, G., Wang, B., Liu, X., Li, W., Huang, Y., Zhang, Y., Lu, Y., Chen, H., Chen, Y., Wang, C., Zhu, D., Wang, X., Li, B., Liu, W., and M. J.: Black carbon emissions in China from 1949 to 2050, Environ. Sci. Technol., 46, 7595–7603, 2012.
Wang, Y., Lampel, J., Xie, P., Beirle, S., Li, A., Wu, D., and Wagner, T.: Ground-based MAX-DOAS observations of tropospheric aerosols, NO2, SO2 and HCHO in Wuxi, China, from 2011 to 2014, Atmos. Chem. Phys., 17, 2189–2215, https://doi.org/10.5194/acp-17-2189-2017, 2017.
Winker, D. M., Vaughan, M. A., Omar, A. H., Hu, Y., Powell, K. A., Liu, Z., Hunt, W. H., and Young, S. A.: Overview of the CALIPSO mission and CALIOP data processing algorithms, J. Atmos. Ocean. Technol., 26, 2310–2323, 2009.
Xu, X., Wang, J., Yang, Y., Zeng, J., Torres, O., Yang, Y., Marshak, A., Reid, J., and Miller, S.: Passive remote sensing of altitude and optical depth of dust plumes using the oxygen A and B bands: First results from EPIC/DSCOVR at Lagrange-1 point, Geophys. Res. Lett., 44, 7544–7554, 2017.
Xu, X., Wang, J., Wang, Y., Zeng, J., Torres, O., Reid, J. S., Miller, S. D., Martins, J. V., and Remer, L. A.: Detecting layer height of smoke aerosols over vegetated land and water surfaces via oxygen absorption bands: hourly results from EPIC/DSCOVR in deep space, Atmos. Meas. Tech., 12, 3269–3288, https://doi.org/10.5194/amt-12-3269-2019, 2019.
Zeng, Z.-C., Chen, S., Natraj, V., Le, T., Xu, F., Merrelli, A., Crisp, D., Sander, S. P., and Yung, Y. L.: Constraining the vertical distribution of coastal dust aerosol using OCO-2 O2 A-band measurements, Remote Sens. Env., 236, 111494, https://doi.org/10.1016/j.rse.2019.111494, 2020.