the Creative Commons Attribution 4.0 License.
the Creative Commons Attribution 4.0 License.
 | 03 Jun 2025
A channel selection methodology for enhancing volcanic SO2 monitoring using FY-3E/HIRAS-II hyperspectral data
Xinyu Li
Hongfu Sun
Ximing Lv
Chengli Qi
Huanhuan Yan
The Hyperspectral Infrared Atmospheric Sounder Type II (HIRAS-II) aboard the Fengyun 3E (FY-3E) satellite provides valuable data on the vertical distribution of atmospheric states. However, effectively extracting quantitative atmospheric information from the observations is challenging due to the large number of hyperspectral sensor channels, inter-channel correlations, associated observational errors, and susceptibility of the results to influence by trace gases. This study explores the potential of FY-3E/HIRAS-II in atmospheric loadings of SO2 from volcanic eruptions. A methodology for selecting SO2-sensitive channels from the large number of hyperspectral channels recorded by FY-3E/HIRAS-II is presented. The methodology allows for the selection of SO2-sensitive channels that contain similar information on variations in atmospheric temperature and water vapor for minimizing the influence of atmospheric water vapor and temperature on SO2. A sensitivity study shows that the difference in brightness temperature between the experimentally selected SO2-sensitive channels and the background channels' efficiency removes interference signals from surface temperature, atmospheric temperature, and water vapor during SO2 detection and inversion. A positive difference between near-surface atmospheric temperature and surface temperature enables the infrared band to capture more SO2 information in the lower and middle layers. The efficiency of FY-3E/HIRAS-II SO2-sensitive channels in quantitatively monitoring volcanic SO2 is demonstrated using data from the 29 April 2024 eruption of Mount Ruang in Indonesia. Using FY-3E/HIRAS-II measurements, the spatial distribution and qualitative information of volcanic SO2 is easily observed. The channel selection can significantly enhance the computational efficiency while maintaining the accuracy of SO2 detection and retrieval, despite the large volume of data.
- Article
(9332 KB) - Full-text XML
- BibTeX
- EndNote


Volcanoes pose significant threats to human populations around the world. During eruptions, they release a variety of gases (e.g., CO2 and SO2), liquids (e.g., H2O and H2SO4), and solids (e.g., glass, minerals, and salts), with far-reaching environmental and climatic impacts (Patrick et al., 2020). Understanding the vertical distributions of these substances is essential for analyzing their atmospheric reactions (Bauduin et al., 2017).
Sulfur dioxide (SO2) is a magmatic volatile compound that is critical for volcanic geochemical analysis and hazard assessment due to its low ambient concentration, high abundance in volcanic plumes, and distinct spectral characteristics (Schmidt et al., 2012). The 1991 eruption of Mount Pinatubo and the 2014 eruption of Mount Bárðarbunga are both significant volcanic SO2 eruption events, each producing SO2 plumes exceeding 1 × 10¹⁰ kg (Shibata and Kinoshita, 2015). The 1991 Pinatubo eruption in particular produced a plume that peaked at 40 km height, resulting in the largest atmospheric aerosol event since the 1883 Krakatoa eruption (Holasek et al., 1996). Similarly, the 1982 eruption of El Chichón released approximately 7.5 × 10⁹ kg of SO2 into the atmosphere, reaching 31 km in height (Carey and Sigurdsson, 1986). Tropospheric volcanic SO2 and its transformation products affect the environment, human health, air quality, and Earth's radiation balance (Gíslason et al., 2015). Hence, systematic monitoring of volcanic SO2 emissions is essential.
Satellite radiometry offers significant advantages for this purpose, including long-term continuity and extensive spatial coverage (Krueger et al., 2009). Ultraviolet (UV) band sensors are limited to monitoring SO2 from daytime eruptions due to their reflective nature. In contrast, general infrared (IR) sensors, with their broader channels, may filter out some SO2 spectral information (Watson et al., 2004). Different techniques have been developed which make use of satellite-based broadband IR channels to detect volcanic SO2 plumes (Corradini et al., 2021; Corradini et al., 2010; Doutriaux-Boucher and Dubuisson, 2009; Prata and Kerkmann, 2007; Prata et al., 2004; Tournigand et al., 2020). It is found that the strong absorption at 7.3 µm is heavily affected by low-level water vapor, and thus this channel is usually used to retrieve SO2 that is high (>3 km) in the atmosphere and hence above most of the water vapor (Taylor et al., 2018). In addition, the retrieval is very sensitive to uncertainties in surface temperature and emissivity (Corradini et al., 2009). Meanwhile, wide spectral channels are not sensitive enough to instantaneous changes in SO2 composition, which will increase the minimum concentration of SO2 components that can be monitored (Carn et al., 2003). Hyperspectral IR sensors enable observations with finer-channel bandwidths that accurately characterize and distinguish each component, thereby reducing interference from other materials (Milstein and Blackwell, 2016). Although hyperspectral IR sensors provide thousands of spectral channels, they cannot all be used simultaneously for near-real-time operations owing to unmanageable data volumes and high computational burdens (Li and Han, 2017). At the same time, substantial redundancy and correlation mean that not all channels need to be considered. In addition, the low spectral resolution of traditional multispectral sensors makes it difficult for them to distinguish between many important targets (Kruse, 2004) and is limited in quantitative calculations (Feng et al., 2006), thus reducing detection and retrieval accuracy.
To improve computational efficiency and detection accuracy, and to achieve rapid and accurate data acquisition, we require the selection of a set of channels that provide the maximum amount of information for specific applications (Chang et al., 2020). Rabier et al. (2002) proposed the “constant” iteration method for channel selection for the Infrared Atmospheric Sounding Interferometer (IASI) under clear-sky conditions, which maximized the information for applications. Fourrié and Rabier (2004) selected IASI channels for cloud-sensitive regions based on entropy reduction, demonstrating the robustness of the method. Gambacorta and Barnet (2013) used a physical approach to select channels based solely on their spectral characteristics, emphasizing spectral purity, avoidance of redundancy, vertical sensitivity, low instrument noise, and global optimality. Lipton (2003) developed a method to select atmospheric microwave sounding channels based on the combination of each channel's center frequency, bandwidth, and degrees of freedom for the signal, with both applicability to multiple environmental conditions and provision of robust retrieval performance taken into consideration. Noh et al. (2017) employed the channel score index to individually evaluate channels selected using a one-dimensional variational (1DVar) assimilation method. They used entropy subtraction for a comparative study of the selected channels, significantly reducing water vapor errors in the upper troposphere. Ventress and Dudhia (2014) proposed a 1DVar method for selecting IASI channels and compared it with the method currently employed to choose channels for numerical weather prediction; their method reduced the sensitivity of the channel set to unknown spectral correlations while maintaining the same number of degrees of freedom for the signal. As information entropy iterative techniques do not consider the dynamic impacts of measurements throughout time and only account for the reduction in atmospheric state uncertainty from a single measurement, Di et al. (2022) developed an alternative approach to channel selection for the geostationary hyperspectral IR sounder by incorporating an Mnindex that considers temporal variations in the variance of the Jacobian. The adapted algorithm improved the accuracy of water vapor profile inversion.
The Jacobian function reflects the sensitivity of the radiation measured at a given pressure level in the atmosphere to changes in substance concentration (Di et al., 2016). In this paper, we propose a channel selection method based on the Jacobian matrix for SO2 detection and retrieval using the Infrared Hyperspectral Atmospheric Vertical Sounder Type II (HIRAS-II) instrument aboard the Fengyun 3E (FY-3E) satellite.
The remainder of this paper is organized as follows. Section 2 details the data, the radiative transfer principle, and the radiative transfer model employed. Section 3 outlines the methodology of utilizing the Jacobian matrix to select sensitive and background channels for SO2 monitoring. Section 4 investigates the effects of surface temperature and near-surface air atmospheric temperature variations on SO2 as well as the sensitivity from detecting SO2 plumes in the preferred channels. Section 5 demonstrates the case study of Mount Ruang in the comparison of the effectiveness of SO2 detection between the preferred channels and other absorption channels. Finally, Sect. 6 provides a summary and a discussion of the main findings.
2.1 Radiative transfer model
The radiation observed by instruments at the top of the atmosphere (TOA) is modulated by the physical properties of both the atmosphere and Earth's surface (Aires et al., 2002). The atmospheric radiative transfer equation is a fundamental framework that governs the behavior of solar electromagnetic radiation and thermal radiation from both the atmosphere and the surface. It is crucial to analyzing radiative transfer processes and understanding atmospheric physical parameters (Seidel et al., 2010). In the absence of scattering, and assuming local thermal equilibrium, the atmospheric radiative transfer equation in the IR band can be formulated as follows:
where R is the spectral radiation, B is the Planck function at pressure level P, τ is the total atmospheric transmittance above pressure level P, ε is the surface emissivity, Ts is the surface temperature, T is the true atmospheric temperature, θ is the zenith angle, ρr is the solar reflectivity, Tsun is the solar temperature, and (Li, 1994). Among them, subscript “s” represents the surface skin and subscript “r” represents solar radiation. Term R represents the radiation reaching the satellite. The right-hand side of the equation has four components. The first is the surface emission term, which describes the radiation emitted from the surface that is transmitted through the atmosphere to the satellite. The second term accounts for the upward atmospheric radiation. The third term captures the contribution of downward atmospheric radiation reflected from the surface to the satellite. The fourth term represents the contribution of solar radiation to the IR band, which can be neglected here because our focus is on the mid-wave and longwave IR regions.
To calculate the TOA radiation using Eq. (1), the atmosphere is typically discretized into multiple layers, whose average properties (e.g., temperature, pressure, and molecular species) can be determined. Radiative transfer models facilitate this by allowing precise computation of radiation transmitted through atmospheric gases.
This study uses the Line-By-Line Radiative Transfer Model (LBLRTM), which is a sophisticated, vectorized model derived from Fast Atmospheric Signature Code. The LBLRTM can accurately compute atmospheric fluxes and heating rates, making it well-suited to retrieving atmospheric temperature profiles and trace gas concentrations from high-resolution spectral radiance data (Clough et al., 2005). The LBLRTM allows for the input of user-defined atmospheric profile files. In this study, the meteorological data input into the LBLRTM consists of six standard atmospheric profiles: the 1976 US Standard Atmosphere and profiles for mid-latitude summer, mid-latitude winter, subarctic summer, and subarctic winter (Krueger and Minzner, 1976). These profiles provide 99 vertical levels of atmospheric parameters such as temperature, water vapor concentration, and SO2. Additional inputs include surface temperature, satellite zenith angle, and specific spectral band information, which are essential for calculating the simulated radiance and the Jacobian matrix. Given the spectral absorption characteristics of water vapor, temperature, and SO2 in the IR region, this study focuses on the mid-wave and longwave IR bands observed by FY-3E/HIRAS-II.
2.2 FY-3E/HIRAS-II data
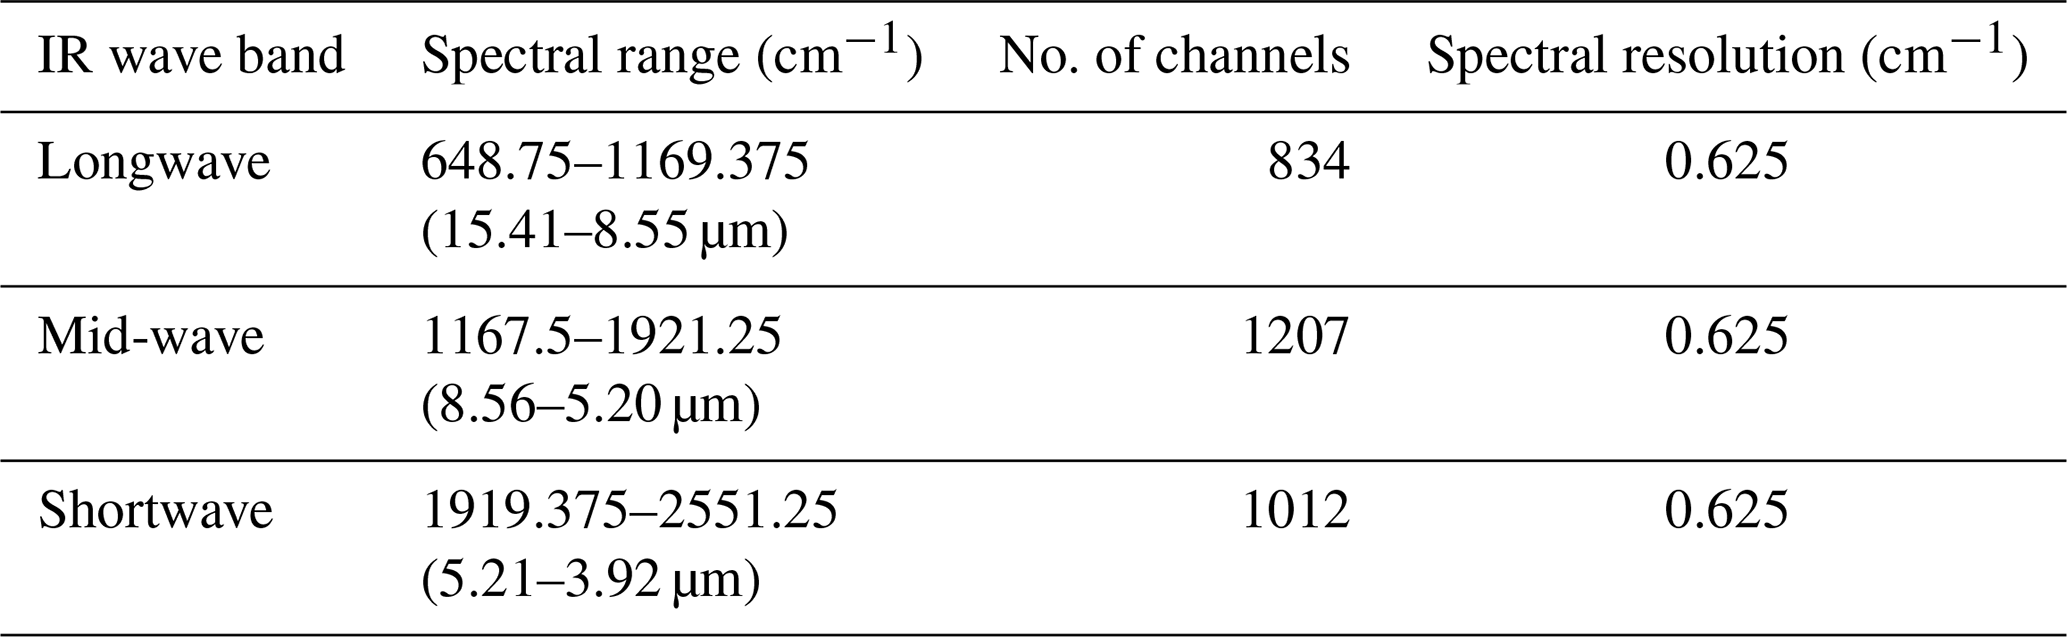
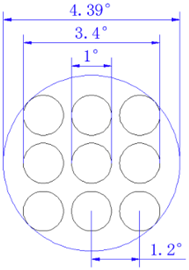
The FY-3E meteorological satellite is the world's first civilian dawn–dusk-orbiting meteorological satellite (Zhang et al., 2022). It is part of China's second-generation polar-orbiting meteorological satellite series. Launched in July 2021, it delivers global cross-spectral atmospheric temperature and humidity vertical distribution data twice daily, in the morning and evening. Working at an inclination of 98.75° and an altitude of 836 km, FY-3E completes 14 orbits around Earth's poles each day, with each orbit taking ∼ 101.5 min, thus achieving comprehensive global coverage after 14 orbits. The satellite's HIRAS-II sensor features 3053 IR channels: 834 longwave, 1207 mid-wave, and 1012 shortwave. Its measurements span a continuous spectrum range of 648.75 to 2551.25 cm−1 at a resolution of 0.625 cm−1. Each infrared band contains 3 × 3 detector arrays, which simultaneously observe the target area. A complete scanning cycle of HIRAS-II lasts 8 s, the instantaneous field of view (FOV) of each detector to the ground is 1.1°, and Fig. 1 is a schematic diagram of the field of view (Li et al., 2022). Based on the radiometric specifications for FY-3E/HIRAS-II, the noise-equivalent differential temperature (NEdT) is specified within 0.2–0.4 K for the longwave IR band, 0.2–0.3 K (at 280 K) for the mid-wave IR band, and 0.8–2.4 K (at 280 K) for the shortwave IR band (Huang et al., 2023). Overall, it delivers high-resolution IR spectra of the ground–atmosphere system. FY-3E/HIRAS-II data are freely available from the FENGYUN Satellite Data Service (https://satellite.nsmc.org.cn/DataPortal/cn/home/index.html, last access: 18 June 2024).
Table 1Spectral parameters of the FY-3E/HIRAS-II channels (Xie et al., 2023).
In practical applications, the Level-1 (L1) observation data from HIRAS-II require apodization to mitigate side-lobe effects (Xie et al., 2023). This is accomplished in the present study using the Hamming window function. In addition, radiometric measurements are typically integrated over a wavenumber interval and modified by the instrument's line shape (Crevoisier et al., 2003). Consequently, we convolve the simulated BT with the FY-3E/HIRAS-II spectral response function to facilitate subsequent channel selection.
2.3 Sentinel-5P/TROPOMI SO2 data
Sentinel-5P is a quasi-polar, sun-synchronous satellite in a low Earth orbit with a height of about 824 km, and it covers the entire planet each day (van Geffen et al., 2020). Every orbital period lasts 16 d, with an average of 227 orbits every period (14 orbits per day) (Corradino et al., 2024). The satellite hosts the Tropospheric Monitoring Instrument (TROPOMI). Daily or subdaily revisits of specific sites are achievable, given TROPOMI's 108° cross-orbit field of view and its ability to capture data across multiple orbits (Theys et al., 2017). Since 2019, Sentinel-5P's spatial resolution has been enhanced to 3.5 km × 5.5 km. TROPOMI measures data across four spectral regions (ultraviolet, visible, near-infrared, and shortwave infrared) and is adept at monitoring SO2 and a range of other gases (Theys et al., 2019). With a comparable footprint of 12 km in diameter, TROPOMI demonstrates greater sensitivity to SO2 variations than IASI (Cofano et al., 2021).
This study uses TROPOMI's Level-2 (L2) geophysical SO2 products, accessible through the European Space Agency's Copernicus Open Access Center via the Sentinel-5P Pre-Operations Hub. We use the offline (OFFL) data of this version, which are freely available (Copernicus Sentinel-5P, 2020). These L2 products are derived from Level-0 (L0) raw data, which undergo calibration and georeferencing, followed by processing to Level-1b (L1b) data, including brightness and irradiance. In this study, Sentinel-5P/TROPOMI SO2 data are primarily employed to validate the SO2 detection capabilities of FY-3E/HIRAS-II at Mount Ruang (Inness et al., 2022).
2.4 Atmospheric profile data
This study employs standard atmospheric profile data as inputs for the LBLRTM. The profiles used are the US Standard Atmosphere, 1976, as well as tropical, mid-latitude summer and winter, and subarctic summer and winter profiles. The US Standard Atmosphere, 1976, serves as an idealized stable representation of Earth's atmosphere from the surface to 1000 km, detailing the relative changes in atmospheric composition with altitude. Below 86 km, the atmospheric composition is calculated using a series of linear functions, while the upper region is defined by continuous functions that closely approximate observational data (Krueger and Minzner, 1976).
ERA5 is the latest comprehensive reanalysis dataset from the European Centre for Medium-Range Weather Forecasts (ECMWF), superseding ERA-Interim. With daily updates, ERA5 provides hourly estimates of the world's atmosphere, land surface, and waves in the ocean from 1950 onward (Hersbach et al., 2020). Each profile from ERA5 has a horizontal scale of 31 km. This includes upper-air parameters at 37 fixed pressure levels from 1000 to 1 hPa and 137 model levels distributed using the hybrid sigma-pressure coordinate system. For this study, we interpolate ERA5 400 hPa fixed pressure level data to assess atmospheric water vapor conditions near Mount Ruang, concurrent with FY-3E/HIRAS-II observations.
When selecting channels, it is crucial to avoid bands with cloud or aerosol interference and longwave channels that provide redundant information (Tsuchiya, 1983). In addition, as the temperature Jacobian matrices of the water vapor and ozone channels can be strongly influenced by the state of the atmosphere, they should not be used as the main sources of temperature information (Kuai et al., 2010). Therefore, different sets of channels should be considered at various stages during the channel selection process. This research suggests two primary steps for channel selection, as follows:
-
Initially, channels are excluded through prescreening, which eliminates regions of high uncertainty in the simulated spectrum based on specific criteria.
-
The primary channel selection algorithm is based on Jacobian calculations as a measure of the information content of various atmospheric species and is executed through multiple independent selection operations.
3.1 Channel prescreening
Channel prescreening rejects spectral regions that would bring substantial uncertainty into the subsequent simulation phase, thus enhancing the efficiency of and reducing data redundancy in the forward simulations (Li et al., 2022). We prescreened the mid-wave and longwave IR bands by eliminating trace gas absorption channels and applying a threshold to the NEdT.
The first step eliminates channels with strong absorption of trace gases. For any of the six standard atmospheric profiles, channels are removed if changes in trace gas content induce a BT shift of >1 K. Channels are retained if the gas-induced BT change is <1 K; the influence of these gases is then incorporated into the forward model for simulation. Of the nine trace gases (CH4, CO, N2O, CCl4, CFC-11, CFC-12, CFC-14, HNO3, NO2, OCS, and NO), only the first three significantly affect the channel BT (Collard, 2007). As the absorption bands of CO and N2O fall outside this study's spectral range, we focus on CH4 for testing. Channels significantly influenced by ozone and solar irradiance are also excluded.
The second step involves eliminating channels with excessive noise. To minimize the risk of excluding relevant spectral bands or retaining inappropriate bands, a threshold of 0.2 K for the NEdT is adopted as the prescreening criterion for channel selection.
The third step excludes channels with nonlinear Jacobian matrices and multiple Jacobian peaks. Using the LBLRTM model and six standard atmospheric profiles, we calculate the Jacobian matrix for temperature and water vapor. Channels exhibiting significant double or multiple peaks in the Jacobian matrices are excluded. Figure 2 illustrates the channels rejected during prescreening: the red areas indicate channels influenced by O3, the purple areas are those affected by CH4, and the yellow areas are those with multiple peaks in the Jacobian matrix.
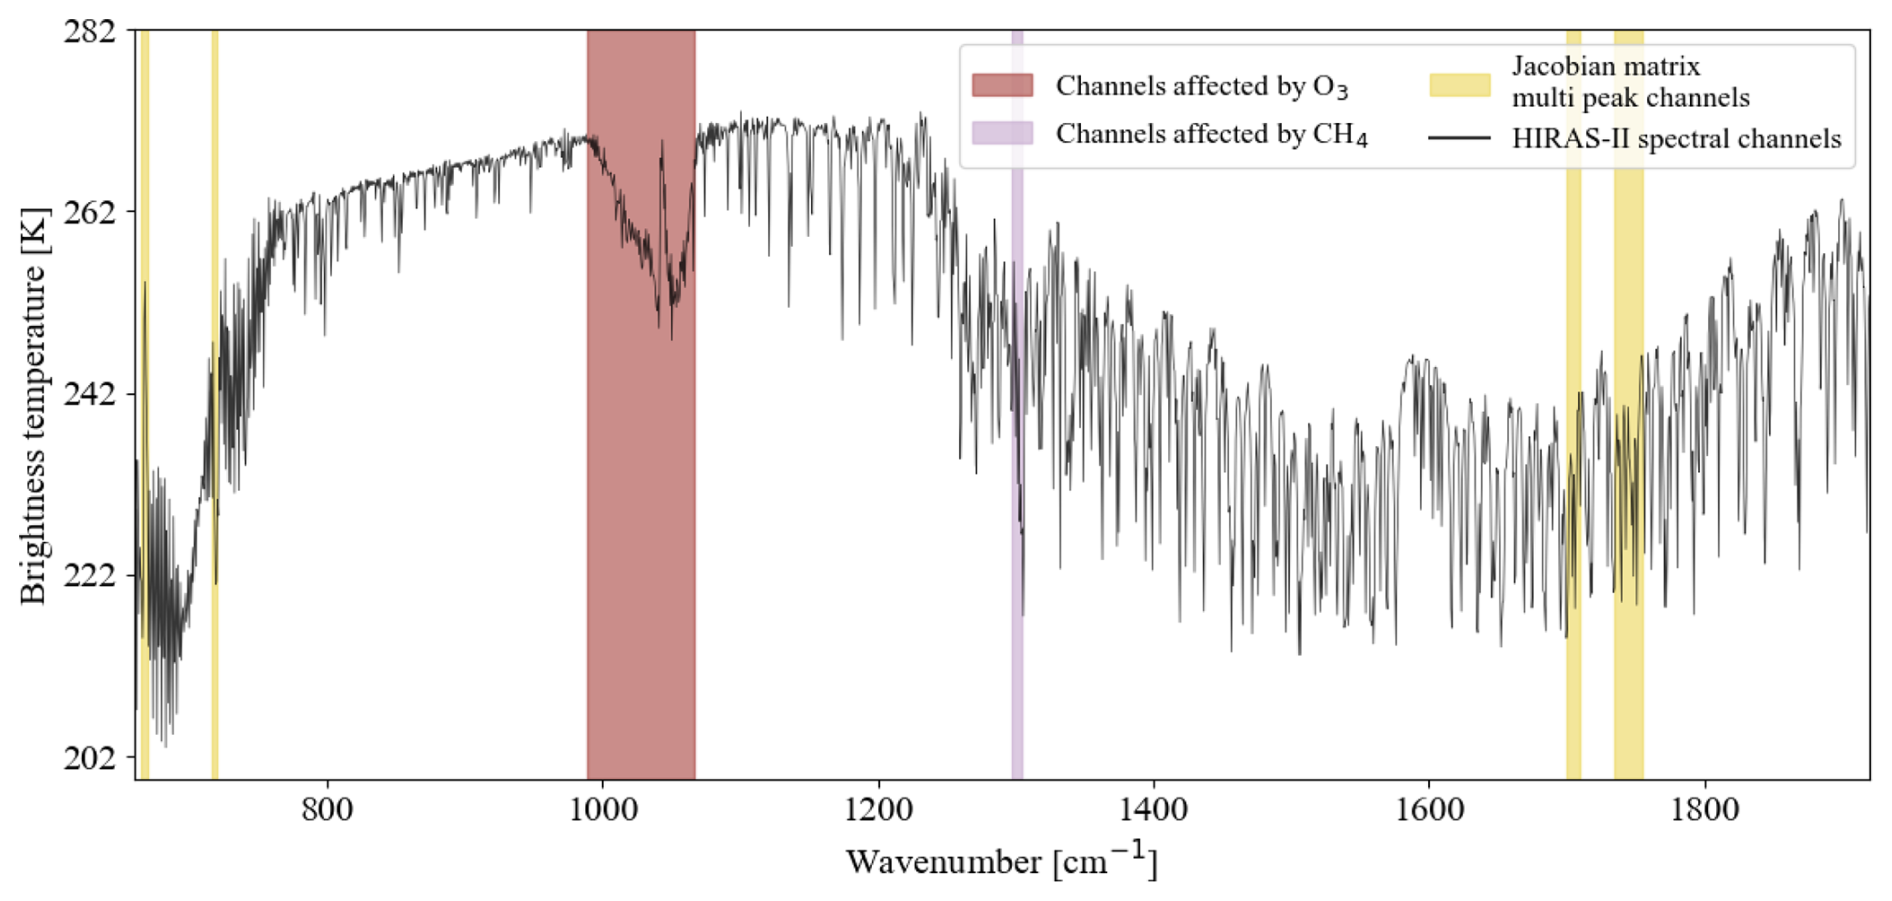
Figure 2FY-3E/HIRAS-II channel prescreening results: red and purple highlight channels affected by O3 and CH4, respectively. Yellow highlights channels with multiple peaks in the Jacobian matrix.
3.2 Jacobian-matrix-based information analysis
We calculate and analyze the information generated by water vapor, temperature, and SO2 at different altitudes to select and utilize the most relevant channels. To evaluate the capability of HIRAS-II channels to provide information on these parameters, we employ the Jacobian matrix for channel selection. The Jacobian functions can identify a set of optimal channels with maximum or minimum information content for each atmospheric profile. It assesses the sensitivity of radiation to the specific physical and chemical parameters. For a specified wavenumber (ν), the sensitivity of BT to variations in geophysical parameters (X) is represented by the Jacobian matrix for each pressure layer (Coopmann et al., 2020) as follows:
The Jacobian matrix illustrates the sensitivity of atmospheric BT to temperature, humidity, and various gas concentrations at a given wavenumber (Aires et al., 2016).
Three key parameters for measuring the properties of a Jacobian matrix are employed. The first parameter is the maximum value of each Jacobian matrix, denoted as M, quantifying the information (here, all discussions of M in this paper only consider its maximum value, i.e., |M|). The second is the pressure level P, corresponding to the height where the Jacobian matrix attains its peak value and indicating the altitude at which the IR radiation is most responsive to variations in atmospheric composition. The third parameter, dP, represents the width at half-maximum of the Jacobian matrix peak, defined as the pressure difference between the two levels where the Jacobian matrix value drops to half of its maximum. This metric represents the vertical extent of the atmospheric layer contributing most significantly to the IR signal. Figure 3 schematically represents the SO2 profile, the Jacobian peak, and the maximum half-width of the Jacobian matrix under the conditions of the US Standard Atmosphere, 1976.
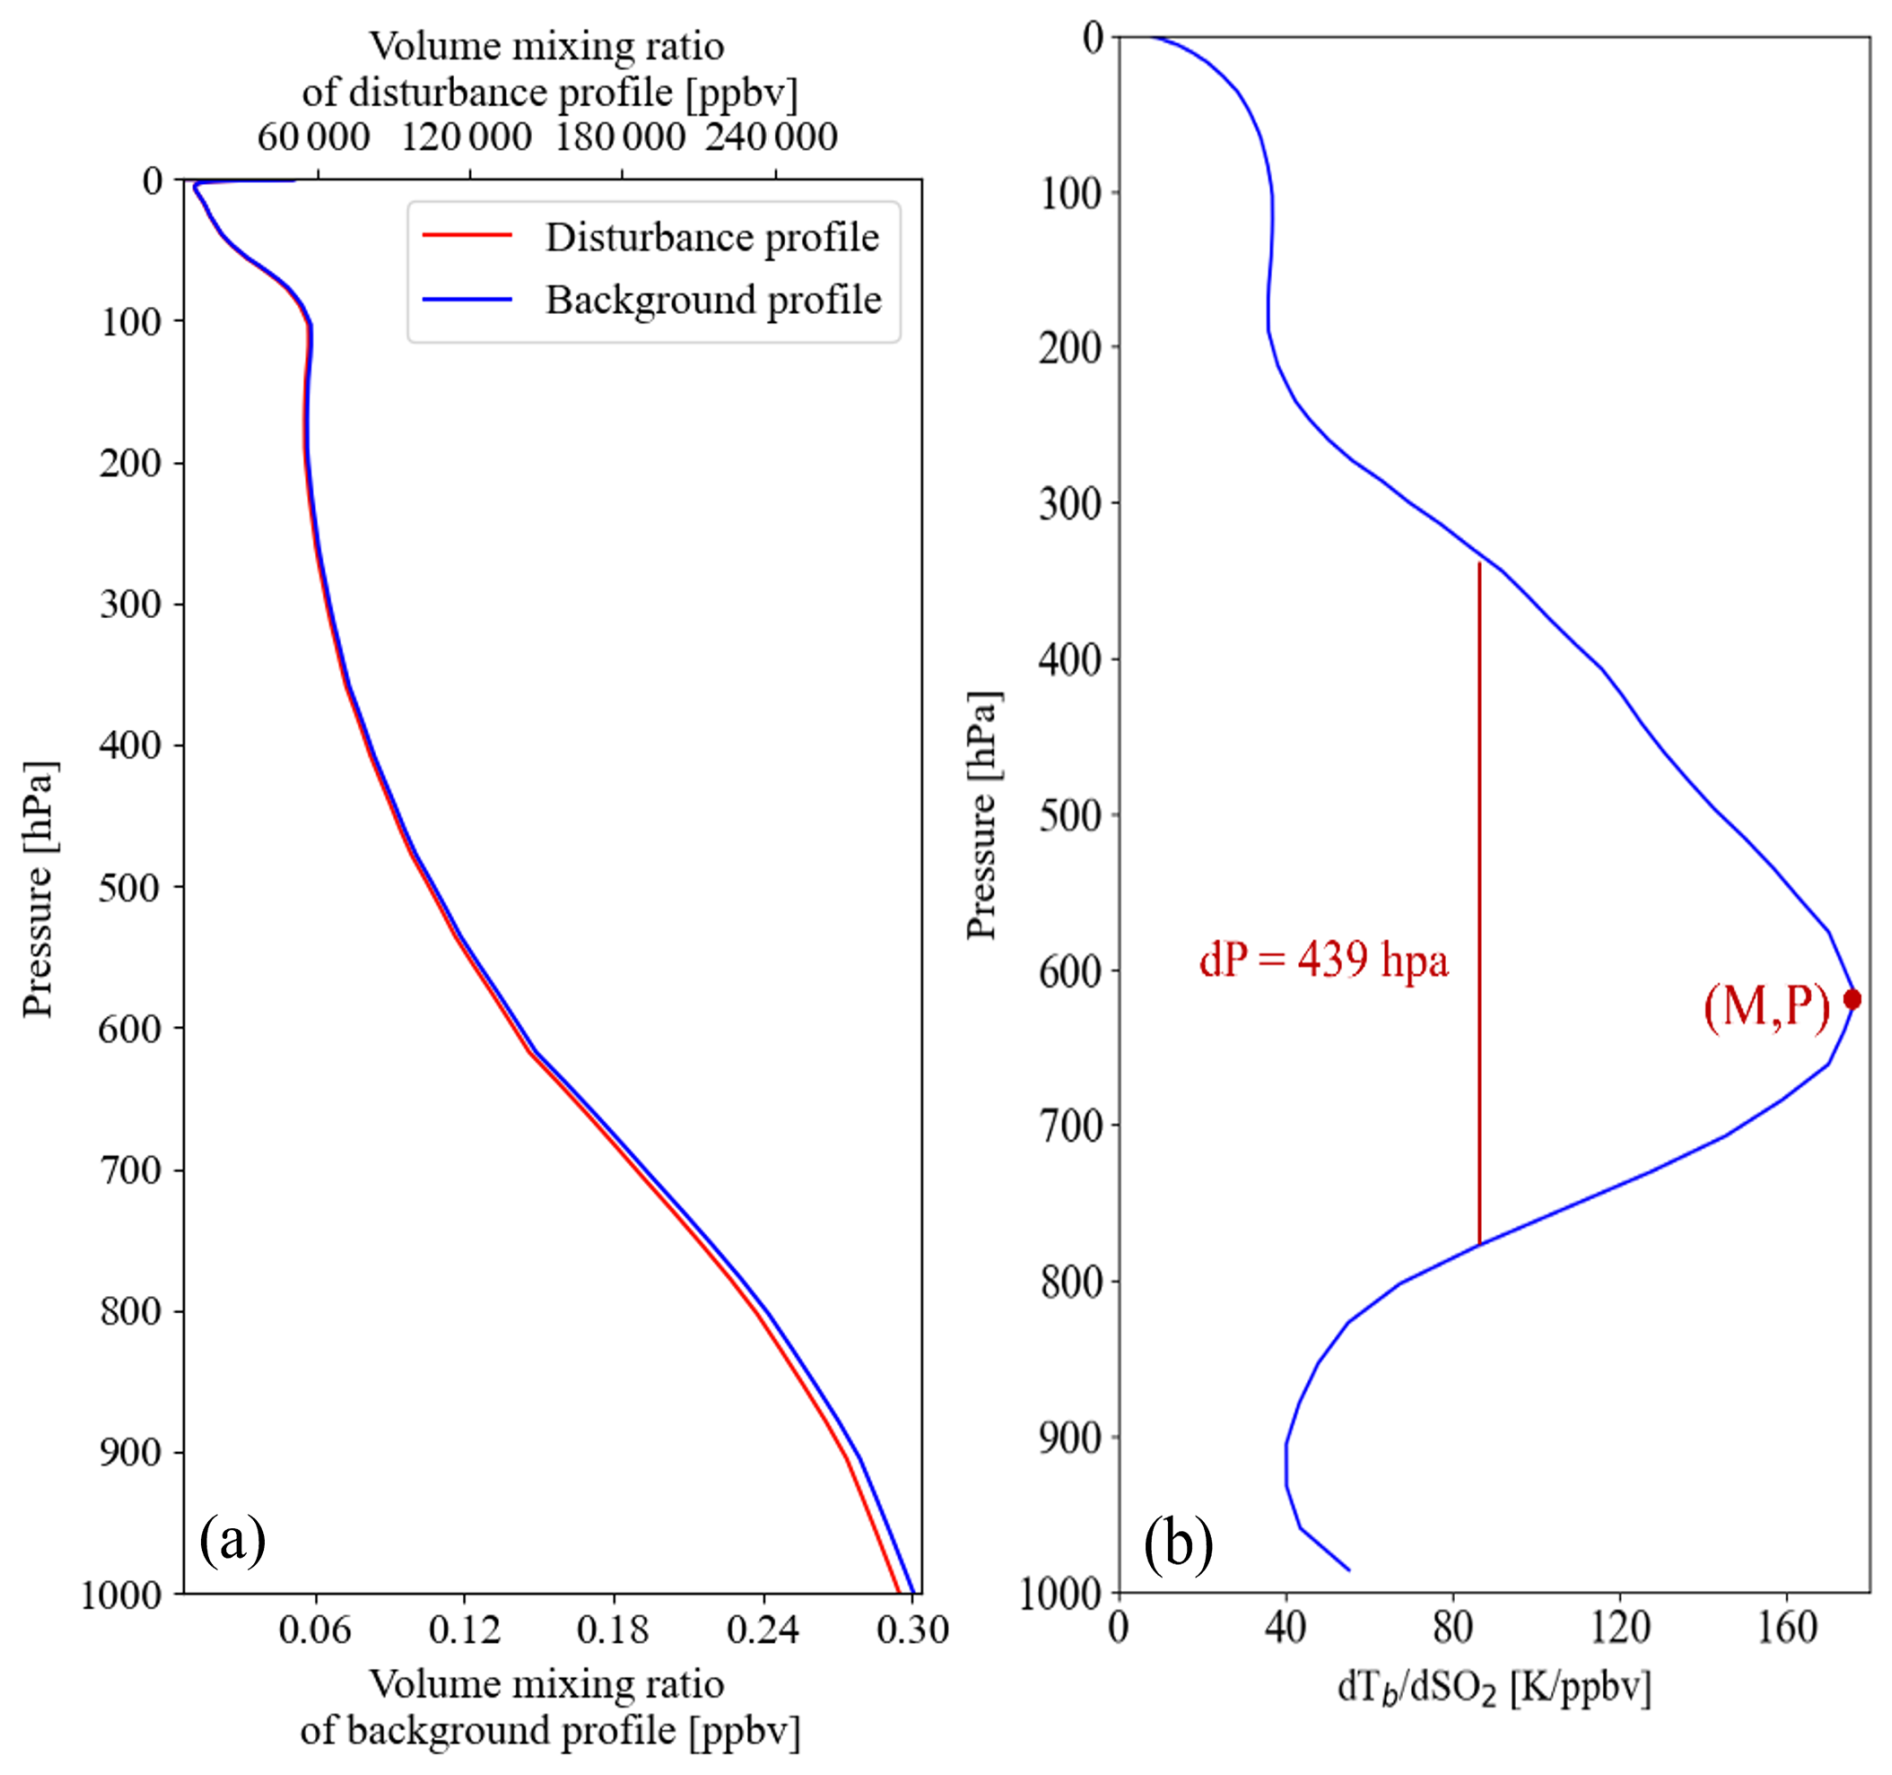
Figure 3Representation of the maximum half-width and peak value of the SO2 Jacobian function for the US Standard Atmosphere, 1976: (a) SO2 profile and (b) 1163.125 cm−1 channel.
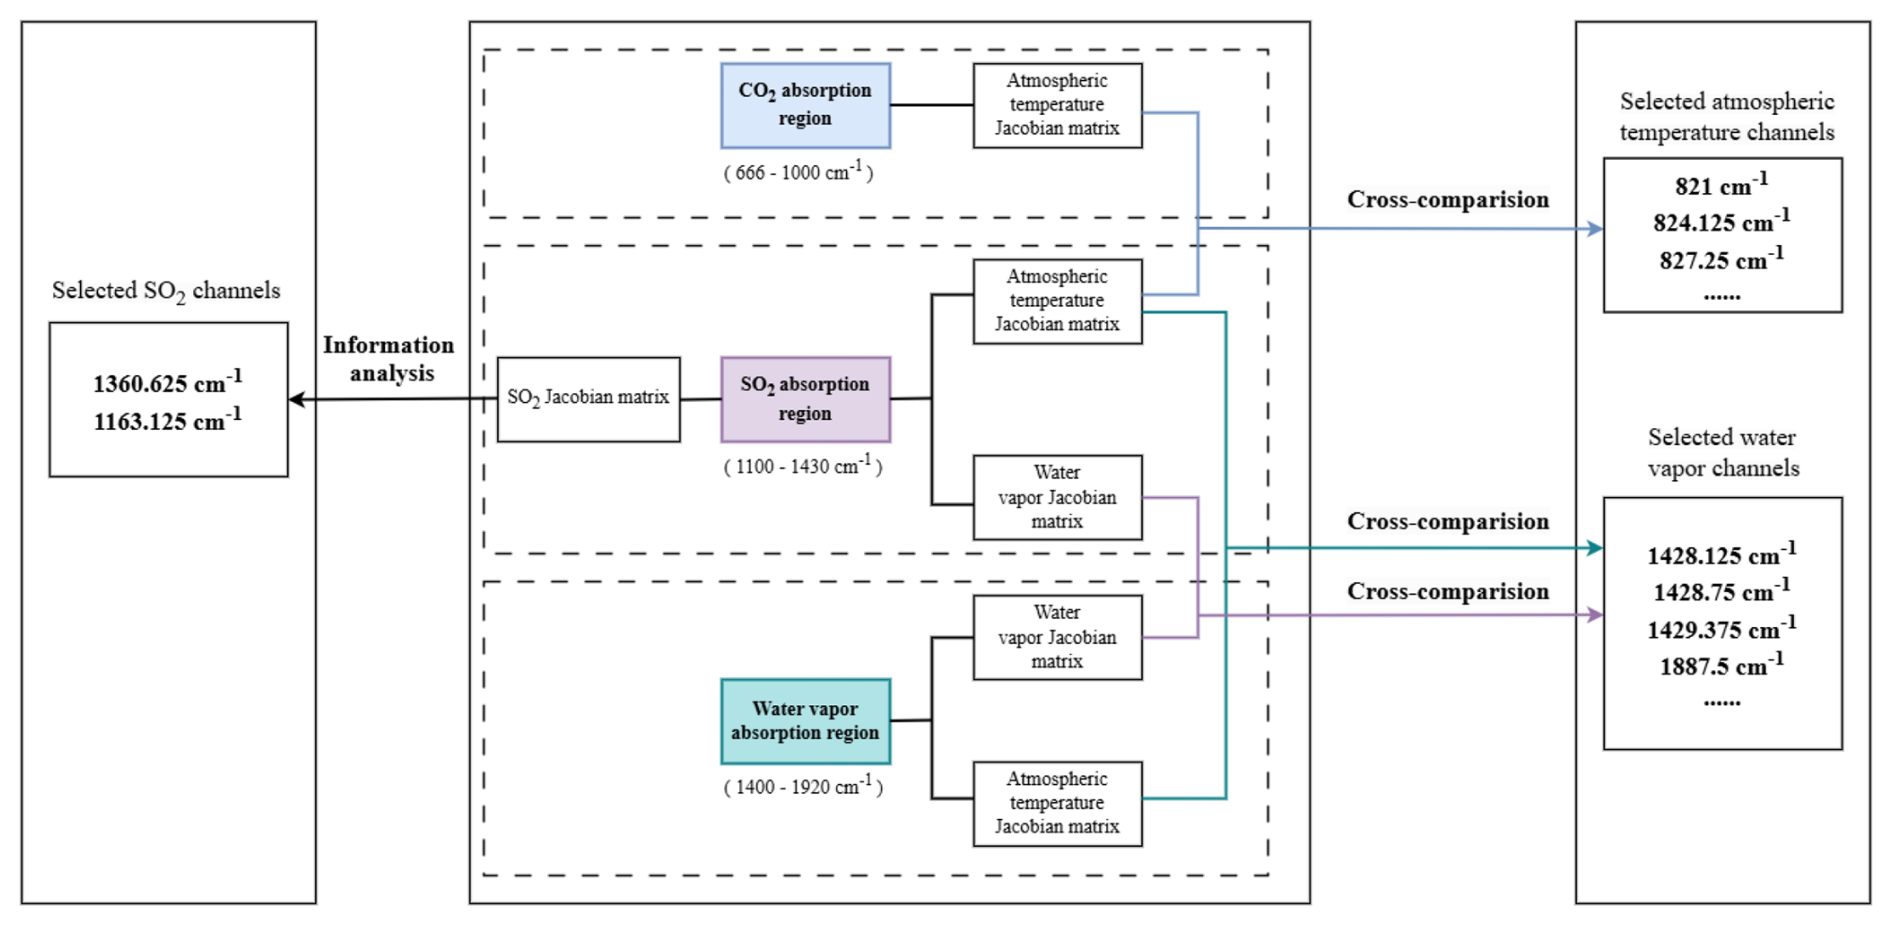
To accurately monitor SO2, it is essential to minimize the interference of atmospheric temperature and water vapor in the SO2 channels. Since the radiance signals from SO2 channels are simultaneously influenced by atmospheric temperature, water vapor, and SO2, it is necessary to utilize other channels to provide independent atmospheric temperature and water vapor information for separation. In selecting channels minimally influenced by atmospheric temperature, we prioritize those channels that are primarily sensitive to a single gas with a constant concentration, and CO2 absorption channels primarily reflect the information in atmospheric temperature profiles (Li et al., 2022). Consequently, we utilize the spectral absorption region of CO2 (666–1000 cm−1) to calculate the temperature Jacobian matrix and combine this with the atmospheric IR window channel to select the atmospheric temperature channels. Water vapor channels contain both temperature and water vapor information, while SO2 channels contain information on temperature, water vapor, and SO2. To separate temperature from water vapor in water vapor absorption channel radiances, CO2 channels play an important role by providing temperature information. If a water vapor absorption channel and a CO2 absorption channel have similar temperature Jacobians, they also have a similar temperature sensitivity, and thus that CO2 channel is helpful for separating the temperature from water vapor in the water vapor channel radiance. As with a SO2 channel, if a water vapor channel has a similar temperature Jacobian and water vapor Jacobian, the water vapor channel is helpful for separating temperature and water vapor from SO2 in that SO2 channel radiance. During the cross-comparison of channel selection, we ensure that the water vapor Jacobian matrix and temperature Jacobian matrix within the water vapor absorption region are consistent with those in the SO2 channels. Thus, when subtracting the brightness temperature of the SO2 channels from that of the water vapor channels, the influence of water vapor, atmospheric temperature, and surface radiation shared by both channels can be effectively removed.
The specific channel selection process is shown in Fig. 4: it illustrates the cross-comparison process using the three key parameters of Jacobian matrices in the ranges of the SO2, water vapor, and CO2 absorption regions. Initially, we computed the temperature, water vapor, and SO2 Jacobian matrix for the six standard atmospheric profiles. Then, the similarities in the peak and half-width of the Jacobian matrix at a specific pressure level P for HIRAS-II channels in the SO2, water vapor, and temperature absorption regions were cross-compared. The temperature Jacobian information for the atmospheric temperature channels and the water vapor Jacobian information for the water vapor channels need to align with that of the SO2 channels to minimize the influence of atmospheric water vapor and temperature on SO2. Similarly, the temperature and water vapor Jacobian information for the water vapor channels must match the corresponding information for the SO2 channels. Consequently, when SO2 concentration changes, the similarity of the water vapor and temperature Jacobian matrices between the SO2 channels and the water vapor channels can effectively eliminate the interference of atmospheric temperature and water vapor with SO2 monitoring results.
Using this information, we then identify the atmospheric temperature channels, water vapor absorption channels, and SO2-sensitive channels. Considering the variability in the sensitivity of the HIRAS-II channels to the atmospheric conditions, we utilize 1040 hPa as the near-surface atmospheric pressure and compute the Jacobian matrices for water vapor, temperature, and SO2 across 99 vertical layers of the six atmospheric profiles.
3.2.1 SO2 channel selection
In situ measurements reported by Rose et al. (2004) indicate SO2 concentrations of 500–1000 ppbv during an aircraft encounter with a 35 h volcanic plume from the Icelandic Hekla eruption in February 2000, at a distance of approximately 1300 km from the source. In comparison, the concentration of SO2 in the clean troposphere typically ranges from 0.25 to 0.43 ppbv (Casadevall et al., 1984). Given that SO2 concentrations increase dramatically over a short period during volcanic eruptions, for SO2, we perturb the atmospheric profiles at different pressure levels using 5×10⁴ times gas content to better represent the gas distribution characteristics in volcanic eruption scenarios. Given the low SO2 content under the other five atmospheric conditions, this study focuses on the SO2 information for the US Standard Atmosphere, 1976. The corresponding SO2 Jacobian functions (Fig. 5) clearly show that the SO2 absorption region is mainly located around the central wavenumbers of 1360 and 1163 cm−1. The 1360 cm−1 band exhibits the strongest SO2 signal among the available spectral bands. However, it is also a strong absorption region for atmospheric water vapor, which can introduce contamination into SO2 retrievals. This band demonstrates minimal sensitivity to radiative contributions from the surface and lower atmosphere, making it particularly effective in monitoring stratospheric SO2 plumes (Thomas and Watson, 2010). In contrast, the 1163 cm−1 band falls within an atmospheric window region. While the presence of SO2 in this band leads to a certain degree of radiative attenuation, it remains well-suited for detecting SO2 plumes in the troposphere (Carboni et al., 2016). This characteristic makes it especially valuable for monitoring volcanic activity characterized by continuous passive degassing. By leveraging the complementary strengths of these bands, we select SO2-sensitive channels with central wavenumbers around 1163 and 1360 cm−1. In addition, SO2 absorption information is discernible at various altitudes in the atmosphere, particularly in the middle atmosphere and near the surface. To obtain pure SO2 absorption information, it is essential to eliminate information about the surface temperature, atmospheric temperature, and water vapor that might interfere with the SO2 observation channels, thereby avoiding overestimation or misestimation of the SO2 content and dispersion trends. We selected the top channels with the highest Jacobian matrix values in the SO2 absorption region near 1360 and 1163 cm−1, which are 1360.625 and 1163.125 cm−1. These two channels contain prominent SO2 absorption information.
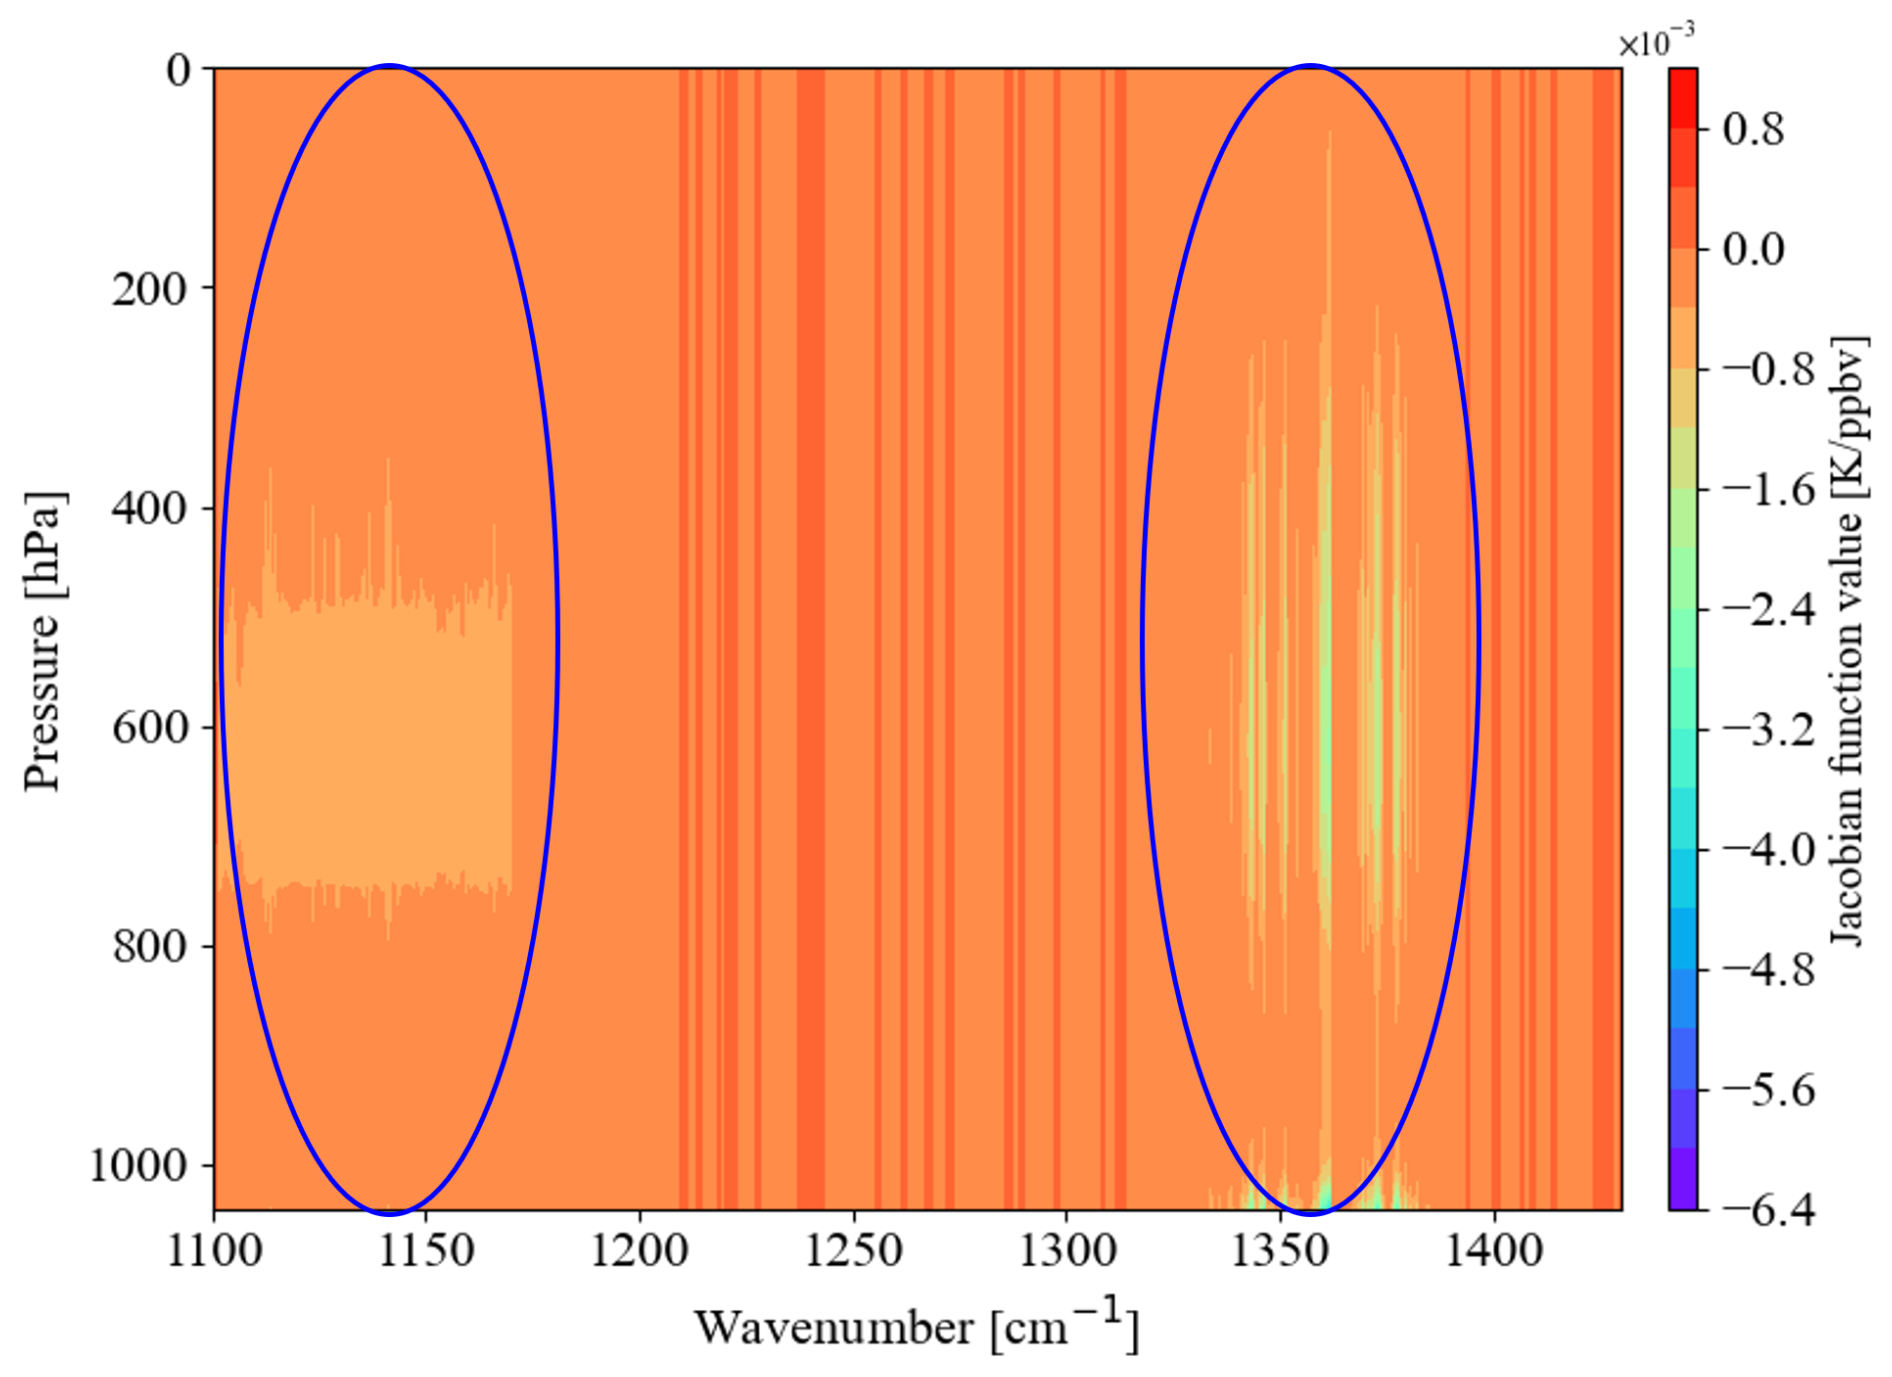
Figure 5Schematic diagram of the SO2 Jacobian matrix with atmospheric profiles from the US Standard Atmosphere, 1976.
3.2.2 Atmospheric temperature channel selection
Volcanic eruptions typically change the temperature of the stratosphere and troposphere, making it essential to eliminate any interference effect of atmospheric temperature on SO2 observations (Yang and Schlesinger, 2002). Figure 6a–f show temperature Jacobian functions for the six atmospheric profiles, revealing that near-surface temperatures are more responsive to temperature perturbations in the tropical, mid-latitude summer, subarctic summer, and US Standard Atmosphere, 1976, profiles, while the mid-latitude winter and subarctic winter profiles exhibit greater fluctuations at higher altitudes. For the atmospheric temperature channels, it is crucial that the temperature Jacobian functions peak at the same altitudes as those of the SO2 channels and have similar half-widths of their Jacobian functions. We compare the temperature Jacobian functions of the SO2 channels with that of the atmospheric temperature absorption region under each set of atmospheric profiles, so that each channel in the atmospheric temperature absorption region can be compared with all channels in the SO2 absorption region for atmospheric temperature absorption information. First, we filter out channels where both peak at the same altitude. Then we determine the final atmospheric temperature channels using a threshold of a half-width difference of <0.1. Channels meeting these conditions, along with the SO2 channels, exhibit consistent temperature absorption information and adequately cover the atmospheric temperature channels for the six observed atmospheric conditions. According to Fig. 7, many channels in the atmospheric temperature absorption region also have similar atmospheric temperature absorption information, with multiple SO2 channels at the same time.
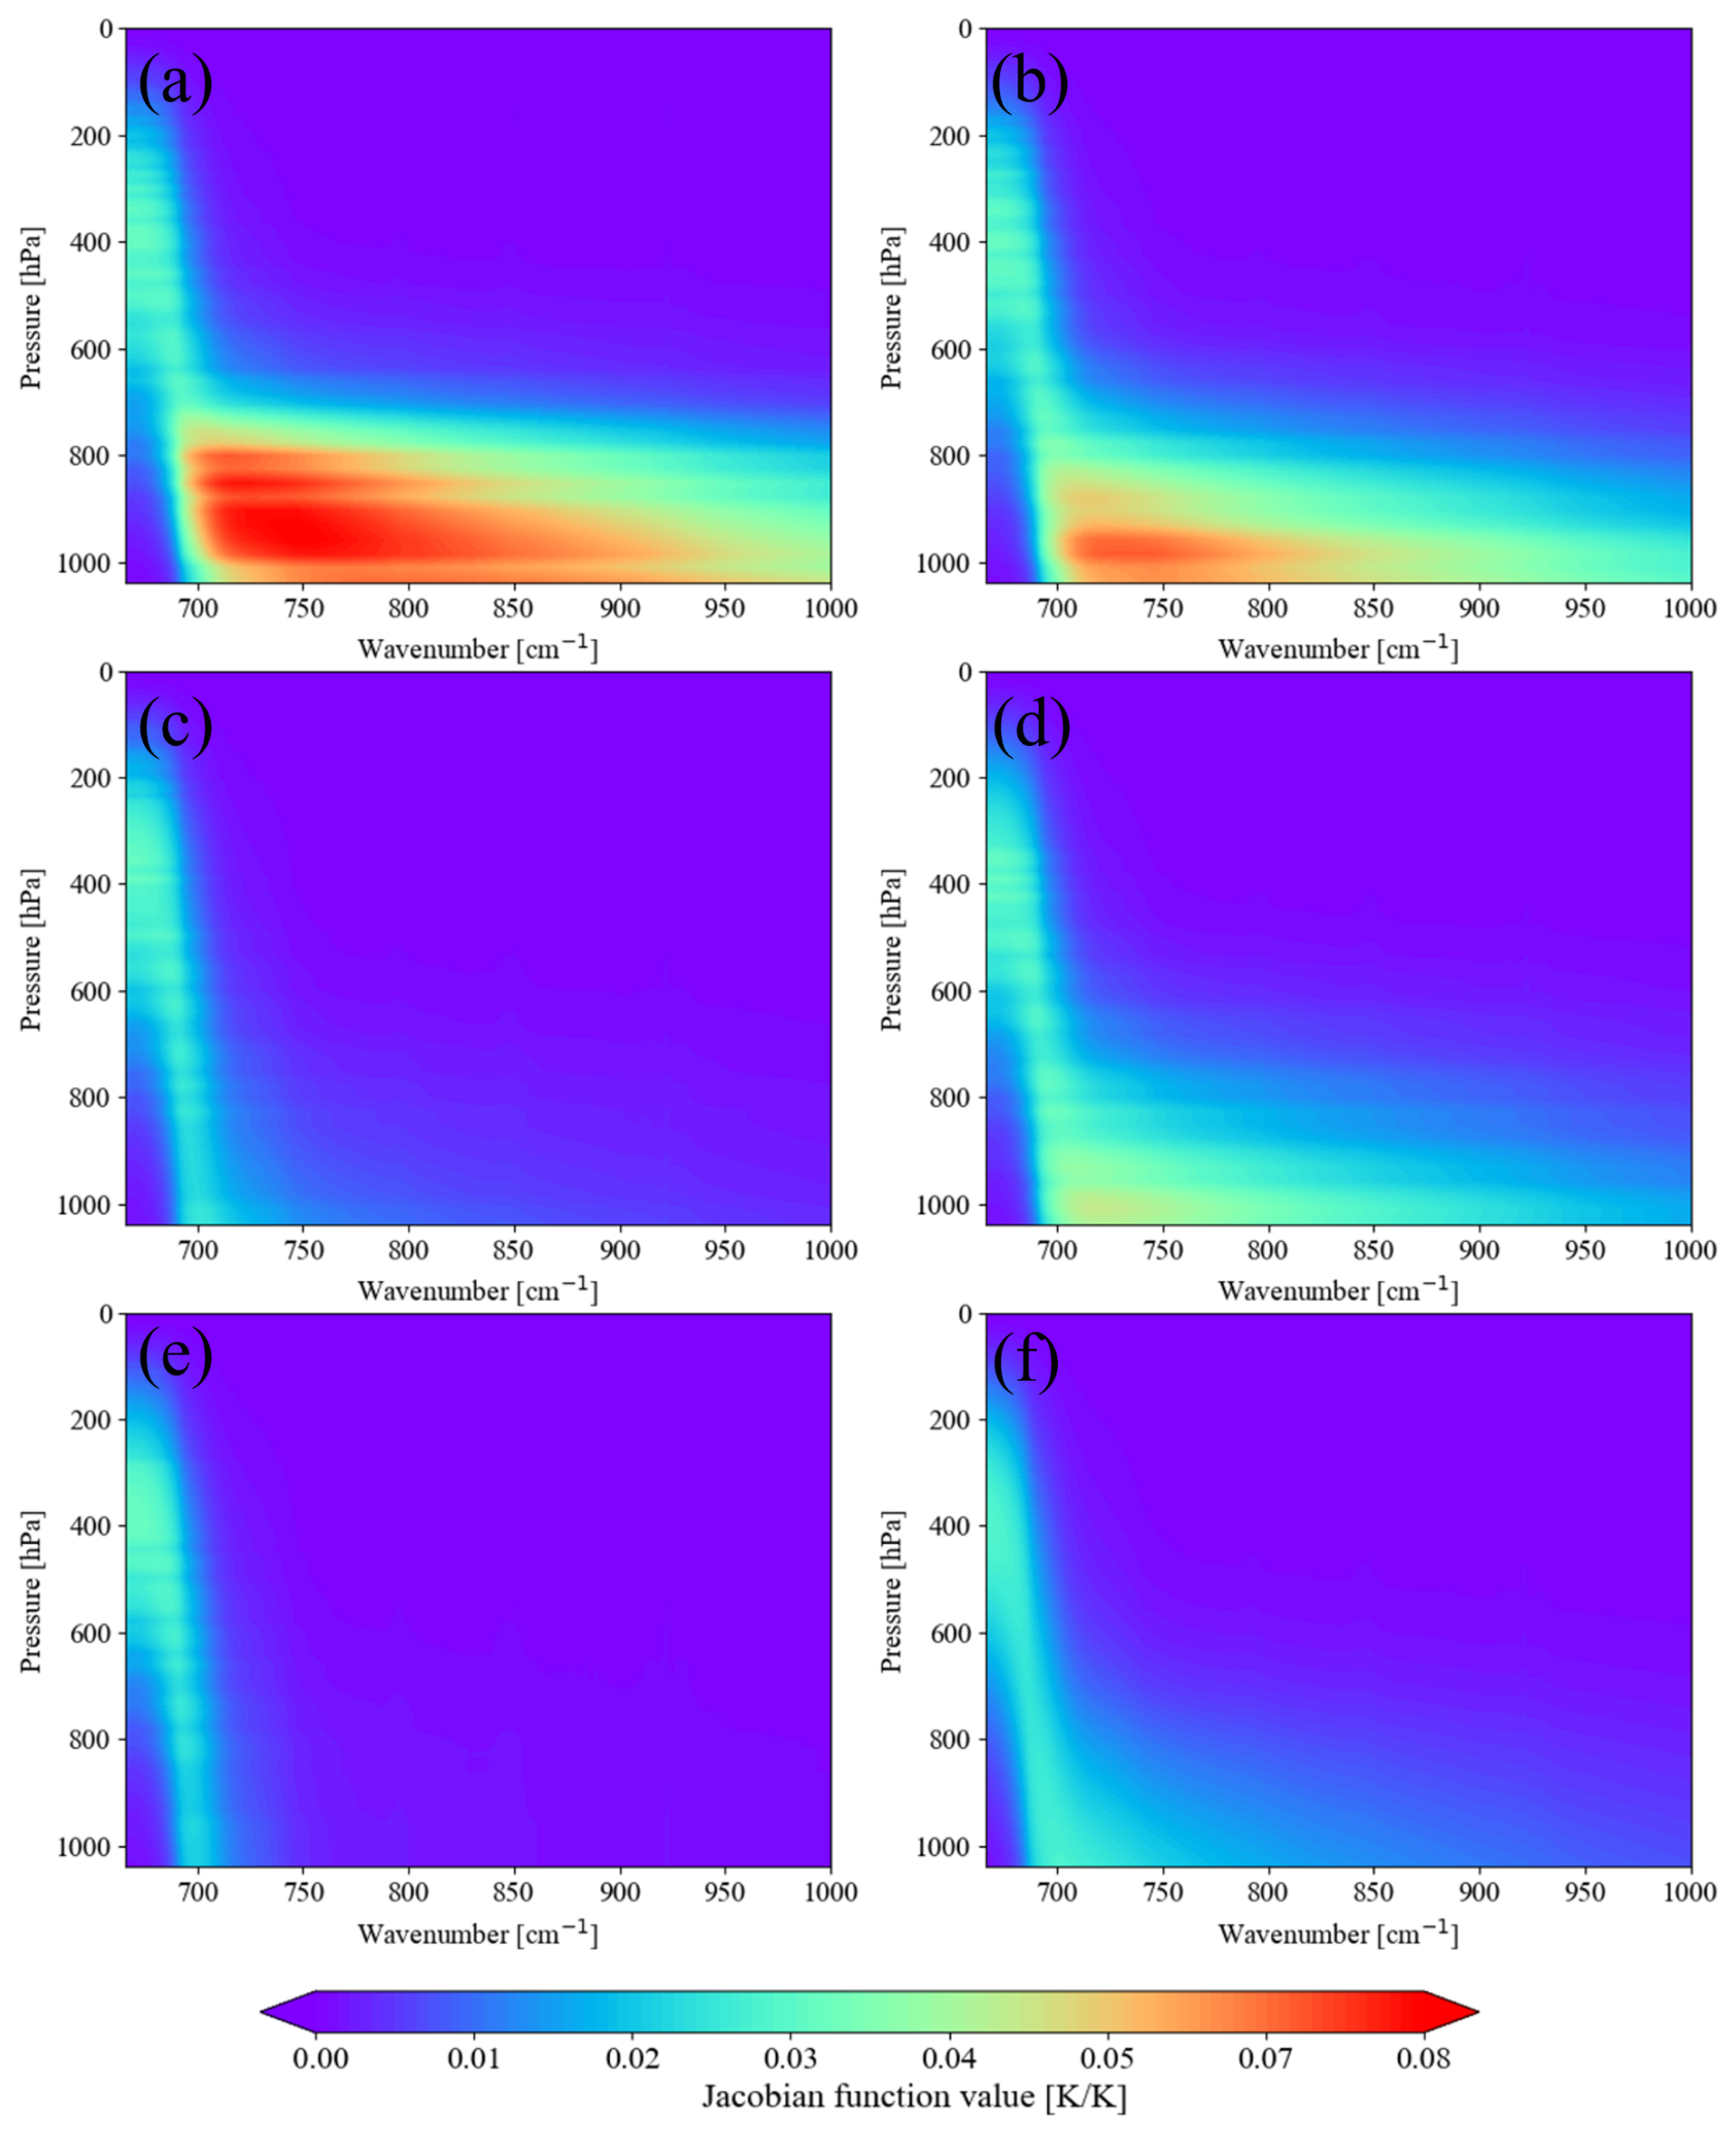
Figure 6Representations of temperature Jacobian functions in the atmospheric temperature absorption region for the conditions of six atmospheric profiles: (a) tropical atmospheric profile, (b) mid-latitude summer atmospheric profile, (c) mid-latitude winter atmospheric profile, (d) subarctic summer atmospheric profile, (e) subarctic winter atmospheric profile, and (f) US Standard Atmosphere, 1976.
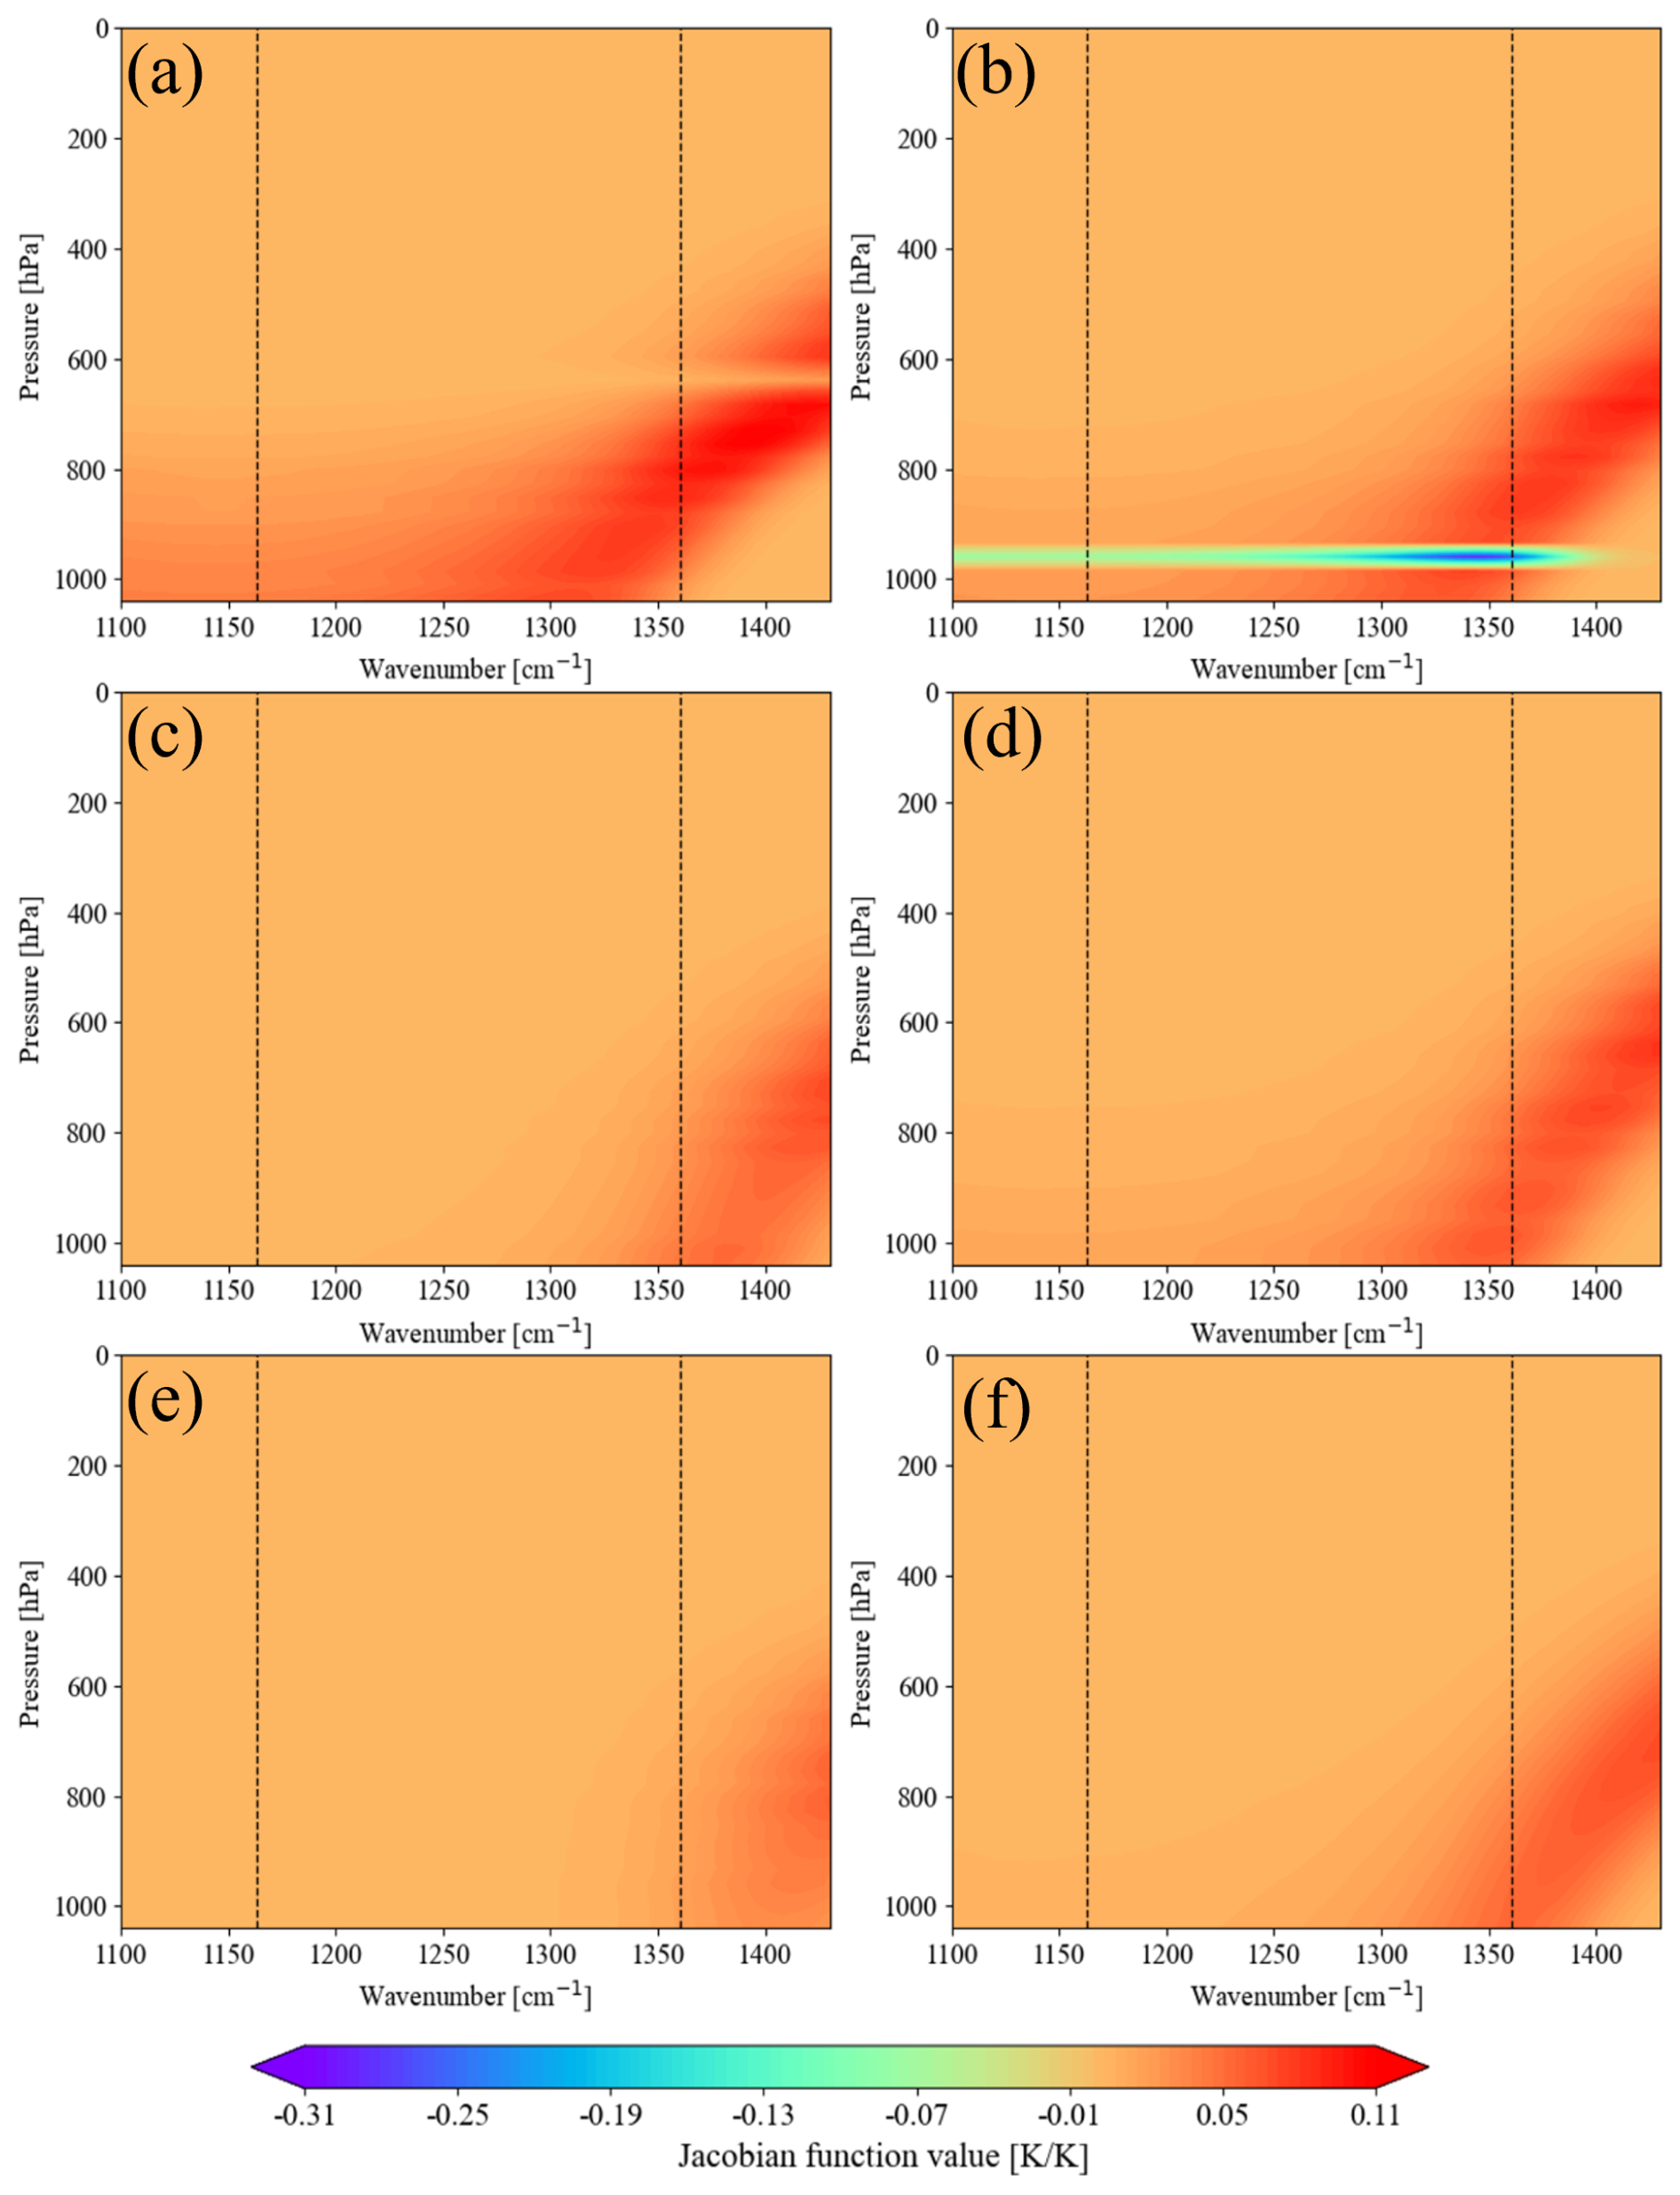
Figure 7Representations of temperature Jacobian functions in the SO2 absorption region (black dashed lines represent selected SO2 channels) for the conditions of six atmospheric profiles: (a) tropical atmospheric profile, (b) mid-latitude summer atmospheric profile, (c) mid-latitude winter atmospheric profile, (d) subarctic summer atmospheric profile, (e) subarctic winter atmospheric profile, and (f) US Standard Atmosphere, 1976.
3.2.3 Water vapor absorption channel selection
Figure 8 shows strong absorption by water vapor around 1428 and 1850 cm−1 under the six atmospheric conditions, indicating that this region contains substantial absorption information on water vapor. In addition, the absolute value of the Jacobian function for water vapor in the lower and middle layers of the 1428 cm−1 band can reach up to K ppbv−1 in the tropical, mid-latitude summer, subarctic summer, and 1976 US Standard Atmosphere profiles, indicating that water vapor has a stronger influence than in the mid-latitude winter and subarctic winter profiles. At the same time, it can be seen from Fig. 9 that the SO2 absorption region around 1360 cm−1 is more susceptible to water vapor contamination than the 1163 cm−1 absorption region. Under most atmospheric profile conditions, there exists a channel within the water vapor absorption region that exhibits Jacobian characteristics consistent with the selected SO2 channels according to Fig. 9. We calculate the temperature Jacobian functions and water vapor Jacobian functions separately within the water vapor absorption region and SO2 absorption region. The Jacobian information on water vapor in the SO2 and water vapor absorption regions is cross-compared. The Jacobian information on atmospheric temperature in the SO2, water vapor absorption region, and selected atmospheric temperature channels were also cross-compared, and the channels with consistent maximum peak values and half-widths were selected to ensure that the vertical changes in water vapor and atmospheric temperature were consistent with those of SO2. The cross-comparison criteria of the Jacobian matrix here are consistent with the selection criteria and threshold of the atmospheric temperature channels in Sect. 3.2.2. Through the cross-comparison process, the selected water vapor channels can simultaneously contain consistent atmospheric temperature and water vapor absorption information on the SO2 channels. In this way, the atmospheric temperature and water vapor absorption information carried in the selected SO2 channels can be removed in the subsequent calculation of the BT difference between the SO2 channels and the water vapor channels. Figure 10 illustrates the specific central wavenumbers of the selected atmospheric temperature channels, water vapor absorption channels, and corresponding BTs under the 1976 US Standard Atmosphere.
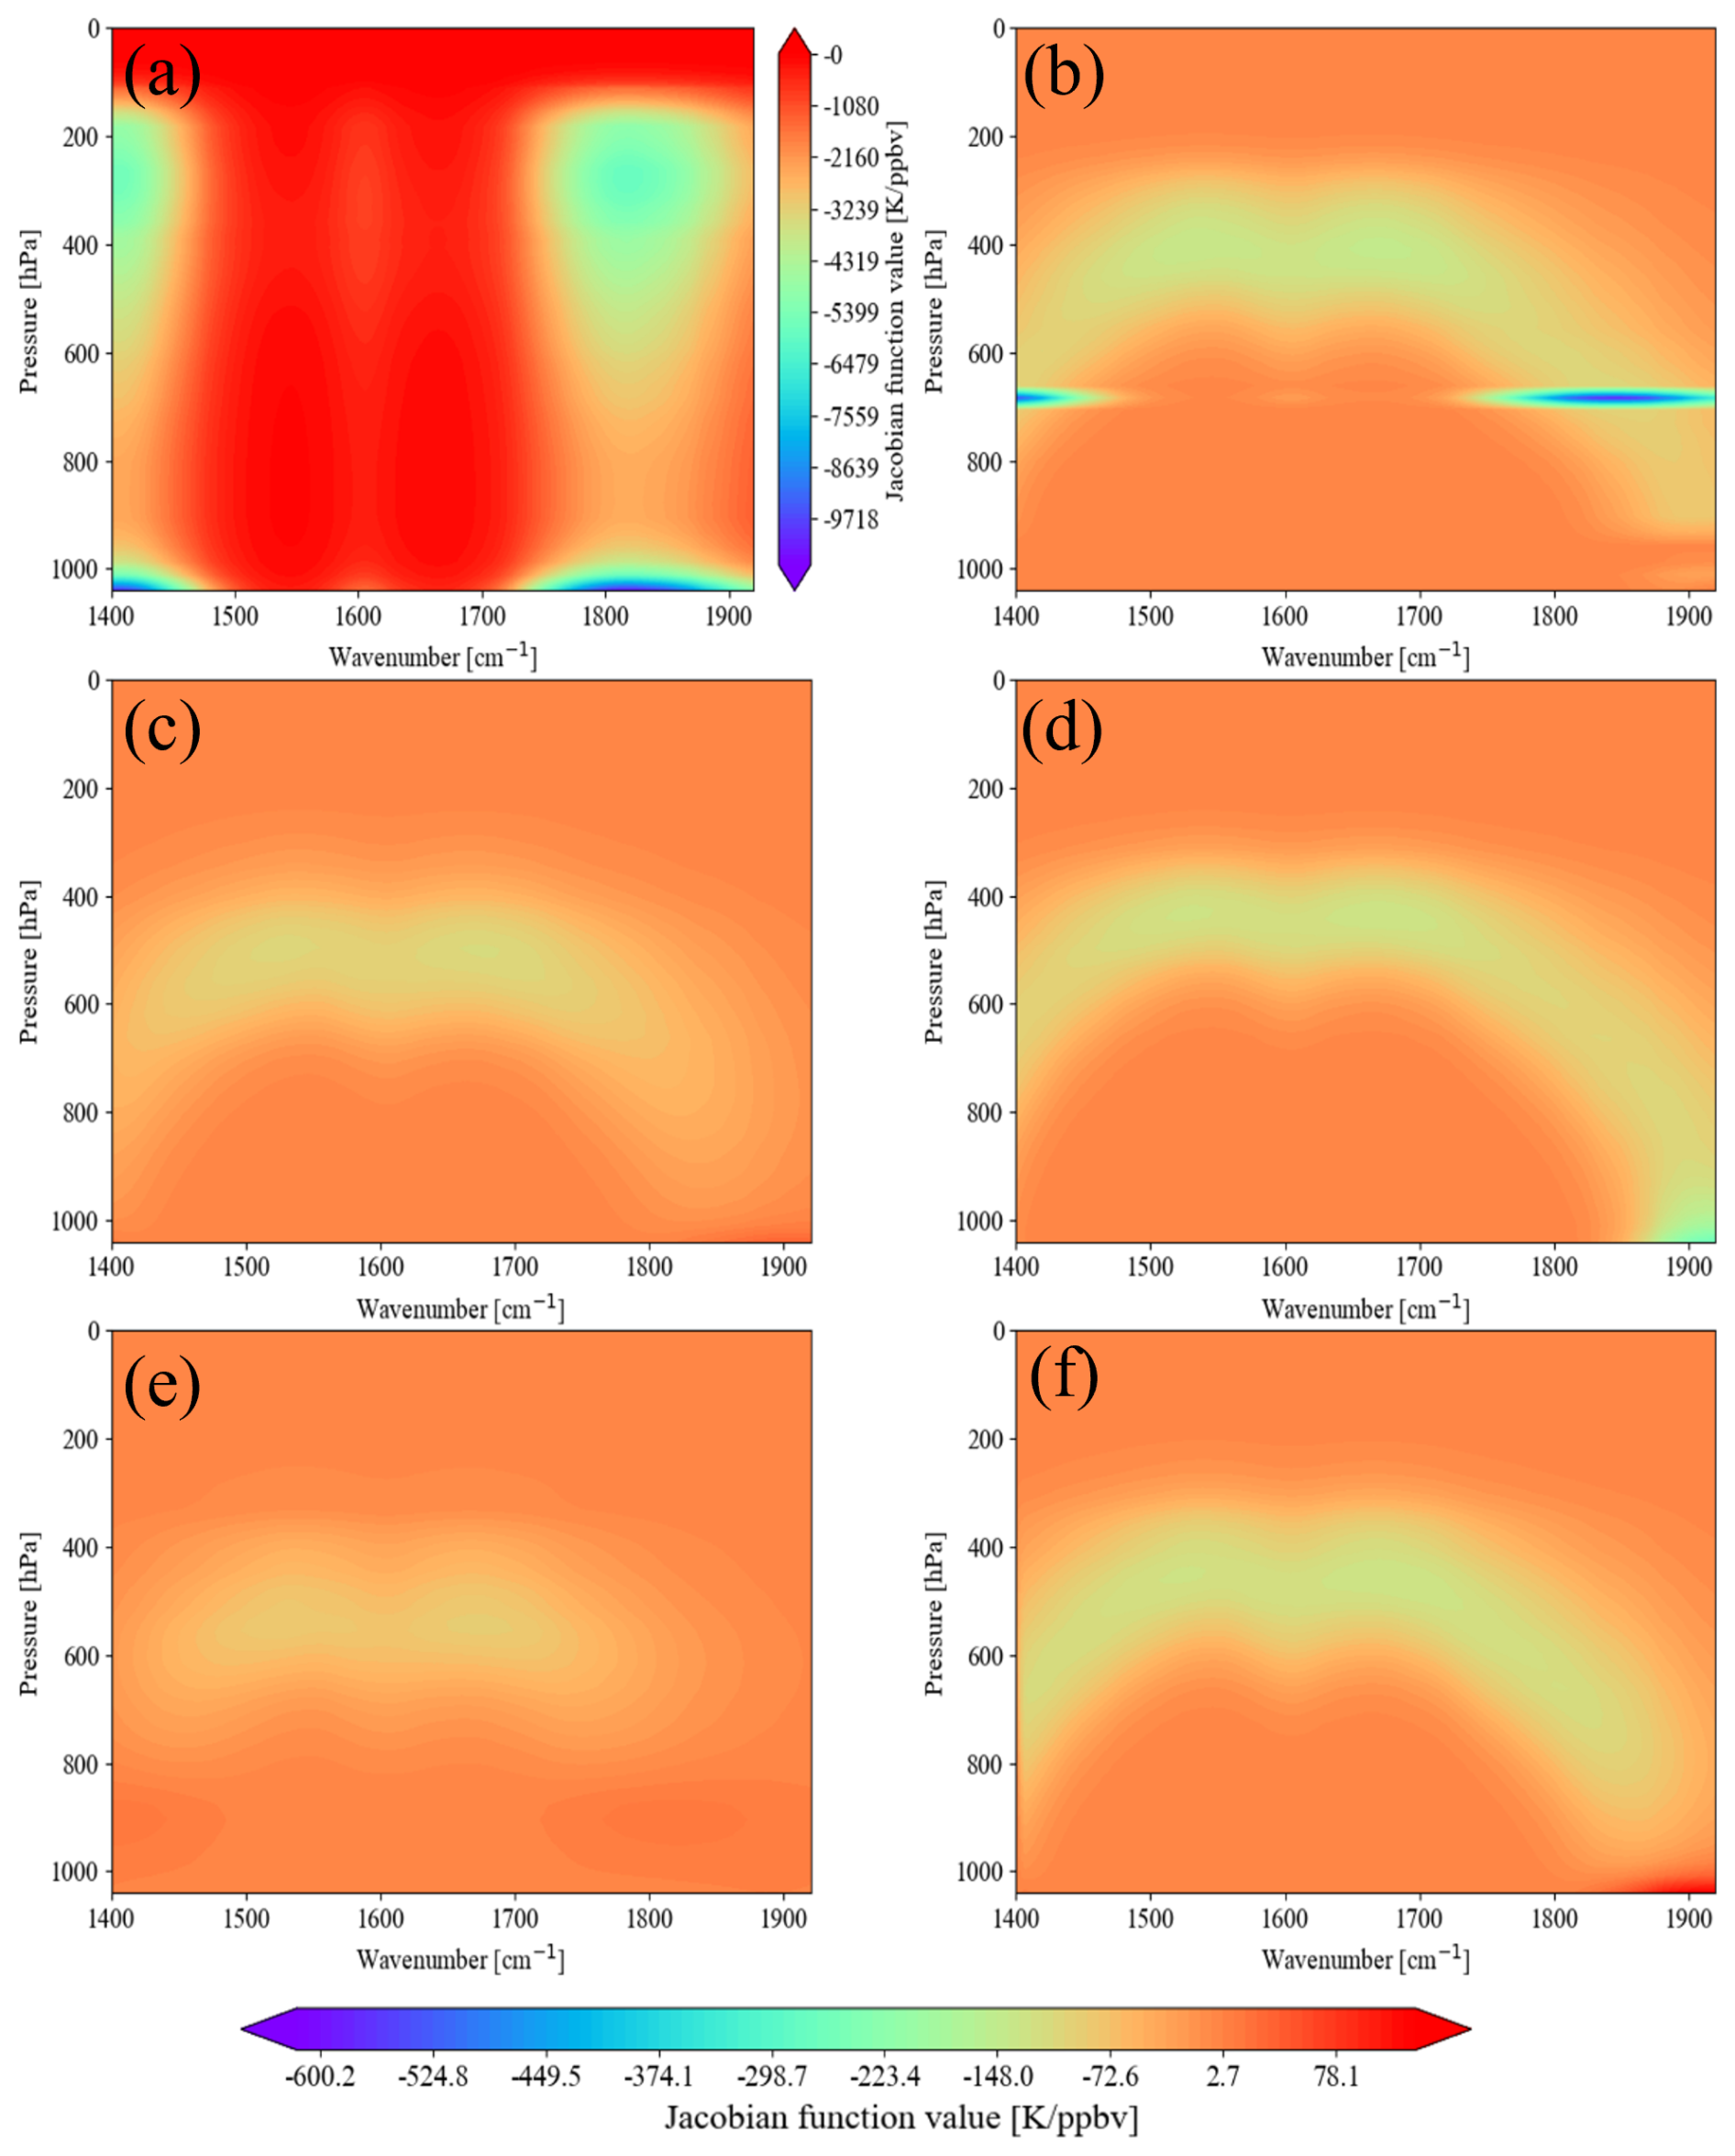
Figure 8Representations of water vapor Jacobian functions in the water absorption region for conditions of six atmospheric profiles: (a) tropical atmospheric profile, (b) mid-latitude summer atmospheric profile, (c) mid-latitude winter atmospheric profile, (d) subarctic summer atmospheric profile, (e) subarctic winter atmospheric profile, and (f) US Standard Atmosphere, 1976.
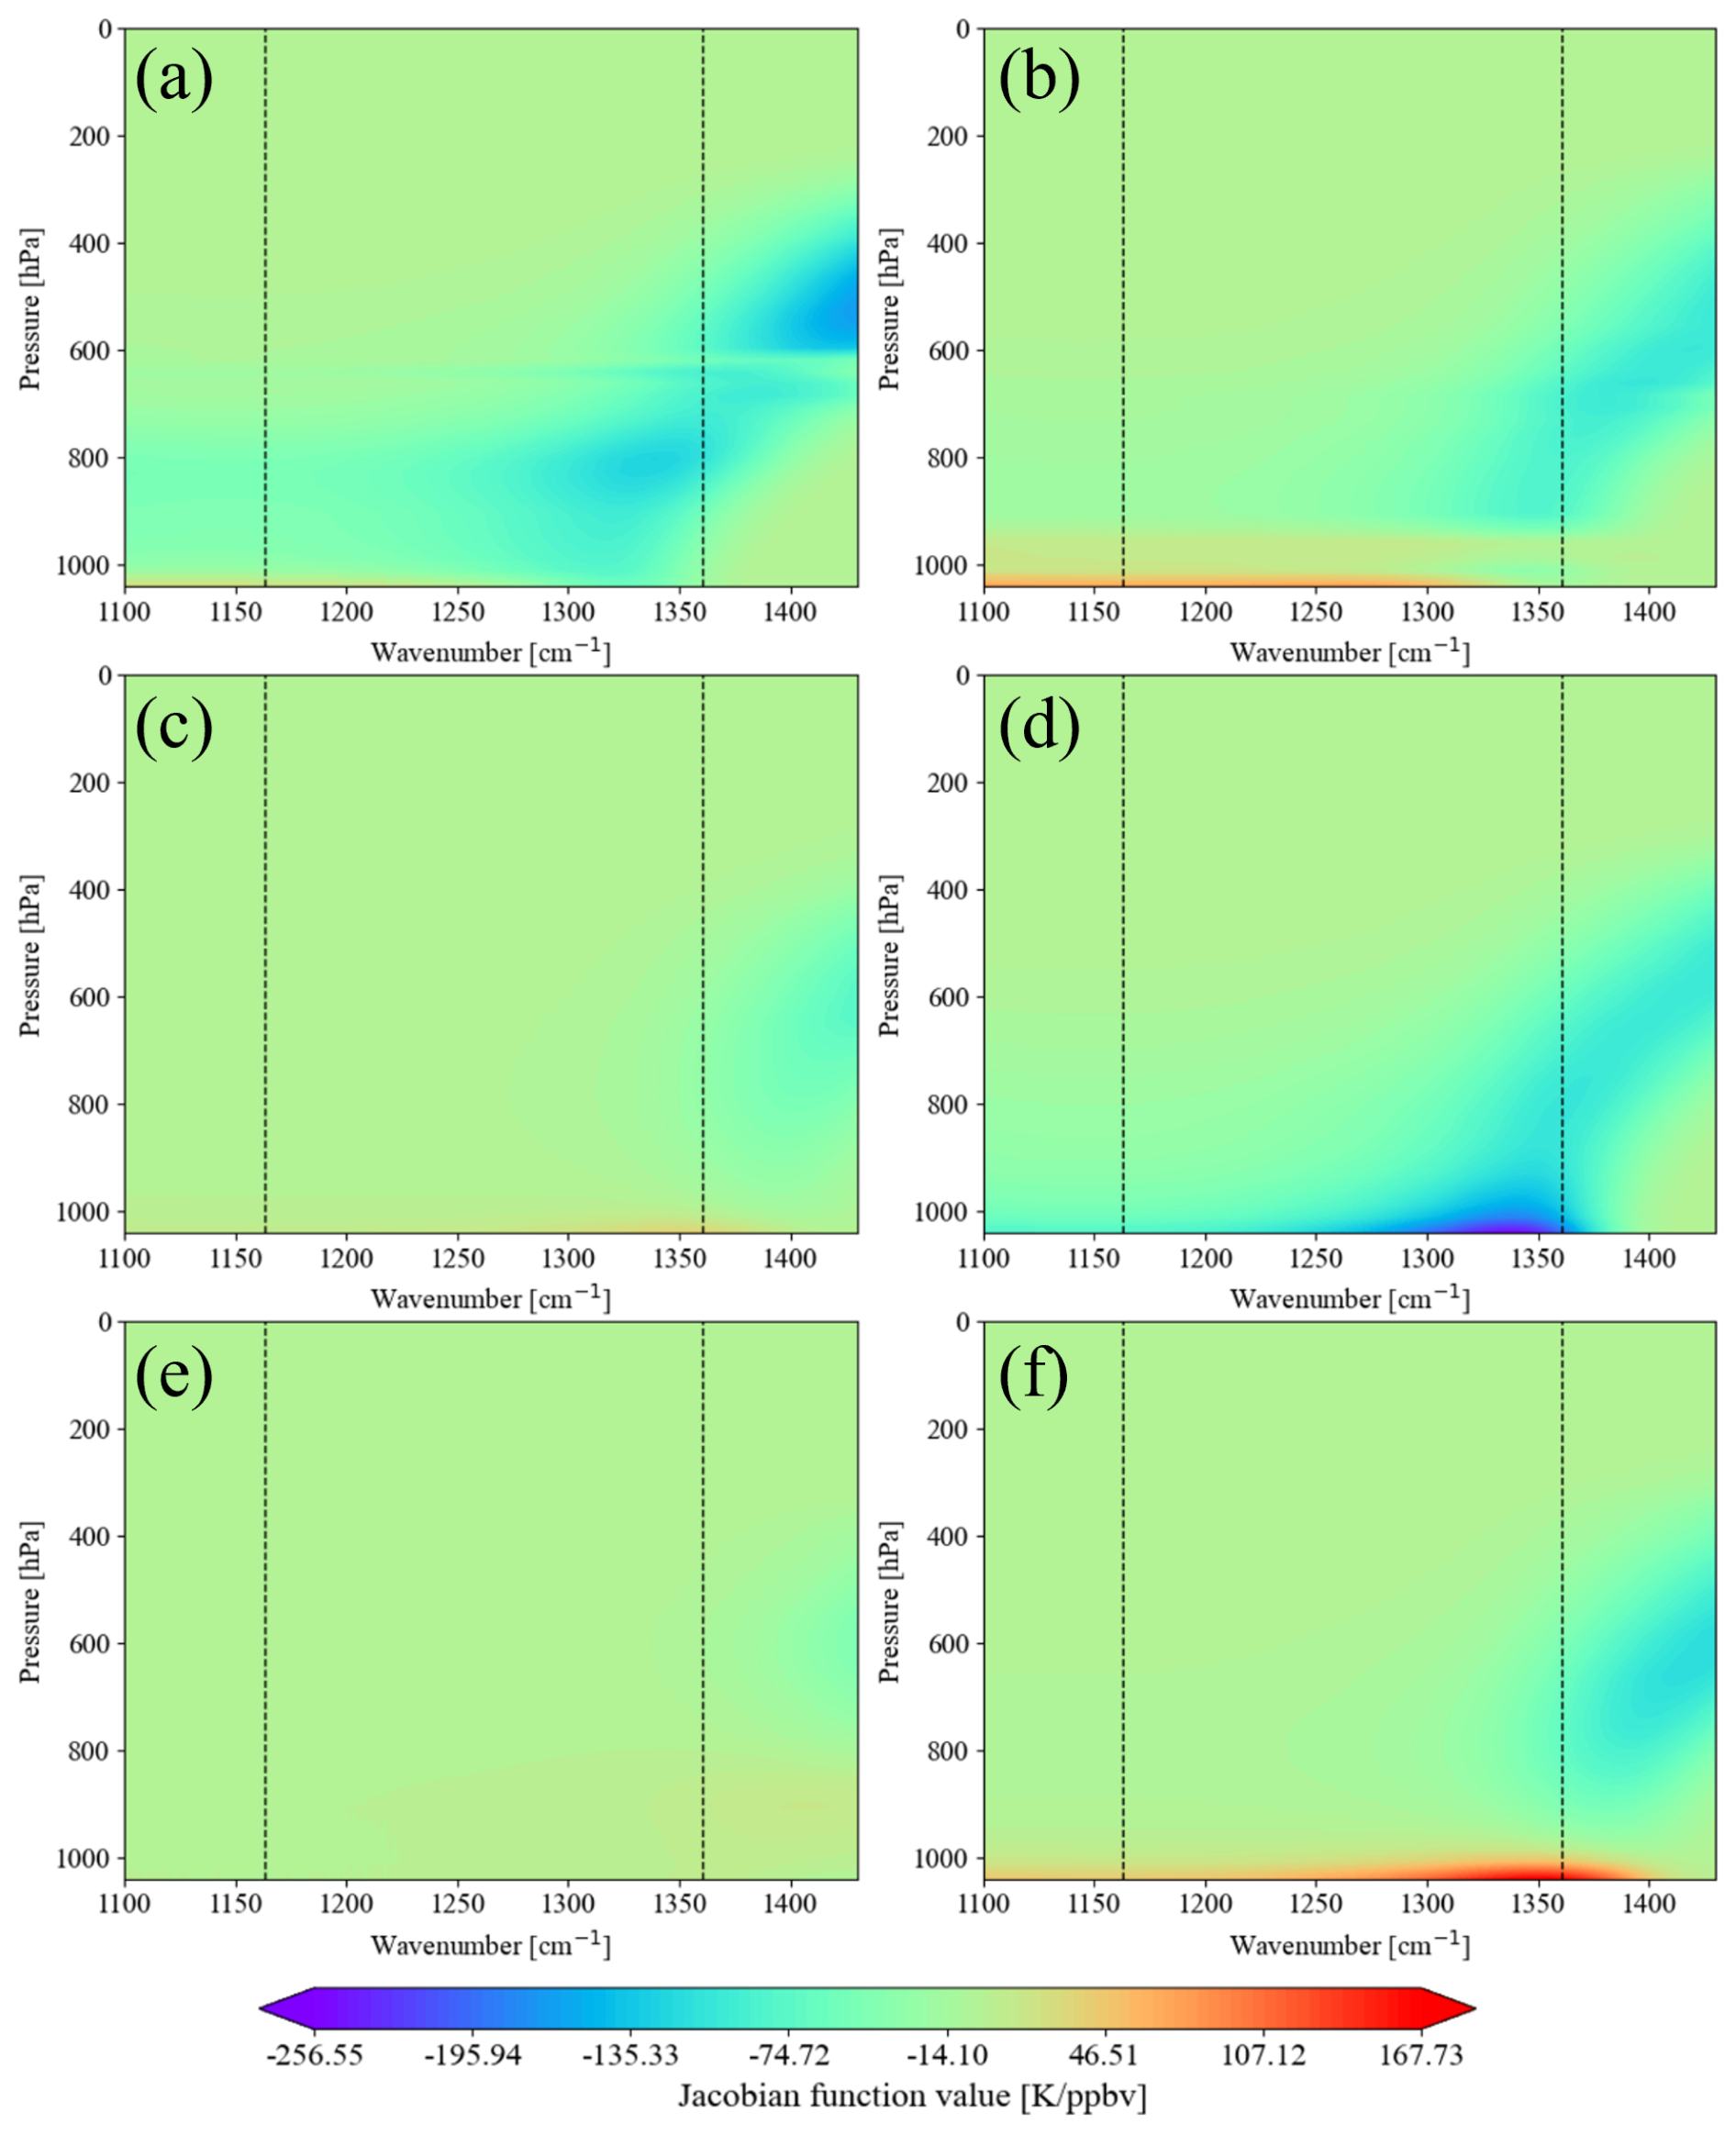
Figure 9Representations of water vapor Jacobian functions in the SO2 absorption region (black dashed lines represent selected SO2 channels) for conditions of six atmospheric profiles: (a) tropical atmospheric profile, (b) mid-latitude summer atmospheric profile, (c) mid-latitude winter atmospheric profile, (d) subarctic summer atmospheric profile, (e) subarctic winter atmospheric profile, and (f) US Standard Atmosphere, 1976.
Under the same SO2 and water vapor conditions, and based on the selected SO2 channels, we selected three corresponding water vapor channels for both the 1163.125 and 1360.625 cm−1 channels, whose channels combined with the largest BT difference. By analyzing the BT difference, we determined the SO2-sensitive channels to accurately carry out the SO2 retrieval. As can be seen in Fig. 11, 1163.125 and 1360.625 cm−1 are used as the SO2-sensitive channels and 1887.5 and 1429.375 cm−1 as the water vapor absorption channels. For the 1360.625 cm−1 channel, the combination of the channels we chose can effectively remove the water vapor information contained in the SO2-sensitive channels and can also better demonstrate the SO2 plume after deducting the effect of water vapor, which lays the foundation for the SO2 retrieval in the subsequent inversion process.
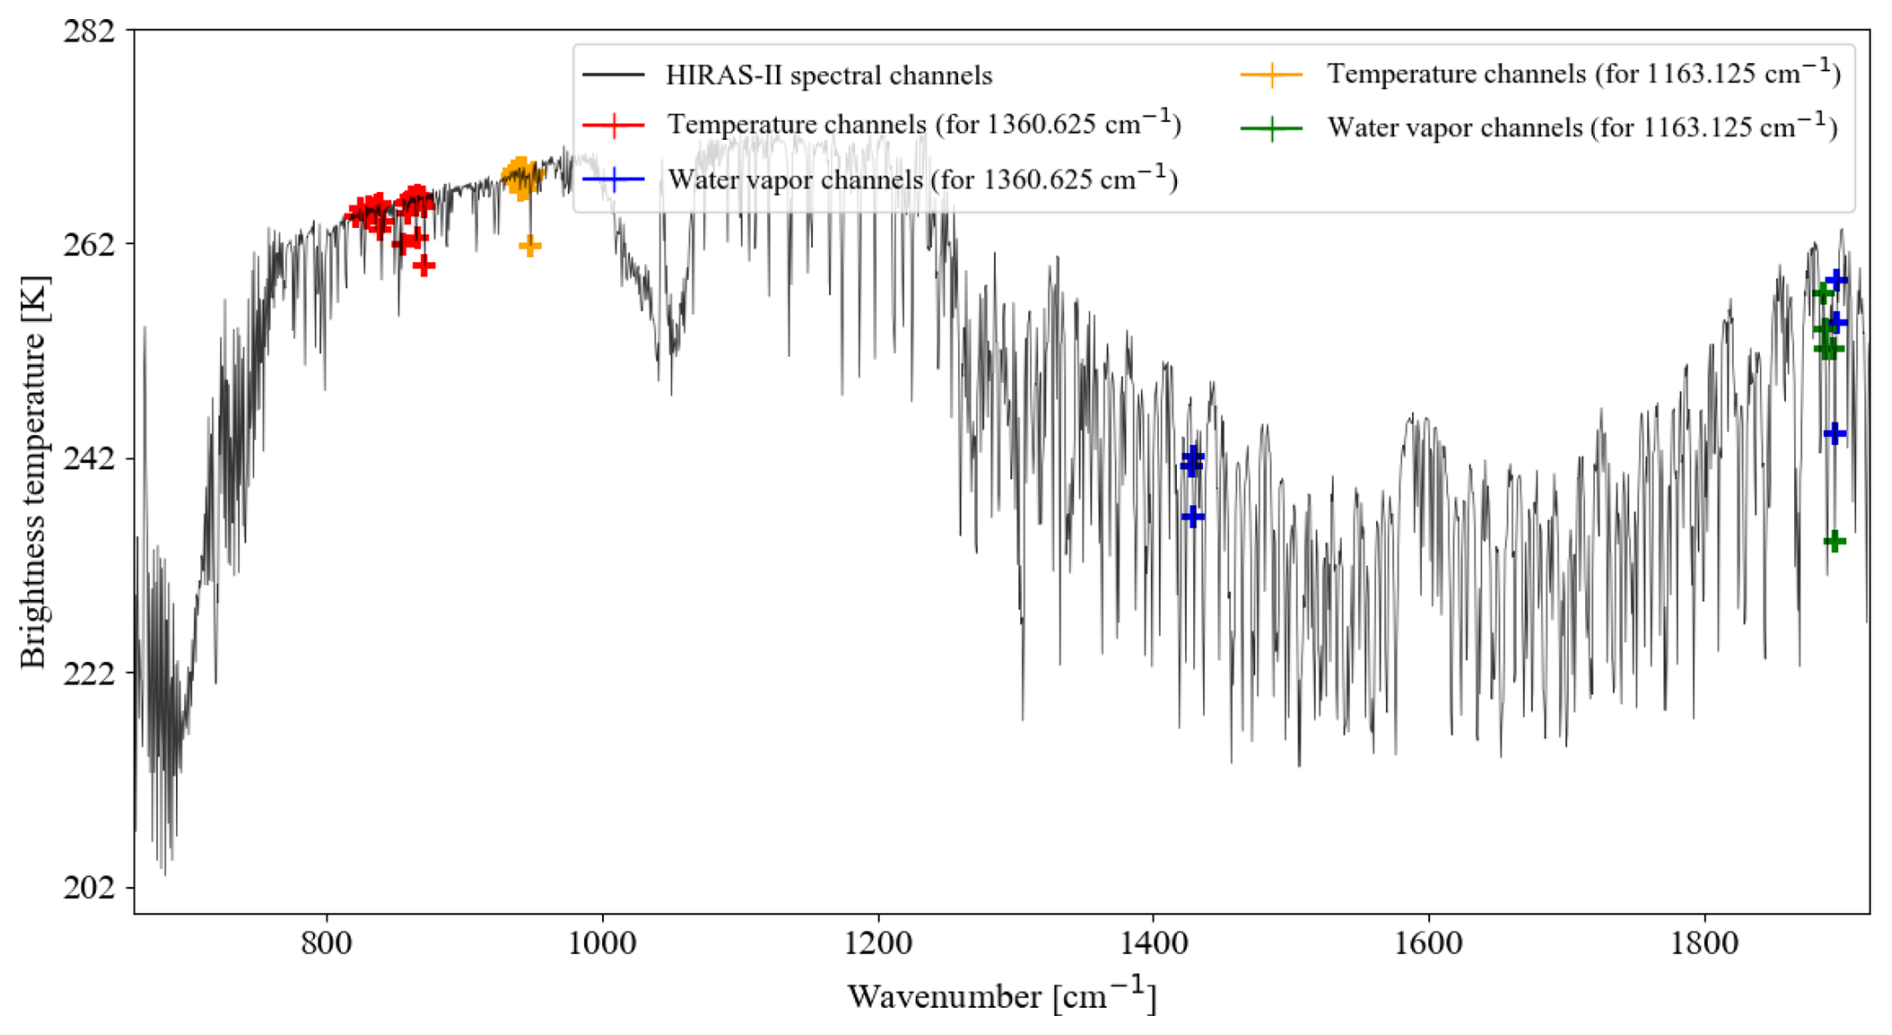
Figure 10Part of the HIRAS-II brightness temperature spectrum with selected atmospheric temperature channels and water vapor absorption channels labeled.
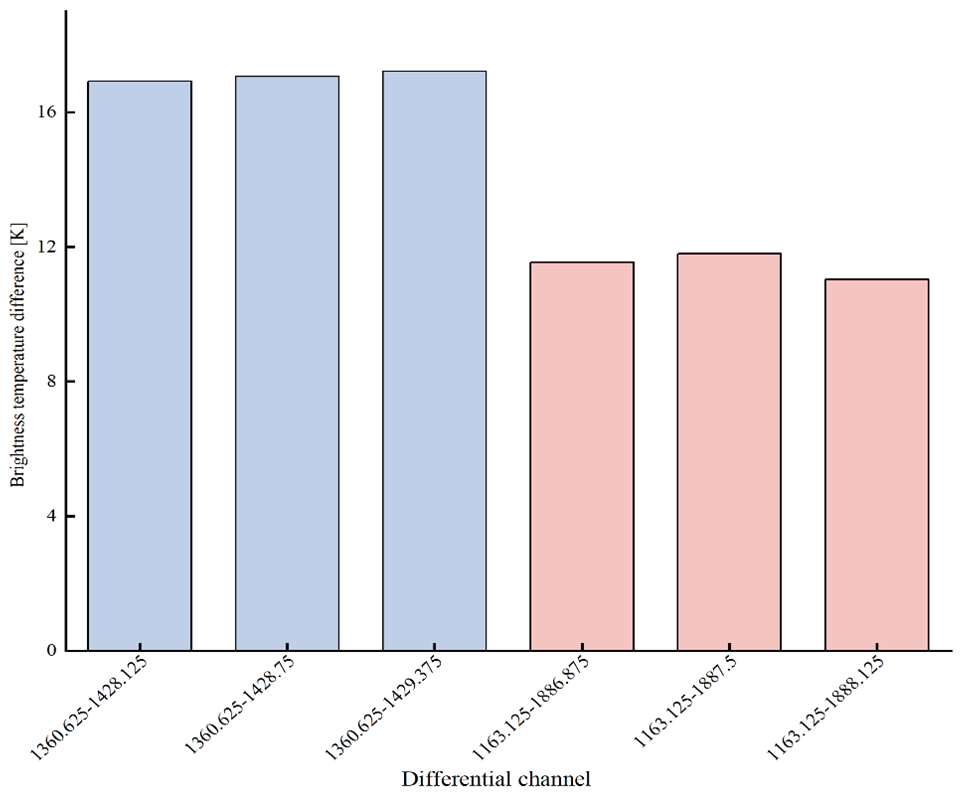
Figure 11Brightness temperature difference between the SO2 channel and the water vapor absorption channel with atmospheric profiles from the 1976 US Standard Atmosphere.
3.3 Surface temperature channel selection
Land surface temperature (or surface skin temperature) is a key variable in IR data inversion (Jimenez-Munoz et al., 2009). The atmosphere minimally reflects, scatters, and absorbs electromagnetic waves in the atmospheric IR window band (Senf and Deneke, 2017). Therefore, we select the clean channel from this range with the highest BT: its use in subsequent analyses as the land surface temperature channels mitigates the influence of land on SO2 observations. Table 2 presents the distribution of the three channels with the highest BT across the six atmospheric profiles. Notably, the land surface temperature channels for the mid-latitude winter and subarctic winter situations are identical, while those for the mid-latitude summer and subarctic summer profiles are somewhat similar. The tropical atmosphere profile has a land surface temperature channel with a higher wavenumber and shorter wavelength compared with the other profiles. The land surface temperature channel for the US Standard Atmosphere, 1976, falls between those of the other profiles. To ensure that the selected land surface temperature channels are applicable to most atmospheric conditions, we identify the two channels with the highest frequencies (902.5 and 901.875 cm−1) for subsequent work.
4.1 Effects of differences in surface temperature and near-surface atmospheric temperature on SO2-sensitive channels
Given the variations in surface characteristics affecting atmospheric radiation, we analyzed the impact of the generally low temperature difference between the surface and the overlying air on the SO2 Jacobian function. Meanwhile, the 750–1200 cm−1 region is highly sensitive to surface features (Clarisse et al., 2010), and the sensitivity of HIRAS-II to SO2 is significantly influenced by the temperature difference (TD) between the surface and the first distinct layer of air (Tp) (Tsuchiya, 1983). The Jacobian formula defines the relationship between the change in brightness temperature and the perturbation in material concentration. Under consistent atmospheric conditions with fixed SO2 concentration perturbations and uniform background brightness temperature, the TD after SO2 perturbation demonstrates a trend and behavior similar to that of the Jacobian value. As a result, TD can effectively substitute for the Jacobian value in assessing the detection capability of SO2. For simplicity, we consider three scenarios: Ts=Tp (TD = 0), Tp>Ts (TD > 0), and Tp<Ts (TD <0). With ε=0.98 and P= 212 hPa, TD was varied from −10 to 10 K in 5 K increments, and infrared radiation was simulated under each set of conditions. Figure 12 illustrates variations in the SO2 plume in the 1163.125 and 1360.625 cm−1 channels under different TD conditions for the US Standard Atmosphere, 1976.
Table 2Distribution of surface temperature channels in six atmospheric profiles.
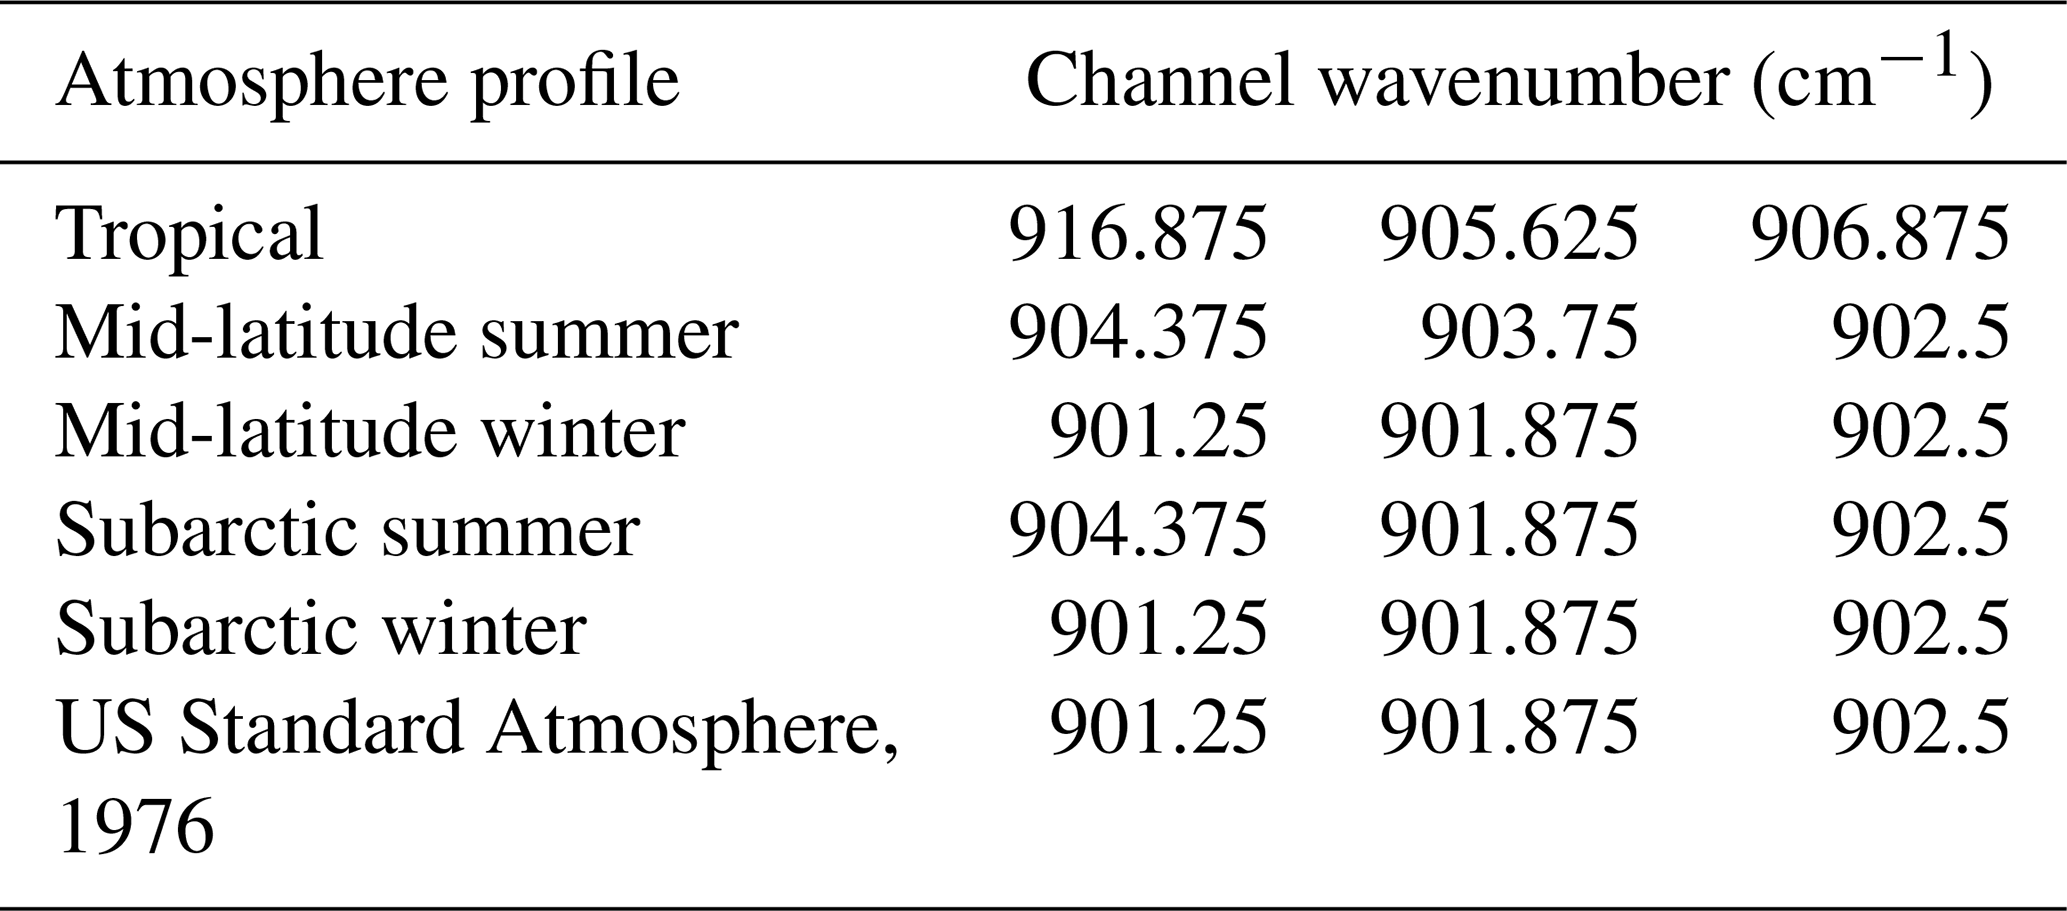
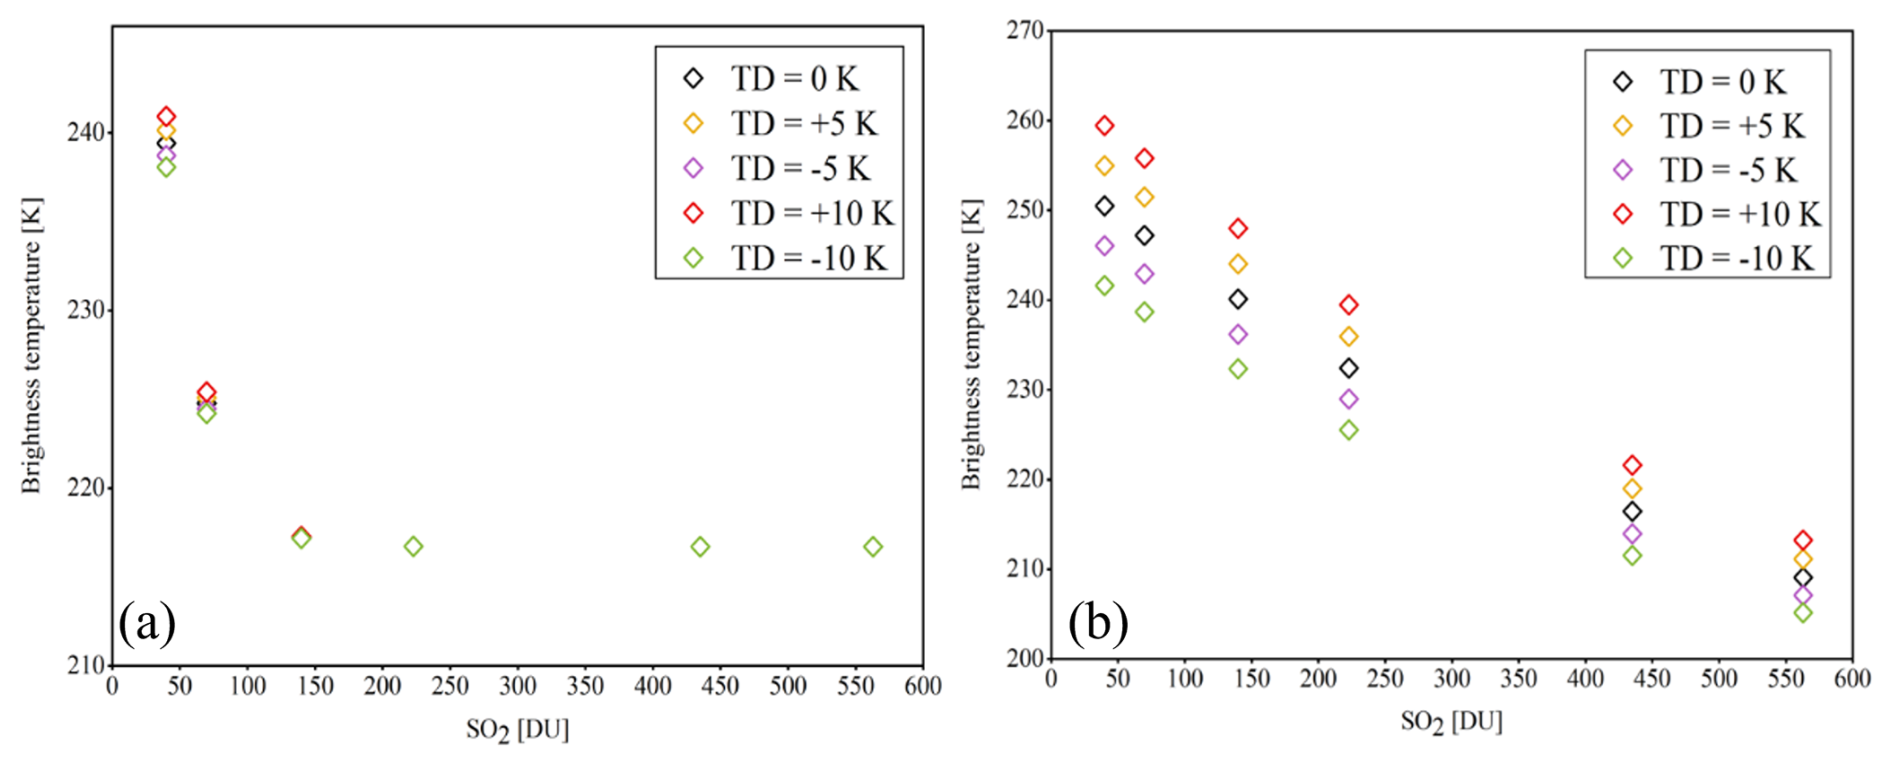
Figure 12Sensitivity of SO2 plume measurement at channels (a) 1360.625 and (b) 1163.125 cm−1 to surface temperature with atmospheric profiles from the US Standard Atmosphere, 1976.
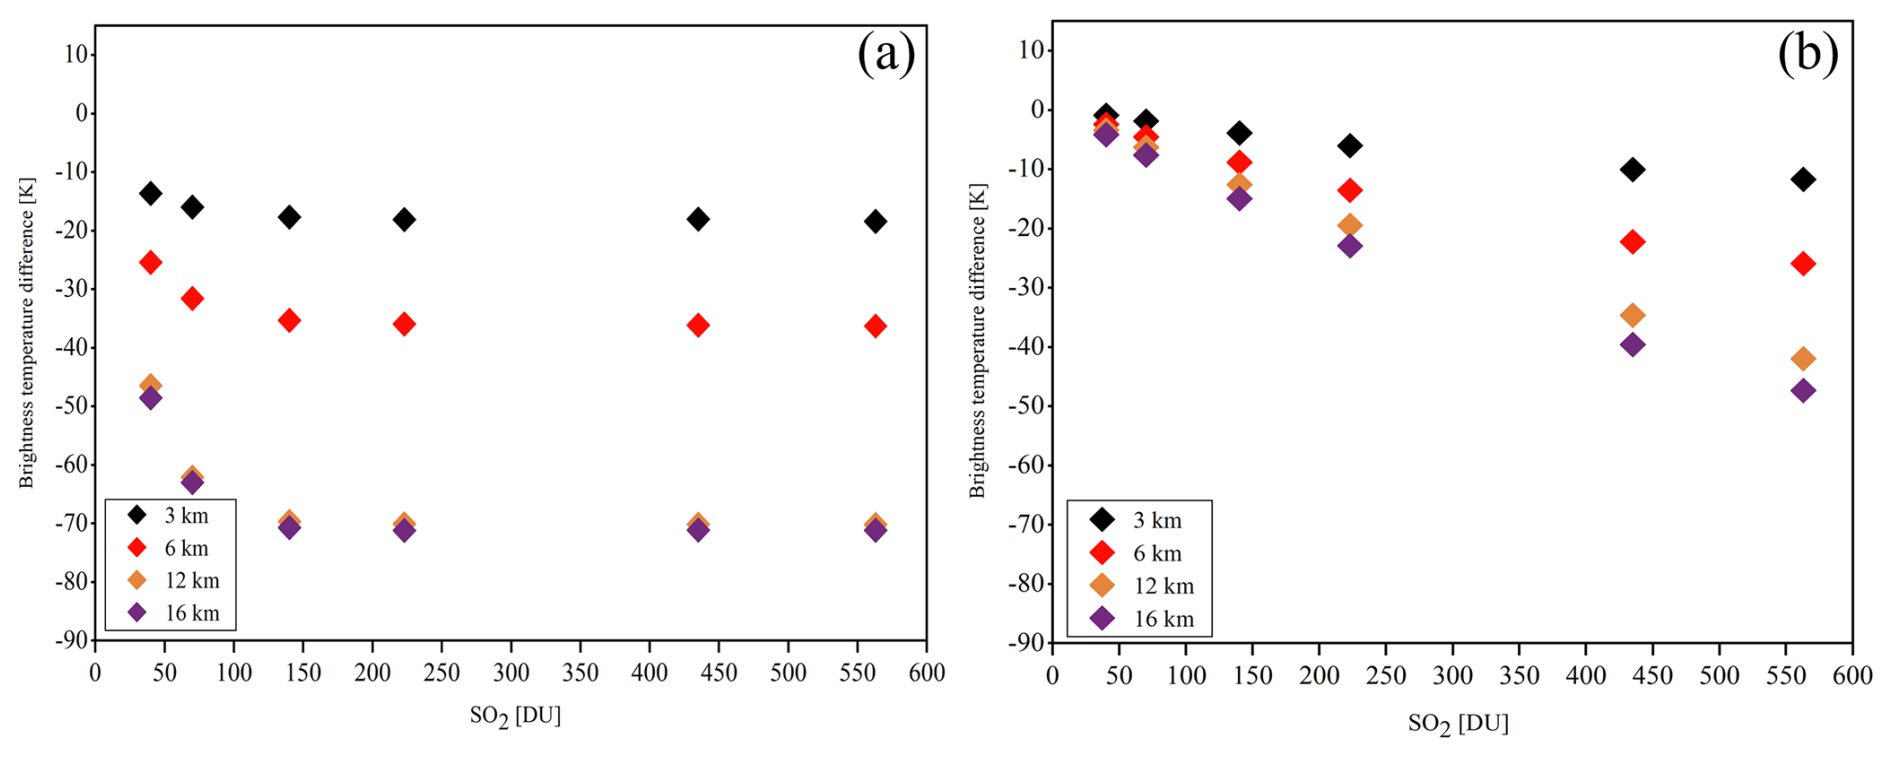
Figure 13Modeled FY-3E/HIRAS-II brightness temperature differences between the (a) 1360.625 and 902.5 cm−1 channels and the (b) 1163.125 and 902.5 cm−1 channels for assessing the column SO2 content (DU) at four plume heights in atmospheric profiles derived from the US Standard Atmosphere, 1976.
From Fig. 12a, it can be observed that, for the 1360.625 cm−1 channel, SO2 with column densities <150 DU exhibits high sensitivity to changes in the TD. However, when the SO2 column density >150 DU, the response of TD to concentration variations significantly weakens, indicating that this channel tends to saturate at higher SO2 concentrations. This phenomenon demonstrates that the 1360.625 cm−1 channel is more effective at detecting SO2 in the middle and upper troposphere. In contrast, as shown in Fig. 12b, for the 1163.125 cm−1 channel, a positive change in TD leads to a significant increase in brightness temperature at the same SO2 concentration. As the SO2 concentration increases, the influence of TD on brightness temperature decreases approximately linearly. This suggests that the 1163.125 cm−1 channel is more susceptible to interference from surface and near-surface radiation properties, with its signal primarily reflecting the distribution of SO2 in the lower atmosphere.
For a plume SO2 content of <150 DU, an increasingly positive TD enhances SO2 detection in the IR band. Conversely, a decrease in TD limits SO2's contribution to radiation, thereby constraining its IR remote sensing capability. As the plume's SO2 content increases, the impact of TD on SO2 observation diminishes. These findings suggest that favorable TD conditions can enhance the accuracy of SO2 detection and inversion, which is relevant for monitoring air quality. Due to the vertical distribution of gases, near-surface SO2 tends to be underestimated, but a positive TD helps capture the net absorption of near-surface SO2.
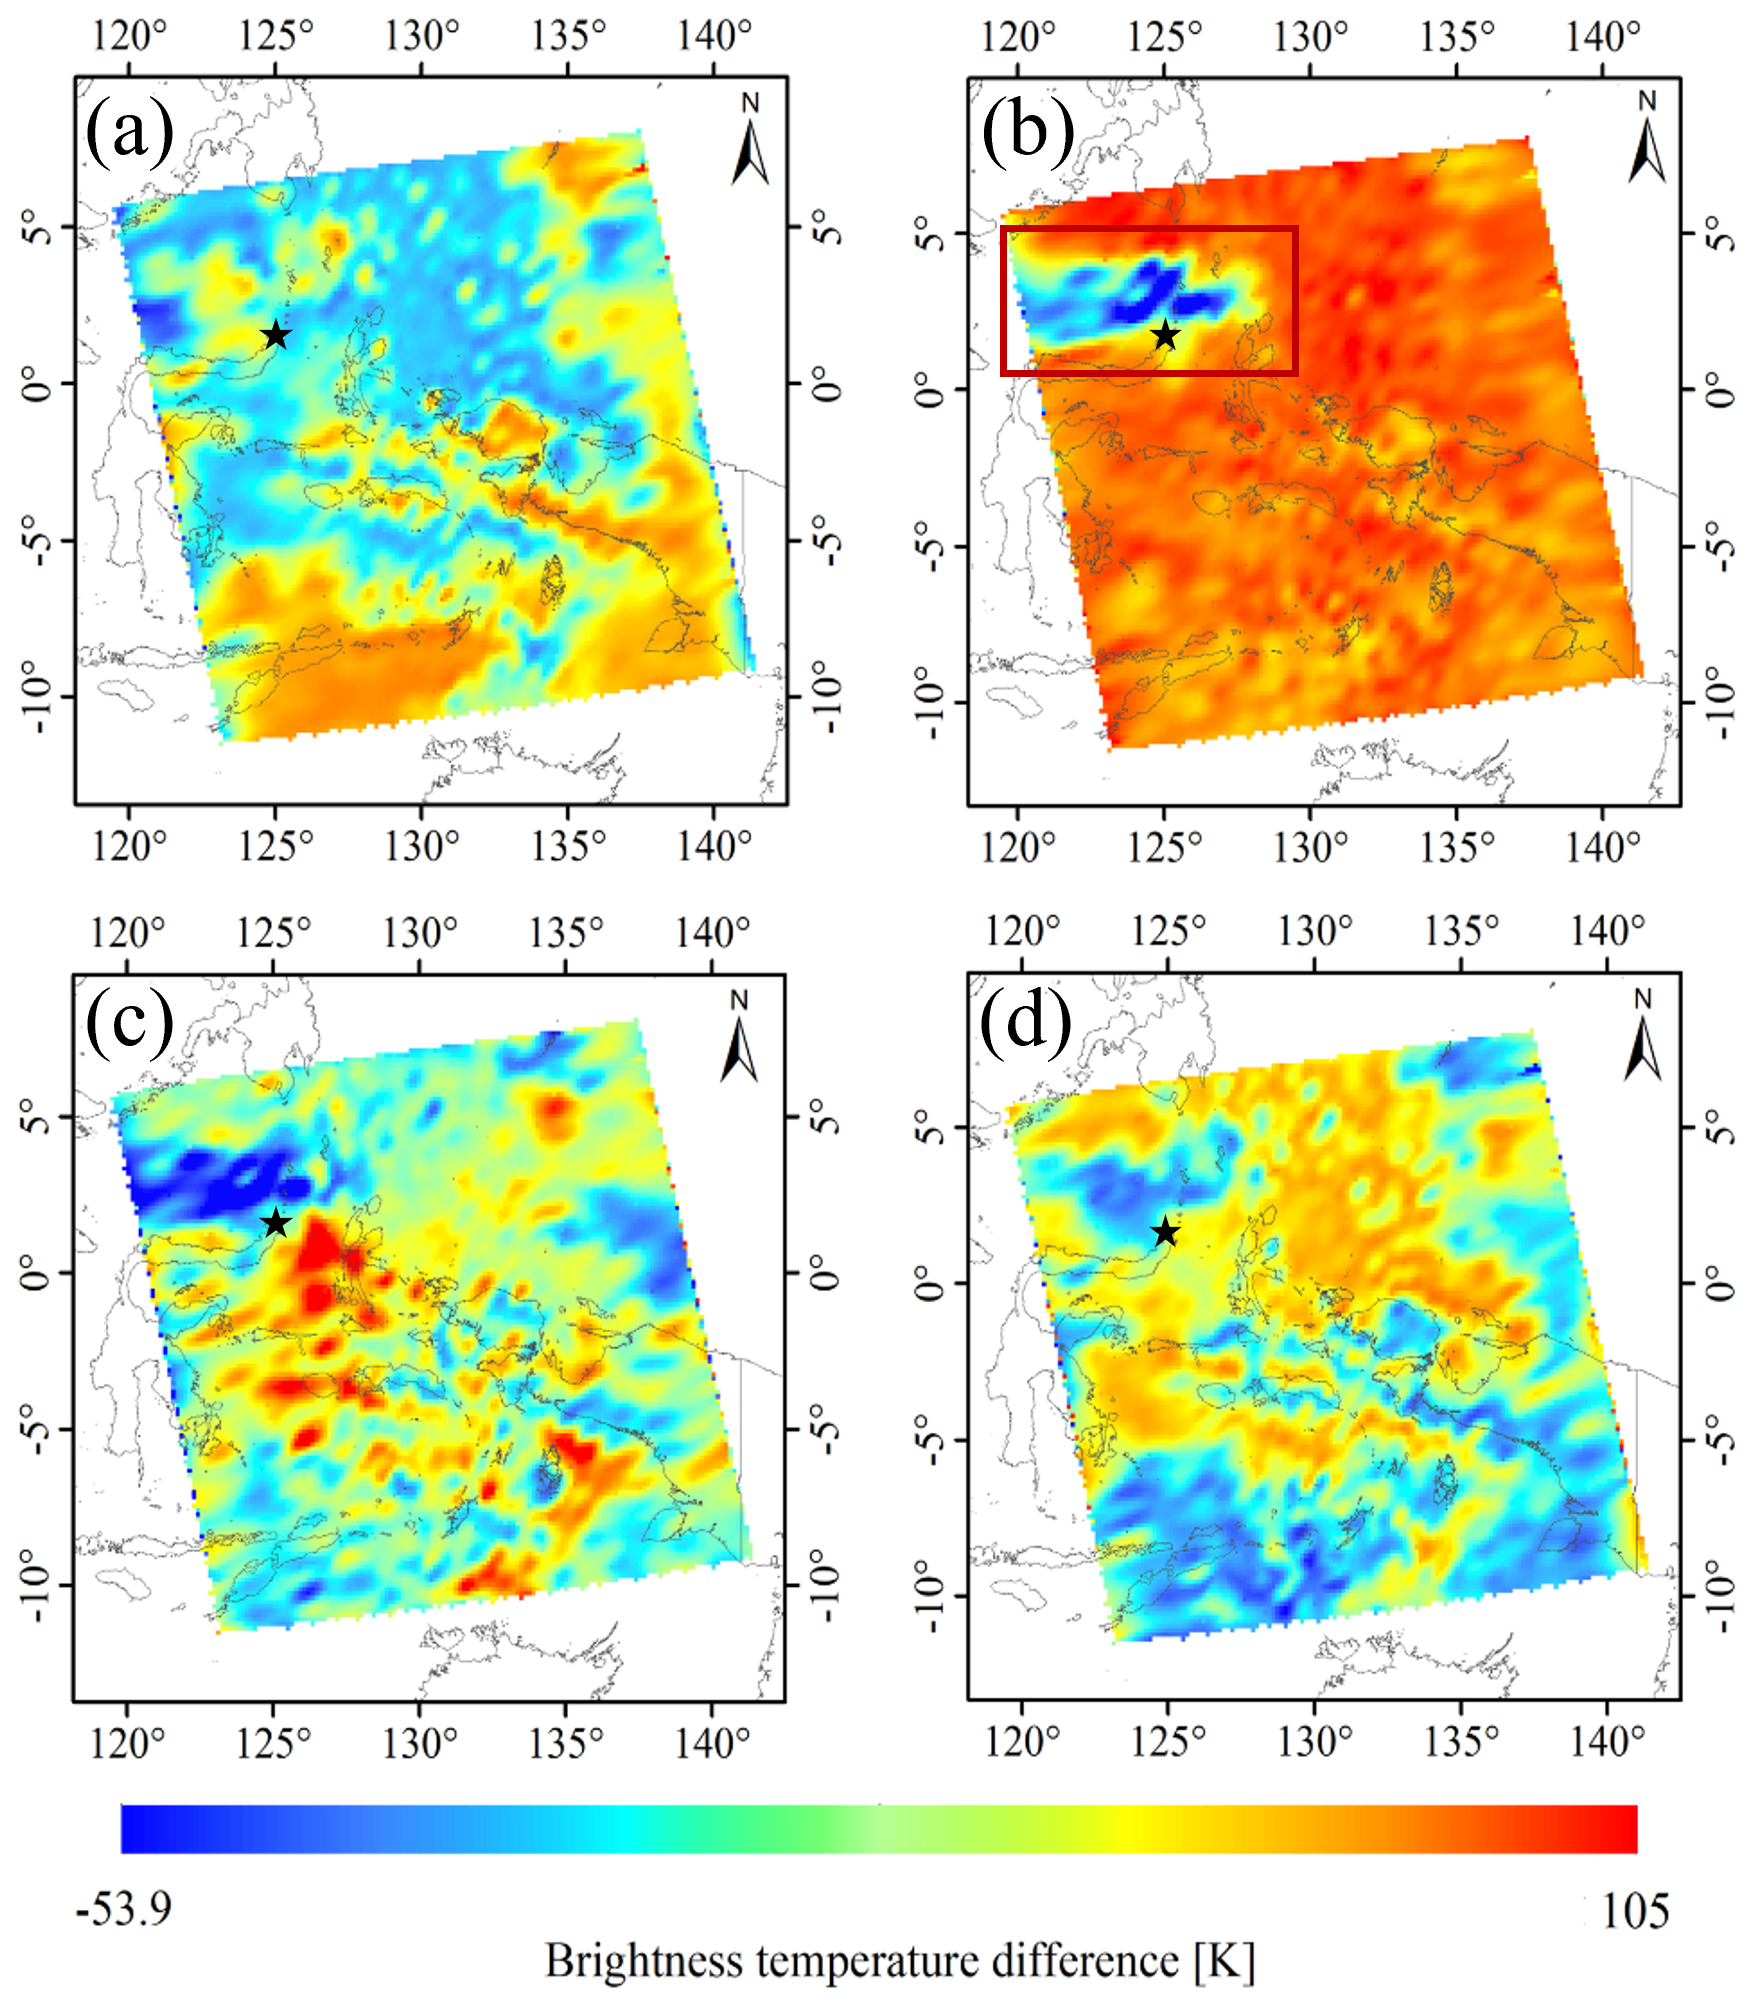
Figure 14FY-3E/HIRAS-II brightness temperature difference data for the region around Mount Ruang (black star in each image) at 08:55 UT on 18 April 2024 for the channels (a) 1360.625 and 902.5 cm−1, (b) 1360.625 and 1429.375 cm−1, (c) 1163.125 and 902.5 cm−1, and (d) 1163.125 and 1887.5 cm−1.
4.2 SO2 plume sensitivity
This study assumes an atmosphere containing SO2 clouds at various altitudes and simulates the radiative transfer in a standard atmosphere with an introduced SO2 layer of varying SO2 concentrations. The simulations replicate FY-3E/HIRAS-II's observations of SO2 volcanic plumes, focusing on the sensitivity of the differences in BT between central wavenumbers of 1360.625 and 902.5 cm−1 and between 1163.125 and 902.5 cm−1 in the total SO2 column in Dobson units at four plume altitudes (3, 6, 12, and 16 km). The temperature and humidity profiles for these simulations are based on the US Standard Atmosphere, 1976. Figure 13a shows that, for SO2 plumes under varying pressure intensities, strong sensitivity is observed when the SO2 content exceeds 50 DU. Between 50 and 300 DU, the sensitivity of the SO2 plume increases with altitude. However, beyond 300 DU, the impact of altitude on sensitivity diminishes, indicating a saturation state. Thus, the 1360.625 cm−1 channel is prone to saturation at high SO2 concentrations. Figure 13b shows that, for SO2 plumes below 400 DU, the SO2 Jacobian function value for the 1163.125 cm−1 channel is relatively low, resulting in reduced sensitivity. Conversely, above 500 DU, the channel exhibits a more pronounced response to increasing SO2 concentration and plume height.
Therefore, combining these two channels for different SO2 concentrations enables the representation of a broad range of net SO2 absorption. The brightness temperature difference between the 1360.625 and 902.5 cm−1 channels can reach up to ∼ 70 K, aligning well with previous experimental results (Ackerman et al., 2008).
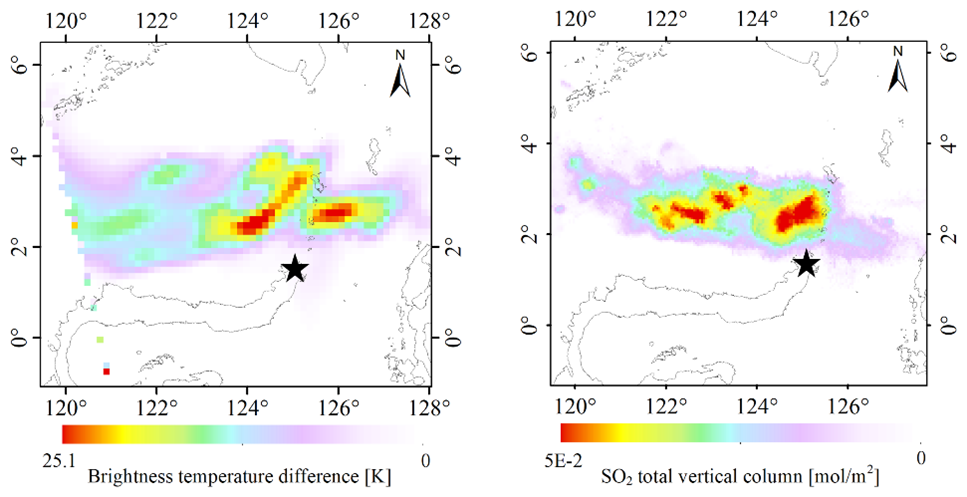
Figure 15Comparison of SO2 around Mount Ruang (black star in each image) observed by FY3E/HIRAS-II on 18 April at 08:55 UT and Sentinel-5P/TROPOMI on 18 April at 04:07:08 UT.
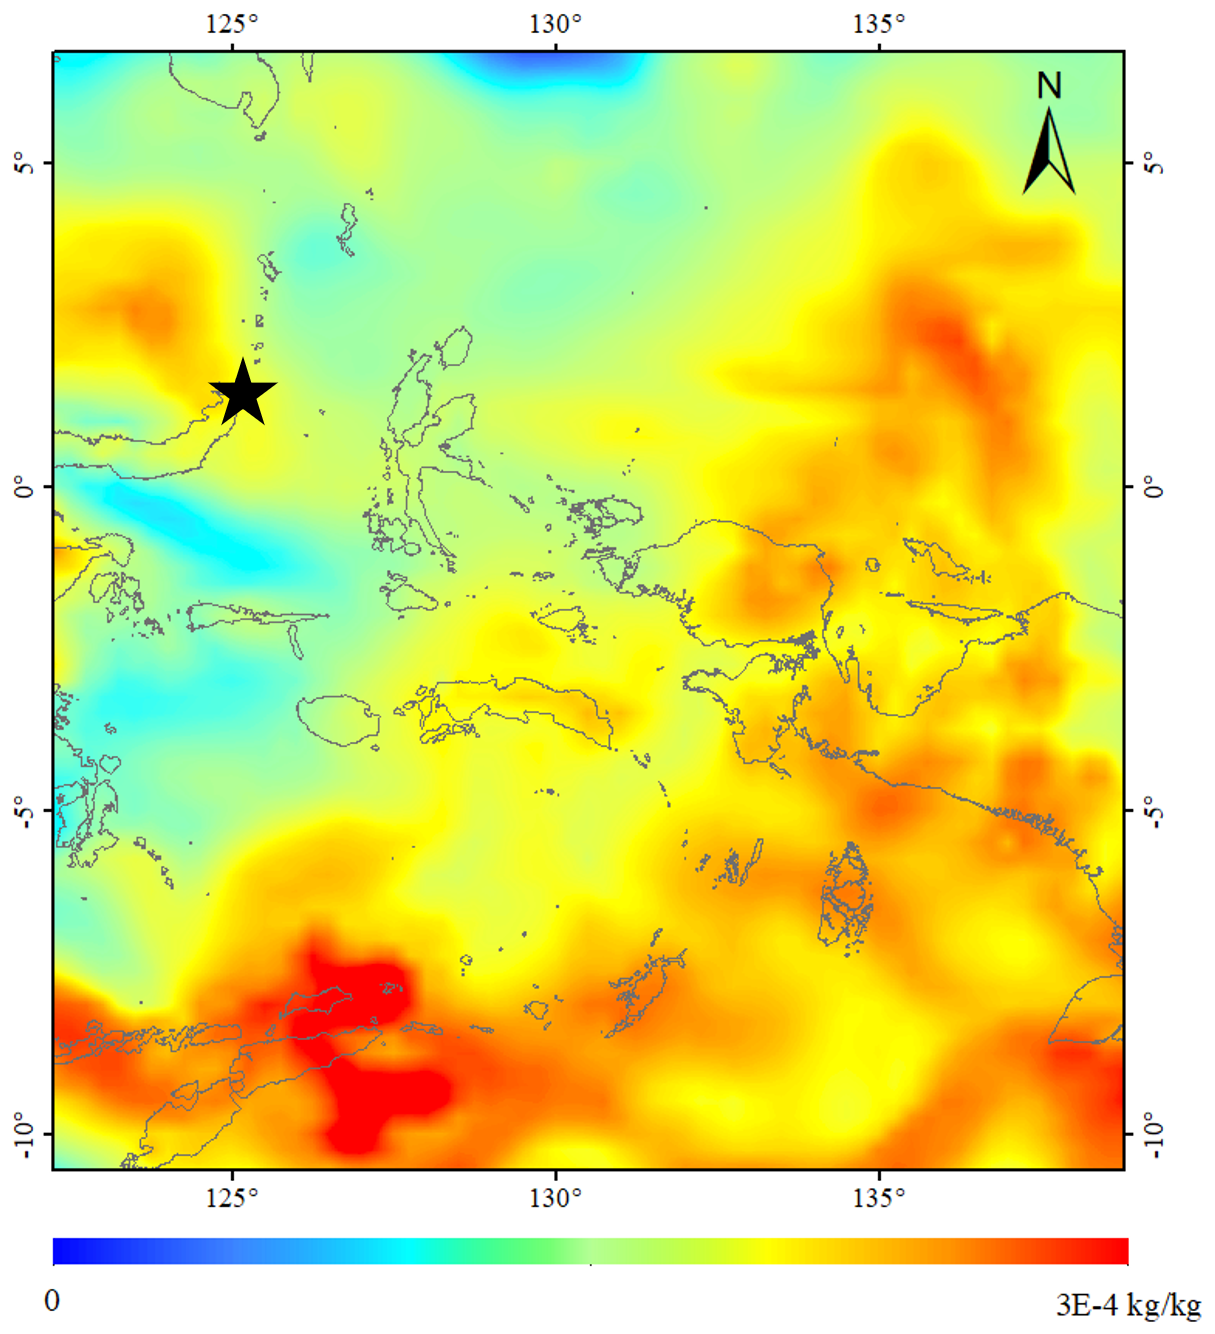
Figure 16Specific humidity data from ERA5 for the area around Mount Ruang (black star) at 09:00 UT on 18 April 2024 at an atmospheric pressure of 400 hPa.
The channels for SO2 detection and retrieval least affected by temperature and water vapor were selected based on experimental results. To verify the accuracy of our channel selection, we compared observations of a volcanic eruption using our selected channels and normal channels.
The selected eruption was of Mount Ruang, Indonesia, the southernmost complex volcano in the Sandwich Islands. Its first recorded eruption in 1808 forced the evacuation of over 1000 people (Galetto et al., 2024). Its violent eruption on the evening of 17 April 2024 was observed by FY-3E/HIRAS-II on 18 April. The collected data are used to explore the advantages of our selected channels.
Figure 14 depicts the differences between the following pairs of channels: 1360.625 and 902.5 cm−1, 1360.625 and 1429.375 cm−1, 1163.125 and 902.5 cm−1, and 1163.125 and 1887.5 cm−1. Comparison of the difference results of Fig. 14a and b indicates that the extent of the SO2 plume near the volcano's center may be mistaken for water vapor due to the background channel's inability to effectively remove the effect of water vapor from the 1360.625 cm−1 channel. Water vapor far from the crater is prone to misclassification as SO2 gas. A comparison of the Fig. 14c and d sets of difference results indicates that it is challenging to separate SO2 from the atmosphere due to the smaller value of the SO2 Jacobian matrix for the 1163.125 cm−1 channel and its lower sensitivity to SO2 information compared with the 1360.625 cm−1 channel. In addition, the eruption increased the atmospheric temperature near the volcano, and the difference between the 1163.125 and 1887.5 cm−1 channels cannot remove the atmospheric temperature information observed by the sensors, resulting in significant BT differences over a large area compared to the former, and the difference between the 1163.125 and 902.5 cm−1 channels allows for a more pronounced enhancement of certain SO2 plumes, but the results were still suboptimal. Figure 14b shows the BT difference between the most sensitive and background channels based on the experimental selection. The chosen combination of SO2 channels filters out most of the water vapor and atmospheric temperature effects in the observation channel, resulting in better detection of small SO2 plumes.
Figure 15 compares the FY-3E/HIRAS-II BT difference data (for the area indicated by the red box in Fig. 14b) with the corresponding observations by Sentinel-5P/TROPOMI. The area of the SO2 plume's spread and its trajectory are essentially the same for both cases. Figure 16 shows the absolute humidity data at 09:00 UT on 18 April 2024 from the ERA5 atmospheric reanalysis data at an atmospheric pressure of 400 hPa, confirming that the SO2 plume observed by FY-3E/HIRAS-II in Fig. 14 is largely free of interference by water vapor.
This paper proposes a novel methodology for selecting SO2-sensitive channels from FY-3E/HIRAS-II hyperspectral IR atmospheric sensors to quantitatively monitor volcanic SO2. The peak and maximum half-width of the Jacobian function of SO2, temperature, and water vapor under different atmospheric conditions were cross-compared to identify the optimal channels for SO2 detection and retrieval. The results demonstrate that the 1360.625 cm−1 channel (wavelength around 7.3 µm) is most sensitive to SO2, exhibiting a maximum peak and half-width Jacobian values that convey comprehensive SO2 absorption information, while the 1163.125 cm−1 (wavelength around 8.6 µm) channel has a weaker absorption of SO2 compared to the 1360.625 cm−1 channel but also contains valuable information.
Through cross-comparison of the Jacobian matrices of water vapor, temperature, and SO2, we find that the 1429.375 cm−1 channel (wavelength around 7.0 µm) can not only reflect the water vapor information to the greatest extent but also maintain variations consistent with the atmospheric temperature and SO2, which allows us to minimize the influence of atmospheric water vapor and temperature on SO2 detection and retrieval. In the atmospheric IR window band, we identify the two channels (902.5 and 901.875 cm−1) with the highest frequency of maximum BT under different atmospheric conditions as the land surface temperature channels to mitigate the influence of land on SO2 observations.
A sensitivity study shows that the BT difference (BTD) between the experimentally selected SO2-sensitive channel (1360.625 cm−1 channel) and the background channel (902.5 cm−1 channel) demonstrates a pronounced relationship with SO2 between 50 and 300 DU. To address the phenomenon of saturation of the SO2 response in the 1360.625 cm−1 channel at high concentrations, we propose using the 1163.125 cm−1 channel to provide auxiliary information. It is demonstrated that the 1163.125 cm−1 channel exhibits a more significant and linear response to increasing SO2 concentration and plume height when the SO2 is above 500 DU. In addition, in the lower and middle layers, a positive difference between the surface air temperature and the surface skin temperature enables the IR band to capture more SO2 information. By further analyzing the BTD between 1360.625 and 1429.375 cm−1, the influence of water vapor and atmospheric temperature from 1360.625 cm−1 can be effectively removed.
The main advantage of this methodology is that it comprehensively considers the interference of atmospheric temperature, humidity, and surface temperature in SO2 detection and retrieval, laying the groundwork for developing a more accurate and flexible volcanic SO2 retrieval algorithm under different atmospheric conditions. Traditional broadband multispectral satellites are seriously influenced by water vapor and atmospheric temperature in the SO2 absorption region, and it is difficult to accurately separate water vapor and temperature information from SO2-sensitive channels. This methodology overcomes the above problem using satellite-based hyperspectral IR data in a Jacobian matrix information framework. This method is able to greatly enhance the efficiency of extracting SO2 information from a hyperspectral IR sounder with a large number of channels while maintaining the accuracy. Therefore, it has great potential in both satellite-based and ground-based hyperspectral data processing for volcanic SO2 retrieval.
For future work, development of a comprehensive dataset representing a variety of volcanic ash spectral properties and atmospheric conditions for SO2 modeling, detection, and retrieval is highly desirable. Building on the dataset and the traditional LBLRTM, machine learning methods can help explore the nonlinear relationship between volcanic SO2 and the atmosphere or surface signals from massive forward-simulated samples and develop a fast and accurate radiative transfer model for SO2 retrieval.
The atmosphere profile data are available at https://doi.org/10.5281/zenodo.14174378 (Li, 2024). The TROPOMI SO2 data are freely available at https://doi.org/10.5270/S5P-74eidii (Copernicus Sentinel-5P, 2020). The LBLRTM code is freely available at https://github.com/AER-RC/LBLRTM (Clough, 1991). The ERA5-specific humidity data are freely available from the Copernicus Climate Change Service (C3S) Climate Data Store (CDS; https://doi.org/10.24381/cds.adbb2d47, Hersbach et al., 2023).
XL: writing – original draft, formal analysis, data curation, writing – review and editing. LZ: conceptualization, methodology, writing – review and editing. HS: conceptualization, writing – review and editing. JL: methodology, writing – review and editing. XL: data curation. CQ: resources. HY: resources.
The contact author has declared that none of the authors has any competing interests.
Publisher's note: Copernicus Publications remains neutral with regard to jurisdictional claims made in the text, published maps, institutional affiliations, or any other geographical representation in this paper. While Copernicus Publications makes every effort to include appropriate place names, the final responsibility lies with the authors.
This research was supported by National Natural Science Foundation of China grant nos. 12292983 and 42271383. Special thanks go to Di di from Nanjing University of Information Science and Technology for her advice and assistance on Jacobian calculations.
This research has been supported by the National Natural Science Foundation of China (grant nos. 12292983 and 42271383).
This paper was edited by Lars Hoffmann and reviewed by two anonymous referees.
Ackerman, S. A., Schreiner, A. J., Schmit, T. J., Woolf, H. M., Li, J., and Pavolonis, M.: Using the GOES Sounder to monitor upper level SO2 from volcanic eruptions, J. Geophys. Res., 113, D14S11, https://doi.org/10.1029/2007JD009622, 2008.
Aires, F., Chédin, A., Scott, N. A., and Rossow, W. B.: A regularized neural net approach for retrieval of atmospheric and surface temperatures with the IASI instrument, J. Appl. Meteorol., 41, 144–159, https://doi.org/10.1175/1520-0450(2002)041<0144:ARNNAF>2.0.CO;2, 2002.
Aires, F., Pellet, V., Prigent, C., and Moncet, J.-L.: Dimension reduction of satellite observations for remote sensing. Part 1: A comparison of compression, channel selection and bottleneck channel approaches, Q. J. Roy. Meteor. Soc., 142, 2658–2669, https://doi.org/10.1002/qj.2855, 2016.
Bauduin, S., Clarisse, L., Theunissen, M., George, M., Hurtmans, D., Clerbaux, C., and Coheur, P. F.: IASI's sensitivity to near-surface carbon monoxide (CO): Theoretical analyses and retrievals on test cases, J. Quant. Spectrosc. Ra., 189, 428–440, https://doi.org/10.1016/j.jqsrt.2016.12.022, 2017.
Cady-Pereira, K., Alvarado, M., Mlawer, E., Iacono, M., Delamere, J., and Pernak, R.: AER Line File Parameters (v3.8.2), Zenodo [data set], https://doi.org/10.5281/zenodo.7853414, 2020.
Carboni, E., Grainger, R. G., Mather, T. A., Pyle, D. M., Thomas, G. E., Siddans, R., Smith, A. J. A., Dudhia, A., Koukouli, M. E., and Balis, D.: The vertical distribution of volcanic SO2 plumes measured by IASI, Atmos. Chem. Phys., 16, 4343–4367, https://doi.org/10.5194/acp-16-4343-2016, 2016.
Carey, S. and Sigurdsson, H.: The 1982 eruptions of El Chichon volcano, Mexico (2): Observations and numerical modelling of tephra-fall distribution, B. Volcanol., 48, 127–141, https://doi.org/10.1007/BF01046547, 1986.
Carn, S. A., Krueger, A. J., Bluth, G. J. S., Schaefer, S. J., Krotkov, N. A., Watson, I. M., and Datta, S.: Volcanic eruption detection by the Total Ozone Mapping Spectrometer (TOMS) instruments: a 22-year record of sulphur dioxide and ash emissions, in: Volcanic Degassing, edited by: Oppenheimer, C., Pyle, D. M., and Barclay, J., Geological Society of London, 213, 177–202, https://doi.org/10.1144/gsl.Sp.2003.213.01.11, 2003.
Casadevall, T. J., Rose Jr, W. I., Fuller, W. H., Hunt, W. H., Hart, M. A., Moyers, J. L., Woods, D. C., Chuan, R. L., and Friend, J. P.: Sulfur dioxide and particles in quiescent volcanic plumes from Poás, Arenal, and Colima Volcanos, Costa Rica and Mexico, J. Geophys. Res., 89, 9633–9641, https://doi.org/10.1029/JD089iD06p09633, 1984.
Chang, S., Sheng, Z., Du, H., Ge, W., and Zhang, W.: A channel selection method for hyperspectral atmospheric infrared sounders based on layering, Atmos. Meas. Tech., 13, 629–644, https://doi.org/10.5194/amt-13-629-2020, 2020.
Clarisse, L., Prata, F., Lacour, J. L., Hurtmans, D., Clerbaux, C., and Coheur, P. F.: A correlation method for volcanic ash detection using hyperspectral infrared measurements, Geophys. Res. Lett., 37, https://doi.org/10.1029/2010gl044828, 2010.
Clough, S. A.: Line-By-Line Radiative Transfer Model, Github [code], https://github.com/AER-RC/LBLRTM, 1991.
Clough, S. A., Shephard, M. W., Mlawer, E. J., Delamere, J. S., Iacono, M. J., Cady-Pereira, K., Boukabara, S., and Brown, P. D.: Atmospheric radiative transfer modeling: a summary of the AER codes, J. Quant. Spectrosc. Ra., 91, 233–244, https://doi.org/10.1016/j.jqsrt.2004.05.058, 2005.
Cofano, A., Cigna, F., Santamaria Amato, L., Siciliani de Cumis, M., and Tapete, D.: Exploiting Sentinel-5P TROPOMI and Ground Sensor Data for the Detection of Volcanic SO2 Plumes and Activity in 2018–2021 at Stromboli, Italy, Sensors, 21, 6991, https://doi.org/10.3390/s21216991, 2021.
Collard, A. D.: Selection of IASI channels for use in numerical weather prediction, Q. J. Roy. Meteor. Soc., 133, 1977–1991, https://doi.org/10.1002/qj.178, 2007.
Coopmann, O., Guidard, V., Fourrié, N., Josse, B., and Marécal, V.: Update of Infrared Atmospheric Sounding Interferometer (IASI) channel selection with correlated observation errors for numerical weather prediction (NWP), Atmos. Meas. Tech., 13, 2659–2680, https://doi.org/10.5194/amt-13-2659-2020, 2020.
Copernicus Sentinel-5P: TROPOMI Level 2 Sulphur Dioxide Total Column, Version 02, processed by ESA, European Space Agency [data set], https://doi.org/10.5270/S5P-74eidii, 2020.
Corradini, S., Merucci, L., and Prata, A. J.: Retrieval of SO2 from thermal infrared satellite measurements: correction procedures for the effects of volcanic ash, Atmos. Meas. Tech., 2, 177–191, https://doi.org/10.5194/amt-2-177-2009, 2009.
Corradini, S., Merucci, L., Prata, A. J., and Piscini, A.: Volcanic ash and SO2 in the 2008 Kasatochi eruption: Retrievals comparison from different IR satellite sensors, J. Geophys. Res., 115, https://doi.org/10.1029/2009JD013634, 2010.
Corradini, S., Guerrieri, L., Brenot, H., Clarisse, L., Merucci, L., Pardini, F., Prata, A. J., Realmuto, V. J., Stelitano, D., and Theys, N.: Tropospheric Volcanic SO2 Mass and Flux Retrievals from Satellite, The Etna December 2018 Eruption, Remote Sens., 13, 2225, https://doi.org/10.3390/rs13112225, 2021.
Corradino, C., Jouve, P., La Spina, A., and Del Negro, C.: Monitoring Earth's atmosphere with Sentinel-5 TROPOMI and Artificial Intelligence: Quantifying volcanic SO2 emissions, Remote Sens. Environ., 315, 114463, https://doi.org/10.1016/j.rse.2024.114463, 2024.
Crevoisier, C., Chedin, A., and Scott, N. A.: AIRS channel selection for CO2 and other trace-gas retrievals, Q. J. Roy. Meteor. Soc., 129, 2719–2740, https://doi.org/10.1256/qj.02.180, 2003.
Di, D., Ai, Y. F., Li, J., Shi, W. J., and Lu, N. M.: Geostationary satellite-based 6.7 µm band best water vapor information layer analysis over the Tibetan Plateau, J. Geophys. Res.-Atmos., 121, 4600–4613, https://doi.org/10.1002/2016jd024867, 2016.
Di, D., Li, J., Han, W., and Yin, R. Y.: Geostationary Hyperspectral Infrared Sounder Channel Selection for Capturing Fast-Changing Atmospheric Information, IEEE T. Geosci. Remote, 60, 4102210, https://doi.org/10.1109/tgrs.2021.3078829, 2022.
Doutriaux-Boucher, M. and Dubuisson, P.: Detection of volcanic SO2 by spaceborne infrared radiometers, Atmos. Res., 92, 69–79, https://doi.org/10.1016/j.atmosres.2008.08.009, 2009.
Feng, G., Masek, J., Schwaller, M., and Hall, F.: On the blending of the Landsat and MODIS surface reflectance: predicting daily Landsat surface reflectance, IEEE T. Geosci. Remote, 44, 2207–2218, https://doi.org/10.1109/TGRS.2006.872081, 2006.
Fourrié, N. and Rabier, F.: Cloud characteristics and channel selection for IASI radiances in meteorologically sensitive areas, Q. J. Roy. Meteor. Soc., 130, 1839–1856, https://doi.org/10.1256/qj.03.27, 2004.
Galetto, F., Lobos Lillo, D., and Pritchard, M. E.: The use of high-resolution satellite topographic data to quantify volcanic activity at Raung volcano (Indonesia) from 2000 to 2021, B. Volcanol., 87, 1, https://doi.org/10.1007/s00445-024-01781-1, 2024.
Gambacorta, A. and Barnet, C. D.: Methodology and Information Content of the NOAA NESDIS Operational Channel Selection for the Cross-Track Infrared Sounder (CrIS), IEEE T. Geosci. Remote, 51, 3207–3216, https://doi.org/10.1109/tgrs.2012.2220369, 2013.
Gíslason, S. R., Stefánsdóttir, G., Pfeffer, M. A., Barsotti, S., Jóhannsson, T., Galeczka, I., Bali, E., Sigmarsson, O., Stefánsson, A., Keller, N. S., Sigurdsson, A., Bergsson, B., Galle, B., Jacobo, V. C., Arellano, S., Aiuppa, A., Jónasdóttir, E. B., Eiríksdóttir, E. S., Jakobsson, S., Guodfinnsson, G. H., Halldórsson, S. A., Gunnarsson, H., Haddadi, B., Jónsdóttir, I., Thordarson, T., Riishuus, M., Högnadottir, T., Dürig, T., Pedersen, G. B. M., Höskuldsson, A., and Gudmundsson, M. T.: Environmental pressure from the 2014–15 eruption of Bardarbunga volcano, Iceland, Geochem. Perspect. Lett., 1, 84–92, https://doi.org/10.7185/geochemlet.1509, 2015.
Hersbach, H., Bell, B., Berrisford, P., Hirahara, S., Horányi, A., Muñoz-Sabater, J., Nicolas, J., Peubey, C., Radu, R., Schepers, D., Simmons, A., Soci, C., Abdalla, S., Abellan, X., Balsamo, G., Bechtold, P., Biavati, G., Bidlot, J., Bonavita, M., and Thépaut, J. N.: The ERA5 global reanalysis, Q. J. Roy. Meteor. Soc., 146, 1999–2049, https://doi.org/10.1002/qj.3803, 2020.
Hersbach, H., Bell, B., Berrisford, P., Biavati, G., Horányi, A., Muñoz Sabater, J., Nicolas, J., Peubey, C., Radu, R., Rozum, I., Schepers, D., Simmons, A., Soci, C., Dee, D., and Thépaut, J.-N.: ERA5 hourly data on single levels from 1940 to present, Copernicus Climate Change Service (C3S) Climate Data Store (CDS) [data set], https://doi.org/10.24381/cds.adbb2d47, 2023.
Holasek, R. E., Self, S., and Woods, A. W.: Satellite observations and interpretation of the 1991 Mount Pinatubo eruption plumes, J. Geophys. Res., 101, 27635–27655, https://doi.org/10.1029/96JB01179, 1996.
Huang, J., Ma, G., Liu, G. Q., Li, J., and Zhang, H.: The Evaluation of FY-3E Hyperspectral Infrared Atmospheric Sounder-II Long-Wave Temperature Sounding Channels, Remote Sens., 15, 17, https://doi.org/10.3390/rs15235525, 2023.
Inness, A., Ades, M., Balis, D., Efremenko, D., Flemming, J., Hedelt, P., Koukouli, M.-E., Loyola, D., and Ribas, R.: Evaluating the assimilation of S5P/TROPOMI near real-time SO2 columns and layer height data into the CAMS integrated forecasting system (CY47R1), based on a case study of the 2019 Raikoke eruption, Geosci. Model Dev., 15, 971–994, https://doi.org/10.5194/gmd-15-971-2022, 2022.
Jimenez-Munoz, J. C., Cristobal, J., Sobrino, J. A., Soria, G., Ninyerola, M., and Pons, X.: Revision of the Single-Channel Algorithm for Land Surface Temperature Retrieval From Landsat Thermal-Infrared Data, IEEE T. Geosci. Remote, 47, 339–349, https://doi.org/10.1109/TGRS.2008.2007125, 2009.
Krueger, A. J. and Minzner, R. A.: A mid-latitude ozone model for the 1976 U.S. Standard Atmosphere, J. Geophys. Res., 81, 4477–4481, https://doi.org/10.1029/JC081i024p04477, 1976.
Krueger, A. J., Krotkov, N. A., Yang, K., Carn, S., Vicente, G., and Schroeder, W.: Applications of Satellite-Based Sulfur Dioxide Monitoring, IEEE J. Sel. Top. Appl., 2, 293–298, https://doi.org/10.1109/jstars.2009.2037334, 2009.
Kruse, F.: Predictive subpixel spatial/spectral modeling using fused HSI and MSI data, SPIE, 5425, https://doi.org/10.1117/12.542631, 2004.
Kuai, L., Natraj, V., Shia, R.-L., Miller, C., and Yung, Y. L.: Channel selection using information content analysis: A case study of CO2 retrieval from near infrared measurements, J. Quant. Spectrosc. Ra., 111, 1296–1304, https://doi.org/10.1016/j.jqsrt.2010.02.011, 2010.
Li, J.: Temperature and water vapor weighting functions from radiative transfer equation with surface emissivity and solar reflectivity, Adv. Atmos. Sci., 11, 421–426, https://doi.org/10.1007/BF02658162, 1994.
Li, J. and Han, W.: A step forward toward effectively using hyperspectral IR sounding information in NWP, Adv. Atmos. Sci., 34, 1263–1264, https://doi.org/10.1007/s00376-017-7167-2, 2017.
Li, J., Menzel, W. P., Schmit, T. J., and Schmetz, J.: Applications of Geostationary Hyperspectral Infrared Sounder Observations: Progress, Challenges, and Future Perspectives, B. Am. Meteor. Soc., 103, E2733–E2755, https://doi.org/10.1175/BAMS-D-21-0328.1, 2022.
Li, S., Hu, H., Fang, C., Wang, S., Xun, S., He, B., Wu, W., and Huo, Y.: Hyperspectral Infrared Atmospheric Sounder (HIRAS) Atmospheric Sounding System, Remote Sens., 14, 3882, https://doi.org/10.3390/rs14163882, 2022.
Li, X.: atmosphere profile data, Zenodo [data set], https://doi.org/10.5281/zenodo.14174378, 2024.
Lipton, A. E.: Satellite sounding channel optimization in the microwave spectrum, IEEE T. Geosci. Remote, 41, 761–781, https://doi.org/10.1109/tgrs.2003.810926, 2003.
Milstein, A. B. and Blackwell, W. J.: Neural network temperature and moisture retrieval algorithm validation for AIRS/AMSU and CrIS/ATMS, J. Geophys. Res.-Atmos., 121, 1414–1430, https://doi.org/10.1002/2015jd024008, 2016.
Noh, Y. C., Sohn, B. J., Kim, Y., Joo, S., Bell, W., and Saunders, R.: A new Infrared Atmospheric Sounding Interferometer channel selection and assessment of its impact on Met Office NWP forecasts, Adv. Atmos. Sci., 34, 1265–1281, https://doi.org/10.1007/s00376-017-6299-8, 2017.
Patrick, M. R., Houghton, B. F., Anderson, K. R., Poland, M. P., Montgomery-Brown, E., Johanson, I., Thelen, W., and Elias, T.: The cascading origin of the 2018 Klauea eruption and implications for future forecasting, Nat. Commun., 11, 5646, https://doi.org/10.1038/s41467-020-19190-1, 2020.
Prata, A. J. and Kerkmann, J.: Simultaneous retrieval of volcanic ash and SO2 using MSG-SEVIRI measurements, Geophys. Res. Lett., 34, https://doi.org/10.1029/2006GL028691, 2007.
Prata, A. J., Rose, W. I., Self, S., and O'Brien, D. M.: Global, Long-Term Sulphur Dioxide Measurements from TOVS Data: A New Tool for Studying Explosive Volcanism and Climate, in: Volcanism and the Earth's Atmosphere, American Geophysical Union, 75–92, https://doi.org/10.1029/139GM05, 2004.
Rabier, F., Fourrié, N., Chafaï, D., and Prunet, P.: Channel selection methods for Infrared Atmospheric Sounding Interferometer radiances, Q. J. Roy. Meteor. Soc., 128, 1011–1027, https://doi.org/10.1256/0035900021643638, 2002.
Rose, W. I., Gu, Y., Watson, I. M., Yu, T., Blut, G. J. S., Prata, A. J., Krueger, A. J., Krotkov, N., Carn, S., Fromm, M. D., Hunton, D. E., Ernst, G. G. J., Viggiano, A. A., Miller, T. M., Ballenthin, J. O., Reeves, J. M., Wilson, J. C., Anderson, B. E., and Flittner, D. E.: The February–March 2000 Eruption of Hekla, Iceland from a Satellite Perspective, Volcanism and the Earth's Atmosphere, 139, 107–132, https://doi.org/10.1029/139GM07, 2004.
Schmidt, A., Carslaw, K. S., Mann, G. W., Rap, A., Pringle, K. J., Spracklen, D. V., Wilson, M., and Forster, P. M.: Importance of tropospheric volcanic aerosol for indirect radiative forcing of climate, Atmos. Chem. Phys., 12, 7321–7339, https://doi.org/10.5194/acp-12-7321-2012, 2012.
Seidel, F. C., Kokhanovsky, A. A., and Schaepman, M. E.: Fast and simple model for atmospheric radiative transfer, Atmos. Meas. Tech., 3, 1129–1141, https://doi.org/10.5194/amt-3-1129-2010, 2010.
Senf, F. and Deneke, H.: Uncertainties in synthetic Meteosat SEVIRI infrared brightness temperatures in the presence of cirrus clouds and implications for evaluation of cloud microphysics, Atmos. Res., 183, 113–129, https://doi.org/10.1016/j.atmosres.2016.08.012, 2017.
Shibata, T. and Kinoshita, T.: Volcanic aerosol layer formed in the tropical upper troposphere by the eruption of Mt. Merapi, Java, in November 2010 observed by the spaceborne lidar CALIOP, Atmos. Res., 168, 49–56, https://doi.org/10.1016/j.atmosres.2015.09.002, 2015.
Taylor, I. A., Preston, J., Carboni, E., Mather, T. A., Grainger, R. G., Theys, N., Hidalgo, S., and Kilbride, B. M.: Exploring the Utility of IASI for Monitoring Volcanic SO2 Emissions, J. Geophys. Res.-Atmos., 123, 5588–5606, https://doi.org/10.1002/2017JD027109, 2018.
Theys, N., De Smedt, I., Yu, H., Danckaert, T., van Gent, J., Hörmann, C., Wagner, T., Hedelt, P., Bauer, H., Romahn, F., Pedergnana, M., Loyola, D., and Van Roozendael, M.: Sulfur dioxide retrievals from TROPOMI onboard Sentinel-5 Precursor: algorithm theoretical basis, Atmos. Meas. Tech., 10, 119–153, https://doi.org/10.5194/amt-10-119-2017, 2017.
Theys, N., Hedelt, P., De Smedt, I., Lerot, C., Yu, H., Vlietinck, J., Wagner, T., Hedelt, P., Bauer, H., Romahn, F., Pedergnana, M., Loyola, D., and Van Roozendael, M.: Global monitoring of volcanic SO2 degassing with unprecedented resolution from TROPOMI onboard Sentinel-5 Precursor, Sci. Rep., 9, 2643, https://doi.org/10.1038/s41598-019-39279-y, 2019.
Thomas, H. E. and Watson, I. M.: Observations of volcanic emissions from space: current and future perspectives, Nat. Hazards, 54, 323–354, https://doi.org/10.1007/s11069-009-9471-3, 2010.
Tournigand, P.-Y., Cigala, V., Lasota, E., Hammouti, M., Clarisse, L., Brenot, H., Prata, F., Kirchengast, G., Steiner, A. K., and Biondi, R.: A multi-sensor satellite-based archive of the largest SO2 volcanic eruptions since 2006, Earth Syst. Sci. Data, 12, 3139–3159, https://doi.org/10.5194/essd-12-3139-2020, 2020.
Tsuchiya, K.: Selection of sensors and spectral bands of marine observation satellite (MOS)–1, Adv. Space Res., 3, 257–261, https://doi.org/10.1016/0273-1177(83)90128-X, 1983.
van Geffen, J., Boersma, K. F., Eskes, H., Sneep, M., ter Linden, M., Zara, M., and Veefkind, J. P.: S5P TROPOMI NO2 slant column retrieval: method, stability, uncertainties and comparisons with OMI, Atmos. Meas. Tech., 13, 1315–1335, https://doi.org/10.5194/amt-13-1315-2020, 2020.
Ventress, L. and Dudhia, A.: Improving the selection of IASI channels for use in numerical weather prediction, Q. J. Roy. Meteor. Soc., 140, 2111–2118, https://doi.org/10.1002/qj.2280, 2014.
Watson, I. M., Realmuto, V. J., Rose, W. I., Prata, A. J., Bluth, G. J. S., Gu, Y., Bader, C. E., and Yu, T.: Thermal infrared remote sensing of volcanic emissions using the moderate resolution imaging spectroradiometer, J. Volcanol. Geoth. Res., 135, 75–89, https://doi.org/10.1016/j.jvolgeores.2003.12.017, 2004.
Xie, M., Gu, M., Hu, Y., Huang, P., Zhang, C., Yang, T., and Yang, C.: A Study on the Retrieval of Ozone Profiles Using FY-3D/HIRAS Infrared Hyperspectral Data, Remote Sens., 15, 1009, https://doi.org/10.3390/rs15041009, 2023.
Yang, F. and Schlesinger, M. E.: On the surface and atmospheric temperature changes following the 1991 Pinatubo volcanic eruption: A GCM study, J. Geophys. Res., 107, ACL 8-1–ACL 8-14, https://doi.org/10.1029/2001JD000373, 2002.
Zhang, P., Hu, X., Lu, Q., Zhu, A., Lin, M., Sun, L., Chen, L., and Xu, N.: FY-3E: The First Operational Meteorological Satellite Mission in an Early Morning Orbit, Adv. Atmos. Sci., 39, 1–8, https://doi.org/10.1007/s00376-021-1304-7, 2022.