the Creative Commons Attribution 4.0 License.
the Creative Commons Attribution 4.0 License.
 | 03 Jun 2025
Advancing CH4 and N2O retrieval strategies for NDACC/IRWG FTIR observations with the support of airborne in situ measurements
James W. Hannigan
Bianca C. Baier
Kathryn McKain
Dan Smale
Atmospheric methane (CH4) and nitrous oxide (N2O) are potent greenhouse gases with significant impacts on climate change. Accurate measurement of their atmospheric abundance is essential for understanding their sources, sinks, and the impact of human activities on the atmosphere. Ground-based high-resolution Fourier-transform infrared (FTIR) observations, employed by collaborative international initiatives like the Infrared Working Group (IRWG) within the Network for the Detection of Atmospheric Composition Change (NDACC), play a vital role in retrieving the atmospheric amounts of these gases. Network-wide consistent data products rely on consistent observations and retrievals. Recent developments in spectroscopy, a priori data, and retrieval software and techniques underscore the necessity to revisit the current retrieval strategies for all NDACC/IRWG species. This study investigates various retrieval strategies of CH4 and N2O utilizing high-resolution FTIR observations in Boulder, Colorado, and compares them with unique airborne in situ measurements. The initial focus is on characterizing retrieval differences across spectroscopy databases. While it is challenging to identify the best retrievals purely based on spectroscopy, as they produce similar outcomes, notable differences in profile shapes and magnitudes underscore the importance of independent validation. Specifically, when multiyear independent nearby AirCore and aircraft in situ profile measurements are used to evaluate vertical distributions and biases in partial columns, they reveal excellent agreement in relative differences with FTIR retrievals and thereby strengthen confidence in the assessment. The final optimized retrievals for CH4 and N2O are presented, incorporating quantitative fitting results and comparisons of vertical profiles as well as partial and total columns. We find that employing a priori profiles using the latest simulations of the Whole Atmosphere Community Climate Model (WACCM) enhances accuracy relative to in situ profiles. While the HITRAN 2020 spectroscopic database is effective for N2O, ATM 2020 provides better results for CH4, with a slight improvement observed when paired with the water vapor line list from the German Aerospace Center (DLR); however, this improvement may be site-dependent. Regarding regularization, both first-order Tikhonov and optimal estimation produce comparable outcomes, as long as the fitted profile degrees of freedom remain between 2 and 2.5. Correspondingly, profile result comparisons yield biases of −0.08 ± 0.38 % and 0.89 ± 0.28 % for tropospheric and stratospheric layers of CH4 relative to AirCore, respectively, whereas they yield a bias of 0.39 ± 0.42 % for aircraft comparisons in the troposphere. For N2O, the bias in the troposphere using aircraft measurements is approximately 0.18 ± 0.2 %. Uncertainty budgets combining random and systematic sources are provided. Random errors, mainly stemming from temperature profile uncertainties and measurement noise, dominate in the troposphere for both gases, with a retrieval random error of 0.5 %. Systematic errors primarily arise from HITRAN-based spectral line parameters, predominantly the line intensity and air-broadened half-width. These findings contribute to advancing our understanding of atmospheric composition and will support the improvement of a harmonized approach for all IRWG/NDACC sites.
- Article
(3459 KB) - Full-text XML
- BibTeX
- EndNote


Atmospheric methane (CH4) and nitrous oxide (N2O) are potent greenhouse gases that significantly contribute to radiative forcing and, consequently, climate change. Accurate and precise measurement of these trace gases is essential for understanding their sources, sinks, and the impact of anthropogenic activities on the Earth's atmosphere. CH4 is considered a short-lived greenhouse gas with an atmospheric lifetime of approximately 10 years. Despite its relatively short atmospheric lifetime compared to other greenhouse gases, CH4 has a high global warming potential, 27 to 30 times that of CO2 over a 100-year timescale, making it a significant contributor to near-term climate forcing. Its sources are diverse, including natural processes, such as wetlands, and anthropogenic activities, such as livestock management and fossil fuel extraction (Canadell et al., 2021). In contrast, N2O is classified as a long-lived greenhouse gas, with a lifetime of approximately 114 years. Although it is less abundant, N2O exhibits a remarkable warming potential, approximately 270 times greater per metric ton than CO2 over a 100-year time horizon. This amplifies its impact on climate change and its role in stratospheric ozone depletion (Prather et al., 2015; Tian et al., 2020). Understanding the sources and sinks of both CH4 and N2O is crucial for developing effective climate mitigation strategies and policies. Moreover, as both gases are intricately linked to the global carbon and nitrogen cycles, studying their behavior aids in comprehending broader ecological processes and human-induced perturbations to the Earth's atmosphere (Canadell et al., 2021).
Ground-based Fourier-transform infrared (FTIR) spectroscopy has proven to be a reliable method for extracting atmospheric concentrations of both CH4 and N2O through direct-Sun solar absorption measurements. Collaborative international initiatives actively use FTIR observations to retrieve information on these species. The Infrared Working Group (IRWG) within the Network for the Detection of Atmospheric Composition Change (NDACC) has demonstrated the capability to retrieve both gases, along with numerous others, in the mid-infrared with higher spectral resolution and over the long term (De Mazière et al., 2018). Simultaneously, the Total Column Observation Network (TCCON) focuses on precision measurements of column-averaged abundances for CH4 and N2O in the near-infrared spectral region (Wunch et al., 2011). Additionally, the newly formed Collaborative Carbon Column Observing Network (COCCON) has employed portable low-resolution FTIR spectrometers to measure greenhouse gases, including CH4 and N2O (Hase et al., 2016; Alberti et al., 2022). While TCCON and COCCON have optimized their retrievals through profile scaling to derive total columns, the IRWG/NDACC is able to obtain vertical profile information with higher spectral resolution, with degrees of freedom (DOF) values of up to 2 or 3.
Presently, sites within IRWG/NDACC generally adhere to the recommendations outlined in Sussmann et al. (2011). However, as evidenced by Sepúlveda et al. (2014), Bader et al. (2017), and Olsen et al. (2017), a significant variability exists in the final retrieval strategies employed at each site. The retrieval strategy proposed by Sussmann et al. (2011) for CH4 involved using the HIgh-resolution TRANsmission molecular absorption database (HITRAN) 2001, which exhibited better agreement between measured and simulated spectra compared to newer databases of that time (e.g., HITRAN 2008; Rothman et al., 2009). This strategy utilized three out of five possible micro-windows and incorporated Tikhonov L1 regularization, which focuses on stabilizing the solution by adding constraints to the optimization problem. In a more recent study, Chesnokova et al. (2020) analyzed total columns derived from various line lists, concluding that HITRAN 2001 offers better CH4 retrievals. However, ATM19 (Toon, 2015; Toon et al., 2016) produced slightly different, yet comparable, results to HITRAN 2001. This conclusion is based on the optimal agreement observed between measured and simulated spectra. Considering the availability of updated spectroscopy, diverse retrieval strategies at each site, and new validation data, there is a pressing need to explore an optimal and harmonized strategy within the IRWG/NDACC. Additionally, while previous studies have focused mainly on total columns, IRWG/NDACC observations have the potential to separate both tropospheric and stratospheric columns for N2O and CH4. However, this has not yet been extensively validated.
This study investigates diverse retrieval strategies for CH4 and N2O, employing several micro-windows, a priori profiles, and regularization methods. High-resolution Fourier-transform infrared (HR-FTIR) observations in Boulder, Colorado, form the basis of our analysis (Ortega et al., 2021). Initially, we focus on characterizing residuals, representing differences between simulated and observed spectra using different spectroscopy databases. A key aspect of our investigation involves integrating multiyear independent observations from AirCore (CH4) and aircraft (CH4 and N2O) profiles obtained in close proximity to the FTIR site. These independent datasets are crucial for evaluating the vertical distribution (profile shapes) of the retrieval strategies. For CH4, we examine the bias in tropospheric and stratospheric partial columns, whereas for N2O, the assessment primarily focuses on tropospheric columns. Boulder offers a unique opportunity with its extensive, multiyear coverage of AirCore, aircraft, and IRWG/NDACC profiles, which sample CH4 in close proximity, allowing for the integration of numerous observations into our analysis.
2.1 Ground-based FTIR
High-resolution (HR) direct solar infrared absorption spectra have been recorded at the National Science Foundation's National Center for Atmospheric Research (NSF NCAR) in Boulder (Colorado; 40.40° N, 105.24° W; 1600 m.a.s.l., meters above sea level) from 2010 to present. Measurements from 2010 to 2017 were undertaken utilizing a Bruker 120 HR-FTIR spectrometer; however, the instrument subsequently underwent an upgrade throughout a significant portion of 2018, incorporating the latest electronics and optics from the Bruker 125 HR-FTIR. Measurements are conducted under clear-sky conditions. The site officially became a part of the Infrared Working Group (IRWG) within NDACC in 2020, and the observations adhere to the standard measurement protocols established by the network. Optical band-pass filters are employed to optimize the signal-to-noise ratio (SNR) within the near- and mid-infrared spectral range. Hannigan et al. (2009) provide a list of typical band limits for each NDACC filter, along with the gases exhibiting absorption features and typically retrieved, covering a spectral range of 750–5000 cm−1. For CH4, NDACC filter 3 is used, while for N2O, both filters 3 and 4 can be used, although filter 3 is predominantly used. The nominal spectral resolution achieved is 0.004 cm−1 (maximum optical path difference (OPD) of ≈ 257 cm), utilizing liquid-nitrogen-cooled indium antimonide (InSb) and mercury cadmium telluride (MCT) detectors and a potassium bromide (KBr) beam splitter. For a detailed description of the FTIR operations at Boulder, see Ortega et al. (2019, 2021).
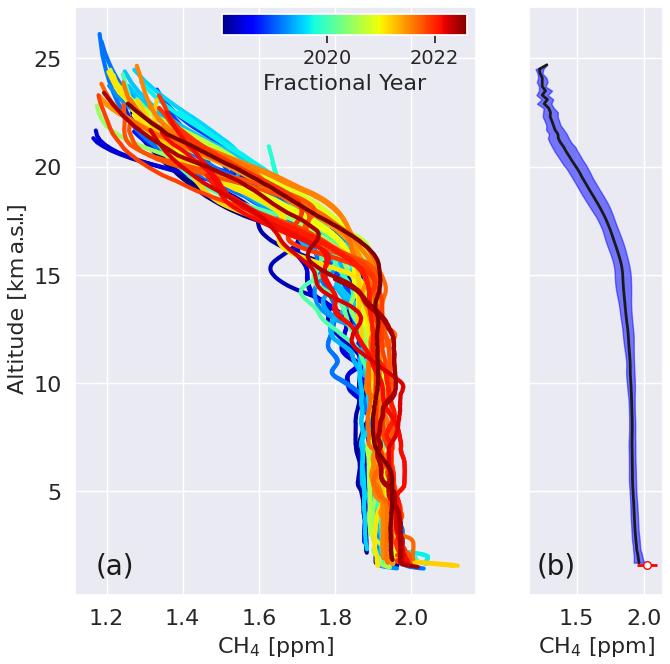
Figure 1(a) Individual AirCore CH4 profiles in Boulder, Colorado, with different colors indicating fractional years between 2018 and 2022. (b) Mean vertical profile of CH4 accompanied by the standard deviation, with the red circle at the bottom representing the mean volume mixing ratio from an in situ sensor near the HR-FTIR (see text for details). A total of 61 vertical profiles are included in these plots.
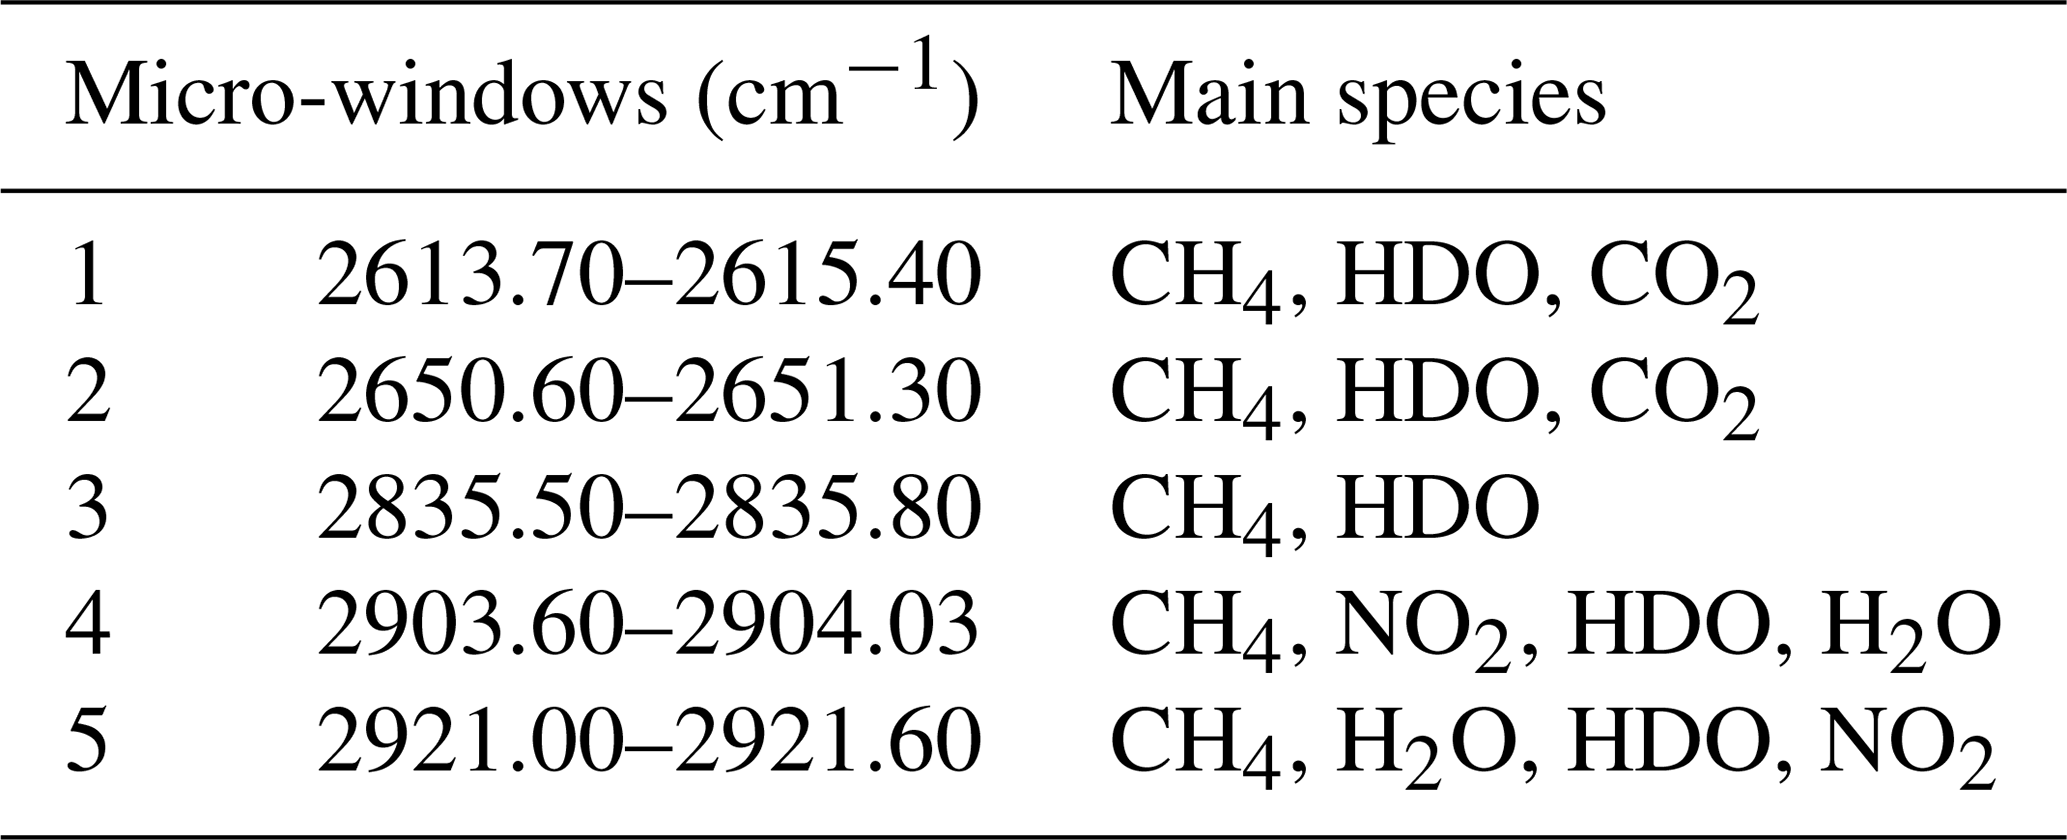
Table 1Summary of the five micro-windows tested in the retrieval of CH4.
The spectra undergo analysis using the SFIT4 algorithm, an advancement from SFIT2 (Pougatchev et al., 1995; Rinsland et al., 1998; Hase et al., 2004; Hannigan et al., 2024), to extract profiles of CH4 and N2O. Key input and common parameters for the retrieval of all gases using SFIT4 include vertical profiles of pressure, temperature, and volume mixing ratios (VMRs) of the atmospheric gases absorbing in the specific micro-windows. The input pressure and temperature vertical profiles are obtained from National Center for Environmental Prediction (NCEP) (Wild et al., 1995) and are standardized for use in all NDACC retrievals. These are daily average profiles extending up to approximately 50 km. Above that, we use monthly mean pressure and temperature profiles from simulations using the Whole Atmosphere Community Climate Model (WACCM) (Garcia et al., 2007). As an initial step (and to mitigate water vapor interference), the retrieval of water vapor is conducted first. Subsequently, this water vapor information is utilized in the retrieval process for CH4 and N2O to prevent potential bias arising from inaccuracies in the water vapor profile shape (Ortega et al., 2019). Section 3.1 and 3.2 describe the respective specific retrievals for CH4 and N2O in more detail.
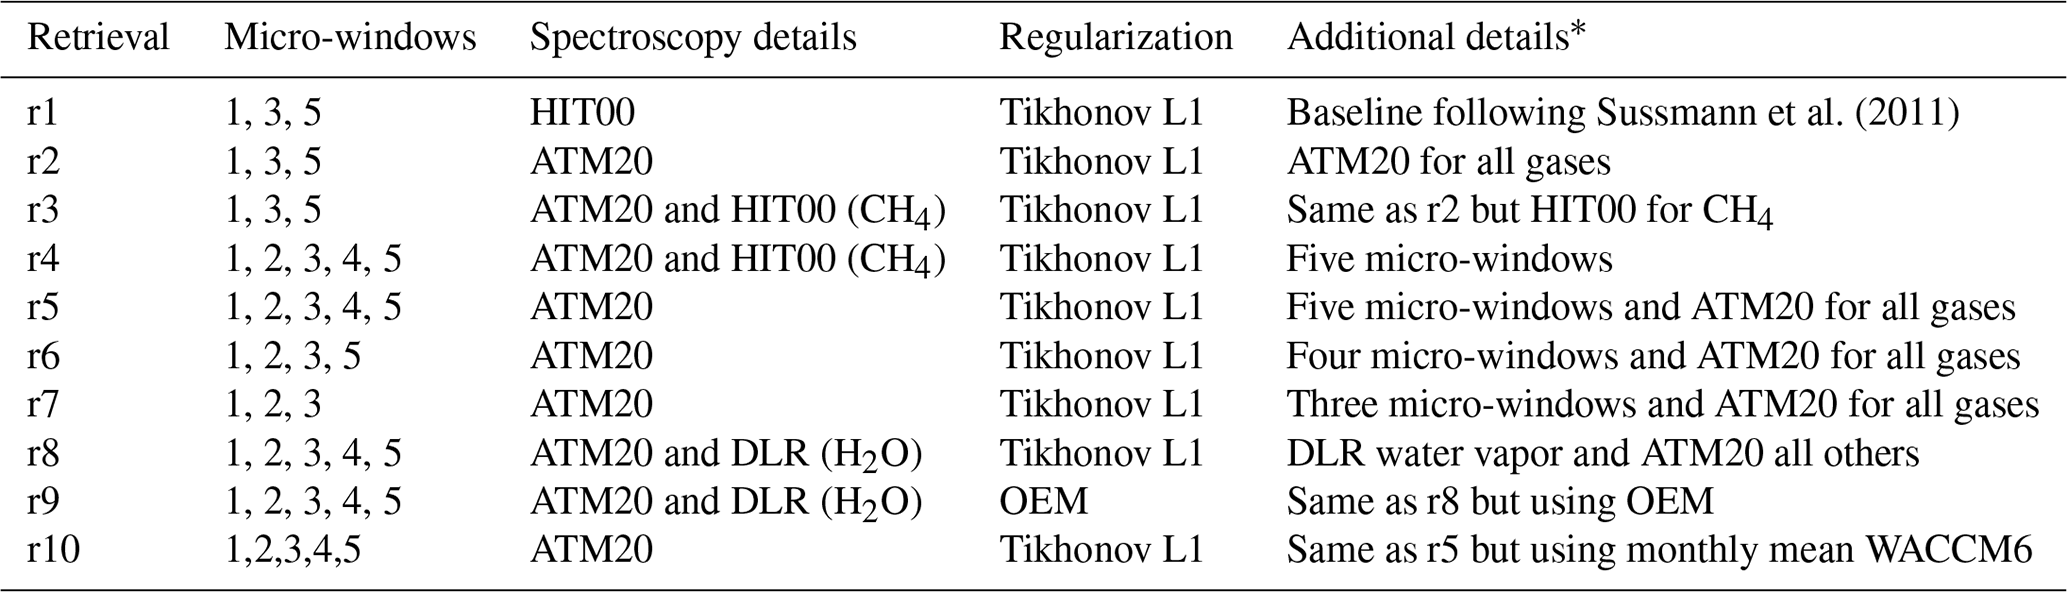
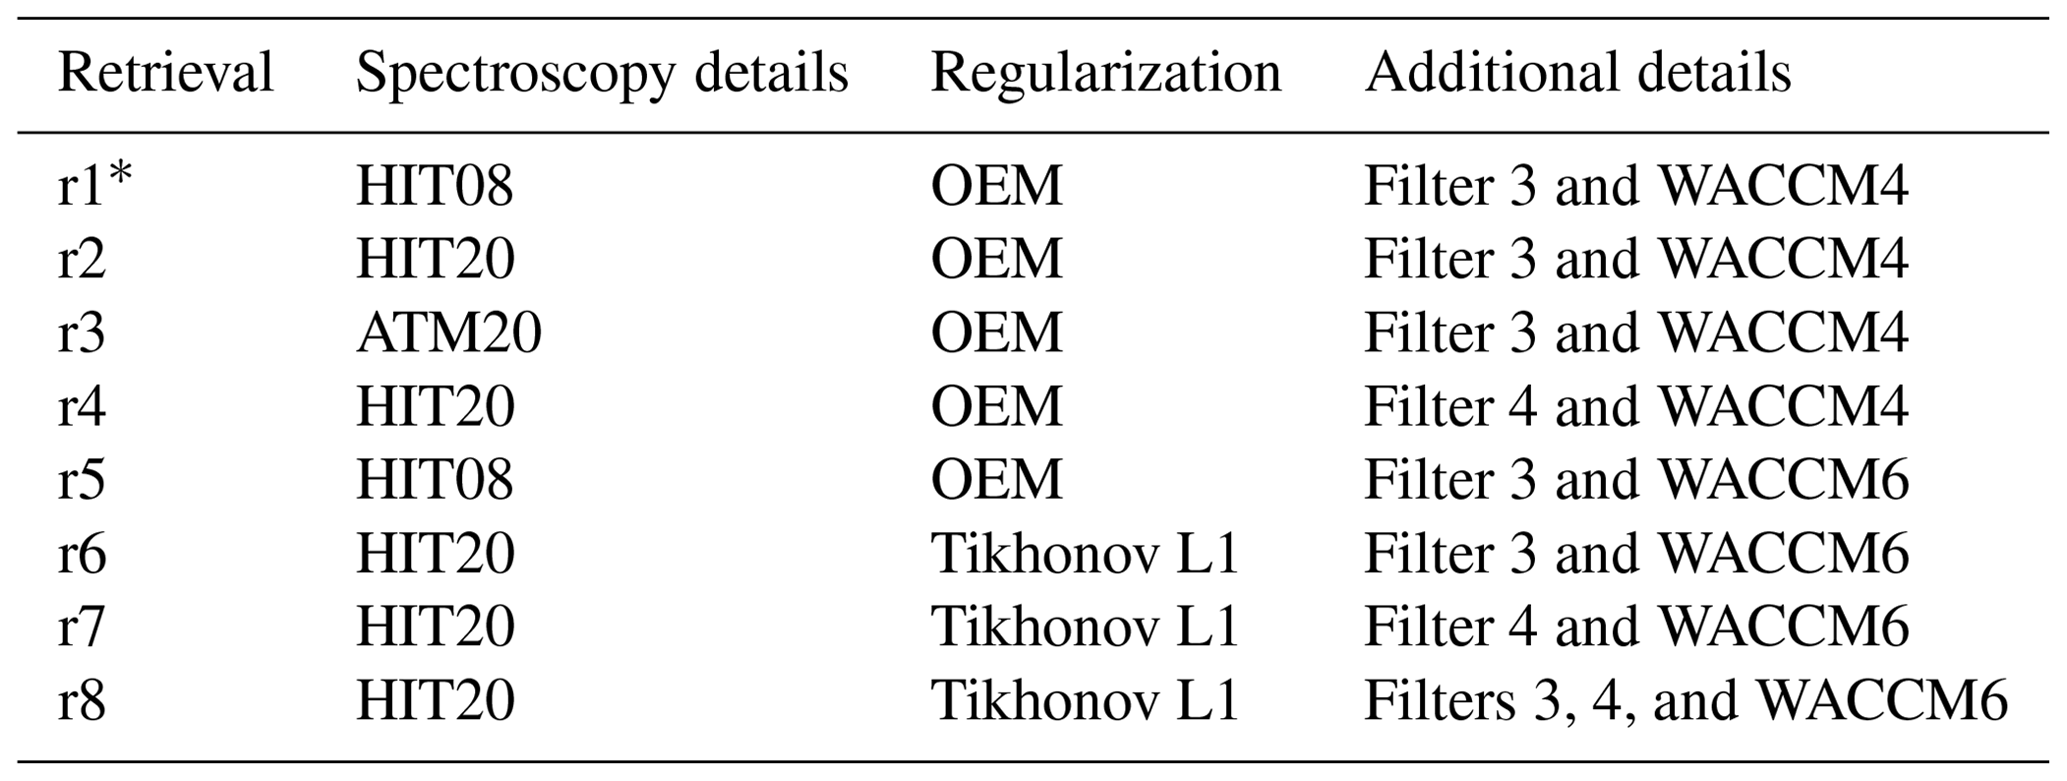
Sussmann et al. (2011)Table 2Different strategies tested in the retrieval of CH4.
* OEM denotes optimal estimation.
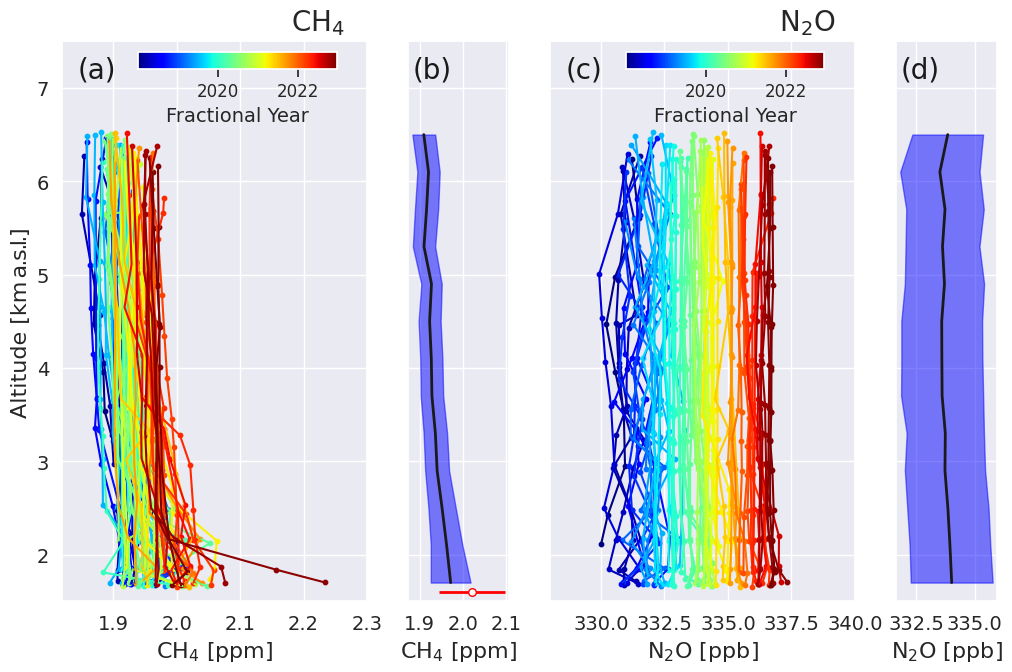
Figure 2(a) NOAA aircraft profiles of CH4 at Briggsdale, Colorado, with different colors indicating fractional years between 2018 and 2022. (b) The mean and standard deviation of CH4 profiles derived from the NOAA aircraft, along with the surface CH4 volume mixing ratio (VMR) from the Boulder reservoir, including the standard deviation. Panel (c) is the same as panel (a) but for N2O. Panel (d) is the same as panel (b) but for N2O. A total of 81 vertical profiles are included in these plots.
2.2 AirCore CH4 profiles
We employ CH4 AirCore data acquired from the National Oceanic and Atmospheric Administration (NOAA) Global Monitoring Laboratory (GML) to examine and assess the vertical distribution of CH4 in the troposphere and stratosphere. Regular monthly AirCore flights are initiated in Boulder, Colorado; many of these flights occur at approximately 13:00 LT (local time), to synchronize with the OCO-2/A-train satellite overpass, with air samples collected anywhere from 17 to 121 km near the FTIR site (measured from the descent point). The AirCore technique employed by NOAA involves collecting air samples within a stainless-steel tube (approx. 100 m in length and 1 cm in diameter). This tube passively collects atmospheric air during balloon descents from the middle stratosphere to the ground. Subsequently, the collected air is analyzed using a cavity ring-down spectrometer, ensuring a trace mole fraction precision of better than 0.4 ppb for CH4 (Karion et al., 2010). Because storage of the air sample in the tubing does not diffuse quickly between the balloon payload landing and analysis, approximately 100 discrete samples are measured in the AirCore tubing during a 4 h storage time, offering detailed insights into the vertical distribution of CH4, carbon monoxide (CO), and carbon dioxide (CO2). For our study, we leverage Level-2 CH4 from the current NOAA AirCore dataset v20230831, which includes dry-air mole fraction profiles retrieved since 2012 (Baier et al., 2021). Our investigation includes profiles collected from 2018 to 2022, enabling the evaluation of different retrieval strategies using a substantial set of coincident FTIR, AirCore, and aircraft observations.
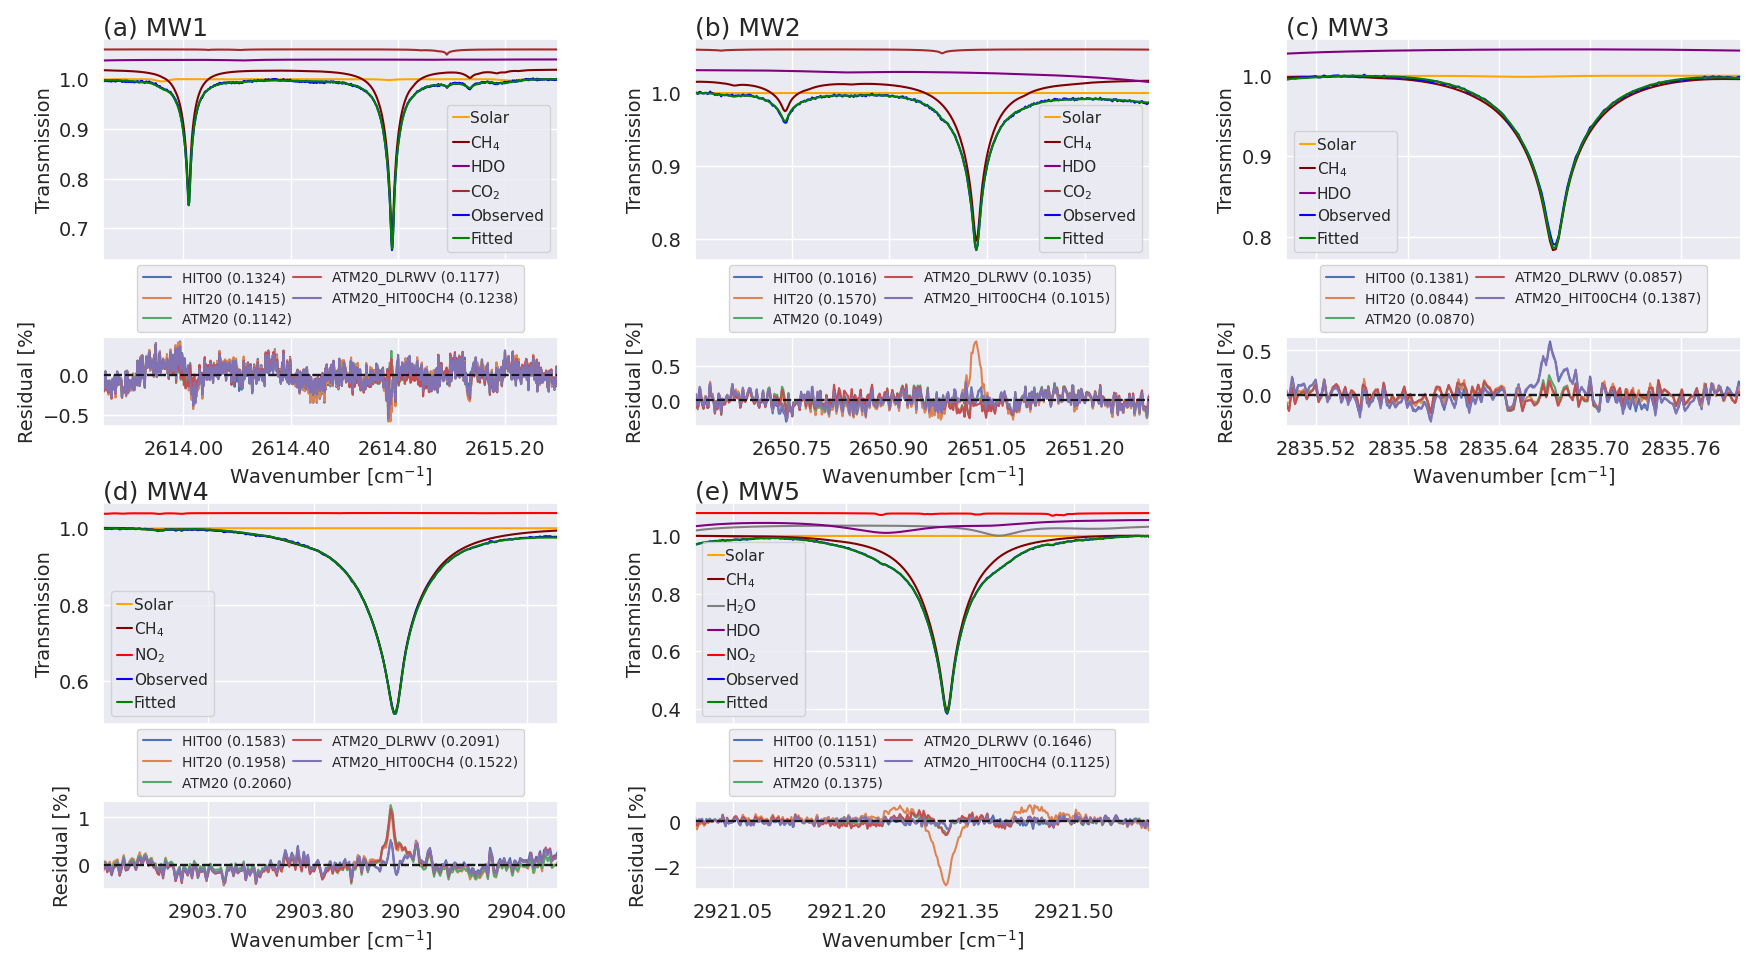
Figure 3Retrieval fit example of CH4 for 18 November 2019 with a solar zenith angle of 60.0°. Spectral contributions for various species are displayed above each micro-window, spanning from micro-window 1 (a) to micro-window 5 (e), employing Tikhonov regularization and WACCM6 as the a priori. The observed and fitted lines are represented using blue and green, respectively. The bottom plots show the residuals (observed minus fitted), with distinct colors indicating different spectroscopy types as labeled. The numbers within the labels denote the root-mean-square fitting for each micro-window across various spectroscopy databases.
Figure 1a shows individual CH4 AirCore profiles obtained in Boulder, Colorado, from 2018 to 2022. As expected, there is a noticeable rise in the CH4 mole fraction from 2018 onwards, reflecting the increase in the global background (https://gml.noaa.gov/ccgg/trends_ch4/, last access: 20 May 2025). These profiles exhibit distinct features, such as elevated near-ground values in certain instances, suggestive of local sources. Further, within the boundary layer and free troposphere, the profiles demonstrate well-mixed characteristics with some variations in the upper troposphere and the lowest stratosphere of the AirCore profiles, culminating in a sharp decrease at the tropopause. Figure 1b presents the mean vertical profiles from 2018 to 2022. To derive the mean profile, the individual profiles are regridded to common altitude scheme levels within a range from 1.6 to 25 km, and mean values are then estimated within a 0.2 km resolution. Ultimately, mean and standard deviation profiles are calculated. The shaded blue area in Fig. 1b represents the standard deviation in the AirCore profile dataset used here, while the red circle at the bottom represents the mean values from an in situ sensor located at the Boulder reservoir about 5 km from the HR-FTIR using the overlap period between 2020 to 2022 (https://www.bouldair.com/boulder.htm, last access: 20 May 2025), providing insight into the variability around the Boulder region.
Table 3Summary of the four micro-windows used in the retrieval of N2O.
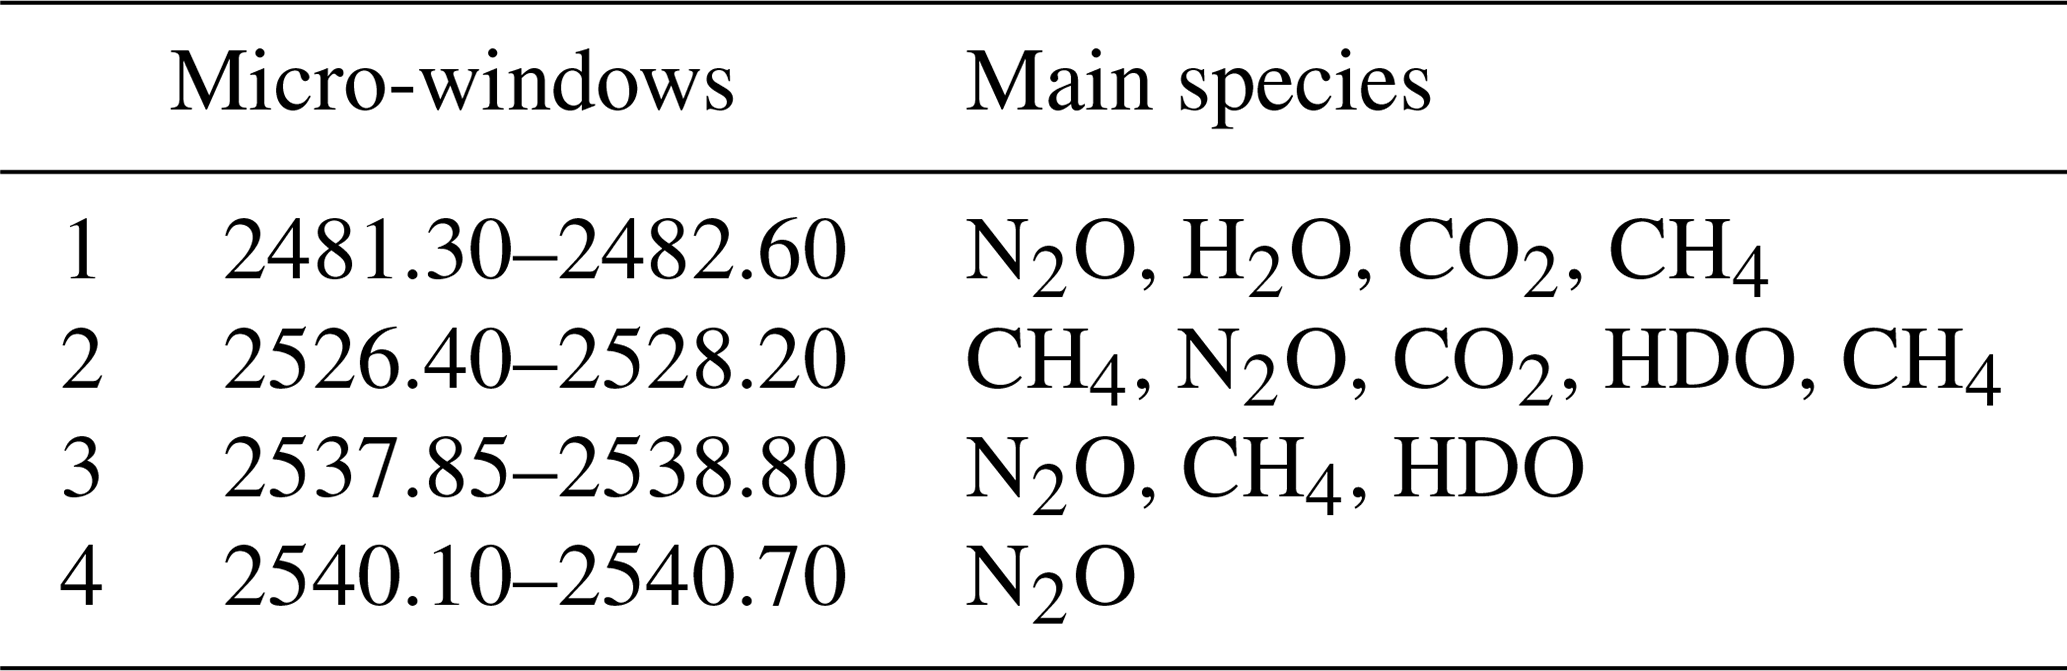
Table 4Different strategies tested in the retrieval of N2O.
* Current retrieval strategy as suggested by the IRWG.
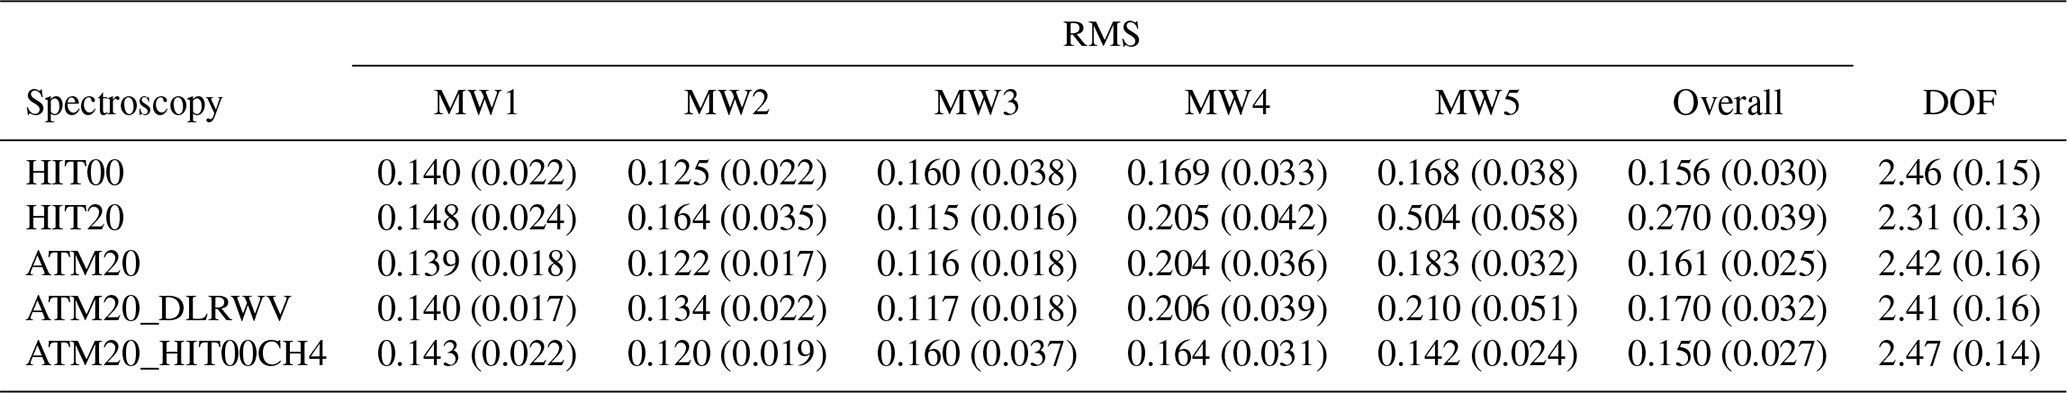
Table 5Overview of the mean root-mean-square (RMS) values across all five micro-windows (MWs) and the overall RMS for the CH4 retrieval using various spectroscopy databases for 2021. The last column displays the degrees of freedom (DOF) values. Values in parentheses are the standard deviation.
2.3 Aircraft-based observations of CH4 and N2O profiles
To further evaluate CH4 and N2O retrievals, we use the vertical profiles obtained at a remote location near Briggsdale (40.6347° N, 104.3269° W), Colorado, approximately 100 km northeast of the HR-FTIR, as part of the NOAA Earth System Research Laboratories (ESRL) Global Greenhouse Gas Reference Network Aircraft Program (Sweeney et al., 2015; McKain et al., 2023) (https://gml.noaa.gov/ccgg/aircraft/, last access: 20 May 2025). This program employs contracted aircraft equipped with instruments to collect 12 discrete air samples in vertical profiles, primarily over North America, and monitor over 50 trace gases throughout the boundary layer and free troposphere over the long term. The network provides crucial insights into the sources, sinks, and transport mechanisms of greenhouse and other trace gases. Additionally, these profiles are a resource for the model evaluation of vertical mixing and independently constrain the mean biospheric uptake of CO2 throughout the annual cycle. The routine data collection within the program further facilitates the evaluation of satellite retrievals, which is often complemented by ground-based remote-sensing observations. Figure 2 illustrates the CH4 and N2O aircraft profiles acquired at Briggsdale, Colorado, spanning from 2018 to 2022. In line with CH4 AirCore profiles, there is minimal variation observed in the profiles up to 6 km, with occasional enhancements near the ground on certain days. In the case of N2O, there is a clear increase from 2018 onwards, also consistent with the increase in the global background (https://gml.noaa.gov/ccgg/trends_n2o/, last access: 20 May 2025). The N2O profiles exhibit a well-mixed pattern, with no notable enhancements near the ground. Similar to Fig. 1, the mean profiles are presented on the right side for each gas, depicting mainly the increase in the global background. However, the mean profile is displayed within the altitude range of 1.6 to 7 km a.s.l., with a resolution of 0.4 km due to the original vertical resolution being lower than that of the AirCore.
3.1 CH4
Multiple retrieval strategies have been devised, encompassing various combinations of micro-windows, spectroscopy, and regularization techniques. The fitting results are employed to assess different spectroscopy databases, and all retrieval strategies are compared with AirCore and aircraft observations to determine the most effective approach.
An optimized selection of micro-windows (MWs) in the mid-infrared has been carried out by Sussmann et al. (2011), and a summary of these retrieval strategies is provided in Table 2. In alignment with Sussmann et al. (2011), we employed the same five potential micro-windows for our analysis, as detailed in Table 1.
The molecular absorption databases employed in this study include the latest official release of HITRAN 2020 (HIT20; Gordon et al., 2022); the ATM 2020 (ATM20) spectroscopic database used by TCCON (Toon, 2015; Toon et al., 2016), which is available at https://mark4sun.jpl.nasa.gov/toon/linelist/linelist.html (last access: 22 December 2023); and HITRAN 2000 (HIT00; including the 2001 updates), as recommended by Sussmann et al. (2011). In their study, Sussmann et al. (2011) also tested HITRAN 2008, which was the most recent database at the time, and found significant residuals with HITRAN 2008, whereas HIT00 showed much lower residuals. More recently, Chesnokova et al. (2020) examined the impact of different databases and similarly concluded that HIT00 provides superior fitting results, with the exception of ATM (ATM19 at the time). Additionally, we utilized combinations of these databases with others for specific purposes. For instance, water vapor spectroscopy is based on the line list provided by the German Aerospace Center (DLR) (Zhou et al., 2018), while ATM20 is used in conjunction with the HIT00 line list for CH4. Section 4.1 provides a more detailed overview of the various spectroscopy databases and their corresponding results.
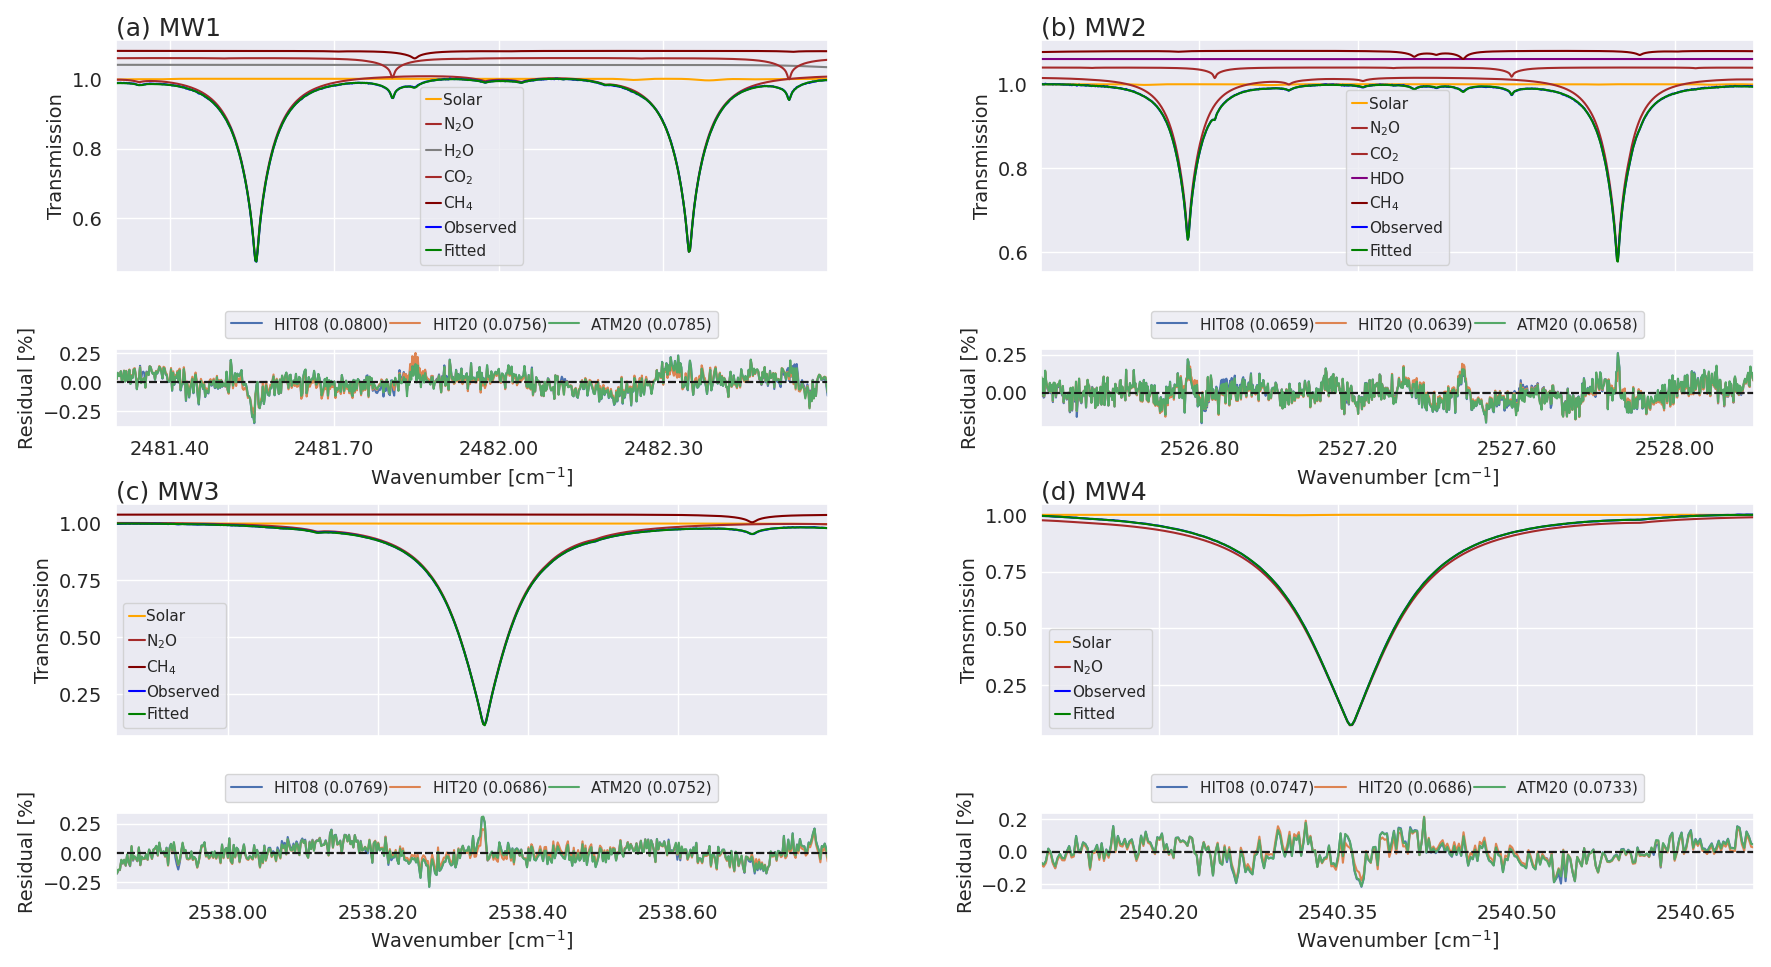
Figure 4Retrieval fit example of N2O on 31 January 2019 with a solar zenith angle of 63.8°. Spectral contributions for various species are displayed above each micro-window, spanning from micro-window 1 (a) to micro-window 4 (d), employing Tikhonov regularization, WACCM6 as the a priori, and filter 4. The observed and fitted lines are represented using blue and green, respectively. The bottom plots show the residuals (observed minus fitted), with distinct colors indicating different spectroscopy types as labeled. The numbers within the labels denote the root-mean-square fitting for each micro-window across various spectroscopy databases.
For the current IRWG gas retrievals, mean a priori profiles were primarily obtained using WACCM version 4 for the 1980–2020 period (referred to as WACCM4). WACCM simulations underwent enhancements in physical, chemical, and aerosol parameterizations (Gettelman et al., 2019), resulting in version 6 (WACCM6), and new mean a priori profiles have been created spanning the 1980–2040 period (https://wiki.ucar.edu/pages/viewpage.action?pageId=452264118, last access: 20 May 2025). Comparing CH4 between these two WACCM versions at different sites (e.g., Mauna Loa, Hawaii; Thule, Greenland) with independent profiles obtained during the airborne Pole-to-Pole Observations (HIPPO; https://www.eol.ucar.edu/field_projects/hippo, last access: 20 May 2025; Wofsy, 2011) campaign and the Atmospheric Tomography Mission (ATom; https://daac.ornl.gov/ATOM/campaign/, last access: 20 May 2025; Thompson et al., 2022) field campaigns indicates that the latest version-6 profiles are more suitable for recent years (not shown). To streamline the retrieval process, all retrievals utilized the most recent version of the WACCM profiles. For regularization, the process of adding constraints or penalties to the optimization problem to ensure a more stable and reliable solution, we employed both the first-order Tikhonov regularization, following the recommendation of Sussmann et al. (2011), and the conventional optimal estimation (OEM) approach. In Tikhonov regularization, the regularization strength (α) is optimized to maintain the degrees of freedom (DOF) value at approximately 2, with potential variations depending on conditions. Optimization is achieved through the typical L-curve method, as proposed by Steck (2002). The Tikhonov regularization procedure is directly implemented in the latest version of SFIT4, accessible at https://wiki.ucar.edu/display/sfit4/SFIT+Core+Code (last access: 22 December 2023). For the OEM approach, regularization involved diagonal a priori covariance matrices. Variance magnitudes were empirically tuned to prevent profile oscillations and, similarly, to achieve a target DOF of around 2. The OEM technique has the advantage that the retrieved vertical profile relaxes back to the a priori profile shape, as spectral information diminishes with altitude. In contrast, the Tikhonov constraint tends to preserve the deviation from the a priori at higher altitudes where spectral information is still present. Additional details on the retrieval workflow in Boulder are provided in Ortega et al. (2021).
Table 6Summary of the RMS values for N2O retrieval in 2021, encompassing all five micro-windows (MWs) and the overall RMS. The last column presents the DOF values. Values in parentheses are the standard deviation.
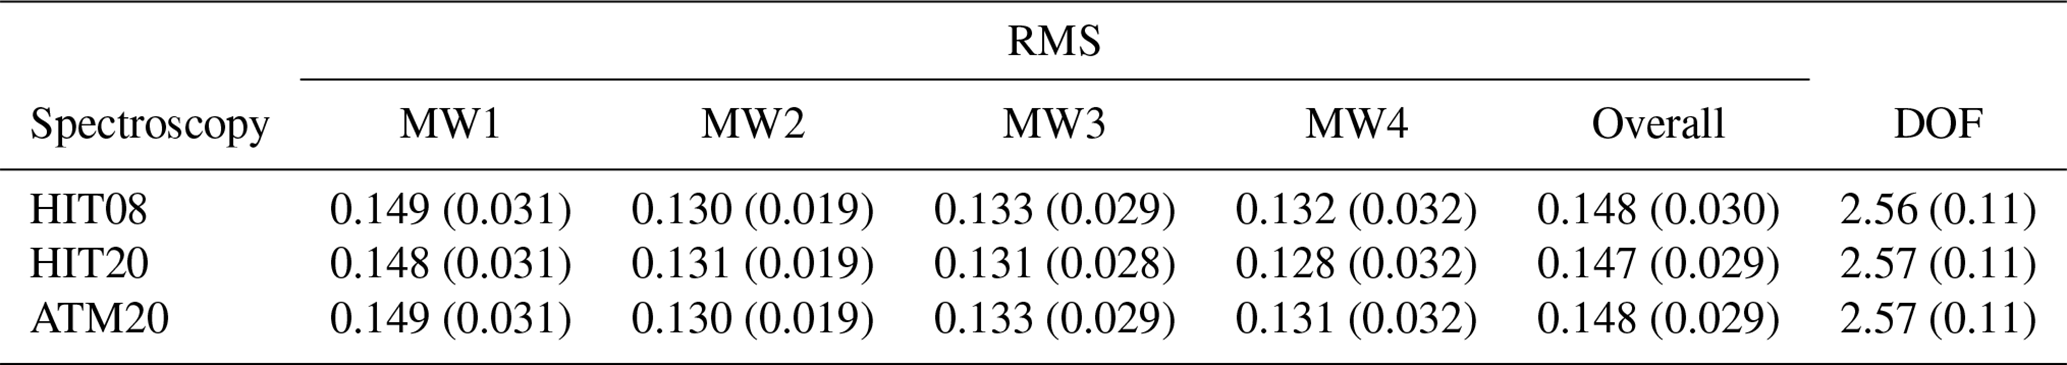
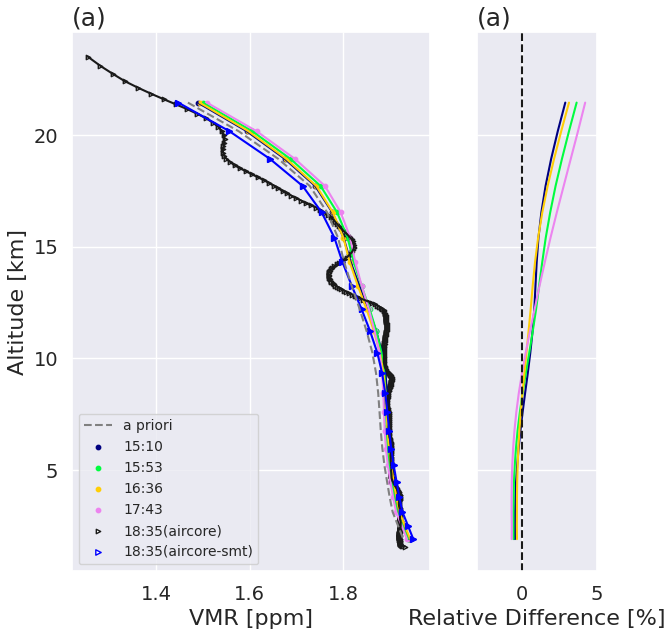
Figure 5(a) Illustrative comparison between FTIR and AirCore CH4 profiles on 14 May 2019, utilizing ATM20, WACCM6, and Tikhonov regularization (retrieval r5 in Table 2). Various colors denote different HR-FTIR retrieval times (UT), with the high-resolution AirCore profile presented in black and the smoothed profile in blue. (b) The relative difference (FTIR minus AirCore) for each corresponding time.
We establish a baseline retrieval strategy (r1) by employing three micro-windows (1, 3, and 5), along with the first-order Tikhonov regularization approach, and the HIT00 spectroscopy database (Sussmann et al., 2011). A total of 10 retrieval strategies have been developed to explore various approaches and determine whether different methods impact the results when compared with AirCore and aircraft profiles. As shown in Sect. 4.1, HIT20 was excluded due to its significantly higher residuals in the fitting results. Detailed information on each retrieval strategy is provided in Table 2.
3.2 N2O
The N2O retrievals suggested by the IRWG involve the use of four micro-windows within the 2480–2540 cm−1 spectral range. The specific micro-windows and associated interfering species are detailed in Table 3. Our focus is not directed towards the identification or refinement of micro-windows, as they are well-harmonized across the network, yielding satisfactory results; instead, our objective is to assess the performance of the latest spectroscopy line parameters. Similarly, the spectroscopy evaluation includes testing HITRAN 2008 (HIT08) (the current official IRWG recommendation), HIT20, and ATM20. Within the retrieval strategies outlined in Table 4, we incorporate both the Tikhonov L1 and OEM approaches, as the regularization approach is not uniformly harmonized (Zhou et al., 2019). Additionally, two optical band-pass filters, denoted as filters 3 and 4 within the IRWG, are available for utilization in the N2O retrieval process. In this case, we conducted separate N2O retrievals using each filter independently, as well as a retrieval approach in which both filters were used independently, but the results were combined without distinguishing between filters. In this instance, we incorporate retrieval strategies utilizing both WACCM4 and v6, as there is a comparatively lower number of sensitivity studies compared to CH4.
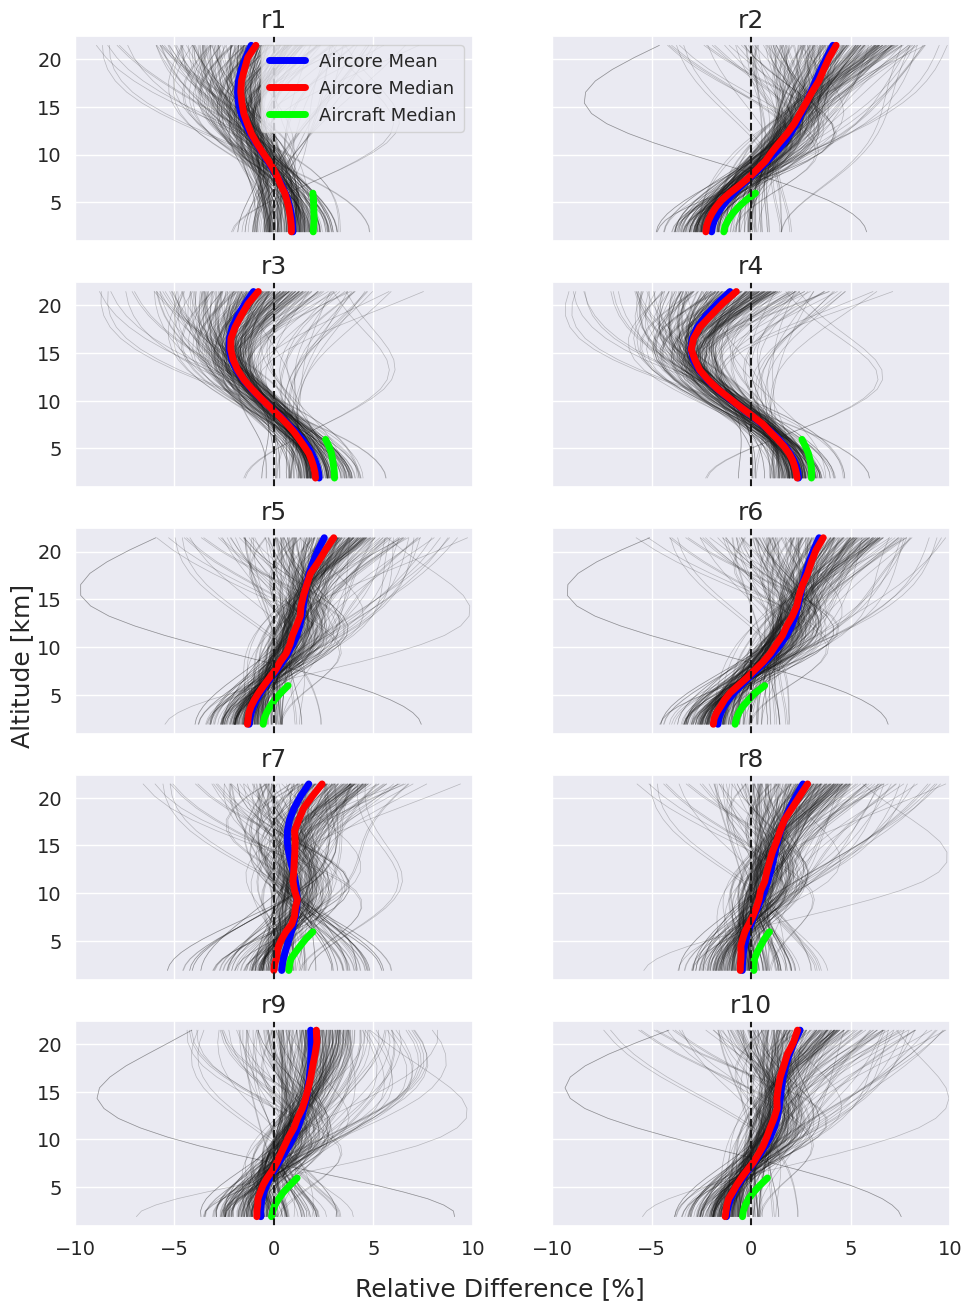
Figure 6Relative differences in CH4 profiles, calculated as the difference between FTIR and AirCore values divided by the AirCore values, employing diverse retrieval strategies. The mean and median profiles are shown using blue and red lines, respectively. The green lines illustrate the relative differences obtained in the lower troposphere using aircraft comparisons, as shown in Fig. 7.
4.1 Intercomparison among spectroscopy databases
This section addresses the quality of fits resulting from various spectroscopy databases. Specifically, we compare five databases for CH4: (1) HIT00, (2) HIT20, (3) ATM20, (4) ATM20 with DLR water vapor (ATM20_DLRWV), and (5) ATM20 with HIT00 for CH4 (ATM20_HIT00CH4). To maintain the focus on spectroscopy, all five retrievals follow the same procedure, employing Tikhonov regularization and WACCM6 as the a priori, with the only variation being the choice of spectroscopy. Figure 3 visually shows the spectral contributions of various species during the CH4 retrieval across the five micro-windows. As an example, the top panel displays these contributions for each micro-window on 18 November 2019 at a solar zenith angle of 60.0°. The observed and fitted lines, presented in blue and green, respectively, provide insights into the quality of the retrieval. In the corresponding bottom plots, the residuals (observed minus fitted) are presented, with distinct colors indicating the different spectroscopy databases. There are clear differences for some micro-windows. For instance, HIT20 exhibits substantial systematic residuals for micro-windows 2 and 5. The large residual at 2921.33 cm−1 in HIT20 for micro-window 5, previously identified by Sussmann et al. (2011) for HIT08, suggests that HIT20 still needs to be improved for this line strength. To further identify differences, the numbers within the labels provide the root-mean-square fitting for each micro-window across diverse spectroscopy databases. Micro-window 1 stands out as the only one for which all databases perform similarly, while others exhibit variations. Nonetheless, ATM20 demonstrates slightly better results within micro-window 1. Apart from HIT20, which displays high residuals in micro-window 2, all other databases show similar residuals. In micro-window 3, ATM20, ATM20_DLRWV, and HIT20 produce improved results, whereas in micro-window 4, lower residuals are observed with ATM20_HIT00CH4, HIT20_HIT00CH4, and HIT00, indicating that HIT00 remains the preferred choice for this micro-window. As previously noted, HIT20 continues to show large residuals in micro-window 5, whereas HIT00 still provides better residuals. A summary of root-mean-square values (RMS) for all micro-windows for a full year (2021) of retrievals is provided in Table 5. Overall, HIT20 displays larger RMS values, suggesting it may not be an optimal choice, while all other spectroscopy databases show similar RMS values within the standard deviation. These findings align with Chesnokova et al. (2020), who found that HIT00 yields better RMS values but is similar to ATM20. However, there are notable differences in the profile shapes and magnitudes (see Sect. 4.2), highlighting the importance of the assessment conducted with independent observations.
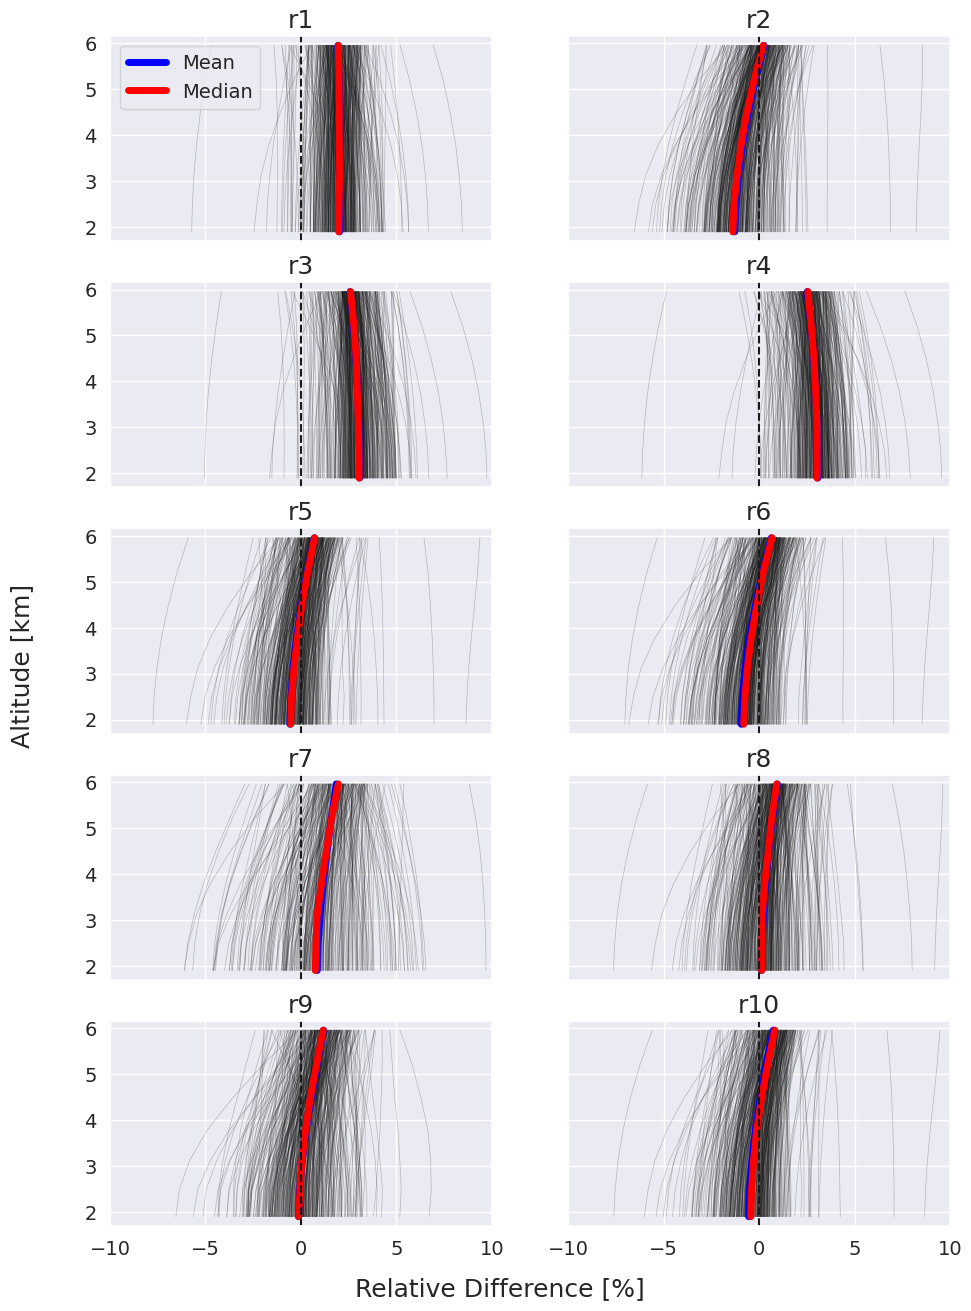
Figure 7Relative difference between FTIR and NOAA aircraft CH4 profiles using several retrieval strategies.
For N2O, we compare the HIT08, HIT20, and ATM20 databases. Our objective is to assess whether HIT20 or ATM20 exhibits better residual quality than HIT08, currently employed in the IRWG/NDACC strategy. Figure 4 illustrates the spectral contributions of various species during the N2O retrieval across four micro-windows. Similar to CH4, the top panels showcase an example, specifically on 31 January 2019, at a zenith angle of 63.8°. The bottom residual plots do not reveal a significant difference among the three databases. While the RMS suggests a slight improvement with HIT20, an overview table (Table 6) presenting results for the entire year (2021) indicates no significant improvement. Nonetheless, this suggests that either HIT20 or ATM20 could be considered in the IRWG recommendation.
4.2 Intercomparison with AirCore and aircraft profiles
Between 2018 and 2022, a total of 61 AirCore sampling systems were launched in Boulder, 36 of which were coincident with FTIR measurements. The total number of coincident dates between FTIR and aircraft profiles is 51. To enable a quantitative comparison of in situ profiles and partial columns, vertical profile measurements from AirCore and aircraft are regridded onto the FTIR retrieval's altitude grid using first-order spline interpolation. Subsequently, these profiles are smoothed with the daily mean FTIR averaging kernels to account for the FTIR altitude sensitivity (Rodgers and Connor, 2003). Figure 5a presents an illustrative comparison between FTIR profiles obtained on a given day and an AirCore profile. The high-vertical-resolution AirCore profile is depicted using black triangles, while the smoothed AirCore profile is shown using blue triangles. FTIR retrievals from the same day are represented by circles in various colors. In Fig. 5b, the relative difference in percentage (or bias), defined as the difference between FTIR and AirCore values divided by the AirCore values, is shown for each corresponding time. To maximize the number of profile comparisons (and considering the relatively stable nature of CH4 and N2O), we compare FTIR profiles obtained within a 6 h time window of the AirCore descent time. The mean distance between the AirCore descent location and the FTIR site is 76.8 ± 26.5 km, while the mean distance between the FTIR site and the AirCore landing point is 101.1 ± 28.5 km. The same approach is undertaken when comparing with aircraft observations but the aircraft profiles generally extend up to around 6 km a.s.l., whereas the AirCore profiles extend up to 20 km or higher. As mentioned in Sect. 2.3, aircraft observations are conducted approximately 100 km northeast of the FTIR site.
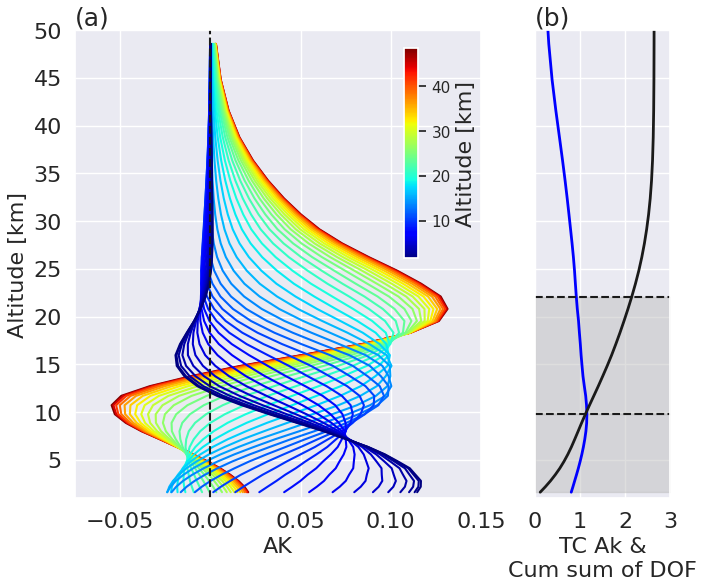
Figure 8(a) Averaging kernel for CH4, representative of 18 November 2019, at a solar zenith angle of 60.0°. Panel (b) shows the total column averaging kernel in blue and the cumulative sum of the degrees of freedom (DOF) values in black. The shaded rectangles indicate the cumulative sum of the DOF values. The first DOF spans from 1.6 to 9.8 km, whereas the second DOF ranges from 9.8 to 22.1 km. This example employs five micro-windows, Tikhonov regularization, and WACCM6 as the a priori.
4.2.1 CH4
Figure 6 shows the relative differences in the CH4 vertical profiles obtained for each retrieval strategy when compared with AirCore profiles. The subpanel names correspond to the retrievals listed in Table 2. The individual profile relative differences are displayed in gray, while the mean and median profiles are depicted using red and blue, respectively. To highlight the similarity between AirCore and aircraft profile results, the median relative differences in the troposphere from aircraft profiles are displayed in green in the same figure. The relative differences with aircraft profiles in the troposphere (up to 6 km) are further detailed in Fig. 7. Despite the absence of coincidence between AirCore and aircraft profiles, the relative differences exhibit remarkable similarity with respect to both magnitude and shape, enhancing confidence in the assessment of multiple retrievals. It is interesting to observe that changing only the CH4 database spectroscopy leads to a substantial change in the magnitude of profile differences. For example, retrievals r1 and r2 show opposite signs in their relative differences within both the troposphere and stratosphere, despite having identical retrieval parameters, apart from the spectroscopy. The key distinction between retrievals r1 and r2 is that r1 employs HIT00, whereas r2 relies on ATM20. Interestingly, using a combination of ATM20 and HIT00 for CH4 yields profile differences that are very similar to those obtained using only HIT00, suggesting that the line parameters for CH4 primarily dictate the profile shape. The inclusion of three or five micro-windows does not change the shape of the profile difference; however, r5, which uses five micro-windows, shows smaller relative differences in both the troposphere and stratosphere compared to r2, which uses the same settings but with only three micro-windows. Retrieval strategies showing favorable bias outcomes are encompassed in r7 to r10. Strategy r7 utilizes micro-windows 1, 2, and 3, while r8 employs all five micro-windows, deviating from the micro-windows 1, 3, and 5 recommended by Sussmann et al. (2011). We observe slightly higher variability in r7, whereas r8 and r9 exhibit more compact variability, particularly in the troposphere. Retrieval r8 is identical to r9, except that r9 uses the OEM approach. Additionally, using monthly mean CH4 a priori profiles does not significantly improve biases, as seen when comparing r10 to r5. It is important to note that past studies have predominantly focused on total column analysis. In such cases, retrieval strategies might produce biases in the troposphere and stratosphere with opposite signs, potentially canceling each other out and reducing the overall bias in total column measurements. In contrast, this work focuses on examining the differences at various altitudes within the vertical profiles, which, due to vertical sensitivity, ultimately lead to distinct biases in tropospheric and stratospheric columns, as well as in total column measurements.
Table 7CH4 bias results among the different retrieval strategies for the different partial columns using AirCore profiles as the reference. The results in bold indicate the best performance.
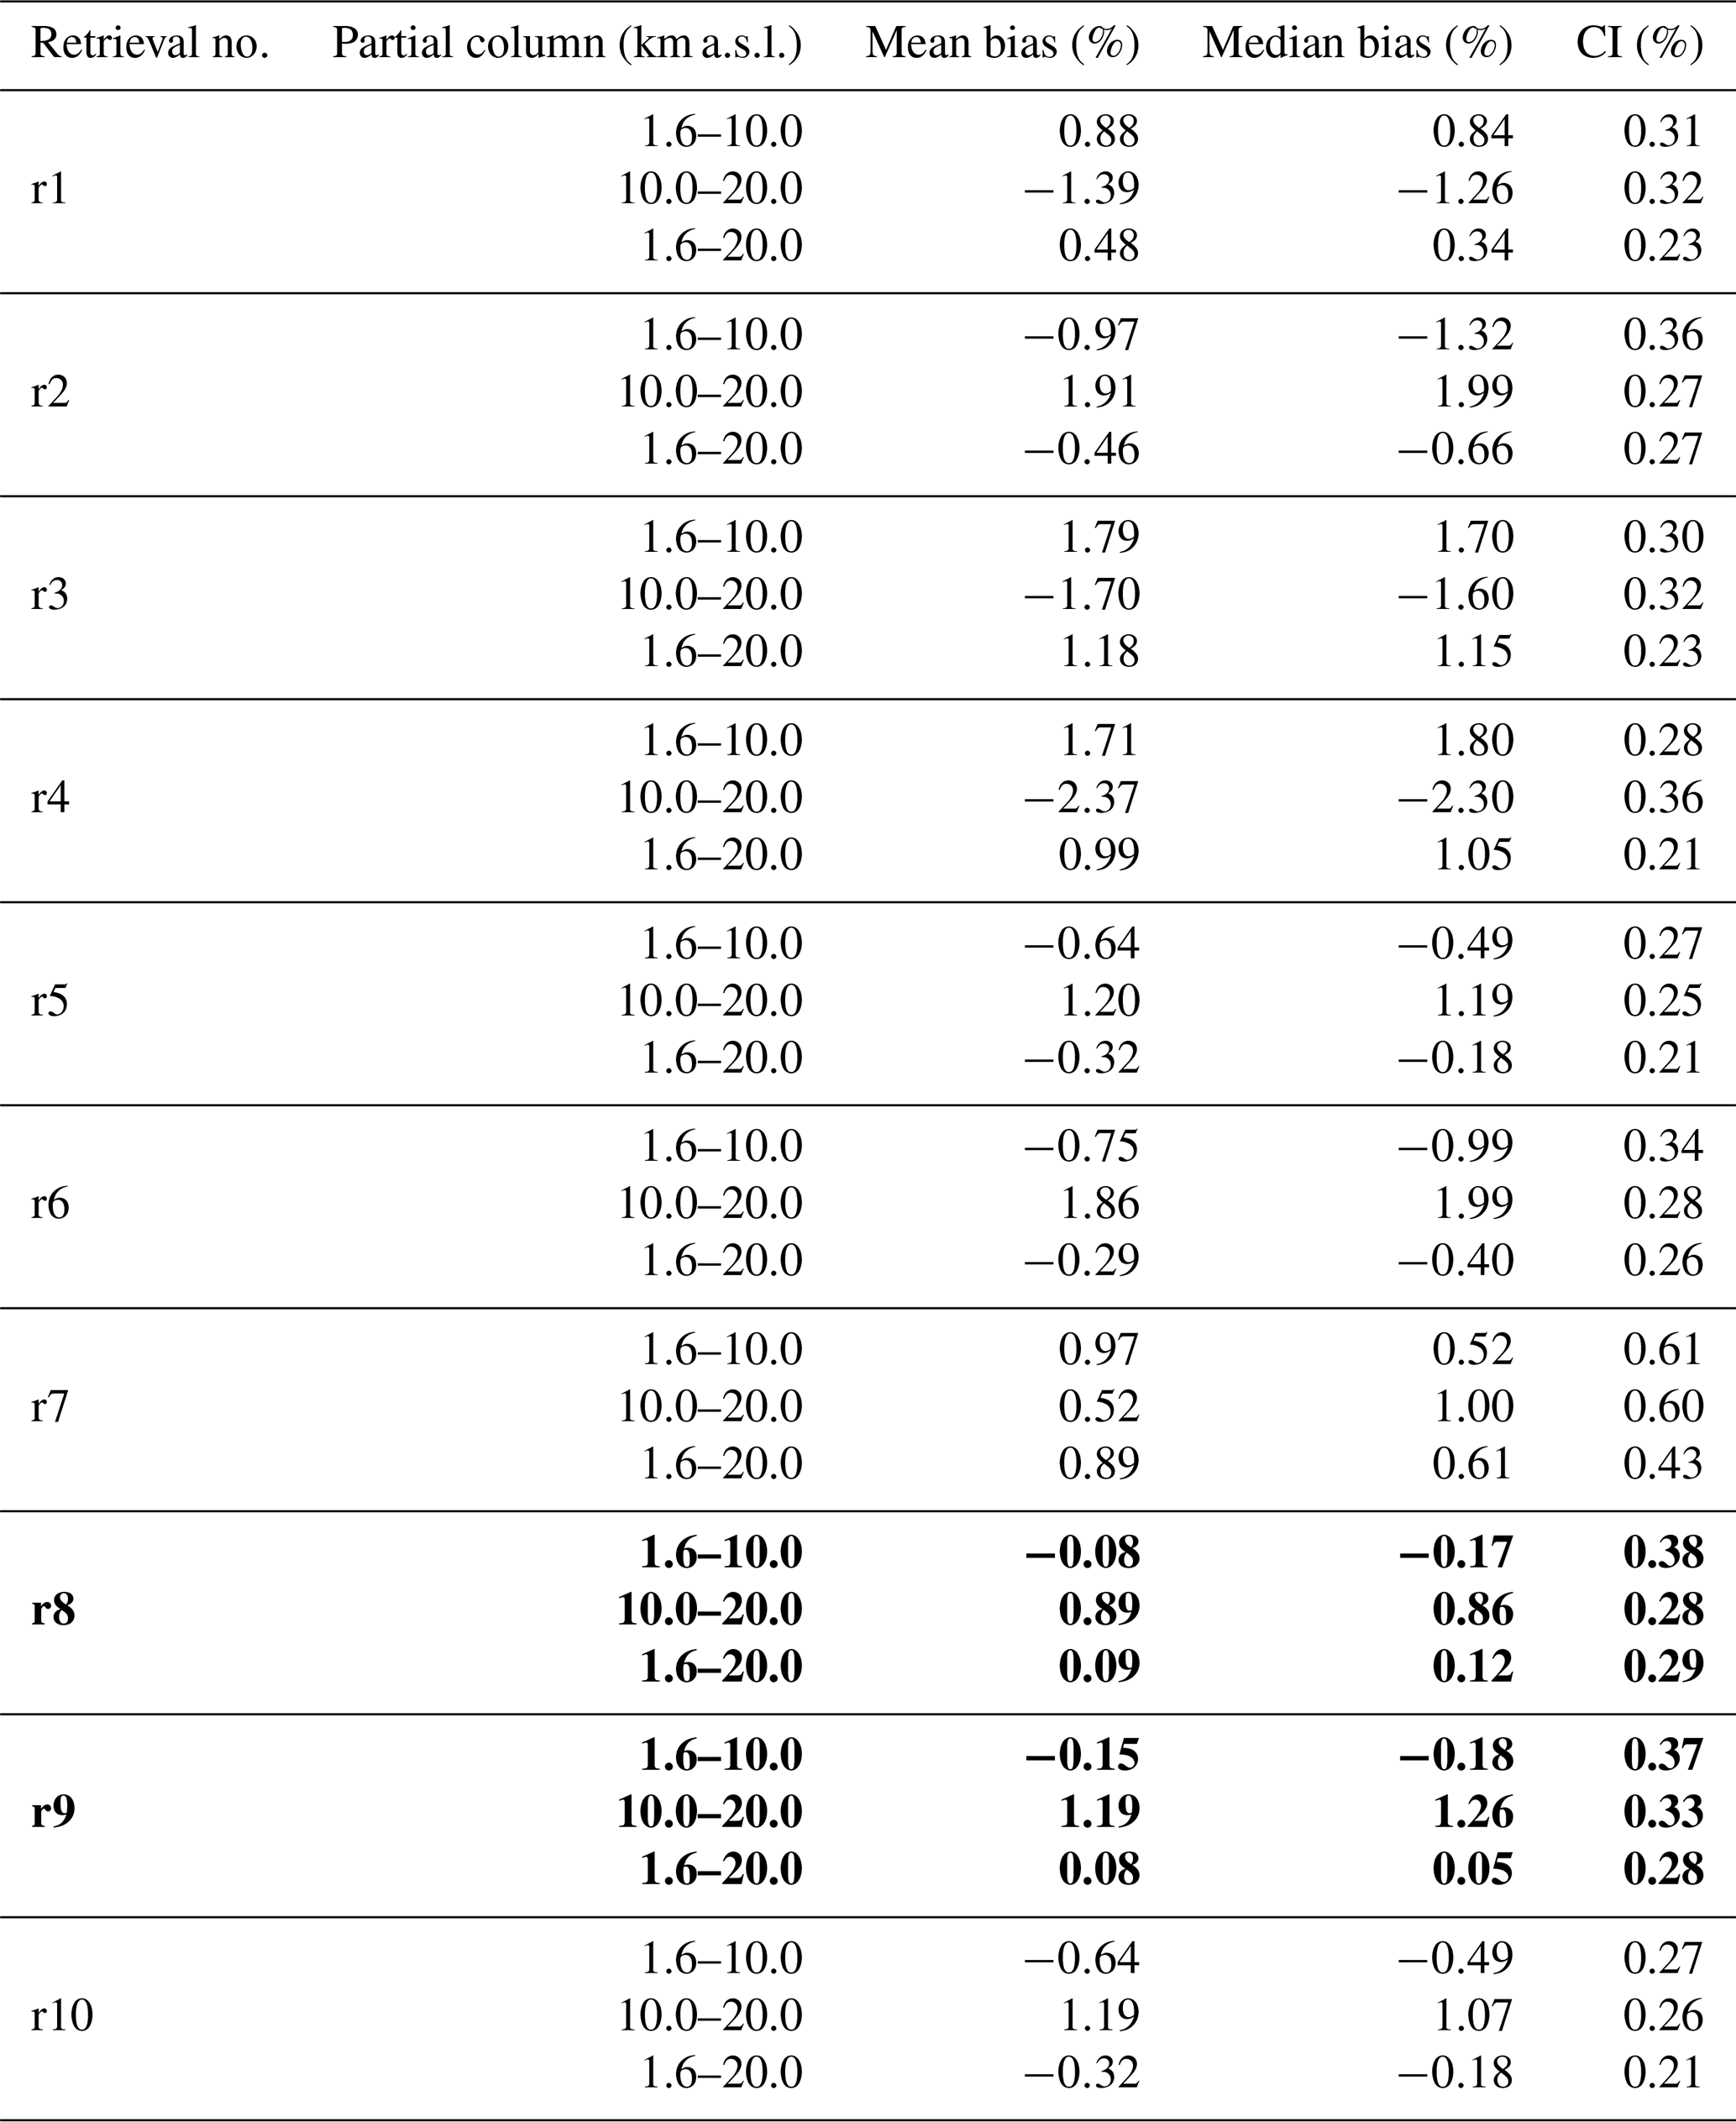
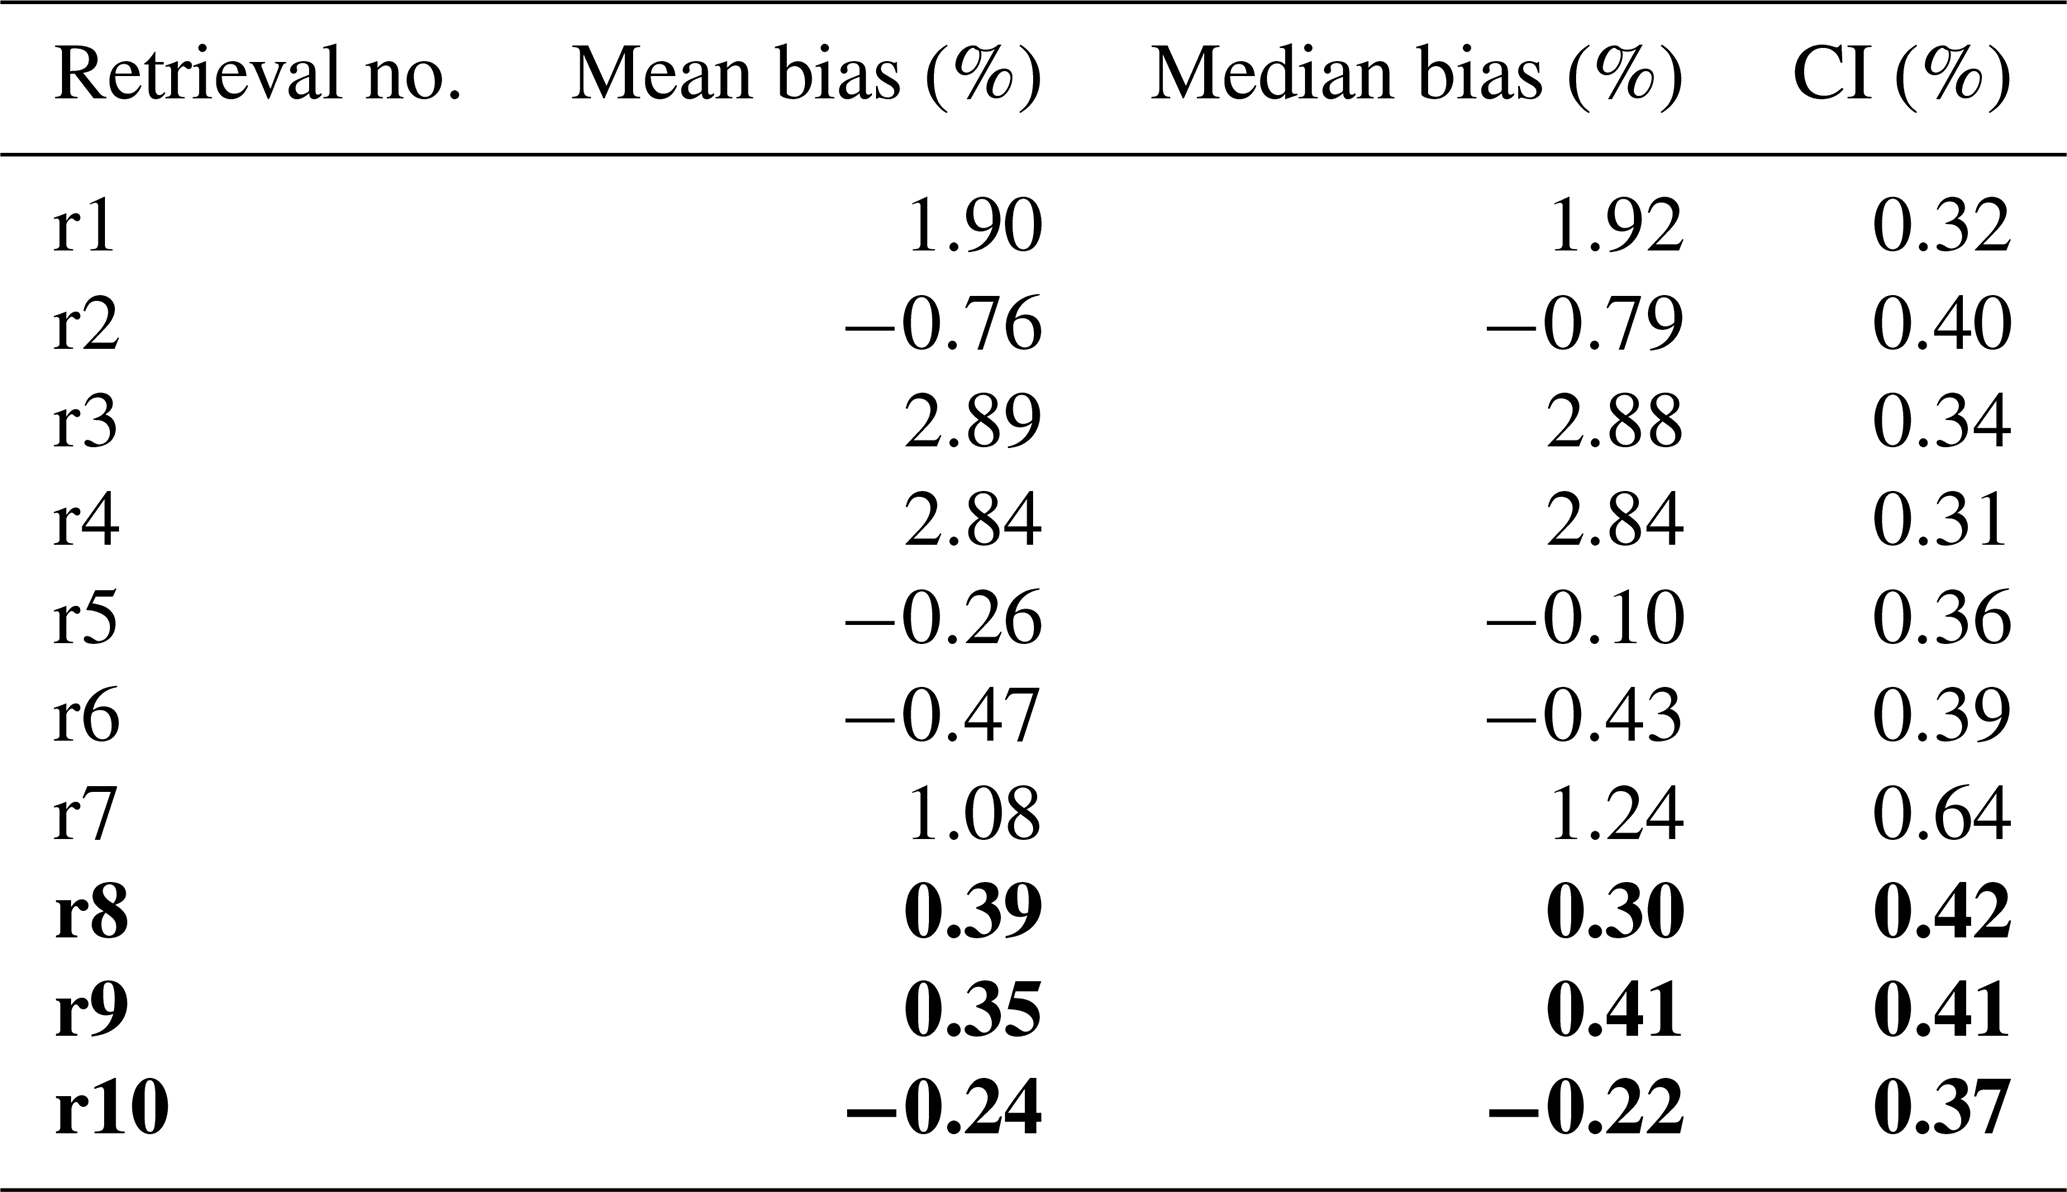
The retrieval methodology implemented in SFIT4 encompasses the vertical profile but is confined in sensitivity to specific altitude ranges. Figure 8a shows typical averaging kernels (row kernels) employed in the CH4 retrieval, while Fig. 8b portrays the total column averaging kernel and the cumulative sum of the DOF values, denoting the number of independent layers in the retrieved profile. Shaded rectangles separate the cumulative sum of the DOF values, with the first DOF spanning 1.6–9.8 km and the second DOF ranging from 9.8 to 22.1 km. Note that all profile regularization constraints of the retrieval strategies have been adjusted to attain similar DOF values, although averaging kernels may differ, particularly between those utilizing Tikhonov and OEM regularization due to the inherent nature of the approaches. To comprehensively evaluate these layers, we conduct a comparative analysis with AirCore and aircraft data, using mixing ratios weighted by air mass density within the specified altitude ranges (see Ortega et al., 2021, for details on weighted mixing ratios). Tables 7 and 8 list the mean and median CH4 relative differences among various retrieval strategies for different partial columns using AirCore and aircraft profiles, respectively. The last column represents the 95 % confidence interval (CI) calculated. As indicated earlier, tropospheric biases estimated from both AirCore and aircraft observations reveal congruent findings. Strategy r8 demonstrates satisfactory performance, with mean biases of −0.08 ± 0.38 % and 0.89 ± 0.28 % for the tropospheric and stratospheric layers, respectively, whereas it shows a mean bias of 0.39 ± 0.42 % for aircraft comparisons in the troposphere. Strategy r9, which is identical to r8 but employs the OEM approach, produces very similar results. Additionally, we assessed the a priori profile by comparing it with AirCore and aircraft profiles. When evaluating WACCM6 across different partial columns, the biases are −1.9 ± 1.0 % and −1.5 ± 1.3 % for the troposphere and stratosphere, respectively. Retrievals yield improved and lower biases, with r8 and r9 showing significant reductions.
Table 8CH4 bias results among the different retrieval strategies in the lower troposphere using aircraft profiles as the reference. The results in bold indicate the best performance.
4.2.2 N2O
To evaluate N2O, we employ a comparable approach but use only low- to mid-tropospheric values from aircraft profiles. Figure 9 shows the vertical profile differences across all retrieval strategies, and a summary of tropospheric weighted mixing ratio biases is presented in Table 9. In the current retrieval strategy (r1) recommended by the IRWG, there is a systematic positive bias of 1.58 ± 0.28 % at all tropospheric altitudes. Transitioning to the latest HIT20 spectroscopy (r2) reduces the overall tropospheric bias to 0.12 ± 0.27 %, although the profile's relative differences shift from negative values below 3 km to positive values above 3 km. Interestingly, employing ATM20 (r3) also results in a systematic positive bias of 1.42 ± 0.27 %, similar to HIT08. Similar outcomes are observed when using both filters independently. Switching to WACCM6 yields a slight improvement. For example, in retrieval r5, which utilizes HIT08 with the updated WACCM6 profile, the difference is 1.27 ± 0.28 %. The combination of HIT20 and WACCM6 further improves the comparison, as seen in retrievals r6 (−0.02 ± 0.25 %) for filter 3 and r7 (0.36 ± 0.22 %) for filter 4, both employing the Tikhonov approach. Retrieval r8, which uses both filters, exhibits minimal bias (0.18 ± 0.20 %), demonstrating the feasibility of using filters 3 and 4 across the IRWG/NDACC network. Additionally, combining both filters maximizes the number of available retrievals. The OEM retrieval approach was also tested with HIT20 and WACCM6, yielding similar results to the Tikhonov approach. Specifically, the OEM-based retrieval showed a bias of 0.02 ± 0.23 %, which falls within the uncertainty of r8 using the Tikhonov approach. The averaging kernels and the cumulative sum of degrees of freedom (DOF) values for N2O are shown in Fig. 10. The first DOF is captured from the surface to about 8 km, whereas the second DOF is observed between 8 and 17 km. Because N2O appears to be well mixed among all tropospheric altitudes, the results shown above are representative of the entire troposphere. Unfortunately, long-term stratospheric AirCore N2O data are not yet available in the same fashion as CH4 to evaluate the stratospheric component using the same approach.
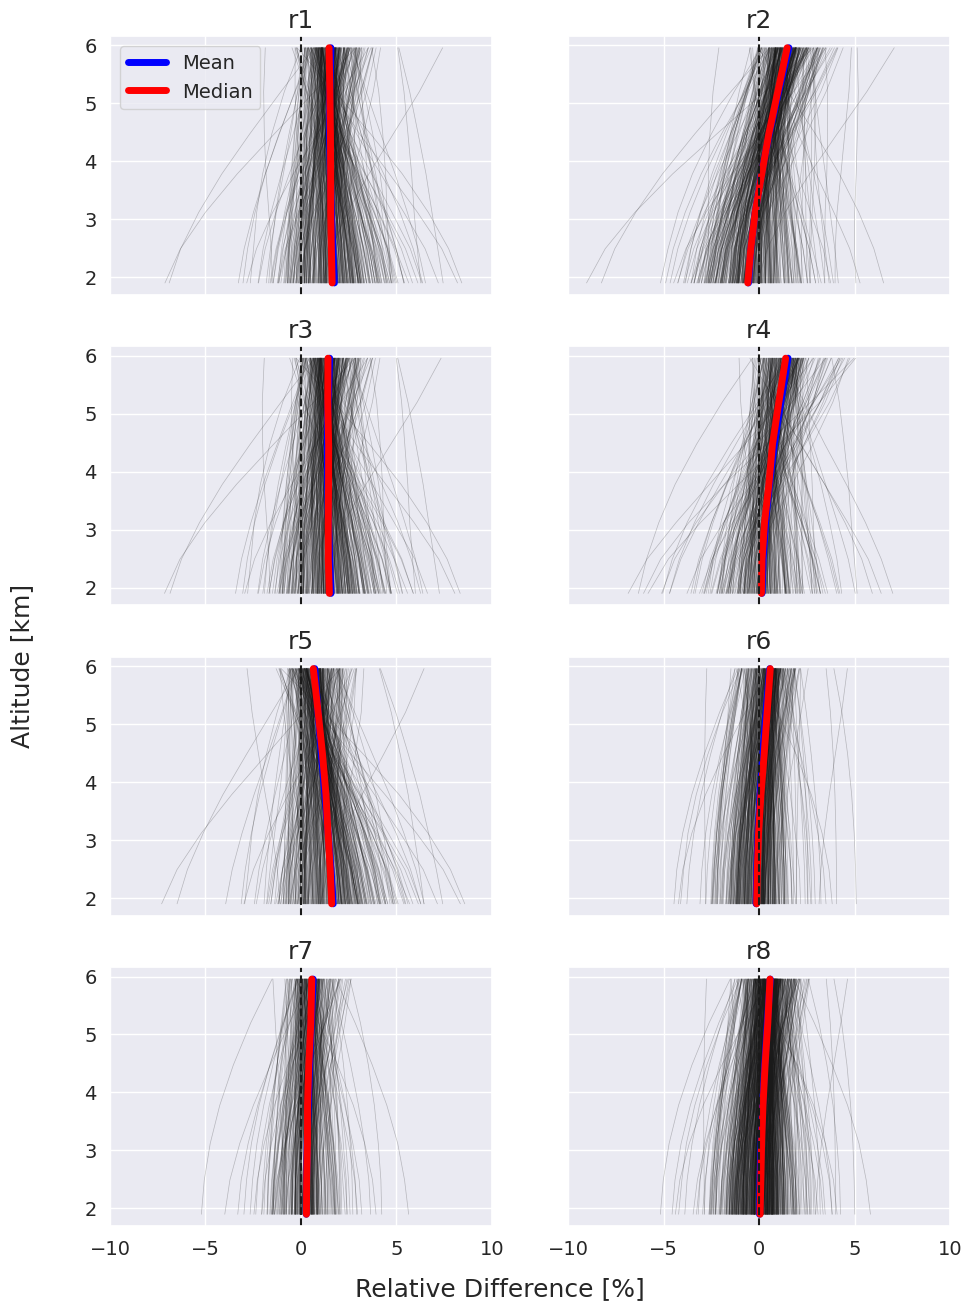
Figure 9Relative difference between FTIR and NOAA aircraft N2O profiles using several retrieval strategies.
Table 9N2O bias results among the different retrieval strategies in the lower troposphere using aircraft profiles as the reference. The results in bold indicate the best performance.
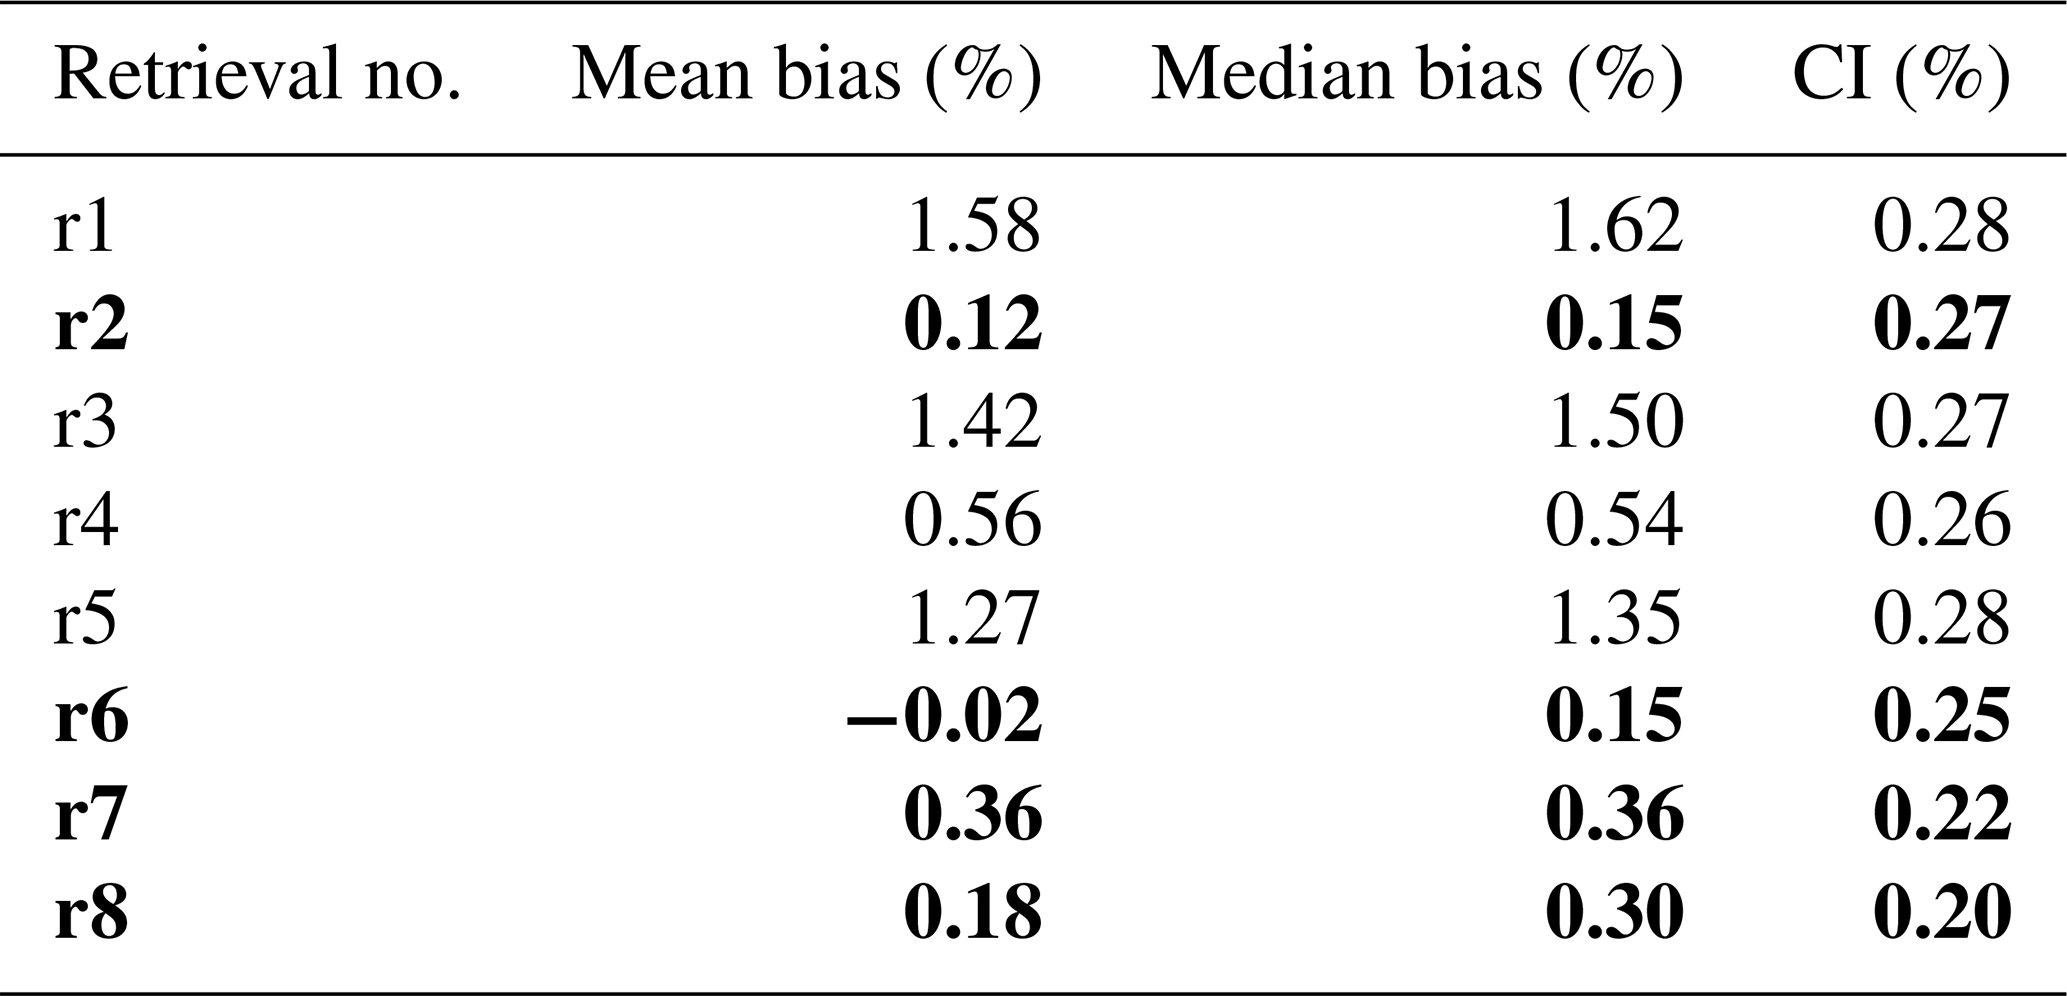
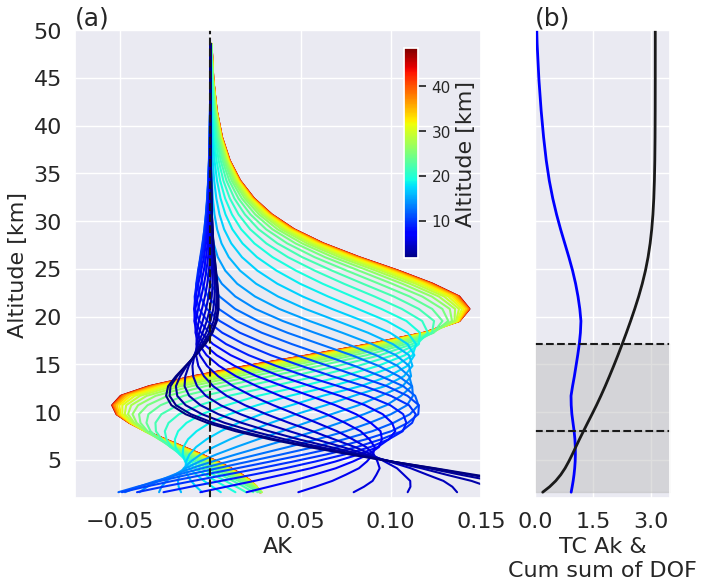
Figure 10(a) N2O FTIR mean row averaging kernels. (b) Total column averaging kernel and the cumulative sum of the DOF values on 31 January 2019 using five micro-windows, Tikhonov regularization, and WACCM6 a priori profiles. The first DOF is between 1.6 and 8 km, whereas the second DOF is between 8.0 and 17.12 km.
4.3 Recommended retrieval strategies and error budget
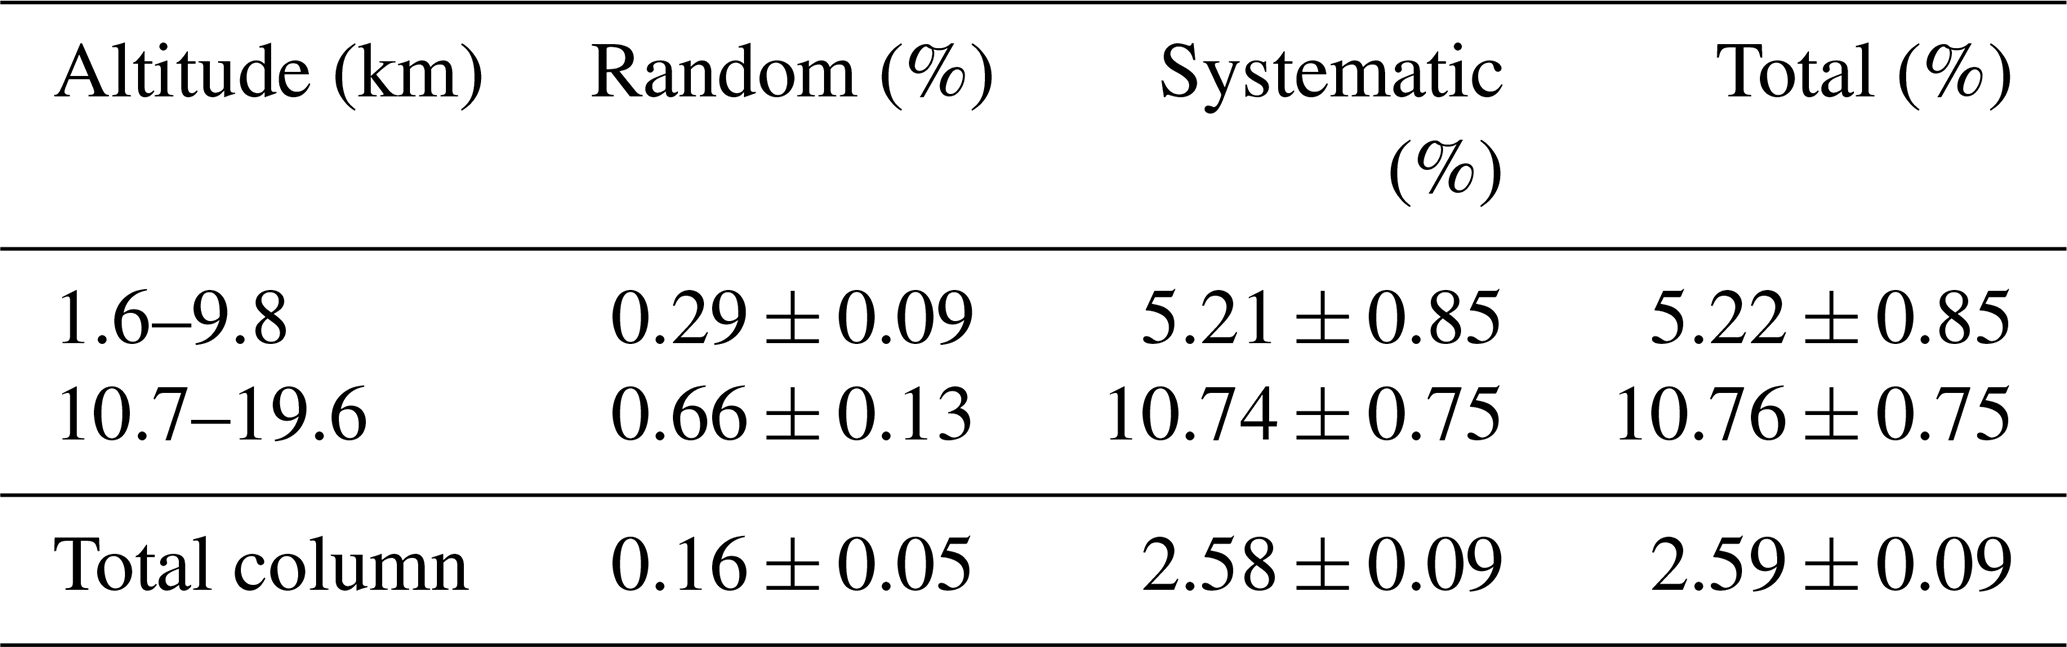
The final suggested retrievals for CH4 and N2O are presented in Table 10, based on both fitting results using various spectroscopy line parameters and, especially, on the assessment of vertical profiles and columns using independent AirCore and aircraft profiles. These retrievals correspond to r8 and r9 for CH4 (Table 2), which are identical except that r8 employs Tikhonov regularization, whereas r9 uses OEM. For N2O, retrievals follow the r8 strategy (Table 4). Although Table 2 lists DLR water vapor for CH4 retrievals, we believe that a standardized approach using ATM20 for all gases would provide satisfactory results, while also being more practical and easier to implement on a broader scale. SFIT4 provides uncertainty budgets that combine random and systematic sources following the formalism outlined in Rodgers and Connor (2003). The primary random and systematic error profiles for CH4 and N2O are illustrated in Figs. 11 and 12, respectively. These vertical profile uncertainties are expressed as percentages relative to the mean mixing ratio, with the total respective errors represented by dotted black lines. The error calculation in SFIT4 is detailed in Ortega et al. (2019), with a specific analysis for water vapor at Boulder. The dominant random error in the troposphere for both gases stem from uncertainties in the temperature profile and measurement noise characterized by the SNR in the spectral region of interest. Additional error parameters, such as interfering species, the apodization function, and the solar zenith angle, have a comparatively lesser impact. Major systematic error components arise from absorption line parameters, specifically line intensity (S), air-broadened half-width (γ), and the temperature dependence of γ (n). The lower-limit uncertainties reported in HIT20 are used for systematic error retrieval, with values of 5 %, 5 %, and 10 % for CH4 and 2 %, 10 %, and 5 % for N2O for S, γ, and n, respectively. It should be noted that these errors are expected to be significantly smaller for CH4 due to the use of the empirically modified line list ATM20. Smoothing error is treated separately and excluded from the total error analysis, as it is often not well-known and is, thus, frequently simplified. Tables 11 and 12 summarize the mean random, systematic, and total uncertainties in the retrieval of CH4 and N2O for three partial columns. These uncertainties are expressed as percentages relative to the mean weighted mixing ratio of the corresponding partial column (using weighted mean errors) and the total column errors. Random error, associated with precision or statistical uncertainty, reflects the inherent variability in measurements and is crucial for meeting precision requirements in observations for CH4, such as growth rate, seasonal cycle amplitudes, and interhemispheric gradients. This type of uncertainty is typically quantified as the standard deviation or standard error of a set of measurements. For example, Sussmann et al. (2011) optimized precision to about 0.3 % using 1σ standard deviation and diurnal variation in a 7 min integration, aligning with the retrieval random error of 0.5 % shown in Table 11.
Table 10Suggested CH4 and N2O final retrieval strategies based on fitting results and assessment with AirCore and aircraft profiles.
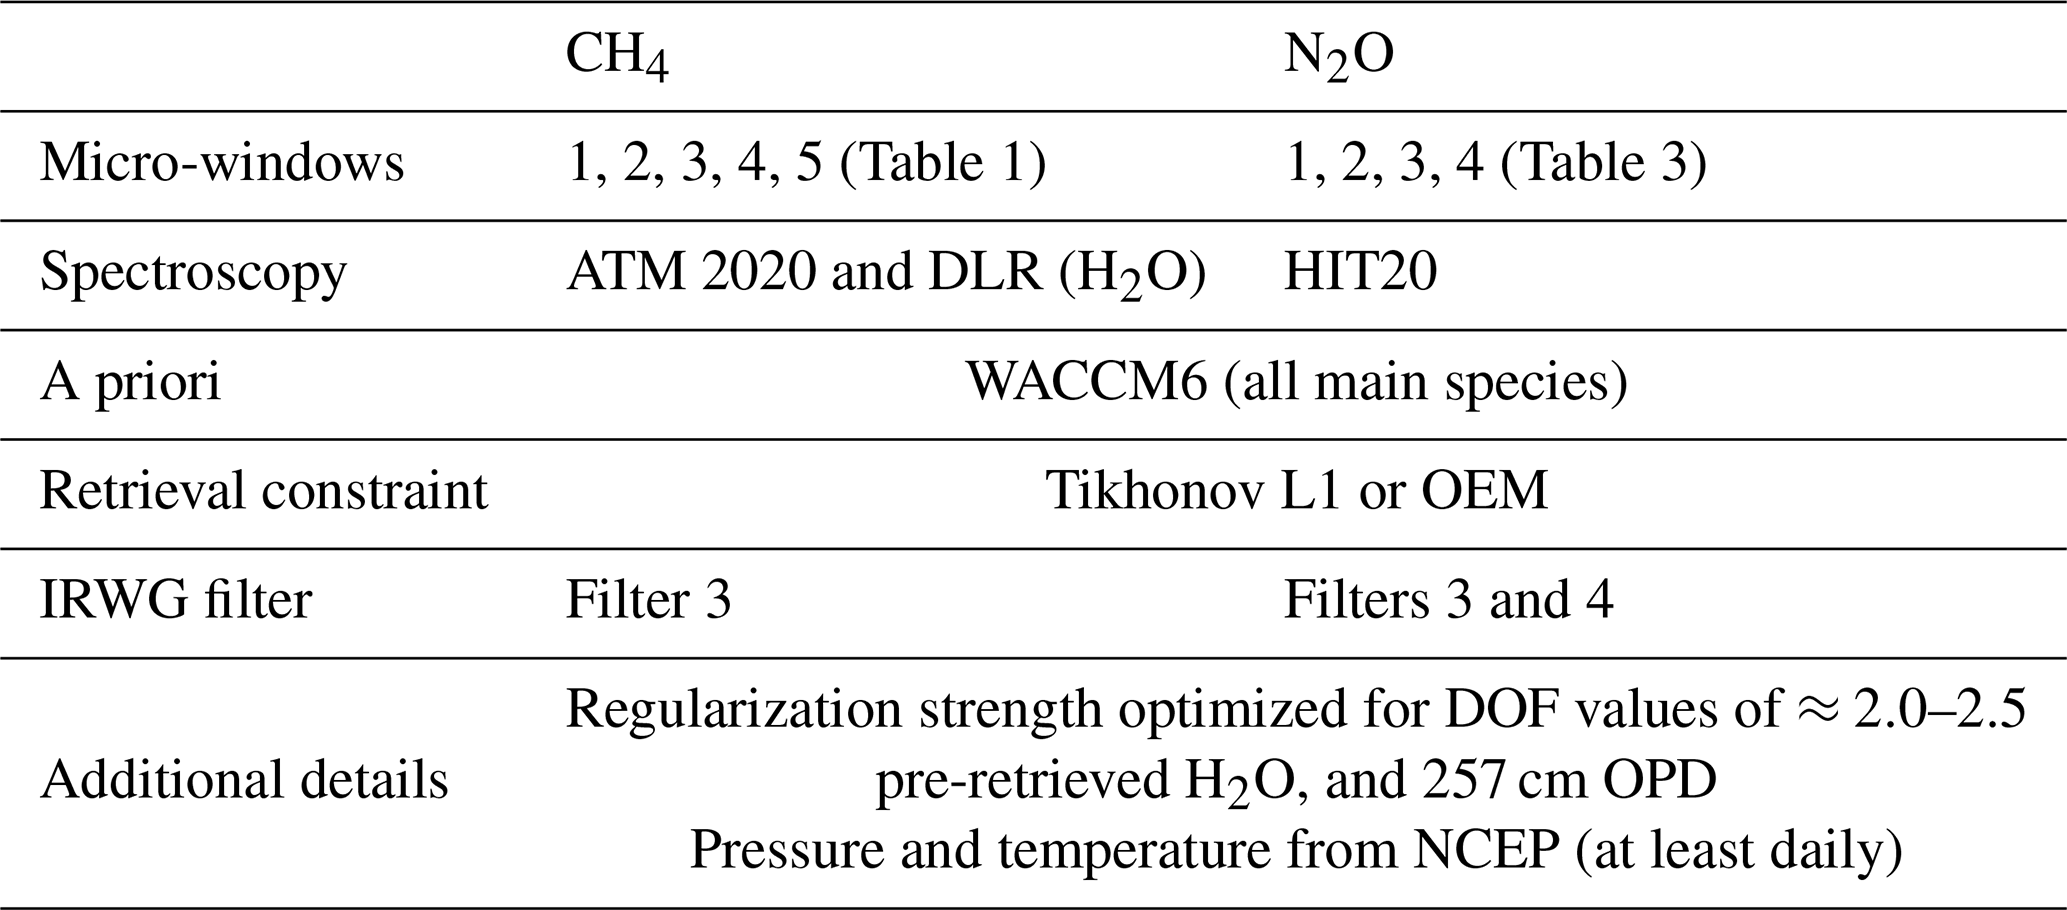
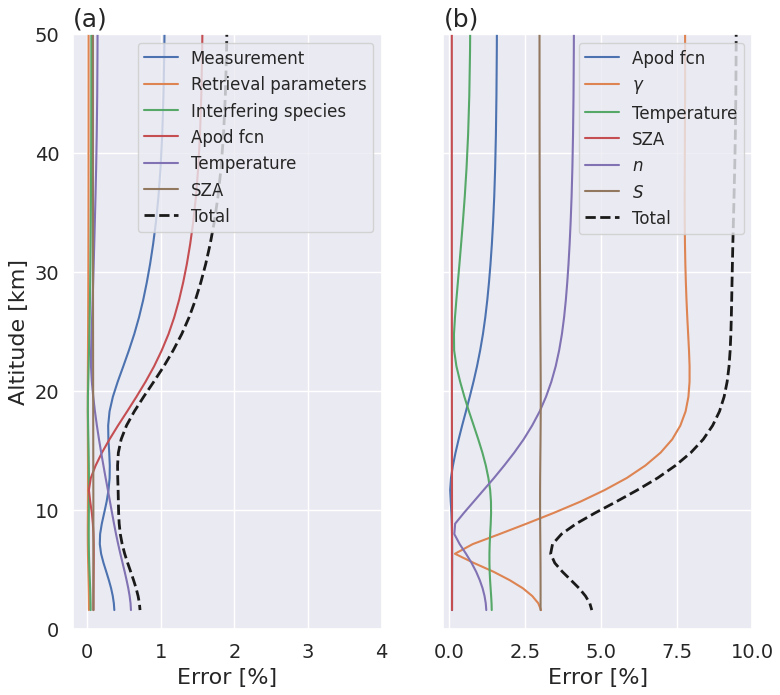
Figure 11Mean vertical profiles of the primary random (a) and systematic (b) uncertainty components in the retrieval of CH4 for the year 2021.
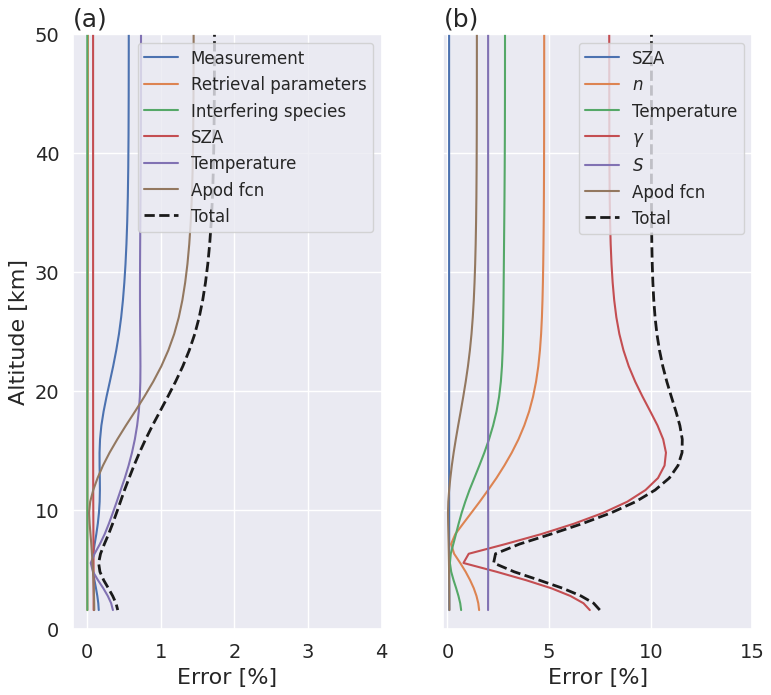
Table 11Mean values of random, systematic, and total uncertainties in the CH4 retrieval for the entire year of 2021 using the final suggested retrieval strategy. These values represent the weighted errors in the corresponding partial column, with the total column errors presented in the bottom row.
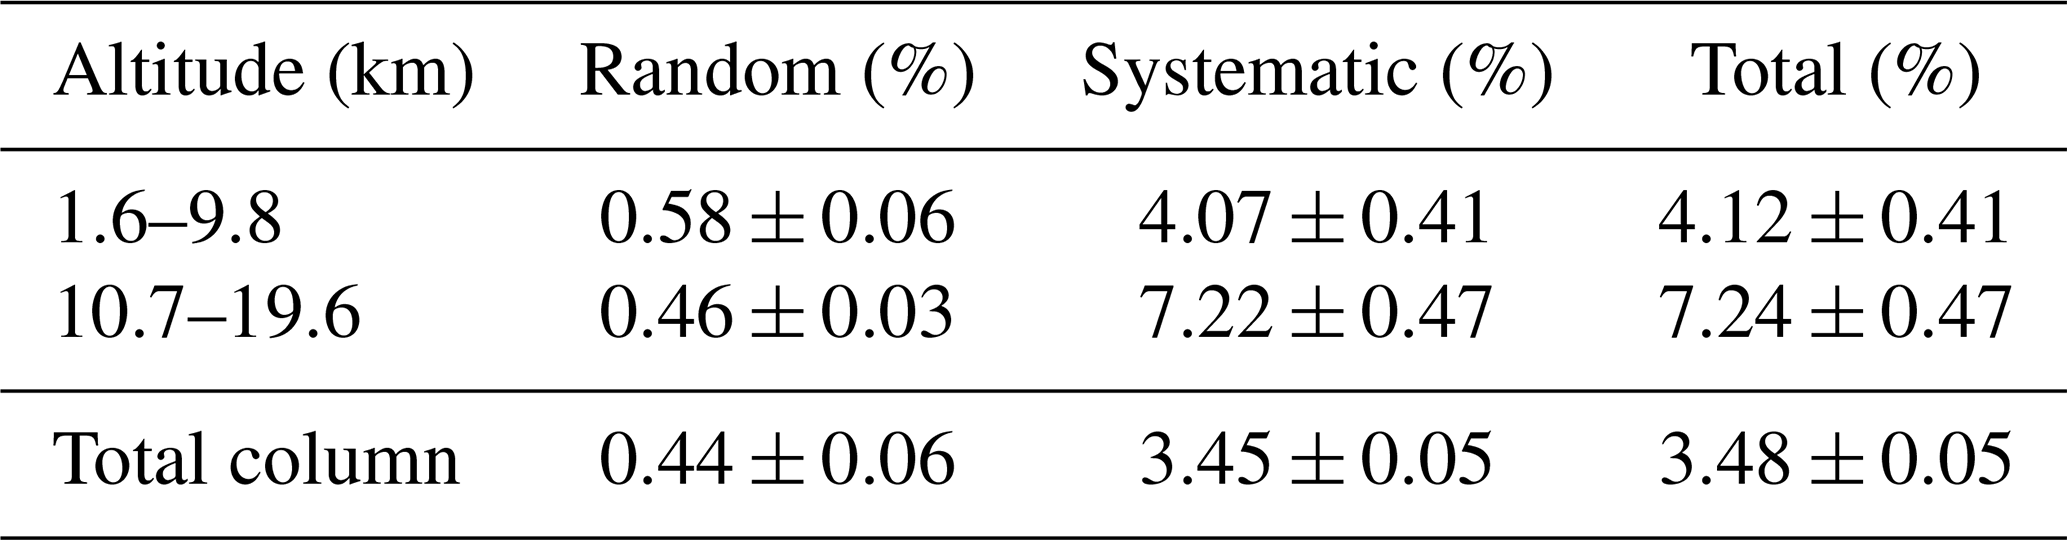
Table 12Mean values of random, systematic, and total uncertainties in the N2O retrieval for the entire year of 2021 using the final suggested retrieval strategy (r8). These values represent the weighted errors in the corresponding partial column, with the total column errors presented in the bottom row.
Over recent years, there has been noticeable variability in the retrieval strategies for CH4 among different ground-based FTIR instruments within the IRWG of NDACC. Acknowledging advancements in spectroscopy and the need for retrieval consistency among the IRWG of NDACC, our study evaluates various retrieval strategies, encompassing not only CH4 but also N2O. Using observations from Boulder, Colorado, we initially assess fitting results across diverse spectroscopy databases, including the latest HITRAN databases, the ATM spectroscopy utilized by TCCON and IRWG, a combination of them, and a water vapor line list from DLR. We also evaluate previously identified suitable micro-windows. While some cases exhibit clear improvements in residuals for certain spectroscopy, in other instances, residual differences are less distinct, despite significant variations in profile retrievals. Thus, we emphasize the importance of the subsequent step: comparing independent long-term AirCore and aircraft in situ profile observations with the various FTIR retrieval strategies. By utilizing this dataset, we strengthen the evaluation of various retrieval strategies for CH4 and N2O, an approach rarely undertaken within the IRWG. In total, we assess 10 CH4 retrieval strategies, varying micro-windows, spectroscopy, and regularization (Tikhonov or optimal estimation) approaches, as well as 8 N2O retrievals, primarily focusing on spectroscopy, regularization, and a priori profiles. Notably, both AirCore and aircraft profiles exhibit remarkable similarity in their relative differences compared to all FTIR retrievals, strengthening our confidence in the assessment. Moreover, bias analyses across various atmospheric layers for both CH4 and N2O contribute to refining retrieval methodologies. Clear biases were observed when undertaking a comparison with independent profiles, making the exclusion of certain retrievals straightforward. We propose optimized retrieval settings for CH4 and N2O, leveraging a first-order Tikhonov method and incorporating a priori profiles from the latest WACCM model simulations to enhance accuracy. While the HITRAN 2020 spectroscopic database is effective for N2O, it exhibits suboptimal residuals for CH4, indicating the need for further refinements. In contrast, ATM 2020 yields better results for CH4, with a slight improvement when combined with the DLR water vapor line list. However, this enhancement may be site-dependent. Furthermore, profile comparisons reveal biases within different atmospheric layers. For the proposed retrievals, we obtain a mean bias of −0.08 ± 0.38 % and 0.89 ± 0.28 % for the tropospheric and stratospheric layers of CH4 using AirCore, respectively, whereas the mean bias is 0.39 ± 0.42 % for aircraft comparisons in the troposphere. For N2O, the bias in the troposphere is approximately 0.18 ± 0.2 %. Furthermore, we provide uncertainty budgets, including random and systematic sources, to comprehensively understand error sources, guiding future refinement efforts. Random errors of about 0.5 %, mainly attributed to temperature profile uncertainties and measurement noise, dominate in the troposphere for both gases. Overall, our findings significantly contribute to advancing the understanding of atmospheric composition and advocate for an effective harmonized approach among all IRWG/NDACC sites. Although Boulder benefits from unique long-term AirCore and aircraft profile observations, these capabilities are not widespread across IRWG/NDACC sites, underscoring the importance of deploying similar observations systems elsewhere in the NDACC network.
The profile retrieval algorithm, SFIT4 (Hannigan et al., 2024), is freely available and can be obtained at https://doi.org/10.18758/CLYG3EUO. The Level-2 NOAA AirCore dataset (v20230831) (Baier et al., 2021) is publicly available via the NOAA data repository: https://doi.org/10.15138/6AV0-MY81. Atmospheric observations from the NOAA GML Carbon Cycle Aircraft Vertical Profile Network (Sweeney et al., 2015; McKain et al., 2023) can be obtained from https://doi.org/10.15138/39HR-9N34. Additional data used in this study can be provided upon request from the corresponding author. The figures in this paper were created using Python. Plotting scripts are available from the corresponding author upon request.
IO and JWH conceptualized the project. IO carried out the data analysis, generated all figures and plots, and prepared the initial draft of the manuscript. BCB, KM, and DS contributed the AirCore, aircraft, and Lauder FTIR datasets, respectively, and provided substantial input throughout the study. All co-authors contributed to discussions, offered feedback on the manuscript, and assisted in its preparation.
The contact author has declared that none of the authors has any competing interests.
Publisher's note: Copernicus Publications remains neutral with regard to jurisdictional claims made in the text, published maps, institutional affiliations, or any other geographical representation in this paper. While Copernicus Publications makes every effort to include appropriate place names, the final responsibility lies with the authors.
We thank the many people at NOAA GML that contributed to the AirCore and aircraft datasets used in this study, including Andy Crotwell, Molly Crotwell, Ed Dlugokencky, Jack Higgs, Xin Lan, Pat Lang, Thomas Legard, Monica Madronich, Eric Moglia, John Mund, Don Neff, Tim Newberger, Colm Sweeney, Pieter Tans, and Sonja Wolter.
This study has been supported under contract by the National Aeronautics and Space Administration (NASA) award no. NNX17AE38G. This work also received support from the NOAA Climate Program Office's Atmospheric Chemistry, Carbon Cycle, and Climate program (grant no. NA23OAR4310285).
This paper was edited by Nicholas Deutscher and reviewed by two anonymous referees.
Alberti, C., Hase, F., Frey, M., Dubravica, D., Blumenstock, T., Dehn, A., Castracane, P., Surawicz, G., Harig, R., Baier, B. C., Bès, C., Bi, J., Boesch, H., Butz, A., Cai, Z., Chen, J., Crowell, S. M., Deutscher, N. M., Ene, D., Franklin, J. E., García, O., Griffith, D., Grouiez, B., Grutter, M., Hamdouni, A., Houweling, S., Humpage, N., Jacobs, N., Jeong, S., Joly, L., Jones, N. B., Jouglet, D., Kivi, R., Kleinschek, R., Lopez, M., Medeiros, D. J., Morino, I., Mostafavipak, N., Müller, A., Ohyama, H., Palmer, P. I., Pathakoti, M., Pollard, D. F., Raffalski, U., Ramonet, M., Ramsay, R., Sha, M. K., Shiomi, K., Simpson, W., Stremme, W., Sun, Y., Tanimoto, H., Té, Y., Tsidu, G. M., Velazco, V. A., Vogel, F., Watanabe, M., Wei, C., Wunch, D., Yamasoe, M., Zhang, L., and Orphal, J.: Improved calibration procedures for the EM27/SUN spectrometers of the COllaborative Carbon Column Observing Network (COCCON), Atmos. Meas. Tech., 15, 2433–2463, https://doi.org/10.5194/amt-15-2433-2022, 2022. a
Bader, W., Bovy, B., Conway, S., Strong, K., Smale, D., Turner, A. J., Blumenstock, T., Boone, C., Collaud Coen, M., Coulon, A., Garcia, O., Griffith, D. W. T., Hase, F., Hausmann, P., Jones, N., Krummel, P., Murata, I., Morino, I., Nakajima, H., O'Doherty, S., Paton-Walsh, C., Robinson, J., Sandrin, R., Schneider, M., Servais, C., Sussmann, R., and Mahieu, E.: The recent increase of atmospheric methane from 10 years of ground-based NDACC FTIR observations since 2005, Atmos. Chem. Phys., 17, 2255–2277, https://doi.org/10.5194/acp-17-2255-2017, 2017. a
Baier, B., Sweeney, C., Newberger, T., Higgs, J., and Wolter, S.: NOAA AirCore atmospheric sampling system profiles (Version 20230831), NOAA GML Data Repository [data set], https://doi.org/10.15138/6AV0-MY81, 2021. a, b
Canadell, J. G., Monteiro, P. M. S., Costa, M. H., Cotrim da Cunha, L., Cox, P. M., Eliseev, A. V., Henson, S., Ishii, M., Jaccard, S., Koven, C., Lohila, A., Patra, P. K., Piao, S., Rogelj, J., Syampungani, S., Zaehle, S., and Zickfeld, K.: Global Carbon and other Biogeochemical Cycles and Feedbacks, in: Climate Change 2021: The Physical Science Basis. Contribution of Working Group I to the Sixth Assessment Report of the Intergovernmental Panel on Climate Change, edited by: Masson-Delmotte, V., Zhai, P., Pirani, A., Connors, S. L., Péan, C., Berger, S., Caud, N., Chen, Y., Goldfarb, L., Gomis, M. I., Huang, M., Leitzell, K., Lonnoy, E., Matthews, J. B. R., Maycock, T. K., Waterfield, T., Yelekçi, O., Yu, R., and Zhou, B., Cambridge University Press, Cambridge, United Kingdom and New York, NY, USA, 673–816, https://doi.org/10.1017/9781009157896.007, 2021. a, b
Chesnokova, T. Y., Makarova, M. V., Chentsov, A. V., Kostsov, V. S., Poberovskii, A. V., Zakharov, V. I., and Rokotyan, N. V.: Estimation of the impact of differences in the CH4 absorption line parameters on the accuracy of methane atmospheric total column retrievals from ground-based FTIR spectra, J. Quant. Spectrosc. Ra., 254, 107187, https://doi.org/10.1016/j.jqsrt.2020.107187, 2020. a, b, c
De Mazière, M., Thompson, A. M., Kurylo, M. J., Wild, J. D., Bernhard, G., Blumenstock, T., Braathen, G. O., Hannigan, J. W., Lambert, J.-C., Leblanc, T., McGee, T. J., Nedoluha, G., Petropavlovskikh, I., Seckmeyer, G., Simon, P. C., Steinbrecht, W., and Strahan, S. E.: The Network for the Detection of Atmospheric Composition Change (NDACC): history, status and perspectives, Atmos. Chem. Phys., 18, 4935–4964, https://doi.org/10.5194/acp-18-4935-2018, 2018. a
Garcia, R. R., Marsh, D. R., Kinnison, D. E., Boville, B. A., and Sassi, F.: Simulation of secular trends in the middle atmosphere, 1950–2003, J. Geophys. Res.-Atmos., 112, https://doi.org/10.1029/2006JD007485, 2007. a
Gettelman, A., Mills, M. J., Kinnison, D. E., Garcia, R. R., Smith, A. K., Marsh, D. R., Tilmes, S., Vitt, F., Bardeen, C. G., McInerny, J., Liu, H.-L., Solomon, S. C., Polvani, L. M., Emmons, L. K., Lamarque, J.-F., Richter, J. H., Glanville, A. S., Bacmeister, J. T., Phillips, A. S., Neale, R. B., Simpson, I. R., DuVivier, A. K., Hodzic, A., and Randel, W. J.: The Whole Atmosphere Community Climate Model Version 6 (WACCM6), J. Geophys/ Res.-Atmos., 124, 12380–12403, https://doi.org/10.1029/2019JD030943, 2019. a
Gordon, I. E., Rothman, L. S., Hargreaves, R. J., Hashemi, R., Karlovets, E. V., Skinner, F. M., Conway, E. K., Hill, C., Kochanov, R. V., Tan, Y., Wcisło, P., Finenko, A. A., Nelson, K., Bernath, P. F., Birk, M., Boudon, V., Campargue, A., Chance, K. V., Coustenis, A., Drouin, B. J., Flaud, J., Gamache, R. R., Hodges, J. T., Jacquemart, D., Mlawer, E. J., Nikitin, A. V., Perevalov, V. I., Rotger, M., Tennyson, J., Toon, G. C., Tran, H., Tyuterev, V. G., Adkins, E. M., Baker, A., Barbe, A., Canè, E., Császár, A. G., Dudaryonok, A., Egorov, O., Fleisher, A. J., Fleurbaey, H., Foltynowicz, A., Furtenbacher, T., Harrison, J. J., Hartmann, J., Horneman, V., Huang, X., Karman, T., Karns, J., Kassi, S., Kleiner, I., Kofman, V., Kwabia-Tchana, F., Lavrentieva, N. N., Lee, T. J., Long, D. A., Lukashevskaya, A. A., Lyulin, O. M., Makhnev, V. Y., Matt, W., Massie, S. T., Melosso, M., Mikhailenko, S. N., Mondelain, D., Müller, H. S. P., Naumenko, O. V., Perrin, A., Polyansky, O. L., Raddaoui, E., Raston, P. L., Reed, Z. D., Rey, M., Richard, C., Tóbiás, R., Sadiek, I., Schwenke, D. W., Starikova, E., Sung, K., Tamassia, F., Tashkun, S. A., Vander Auwera, J., Vasilenko, I. A., Vigasin, A. A., Villanueva, G. L., Vispoel, B., Wagner, G., Yachmenev, A., and Yurchenko, S. N.: The HITRAN2020 molecular spectroscopic database, J. Quant. Spectrosc. Ra., 277, 107949, https://doi.org/10.1016/j.jqsrt.2021.107949, 2022. a
Hannigan, J., Palm, M., Jones, N., Ortega, I., Langerock, B., Mahieu, E., Zhou, M., and Smale, D.: SFIT4 Line-by-line nonlinear spectral fitting software: version 1.0.21, BIRA-IASB Data repository [data set], https://doi.org/10.18758/CLYG3EUO, 2024. a, b
Hannigan, J. W., Coffey, M. T., and Goldman, A.: Semiautonomous FTS observation system for remote sensing of stratospheric and tropospheric gases, J. Atmos. Ocean. Tech., 26, 1814–1828, https://doi.org/10.1175/2009JTECHA1230.1, 2009. a
Hase, F., Hannigan, J. W., Coffey, M. T., Goldman, A., Höpfner, M., Jones, N. B., Rinsland, C. P., and Wood, S. W.: Intercomparison of retrieval codes used for the analysis of high-resolution, ground-based FTIR measurements, J. Quant. Spectrosc. Ra., 87, 25–52, https://doi.org/10.1016/j.jqsrt.2003.12.008, 2004. a
Hase, F., Frey, M., Kiel, M., Blumenstock, T., Harig, R., Keens, A., and Orphal, J.: Addition of a channel for XCO observations to a portable FTIR spectrometer for greenhouse gas measurements, Atmos. Meas. Tech., 9, 2303–2313, https://doi.org/10.5194/amt-9-2303-2016, 2016. a
Karion, A., Sweeney, C., Tans, P., and Newberger, T.: AirCore: An Innovative Atmospheric Sampling System, J. Atmos. Ocean. Tech., 27, 1839–1853, https://doi.org/10.1175/2010JTECHA1448.1, 2010. a
McKain, K., Sweeney, C., Baier, B., Crotwell, A., Crotwell, M., Handley, P., Higgs, J., Legard, T., Madronich, M., Miller, J. B., Moglia, E., Mund, J., Newberger, T., Wolter, S., and Laboratory, N. G. M.: NOAA Global Greenhouse Gas Reference Network Flask-Air PFP Sample Measurements of CO2, CH4, CO, N2O, H2, SF6 and isotopic ratios collected from aircraft vertical profiles, NOAA GML Data Repository [data set], https://doi.org/10.15138/39HR-9N34, 2023. a, b
Olsen, K. S., Strong, K., Walker, K. A., Boone, C. D., Raspollini, P., Plieninger, J., Bader, W., Conway, S., Grutter, M., Hannigan, J. W., Hase, F., Jones, N., de Mazière, M., Notholt, J., Schneider, M., Smale, D., Sussmann, R., and Saitoh, N.: Comparison of the GOSAT TANSO-FTS TIR CH4 volume mixing ratio vertical profiles with those measured by ACE-FTS, ESA MIPAS, IMK-IAA MIPAS, and 16 NDACC stations, Atmos. Meas. Tech., 10, 3697–3718, https://doi.org/10.5194/amt-10-3697-2017, 2017. a
Ortega, I., Buchholz, R. R., Hall, E. G., Hurst, D. F., Jordan, A. F., and Hannigan, J. W.: Tropospheric water vapor profiles obtained with FTIR: comparison with balloon-borne frost point hygrometers and influence on trace gas retrievals, Atmos. Meas. Tech., 12, 873–890, https://doi.org/10.5194/amt-12-873-2019, 2019. a, b, c
Ortega, I., Hannigan, J. W., Buchholz, R. R., and Pfister, G.: Long-term variability and source signature of gases emitted from oil & natural gas and cattle feedlot operations in the Colorado front range, Atmos. Environ., 263, 118663, https://doi.org/10.1016/j.atmosenv.2021.118663, 2021. a, b, c, d
Pougatchev, N. S., Connor, B., and Rinsland, C. P.: Infrared measurements of the ozone vertical distribution above Kitt Peak, J. Geophys. Res., 100, 16689–16697, https://doi.org/10.1029/95JD01296, 1995. a
Prather, M. J., Hsu, J., DeLuca, N. M., Jackman, C. H., Oman, L. D., Douglass, A. R., Fleming, E. L., Strahan, S. E., Steenrod, S. D., Søvde, O. A., Isaksen, I. S. A., Froidevaux, L., and Funke, B.: Measuring and modeling the lifetime of nitrous oxide including its variability, J. Geophys. Res.-Atmos., 120, 5693–5705, https://doi.org/10.1002/2015JD023267, 2015. a
Rinsland, C. P., Jones, N. B., Connor, B. J., Logan, J. A., Pougatchev, N. S., Goldman, A., Murcray, F. J., Stephen, T. M., Pine, A. S., Zander, R., Mahieu, E., and Demoulin, P.: Northern and southern hemisphere ground-based infrared spectroscopic measurements of tropospheric carbon monoxide and ethane, J. Geophys. Res.-Atmos., 103, 28197–28217, https://doi.org/10.1029/98JD02515, 1998. a
Rodgers, C. and Connor, B.: Intercomparison of remote sounding instruments, J. Geophys. Res.-Atmos., 108, https://doi.org/10.1029/2002JD002299, 2003. a, b
Rothman, L. S., Gordon, I. E., Barbe, A., Benner, D. C., Bernath, P. F., Birk, M., Boudon, V., Brown, L. R., Campargue, A., Champion, J. P., Chance, K., Coudert, L. H., Dana, V., Devi, V. M., Fally, S., Flaud, J. M., Gamache, R. R., Goldman, A., Jacquemart, D., Kleiner, I., Lacome, N., Lafferty, W. J., Mandin, J. Y., Massie, S. T., Mikhailenko, S. N., Miller, C. E., Moazzen-Ahmadi, N., Naumenko, O. V., Nikitin, A. V., Orphal, J., Perevalov, V. I., Perrin, A., Predoi-Cross, A., Rinsland, C. P., Rotger, M., Šimečková, M., Smith, M. A. H., Sung, K., Tashkun, S. A., Tennyson, J., Toth, R. A., Vandaele, A. C., and Vander Auwera, J.: The HITRAN 2008 molecular spectroscopic database, J. Quant. Spectrosc. Ra., 110, 533–572, https://doi.org/10.1016/j.jqsrt.2009.02.013, 2009. a
Sepúlveda, E., Schneider, M., Hase, F., Barthlott, S., Dubravica, D., García, O. E., Gomez-Pelaez, A., González, Y., Guerra, J. C., Gisi, M., Kohlhepp, R., Dohe, S., Blumenstock, T., Strong, K., Weaver, D., Palm, M., Sadeghi, A., Deutscher, N. M., Warneke, T., Notholt, J., Jones, N., Griffith, D. W. T., Smale, D., Brailsford, G. W., Robinson, J., Meinhardt, F., Steinbacher, M., Aalto, T., and Worthy, D.: Tropospheric CH4 signals as observed by NDACC FTIR at globally distributed sites and comparison to GAW surface in situ measurements, Atmos. Meas. Tech., 7, 2337–2360, https://doi.org/10.5194/amt-7-2337-2014, 2014. a
Steck, T.: Methods for determining regularization for atmospheric retrieval problems, Appl. Opt., 41, 1788–1797, https://doi.org/10.1364/AO.41.001788, 2002. a
Sussmann, R., Forster, F., Rettinger, M., and Jones, N.: Strategy for high-accuracy-and-precision retrieval of atmospheric methane from the mid-infrared FTIR network, Atmos. Meas. Tech., 4, 1943–1964, https://doi.org/10.5194/amt-4-1943-2011, 2011. a, b, c, d, e, f, g, h, i, j, k, l
Sweeney, C., Karion, A., Wolter, S., Newberger, T., Guenther, D., Higgs, J. A., Andrews, A. E., Lang, P. M., Neff, D., Dlugokencky, E., Miller, J. B., Montzka, S. A., Miller, B. R., Masarie, K. A., Biraud, S. C., Novelli, P. C., Crotwell, M., Crotwell, A. M., Thoning, K., and Tans, P. P.: Seasonal climatology of CO2 across North America from aircraft measurements in the NOAA/ESRL Global Greenhouse Gas Reference Network, J. Geophys. Res.-Atmos., 120, 5155–5190, https://doi.org/10.1002/2014JD022591, 2015. a, b
Thompson, C. R., Wofsy, S. C., Prather, M. J., Newman, P. A., Hanisco, T. F., Ryerson, T. B., Fahey, D. W., Apel, E. C., Brock, C. A., Brune, W. H., Froyd, K., Katich, J. M., Nicely, J. M., Peischl, J., Ray, E., Veres, P. R., Wang, S., Allen, H. M., Asher, E., Bian, H., Blake, D., Bourgeois, I., Budney, J., Bui, T. P., Butler, A., Campuzano-Jost, P., Chang, C., Chin, M., Commane, R., Correa, G., Crounse, J. D., Daube, B., Dibb, J. E., DiGangi, J. P., Diskin, G. S., Dollner, M., Elkins, J. W., Fiore, A. M., Flynn, C. M., Guo, H., Hall, S. R., Hannun, R. A., Hills, A., Hintsa, E. J., Hodzic, A., Hornbrook, R. S., Huey, L. G., Jimenez, J. L., Keeling, R. F., Kim, M. J., Kupc, A., Lacey, F., Lait, L. R., Lamarque, J.-F., Liu, J., McKain, K., Meinardi, S., Miller, D. O., Montzka, S. A., Moore, F. L., Morgan, E. J., Murphy, D. M., Murray, L. T., Nault, B. A., Neuman, J. A., Nguyen, L., Gonzalez, Y., Rollins, A., Rosenlof, K., Sargent, M., Schill, G., Schwarz, J. P., Clair, J. M. S., Steenrod, S. D., Stephens, B. B., Strahan, S. E., Strode, S. A., Sweeney, C., Thames, A. B., Ullmann, K., Wagner, N., Weber, R., Weinzierl, B., Wennberg, P. O., Williamson, C. J., Wolfe, G. M., and Zeng, L.: The NASA Atmospheric Tomography (ATom) Mission: Imaging the Chemistry of the Global Atmosphere, B. Am. Meteor. Soc., 103, E761–E790, https://doi.org/10.1175/BAMS-D-20-0315.1, 2022. a
Tian, H., Xu, R., Canadell, J. G., Thompson, R. L., Winiwarter, W., Suntharalingam, P., Davidson, E. A., Ciais, P., Jackson, R. B., Janssens-Maenhout, G., Prather, M. J., Regnier, P., Pan, N., Pan, S., Peters, G. P., Shi, H., Tubiello, F. N., Zaehle, S., Zhou, F., Arneth, A., Battaglia, G., Berthet, S., Bopp, L., Bouwman, A. F., Buitenhuis, E. T., Chang, J., Chipperfield, M. P., Dangal, S. R. S., Dlugokencky, E., Elkins, J. W., Eyre, B. D., Fu, B., Hall, B., Ito, A., Joos, F., Krummel, P. B., Landolfi, A., Laruelle, G. G., Lauerwald, R., Li, W., Lienert, S., Maavara, T., MacLeod, M., Millet, D. B., Olin, S., Patra, P. K., Prinn, R. G., Raymond, P. A., Ruiz, D. J., van der Werf, G. R., Vuichard, N., Wang, J., Weiss, R. F., Wells, K. C., Wilson, C., Yang, J., and Yao, Y.: A comprehensive quantification of global nitrous oxide sources and sinks, Nature, 586, 248–256, https://doi.org/10.1038/s41586-020-2780-0, 2020. a
Toon, G. C.: Atmospheric Line List for the 2014 TCCON Data Release, California Institute of Technology Data Repository [data set], https://doi.org/10.14291/TCCON.GGG2014.ATM.R0/1221656, 2015. a, b
Toon, G. C., Blavier, J.-F., Sung, K., Rothman, L. S., and E. Gordon, I.: HITRAN spectroscopy evaluation using solar occultation FTIR spectra, J. Quant. Spectrosc. Ra., 182, 324–336, https://doi.org/10.1016/j.jqsrt.2016.05.021, 2016. a, b
Wild, J. D., Gelman, M. E., Miller, A. J., Chanin, M. L., Hauchecorne, A., Keckhut, P., Farley, R., Dao, P. D., Meriwether, J. W., Gobbi, G. P., Congeduti, F., Adriani, A., McDermid, I. S., McGee, T. J., and Fishbein, E. F.: Comparison of stratospheric temperatures from several lidars, using National Meteorological Center and microwave limb sounder data as transfer references, J. Geophys. Res.-Atmos., 100, 11105–11111, https://doi.org/10.1029/95JD00631, 1995. a
Wofsy, S. C.: HIAPER Pole-to-Pole Observations (HIPPO): fine-grained, global-scale measurements of climatically important atmospheric gases and aerosols, Philos. T. Roy. Soc. A, 369, 2073–2086, https://doi.org/10.1098/rsta.2010.0313, 2011. a
Wunch, D., Toon, G. C., Blavier, J.-F. L., Washenfelder, R. A., Notholt, J., Connor, B. J., Griffith, D. W. T., Sherlock, V., and Wennberg, P. O.: The Total Carbon Column Observing Network, Philos. T. Roy. Soc. A, 369, 2087–2112, https://doi.org/10.1098/rsta.2010.0240, 2011. a
Zhou, M., Langerock, B., Vigouroux, C., Sha, M. K., Ramonet, M., Delmotte, M., Mahieu, E., Bader, W., Hermans, C., Kumps, N., Metzger, J.-M., Duflot, V., Wang, Z., Palm, M., and De Mazière, M.: Atmospheric CO and CH4 time series and seasonal variations on Reunion Island from ground-based in situ and FTIR (NDACC and TCCON) measurements, Atmos. Chem. Phys., 18, 13881–13901, https://doi.org/10.5194/acp-18-13881-2018, 2018. a
Zhou, M., Langerock, B., Wells, K. C., Millet, D. B., Vigouroux, C., Sha, M. K., Hermans, C., Metzger, J.-M., Kivi, R., Heikkinen, P., Smale, D., Pollard, D. F., Jones, N., Deutscher, N. M., Blumenstock, T., Schneider, M., Palm, M., Notholt, J., Hannigan, J. W., and De Mazière, M.: An intercomparison of total column-averaged nitrous oxide between ground-based FTIR TCCON and NDACC measurements at seven sites and comparisons with the GEOS-Chem model, Atmos. Meas. Tech., 12, 1393–1408, https://doi.org/10.5194/amt-12-1393-2019, 2019. a