the Creative Commons Attribution 4.0 License.
the Creative Commons Attribution 4.0 License.
 | 10 Jun 2025
Robustness of atmospheric trace gas retrievals obtained from low-spectral-resolution Fourier transform infrared absorption spectra under variations of interferogram length
Bavo Langerock
Martine De Mazière
Filip Desmet
Pauli Heikkinen
Rigel Kivi
Mahesh Kumar Sha
Corinne Vigouroux
Minqiang Zhou
Gopala Krishna Darbha
Mohmmed Talib
This study examines the sensitivity of atmospheric trace gas column retrievals from ground-based Fourier transform interferometer measurements to variations in the number of points in the recorded interferograms. Shortening an interferogram can be part of standard FTIR data processing and typically occurs with a convolution operation on the interferogram. Shortening will alter the leakage pattern in the associated spectrum, and we demonstrate that the removal of a relatively small number of points from the interferogram edges creates a beat pattern in the difference of the associated spectra obtained from the original and shortened interferograms. For low-spectral-resolution interferometers, the beat pattern may exceed the spectral noise level, and, if this occurs, the number of points in the interferogram can become a strong influence parameter for the retrieved trace gas. In a case study with formaldehyde retrievals obtained from low-resolution spectra in Sodankylä and Kolkata, we show that the retrieval software does not accurately model the leakage pattern and that interferogram shortening has a large effect on atmospheric gas column retrievals that exceeds the estimated retrieval uncertainty of approximately 15 %–30 %. This sensitivity of the retrieval algorithm to the length of the underlying low-resolution interferogram can be reduced by applying a nontrivial apodization such as Norton–Beer apodization. For the Sodankylä case study the correlation between formaldehyde columns obtained from low- and high-resolution measurements increased from 0.72 (without apodization) to 0.93 (Norton–Beer strong apodization).
- Article
(1748 KB) - Full-text XML
- BibTeX
- EndNote


Fourier transform infrared (FTIR) interferometers have a long history of measuring atmospheric trace gas concentrations (De Mazière et al., 2018). The Network for the Detection of Atmospheric Composition Change (NDACC) uses interferometers with a high spectral resolution of approximately 0.005 cm−1 in order to provide vertically resolved trace gas abundances. The Total Carbon Column Observing Network (TCCON) uses measurements with a spectral resolution of 0.02 cm−1 to provide vertically integrated dry-air mole fractions (DMFs) (Wunch et al., 2015). In recent years it has been demonstrated that FTIR interferometers with a low spectral resolution ranging from 0.2 to 0.5 cm−1 have the ability to provide high-quality DMF data (Frey et al., 2019; Sha et al., 2020). FTIR instruments record interferograms that are converted into spectra from which atmospheric trace gas concentrations are retrieved. This paper discusses the sensitivity of this processing chain to a (small) change in the number of points in the recorded interferogram. This dependence on the interferogram size has important implications when directly applying retrieval strategies used in NDACC and TCCON to low-spectral-resolution measurements. To the best of our knowledge, this influence parameter in the retrieval chain has not been considered before. This study builds on standard FTIR data processing methods, including zero filling, phase correction, ramp correction and apodization (Herres and Gronholz, 1985), as well as on the general retrieval scheme applied in the abovementioned networks, where a gas concentration is typically derived from a list of carefully selected spectral microwindows inside the observed spectra. For completeness, we mention here that the COllaborative Carbon Column Observing Network (COCCON, Frey et al., 2019), dedicated to DMF retrievals from low-spectral-resolution measurements, applies by default a Norton–Beer apodization to the interferograms, which reduces the dependence of the retrievals on the interferogram size (how this works will be explained in Sect. 3). NDACC and TCCON retrieval strategies typically use a boxcar apodization.
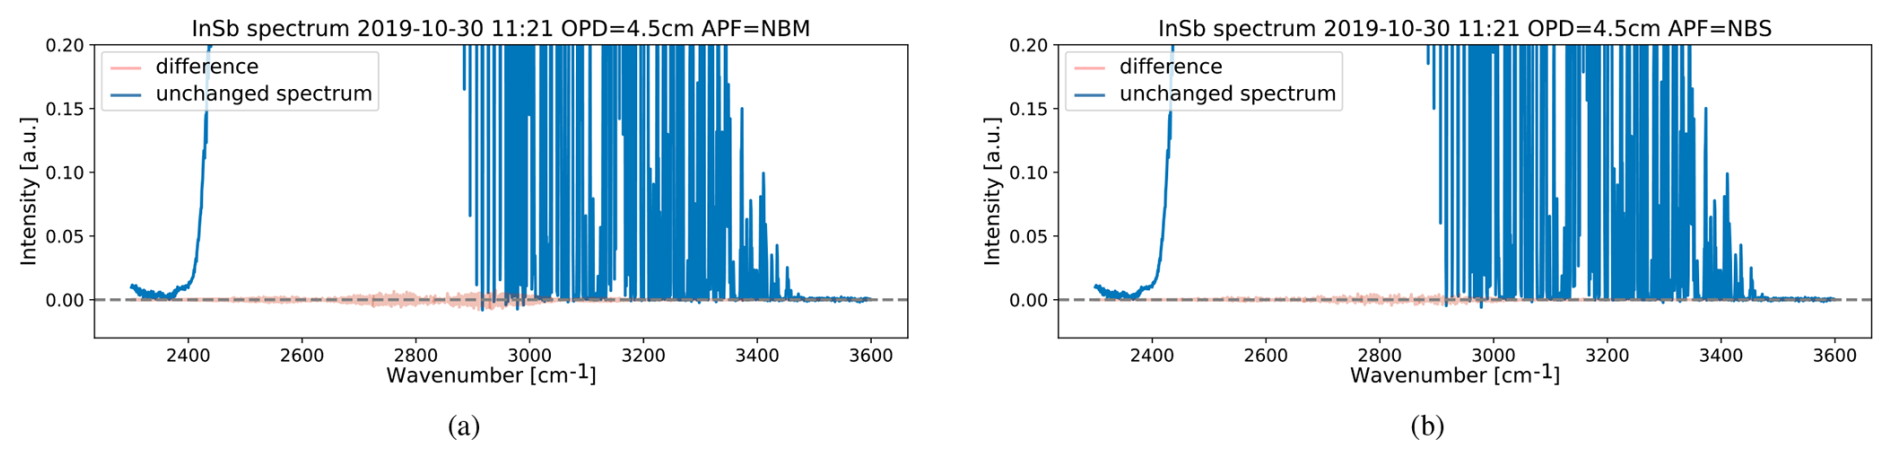
The operation that removes points from the tails of a recorded interferogram typically occurs when a convolution is performed on the interferogram prior to applying the discrete Fourier transform (DFT). For example, a standard practice consists of resampling the interferogram to reduce its asymmetry, and this operation uses a finite convolution with the sinc kernel (Forman et al., 1966, Eq. 13). The interferogram is typically shortened with half the size of the sinc kernel. Digital filtering uses a convolution in the time (or spatial1) domain (Herres and Gronholz, 1985, Part 3). Another example is the Forman phase correction method, which also applies a convolution with a nonstandard kernel to reduce the phase in the spectrum (Forman et al., 1966). Figure 1 shows the effect caused by shortening interferograms that are obtained from two different instruments: Fig. 1a contains a spectrum of an instrument measuring at high spectral resolution, while Fig. 1b shows one at lower resolution (details on the resolutions and path differences are given in the figure panels). Figure 1 shows the appearance of beats in the difference of the unchanged spectrum and the spectrum obtained after removing a few hundred points from the interferogram tails. For the low-resolution spectrum in Fig. 1b, the amplitude of the beats is much larger than the noise level in the spectrum in the out-of-band region. Note that spectral differences can be taken pointwise as the number of points in the spectra is left unchanged even if the interferogram is shortened. This is due to the zero-filling operation, which pads the interferogram with zeros such that the length of the signal becomes a power of 2 (Herres and Gronholz, 1985). For relatively small shortenings and in non-exceptional circumstances, zero filling therefore ensures that the number of points in the spectral domain is fixed.
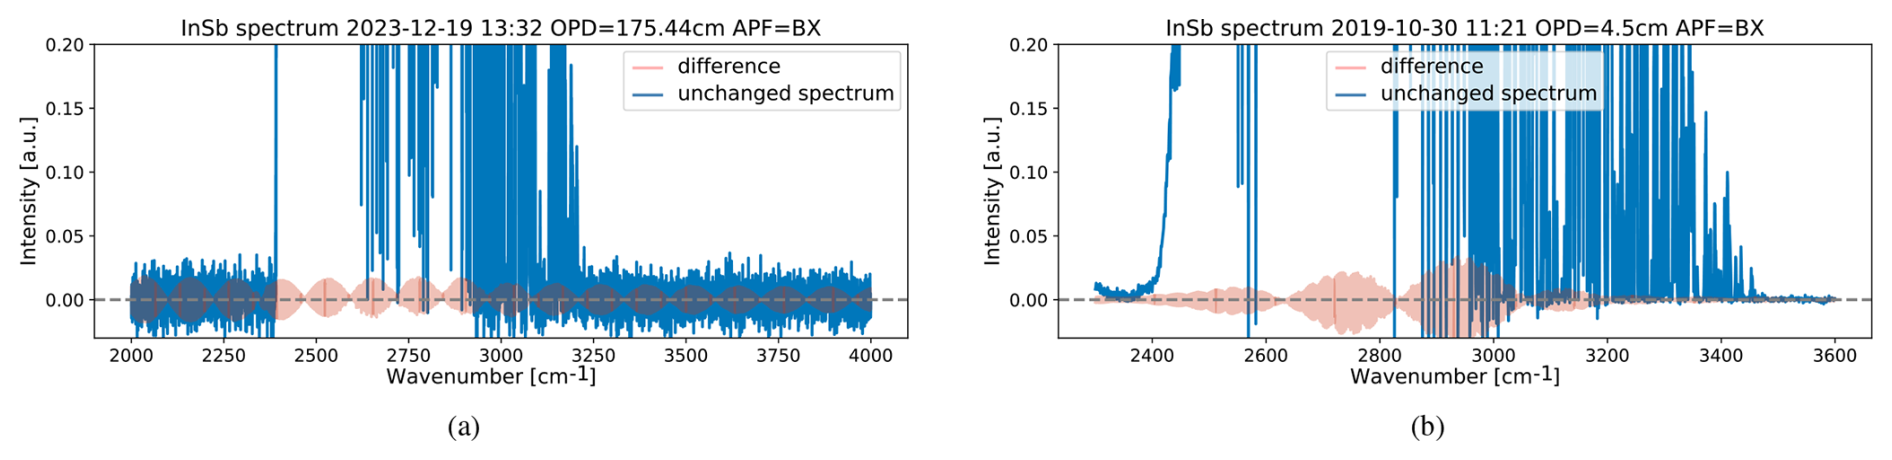
Figure 1Differences in spectra for two boxcar (BX) apodized interferograms obtained after removing δ=28 points: panel (a) shows the beats in the difference where the length of the interferogram is points (obtained with a Bruker 125HR instrument at 0.005 cm−1 spectral resolution), and panel (b) shows the difference where the interferogram contains points (obtained with a Bruker Vertex70 instrument at 0.2 cm−1 spectral resolution). Both spectra are recorded with an InSb detector. The header indicates the apodization function (APF) and the maximal optical path difference (OPD).
Section 2 contains a short discussion to quantify the sizes of the beats using simulated spectra. Section 3 demonstrates how apodization can make the retrieval process more robust under such spectral leakage pattern perturbations. The concluding Sect. 4 studies the effect on formaldehyde retrievals, explains why the retrieval process does not model the leakage pattern accurately and demonstrates that the use of an appropriate apodization for low-resolution spectra stabilizes the atmospheric gas retrievals.
Figure 2 shows the effect of edge removal in a theoretical example using a symmetrical double-sided interferogram that corresponds to an ideal bandpass model with width L. Panel (b) shows the difference between the spectrum that corresponds to the original interferogram and the one where δ≪N points are removed from both edges prior to the DFT. The standard processing chain that we adhere to applies zero padding of the interferogram to the next higher power of 2 (N=28 in this example), and thus the removal of a few points from the edge of the interferogram does not change the number of points in the spectral domain. The difference between both spectra, when considered in the time domain, corresponds to the portion of the interferogram that is removed. The difference in both spectra therefore equals the DFT of the product of the interferogram and an appropriately positioned rectangle window of length 2δ as depicted in Fig. 2a: DFT(I[t]B2δ[t]). The DFT of a rectangle with length ℓ is related to the Dirichlet kernel (McClellan et al., 2016):
From the convolution theorem, we can state that the difference between the two spectra is therefore a circular convolution of the bandpass with an appropriately time-shifted Dirichlet kernel .
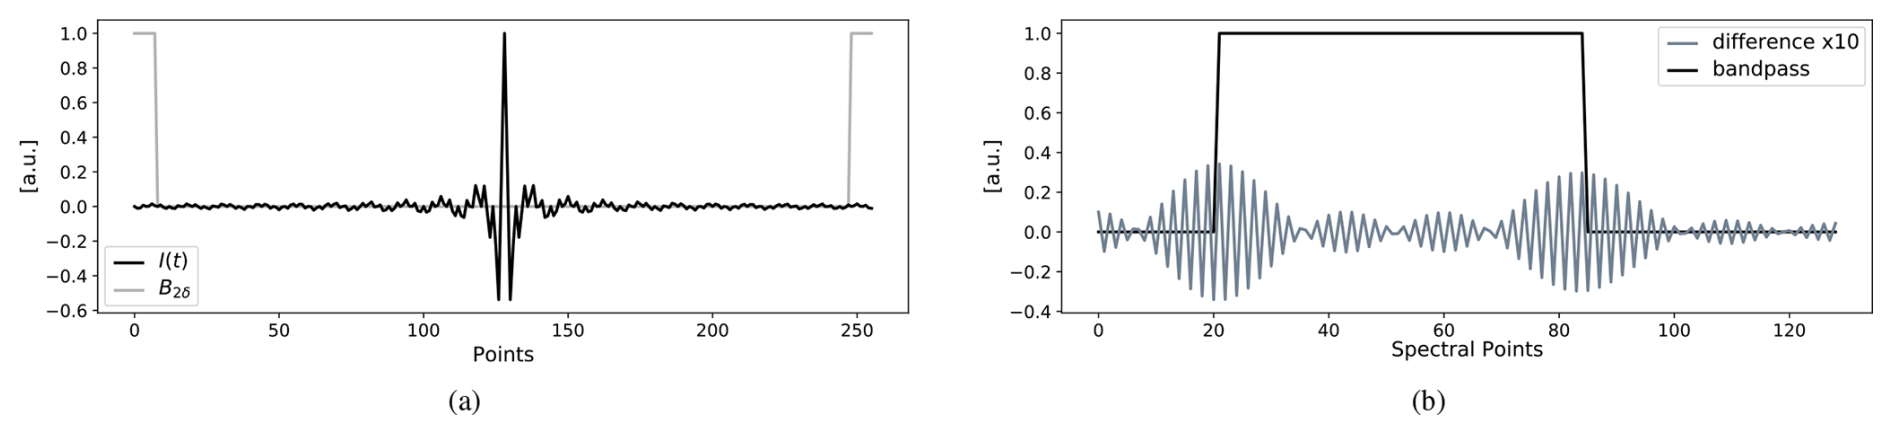
Figure 2Simulation example where the shortening operation is applied to a double-sided interferogram shown in panel (a) that corresponds to an idealized bandpass model shown in panel (b) (only positive frequencies are shown in the spectral domain, the interferogram size is N=28, the bandpass width is and B2δ is the rectangle window that corresponds to the spectral difference). The effect in the spectral domain of removing δ=23 points at each end of the interferogram is shown where the difference in spectra may become ±4 % near the bounds of the bandpass. No apodization is used.
As shown in Fig. 2b, this convolution creates a beat pattern in the difference. In this example the removal of 2δ=16 points leads to an approximately 4 % difference in the spectra. The amplitude of the beats is related to the energy in the difference of both spectra, which in turn is related to the energy in the portion of the interferogram that is removed, i.e., I[t]B2δ[t] (Parseval's theorem). The beat amplitude therefore depends on the number of points removed δ and the distance to the center burst since the energy in the interferogram signal is inversely proportional to the distance to the center burst.
For single-sided interferograms, the ramp correction will ensure that the removal of δ points on the shorter left arm of the interferogram has a negligible effect: see Fig. 3. In this case, only the right rectangle window Bδ should be taken into account, and the associated Dirichlet kernel takes a slightly different form due to a different time shift: , where Nr is the number of points on the longer right arm.
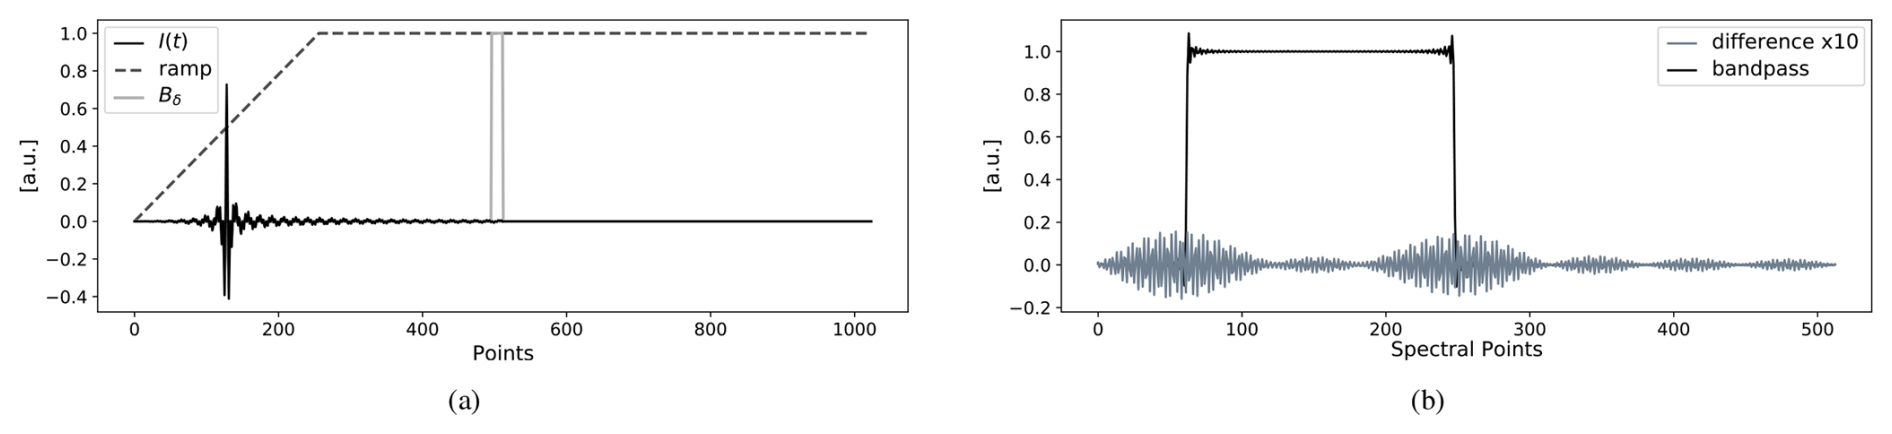
Figure 3Simulation example where the shortening operation is applied to a single-sided interferogram shown in panel (a) that corresponds to an idealized bandpass model shown in panel (b) (only positive frequencies are shown in the spectral domain, the interferogram size is N=29 and the bandpass width is , is ramp-apodized and is zero-padded with a factor of 2). The effect in the spectral domain of removing δ=24 points at the ends of the long arm of the single-sided interferogram is shown. The example uses no additional apodization besides the ramp. The difference in spectra may become ±2 % near the bounds of the bandpass.
The appearance of beats is related to a perturbation in the leakage pattern underlying the DFT. Including apodization in the DFT will therefore reduce its sensitivity to such relatively small changes in the number of points. We consider the standard three Norton–Beer apodization windows from Norton and Beer (1976, 1977), although a more arbitrary strength could be used (Ntokas et al., 2023). Figure 4 shows that the shape of the beats remains when applying different apodizations. However, they are reduced in amplitude compared to the situation without apodization in Fig. 3. For stronger apodizations, the energy in window Bδ containing the removed points is lowered, and so is the amplitude of the beats.
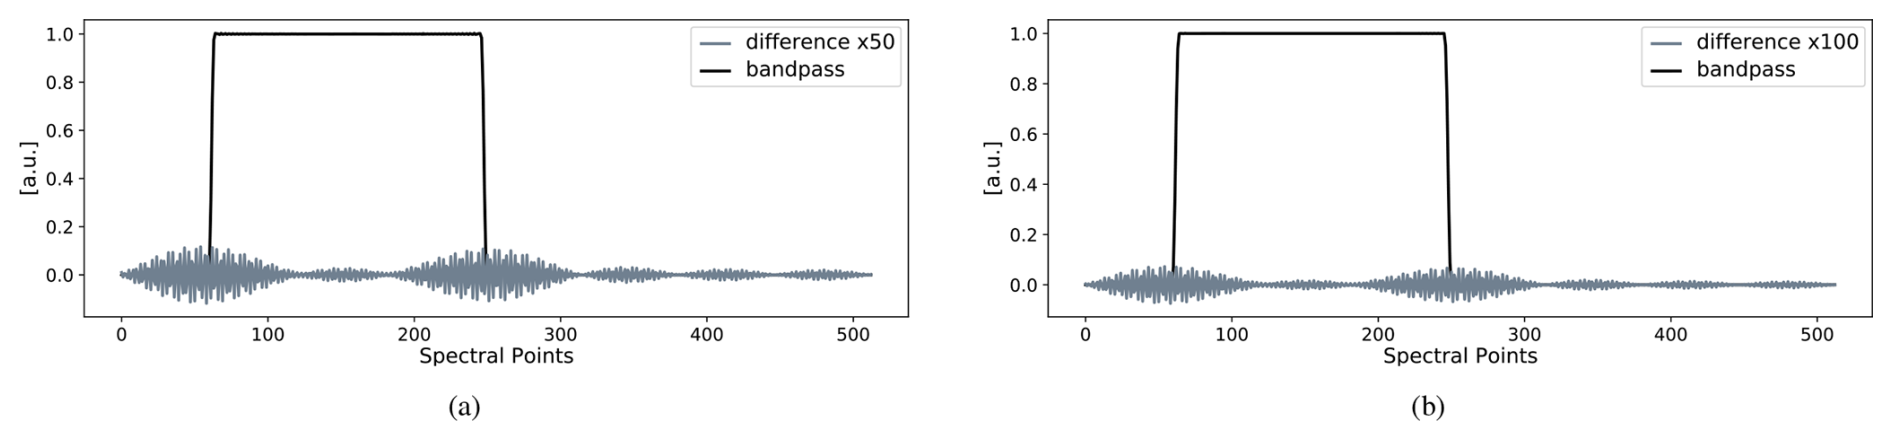
Increasing the strength of the apodization will therefore reduce the dependence of a spectrum on changes in the number of interferogram points and can bring this dependence to the level of the noise in the out-of-band region. Figure 5 shows that, for the low-resolution spectrum in Fig. 1b, the stronger Norton–Beer apodization reduces the beat amplitude to the noise level.
For this case study we first consider a single day of measurements obtained from a low-resolution Bruker Vertex70 instrument (the maximum optical path difference – OPD – equals 4.5 cm) deployed at the remote site Sodankylä (Finland, high latitude, Kivi and Heikkinen, 2016) during the 2019 campaign in the framework of the FRM4GHG project (Sha et al., 2020) and 1 d when the instrument was deployed at a polluted site in Kolkata (India, tropics). The purpose of this study is to check the robustness of the formaldehyde retrieval to small changes in the number of points in the interferogram. For that purpose, formaldehyde columns are retrieved from eight different sets of spectra obtained from the same underlying interferograms but with four different types of apodization applied (boxcar and three standard Norton–Beer) and with each interferogram shortened (δ=28) or left unchanged (δ=0). All of the retrievals follow the retrieval strategy that is currently adopted in the NDACC infrared working group (Vigouroux et al., 2018). This strategy is applied to the low-resolution measurements without further change because it was found that this gives the lowest bias compared to high-resolution measurements at Sodankylä (Sha et al., 2024). The strategy uses microwindows between 2760 and 2785 cm−1 wavenumbers and makes the number of spectral points in the modeled spectrum much smaller compared to the measured spectrum. The estimated systematic uncertainty in the formaldehyde columns for this strategy applied to low-resolution spectra is on the order of 15 %–30 % (Vigouroux et al., 2018; Sha et al., 2024), depending on the pollution level. The retrievals are performed with the retrieval software package SFIT2 (Pougatchev et al., 1995), which was updated to SFIT4 (Hannigan et al., 2024) and is one of the standard retrieval algorithm implementations used in the NDACC infrared working group. The forward model component in SFIT4 takes into account the size of the interferogram via the maximal OPD to simulate the leakage in the modeled spectrum. This is done using a truncation in the time domain after applying the DFT to the modeled spectrum. The truncation index is obtained from the measured maximal OPD using the direct proportion between the OPD and the number of points in the interferogram: more precisely, it is calculated by multiplying the number of points in the modeled interferogram by the ratio of the measured maximal OPD and the modeled OPD. This index is typically invariant under small perturbations of the measured OPD value because the scaled truncation index requires rounding to an integer. In the specific case of the Vertex70 spectra for Sodankylä, we compared two sets of retrievals with a maximal OPD equal to 4.5 cm (no modeled shortening of the interferogram) and a maximal OPD equal to 4.49 cm (modeled shortening of the IFG with δ=28 points out of 171 130). The difference in retrieved formaldehyde columns for the Sodankylä measurements used in Fig. 6 is less than 2 % and is due to a dependence in the forward model wavenumber spacing on the maximal OPD. This difference can be considered negligible compared to the retrieval uncertainty. In the following, all retrievals were made with a fixed maximal OPD value.
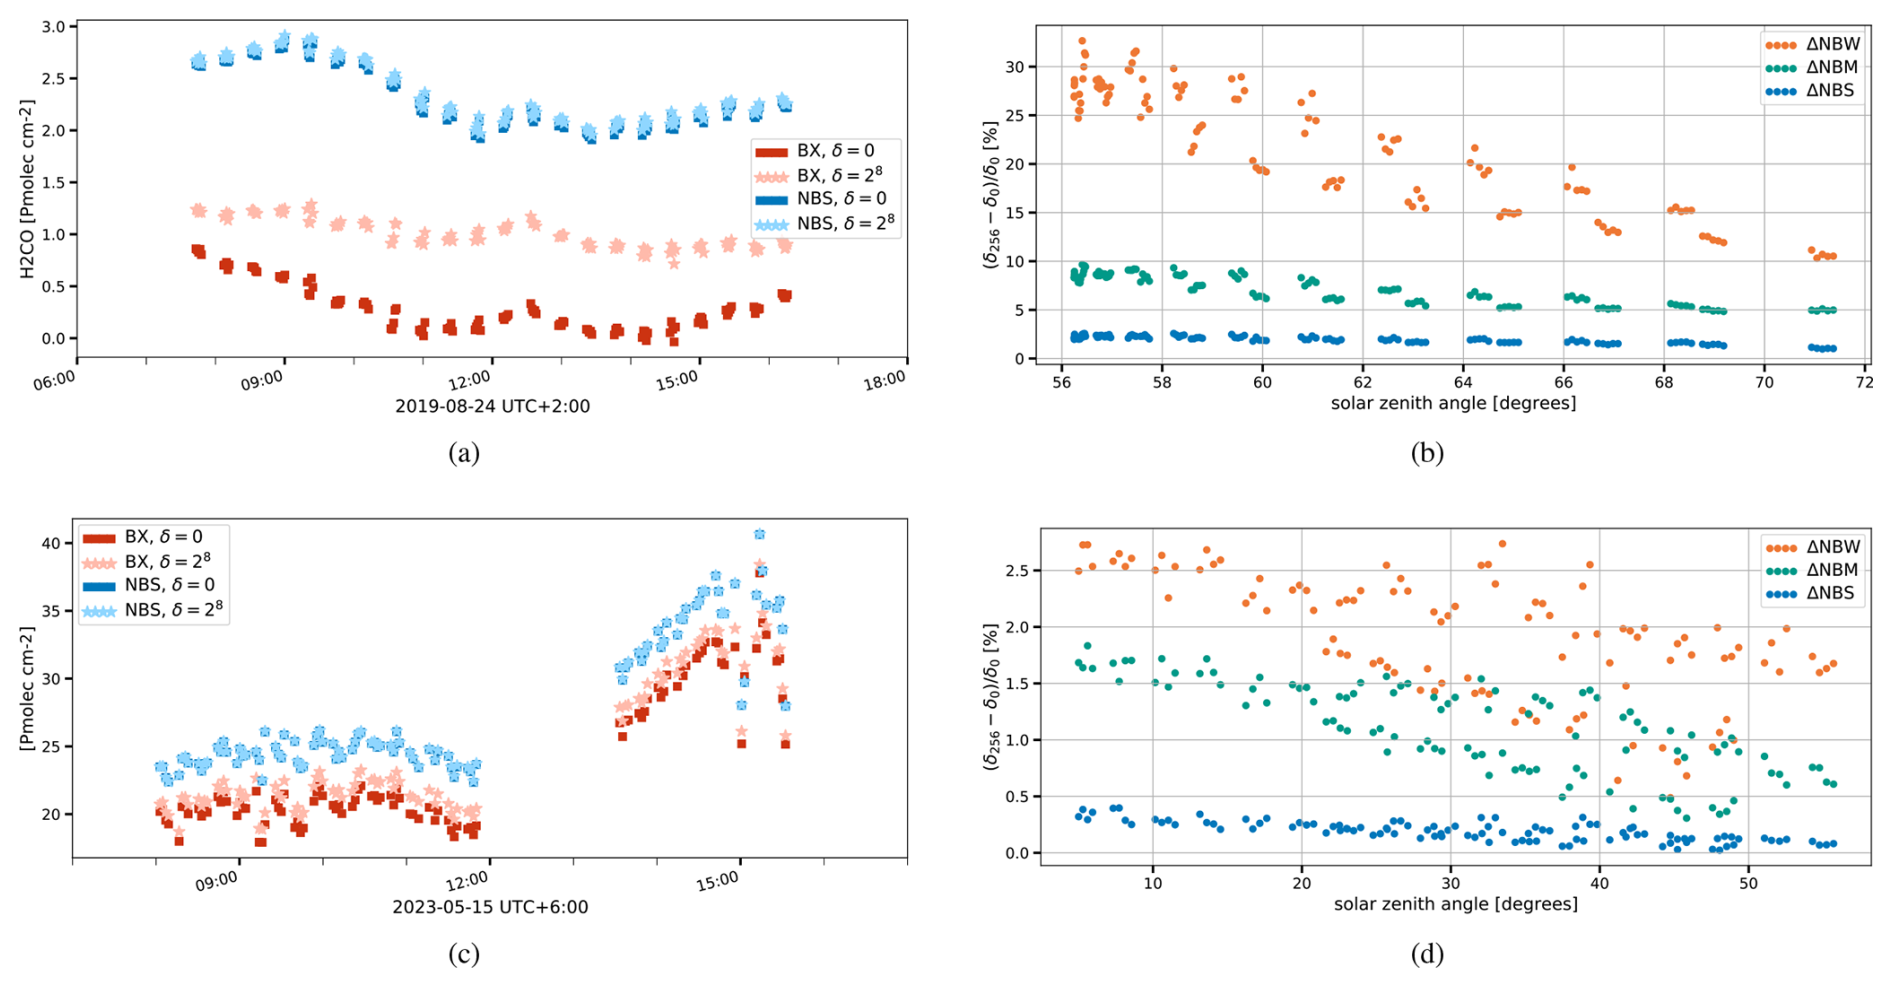
Figure 6Sensitivity study of the retrieval of formaldehyde during 1 d for Vertex70 at Sodankylä (a, b) or Kolkata (c, d), where the formaldehyde is retrieved from spectra obtained with either a BX (red) or Norton–Beer strong (NBS, blue), medium (NBM, green) or weak (NBW, orange) apodization and where either no points (δ=0) are removed or δ=28 points are removed. Panels (a) and (c) show the Vertex70 (BX and NBS) formaldehyde columns, while panels (b) and (d) show the relative column differences between the shortened and original interferograms for the three Norton–Beer apodizations.
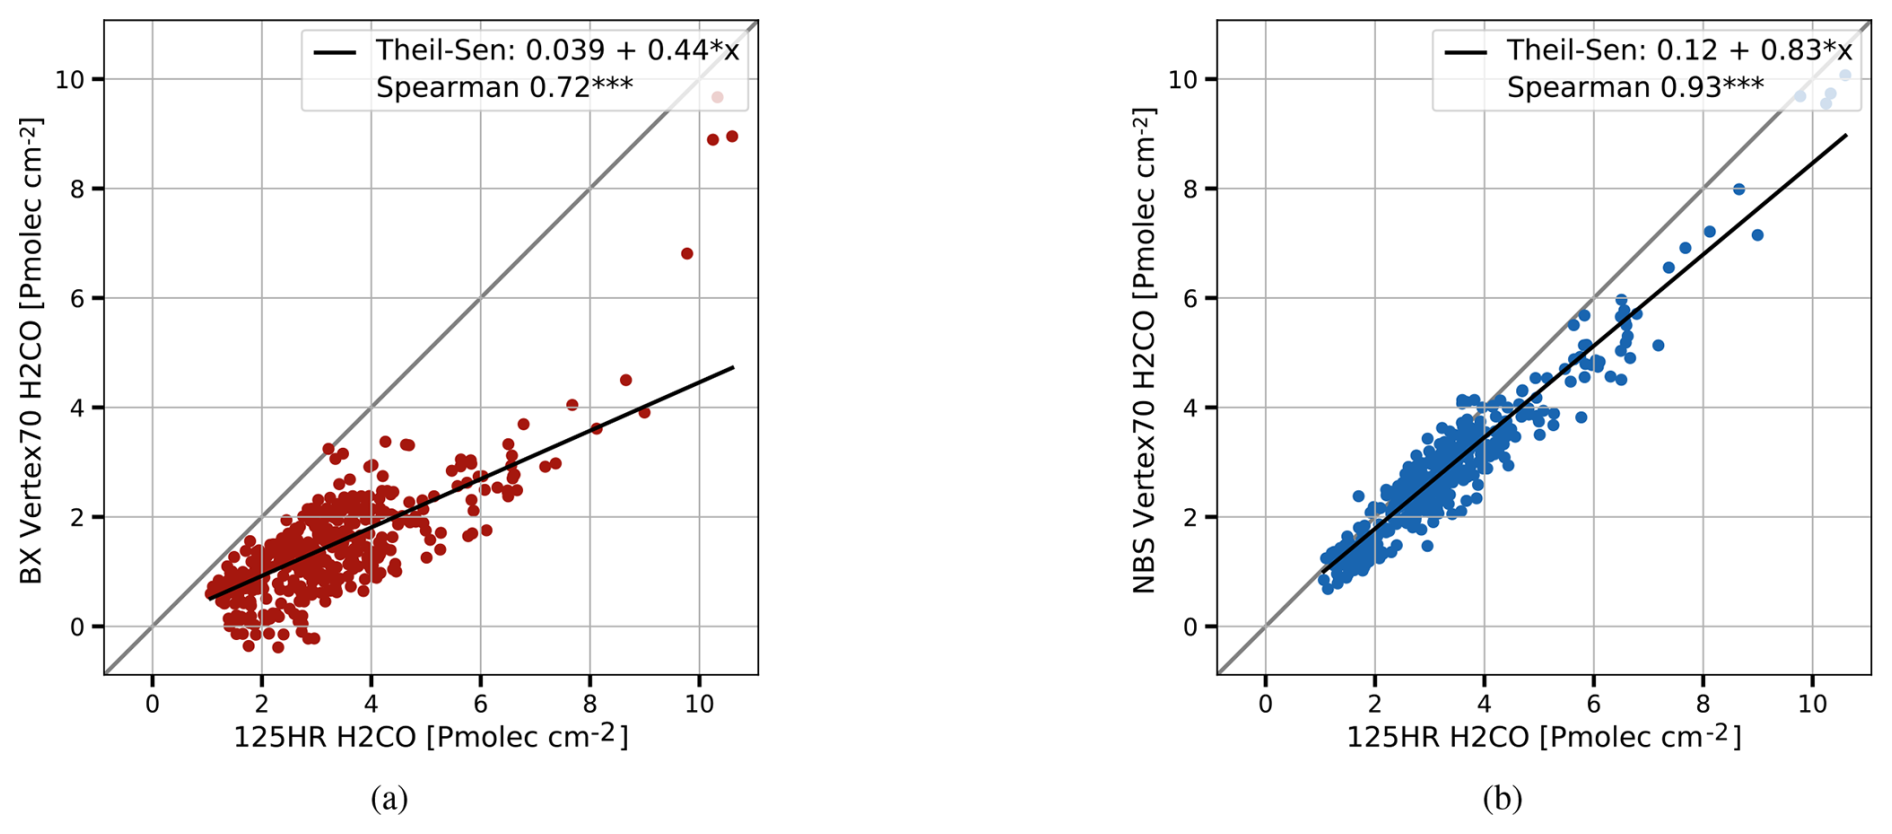
Figure 7Correlations for the formaldehyde columns using (a) boxcar and (b) Norton–Beer strong apodizations for the Vertex70 Sodankylä campaign data in 2019 compared to the NDACC 125HR observations, using coinciding measurements in 15 min averaged data.
Figure 6a and c show that the boxcar (BX) retrievals are strongly dependent on the number of points in the interferogram, while the Norton–Beer strong (NBS) apodized retrievals are (nearly) invariant. The formaldehyde retrieval windows (ranging between 2760 and 2785 cm−1) coincide with a beat from the pattern in Fig. 1b, which partly explains this strong dependence.
Figure 6b and d show that the column difference (shortened − unchanged) depends on the chosen strength of the apodization: for the clean site Sodankylä, the relative differences range from values of up to 30 % for NBW to 10 % for Norton–Beer medium (NBM) and below 5 % for NBS. The Sodankylä columns from the NBS-apodized spectra have a strongly reduced sensitivity to the number of points that becomes negligible when compared to the retrieval uncertainty budget. For the polluted site at Kolkata depicted in panels (c) and (d), the relative differences are much reduced but reveal the same pattern as for Sodankylä. Note also that Fig. 6 shows that both the perturbation in the number of points and the use of different apodizations propagate to different air-mass dependence effects in the differences of the formaldehyde columns. For Sodankylä the NBS apodization reduces the sensitivity to the interferogram size to well below the reported uncertainty and is therefore chosen for a comparison between the Sodankylä Vertex70 retrievals and the Sodankylä Bruker 125HR-retrieved columns that are publicly available from the NDACC rapid delivery database (Kivi et al., 2025). To quantify the bias and the correlation with the NDACC 125HR data, we have retrieved all of the Vertex70 FRM4GHG 2019 campaign spectra using BX and NBS apodizations. Figure 7 uses a 15 min average of the NDACC and Vertex70 retrievals, and only 15 min intervals that coincide are shown (Sha et al., 2024). The overall bias of the low-resolution and high-resolution (NDACC) retrieved columns decreases from approximately −55 % for the low-resolution columns retrieved from the BX-apodized spectra to −15 % for the low-resolution retrievals from the NBS-apodized spectra. Similarly, the correlation coefficient (Spearman, p value<0.01) between the low-resolution and high-resolution retrievals increases from 0.72 for the low-resolution BX retrievals to 0.93 for the low-resolution NBS retrievals.
The effect of apodization on the retrieval results does not contradict the conclusions of Amato et al. (1998), where it is shown that retrieval results are invariant under different apodizations if one takes into account that the measurement error in the spectral domain is no longer random noise after applying apodization. The retrieval software SFIT, typically used with high-resolution spectra, always considers the measurement error to be random noise and therefore produces different retrieval results after applying apodization. As mentioned in Amato et al. (1998), apodizing an interferogram reduces the higher-spectral-resolution information in the spectrum. For the case study considered in this paper, the formaldehyde columns obtained from the apodized low-resolution column agree better with the high-resolution data than with the non-apodized boxcar data, which shows that the information loss in the spectra is negligible compared to the inaccurate modeling of the leakage pattern in the retrieval scheme.
For completeness, it should be mentioned that the high-resolution NDACC retrievals are made from BX-apodized spectra. A robustness test as in Fig. 6 showed no significant dependence of the 125HR-retrieved columns on the interferogram size or the chosen apodization: all relative differences for the Sodankylä 125HR are below 0.1 %.
We have demonstrated that a shortening of an interferogram creates a perturbation in the leakage pattern that resembles a beat pattern in the difference of associated spectra. The amplitude of the beats is related to the energy of the signal in the truncated tail of the interferogram and is therefore larger for low-resolution interferograms. We have shown examples using idealized bandpass models and real measurements where the beats exceed the noise level in the out-of-band region. Retrieval software packages may not be accurate enough to model such small changes in the interferogram size due to rounding errors in the calculation of the leakage pattern. This was demonstrated with the retrieval of atmospheric formaldehyde columns from low-resolution measurements which turned out to be unstable if no appropriate apodization was used. In this case study we chose the strength of the apodization (e.g., Norton–Beer weak, medium or strong) such that the retrieved formaldehyde columns became stable under shortenings of the underlying interferograms in the sense that the retrieved column differences were within the estimated formaldehyde uncertainty budgets. The bias between the low- and high-resolution data decreased from −55 % if no apodization was applied to the low-resolution interferograms to −15 % if a NBS apodization was used. The correlation increased from 0.72 (no apodization) to 0.93 (NBS). The retrieved formaldehyde columns obtained from the high-resolution NDACC measurements were not significantly affected when changing the apodization.
There are many parameters that may influence the sensitivity to the spectrum leakage pattern of the retrieved trace gas product: the signal-to-noise ratio, the size of the microwindows, the concentration level of the retrieved gas or the spectral resolution of the measurements (the maximal optical path difference). We recommend that the interferogram length should be considered an important influence parameter in the development of a trace gas retrieval strategy for measurements from a lower-resolution FTIR interferometer. Different apodizations should be considered in stability tests of the retrieved trace gas products from shortened interferograms. We recommend that the selection of the final apodization strength is done such that the sensitivity to shortening becomes negligible compared to the typical retrieval uncertainty caused by the measurement noise and forward model uncertainties (such as spectroscopy or solar zenith angle); see Rodgers (2000).
SFIT4 (https://doi.org/10.18758/CLYG3EUO) (Hannigan et al., 2024) is a radiative transfer and atmospheric constituent profile retrieval algorithm for use with spectra recorded in solar absorption and emission across the infrared spectrum. The Sodankylä 125HR formaldehyde data (https://doi.org/10.60897/ndacc.sodankyla_ftir.h2co_fmi001_rd) (Kivi et al., 2025) used in this publication were obtained as part of the NDACC rapid delivery archive (https://ndacc.org, last access: 13 February 2025). The other data used in this publication can be provided upon request to the corresponding author.
BL wrote the paper and conducted the analysis and sensitivity studies. CV implemented the NDACC formaldehyde strategy for the Vertex70 low-resolution spectra and the presentation of the statistics in the 2019 Sodankylä time series. MDM, MKS, RK and PH contributed with the Vertex70 spectra from the FRM4GHG campaign in Sodankylä, together with RK and PH with the 125HR spectra from Sodankylä and MDM and MKS with the spectra from Kolkata. GKD and MT maintained and supported the instrument operations in Kolkata. MKS, FD and MZ contributed with valuable suggestions for understanding the cause of the beat patterns. All the authors read and agreed to the published version of the paper.
The contact author has declared that none of the authors has any competing interests.
Publisher's note: Copernicus Publications remains neutral with regard to jurisdictional claims made in the text, published maps, institutional affiliations, or any other geographical representation in this paper. While Copernicus Publications makes every effort to include appropriate place names, the final responsibility lies with the authors.
The authors thank Philippe Demoulin for useful discussions on the implementation details of the DFT at the Jungfraujoch station. Nicolas Kumps, Christian Hermans and Christof Petri operated and set up the instrument during the Sodankylä campaign.
This research has been supported by the Belgian Federal Science Policy Office (grant nos. ACTRIS-BE, TROVA and TROVA-E2) and the European Space Agency (grant nos. 4000132151/20/NL/FF/ab, 4000117640/16/I-LG and 4000136108/21/I-DT-lr).
This paper was edited by Helen Worden and reviewed by two anonymous referees.
Amato, U., Canditiis, D. D., and Serio, C.: Effect of apodization on the retrieval of geophysical parameters from Fourier-transform spectrometers, Appl. Optics, 37, 6537–6543, https://doi.org/10.1364/AO.37.006537, 1998. a, b
De Mazière, M., Thompson, A. M., Kurylo, M. J., Wild, J. D., Bernhard, G., Blumenstock, T., Braathen, G. O., Hannigan, J. W., Lambert, J.-C., Leblanc, T., McGee, T. J., Nedoluha, G., Petropavlovskikh, I., Seckmeyer, G., Simon, P. C., Steinbrecht, W., and Strahan, S. E.: The Network for the Detection of Atmospheric Composition Change (NDACC): history, status and perspectives, Atmos. Chem. Phys., 18, 4935–4964, https://doi.org/10.5194/acp-18-4935-2018, 2018. a
Forman, M. L., Steel, W. H., and Vanasse, G. A.: Correction of Asymmetric Interferograms Obtained in Fourier Spectroscopy, J. Opt. Soc. Am., 56, 59–63, https://doi.org/10.1364/JOSA.56.000059, 1966. a, b
Frey, M., Sha, M. K., Hase, F., Kiel, M., Blumenstock, T., Harig, R., Surawicz, G., Deutscher, N. M., Shiomi, K., Franklin, J. E., Bösch, H., Chen, J., Grutter, M., Ohyama, H., Sun, Y., Butz, A., Mengistu Tsidu, G., Ene, D., Wunch, D., Cao, Z., Garcia, O., Ramonet, M., Vogel, F., and Orphal, J.: Building the COllaborative Carbon Column Observing Network (COCCON): long-term stability and ensemble performance of the EM27/SUN Fourier transform spectrometer, Atmos. Meas. Tech., 12, 1513–1530, https://doi.org/10.5194/amt-12-1513-2019, 2019. a, b
Hannigan, J., Palm, M., Jones, N., Ortega, I., Langerock, B., Mahieu, E., Zhou, M., and Smale, D.: SFIT4 Line-by-line nonlinear spectral fitting software: version 1.0.21, https://doi.org/10.18758/CLYG3EUO, 2024. a, b
Herres, W. and Gronholz, J.: Understanding FT-IR data processing, Part 2: Details of the spectrum calculation, Intell. Instrum. Comput., Appl. Lab., 3, 10–19, 1985 a, b, c
Kivi, R. and Heikkinen, P.: Fourier transform spectrometer measurements of column CO2 at Sodankylä, Finland, Geosci. Instrum. Method. Data Syst., 5, 271–279, https://doi.org/10.5194/gi-5-271-2016, 2016. a
Kivi, R., Vigouroux, C., Heikkinen, P., and Langerock, B.: Formaldehyde (HCHO) RD groundbased remote sensing data from the FTIR instrument FMI001 at Sodankylä FMI-ARC, NDACC [data set], https://doi.org/10.60897/ndacc.sodankyla_ftir.h2co_fmi001_rd, 2025. a, b
McClellan, J., Schafer, R., and Yoder, M.: Digital Signal Processing First, Global Edition, Always Learning, Pearson, ISBN 9781292113869, 2016. a
Norton, R. H. and Beer, R.: New apodizing functions for Fourier spectrometry, J. Opt. Soc. Am., 66, 259–264, https://doi.org/10.1364/JOSA.66.000259, 1976. a
Norton, R. H. and Beer, R.: Errata: New Apodizing Functions For Fourier Spectrometry, J. Opt. Soc. Am., 67, 419–419, https://doi.org/10.1364/JOSA.67.000419, 1977. a
Ntokas, K. F. F., Ungermann, J., and Kaufmann, M.: Norton-Beer apodization and its Fourier transform, J. Opt. Soc. Am. A, 40, 2026–2033, https://doi.org/10.1364/JOSAA.501593, 2023. a
Pougatchev, N. S., Connor, B. J., and Rinsland, C. P.: Infrared measurements of the ozone vertical distribution above Kitt Peak, J. Geophys. Res.-Atmos., 100, 16689–16697, https://doi.org/10.1029/95JD01296, 1995. a
Rodgers, C. D.: Inverse Methods for Atmospheric Sounding: Theory and Practice (Series on Atmospheric Oceanic and Planetary Physics), World Scientific Publishing Company, ISBN 981022740X, 2000. a
Sha, M. K., De Mazière, M., Notholt, J., Blumenstock, T., Chen, H., Dehn, A., Griffith, D. W. T., Hase, F., Heikkinen, P., Hermans, C., Hoffmann, A., Huebner, M., Jones, N., Kivi, R., Langerock, B., Petri, C., Scolas, F., Tu, Q., and Weidmann, D.: Intercomparison of low- and high-resolution infrared spectrometers for ground-based solar remote sensing measurements of total column concentrations of CO2, CH4, and CO, Atmos. Meas. Tech., 13, 4791–4839, https://doi.org/10.5194/amt-13-4791-2020, 2020. a, b
Sha, M. K., De Mazière, M., Notholt, J., Blumenstock, T., Bogaert, P., Cardoen, P., Chen, H., Desmet, F., García, O., Griffith, D. W. T., Hase, F., Heikkinen, P., Herkommer, B., Hermans, C., Jones, N., Kivi, R., Kumps, N., Langerock, B., Macleod, N. A., Makkor, J., Markert, W., Petri, C., Tu, Q., Vigouroux, C., Weidmann, D., and Zhou, M.: Fiducial Reference Measurement for Greenhouse Gases (FRM4GHG), Remote Sens., 16, 3525, https://doi.org/10.3390/rs16183525, 2024. a, b, c
Vigouroux, C., Bauer Aquino, C. A., Bauwens, M., Becker, C., Blumenstock, T., De Mazière, M., García, O., Grutter, M., Guarin, C., Hannigan, J., Hase, F., Jones, N., Kivi, R., Koshelev, D., Langerock, B., Lutsch, E., Makarova, M., Metzger, J.-M., Müller, J.-F., Notholt, J., Ortega, I., Palm, M., Paton-Walsh, C., Poberovskii, A., Rettinger, M., Robinson, J., Smale, D., Stavrakou, T., Stremme, W., Strong, K., Sussmann, R., Té, Y., and Toon, G.: NDACC harmonized formaldehyde time series from 21 FTIR stations covering a wide range of column abundances, Atmos. Meas. Tech., 11, 5049–5073, https://doi.org/10.5194/amt-11-5049-2018, 2018. a, b
Wunch, D., Toon, G. C., Sherlock, V., Deutscher, N. M., Liu, C., Feist, D. G., and Wennberg, P. O.: The Total Carbon Column Observing Network's GGG2014 Data Version, Tech. rep., Carbon Dioxide Information Analysis Center, Oak Ridge National Laboratory, Oak Ridge, Tennessee, USA, https://doi.org/10.14291/tccon.ggg2014.documentation.R0/1221662, 2015. a
The time difference corresponds to the path difference divided by the speed of light.
- Abstract
- Introduction
- The Dirichlet kernel explains the beat pattern
- Apodization
- Case study: formaldehyde retrievals from low-resolution solar absorption spectra
- Conclusions
- Code and data availability
- Author contributions
- Competing interests
- Disclaimer
- Acknowledgements
- Financial support
- Review statement
- References