the Creative Commons Attribution 4.0 License.
the Creative Commons Attribution 4.0 License.
 | 07 Jul 2025
Maximizing the scientific application of Pandora column observations of HCHO and NO2
James H. Crawford
Katherine R. Travis
Laura M. Judd
Mary Angelique G. Demetillo
Lukas C. Valin
James J. Szykman
Andrew Whitehill
Eric Baumann
Thomas F. Hanisco
As part of the Pandonia Global Network (PGN), Pandora spectrometers are widely deployed around the world. These ground-based remote-sensing instruments are federated such that they employ a common algorithm and data protocol for reporting on trace gas column densities and lower-atmospheric profiles using two modes based on direct-sun and sky-scan observations. To aid users in the analysis of Pandora observations, the PGN standard quality flagging procedure assigns flags to the data indicating high, medium, and low quality. This work assesses the suitability of these data quality flags for filtering data in the scientific analysis of formaldehyde (HCHO) and nitrogen dioxide (NO2), two critical precursors controlling tropospheric ozone production. Pandora data flagged as high quality assure scientifically valid data and are often more abundant for direct-sun NO2 columns. For direct-sun HCHO and for sky-scan observations of both molecules, large amounts of data flagged as low quality also appear to be valid. Upon closer inspection of the data, independent uncertainty is shown to be a better indicator of data quality than the standard quality flags. After applying a filter to independent uncertainty, Pandora data flagged as medium or low quality in both modes can be demonstrated to be scientifically useful. The utility of this filtering method is demonstrated by correlating contemporaneous but independent direct-sun and sky-scan observations. When evaluated across 15 Pandora sites in North America, this new filtering method can recover as much as 90 % of data that would have previously been discarded. This method suggests that standard PGN criteria for atmospheric variability and the normalized root mean squared error are too stringent, as they are responsible for downgrading most of the recovered data. A method is also developed for combining the direct-sun and sky-scan observations into a single dataset by accounting for biases between the two observing modes and differences in measurement integration times. These combined data provide a more continuous record that is useful for interpreting Pandora observations against other independent variables such as hourly observations of surface ozone. When Pandora HCHO columns are correlated with surface ozone measurements, data filtered by independent uncertainty exhibit similarly strong and more robust relationships than high-quality data alone. These results suggest that Pandora data users should carefully assess data across all quality flags and consider their potential for useful application to scientific analysis. The present study provides a method for maximizing use of Pandora data with the expectation of more robust satellite validation and comparisons with ground-based observations in support of air quality studies.
- Article
(9325 KB) - Full-text XML
-
Supplement
(1875 KB) - BibTeX
- EndNote


The Pandora spectrometer is a ground-based ultraviolet–visible (UV-VIS) remote-sensing instrument utilized to validate space-based UV-VIS sensors and understand local air quality (Herman et al., 2009, 2019; Wang et al., 2010; Spinei et al., 2018; Tzortziou et al., 2012; Szykman et al., 2019; Judd et al., 2019; Verhoelst et al., 2021; Di Bernardino et al., 2023). The Pandora instrument was developed to observe column nitrogen dioxide (NO2) in direct-sun mode, in addition to the more traditional sky-scan observations obtained using multi-axis differential optical absorption spectroscopy (MAX-DOAS). Once calibrated, direct-sun observations are less impacted by atmospheric parameters that influence the air mass factor (AMF) and that also cause uncertainty in space-based retrievals, such as the vertical gas profile or surface albedo (Cede et al., 2006; Herman et al., 2009). More recently, Pandora instrument retrievals of column formaldehyde (HCHO) have become available, expanding opportunities to evaluate the importance of both nitrogen oxides (NOx) and volatile organic compounds (VOCs) as precursors of ozone and secondary aerosol. This was enabled by the removal of instrument components made of Delrin, which were discovered to outgas HCHO and interfere in its detection (Spinei et al., 2021).
The Pandonia Global Network (PGN) is a NASA- and ESA-sponsored ground-based network of Pandora spectrometers supporting in situ and remotely sensed air quality monitoring and satellite validation activities (https://www.pandonia-global-network.org, last access: 27 February 2025). The major advantages of the PGN are uniform instrument design, homogeneous calibrations, centralized data monitoring and processing, and real-time data distribution (Herman et al., 2009, 2018, 2019; Spinei et al., 2018; Cede, 2024). Pandora instruments are calibrated by the NASA Goddard Space Flight Center and deployed to local operators around the world who have joined the PGN. Consistent retrievals across the network are performed by LuftBlick Earth Observation Technologies and are hosted on the PGN website (Cede, 2024). Presently, there are more than 130 Pandora instruments worldwide and over 60 across the USA (Szykman et al., 2019; Chang et al., 2022).
Pandora instruments have provided valuable information on NO2 retrieval biases from the polar-orbiting Sentinel-5P TROPOspheric Monitoring Instrument (TROPOMI) (Judd et al., 2020; Verhoelst et al., 2021; Park et al., 2022; Ialongo et al., 2020) and the Ozone Monitoring Instrument (OMI) (Tzortziou et al., 2012; Reed et al., 2015; Herman et al., 2019). The high temporal availability of Pandora data has allowed for deep investigation of local meteorology using column NO2 and has shown how well that is captured by air quality models (Goldberg et al., 2017; Choi et al., 2020; Tzortziou et al., 2022, 2023; Wang et al., 2023; Adams et al., 2023). The relatively new formaldehyde retrievals from Pandora (Spinei et al., 2018, 2021; Cede et al., 2025) are beginning to be incorporated into model and satellite validation efforts (Herman et al., 2018) and show promise for the characterization of the local ozone photochemical environment (Schroeder et al., 2016; Travis et al., 2022).
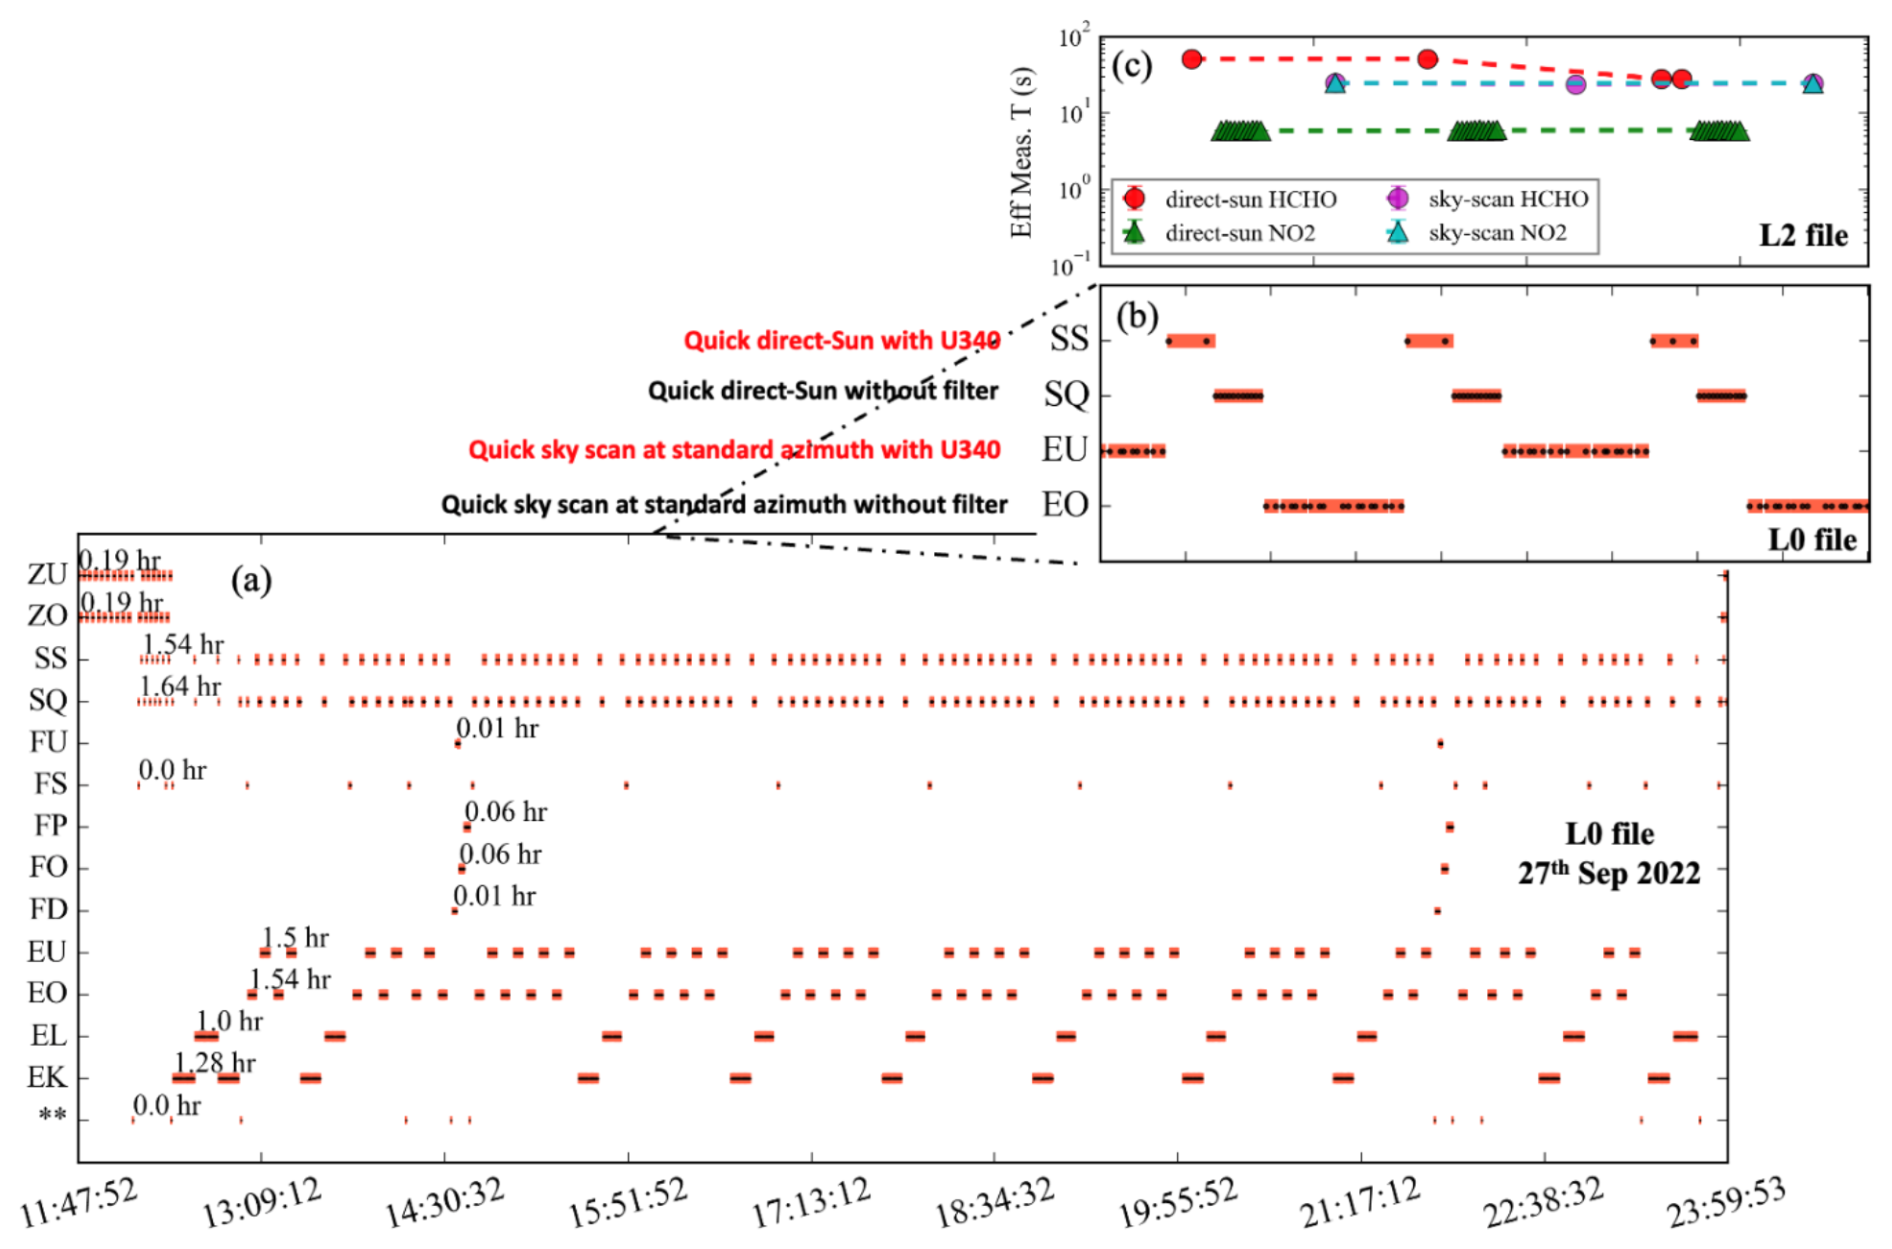
Figure 2(a) Pandora standard schedule of operations (UTC hour) on a clear-sky day, 27 September 2022, at the University of Houston site for different observing modes with a zoomed-in 18 min window for both L0 (b) and L2 (c) file information. The black points in the L0 schedule show the start of each measurement time, and the underlying red line is the total time in the respective mode. The L2 data (c) show the alternating retrieval of NO2 (without filter) and HCHO (with the U340 filter) column from direct-sun and sky-scan modes.
Geostationary satellite observations provide a new challenge in interpreting NO2 and HCHO columns at unprecedented spatial and temporal scales (Kim et al., 2017; Judd et al., 2018). Pandora instruments will be the main source of validation data for both NO2 and HCHO columns for the Tropospheric Emissions: Monitoring of Pollution (TEMPO) geostationary air quality satellite launched over the USA in 2023 (Szykman and Liu, 2023; Zoogman et al., 2017). Pandora instruments are also being used to validate the Geostationary Environmental Monitoring Spectrometer (GEMS) satellite retrievals over East Asia (Kim et al., 2023). Given the growing need for Pandora data to support satellite observations and model development, improved methods for ensuring data availability and quality are needed. In this work, a data filtering method is presented for assessing the suitability of HCHO and NO2 column data beyond the standard quality flags provided by PGN. This method takes advantage of the independent but contemporaneous measurement modes of Pandora operation (direct sun and sky scan) to analyze Pandora data quality and maximize the availability of data for scientific application. The method presented here is but one approach to examine Pandora data quality. The user community should continue to carefully consider how to best ensure data quality while preserving the most data possible.
2.1 Pandora measurements and data retrieval
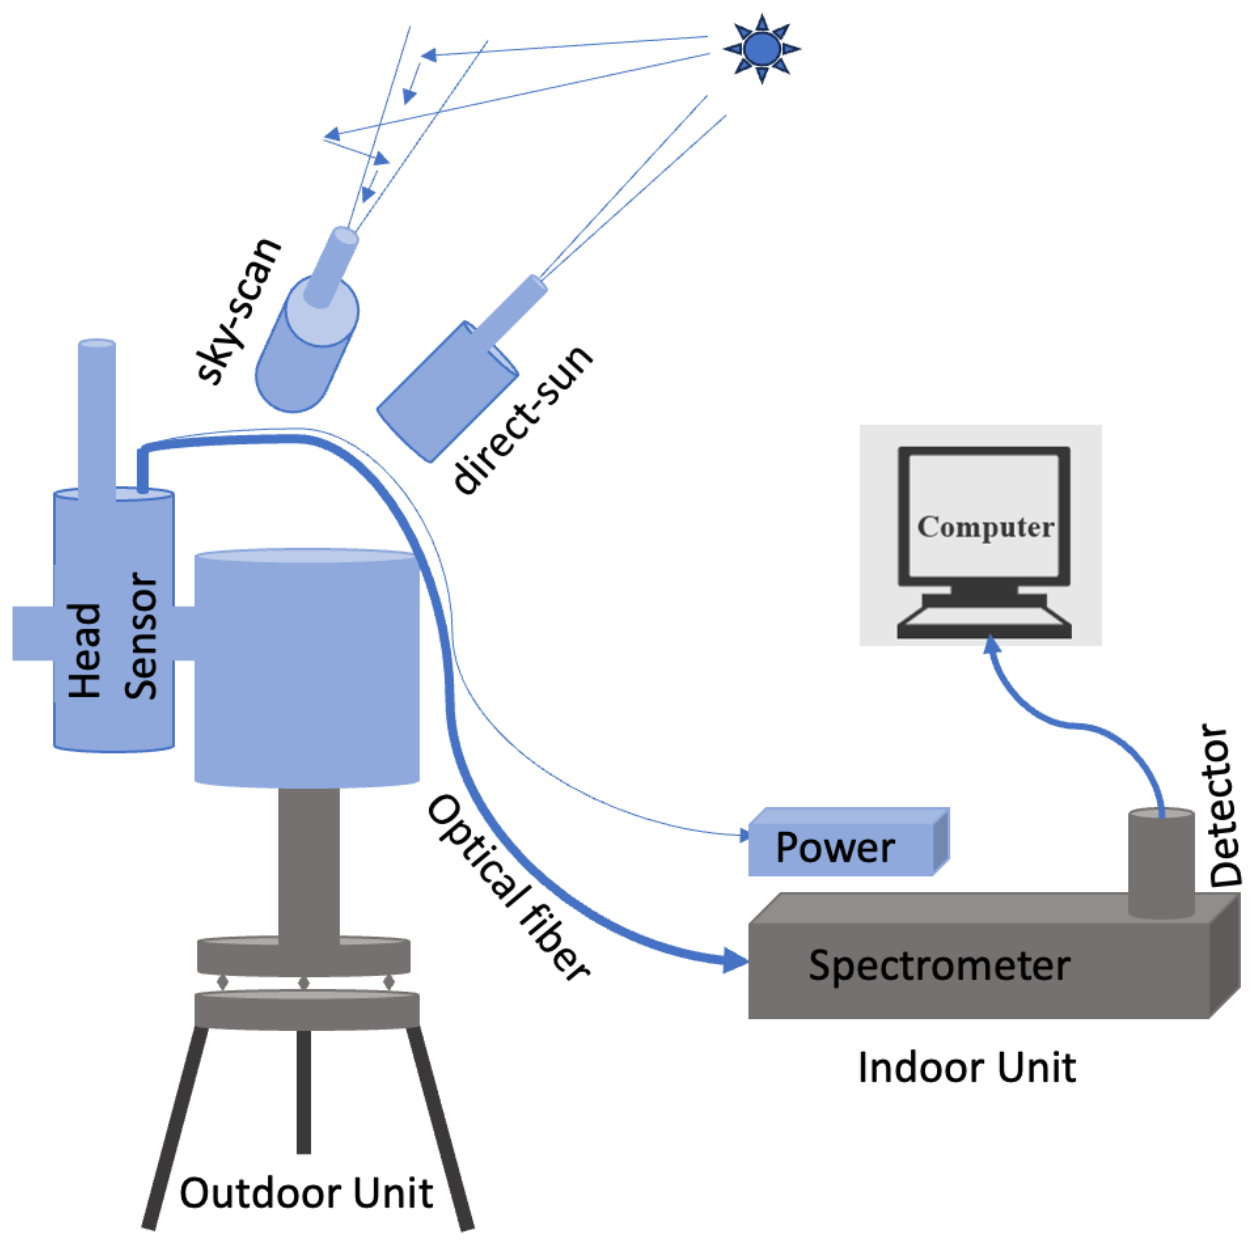
The Pandora spectrometer is an instrument for ground-based remote sensing of a range of trace gases, including NO2, HCHO, O3, and SO2, with a temporal resolution on the order of seconds to minutes. Pandora is a passive UV-VIS spectrometer system equipped with a responsive sun tracker that points the optical head sensor at the sun or sky with a spatial accuracy of up to ±0.1°. A basic description of the Pandora instrument is summarized here, with additional details provided in Sect. S1.1 in the Supplement and available in Cede et al. (2024). Briefly, light is transmitted through fiber optical cables to a UV-VIS low stray-light spectrometer (Herman et al., 2009; Tzortziou et al., 2012). The spectrometer covers a spectral range of 280–530 nm with a spectral resolution of 0.6 nm. To minimize the dark-current noise, the spectrometer is maintained at a stable temperature of 15–20 °C (based on the site location) using a thermal electrical cooler. The Pandora spectrometer operates in two daytime viewing geometries, namely, direct sun (DS) and scattered sunlight or sky scan (SS) (Fig. 1), with varying degrees of temporal resolution spanning from milliseconds to minutes depending on the mode of operation.
The Pandora retrieval involves several sequential steps or data processing levels that are all archived by PGN. Raw measurement spectra are archived as L0. L1 data include corrections for instrumental characteristics such as dark signal, nonlinearity, flat field, temperature sensitivity, simple stray-light removal, and wavelength corrections. L2Fit data include spectral fitting, which enables the calculation of slant columns relative to the reference spectrum employing DOAS analysis (Herman et al., 2009; Cede et al., 2022; Gebetsberger and Tiefengraber, 2023). L2 data result from the conversion of slant columns to vertical columns utilizing geometrical AMFs for direct-sun and analytical methods for sky-scan observations. Sky-scan observations also include profile and surface concentrations. These products are briefly described in Sect. S1.1. The reported accuracy of the DS total vertical column of NO2 is (0.1 Dobson unit, where ), with a precision of (0.01 DU) (Herman et al., 2009). For HCHO DS, a small statistical error up to 6 % and a notable systematic error up to 26 % have been reported (Spinei et al., 2018, 2021), while the recent Pandora Delrin-free instruments require more assessment to quantify accuracy and precision. The Pandora SS measurements still lack robust validation; however, the CINDI-2 intercomparison included a Pandora (called a NASA instrument) instrument and reported a bias for measurements in the SS mode of about for the HCHO column and about for the NO2 column against the median of the participating instruments (Tirpitz et al., 2021; Verhoelst et al., 2021). Additional details on current Pandora software, recent hardware changes, and the retrieval scheme are discussed in Sect. S1.1.
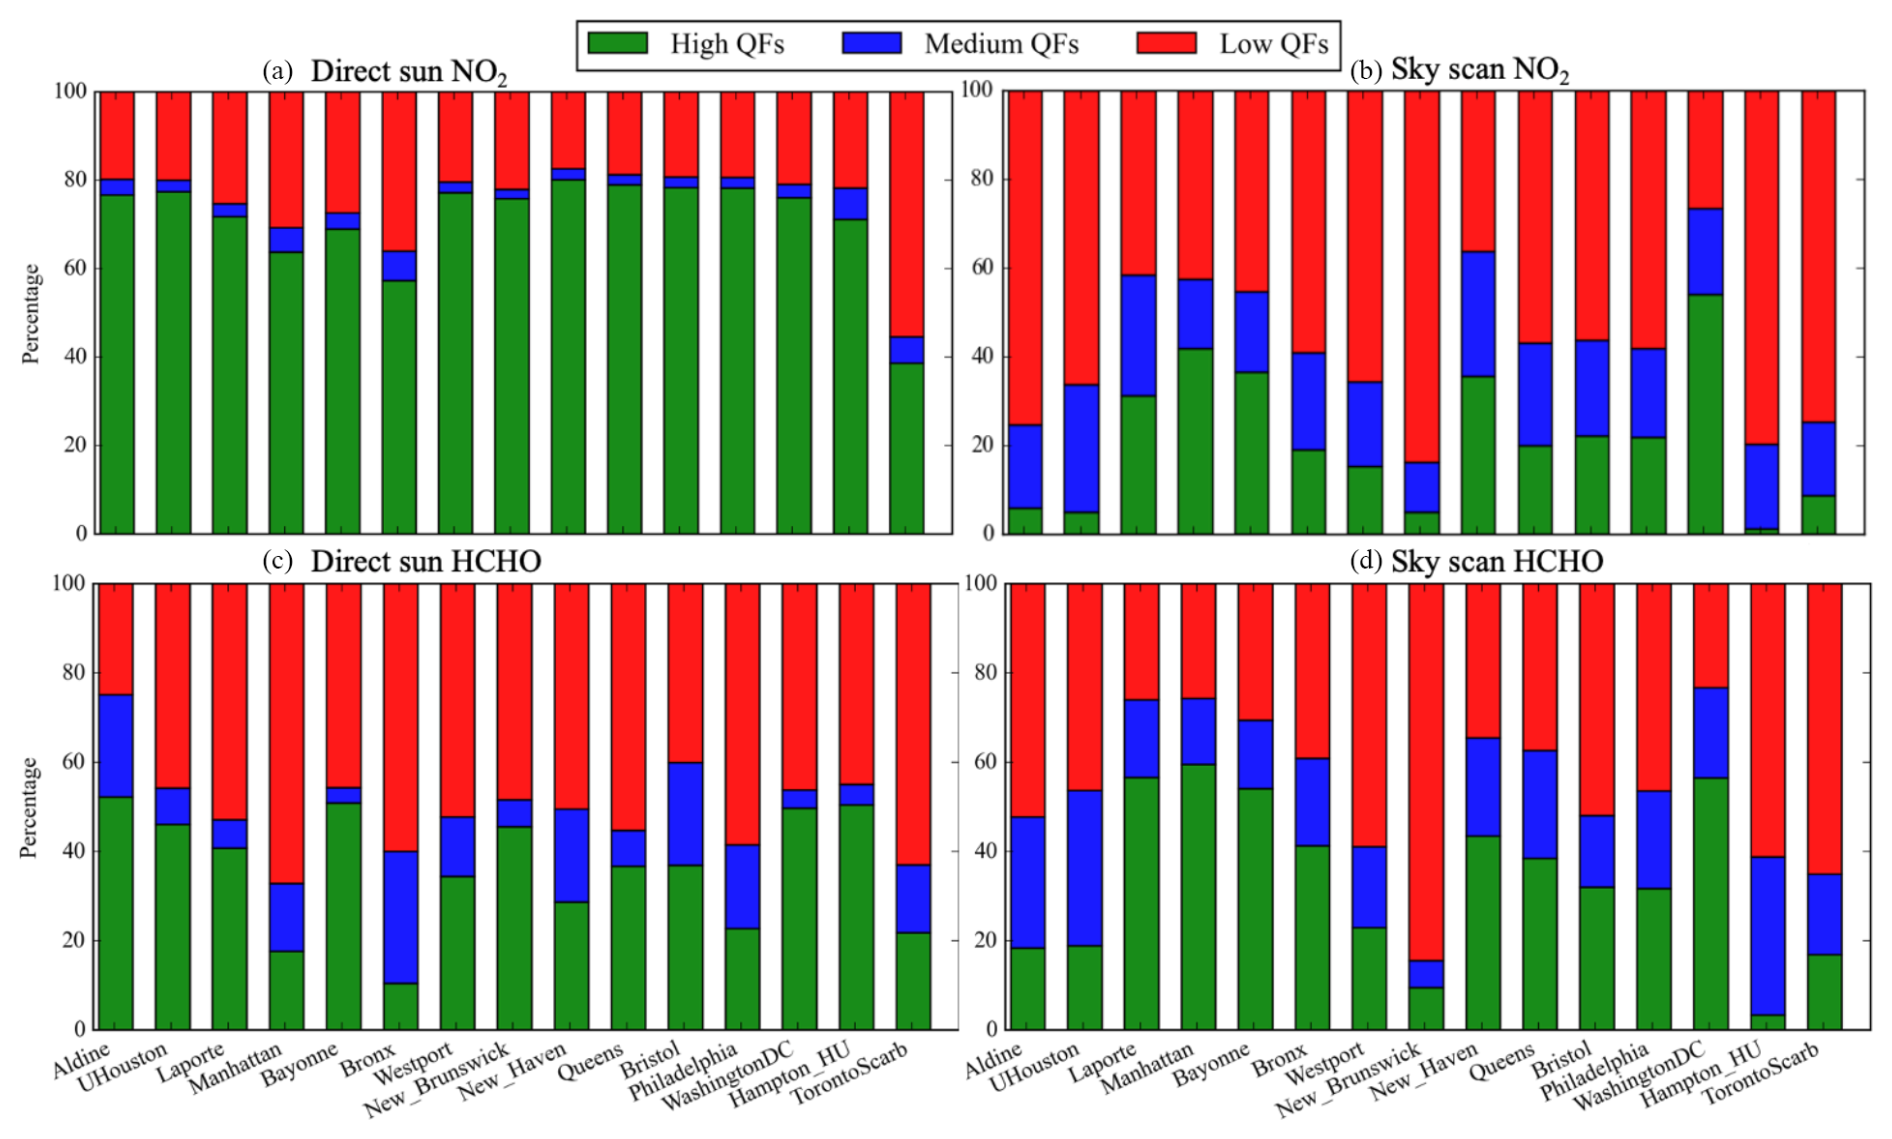
Figure 3Percentage contribution of high- (0, 10), medium- (1, 11), and low- (2, 12) quality flags for 15 Pandora sites for observations in both DS (a, c) and SS (b, d) modes during 2021–2022. Percentage contributions are shown for NO2 in the top panels and HCHO in the bottom panels.
2.2 Pandora observational schedule
Pandora instruments are locally operated and mainly run on the standard schedule alternating between DS and SS mode, although there is an option for user-defined schedules. The DS and SS modes also alternate between an open (unfiltered) mode for NO2 and a U340 (filtered for maximum transmission near 340 nm) mode for HCHO observations (Cede et al., 2024; Spinei et al., 2018). A typical example of the standard Pandora schedule on a clear-sky day is shown in Fig. 2a, with the typical total hours per day for each routine annotated. Typically, Pandora spends about 1.5 h each day in DS NO2 (SQ) and DS HCHO (SS, not to be confused with “sky-scan”, refers to the quick direct-sun scan using the U340 filter; see Sect. S1.2) modes and about 1.5 h each day in SS mode for lower-tropospheric columns of NO2 and HCHO (EO, which refers to the quick elevation scan with the open filter) and HCHO only (EU, which refers to the quick elevation scan with the U340 filter). Longer, more detailed sky scanning (EL, which refers to the detailed elevation scan with U340 filter, or EK, which refers to the detailed elevation scan with the open filter; see Sect. S1.2) occurs for a total of about 1–2 h for profile observations. Find sun (FS) routines occur throughout the day but only take a short time (a few seconds) over the course of each hour. Typically, Pandora spends 65 % of the time in SS mode and 30 % in DS mode under clear-sky conditions. Further details of all Pandora routine acronyms are described in Sect. S1.2 in the Supplement and in the Pandora user manual (Cede et al., 2024). The inset panels in Fig. 2b and c provide a closer view of the schedule for an 18 min window as the instrument switches between DS and SS modes. The varying effective measurement times (teff) illustrate the observation frequency for each mode and product. Generally, the Pandora instrument possesses the ability to capture solar spectra at adjustable integration times ranging from 2.5 ms to 4 s, with an overall measurement duration of approximately 40 s, encompassing a few dark-current measurements (Cede et al., 2024). The integration time for DS NO2 (with no filter) under bright sun is about 4 ms, and roughly 4000 spectra are acquired repeatedly and averaged to obtain very high signal-to-noise ratios with high precision (Herman et al., 2018). For DS HCHO (with the U340 filter), a longer integration time (30–1000 ms) is used; hence, there are fewer measurements for HCHO compared to NO2. Typically, in the DS mode, there are about 5 times more observations of NO2 compared to those of the HCHO column per scan (Fig. 2c). In the SS mode, elevation scans are most effective when taken along an azimuth pointing away from the sun to minimize the effect of scattering. The zenith angle scans can vary by site, with the lowest scan typically occurring between 89° and 85° depending on viewing conditions available at the site to the highest zenith angle (0°), which is utilized as the reference during the spectral fitting (details of different zenith angles are provided in Sect. S1.2). The extended SS measurements are taken at multiple zenith angles (Sect. S1.2) to derive lower-tropospheric columns and profiles typically up to 2–4 km.
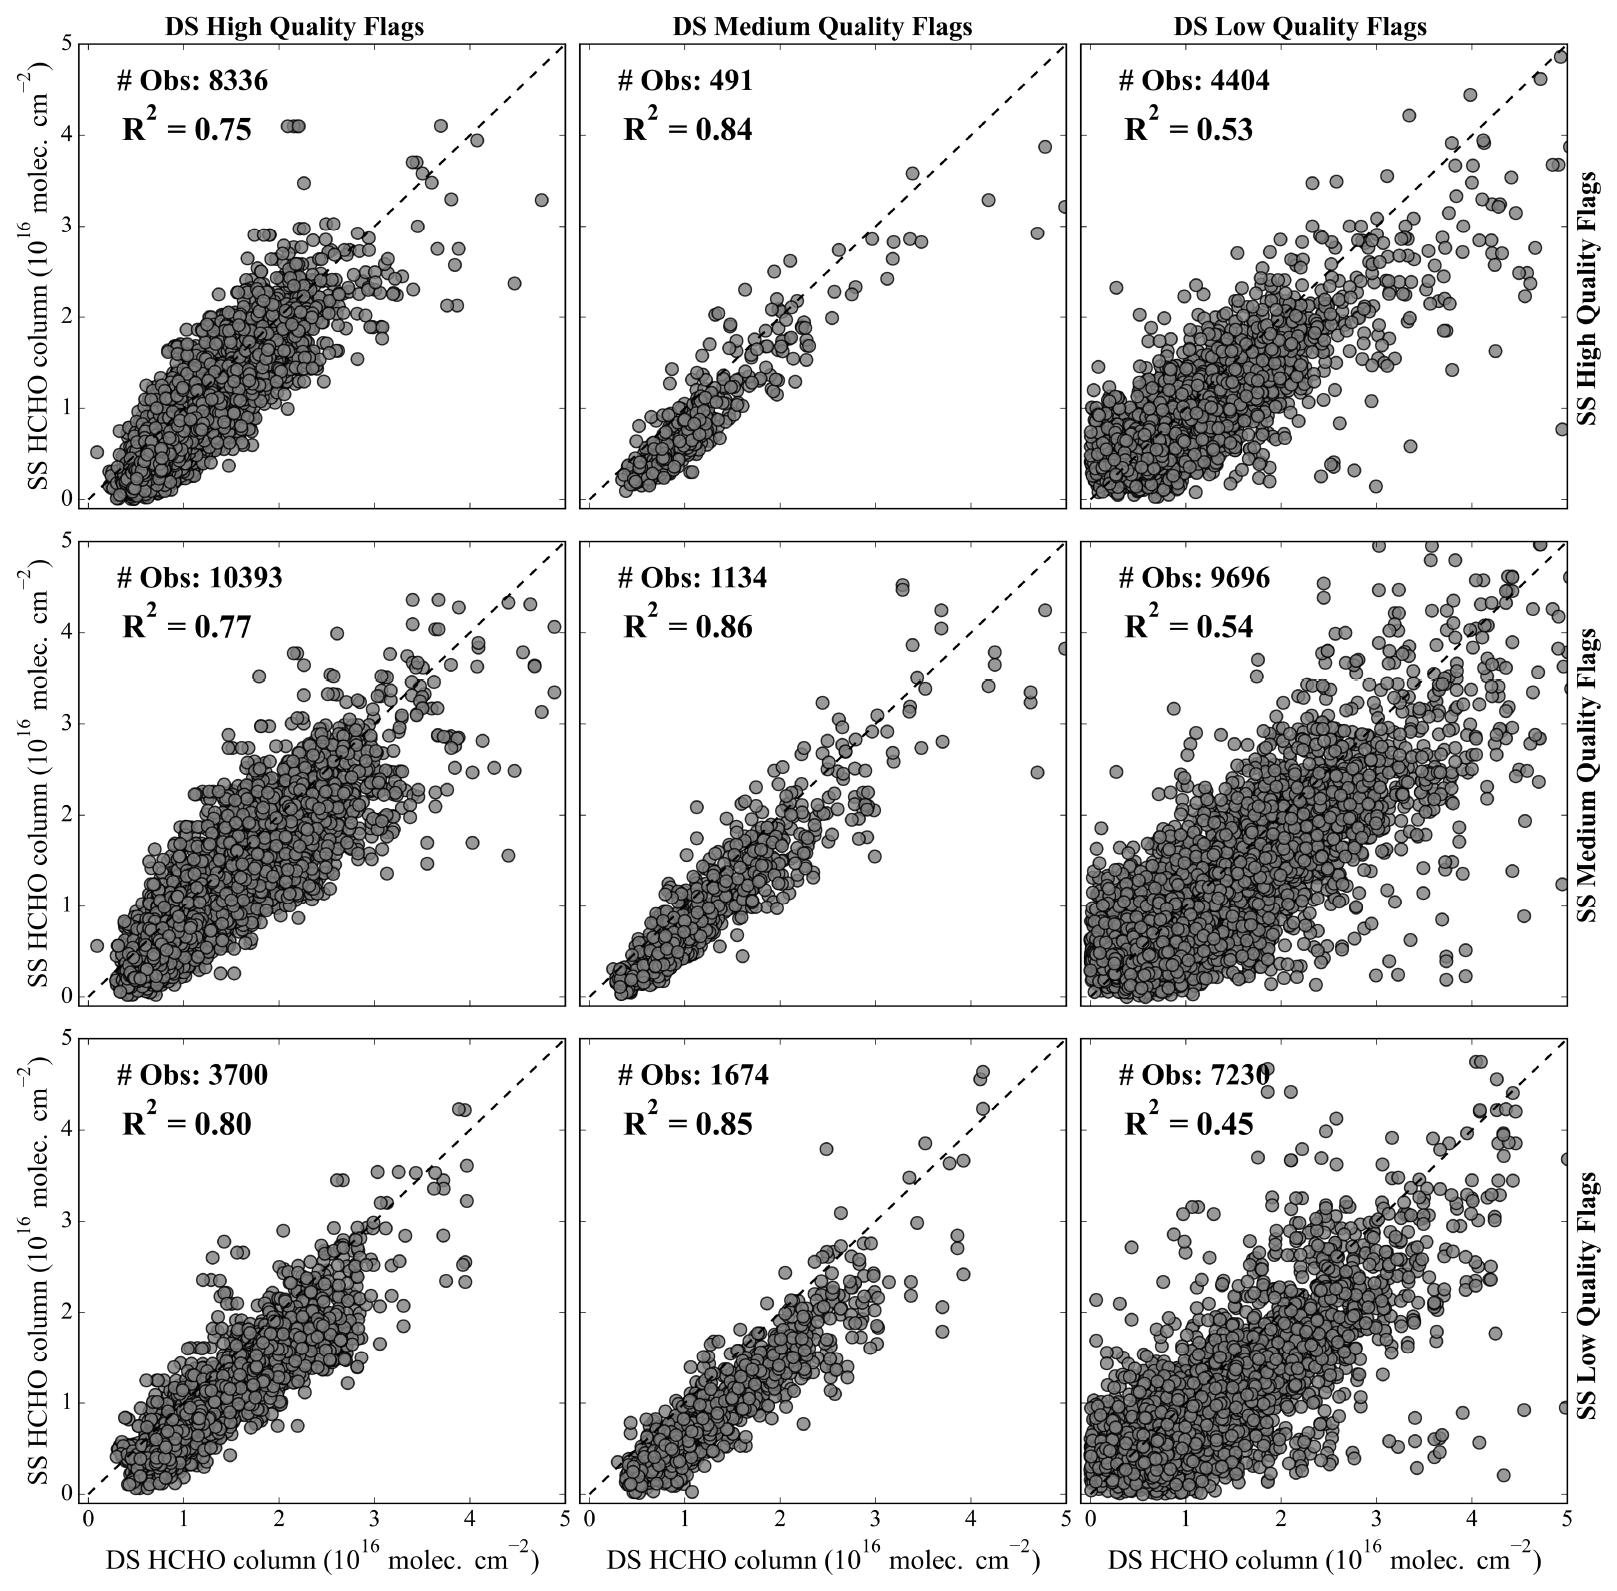
Figure 4Correlation between contemporaneous DS and SS observations of the HCHO column for different quality flag combinations. Data are from the University of Houston Pandora site over 2 years (2021–2022).
The PGN software suite performs retrievals for NO2 and HCHO and provides a measure of data quality to guide users (Cede et al., 2024, 2025). Reduced data quality can arise from instrumental and/or atmospheric sources. Data flags provide information on both the data quality and data assurance level (Gebetsberger et al., 2022). Data quality is indicated in the units position, with a 0, 1, or 2 indicating high, medium, and low quality, respectively. While data that are preliminary but not yet quality assured are useable for science, this status is indicated by a 1 in the tens position. Data that are unusable for whatever reason are indicated by a 2 in the tens position. Thus, data flagged as 0 or 10 are considered useable and of high quality, and users are cautioned to pay additional scrutiny to data flagged as 1 or 11 (medium quality). In contrast, users are discouraged from using any data flagged as 2 or 12 (low quality). These quality flags are assigned in various stages from L1 (raw data) to L2fit (spectral fit data) to L2 (processed data) to ensure data quality through multiple checks at each stage. At the L1 stage, data are flagged into either low- or medium-quality bins based on instrument-related issues such as excessive dark counts, detector saturation, a dark count that differs significantly from the dark map for too many pixels, different effective temperature, and unsuccessful dark-background fitting. In the L2fit stage, where spectral fitting is performed, data are further flagged based on factors including the quality of the fit, the wrms limit (normalized root mean square of fitting residuals weighted with independent uncertainty), and wavelength shift. Finally, at the final retrieval L2 stage, factors including retrieval error and atmospheric variability are used to flag data into the medium- or low-quality groups. More description of the data quality flags is provided in Gebetsberger et al. (2022).
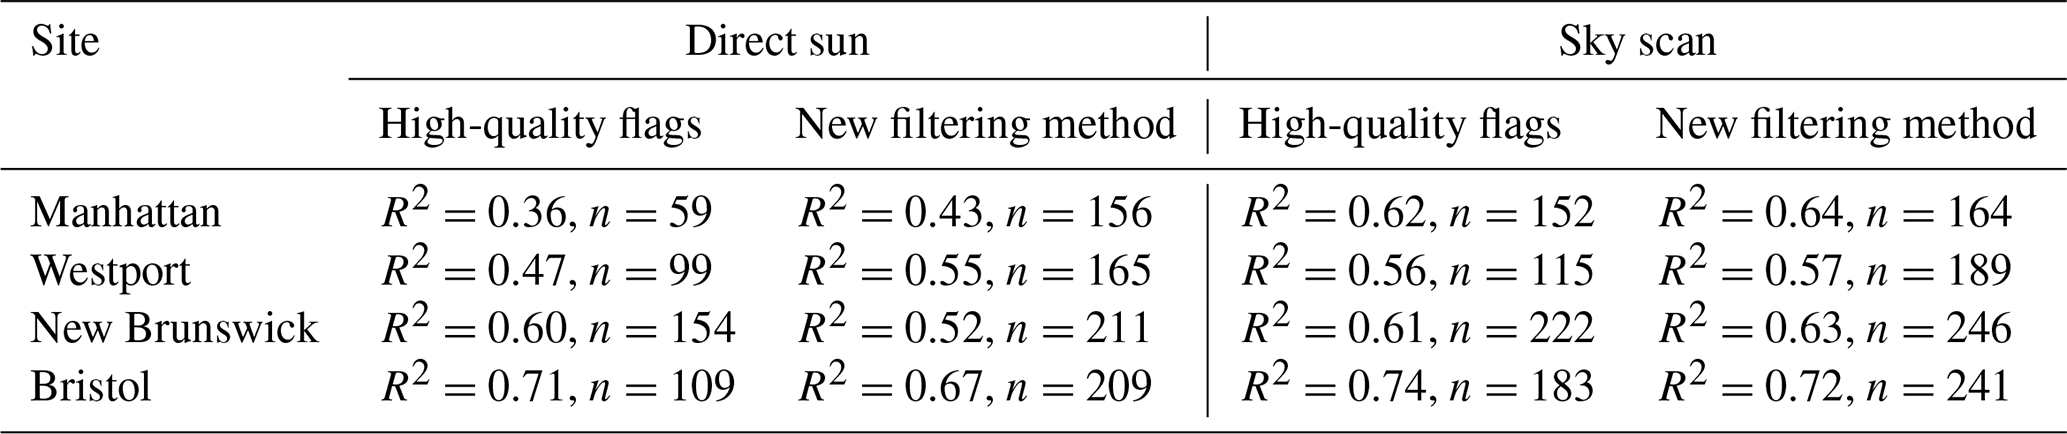
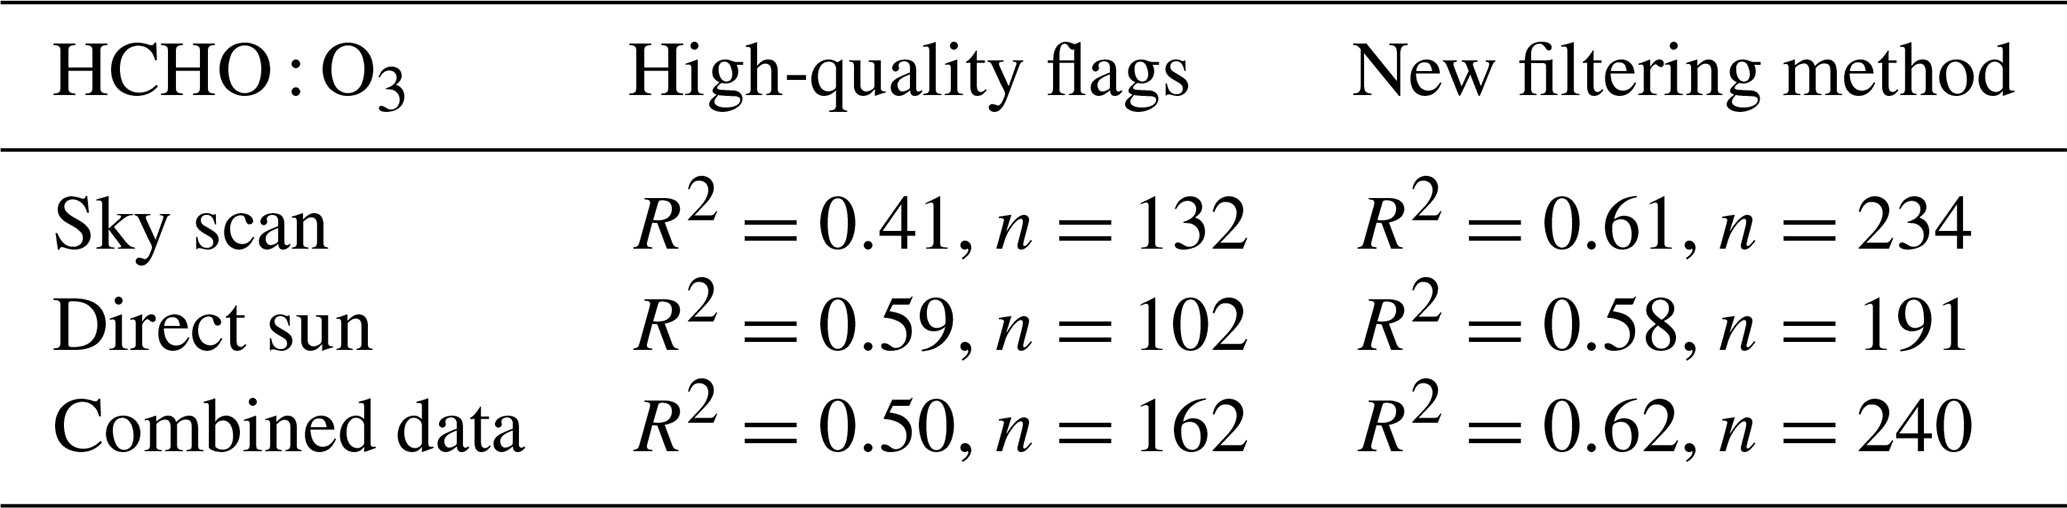
Table 1Correlations (R2) between hourly surface ozone and HCHO observations from direct sun and sky scan for high-quality data flags alone and for data using the new filtering method. The analysis is for four Pandora sites during September 2022. Each site is located near (within 500 m of) an ozone monitoring instrument. The number (n) is the available hourly matchups for each site.
Following the suggestion of the Pandora user manual (Cede et al., 2024, 2025), many previous studies with Pandora v1.8 data utilize only high-quality data (0, 10) (e.g., Park et al., 2022; Verhoelst et al., 2021; Liu et al., 2023). However, when using only high-quality-flagged data, a large fraction of observations is often eliminated. Figure 3 shows quality flag statistics across the 15 Pandora sites evaluated in this study (listed in Table S1 in the Supplement). They have been selected since they fall under recent NASA airborne campaigns that covered areas of the eastern USA and Houston, TX. These are the Tracking Aerosol Convection Interactions Experiment – Air Quality (TRACER-AQ) in 2021, the Student Airborne Research Program (SARP-East) in 2023, and the Synergistic TEMPO Air Quality Science (STAQS) study in 2023. Across these sites, high-quality-data flags dominate only for DS NO2 observations during the 2021–2022 period, typically being between 60 % and 80 %. For other observations, low-quality-data flags often dominate, on average accounting for 57 %, 45 %, and 46 % of data for SS NO2, DS HCHO, and SS HCHO, respectively, across the evaluated sites, making much of the data unavailable to support field campaign analysis.
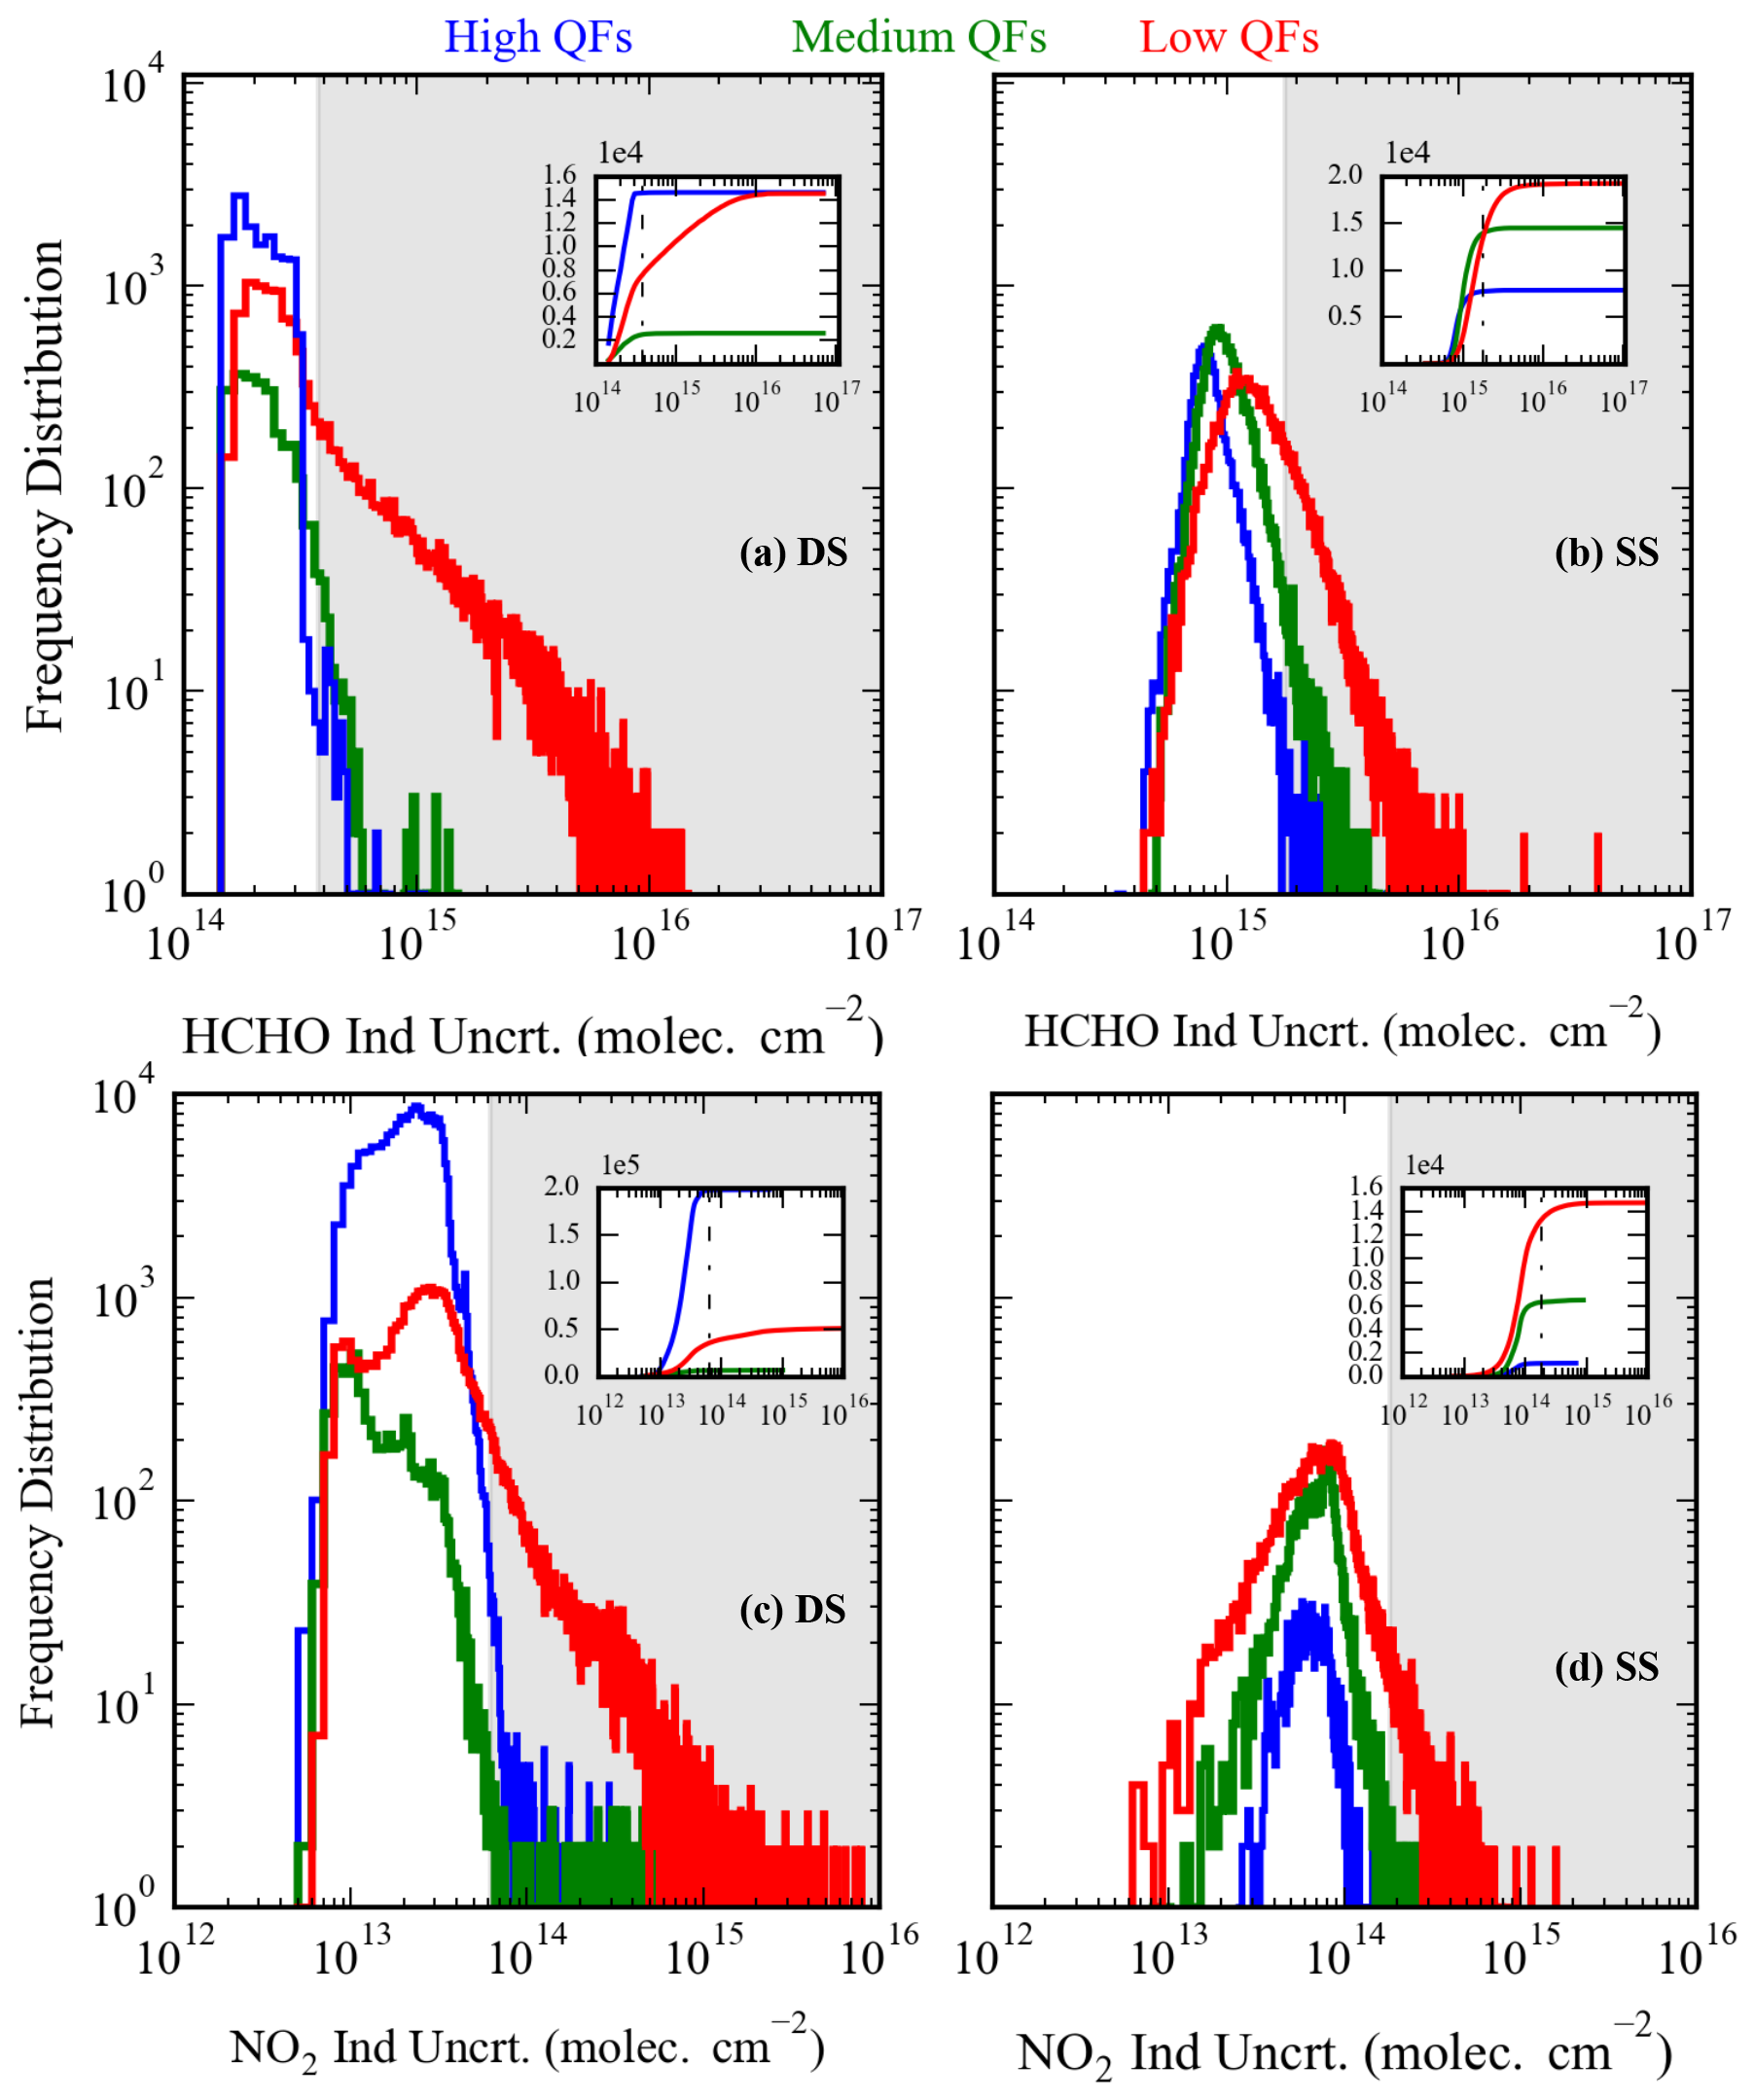
Figure 5Frequency distribution of independent uncertainty in three quality flags: high (blue), medium (green), and low (red) for (a) column HCHO direct-sun, (b) column HCHO sky-scan, (c) column NO2 direct-sun, and (d) column NO2 sky-scan observations at the University of Houston Pandora site. The cumulative distributions for each panel are inset with the cutoff values used in the present analysis shown as a dashed vertical black line. Data values exceeding the cutoff are shaded in gray for the frequency distributions.
The schedule of Pandora operations shown in Fig. 2 demonstrates the contemporaneous nature of DS and SS observations. Figure 3 further shows that the quality flags for the two observing methods can often differ substantially. This enables an independent assessment of data quality by taking advantage of the expected autocorrelation of contemporaneous (within 5 min) DS and SS observations for different quality flag combinations. An example is provided in Fig. 4, showing HCHO observations from the University of Houston Pandora site. Note that there are nine possible combinations of high-, medium-, and low-quality data pairs. More than half of those data pairs (57 %) include one low-quality observation. Low-quality SS observations correlate equally well or better with medium- and high-quality data, as do data pairings including only medium- and high-quality data. There is more scatter in the data that include low-quality DS observations (right column of panels in Fig. 4), but there is still evidence of a large number of well-correlated data points, even for pairings of low-quality data for both DS and SS modes. Given the independent nature of the DS and SS observations, it is worthwhile to examine the role of measurement uncertainty in these correlations.
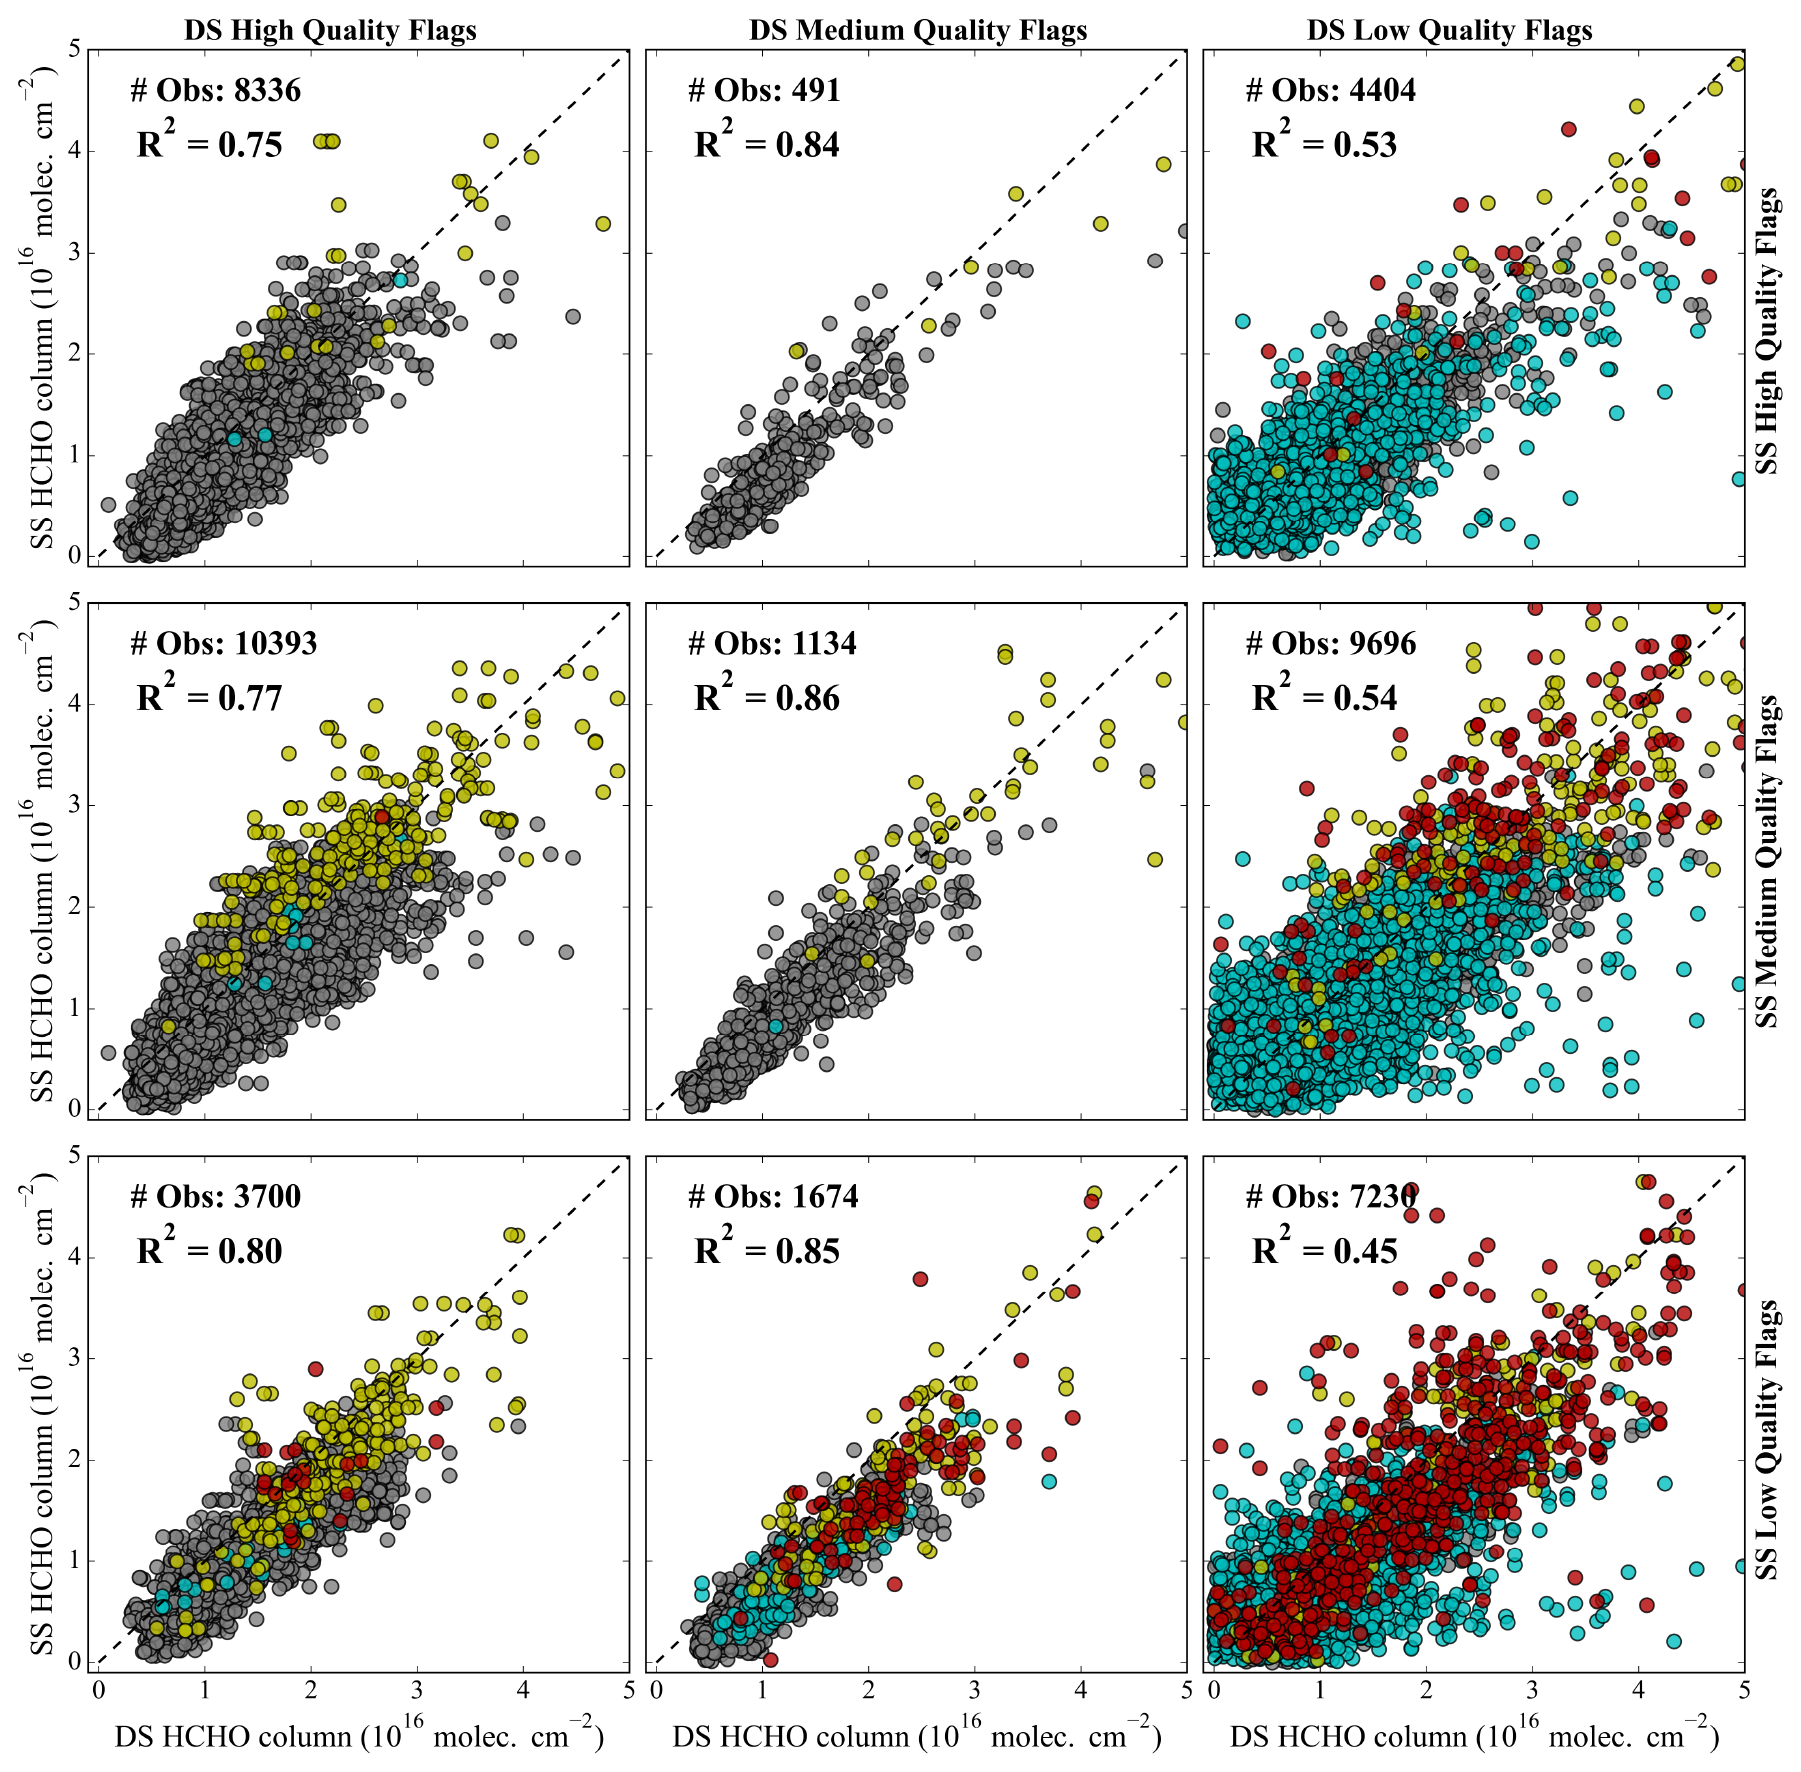
Figure 6Correlation between contemporaneous DS and SS observations of the HCHO column for different quality flag combinations at the University of Houston Pandora site over 2 years (2021–2022). Data points are colored by cutoff values used for HCHO column independent uncertainty values. Gray indicates points for which both DS and SS uncertainties are less than the cutoff; other colors indicate points for which only DS (cyan), only SS (yellow), or both DS and SS (red) uncertainties exceed the cutoff value.
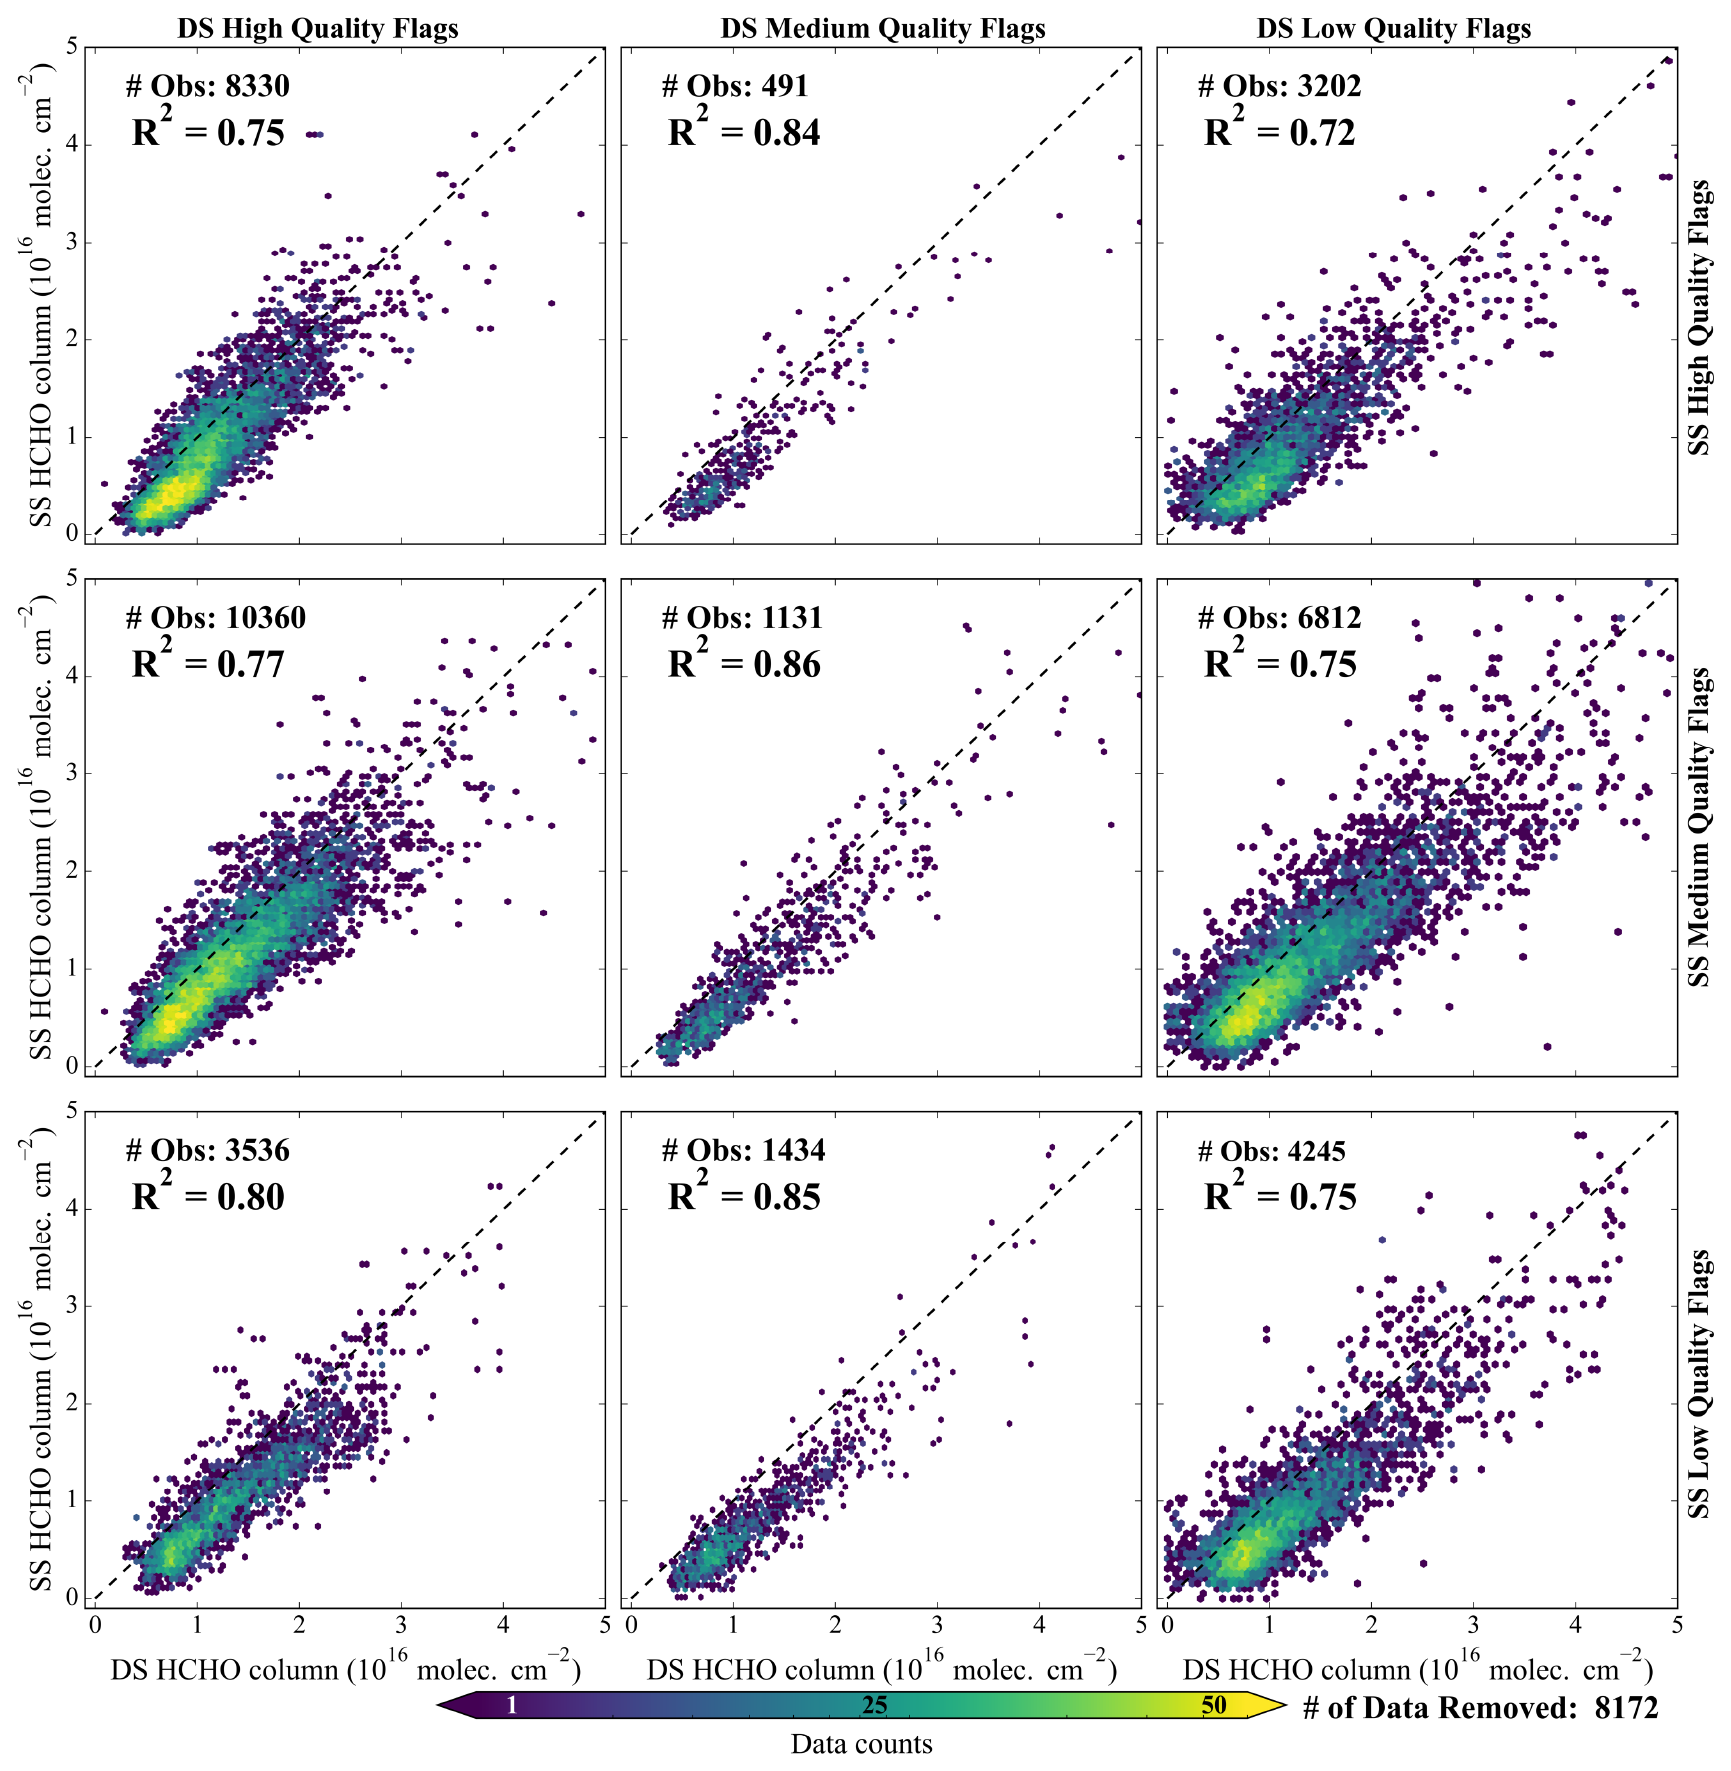
Figure 7Correlation between contemporaneous DS and SS observations of the HCHO column for different quality flag combinations after applying a new filtering method to the University of Houston Pandora site for 2021–2022. Data points are colored based on the count within each hexagonal bin (grid size of 100).
Figure 5 shows the frequency distribution of independent uncertainty for high-, medium-, and low-quality Pandora HCHO and NO2 column observations for both DS and SS mode for nonnegative vertical columns at the University of Houston Pandora site. Independent uncertainty is a measure of the photon noise across the detector pixels that is propagated to slant columns for each retrieval and is provided in the L2 product. Figure 5 shows that there is significant overlap in the independent uncertainty distribution across all three quality flags for each measurement mode. The figure inset shows the corresponding cumulative probability distributions and cutoff value (dotted black line) that preserves almost all high-quality data while including a significant amount of overlapping data flagged as medium or low quality. In the present analysis, the cutoff value for independent uncertainty is defined as μ+3σ of the independent uncertainty distribution for high-quality data, where μ is the mean and σ is the standard deviation. The gray shaded area in Fig. 5 shows the portion of the data falling outside this limit. For the University of Houston Pandora, the cutoff values are for DS independent uncertainty and for SS independent uncertainty in HCHO column measurements. For NO2 column measurements, the cutoff values are for DS independent uncertainty and for SS independent uncertainty. In this method, Pandora data with independent uncertainty lower than the cutoff limit are further scrutinized for scientific utility regardless of their data flag.
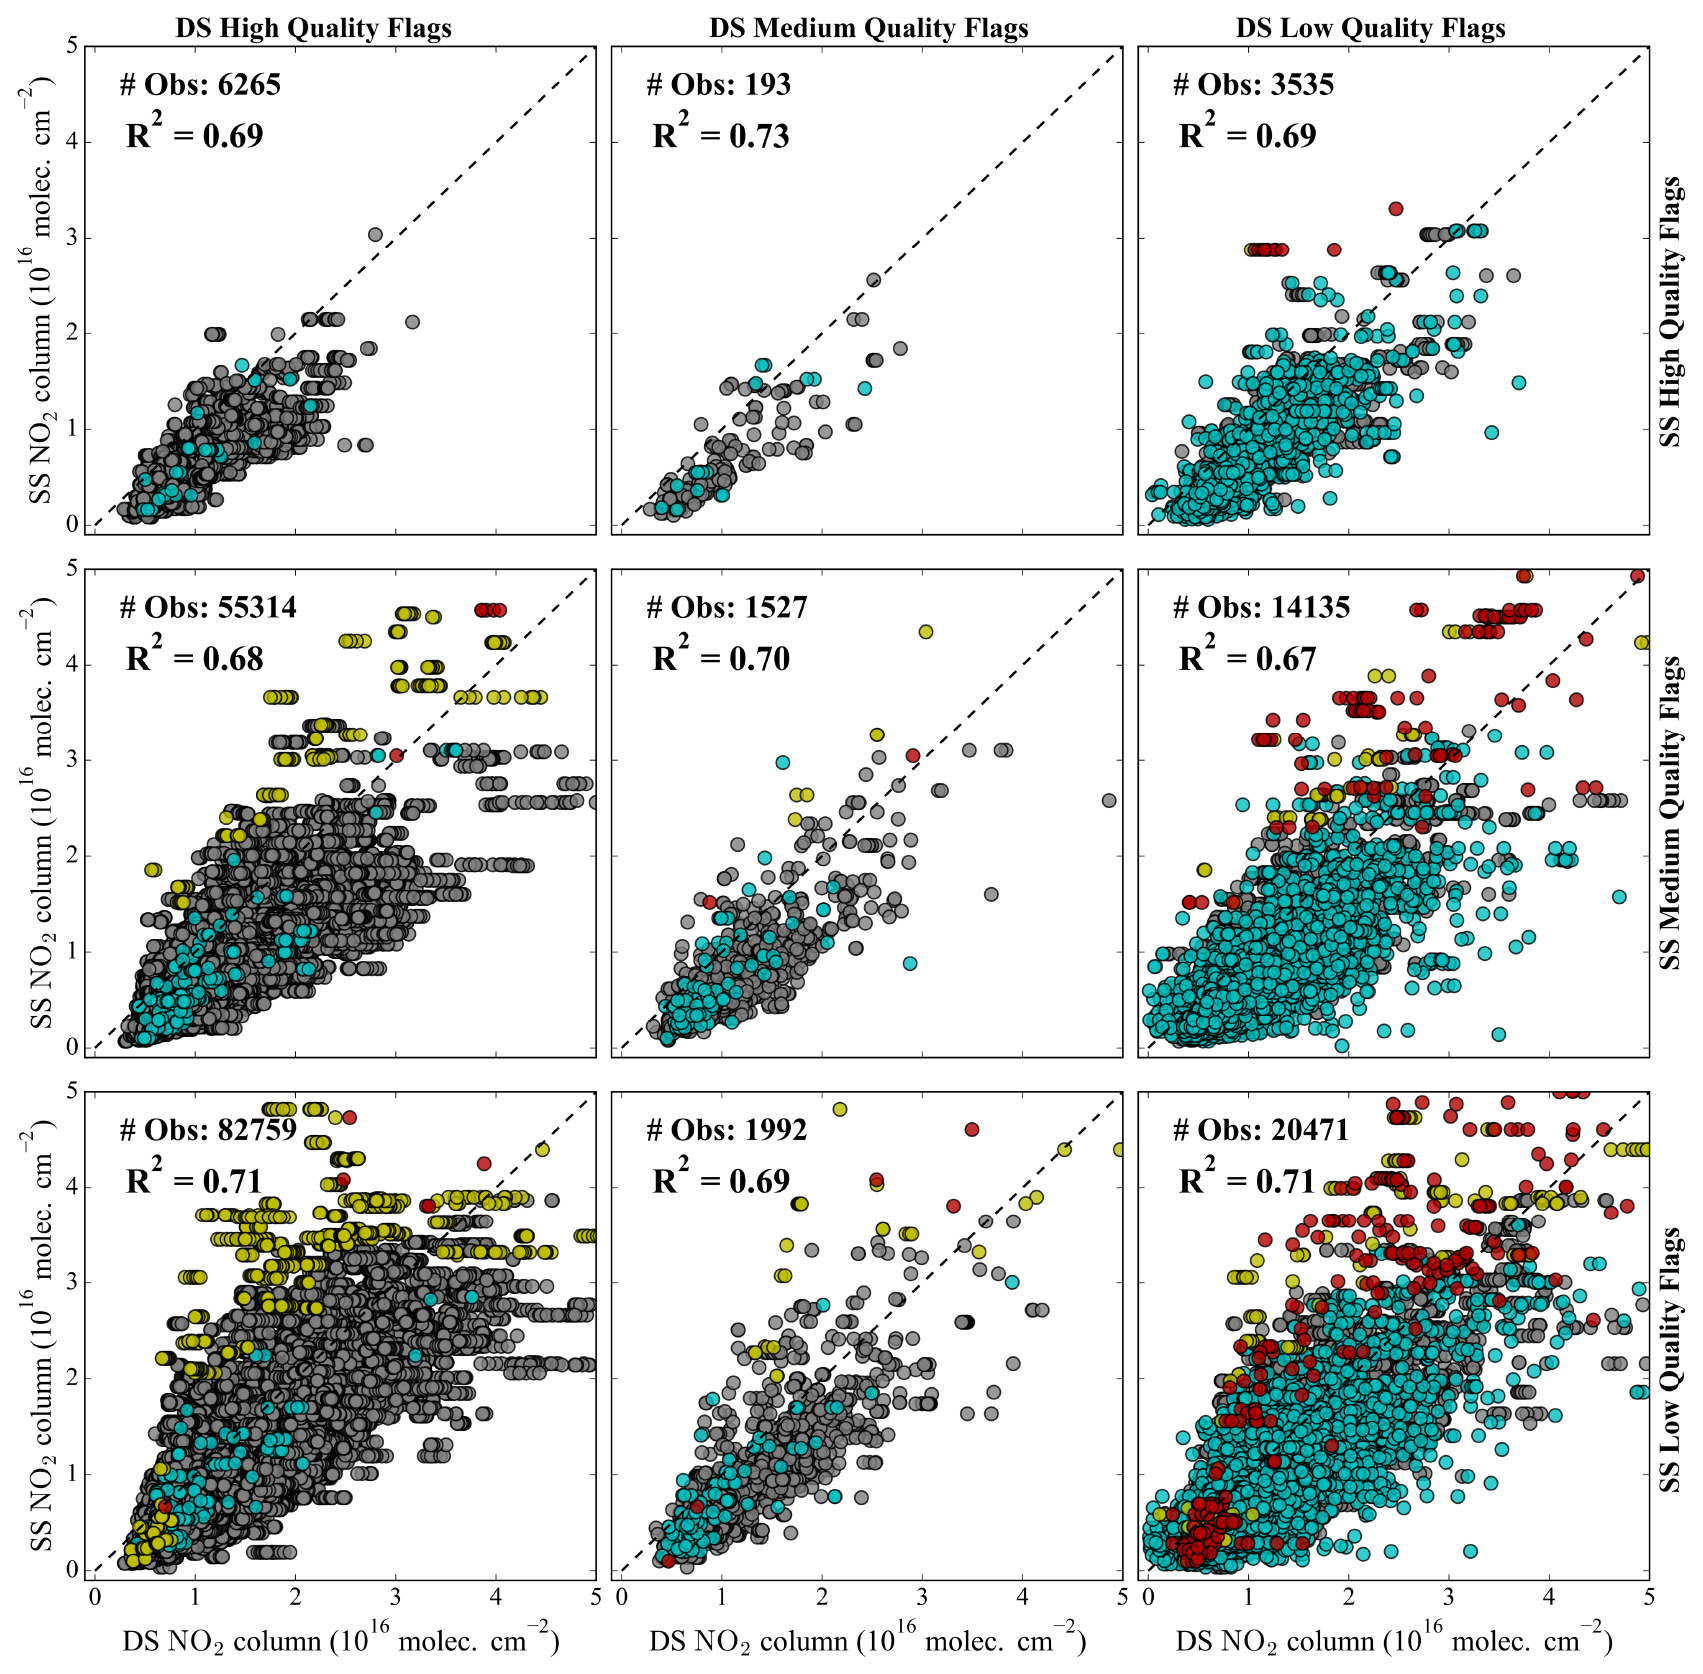
Figure 8Correlation between contemporaneous DS and SS observations of the NO2 column for different quality flag combinations at the University of Houston Pandora site for 2021–2022. Data points are colored by the cutoff values used for NO2 column independent uncertainty values. Gray indicates points for which both DS and SS uncertainties are less than the cutoff; other colors indicate points for which only DS (cyan), only SS (yellow), or both DS and SS (red) uncertainties exceed the cutoff value.
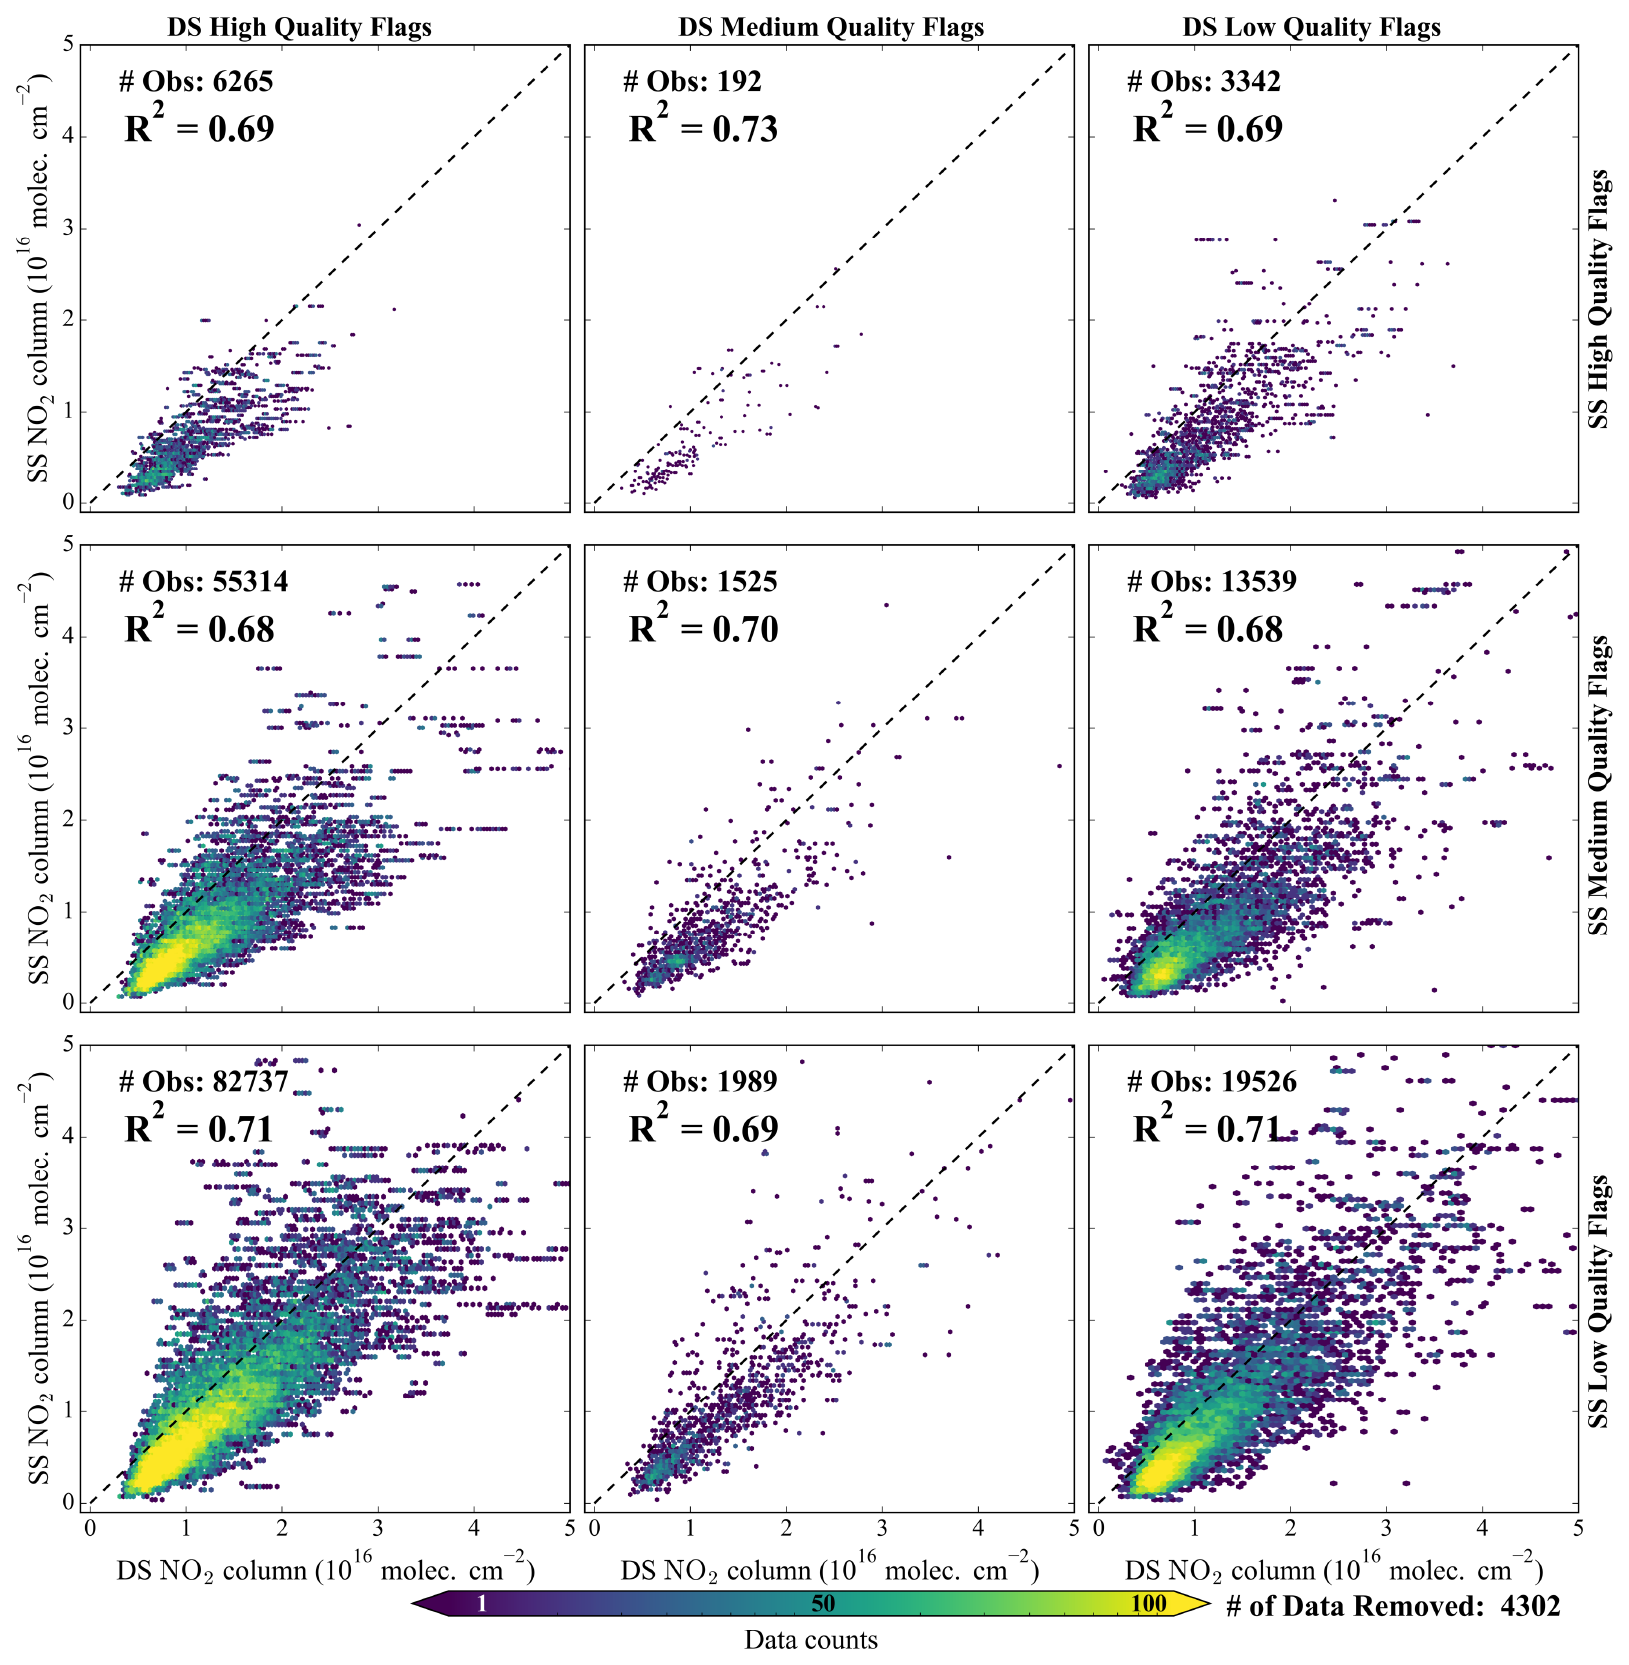
Figure 9Correlation between contemporaneous DS and SS observations of the NO2 column for different quality flag combinations after applying a new filtering method to the University of Houston Pandora site for 2021–2022. Data points are colored based on the count within each hexagonal bin (grid size of 150).
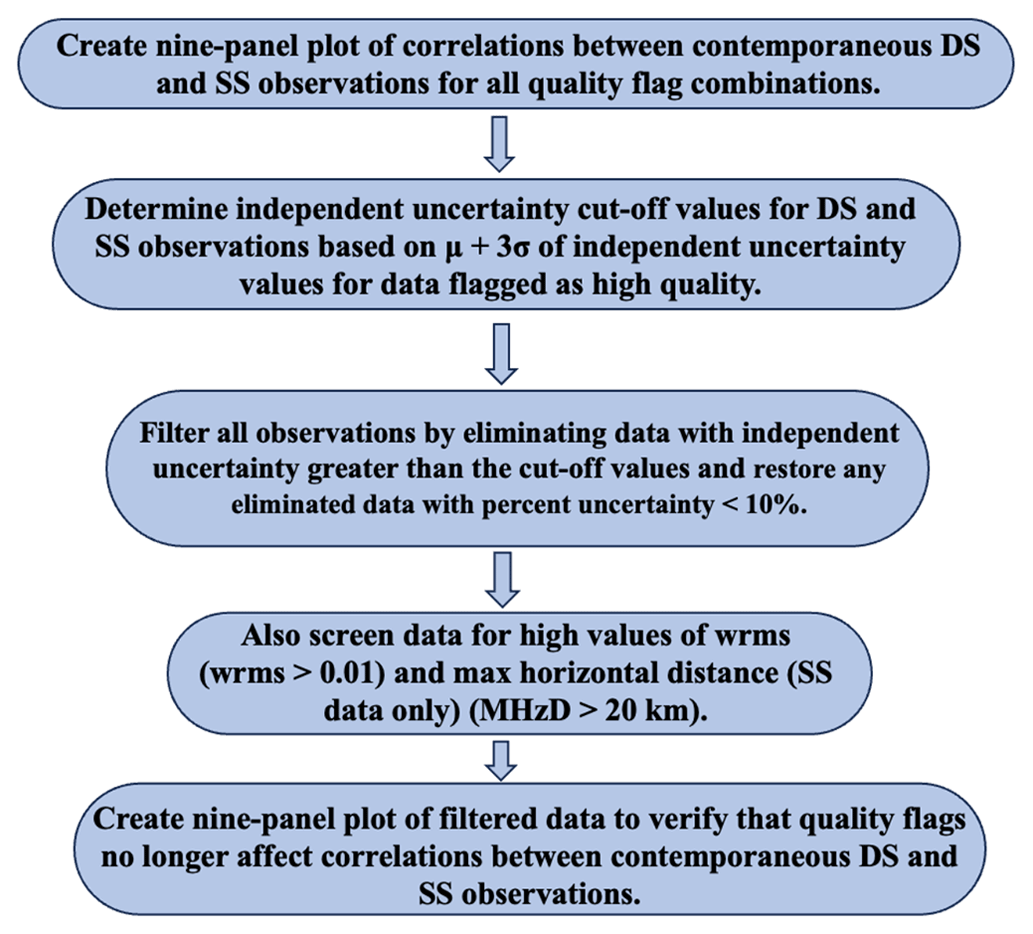
Figure 10The new data filtering method used in the present analysis to increase the scientific availability of Pandora observations.
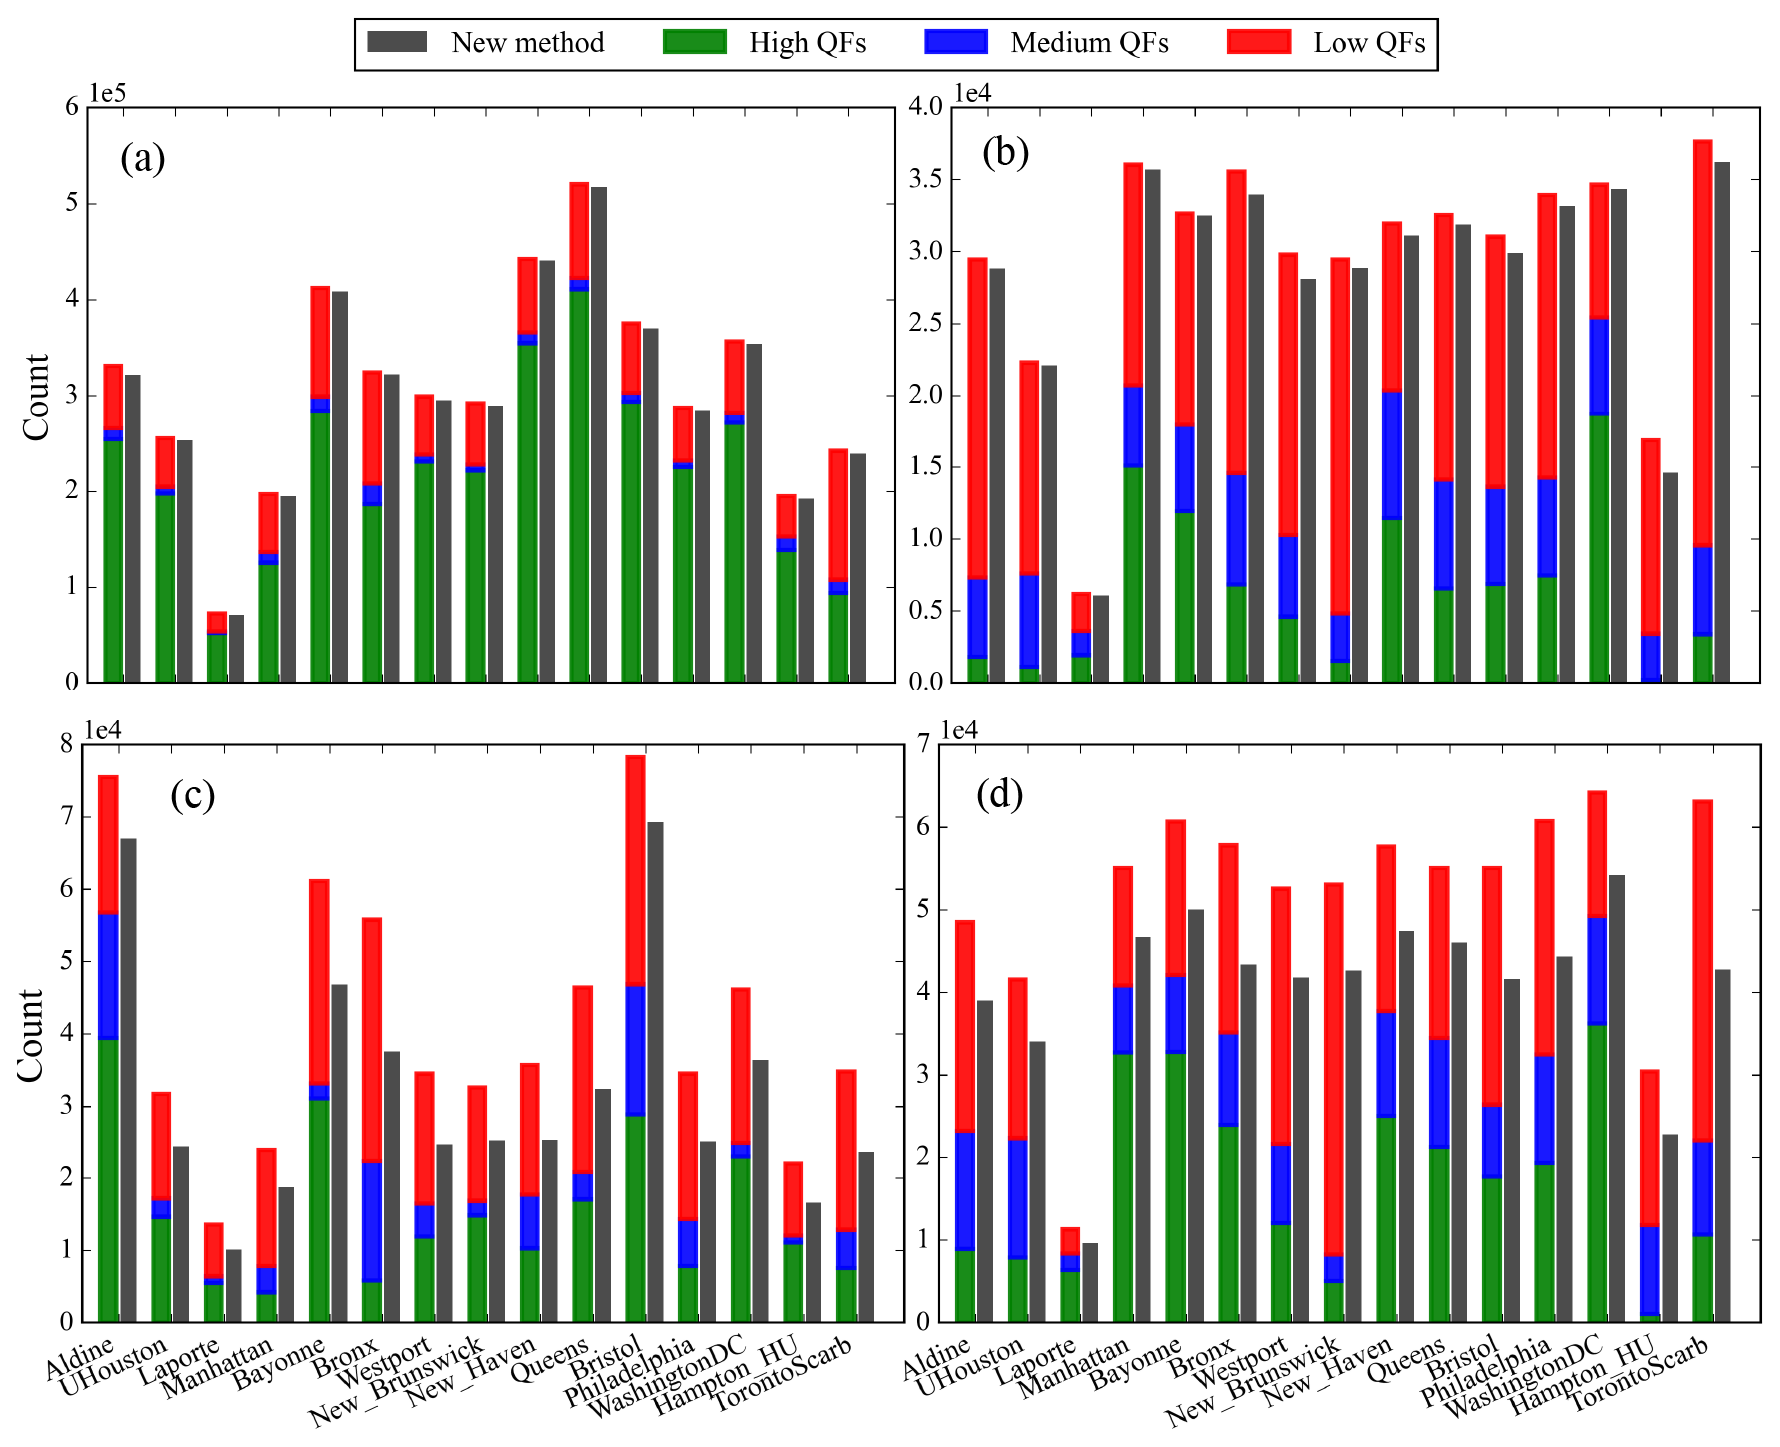
Figure 11Quality flags (QFs) for each Pandora site in 2021–2022 (left bars) colored by green (high), blue (medium), and red (low) for (a) NO2 DS, (b) NO2 SS, (c) HCHO DS, and (d) HCHO SS. The adjacent gray bars show the total observation counts after applying the new filtering method.
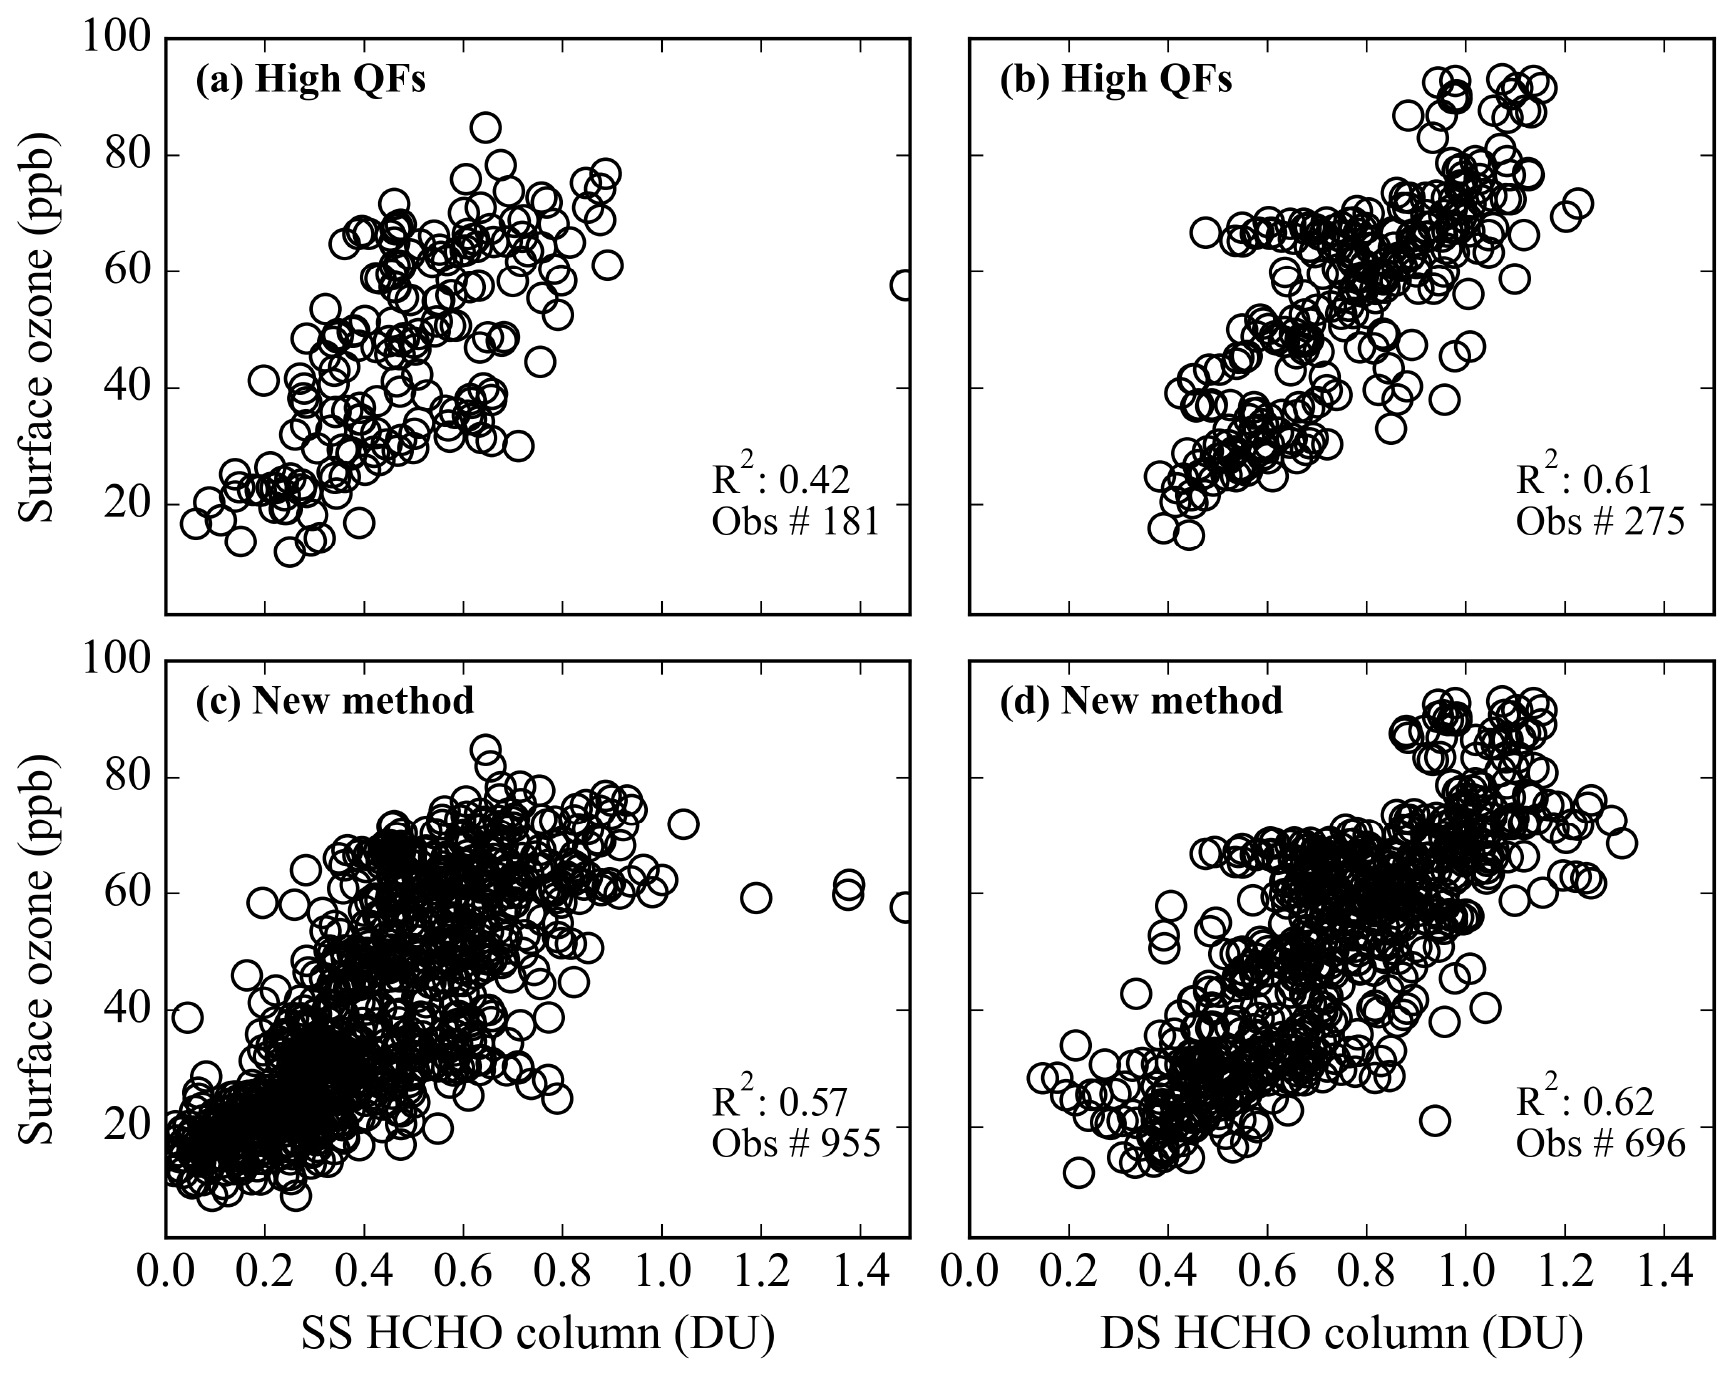
Figure 12Relationship between the Pandora HCHO column and surface ozone observations at the University of Houston site during TRACER-AQ in September 2021. Scatter plots between the sky-scan HCHO column and surface ozone for (a) only high-quality flags and (c) data with the new filtering method. Scatter plots between the direct-sun HCHO column and surface ozone for (b) only high-quality flags and (d) data with new filtering method. The HCHO column is given in Dobson units ().
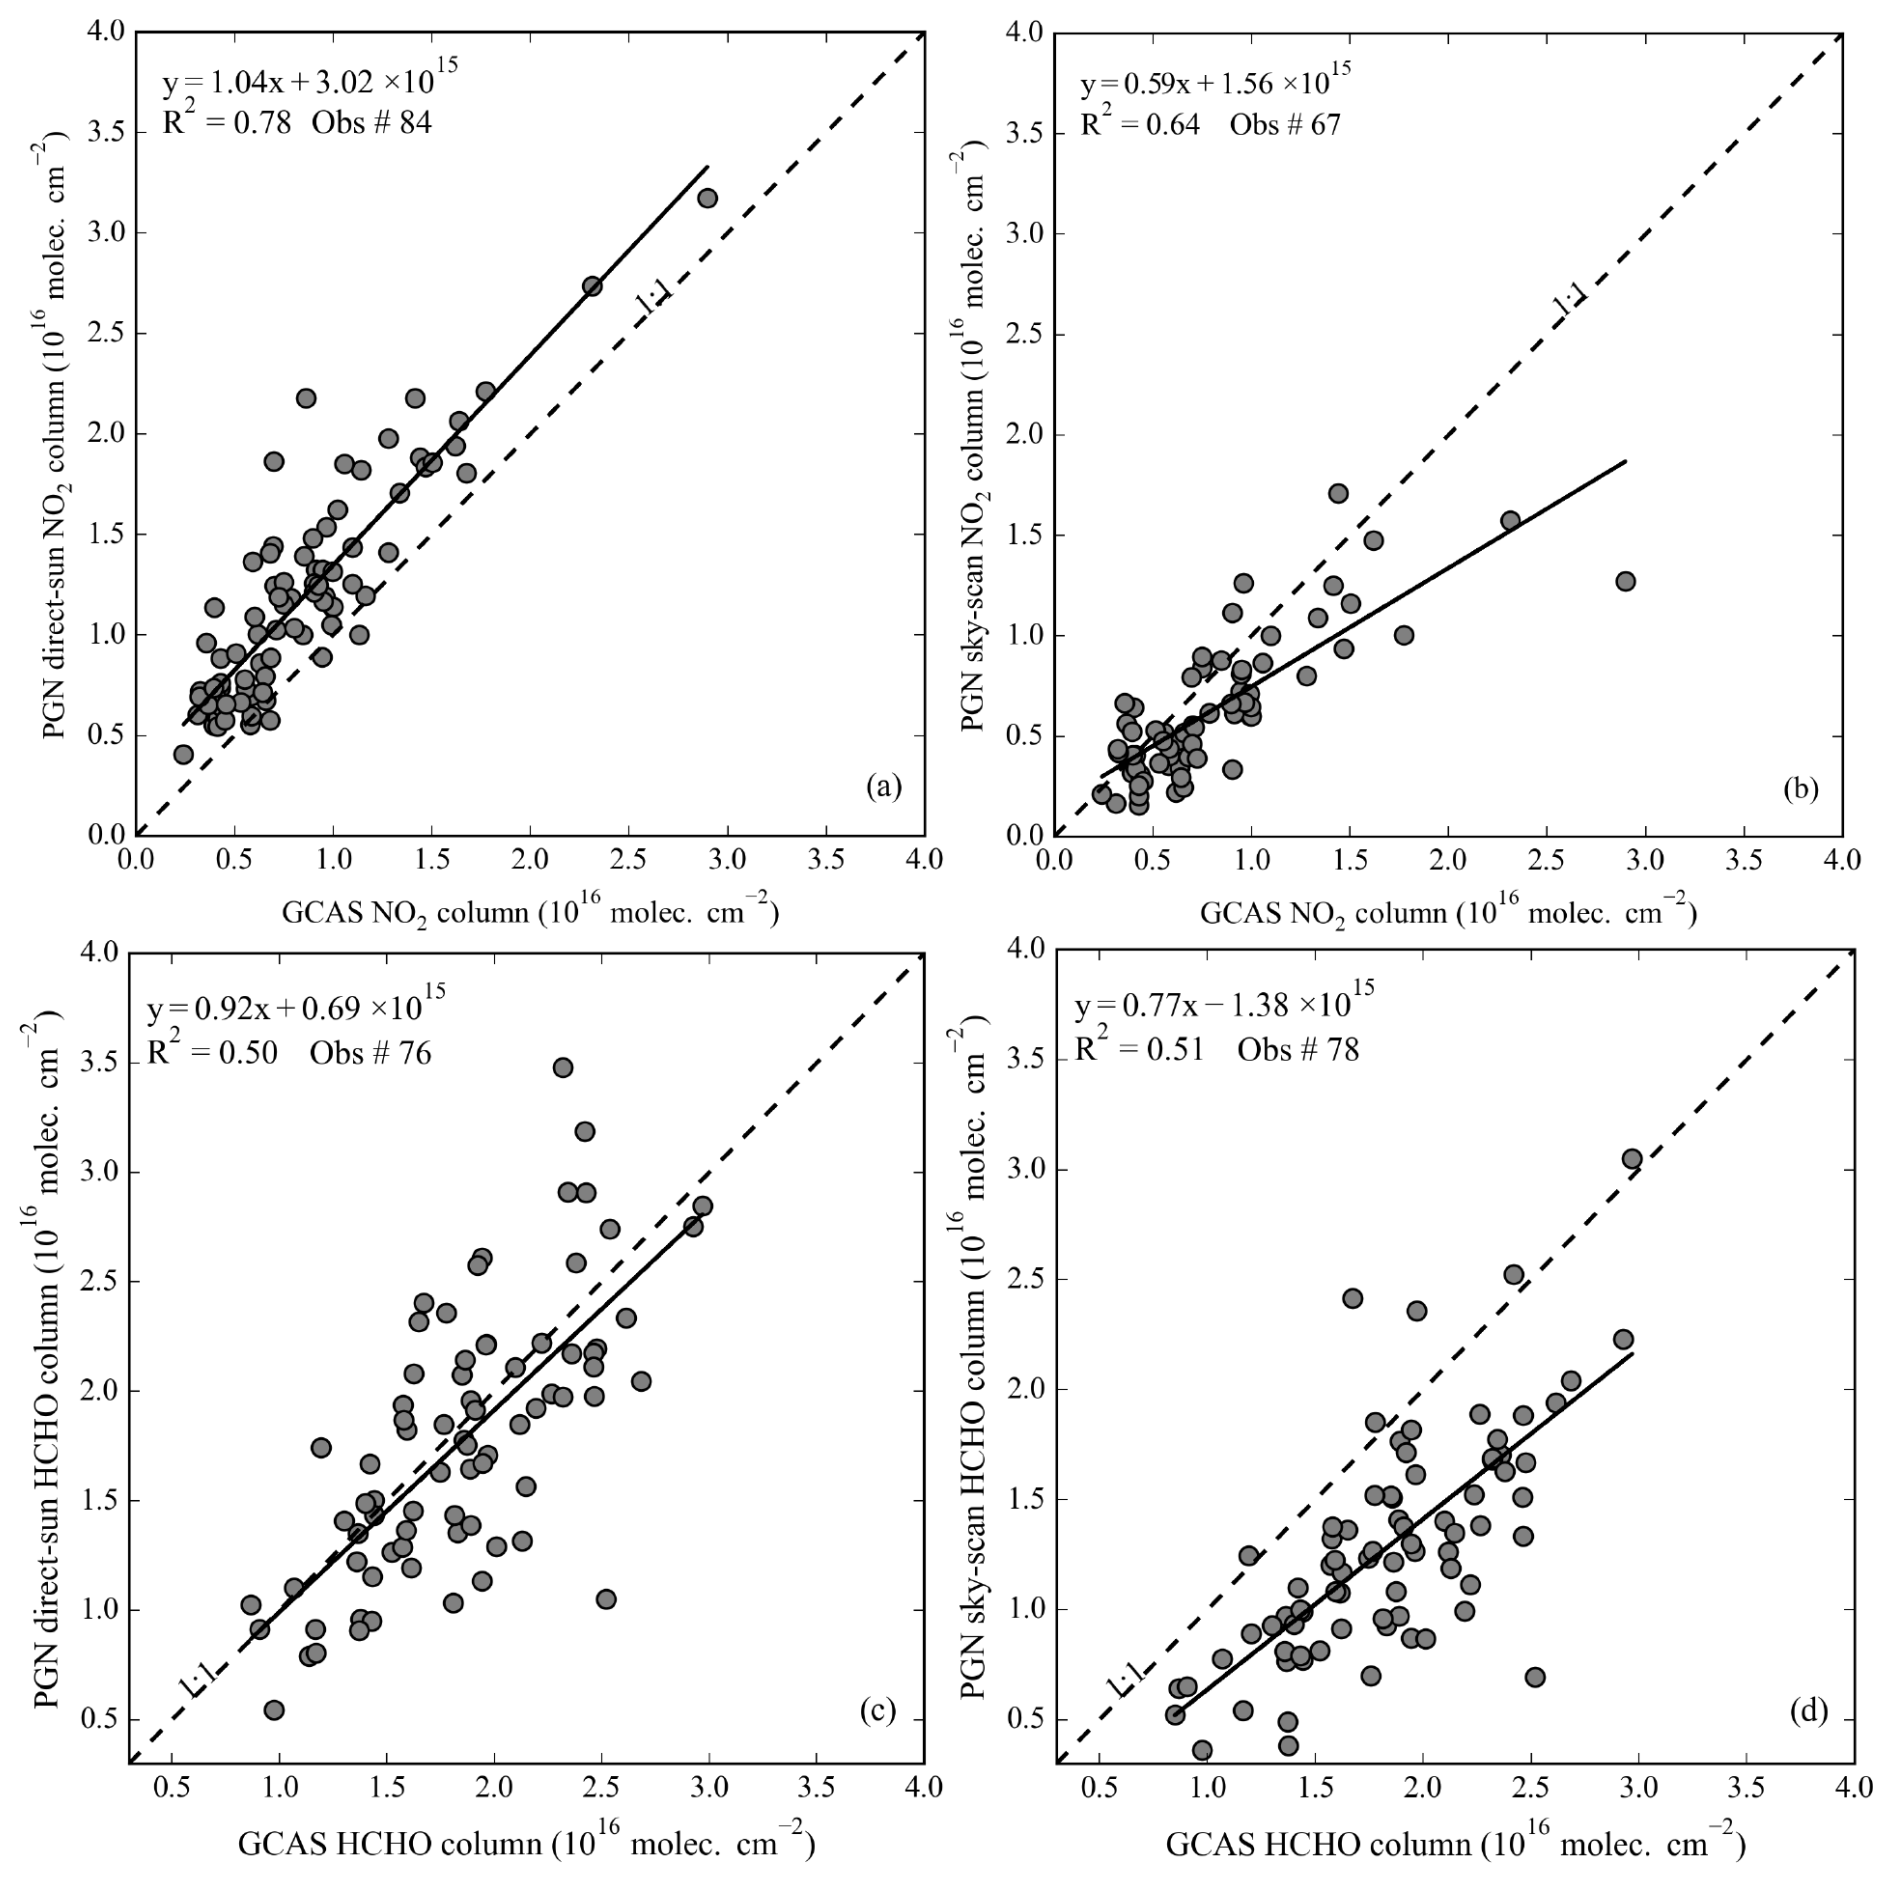
Figure 13Comparison of airborne GCAS trace gas columns and Pandora columns of NO2 (panels a and b) and HCHO (panels c and d) during TRACER-AQ for Houston Pandora sites (Aldine, La Porte, and University of Houston). Comparisons are shown for both direct-sun (panels a and c) and sky-scan (panels b and d) modes.
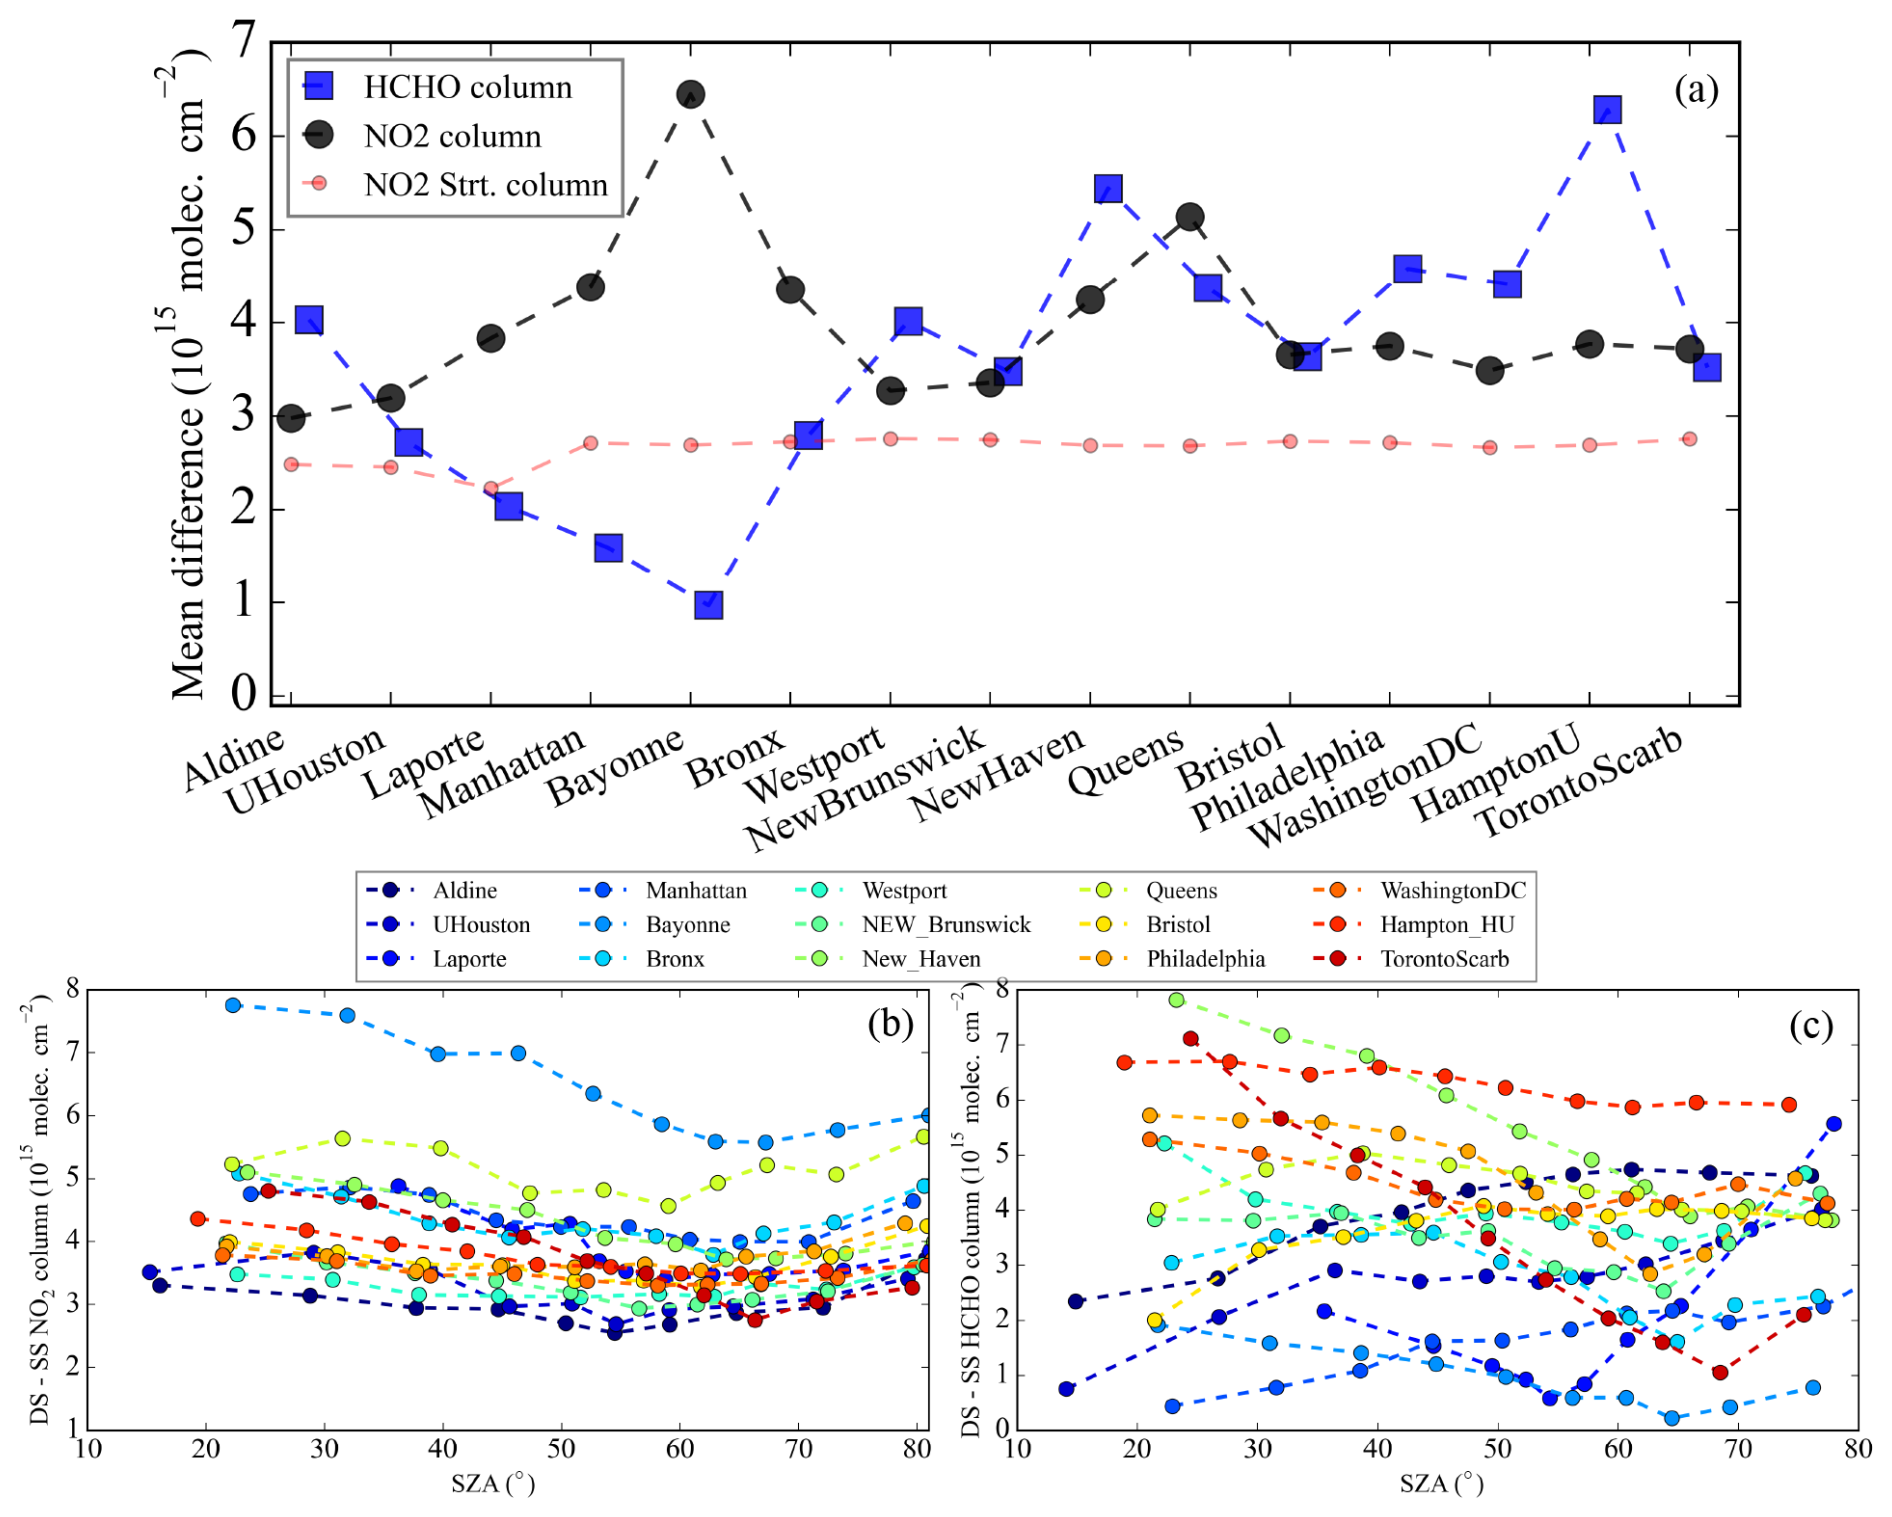
Figure 14(a) Mean differences between the DS and SS columns for HCHO and NO2 over the 15 Pandora sites for 2021–2022. The NO2 stratospheric column for each site is also provided. The bottom panels show the variation in mean column difference with solar zenith angle (SZA) for the NO2 column (b) and HCHO columns (c).
This proposed data filtering method is evaluated in Fig. 6 for HCHO observations at the University of Houston Pandora site, showing how specific data pairs are related to the independent uncertainty cutoff values. Data pairs with uncertainty falling above the cutoff for DS only (blue points) and for both DS and SS (red) are almost exclusively limited to the low-quality-flagged data (right column and bottom row of panels in Fig. 6). These points also account for most of the scatter in the correlations. Data pairs with uncertainty falling above the cutoff for SS data only (yellow) tend toward larger values of HCHO in the column. This calls for a second filtering step in which observations with independent uncertainties of less than 10 % of the column amount are retained even if the absolute independent uncertainty exceeds the cutoff value. This preserves a small but important set of large column abundances that are important for exploring the full dynamic range of column variability.
Finally, there can be a few rare outliers (<0.1 %) associated with unusually large wrms values even after applying this independent uncertainty cutoff. For this analysis, we empirically determine that these outliers are associated with unusually high values for DS and SS data of high wrms and for SS data of maximum horizontal distance (MHzD). These outliers can be removed with thresholds for wrms of 0.01 and for MHzD of 20 km. Specific column numbers from Pandora files for the variables used in this analysis are provided in Table S2 in the Supplement to facilitate the application of this method.
Figure 7 shows the filtered data for the University of Houston Pandora site colored by data density. After the filtering method is applied, correlations notably improve for combinations that include DS low-quality-flagged data. Among all pairings (), data quality flags no longer appear to be a useful predictor of correlation between contemporaneous SS and DS observations. This suggests that all remaining data may be scientifically useful regardless of the quality flag. Figure 7 also shows that there is a bias between SS and DS observations for the HCHO column. This is not unexpected, given that SS observations are limited to the lower troposphere, but as discussed later in Sect. 3.3, this bias must be addressed for applications where it is advantageous to combine SS and DS observations into a larger unified dataset.
Figure 8 shows the same plot as Fig. 6 but for NO2 columns at the University of Houston Pandora site. There are more total pairs in this comparison since DS NO2 observations are more frequent than those of HCHO (see Fig. 2). Again, a reasonable correlation is observed between all the quality flags (). For NO2, the filtering method leads to very few data being removed; thus correlations are essentially unchanged in Fig. 9 for the filtered data. Again, there is a bias, with DS values being greater than SS values. This is mainly due to stratospheric NO2, which is only detected in the DS mode (see discussion in Sect. 3.3). Figures 8 and 9 show that for NO2, the frequent DS retrievals enable multiple DS measurements to be matched to a single SS observation within the 5 min matching window.
The method demonstrated in Figs. 4 through 9 is summarized in Fig. 10. It can be applied to any PGN site with contemporaneous DS and SS observations. Results of applying the method are shown in Fig. 11 for the 15 Pandora sites falling under recent NASA airborne campaigns. Data from 2021 and 2022 are used for all sites, although La Porte, Texas, only has data from August 2021 to February 2022. The bars in Fig. 11 show the occurrences of the high- (green), medium- (blue), and low- (red) quality-flagged data across these 15 Pandora sites. The amount of available data varies considerably between sites. This can be due to a number of reasons, including instrument down time, the use of nonstandard observing schedules, and periods of data flagged as unusable (20, 21, or 22). The gray bars show the amount of usable data after applying the new filtering method. For HCHO data, 35 % is high quality on average. This increases to 77 % on average when the new method is applied. For NO2, this improvement is from 46 % to 97 %.
In Sect. S1.3 in the Supplement, data quality flags are traced for the University of Houston Pandora dataset used in Figs. 6 through 9. For DS HCHO, most data are flagged as medium or low quality, primarily due to a violation of the data quality indicators (DQ) for atmospheric variability. Data are also flagged due to high wrms and saturated data. The data recovery procedure shown in Fig. 10 restores 34 % of data flagged for high wrms and 70 % of data flagged for high atmospheric variability. The large atmospheric variability values are assumed to be related to cloudiness. However, there appears to be no correspondence between atmospheric variability values and actual sky conditions (Fig. S1 in the Supplement). For SS HCHO, flagging primarily occurs due to saturation or dark-count issues in the L1 stage and high wrms in the L2fit stage. Unlike DS measurements, atmospheric variability is rarely triggered for sky-scan HCHO despite observations showing a tendency toward greater atmospheric variability. Of the flagged data, 75 % of saturated or dark-count-affected data and 70 % of high-wrms-flagged data are recovered. For NO2, DS data are primarily flagged for exceeding atmospheric variability thresholds, while SS data are flagged for high wrms values. This analysis suggests that the PGN criteria for atmospheric variability, wrms, dark counts, and saturated data may be overly stringent. Of these PGN criteria, wrms is the only one considered in the method outlined in Fig. 10, but the threshold value is empirically determined independent of the flagging. Data users are encouraged to continue to pay attention to the impact of wrms on Pandora data quality for specific instruments.
As noted in Fig. 10, the first step in verifying the success of the method is to demonstrate the quality of correlation across all quality flag combinations. To further strengthen the case for using this method, independent observations are used in the following sections to demonstrate more robust scientific analyses. Evaluation of biases between DS and SS observations and prospects for combining them into a single dataset are also explored.
3.1 Independent assessment of Pandora scientific data quality with HCHO : O3 analysis
Recent work has shown a strong correlation between surface O3 and column HCHO (Schroeder et al., 2016; Travis et al., 2022). This relationship is used here to test the effectiveness of the new filtering method on Pandora HCHO column observations for the University of Houston Pandora site during the TRACER-AQ period (September 2021). High-resolution (5 min) collocated surface ozone measurements were obtained from the Texas Commission on Environmental Quality. The Pandora HCHO column measurements in SS and DS modes are temporally matched (within 5 min) with surface ozone data between 10:00 and 18:00 local time, when photochemistry is most active. This analysis compares results using only high-quality-flagged Pandora data to results using Pandora data filtered with the new method.
Figure 12 shows the relationship between the HCHO column and surface ozone using DS and SS observations. When the new filtering method is applied, the number of data points increases 5-fold for SS (181–955) and 2-fold for DS (275–696). In both cases, the R2 remains similar or improves. However, the substantial increase in data density will lead to more robust scientific analysis of the HCHO : O3 relationship. Similar results were obtained for other months outside the TRACER-AQ period that are not shown here.
This analysis is expanded in Table 1 to include Pandora sites that are located within 500 m of an Environmental Protection Agency (EPA) regulatory monitor reporting hourly ozone. Data are for the month of September 2022, which had the best data availability. Table 1 summarizes the resulting correlation between hourly averaged column HCHO in SS and DS modes and hourly surface ozone. Generally, similar or improved correlation and increased data availability (14 %–163 %) were observed after applying the new filtering method. However, over the New Brunswick site in DS mode, a lower correlation (0.60–0.52) was observed after applying the new method. This was caused by the new method capturing an ozone event (>60 ppb) that appeared to be decoupled from high HCHO columns on 19 September 2022. This independent analysis shows that the recovered data can both improve the analysis of the HCHO : O3 relationship and provide confidence in the scientific value of the new filtered dataset.
3.2 Independent assessment of Pandora scientific data quality with airborne remote sensing
GEO-CAPE airborne simulator (GCAS) observations (Nowlan et al., 2018; Judd et al., 2020) provide an independent dataset of column NO2 and HCHO observations to compare against Pandora over Houston, TX during the TRACER-AQ period (September 2021). Looking downward as it flies overhead at ∼8.5 km, GCAS measures a partial column from the aircraft altitude down to the surface that includes the polluted boundary layer and a large portion of the less polluted free troposphere. Additionally, the GCAS tropospheric column measurements have been shown to strongly correlate with in situ aircraft observations for NO2 (R2=0.89) and HCHO (R2=0.54), with column differences in magnitude within 10 % (Nowlan et al., 2018). Figure 13 shows the comparison of DS and SS observations with GCAS NO2 and HCHO. To minimize the temporal and spatial mismatch between the Pandora and GCAS observations, GCAS was spatially filtered to include the nearest cloud-free GCAS pixels within 2.5 km of the Pandora location, and Pandora was temporally filtered to include observations in a 15 min window centered on the time of the GCAS overpass.
Both the DS and SS NO2 columns are well-correlated with GCAS (R2=0.78 and 0.64, respectively). Some scatter can be attributed to GCAS uncertainties being on the order of 25 % (Judd et al., 2020; Nawaz et al., 2024) compared to a priori uncertainties related to surface reflectivity and the trace gas profile. For DS NO2 columns, there is a clear offset, with Pandora columns exceeding GCAS values. The slope near unity and the intercept of are consistent with the stratospheric amount that would be absent in the GCAS observations below the aircraft. Despite a few outliers (Fig. 11b), there is no notable systematic bias between GCAS and SS NO2. This is consistent with the SS NO2 observations being limited to the most polluted lower few kilometers of the atmosphere. It could be argued that GCAS values tend to be slightly higher than SS observations of NO2 due to the larger altitude range observed.
The correlations between the GCAS and Pandora HCHO columns also show general agreement (R2=0.50 and 0.51) but are weaker, primarily due to the greater uncertainty in HCHO measurements for both instruments. For HCHO, the bias is in the SS rather than the DS observations. This is due to the lack of significant HCHO in the free troposphere and stratosphere; thus, total column values associated with DS observations are more consistent with those of GCAS. Since HCHO is created photochemically, it tends to have a weaker vertical gradient in the polluted boundary layer compared to NO2, which is much more weighted towards the surface where it is emitted. Thus, the limited altitude range of SS observations is more likely to miss some fraction of lower-atmospheric HCHO and to be biased low with respect to both DS and GCAS HCHO.
Overall, these comparisons are encouraging for both GCAS and Pandora with differences that are consistent with expectations based on the differences in DS and SS viewing sensitivities.
3.3 Direct-sun and sky-scan intercomparison of column measurements
Given that the Pandora instrument spends a significant amount of time in both DS and SS modes, maximum data availability for scientific applications would be achieved by further addressing the causes of the differences in their resulting measurements. DS and SS column measurements are expected to differ in their absolute number due to limitations in the vertical sensitivity (for SS measurements) and retrieval method (Herman et al., 2009; Frieß et al., 2019) and physical differences between tropospheric and stratospheric gas amounts. SS columns generally profile from the surface up to 2–4 km, while DS columns observe the total column throughout the entire atmosphere. Due to its short lifetime and major secondary source from chemistry, the HCHO column has a weak gradient from the surface through the depths of the boundary layer (Schroeder et al., 2016; Crawford et al., 2021). This suggests that the DS HCHO total column should be greater than the SS lower-tropospheric column, and the difference should be largely dependent on the vertical sensitivity of the SS measurement. For the NO2 column, the stratospheric contribution is the largest influence on the differences between the SS and DS column retrievals. To obtain a tropospheric DS NO2 column, the NO2 stratospheric column can be subtracted from the DS NO2 total column using the stratospheric climatology provided by the PGN in their product based on Brohede et al. (2007).
Figure 14a shows the mean differences between the DS and SS columns for HCHO and NO2 over the 15 Pandora sites in 2021–2022. The bias for HCHO on average is , with a larger bias at Hampton University in Virginia and in New Haven, Connecticut (), and the smallest bias in Bayonne, New Jersey. The mean HCHO column in DS mode over these 15 sites averaged about , making the bias between DS and SS mode approximately 35 % of the column.
For NO2, the mean difference was calculated after removing the stratospheric contribution (see red line in Fig. 14a; Fig. 14 is without removing stratospheric contribution). The remaining bias was less than or about 20 % of the tropospheric column () on average. Higher average NO2 columns () were observed in New York (Manhattan, Bronx, and Queens), which also had three of the four highest biases observed. The highest bias was at Bayonne and appears to be anomalous, demonstrating that bias comparisons across the network are a useful tool for identifying potential problems at specific sites. In this case, Bayonne's large NO2 bias between SS and DS deserves a closer look by the site operator and may be related to a reference spectrum or calibration issue.
Figure 14 also shows how the NO2 (Fig. 14b) and HCHO (Fig. 14c) biases between DS and SS change with the solar zenith angle (SZA). One reason to expect changes in the bias with SZA is the larger uncertainty in AMF calculations and larger stray-light contribution at high SZA (Herman et al., 2009). However, no consistent patterns in bias behavior versus SZA were found for either HCHO or NO2. Pandoras in Aldine and at the University of Houston showed increasing biases with increasing SZA for HCHO, but the bias decreases with SZA in New Haven and Toronto and showed no variations with SZA for the New York Pandora instruments. The NO2 column biases as a function of SZA showed no notable variation and were mostly constant around a mean value. Additionally, stray light is minimized in Pandora DS retrievals by subtracting the average signal below 290 nm from the spectra (Cede et al., 2024). However, residual stray light could contribute to the large difference between the DS and SS HCHO columns. Plotting the residual stray light as a function of SZA (Fig. S1) showed that it decreased or remained constant (∼0.3 %) with increasing SZA, which suggests that the stray-light contribution to the column might not increase significantly at higher SZA. There is also no evidence for a seasonal dependence of the difference between SS and DS observations (Fig. S2 in the Supplement for the University of Houston), unlike that reported for the total ozone biases between Pandora and Brewer observations (Tzortziou et al., 2012).
Finally, the importance of differences in the pointing azimuth and solar azimuth angle was investigated since 1) the Pandora SS analytical method may be less accurate when the solar azimuth and pointing azimuth are close (Cede et al., 2024) and 2) when the difference is large, the retrievals may be sampling different air masses. Figure S3 in the Supplement shows no systematic biases as a function of the difference between the pointing azimuth and solar azimuth across all 15 sites. This suggests that retrieval uncertainties and vertical sensitivity are most likely responsible for the mean biases between the SS and DS columns. This allows for the possibility of combining the two datasets for higher temporal coverage.
Table 2Correlations (R2) between hourly surface ozone and the column HCHO from sky scan, direct sun, and combined data at the University of Houston site during TRACER-AQ (September 2021). Results include data with high quality only and with the new filtering method. The number of analyzed hours (n) is given for each case.
3.4 Temporally combining DS and SS data
Section 2.2 discussed the standard schedule for Pandora observations with alternating measurements in the DS and SS modes and the use of UV and open filters for the HCHO and NO2 observations, respectively. The DS NO2 retrieval is relatively fast compared to DS HCHO measurements, which are less frequent. For SS measurements, both HCHO and NO2 are comparable and take much longer than the DS measurements do (Fig. 2c). In order to be combined, these time differences as well as biases diagnosed in the previous section must be addressed.
With the goal of creating a more continuous data record of hourly HCHO columns from Pandora that is suitable for comparison with hourly in situ measurements of surface ozone at EPA sites, Eq. (1) combines data for DS and SS modes by correcting for the mean bias and then accounting for the difference in measurement times. Each column is weighted by the ratio between measurement time in each mode and the total measurement time during the hour for both the DS and SS modes. DS values for the NO2 column must first include subtraction of the stratospheric NO2 contribution. SS observations are corrected by adding the mean bias value (Fig. 14a). The summation of the weighted values results in an hourly Pandora HCHO column.
where teff is the effective measurement time for each DS observation (see column 3, “effective duration of measurement” in the Pandora data files); Δt is the estimated measurement time for each SS observation (see Sect. S1.2 for details); Tot is the total integrated measurement time in a 1 h period for both the DS and SS measurements; and XDS[i] is the direct-sun column and XSS[j] is the sky-scan column for the ith and jth measurements of each hour, respectively. MB is the mean bias of the HCHO and NO2 columns between the DS and SS measurements.
Table 2 shows the performance of the relationship between HCHO and hourly surface ozone at the University of Houston during September 2021 for SS, DS, and the combined dataset. The hourly correlation remains similar compared to high-resolution data (5 min), as discussed in Fig. 12; however, there is a smaller number of observations. The combined dataset with the new filtering method increased the temporal coverage of Pandora observations on the hourly data compared to using only one mode and high-quality-flagged data. Applying the new filtering method to the combined data results in the broadest data coverage, with a correlation that is better than or equivalent to the other subsets of data.
The growing Pandonia Global Network of Pandora spectrometers provides a ground-based network of remote-sensing observations to both validate satellite trace gas retrievals and understand local air quality. Pandora provides information on the diurnal variability in multiple species (e.g., NO2 and HCHO) using two independent viewing geometries: direct-sun (DS) and sky-scan (SS) modes. The Pandora quality assurance procedure recommends using high-quality-flagged data, exercising caution with medium-quality-flagged data, and not using low-quality-flagged data. Unfortunately, high-quality data can often be only a small fraction of the total set of observations, except for the DS NO2 columns.
In response to the overly stringent data flagging procedure, a framework has been described for analyzing Pandora observations by taking advantage of the two independent modes of operation. This includes a new filtering method as an alternative to using quality flags to identify scientifically useful observations. The need to filter data is not new, as Pandora users have selected filtering criteria with some level of subjectivity in years prior to development of the PGN quality flagging procedure (Herman et al., 2009; Judd et al., 2019; Tzortziou et al., 2022).
The method keys in on the range of independent uncertainty values for Pandora data flagged as high quality. Given the large overlap in independent uncertainty for high-, medium-, and low-quality-flagged data, the μ+3σ value of independent uncertainty for the high-quality-flagged data defines a cutoff that preserves almost all high-quality data and includes a large amount of medium- and low-quality-flagged data. A final step in the method is to restore observations with a uncertainty percent of less than 10 %. For a much smaller number of data points, wrms>0.01 (normalized root mean square of the fitting residuals weighted with the independent uncertainty) and SS MHzD>20 km (maximum horizontal distance) should also be filtered out.
Given the independence and contemporaneous nature of DS and SS observation modes, the correlation of adjacent (within 5 min) observations between modes provides evidence for scientifically useful data in the medium- and low-quality-flagged data. Unfiltered observations already exhibit some degree of correlation for data with medium- and low-quality flags, but for filtered data, quality flags appear to have no influence on correlations for various pairing of DS and SS quality flags. This is particularly important, as it means that the method can recover as much as 90 % of data that would have previously been discarded. Further analysis suggests that the standard PGN data flags for atmospheric variability and wrms are too stringent based on the quality of data recovered that exceed PGN criteria for those values.
The strong relationship between column HCHO and surface ozone provided a method for testing the new filtering method. At the University of Houston and four additional sites with nearby ozone monitors, filtered data resulted in a similar or improved relationship between column HCHO and surface ozone, with 14 %–63 % more data than when using high-quality data alone.
Airborne GCAS observations from the TRACER-AQ campaign in Houston provided an independent set of NO2 and HCHO column observations to compare against filtered Pandora DS and SS observations. The two datasets correlated well, but biases were also observed related to differences in the total column DS observations versus SS observations that have sensitivity limited to the lowest 2–4 km of the atmosphere.
Combining SS and DS data provided better hourly data coverage after correcting for biases between the two modes. Across 15 Pandora sites in the domain of recent NASA field campaigns, the HCHO column biases ranged from 0.8×10¹⁵– (8 %–60 % of the average column of ). The NO2 tropospheric column biases were less than (20 % of the average column of , except for at the Bayonne, NJ, Pandora). The biases in NO2 and HCHO between DS and SS observations were examined for trends with solar zenith angle (SZA), viewing azimuth angle, and residual stray light. No systematic behavior in the biases was found.
A more continuous hourly Pandora dataset was constructed for comparison with the hourly surface ozone. This dataset required correcting the site-specific biases in DS and SS observations as well as weighting the observations based on their different measurement durations. The combined hourly dataset showed similar or improved correlations with surface ozone, with a 30 %–40 % increase in hourly data coverage.
The proposed filtering method and improved representation of hourly average conditions by combining DS and SS data offer the community useful strategies for using Pandora observations to their fullest potential for validating geostationary satellite observations and informing local air quality.
The Pandora data are available from the PGN website (https://data.ovh.pandonia-global-network.org, last access: 27 February 2025; Cede et al., 2025; Sect. 2.1). The airborne GCAS observations during the TRACER-AQ period can be obtained from https://www-air.larc.nasa.gov/cgi-bin/ArcView/traceraq.2021 (NASA, 2021). Surface ozone data at hourly and 5 min resolutions are obtained from the EPA (https://www.epa.gov/ground-level-ozone-pollution, US EPA, 2024) and ARM-TRACER-AQ (https://adc.arm.gov/discovery/#/results/s::tracertceqTS9, Atmospheric Radiation Measurement (ARM) user facility, 2022) websites, respectively.
The supplement related to this article is available online at https://doi.org/10.5194/amt-18-2899-2025-supplement.
PR, JHC, and KRT designed the study, and PR performed the data analysis. PR and KRT interpreted the results and wrote the initial draft of the paper. LMJ, JHC, KRT, JJS, LCV, MAGD, AW, EB, and TFH provided significant conceptual input to the design of the paper and the improvement of the paper. All authors discussed the results and analysis.
At least one of the (co-)authors is a member of the editorial board of Atmospheric Measurement Techniques. The peer-review process was guided by an independent editor, and the authors also have no other competing interests to declare.
Publisher's note: Copernicus Publications remains neutral with regard to jurisdictional claims made in the text, published maps, institutional affiliations, or any other geographical representation in this paper. While Copernicus Publications makes every effort to include appropriate place names, the final responsibility lies with the authors.
We thank the PI(s), support staff, and funding agencies for establishing and maintaining the 15 Pandora sites of the PGN used in this investigation; specifically, we thank Jimmy Flynn, Maria Tzortziou, Nader Abuhassan, John Anderson, and Vitali Fioletov. We thank the ESA and NASA joint PGN for Pandora data processing and data dissemination. We thank NASA GFSC for Pandora calibration, in particular Apoorva Pandey and Bryan Place. The NASA postdoctoral program at the NASA Langley Research Center, administered by ORAU under contract with NASA, is acknowledged for funding Prajjwal Rawat. We acknowledge the GCAS groups for the TRACER-AQ 2021 field campaign datasets. We thank the EPA and TCEQ for surface ozone observations.
This research has been supported by the National Aeronautics and Space Administration postdoctoral program (grant no. 80NSSC24M0094).
This paper was edited by Folkert Boersma and reviewed by Manuel Gebetsberger and one anonymous referee.
Adams, T. J., Geddes, J. A., and Lind, E. S.: New Insights Into the Role of Atmospheric Transport and Mixing on Column and Surface Concentrations of NO2 at a Coastal Urban Site, JGR Atmospheres, 128, e2022JD038237, https://doi.org/10.1029/2022JD038237, 2023.
Atmospheric Radiation Measurement (ARM) user facility: Meteorology, radiation, and air quality data from TCEQ air quality stations (AIRQ5M), ARM Mobile Facility (HOU) External Data (satellites and others) (X1). ARM Data Center, https://adc.arm.gov/discovery/#/results/s::tracertceqTS9 (last access: 27 February 2025), 2022.
Brohede, S. M., Haley, C. S., McLinden, C. A., Sioris, C. E., Murtagh, D. P., Petelina, S. V., Llewellyn, E. J., Bazureau, A., Goutail, F., Randall, C. E., Lumpe, J. D., Taha, G., Thomasson, L. W., and Gordley, L. L.: Validation of Odin/OSIRIS stratospheric NO2 profiles, J. Geophys. Res., 112, 2006JD007586, https://doi.org/10.1029/2006JD007586, 2007.
Cede, A.: TN on Manual for Blick Software Suite manual version 1.8-5, Pandonia Global Network, https://www.pandonia-global-network.org/wp-content/uploads/2024/08/BlickSoftwareSuite_Manual_v1-8-5.pdf (last access: 27 February 2025), 2024.
Cede, A., Herman, J., Richter, A., Krotkov, N., and Burrows, J.: Measurements of nitrogen dioxide total column amounts using a Brewer double spectrophotometer in direct Sun mode, J. Geophys. Res.-Atmos., 111, D05304, https://doi.org/10.1029/2005JD006585, 2006.
Cede, A., Santana, D., Tiefengraber, M., Muller, M., and Gebetsberger, M.: Fiducial Reference Measurements for Air Quality, TN on change/upgrade of instrument, Pandonia Global Network, https://www.pandonia-global-network.org/wp-content/uploads/2022/12/LuftBlick_FRM4AQ_ 90InstrumentChangeUpgrade_RP_2019002_v8.pdf (last access: 27 February 2025), 2022.
Cede, A., Tiefengraber, M., Gebetsberger, M., and Lind, E.: TN on Pandonia Global Network Data Products Readme Document version 1.8-8, https://www.pandonia-global-network.org/wp-content/uploads/2025/01/PGN_DataProducts_Readme_v1-8-10.pdf (last access: 20 March 2025), 2025.
Chang, L.-S., Kim, D., Hong, H., Kim, D.-R., Yu, J.-A., Lee, K., Lee, H., Kim, D., Hong, J., Jo, H.-Y., and Kim, C.-H.: Evaluation of correlated Pandora column NO2 and in situ surface NO2 measurements during GMAP campaign, Atmos. Chem. Phys., 22, 10703–10720, https://doi.org/10.5194/acp-22-10703-2022, 2022.
Choi, S., Lamsal, L. N., Follette-Cook, M., Joiner, J., Krotkov, N. A., Swartz, W. H., Pickering, K. E., Loughner, C. P., Appel, W., Pfister, G., Saide, P. E., Cohen, R. C., Weinheimer, A. J., and Herman, J. R.: Assessment of NO2 observations during DISCOVER-AQ and KORUS-AQ field campaigns, Atmos. Meas. Tech., 13, 2523–2546, https://doi.org/10.5194/amt-13-2523-2020, 2020.
Crawford, J. H., Ahn, J. Y., Al-Saadi, J., Chang, L., Emmons, L. K., Kim, J., Lee, G., Park, J. H., Park, R. J., Woo, J. H., and Song, C. K., The Korea–United States air quality (KORUS-AQ) field study, Elem. Sci. Anth., 9, 00163, https://doi.org/10.1525/elementa.2020.00163 2021.
Di Bernardino, A., Mevi, G., Iannarelli, A. M., Falasca, S., Cede, A., Tiefengraber, M., and Casadio, S.: Temporal Variation of NO2 and O3 in Rome (Italy) from Pandora and In Situ Measurements, Atmosphere, 14, 594, https://doi.org/10.3390/atmos14030594, 2023.
Frieß, U., Beirle, S., Alvarado Bonilla, L., Bösch, T., Friedrich, M. M., Hendrick, F., Piters, A., Richter, A., van Roozendael, M., Rozanov, V. V., Spinei, E., Tirpitz, J.-L., Vlemmix, T., Wagner, T., and Wang, Y.: Intercomparison of MAX-DOAS vertical profile retrieval algorithms: studies using synthetic data, Atmos. Meas. Tech., 12, 2155–2181, https://doi.org/10.5194/amt-12-2155-2019, 2019.
Gebetsberger, M. and Tiefengraber, M.: on Evolution of QA/QC Strategies, Pandonia Global Network, https://www.pandonia-global-network.org/wp-content/uploads/2023/08/LuftBlick_FRM4AQ-2_Evolution-Of-QAQC-Strategies_TN_2023008_v1.pdf, last access: 27 September 2023.
Gebetsberger, M., Tiefengraber, M., Cede, A.: Fiducial Reference Measurements for Air Quality, TN on Data Quality Flagging Generic Procedure Evolution, Pandonia Global Network, https://www.pandonia-global-network.org/wp-content/uploads/2023/01/LuftBlick_FRM4AQ_DataQualityFlaggingGenericProcedureEvolution_TN_2019008_v7.pdf (last access: 27 September 2023), 2022.
Goldberg, D. L., Lamsal, L. N., Loughner, C. P., Swartz, W. H., Lu, Z., and Streets, D. G.: A high-resolution and observationally constrained OMI NO2 satellite retrieval, Atmos. Chem. Phys., 17, 11403–11421, https://doi.org/10.5194/acp-17-11403-2017, 2017.
Herman, J., Cede, A., Spinei, E., Mount, G., Tzortziou, M., and Abuhassan, N.: NO2 column amounts from ground-based Pandora and MFDOAS spectrometers using the direct-sun DOAS technique: Intercomparisons and application to OMI validation, J. Geophys. Res., 114, D13307, https://doi.org/10.1029/2009JD011848, 2009.
Herman, J., Spinei, E., Fried, A., Kim, J., Kim, J., Kim, W., Cede, A., Abuhassan, N., and Segal-Rozenhaimer, M.: NO2 and HCHO measurements in Korea from 2012 to 2016 from Pandora spectrometer instruments compared with OMI retrievals and with aircraft measurements during the KORUS-AQ campaign, Atmos. Meas. Tech., 11, 4583–4603, https://doi.org/10.5194/amt-11-4583-2018, 2018.
Herman, J., Abuhassan, N., Kim, J., Kim, J., Dubey, M., Raponi, M., and Tzortziou, M.: Underestimation of column NO2 amounts from the OMI satellite compared to diurnally varying ground-based retrievals from multiple PANDORA spectrometer instruments, Atmos. Meas. Tech., 12, 5593–5612, https://doi.org/10.5194/amt-12-5593-2019, 2019.
Ialongo, I., Virta, H., Eskes, H., Hovila, J., and Douros, J.: Comparison of TROPOMI/Sentinel-5 Precursor NO2 observations with ground-based measurements in Helsinki, Atmos. Meas. Tech., 13, 205–218, https://doi.org/10.5194/amt-13-205-2020, 2020.
Judd, L. M., Al-Saadi, J. A., Valin, L. C., Pierce, R. B., Yang, K., Janz, S. J., Kowalewski, M. G., Szykman, J. J., Tiefengraber, M., and Mueller, M.: The Dawn of Geostationary Air Quality Monitoring: Case Studies From Seoul and Los Angeles, Front. Env. Sci., 6, 85, https://doi.org/10.3389/fenvs.2018.00085, 2018.
Judd, L. M., Al-Saadi, J. A., Janz, S. J., Kowalewski, M. G., Pierce, R. B., Szykman, J. J., Valin, L. C., Swap, R., Cede, A., Mueller, M., Tiefengraber, M., Abuhassan, N., and Williams, D.: Evaluating the impact of spatial resolution on tropospheric NO2 column comparisons within urban areas using high-resolution airborne data, Atmos. Meas. Tech., 12, 6091–6111, https://doi.org/10.5194/amt-12-6091-2019, 2019.
Judd, L. M., Al-Saadi, J. A., Szykman, J. J., Valin, L. C., Janz, S. J., Kowalewski, M. G., Eskes, H. J., Veefkind, J. P., Cede, A., Mueller, M., Gebetsberger, M., Swap, R., Pierce, R. B., Nowlan, C. R., Abad, G. G., Nehrir, A., and Williams, D.: Evaluating Sentinel-5P TROPOMI tropospheric NO2 column densities with airborne and Pandora spectrometers near New York City and Long Island Sound, Atmos. Meas. Tech., 13, 6113–6140, https://doi.org/10.5194/amt-13-6113-2020, 2020.
Kim, J., Kim, M., and Choi, M.: Monitoring aerosol properties in east asia from geostationary orbit: GOCI, MI and GEMS, in Air Pollution in Eastern Asia: An Integrated Perspective ISSI Scientific Report Series, Springer, Cham, https://doi.org/10.1007/978-3-319-59489-7_15 323–333, 2017.
Kim, S., Kim, D., Hong, H., Chang, L.-S., Lee, H., Kim, D.-R., Kim, D., Yu, J.-A., Lee, D., Jeong, U., Song, C.-K., Kim, S.-W., Park, S. S., Kim, J., Hanisco, T. F., Park, J., Choi, W., and Lee, K.: First-time comparison between NO2 vertical columns from Geostationary Environmental Monitoring Spectrometer (GEMS) and Pandora measurements, Atmos. Meas. Tech., 16, 3959–3972, https://doi.org/10.5194/amt-16-3959-2023, 2023.
Liu, O., Li, Z., Lin, Y., Fan, C., Zhang, Y., Li, K., Zhang, P., Wei, Y., Chen, T., Dong, J., and De Leeuw, G.: Evaluation of the first year of Pandora NO2 measurements over Beijing and application to satellite validation, Gases/Remote Sensing/Validation and Intercomparisons, https://doi.org/10.5194/amt-2023-177, 2023.
NASA: Data archive for the TRACER-AQ 2021 field campaign, Langely Recerch Center [data set], https://www-air.larc.nasa.gov/cgi-bin/ArcView/traceraq.2021 (last access: 27 February 2025), 2021.
Nawaz, M. O., Johnson, J., Yarwood, G., de Foy, B., Judd, L., and Goldberg, D. L.: An intercomparison of satellite, airborne, and ground-level observations with WRF–CAMx simulations of NO2 columns over Houston, Texas, during the September 2021 TRACER-AQ campaign, Atmos. Chem. Phys., 24, 6719–6741, https://doi.org/10.5194/acp-24-6719-2024, 2024.
Nowlan, C. R., Liu, X., Janz, S. J., Kowalewski, M. G., Chance, K., Follette-Cook, M. B., Fried, A., González Abad, G., Herman, J. R., Judd, L. M., Kwon, H.-A., Loughner, C. P., Pickering, K. E., Richter, D., Spinei, E., Walega, J., Weibring, P., and Weinheimer, A. J.: Nitrogen dioxide and formaldehyde measurements from the GEOstationary Coastal and Air Pollution Events (GEO-CAPE) Airborne Simulator over Houston, Texas, Atmos. Meas. Tech., 11, 5941–5964, https://doi.org/10.5194/amt-11-5941-2018, 2018.
Park, J.-U., Park, J.-S., Diaz, D. S., Gebetsberger, M., Müller, M., Shalaby, L., Tiefengraber, M., Kim, H.-J., Park, S. S., Song, C.-K., and Kim, S.-W.: Spatiotemporal inhomogeneity of total column NO2 in a polluted urban area inferred from TROPOMI and Pandora intercomparisons, GISci. Remote Sens., 59, 354–373, https://doi.org/10.1080/15481603.2022.2026640, 2022.
Reed, A. J., Thompson, A. M., Kollonige, D. E., Martins, D. K., Tzortziou, M. A., Herman, J. R., Berkoff, T. A., Abuhassan, N. K., and Cede, A.: Effects of local meteorology and aerosols on ozone and nitrogen dioxide retrievals from OMI and pandora spectrometers in Maryland, USA during DISCOVER-AQ 2011, J. Atmos. Chem., 72, 455–482, https://doi.org/10.1007/s10874-013-9254-9, 2015.
Schroeder, J. R., Crawford, J. H., Fried, A., Walega, J., Weinheimer, A., Wisthaler, A., Müller, M., Mikoviny, T., Chen, G., Shook, M., Blake, D. R., Diskin, G., Estes, M., Thompson, A. M., Lefer, B. L., Long, R., and Mattson, E.: Formaldehyde column density measurements as a suitable pathway to estimate near-surface ozone tendencies from space, J. Geophys. Res.-Atmos., 121, 13088–13112, https://doi.org/10.1002/2016JD025419, 2016.
Spinei, E., Whitehill, A., Fried, A., Tiefengraber, M., Knepp, T. N., Herndon, S., Herman, J. R., Müller, M., Abuhassan, N., Cede, A., Richter, D., Walega, J., Crawford, J., Szykman, J., Valin, L., Williams, D. J., Long, R., Swap, R. J., Lee, Y., Nowak, N., and Poche, B.: The first evaluation of formaldehyde column observations by improved Pandora spectrometers during the KORUS-AQ field study, Atmos. Meas. Tech., 11, 4943–4961, https://doi.org/10.5194/amt-11-4943-2018, 2018.
Spinei, E., Tiefengraber, M., Müller, M., Gebetsberger, M., Cede, A., Valin, L., Szykman, J., Whitehill, A., Kotsakis, A., Santos, F., Abbuhasan, N., Zhao, X., Fioletov, V., Lee, S. C., and Swap, R.: Effect of polyoxymethylene (POM-H Delrin) off-gassing within the Pandora head sensor on direct-sun and multi-axis formaldehyde column measurements in 2016–2019, Atmos. Meas. Tech., 14, 647–663, https://doi.org/10.5194/amt-14-647-2021, 2021.
Szykman, J., L. Valin, K. Chance, X. Liu, G. Abad, C. Nowlan, R. Cohen, D. Flittner, T. Hanisco, J. Herman, M. Newchurch, M. Johnson, J. Judd, R. Pierce, J. Sullivan, R. Stauffer, AND M. Tisdale. TROPOSPHERIC EMISSIONS: MONITORING OF POLLUTION (TEMPO) PROJECT Level 2 Science Data Product Validation Plan, NASA, Washington, DC, 2023.
Szykman, J., Swap, R., Leffer, B., Valin, L., Lee, S. C., Fioletov, V., Zhao, X., Davis, J., Williams, D., Abuhassan, N., Shalaby, L., Cede, A., Tiefengraber, M., Müller, M., Kotsakis, A., Santos, F., and Robinson, J.: Connecting in-situ and Satellite Monitoring in Support of the Canada – US Air Quality Agreement, Environmental Managers magazine, Air and Waste Management Association, 1–7, https://www.awma.org/emjune19 (last access: 27 September 2023), 2019.
Tirpitz, J.-L., Frieß, U., Hendrick, F., Alberti, C., Allaart, M., Apituley, A., Bais, A., Beirle, S., Berkhout, S., Bognar, K., Bösch, T., Bruchkouski, I., Cede, A., Chan, K. L., den Hoed, M., Donner, S., Drosoglou, T., Fayt, C., Friedrich, M. M., Frumau, A., Gast, L., Gielen, C., Gomez-Martín, L., Hao, N., Hensen, A., Henzing, B., Hermans, C., Jin, J., Kreher, K., Kuhn, J., Lampel, J., Li, A., Liu, C., Liu, H., Ma, J., Merlaud, A., Peters, E., Pinardi, G., Piters, A., Platt, U., Puentedura, O., Richter, A., Schmitt, S., Spinei, E., Stein Zweers, D., Strong, K., Swart, D., Tack, F., Tiefengraber, M., van der Hoff, R., van Roozendael, M., Vlemmix, T., Vonk, J., Wagner, T., Wang, Y., Wang, Z., Wenig, M., Wiegner, M., Wittrock, F., Xie, P., Xing, C., Xu, J., Yela, M., Zhang, C., and Zhao, X.: Intercomparison of MAX-DOAS vertical profile retrieval algorithms: studies on field data from the CINDI-2 campaign, Atmos. Meas. Tech., 14, 1–35, https://doi.org/10.5194/amt-14-1-2021, 2021.
Travis, K. R., Judd, L. M., Crawford, J. H., Chen, G., Szykman, J., Whitehill, A., Valin, L. C., Spinei, E., Janz, S., Nowlan, C. R., Kwon, H., Fried, A., and Walega, J.: Can Column Formaldehyde Observations Inform Air Quality Monitoring Strategies for Ozone and Related Photochemical Oxidants?, JGR Atmospheres, 127, e2022JD036638, https://doi.org/10.1029/2022JD036638, 2022.
Tzortziou, M., Herman, J. R., Cede, A., and Abuhassan, N.: High precision, absolute total column ozone measurements from the Pandora spectrometer system: Comparisons with data from a Brewer double monochromator and Aura OMI, J. Geophys. Res., 117, 2012JD017814, https://doi.org/10.1029/2012JD017814, 2012.
Tzortziou, M., Kwong, C. F., Goldberg, D., Schiferl, L., Commane, R., Abuhassan, N., Szykman, J. J., and Valin, L. C.: Declines and peaks in NO2 pollution during the multiple waves of the COVID-19 pandemic in the New York metropolitan area, Atmos. Chem. Phys., 22, 2399–2417, https://doi.org/10.5194/acp-22-2399-2022, 2022.
Tzortziou, M., Loughner, C. P., Goldberg, D. L., Judd, L., Nauth, D., Kwong, C. F., Lin, T., Cede, A., and Abuhassan, N.: Intimately tracking NO2 pollution over the New York City – Long Island Sound land-water continuum: An integration of shipboard, airborne, satellite observations, and models, Sci. Total Environ., 897, 165144, https://doi.org/10.1016/j.scitotenv.2023.165144, 2023.
US EPA: Air Quality System Data Mart, https://www.epa.gov/outdoor-air-quality-data (last access: 27 February 2025), 2024.
Verhoelst, T., Compernolle, S., Pinardi, G., Lambert, J.-C., Eskes, H. J., Eichmann, K.-U., Fjæraa, A. M., Granville, J., Niemeijer, S., Cede, A., Tiefengraber, M., Hendrick, F., Pazmiño, A., Bais, A., Bazureau, A., Boersma, K. F., Bognar, K., Dehn, A., Donner, S., Elokhov, A., Gebetsberger, M., Goutail, F., Grutter de la Mora, M., Gruzdev, A., Gratsea, M., Hansen, G. H., Irie, H., Jepsen, N., Kanaya, Y., Karagkiozidis, D., Kivi, R., Kreher, K., Levelt, P. F., Liu, C., Müller, M., Navarro Comas, M., Piters, A. J. M., Pommereau, J.-P., Portafaix, T., Prados-Roman, C., Puentedura, O., Querel, R., Remmers, J., Richter, A., Rimmer, J., Rivera Cárdenas, C., Saavedra de Miguel, L., Sinyakov, V. P., Stremme, W., Strong, K., Van Roozendael, M., Veefkind, J. P., Wagner, T., Wittrock, F., Yela González, M., and Zehner, C.: Ground-based validation of the Copernicus Sentinel-5P TROPOMI NO2 measurements with the NDACC ZSL-DOAS, MAX-DOAS and Pandonia global networks, Atmos. Meas. Tech., 14, 481–510, https://doi.org/10.5194/amt-14-481-2021, 2021.
Wang, B., Geddes, J. A., Adams, T. J., Lind, E. S., McDonald, B. C., He, J., Harkins, C., Li, D., and Pfister, G. G.: Implications of Sea Breezes on Air Quality Monitoring in a Coastal Urban Environment: Evidence From High Resolution Modeling of NO2 and O3, J. Geophys. Res.-Atmos., 128, e2022JD037860, https://doi.org/10.1029/2022JD037860, 2023.
Wang, S., Pongetti, T. J., Sander, S. P., Spinei, E., Mount, G. H., Cede, A., and Herman, J.: Direct Sun Measurements of NO2 column abundances from Table Mountain, California: Intercomparison of low-and high-resolution spectrometers, J. Geophys. Res.-Atmos., 115, D13305, https://doi.org/10.1029/2009JD013503, 2010.
Zoogman, P., Liu, X., Suleiman, R. M., Pennington, W. F., Flittner, D. E., Al-Saadi, J. A., Hilton, B. B., Nicks, D. K., Newchurch, M. J., Carr, J. L., Janz, S. J., Andraschko, M. R., Arola, A., Baker, B. D., Canova, B. P., Chan Miller, C., Cohen, R. C., Davis, J. E., Dussault, M. E., Edwards, D. P., Fishman, J., Ghulam, A., González Abad, G., Grutter, M., Herman, J. R., Houck, J., Jacob, D. J., Joiner, J., Kerridge, B. J., Kim, J., Krotkov, N. A., Lamsal, L., Li, C., Lindfors, A., Martin, R. V., McElroy, C. T., McLinden, C., Natraj, V., Neil, D. O., Nowlan, C. R., O'Sullivan, E. J., Palmer, P. I., Pierce, R. B., Pippin, M. R., Saiz-Lopez, A., Spurr, R. J. D., Szykman, J. J., Torres, O., Veefkind, J. P., Veihelmann, B., Wang, H., Wang, J., and Chance, K.: Tropospheric emissions: Monitoring of pollution (TEMPO), J. Quant. Spectrosc. Ra., 186, 17–39, https://doi.org/10.1016/j.jqsrt.2016.05.008, 2017.