the Creative Commons Attribution 4.0 License.
the Creative Commons Attribution 4.0 License.
 | 21 Jul 2025
Evolution of wind field in the atmospheric boundary layer using multiple-source observations during the passage of Super Typhoon Doksuri (2305)
Xiaoye Wang
Jing Xu
Songhua Wu
Qichao Wang
Guangyao Dai
Peizhi Zhu
Zhizhong Su
Sai Chen
Xiaomeng Shi
Mengqi Fan
The accurate wind field observation of the tropical cyclone (TC) boundary layer is of great significance in improving the TC track and intensity forecasting. To investigate the vertical structure of TC boundary layer during the landfall process of Super Typhoon Doksuri, three kinds of instruments, including the coherent Doppler lidar (CDL), radar wind profiler (RWP) and automatic weather station (AWS), are deployed at two sites in Xiamen, Fujian province. The data fusion method is developed to obtain the complete wind speed profiles covering the whole atmospheric boundary layer (ABL) based on the above instruments. The wind speeds in the near-field blind zones of CDL observation are interpolated by combining the AWS measurements at 10 m. The CDL provides high-temporal- and high-spatial-resolution wind speed profiles from tens of meters to its highest detection height. The wind speeds above the highest detection height of the CDL are supplemented with the RWP measurements. The hourly mean wind speed profiles are compared with traditional models. Generally, the wind speed profiles fit well with the power law in the lower part of the ABL before wind speed changes rapidly. However, it would cause a large error (up to 73 %) to describe the exact wind speed profiles with the power law during and after the typhoon's passage, especially when the wind speed is almost constant with height or when wind shear exists. Then, fine structures and evolutionary processes of the wind field in the ABL during the typhoon landfall are investigated. In addition, the wind field distribution and wind speed variation with distance from the typhoon center are statistically analyzed. The joint wind field measurements of CDL, RWP and AWS have the broad application prospects on the dynamics study of the TC boundary layer and the improvement of the boundary layer parameterization scheme in numerical forecast models.
- Article
(13312 KB) - Full-text XML
- BibTeX
- EndNote


As one of the most severe meteorological disasters, the tropical cyclone (TC) causes heavy casualties and significant economic losses in the southeastern coastal areas of China. Therefore, the accurate prediction of the TC track and intensity is vitally important. The wind field observation of the TC boundary layer and the study of its vertical structure are of great importance to improve the boundary layer parameterization scheme in numerical forecast models and to deepen the understanding of the TC evolution mechanism.
Over the past decades, research on TC boundary layer observations has been widely conducted by radiosonde balloons, GPS dropsondes, anemometers, radar wind profilers (RWP) and weather radars. Many studies focus on the characteristics of the wind field, especially the mean wind speed profiles. The obtained mean wind speed profiles have been compared with the traditional models below 500 m to evaluate the applicability of different models during different TC events (He et al., 2020, 2023b; Luo et al., 2020; Shu et al., 2017; Song et al., 2016). Turbulent parameters below 500 m are estimated from high-frequency wind measurements to analyze the kinematic and thermodynamic boundary layer structures, including momentum flux (Duan et al., 2017; He et al., 2022; Li et al., 2022; Ming et al., 2023, 2014; Tang et al., 2018; Zhao et al., 2022; Zhou et al., 2023), turbulence intensity (Li et al., 2022; Xia et al., 2021), turbulence integral scale (Luo et al., 2020; Wang et al., 2017; Xia et al., 2021), turbulent kinetic energy (TKE) (Duan et al., 2017; He et al., 2022, 2023a; Li et al., 2022; Ming et al., 2023; Zhao et al., 2022), vertical eddy diffusivity (Ming et al., 2023; Tang et al., 2018; Zhao et al., 2022), turbulent kinetic energy dissipation rate (TKEDR) (Fang et al., 2023; Ming et al., 2023), turbulent spatial scales (Duan et al., 2017; He et al., 2022; Lan et al., 2023; Wang et al., 2017; Xia et al., 2021), gust factor (Shu et al., 2017; Xia et al., 2021; Zhou et al., 2023), low-level jet (He et al., 2023b; Li et al., 2019) and wind shear (Shu et al., 2017). And the variation of several characteristic height scales during the TC evolution was also considered, such as the mixed layer depth, the inflow layer depth and the height of the maximum wind speed (He et al., 2018; Ming et al., 2015, 2014; Tang et al., 2018; Zhao et al., 2022). Additionally, a few aircraft campaigns have been reported to analyze the characteristics of the wind field, system-scale circulation and turbulent structures during hurricane and typhoon events (He et al., 2023a; Lussier et al., 2014; Sparks et al., 2019; Tang et al., 2021; Zhang et al., 2010, 2011; Zhao et al., 2020). Generally, TC boundary layer observations and research have made significant progresses after years of development. However, the continuity, temporal–spatial resolution and vertical detection capability of TC boundary layer observations need to be further improved.
With the development of laser remote sensing technology, Doppler wind lidar has been widely used in wind field and turbulence observations due to its advantages of high-accuracy, high-temporal- and high-spatial-resolution, vertically resolved, and continuous capabilities. In recent years, several studies have been conducted to investigate the TC boundary layer structure using Doppler wind lidars. Aiming at typhoons Dujuan and Soudelor that occurred in 2015, Tsai et al. (2019) estimated the mean wind speed profiles within different average periods by the ground-based coherent Doppler lidar (CDL). The wind speed profiles at different evolution stages of TC development were compared with logarithmic law and power law models under the assumption of neutral conditions. Shi et al. (2021) analyzed the characteristics of the wind field, TKE and boundary layer height scales of Typhoon Lekima (2019) based on five ground-based CDLs. Similar to the above studies, Chen et al. (2023) captured typhoons In-fa and Chanthu in 2021 with ground-based CDL observations. Considering the volume-averaging effect in CDL detection, they proposed a correct method based on a wind spectrum model to improve the retrieval accuracy of turbulent parameters. Except for the ground-based CDLs, an airborne CDL system was used, and the retrieval accuracy of the wind field was validated during Tropical Storm Erika (2015). The wind speeds measured by the CDL showed good agreements with that observed by the GPS dropsonde (Zhang et al., 2018). In summary, the feasibility and potential of the CDL in TC observations have been verified by the above studies. However, the detection range of CDLs is usually significantly reduced because typhoons bring heavy rainfall, and the energy of the emitted laser beam is rapidly attenuated by raindrops. The wind field observations could be realized up to a few hundred meters instead of covering the entire atmospheric boundary layer (ABL).
To study the vertical dynamic structure of the TC boundary layer during the passage of Super Typhoon Doksuri, combined wind field observations with CDL, RWP and automatic weather station (AWS) are performed in this paper. The consistency of the wind field measured by the above instruments is first validated. And the no-blind-zone wind profiles covering the entire ABL are obtained and compared with a traditional logarithmic law, power law and other well-known models based on the combined measurements of CDL, RWP and AWS. The relative errors of the power law model in estimating the wind speed are evaluated as well. Then, fine structures and evolutionary processes of the wind field in the ABL during the typhoon landfall are investigated in detail. In addition, the wind field distribution and wind speed variation with the distance from the typhoon center are statistical analyzed.
The paper is organized as follows. The description of the Super Typhoon Doksuri and all involved instruments is presented in Sect. 2. Section 3 introduces the methods used to estimate traditional wind speed profile models and no-blind-zone wind speed profiles. The comparison of the mean wind speed profiles with several well-known models and analysis of the wind field evolution processes are provided in Sect. 4. Then, statistical analyses of the wind field distribution and wind speed variation with the distance from the typhoon center are also performed in this section. Section 5 summarizes the conclusions and describes the outlook of future studies.
2.1 Super Typhoon Doksuri description
As the fifth named storm of the 2023, Typhoon Doksuri formed in the northwestern Pacific Ocean on 21 July 2023. Its best track and intensity information are displayed in Fig. 1a and are from the China Meteorological Administration (CMA) TC Best Track Dataset (Lu et al., 2021; Ying et al., 2014). Typhoon Doksuri first moved northwesterly with increasing intensity and developed into a severe typhoon at 08:00 local standard time (LST, LST=UTC + 8) on 24 July. Then, it reached the status of a super typhoon at 20:00 LST on 24 July. Before 11:00 LST on 28 July, it remained at severe typhoon and super typhoon levels for about 96 h. At about 09:55 LST on 28 July, the severe Typhoon Doksuri caused a landfall in Jinjiang, Fujian province, with a maximum wind speed of 50 m s−1 and minimum sea level pressure of 945 hPa. After the landfall, it continued to move in the northwest direction and brought heavy rainfall to Fujian province and even north China and Huang and Huai areas.
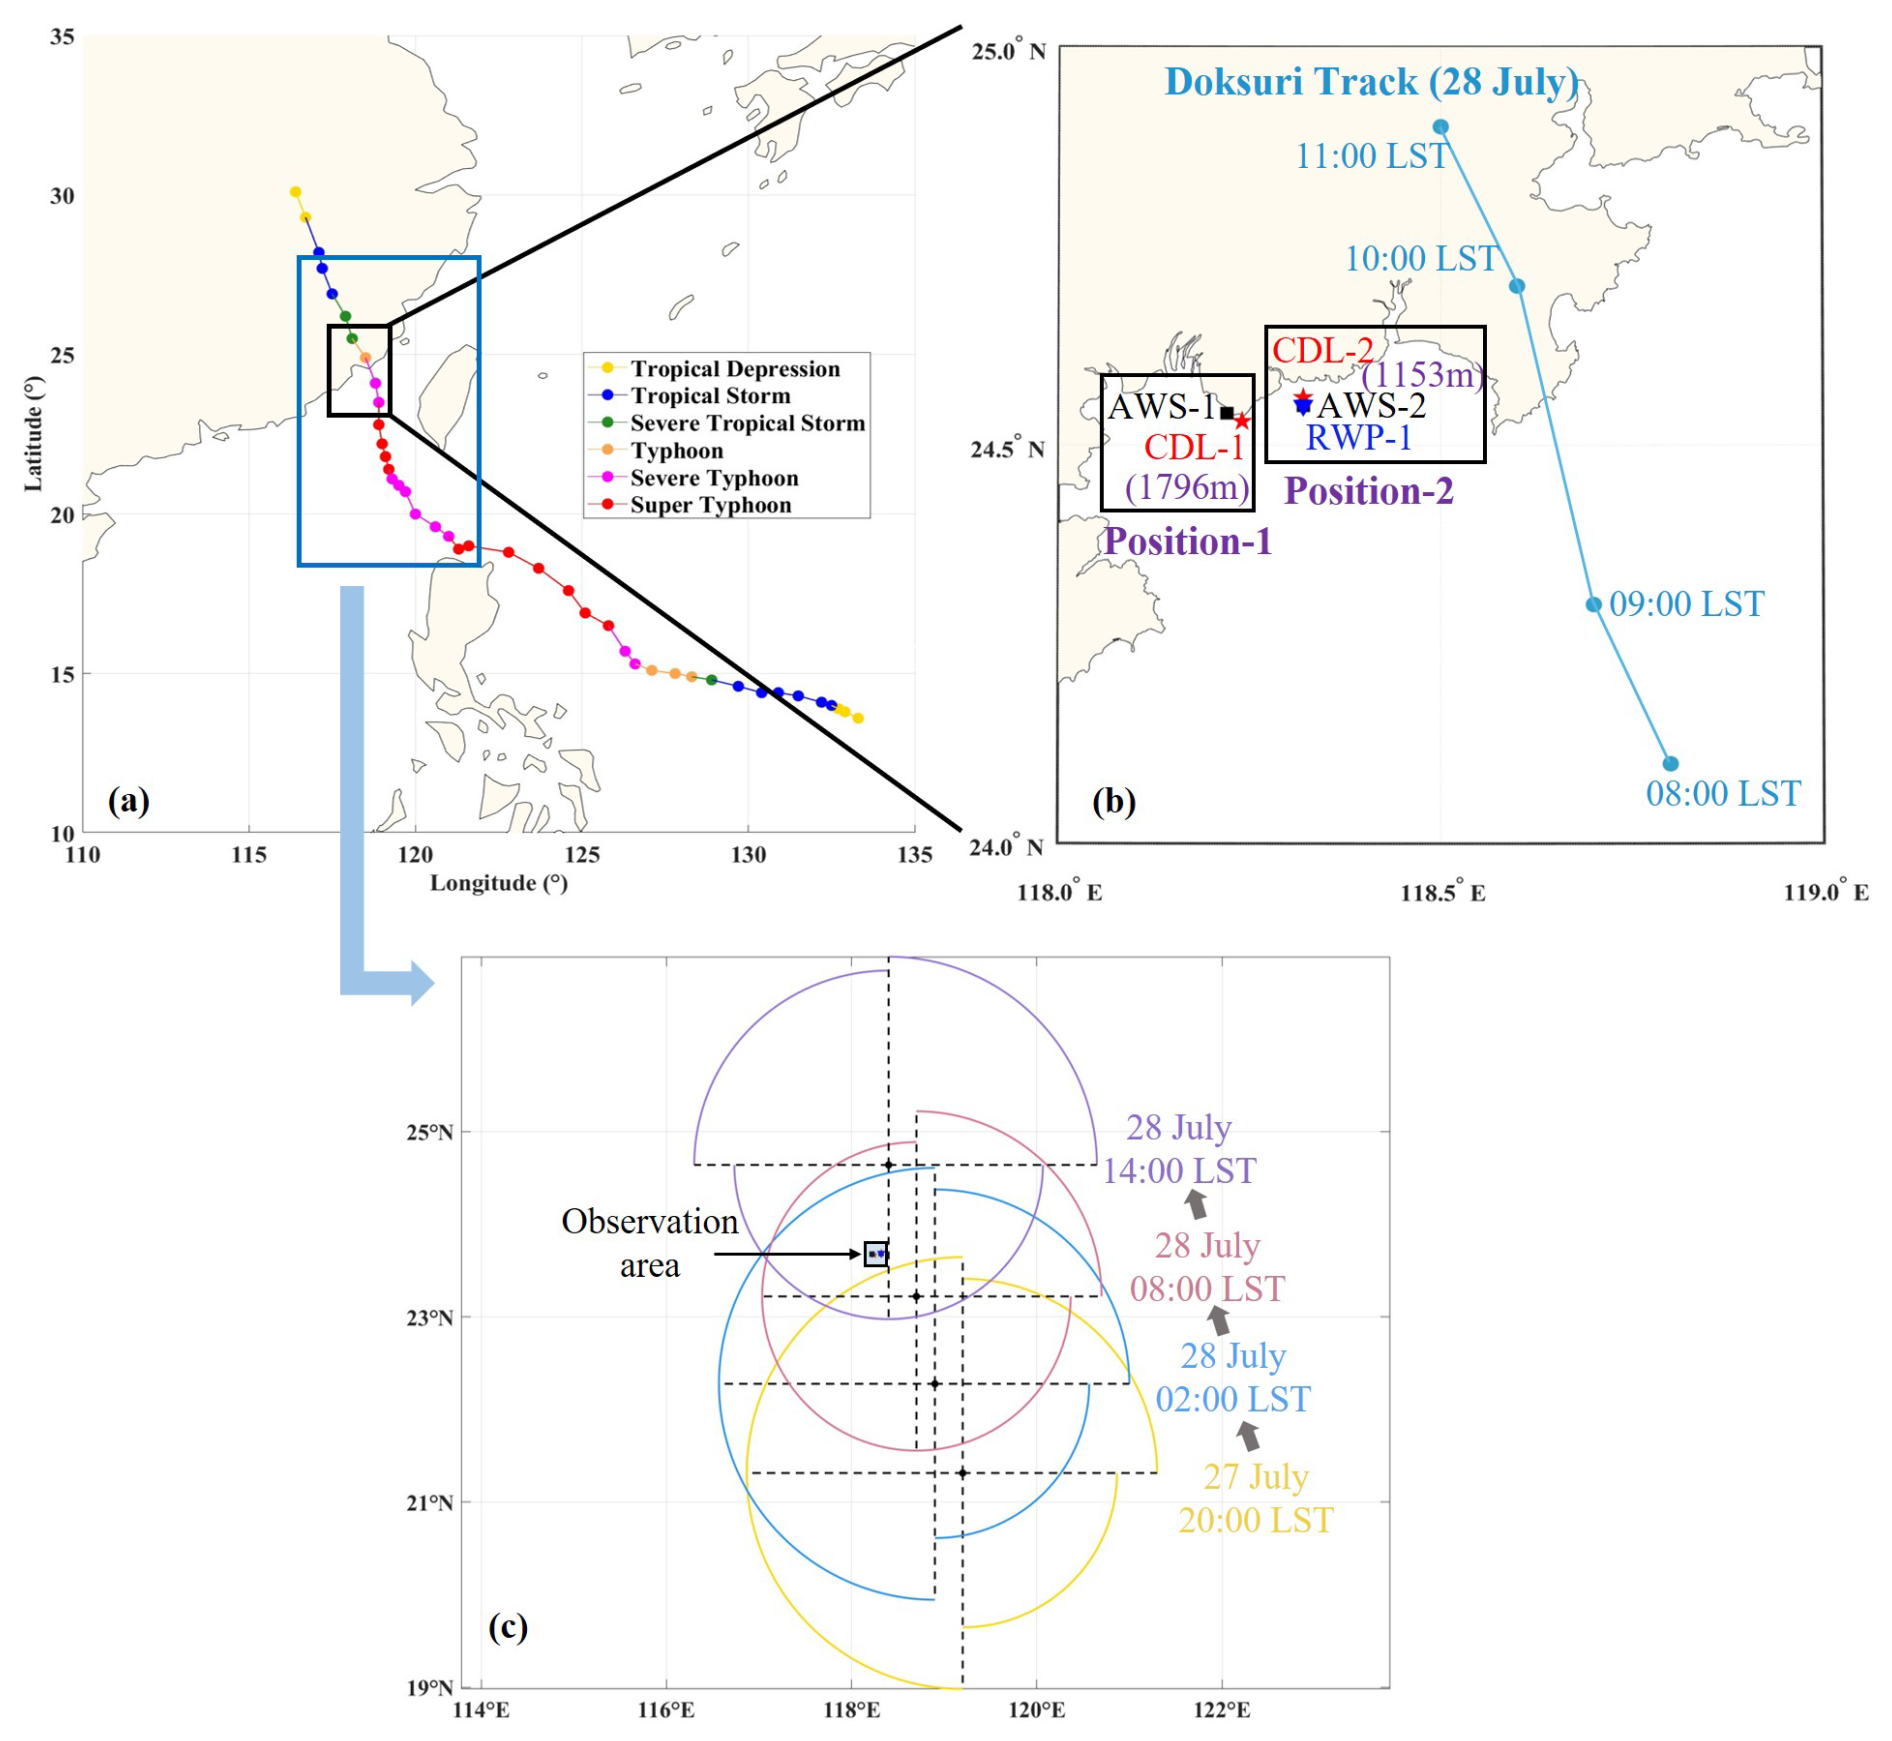
Figure 1(a) Best track and intensity of Super Typhoon Doksuri. (b) The layout of the observation instruments including CDLs (red stars), AWSs (black squares) and RWP (blue triangle). (c) The relative position of the observation area and the 34 kn wind circles.
2.2 Instruments
During the passage of Super Typhoon Doksuri, all instruments including CDL, RWP and AWS were deployed at two sites in Xiamen, Fujian province. The layout of the observation instruments is shown in Fig. 1b. The distances between each CDL and the nearest AWS are labeled in purple font. And the other details of the observation areas and key specifications of all instruments are summarized in Table 1. According to the 34 kn wind circle information from the Joint Typhoon Warning Center (JTWC), the observation area was within the 34 kn wind circle from 20:00 LST on 27 July to 14:00 LST on 28 July, as exhibited in Fig. 1c.
Table 1Details of the observation areas and instrument key specifications.
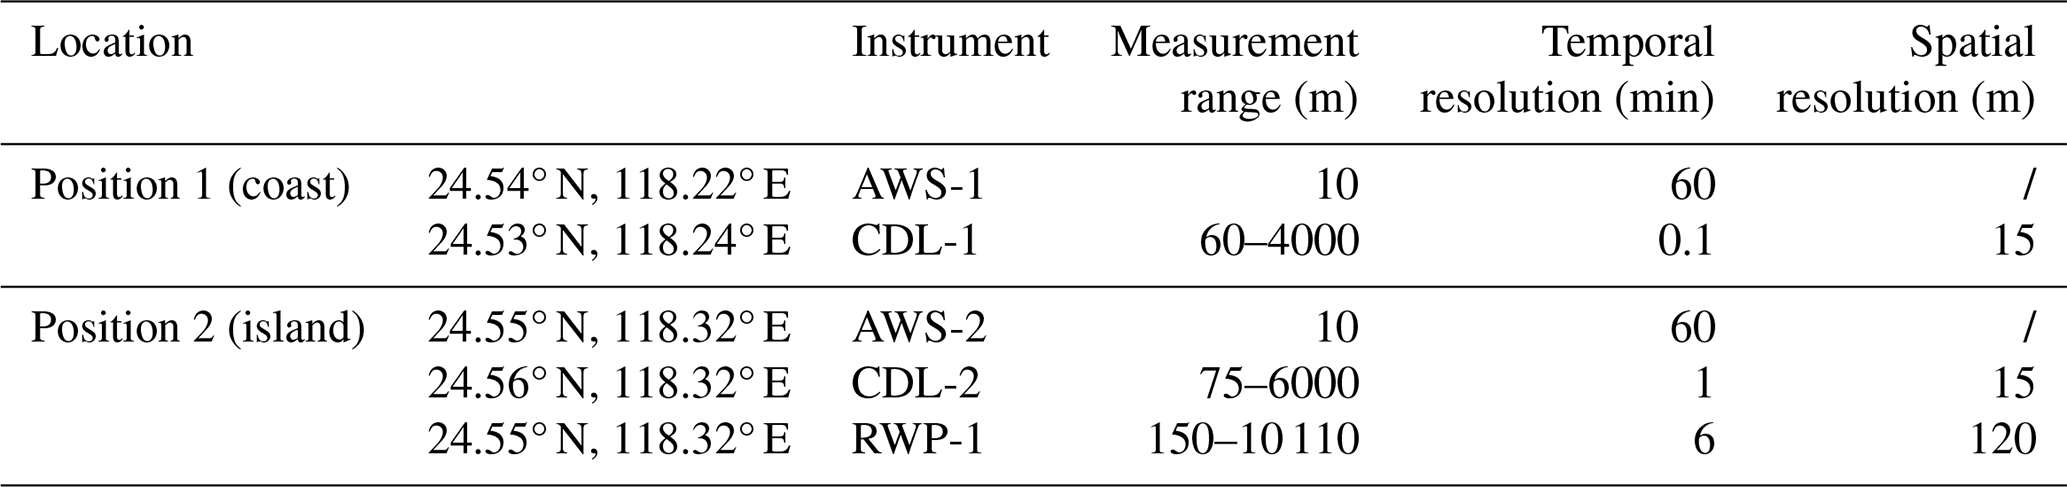
The AWS provides basic meteorological elements measurements of wind speed, wind direction, temperature, relative humidity and pressure information near the ground. Two CDLs used in this study are jointly developed by Ocean University of China (OUC) and Qingdao Leice Transient Technology Co., Ltd. (https://www.leice-lidar.com/en/, last access: 11 July 2024). Their principle and schematic diagram have been introduced in detail in another study (Wu et al., 2016). The type of CDL-1 is WindMast PBL while the type of CDL-2 is Wind3D 6000, and their key specifications can be found in a separate paper (Wu et al., 2022). The RWP used in this paper belongs to the ground-based RWP network and is produced by the 23rd Institute of China Aerospace Science and Industry Corporation (http://www.casic23.com.cn/index.html, last access: 24 July 2024). Its principle and main parameters have been reported systematically in several studies (Liu et al., 2019; Guo et al., 2023).
Three-dimensional wind field profiles can be obtained by the CDL and RWP measurements with different temporal–spatial resolutions. To ensure the measurement accuracy, the quality control needs to be considered. As reported by previous studies (Jin et al., 2022; Wang et al., 2023), the CDL-measured wind field data with the signal-to-noise ratio (SNR) of less than 8 dB is eliminated to ensure the reliability. For the RWP, the horizontal speed and direction results cannot be used if the horizontal credibility is less than 100 %. It needs to emphasize that the measured vertical velocity is inaccurate during precipitation causes the Doppler spectrum of the aerosol and precipitation to be detected simultaneously and have a bimodal or multimodal distribution (Aoki et al., 2016). The Doppler frequency of the precipitation and vertical velocity could be obtained accurately by fitting the two-component or multivariate Gaussian model. This method is being developed by other colleagues in our group; thus, the vertical velocity variation cannot be analyzed in this paper.
The accuracy of the horizontal speed and horizontal direction observed by CDLs have already been evaluated with mast-mounted cup anemometers and wind vanes at Haiyang, Shandong province, on July 2021 (Wu et al., 2022). Good agreement between them, with the speed and direction correlation of 0.998, the speed standard deviation (SD) and bias of 0.14 and 0.07 m s−1, and the direction SD and bias of 2.75 and −1.21°, was obtained. The performance of the RWP network in China has been evaluated, including the system performance index and data accuracy from November 2018 to March 2019 (Liu et al., 2020). The horizontal speed results observed by the RWP used in our study showed good agreement with that obtained from the ERA5 numerical model from 0 to 3 km. The mean speed difference (MSD) and the root-mean-square difference (RMSD) were less than 2 and 4 m s−1, respectively.
3.1 Wind speed profile models
As reported by previous studies, the atmosphere can be considered under neutral or near-neutral conditions when the mean horizontal speed exceeds a certain threshold of 6 m s−1 (Luo et al., 2020) or 10 m s−1 (Tse et al., 2013). High winds caused by the TC circulation weaken the thermal stratification, and turbulent mixing processes are dominated by wind shear (Tsai et al., 2019; Tse et al., 2013).
The surface layer (SL) is the lower layer of the ABL, generally tens of meters in height, and varies with the height of the ABL. Assuming that the friction velocity is constant, the horizontal speed profiles satisfy the logarithmic formulation
where U(z) is the horizontal speed at certain height z, u∗ is the surface friction velocity, k is the von Kármán constant of 0.4 and z0 is the aerodynamic roughness length. u∗ and z0 are estimated with the linear fitting in logarithmic coordinates at the three lowest heights (Tsai et al., 2019):
Above the SL, it is not appropriate to describe the horizontal speed profiles with a logarithmic law. Several well-known wind speed models are selected for comparison with the observation, including the Blackadar–Tennekes (BT) model (Blackadar and Tennekes, 1968), the Deaves–Harris (DH) model (Deaves and Harris, 1978; Harris, 1981) and the Gryning model (Gryning et al., 2007). Their expressions are provided in Eqs. (3)–(5):
where , and . fc is the Coriolis parameter, which could be calculated according to the latitude. Lml is the mixing length, as Gryning et al. (2007) introduced it:
Additionally, the power law model of horizontal speed has become more widely used in recent years:
In this study, we choose the lowest height that CDL detected as the reference height zref, and Uref is the horizontal speed at zref. Equation (7) can be converted as follows:
Then, the power exponent α is obtained using linear fitting and the least-squares method.
3.2 No-blind-zone wind speed profiles
Near-field blind zones exist in the CDL detection, and the wind field observation range is usually greatly reduced when a typhoon passes and brings heavy rainfall. To overcome the above problems, the data fusion method is developed to obtain the complete wind speed profiles covering the entire ABL based on the combined measurements of CDL, RWP and AWS. The flowchart of this method is displayed in Fig. 2.
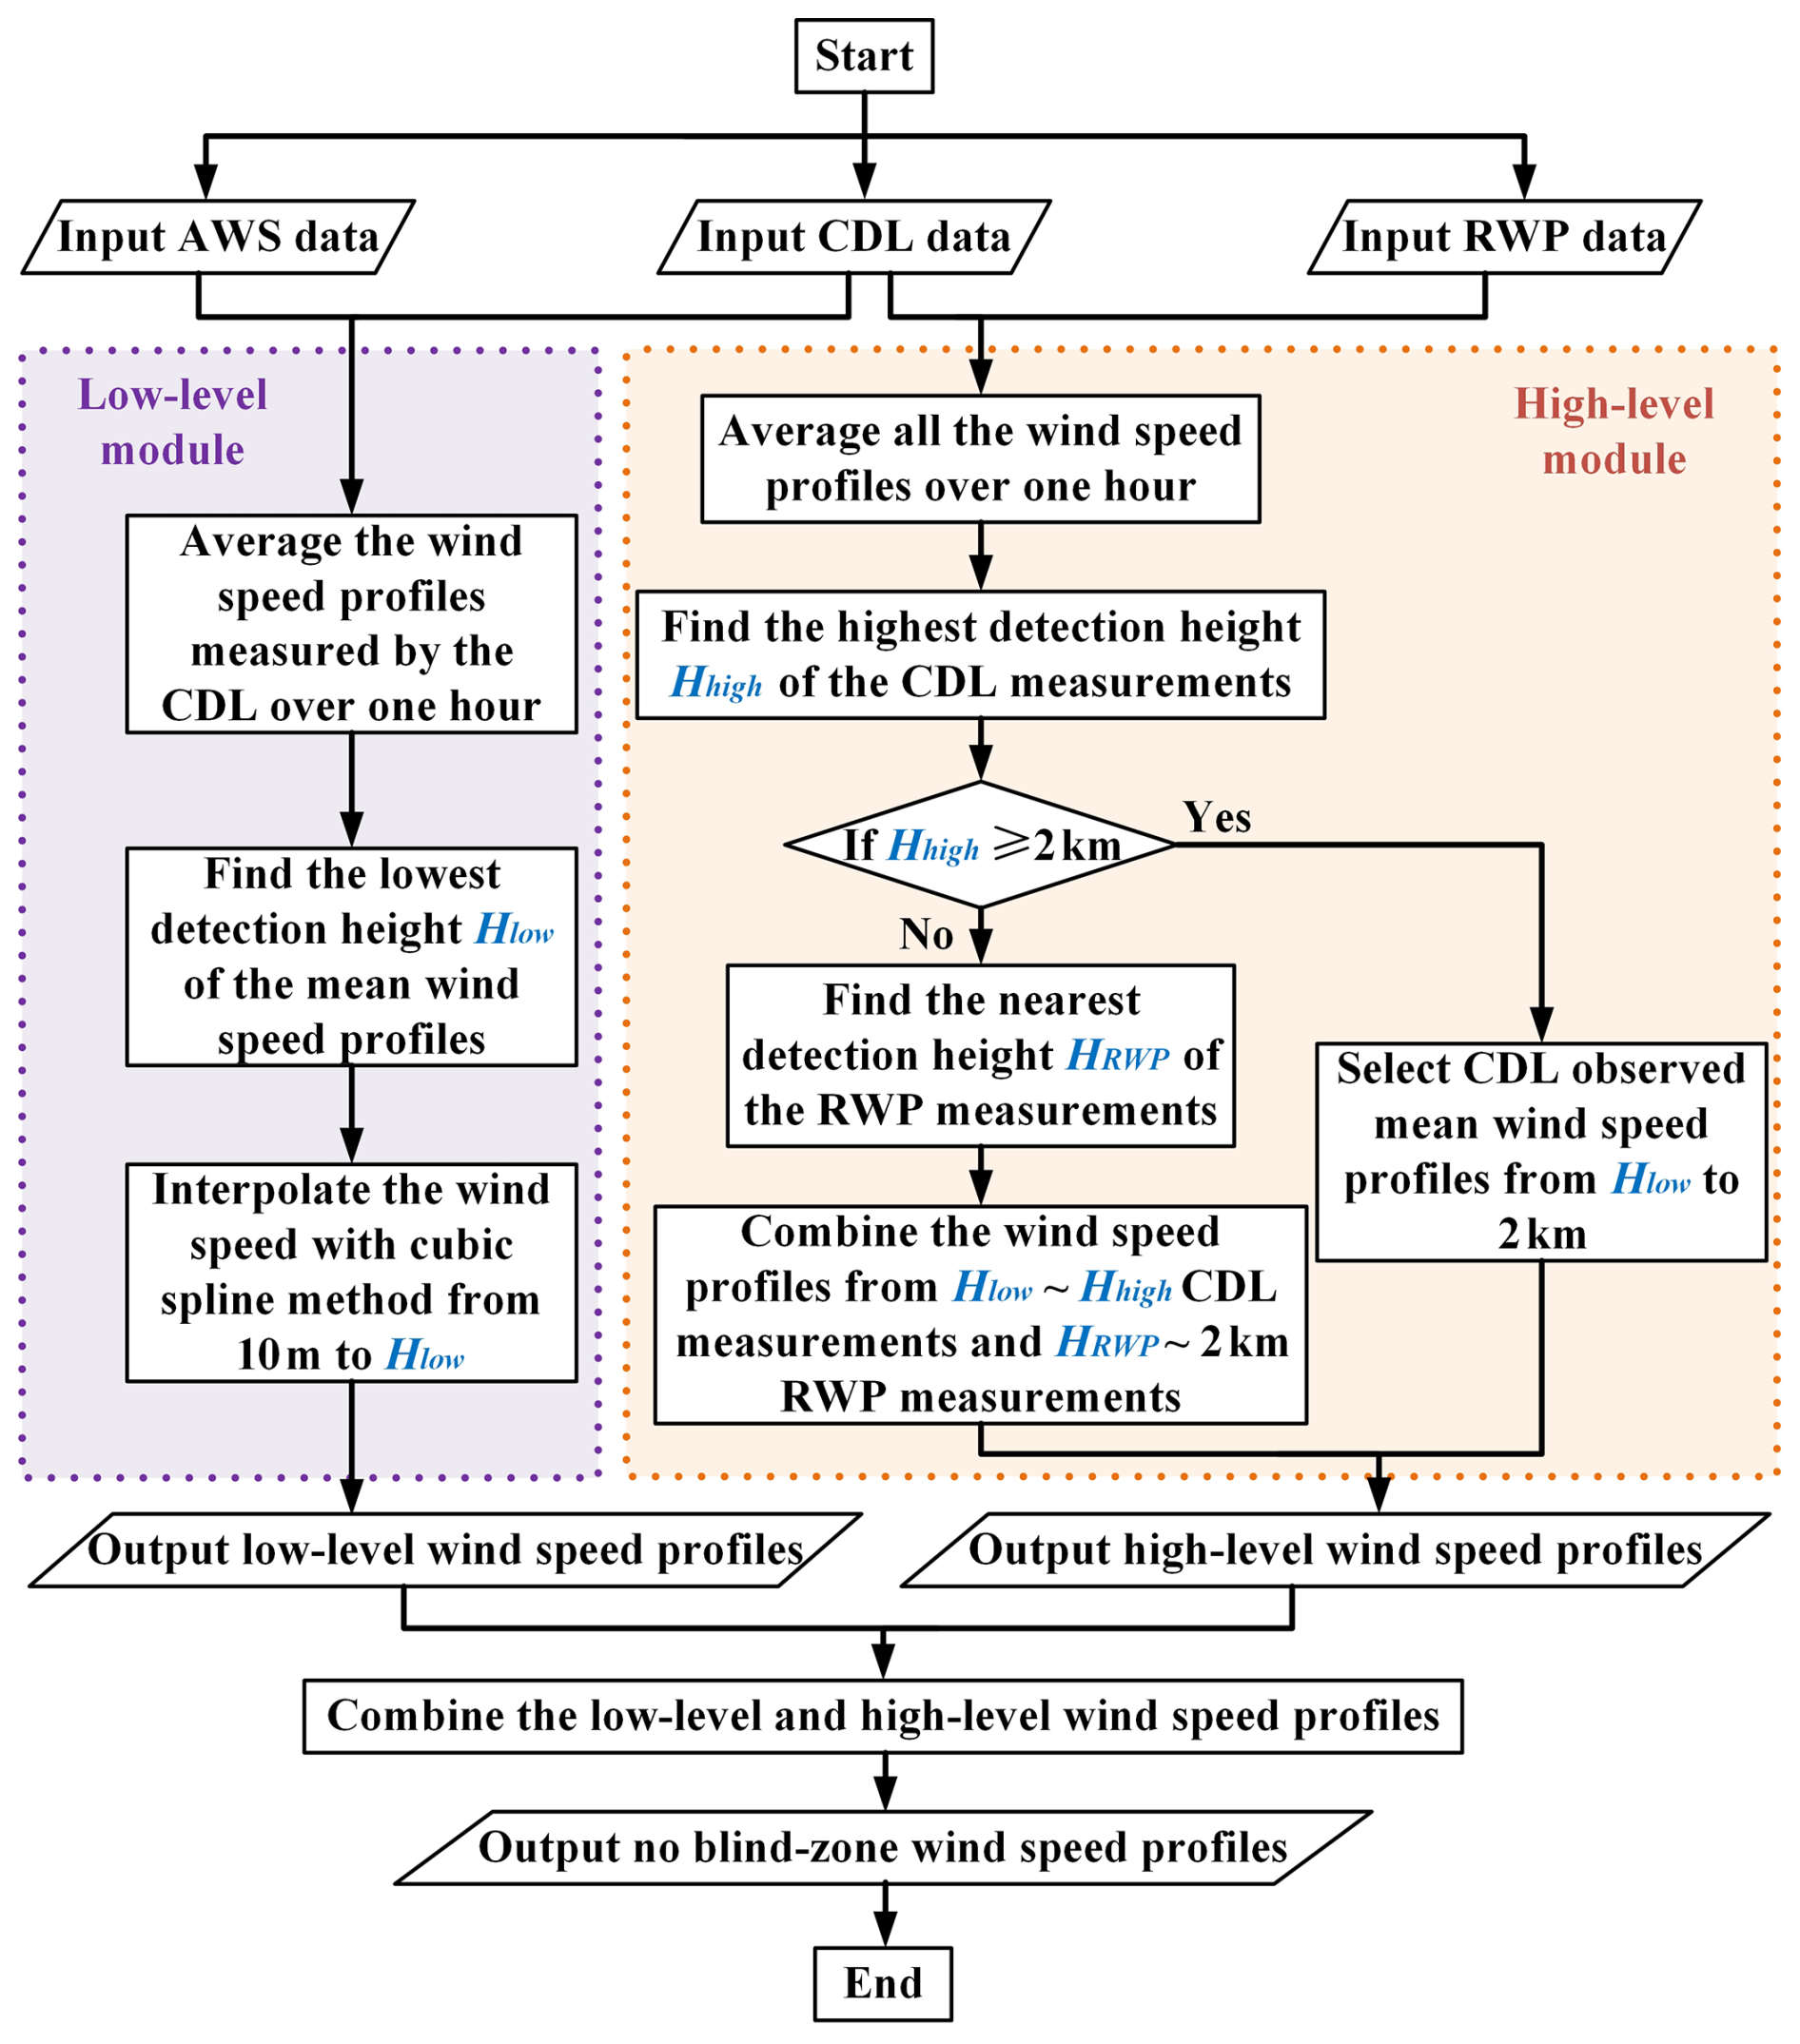
This method includes two modules for low-level and high-level. The wind speed is first averaged over 1 h to remove the microscale fluctuations as a previous study reported (Tsai et al., 2019). In the low-level module, the AWS and CDL data are input to obtain low-level wind speed profiles. The lowest detection height (Hlow; tens of meters in most cases) can be determined from the CDL-measured mean wind speed profiles. Combining the wind speed provided by the AWS measurements, the low-level wind speed in the range of 10 m to Hlow is estimated with cubic spline interpolation method. For the high-level module, the highest detection height (Hhigh) of the CDL measurements must first be confirmed. If Hhigh is greater than 2 km, the mean wind speed profiles from Hlow to 2 km estimated from the CDL are output directly as the high-level wind speed profiles. On the contrary, wind speeds above Hhigh need to be supplemented with the RWP measurements. The closest height HRWP is required to be determined, and then the high-level wind speed profiles are output by combining the wind speeds observed at heights Hlow to Hhigh by CDL with those measured at heights HRWP to 2 km by RWP. In the end, the no-blind-zone wind speed profiles are obtained by combining the low-level and high-level wind speed profiles.
In this section, the near-ground meteorological conditions are given by AWS measurements firstly. The consistency of the wind field measured by the CDL, RWP and AWS is validated. And the measured wind speed profiles are compared with the traditional models during the time periods that wind speeds change rapidly. And the relative errors of the power law model in estimating the wind speed are also evaluated. Then, the fine structures and evolutionary processes of the wind field in the ABL are analyzed during the passage of Typhoon Doksuri. In the end, the statistical analyses of wind field distribution and wind speed variation with the distance from typhoon center are conducted.
4.1 Near-ground meteorological conditions
The variation of meteorological elements at two sites during the passage of Typhoon Doksuri is displayed in Fig. 3. We found that meteorological elements showed similar variation tendencies at two sites in general. The temperature started to decrease at 04:00 LST on 28 July and remained at the minimum of 25 °C between 08:00 and 10:00 LST, approximately. Then, it rose gradually and stabilized after 15:00 LST on 28 July. The relative humidity increased rapidly during 04:00–06:00 LST on 28 July and then mainly stayed above 85 %. As the typhoon landed, the pressure dropped to the minimum of 980 hPa approximately. Figure 3d and e present the 10 min mean wind field results hourly. The horizontal speed variations showed an M-shaped bimodal distribution. The maximum wind speeds of 18.50 m s−1 occurred at 11:00 LST. For the horizontal direction, it changed by more than 100° from 08:00–12:00 LST on 28 July with the typhoon moving.
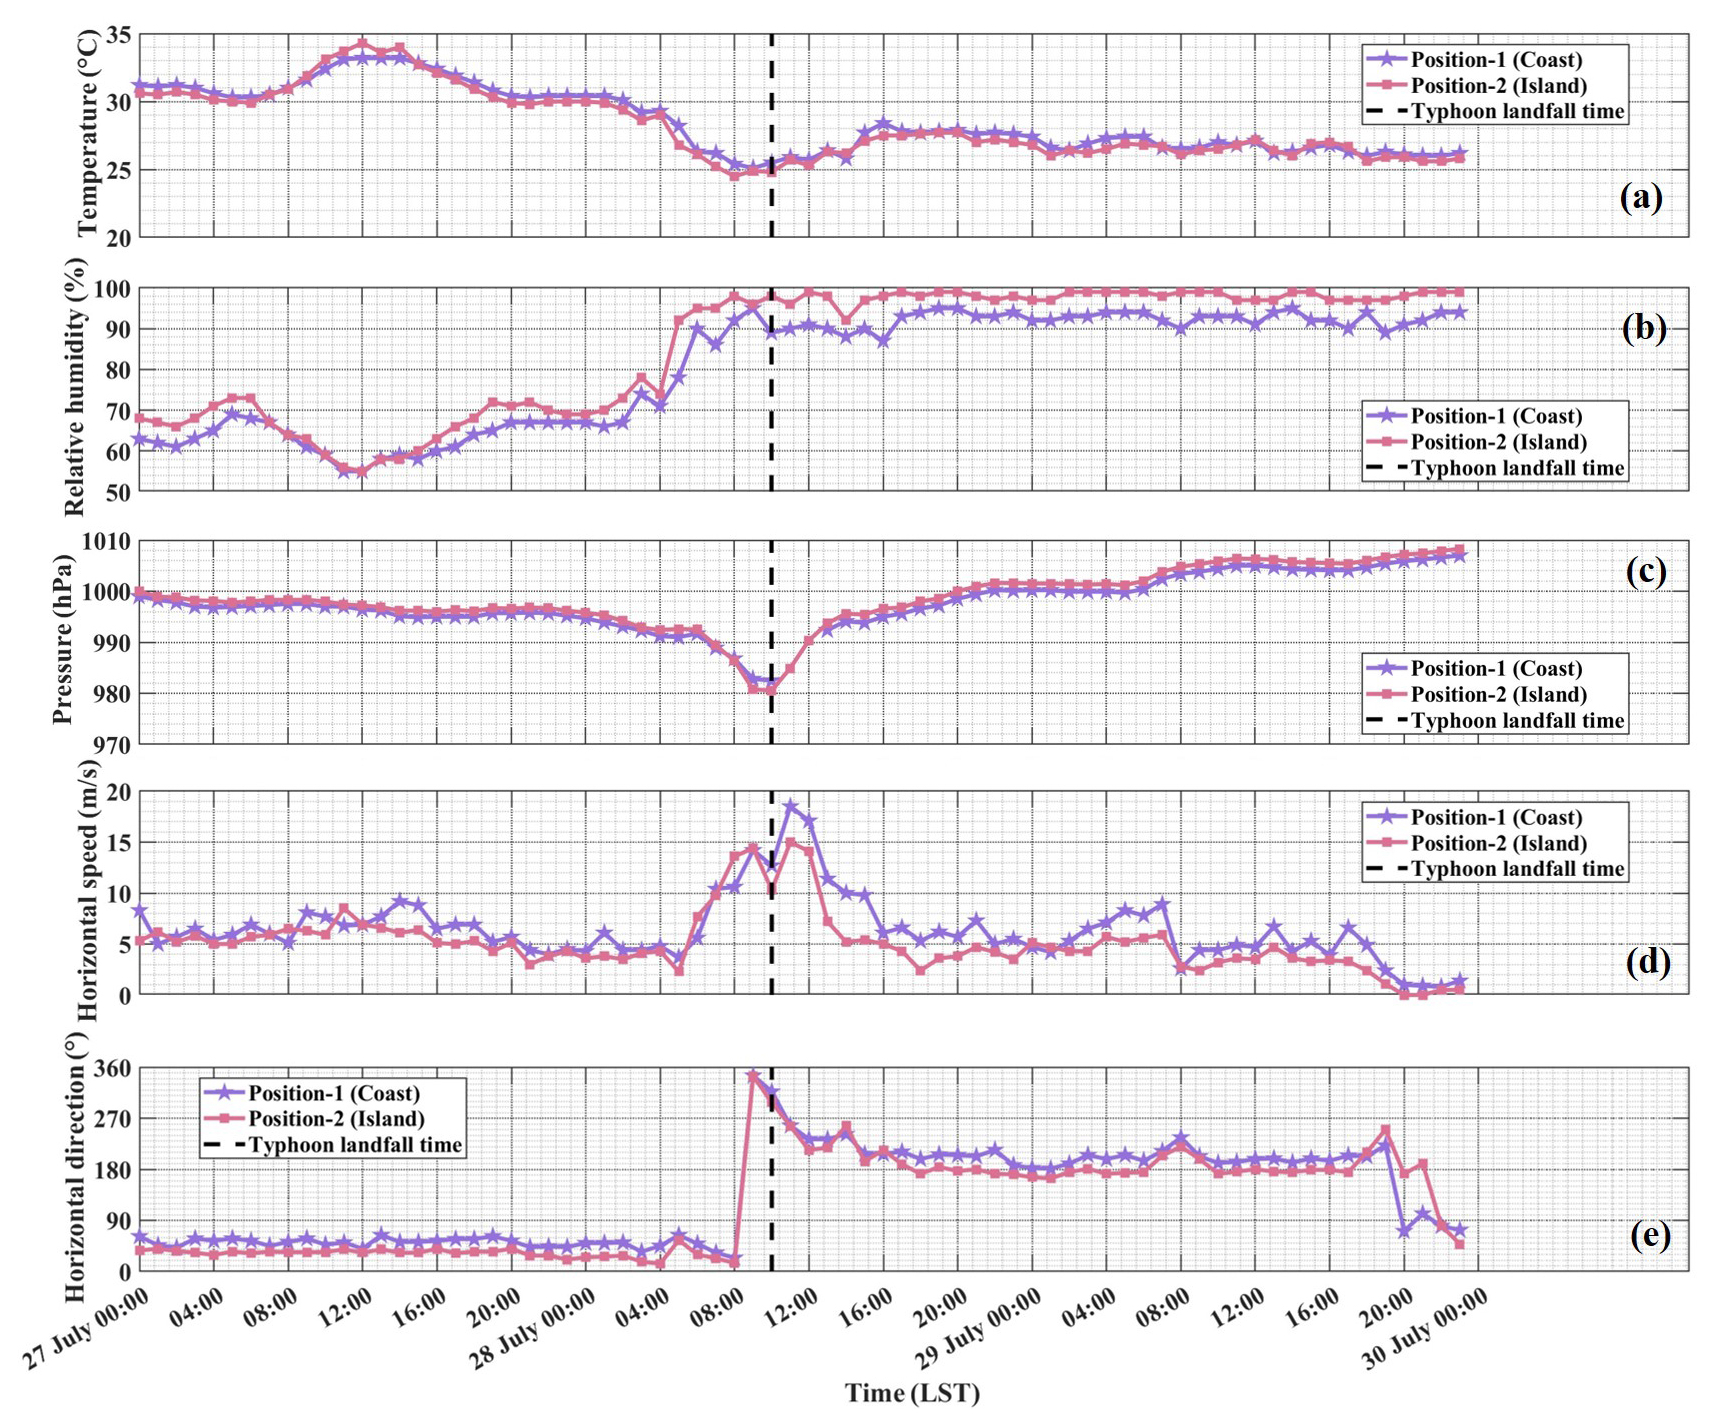
Figure 3The variation in (a) air temperature, (b) relative humidity, (c) air pressure, 10 min mean (d) wind speed and (e) wind direction measured by AWS at two locations.
4.2 Consistency analysis of the wind field
Before retrieving the no-blind-zone wind speed profiles, the consistency of the wind speed and wind direction measured by three instruments during the passage of Typhoon Doksuri must be validated. The comparison results of the CDL and AWS measurements are exhibited in Fig. 4. The lowest detection height of the CDL-1 was 54 m while that of the CDL-2 was 71 m. The wind field results of the CDL lowest detection height and 10 m at two positions are presented in Fig. 4a, b and c, d. In general, the variation in wind speed and wind direction at the CDL lowest detection height and at 10 m showed a similar tendency, and only the numerical differences exist. The wind direction measured by two CDLs showed a sharp increase at about 04:00 LST on 28 July because that the ordinates are set from 0 to 360°. Actually, there was no abrupt change in wind direction, and the variation in it was less than 10°. When north wind dominated and the wind speed varied in 0 to 10° and 350 to 360°, the fact that the wind direction measured by the CDL and the AWS exhibited obvious differences is reasonable as the obtained wind directions were averaged over 10 min and 1 h, respectively. Hence, the wind field results from 10 m to the CDL lowest detection height can be obtained with the interpolation method as Fig. 2 introduces.
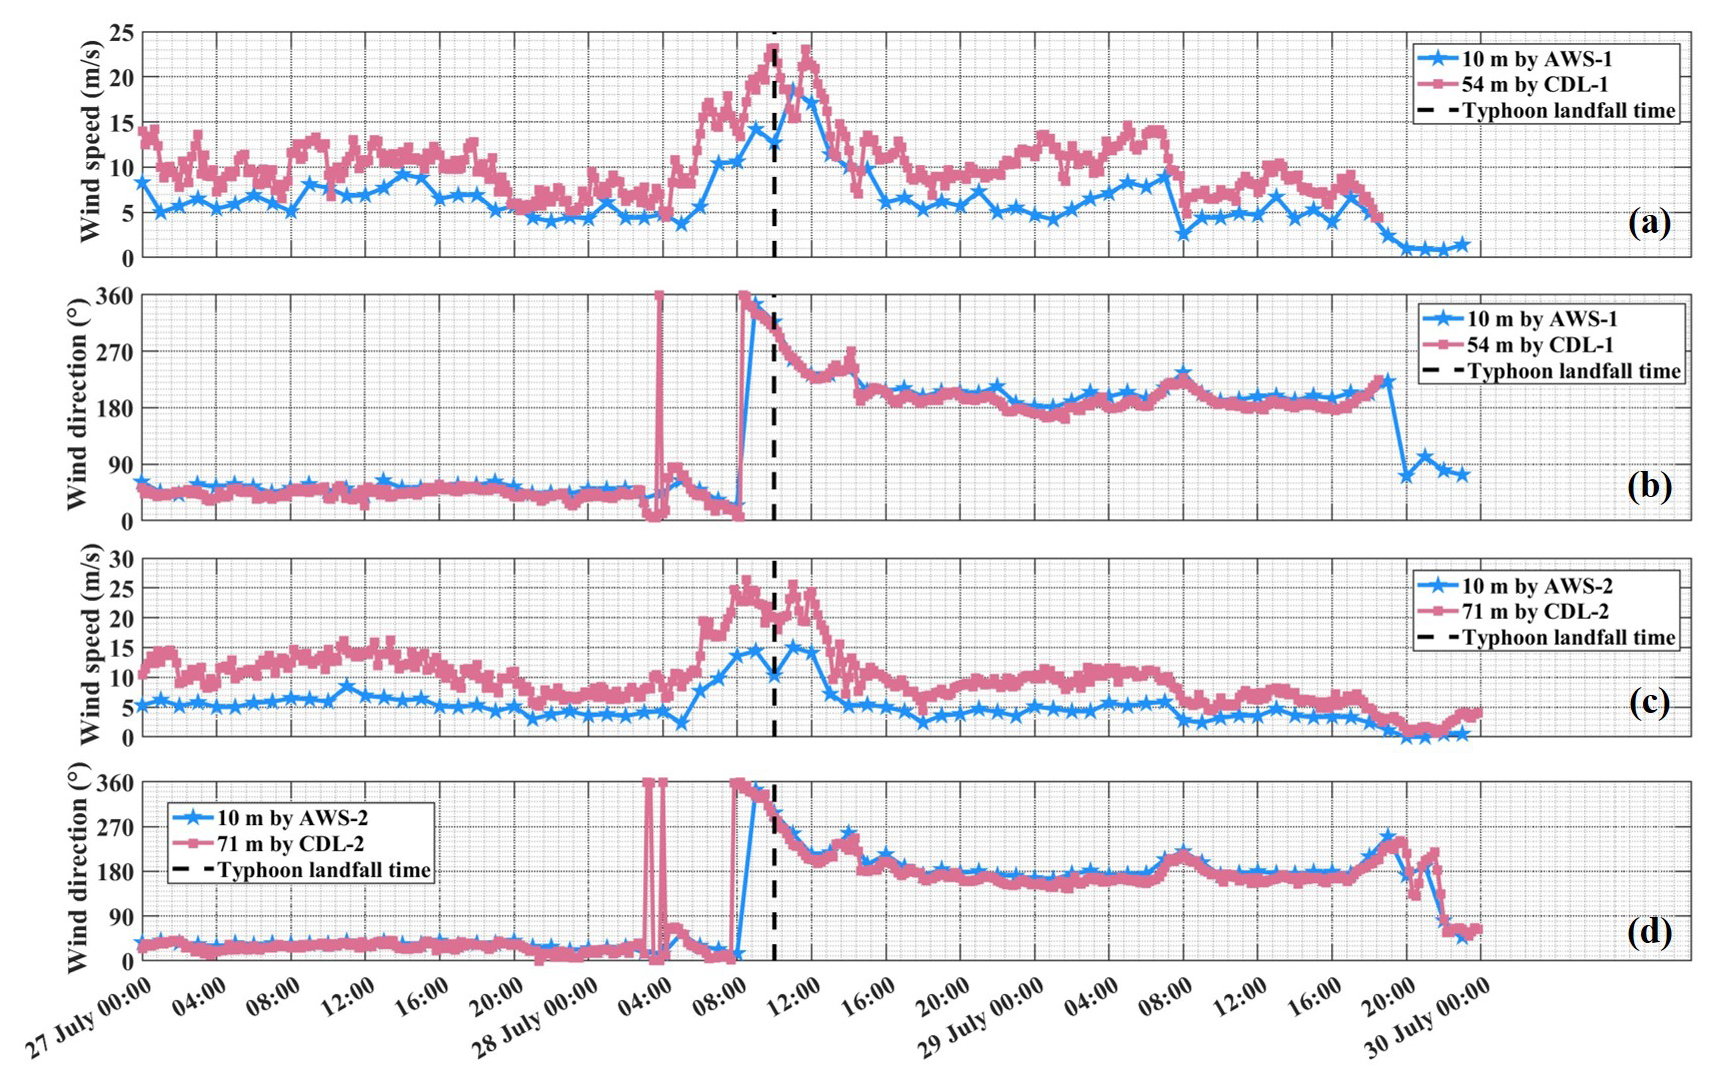
Figure 4Wind speed (a, c) and wind direction (b, d) variation in the CDL lowest detection height (pink squares) and 10 m (blue stars) at Position 1 (a, b) and Position 2 (c, d).
At Position 2, a RWP (RWP-1) was deployed close to the CDL-2. Although the wind accuracies of the two instruments have been validated in detail before the typhoon observation, as described in Sect. 2.2, their performances during the landfall of the typhoon are also compared and evaluated, as shown in Figs. 5 and 6. As seen in Fig. 5a and b, the wind field profiles generally showed good agreement below 1500 m before the typhoon-caused landfall. Due to the high precipitation, the detection ranges of the CDL decreased to about 500 m when the typhoon landed. The horizontal speeds estimated by the CDL were consistent with that measured by the RWP, as displayed in Fig. 5c. However, in Fig. 5d, we find that there were differences in the horizontal direction measurements. The differences may result from the decrease in the horizontal homogeneity range caused by the typhoon. And the statistical results of all wind field results from 27 July to 29 July 2024 are provided in Fig. 6. Generally, the wind speed and wind direction results of the CDL and RWP measurements agreed well. The coefficient of determination and the root-mean-square error (RMSE) for the horizontal speed are 0.89 and 2.46 m s−1. For the horizontal direction, the coefficient of determination and the RMSE are 0.99 and 13.35°. Consequently, the combination of the CDL and RWP has the advantage of increasing detection ranges, which would help to capture the entire vertical structure of the wind field in the typhoon observations.
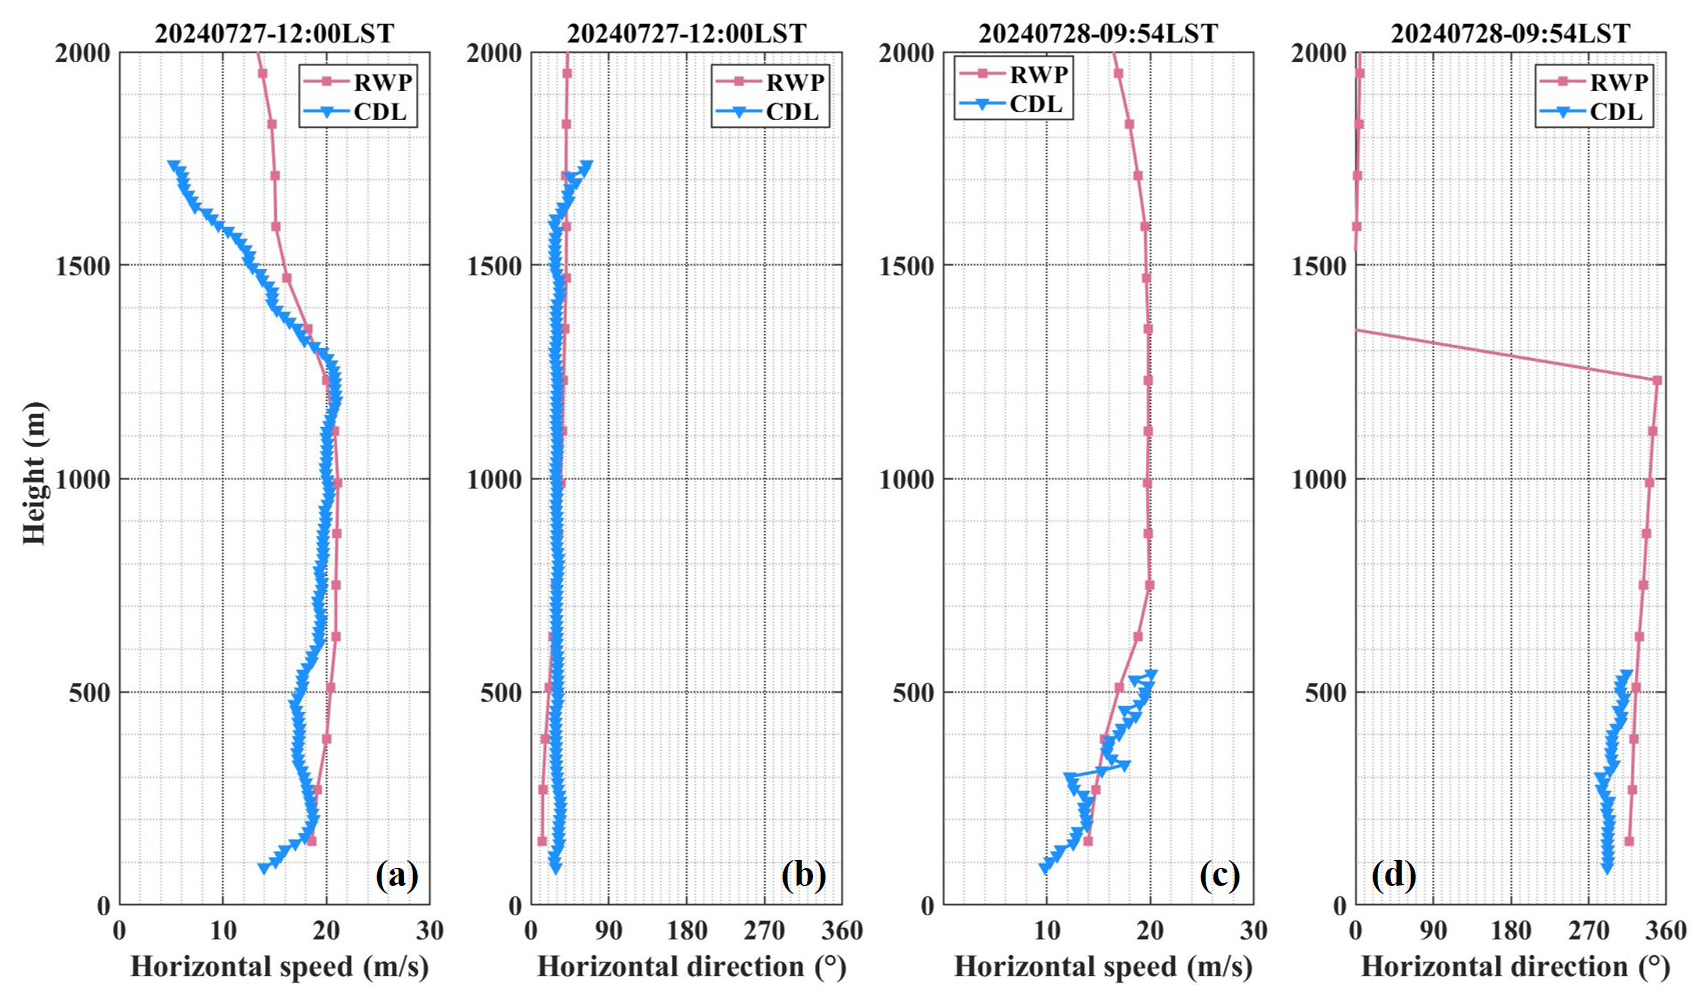
Figure 5Wind profile results of the horizontal speed (a, c) and horizontal direction (b, d) obtained from the CDL (blue triangles) and the RWP (pink squares) before (a, b) and during (c, d) typhoon-caused landfall.
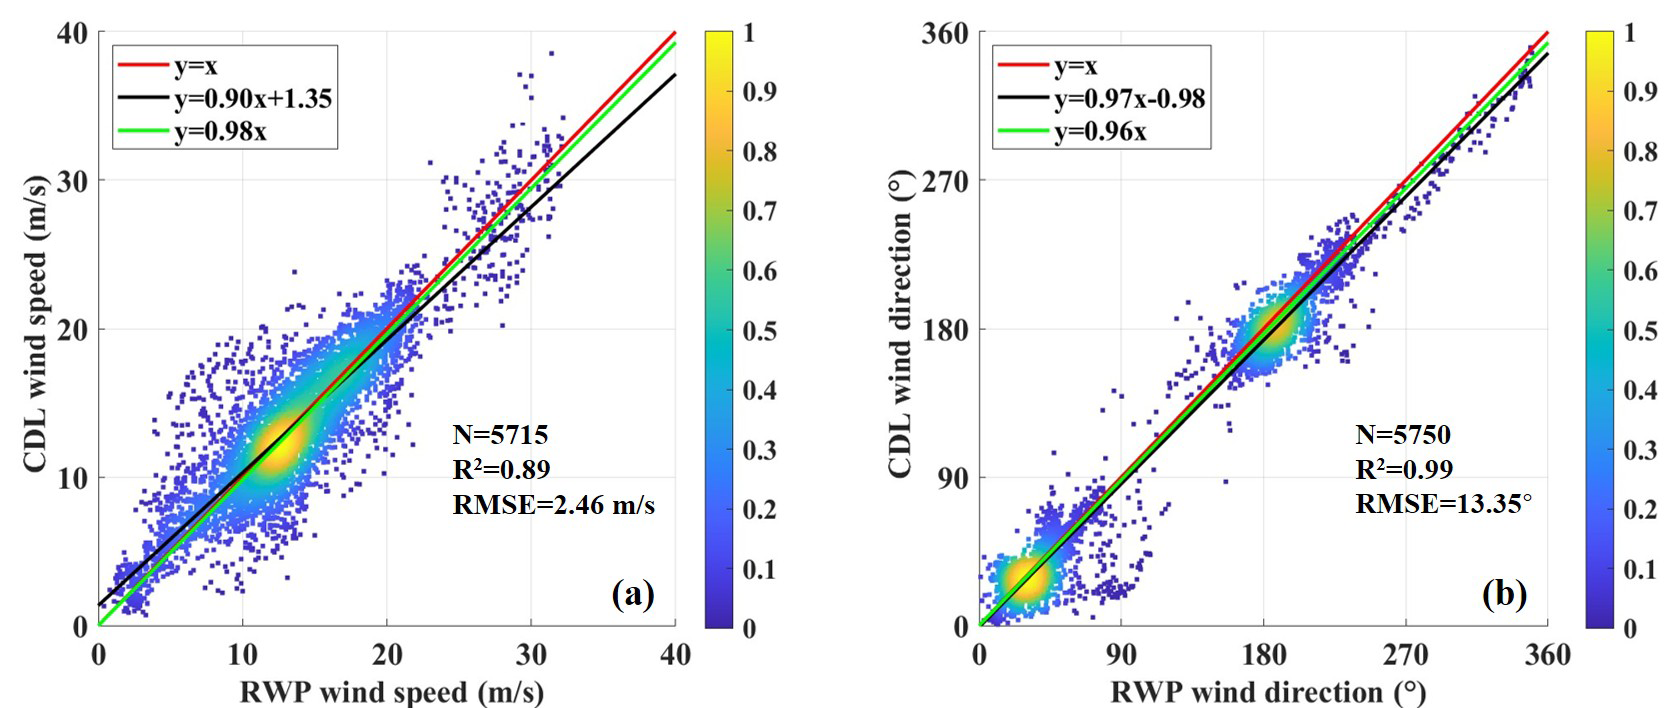
Figure 6Statistical results of the wind speed (a) and wind direction (b) from 27 July to 29 July 2024.
4.3 Comparison of measured wind speed profiles with models
The hourly mean wind speed profiles measured at two positions are provided in Figs. 7 and 8. Figure 7 exhibits the wind speed profiles observed by CDL-1 during 05:00–14:00 LST on 28 July as the wind speed changed rapidly in this period. Before 07:00 LST, the thickness of SL was about 200 m because the wind speed profiles below 200 m fitted well with logarithmic law. And the wind speed showed the best agreement with the power law generally, although it also agreed well with the BT model from 06:00 to 07:00 LST. During the period of 07:00–09:00 LST, the wind speed increased sharply with height; thus, almost no existing models can describe it well. When the typhoon landing, the differences in wind speed at each altitude decreased obviously, and the wind speed even became almost constant with height during 10:00–11:00 LST. After the typhoon-caused landfall, wind shear layers appeared at 600 and 1100 m during 11:00–13:00 LST and 12:00–13:00 LST, respectively.
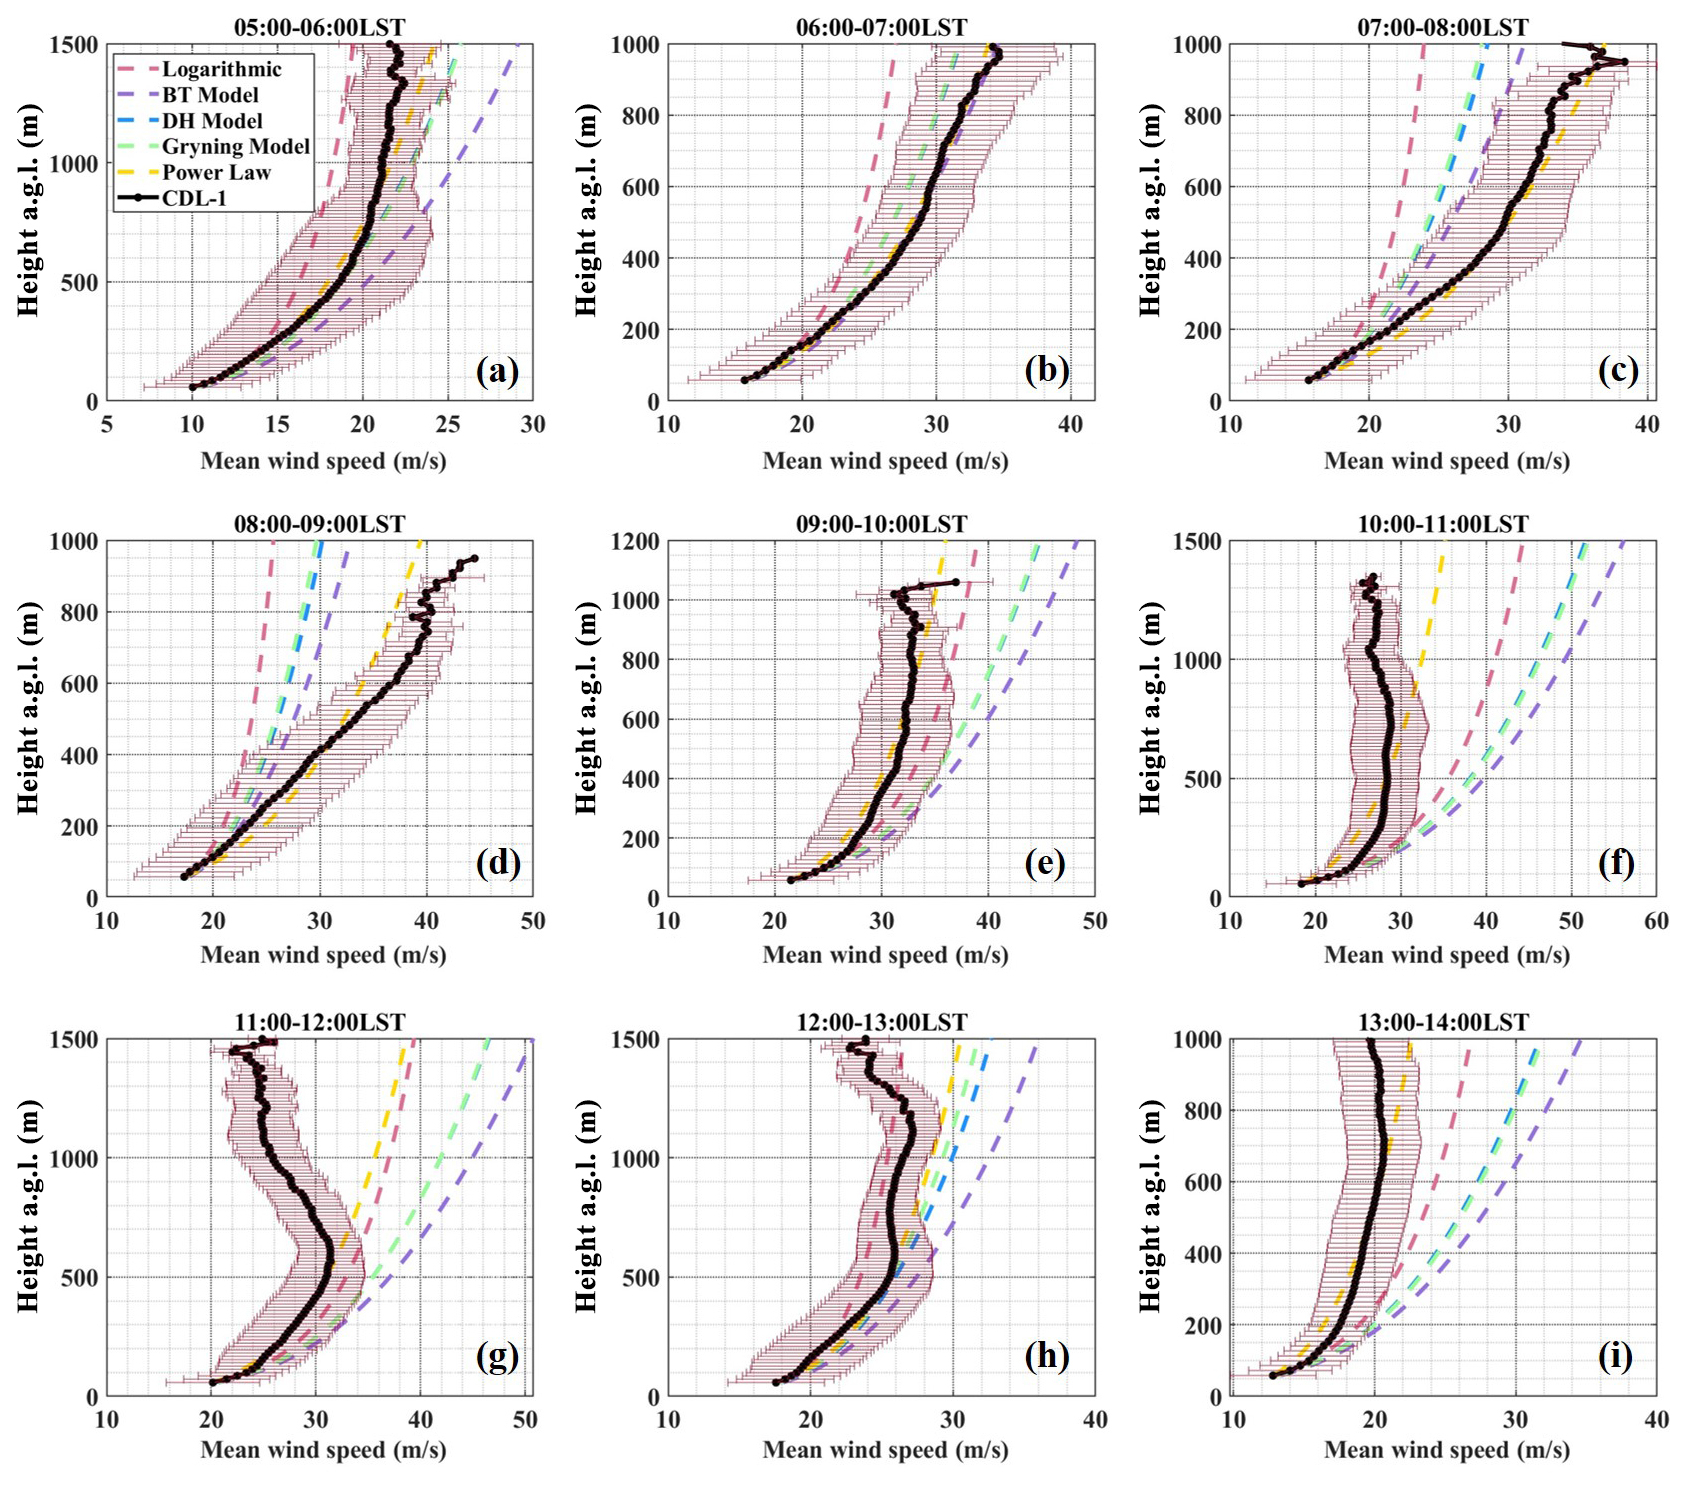
Figure 7Mean wind speed profiles measured by CDL-1 (black dots) and fitted by the logarithmic law (pink dotted line), BT model (purple dotted line), DH model (blue dotted line), Gryning model (green dotted line) and power law (yellow dotted line). The error bars represent the standard deviation of the wind speed in the mean time period shown above.
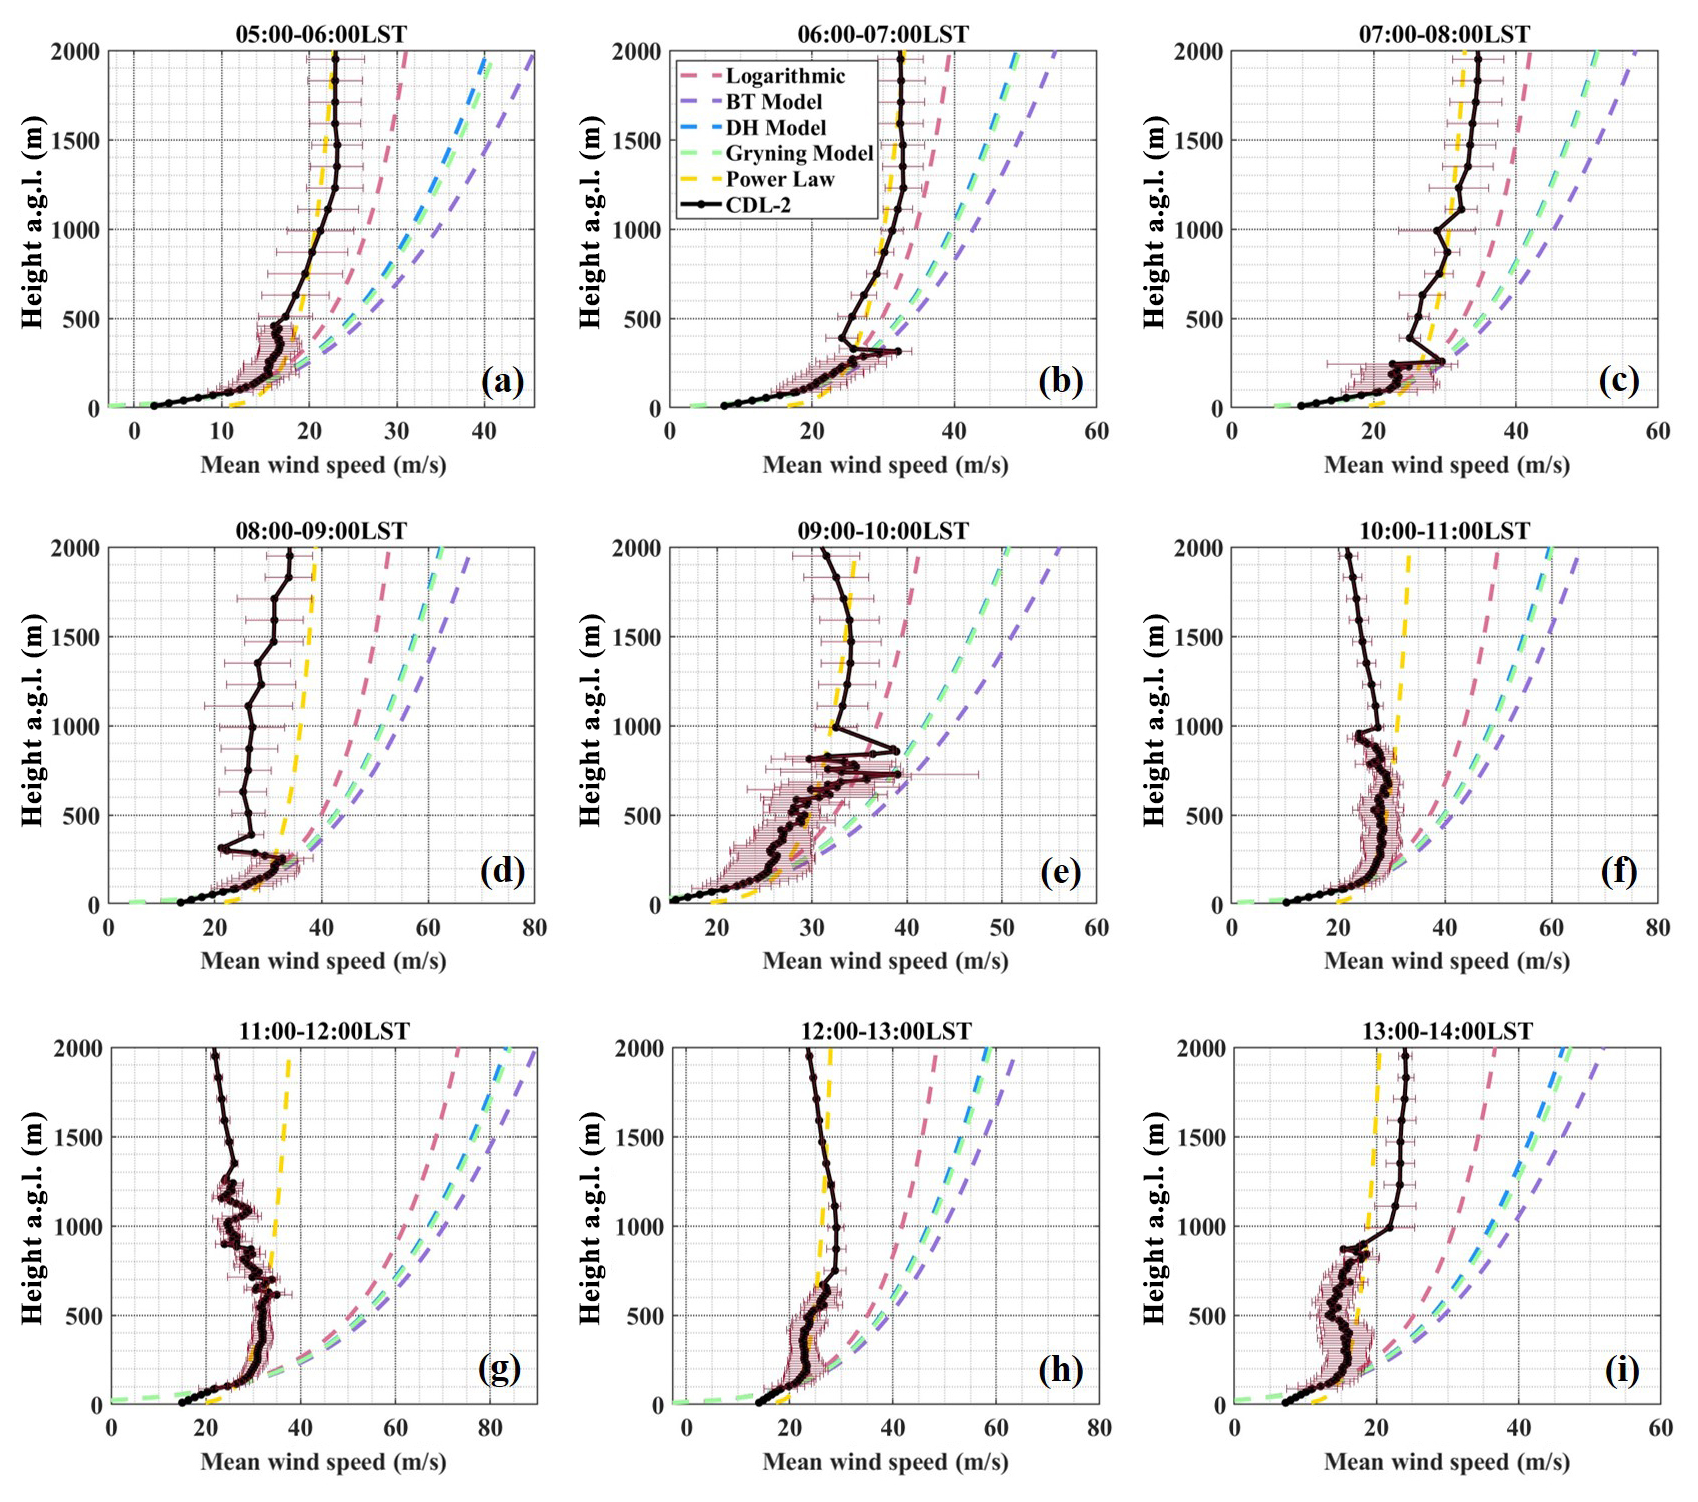
Figure 8No-blind-zone wind speed profiles at Position 2 using the data fusion method (black dots) and fitted by the logarithmic law (pink dotted line), BT model (purple dotted line), DH model (blue dotted line), Gryning model (green dotted line) and power law (yellow dotted line). The error bars represent the standard deviation of the wind speed in the mean time period shown above.
The no-blind-zone wind speed profiles retrieved with the data fusion method are displayed in Fig. 8. The wind speed profiles agreed well with the logarithmic law below 200 m before 07:00 LST. The rapid increase in wind speed was maintained from 06:00 to 10:00 LST, and they showed a longer duration than that appeared at Position 1. During the period of 08:00 to 09:00 LST, the decrease in wind speed caused by wind shear occurred in the range of 260 to 320 m, approximately. And then, wind shear layers occurred at several heights until 14:00 LST. Overall, the variation of wind speed profiles exhibited similar characteristics to those observed by CDL-1 after the typhoon landed.
Generally, the wind speed showed the best agreement with the power law model. In order to evaluate the relative errors of the power law model in estimating the wind speed, the probability distribution of the relative errors at different height ranges based on the measured wind profiles in Figs. 7 and 8 is given in Fig. 9. Below 500 m, the relative errors in wind speed estimated by the power law model were small, and 90 % of the model results had relative errors of less than 10 %. The relative error in the estimated wind speed increased with height. Above 1000 m, the estimated wind speed with relative error greater than 40 % increased significantly.
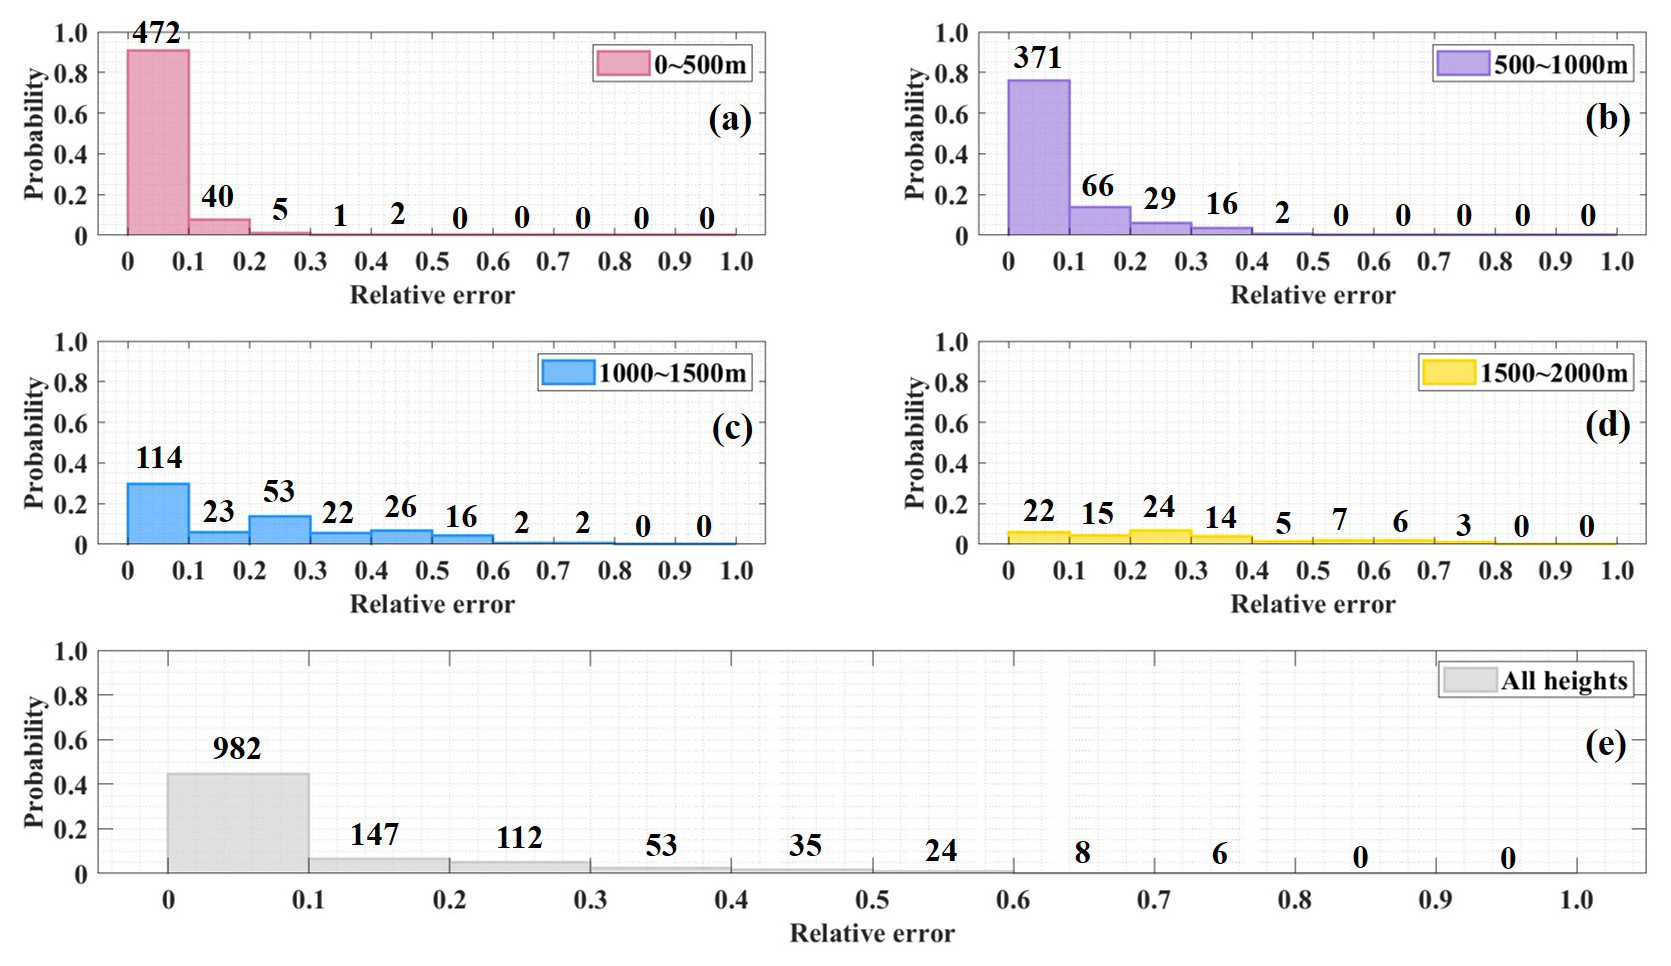
Figure 9The probability distribution of relative errors at (a) 0–500 m, (b) 500–1000 m, (c) 1000–1500 m, (d) 1500–2000 m and (e) all heights estimated by the power law model. The probabilistic frequencies of each group are labeled with black numbers on the histogram.
As shown in Figs. 7–9, it would cause a large error (up to 73 %) to describe the exact wind speed with the power law model, especially when the wind speed is almost constant with height or when wind shear exists. Hence, the wind field measurements are still pretty important for improving real-time intensity forecasts and understanding the wind field structure during a typhoon. In future studies, we will also try to improve the traditional models based on the measured wind profiles to achieve a more accurate description of the typhoon boundary layer structure.
4.4 Evolution of wind field during typhoon passage
Figure 10 provides the variation in wind speed, wind direction and SNR measured by CDL-1 from 27 July to 29 July 2024. On 27 July, the high wind speed in the ABL varied in the range of 15–25 m s−1, and northeasterly winds dominated within the ABL. The maximum speed appeared at about 1000 m, approximately. Before 20:00 LST on 27 July, the CDL-1 was not under the influence of the 34 kn wind circles, and wind speeds within the ABL were basically in the range of 15–20 m s−1. Between 20:00 LST on 27 July and 03:00 LST on 28 July, obvious differences in wind speeds existed at different heights affected by the typhoon. High wind speeds appeared around 1000 m, while low wind speeds occurred below 500 m, which was consistent with the distribution characteristics of the wind speed in the typhoon boundary layer. After about 06:00 LST on 28 July, the wind speed first increased sharply in the upper part of the ABL, and then high speed extended downwards to the SL. At 08:15 LST on 28 July, the observed wind speed reached its maximum of 51.25 m s−1 at 442 m and then decreased after the typhoon landing. During the landfall process of the typhoon, the prevailing winds changed from northeasterly to northwesterly and then stabilized in the southwesterly direction.
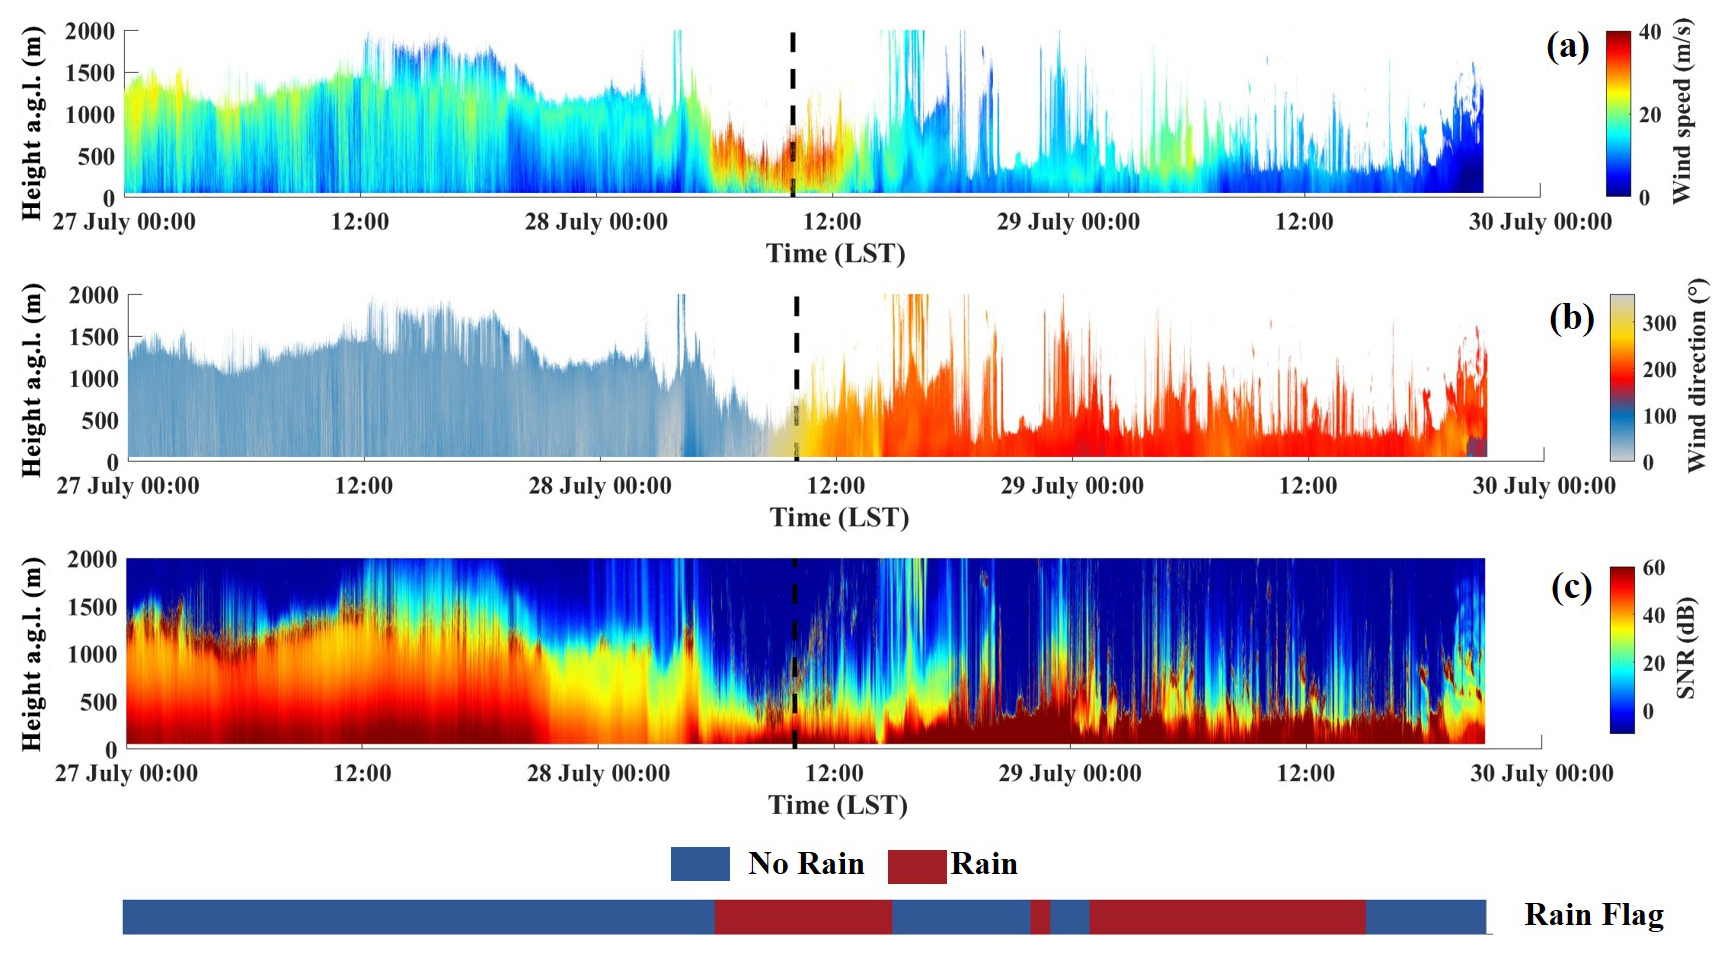
Figure 10The variation in (a) wind speed, (b) wind direction and (c) SNR measured by CDL-1 during the passage of the typhoon.
The evolution of wind field and SNR measured by CDL-2 is exhibited in Fig. 11. Affected by the high precipitation, the detection range decreased sharply during 05:00–15:00 LST on 28 July. Combining the wind field results obtained by the RWP-1, the complete variation in the wind speed and wind direction covering the entire ABL is shown in Fig. 12. The variation in wind speed and wind direction was similar to that at Position 1 in general. During 07:00–10:00 LST, high winds within the ABL exceeded 30 m s−1. At 08:28 LST on 28 July, the maximum wind speed of 52.34 m s−1 was recorded at 571 m.
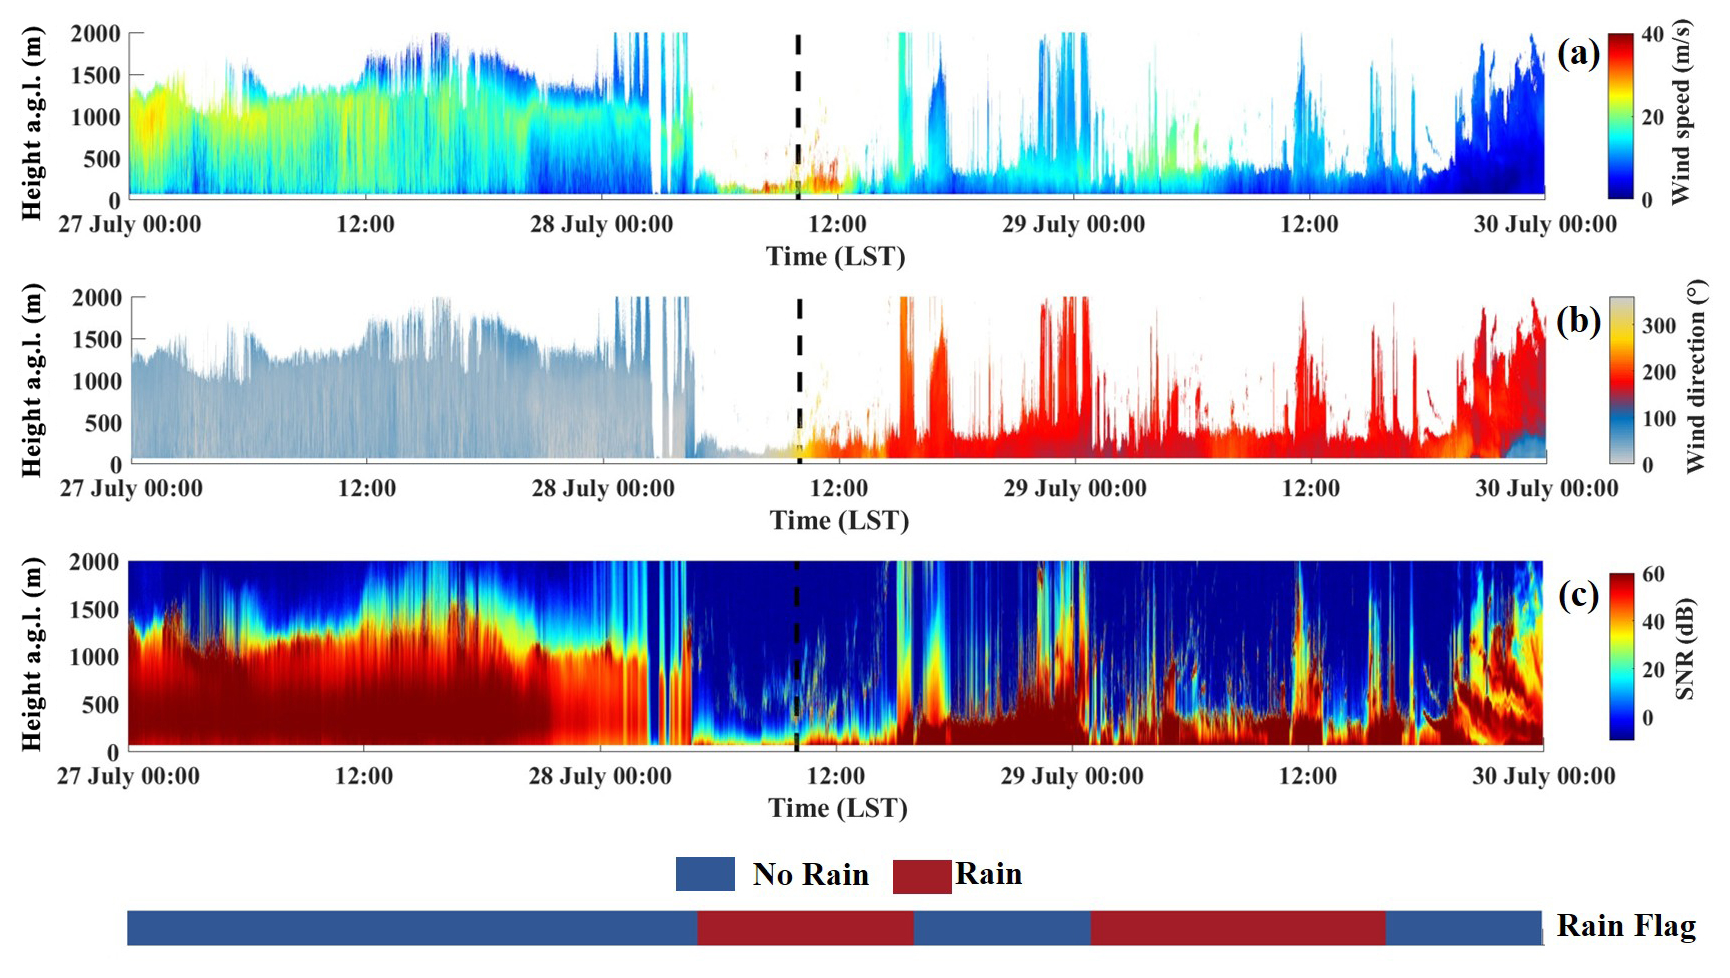
Figure 11The variation in (a) wind speed, (b) wind direction and (c) SNR measured by CDL-2 during the passage of the typhoon.
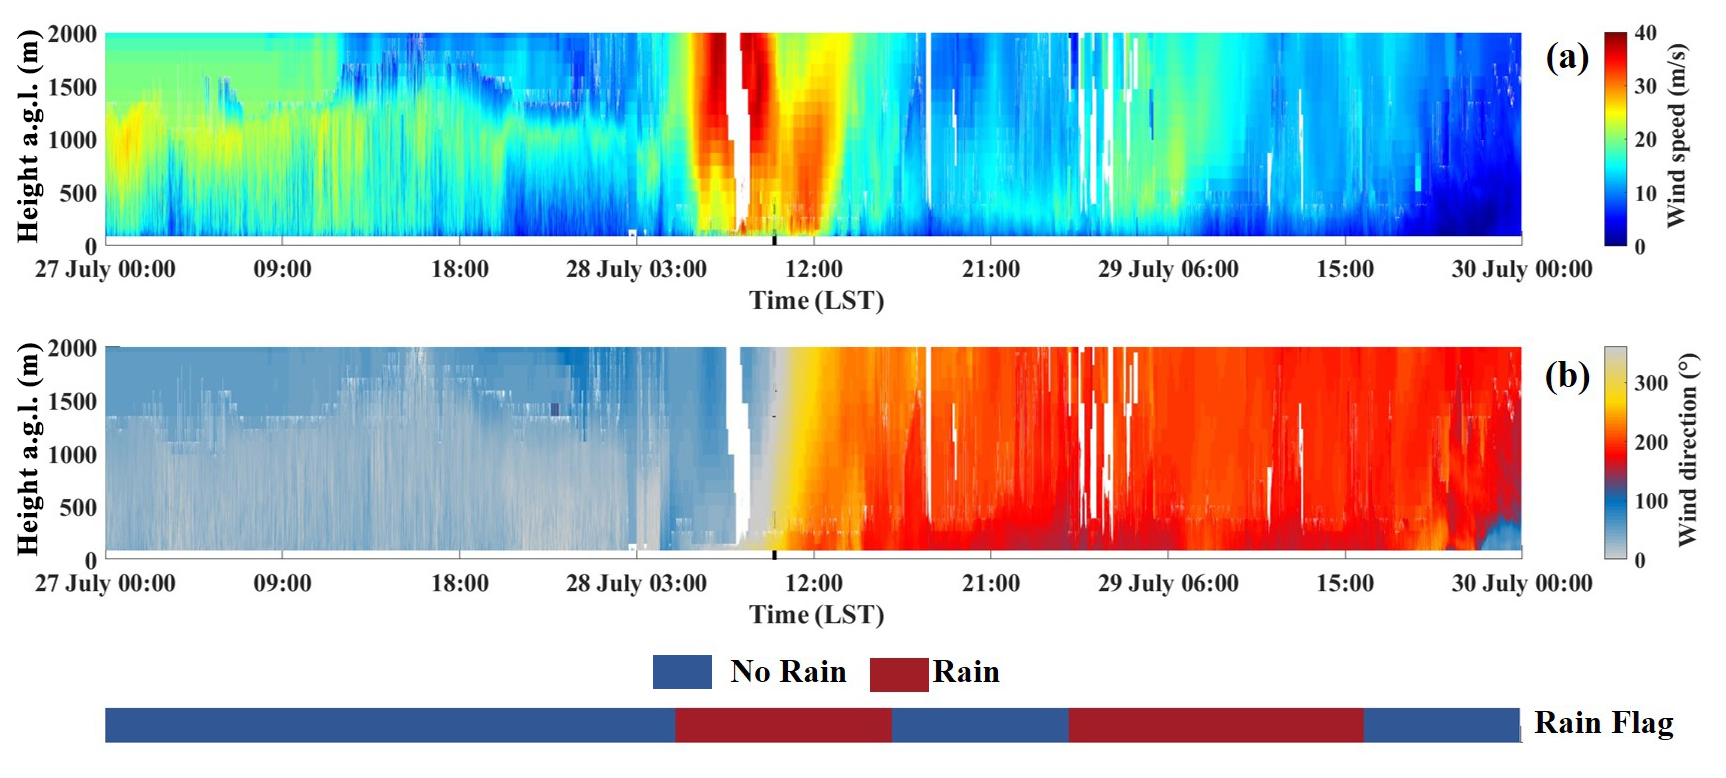
Figure 12The variation in (a) wind speed and (b) wind direction observed by CDL-2 and RWP-1 during the passage of the typhoon.
4.5 Statistical analysis of the wind field
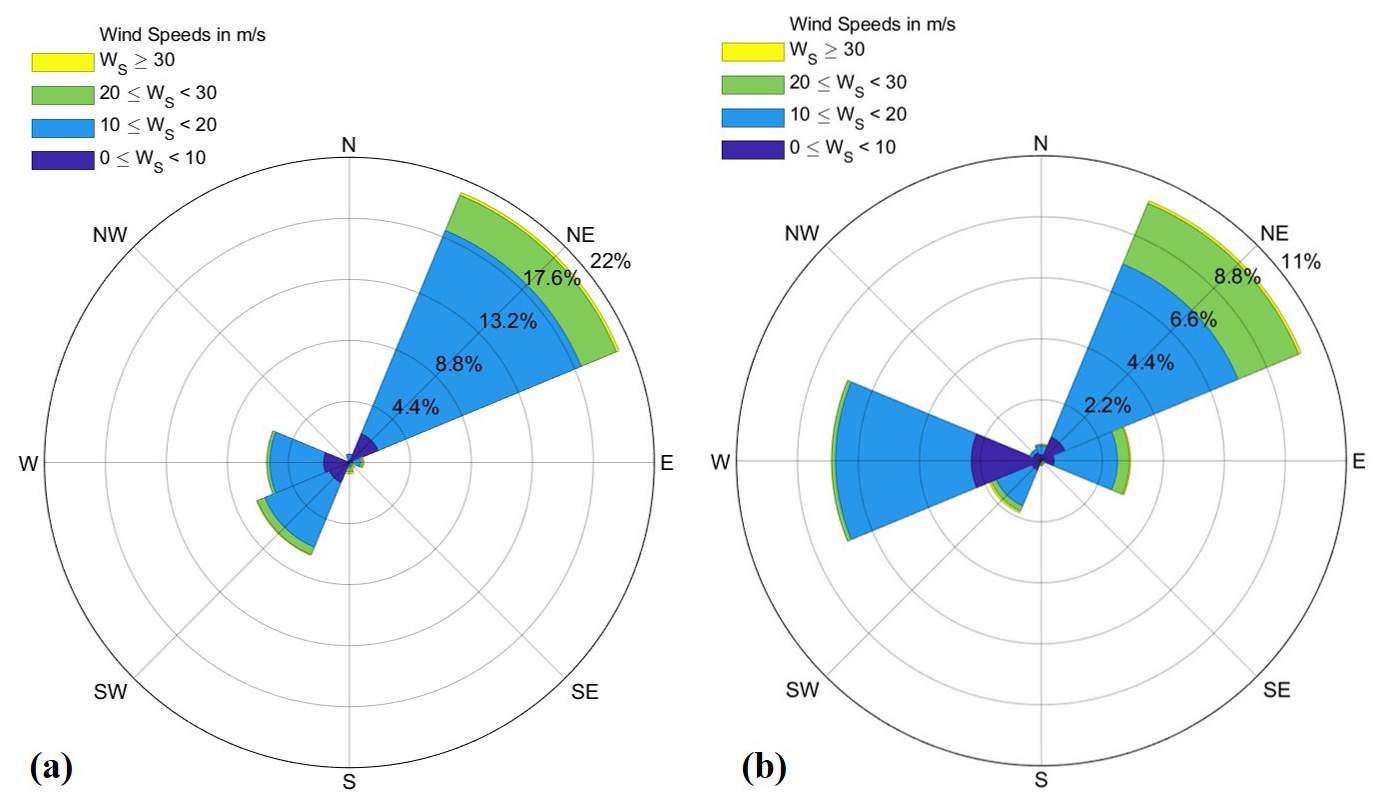
In order to analyze the wind field distribution characteristics, the wind speed and direction results at both positions are collected from 27 July to 29 July. Figure 13a and b present the wind rose map at Position 1 and Position 2, respectively. Influenced by the track of Typhoon Doksuri and the observation areas, northeasterly, southwesterly and westerly winds dominated at Position 1, while northeasterly, westerly and easterly winds prevailed at Position 2. The wind speeds were mostly concentrated in the range of 10 to 20 m s−1 at both sites. However, the wind speeds of less than 10 m s−1 and ranging from 20 to 30 m s−1 covered a large proportion at Position 2, indicating that the wind speeds showed a more discrete distribution.
The statistical results of the observed wind speeds at different distances from the typhoon center are given in Fig. 14a and b. The negative and positive distances are set to distinguish the results before and after the typhoon landing. Before the typhoon-caused landfall, the wind speeds increased rapidly and showed a broader distribution when the distances from the typhoon center were smaller than 150 km. After the typhoon passing, the wind speeds decreased sharply with the increasing of the distance from the typhoon center until the distances from the typhoon center were greater than 100 km. Then, the wind speeds increased briefly and decreased slowly in general. Unfortunately, there was still a lack of wind field observations of the typhoon eye although the closest CDL-2 to the typhoon center was only 32 km away. In future studies, the combination of three instruments will be deployed at more appropriate locations according to the typhoon forecast to achieve the wind field measurements in the typhoon eye areas.
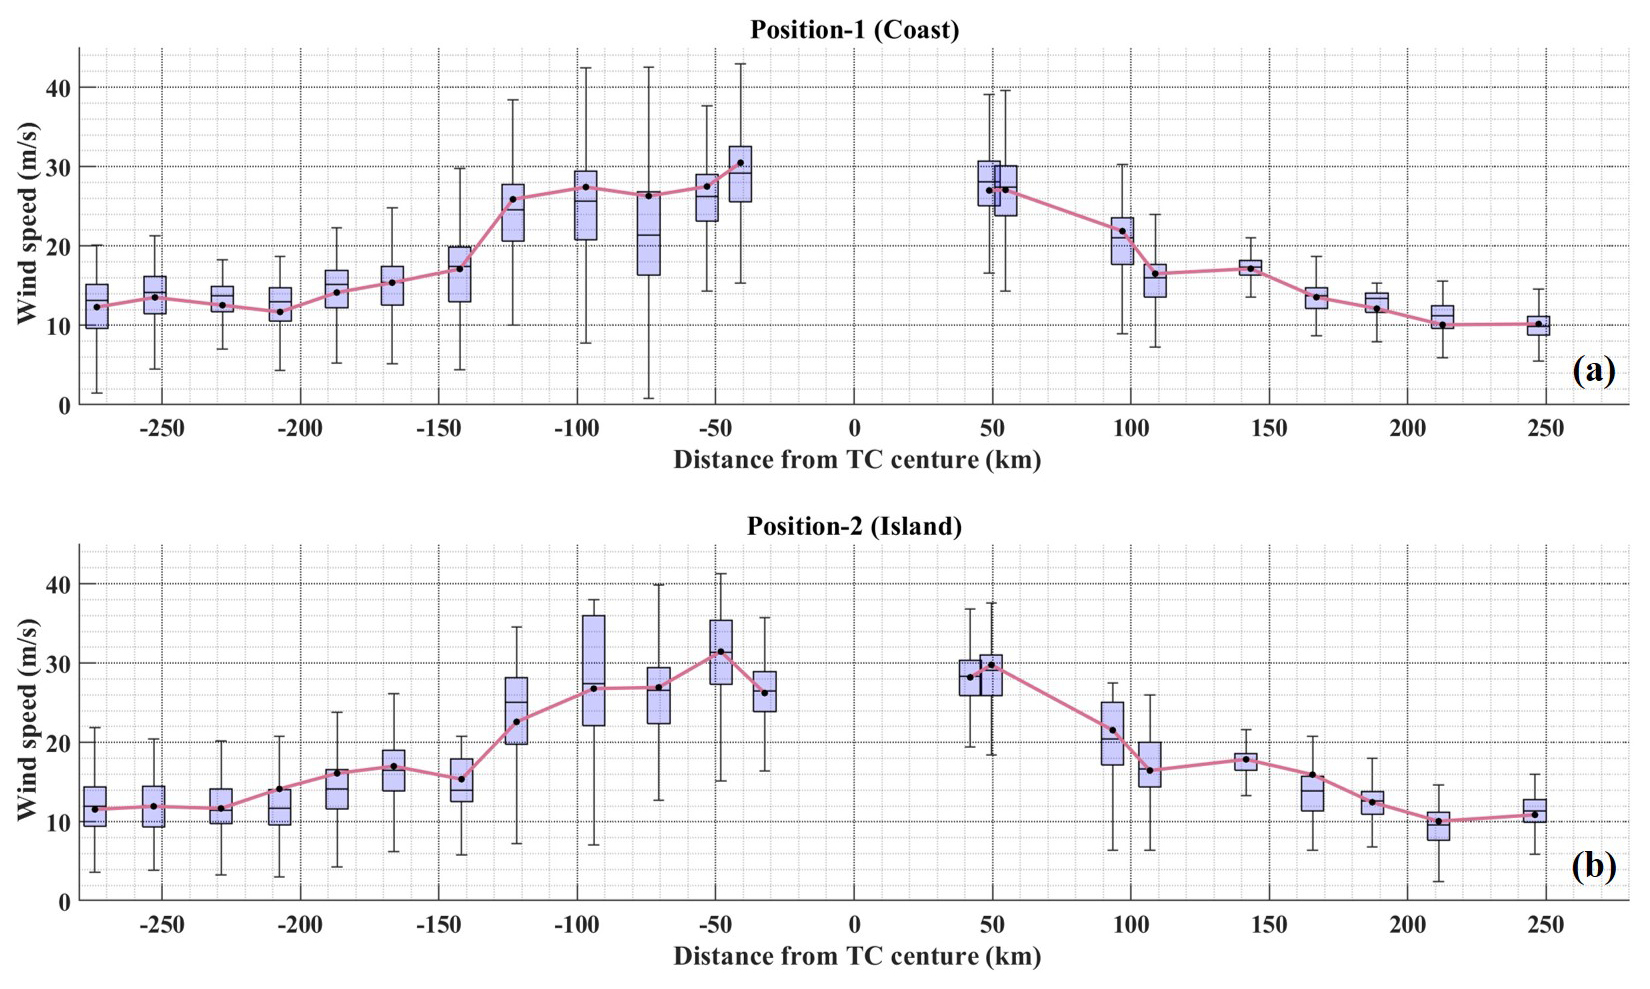
Figure 14The box-and-whisker plots of wind speed and its mean values (black dots) observed at (a) Position 1 and (b) Position 2 at different distances from the typhoon center.
In this paper, based on the combined measurements of CDL, RWP and AWS, fine structures and evolution processes of wind field characteristics covering the entire ABL are systematically investigated during the landfall of Super Typhoon Doksuri. The key conclusions are summarized as below:
-
The CDL system has been verified to be an effective instrument for the wind field observation of TC boundary layer. It provides high-accuracy, high-temporal-resolution and high-spatial-resolution, and vertically resolved wind field measurements which has been validated by the comparison with in situ instruments and the nearby-deployed RWP. Good agreement between the CDL and RWP is obtained during the typhoon passage with the speed and direction correlations of 0.89 and 0.99 and the RMSE of 2.46 m s−1 and 13.35°.
-
It is limiting to perform the typhoon boundary layer observation with single instrument. Aiming at the problems of near-field blind zone and low detection range due to high precipitation in CDL observation, the data fusion method is developed and applied to Typhoon Doksuri observations to obtain the complete wind speed profiles covering the whole ABL based on the combined measurements of CDL, RWP and AWS. It could become a powerful complement to the existing observation methods and have the broad application prospects on the study of typhoon structure.
-
The hourly mean wind speed profiles are compared with the traditional models. In general, the wind speed profiles show the best agreement with the power law in the lower part of the ABL before wind speed changes rapidly. However, the relative errors in wind speed estimated by the power law model increased with height. And it would cause a large error (up to 73 %) to describe the exact wind speed in the upper part of the ABL. As the typhoon lands, the differences in wind speed at each height decrease obviously, and the wind speeds even become almost constant with height. And wind shear or low-level jets occur at several heights after the typhoon landing. Therefore, the wind field measurements are still pretty important for the improvement of real-time intensity forecasts and understanding wind field structure.
-
During the passage of Super Typhoon Doksuri, the wind speed and wind direction measured at two sites show similar variation tendencies. On 27 July, the wind speed ranges from 15 to 25 m s−1, and northeasterly winds prevail in the ABL. Before being affected by the 34 kn wind circles, there was little difference in wind speeds at different heights. Affected by the typhoon, high wind speeds appeared around 1000 m, while low wind speeds occurred below 500 m, which was consistent with the distribution characteristics of the wind speed in the typhoon boundary layer. During 06:00–14:00 LST on 28 July, the wind speed first increases sharply in the upper part of the ABL, and then high speed extends downwards to the SL. The measured maximum wind speed values of 51.25 and 52.34 m s−1 appear on 08:15 LST (442 m) and 08:28 LST (571 m) at two locations, respectively. The prevailing winds change from northeasterly to northwesterly and then stabilize in the southwesterly direction.
As an outlook, the joint wind field measurements of CDL, RWP and AWS have the broad application prospects on the dynamics study of the TC boundary layer and the improvement of the TC track and intensity forecasting. And it is promising to realize the convergence and divergence characteristic analysis within the ABL based on the multi-instrument network observations, which is of great importance to recognize the convection initiation and development of storms.
Due to confidentiality agreements, supporting data can only be made available to bona fide researchers subject to a non-disclosure agreement. To get the data, please contact the first author (wangxiaoye@cma.gov.cn) at the Qingdao Institute of Marine Meteorology.
XW, JX, SW and GD conceived of the idea for the data fusion based on the joint measurements of CDL, RWP and AWS; XW wrote the manuscript; XW, GD, PZ and XS conducted the data analyses; QW, SC and MF collected the CDL data; ZS collected the RWP and AWS data; all the co-authors discussed the results and reviewed the manuscript.
The contact author has declared that none of the authors has any competing interests.
Publisher's note: Copernicus Publications remains neutral with regard to jurisdictional claims made in the text, published maps, institutional affiliations, or any other geographical representation in this paper. While Copernicus Publications makes every effort to include appropriate place names, the final responsibility lies with the authors.
This research was jointly supported by the National Key Research and Development Program of China (grant no. 2022YFC3004200), Basic Research Fund of Chinese Academy of Meteorological Sciences (grant no. 2024Y015), and Key Research and Development Program of Shandong Province (grant no. 2023CXGC010408).
This paper was edited by Wen Yi and reviewed by Longlong Wang and one anonymous referee.
Aoki, M., Iwai, H., Nakagawa, K., Ishii, S., and Mizutani, K.: Measurements of rainfall velocity and raindrop size distribution using coherent Doppler lidar, J. Atmos. Ocean. Tech., 33, 1949–1966, https://doi.org/10.1175/JTECH-D-15-0111.1, 2016.
Blackadar, A. K. and Tennekes, H.: Asymptotic similarity in neutral barotropic planetary boundary layers, J. Atmos. Sci., 25, 1015–1020, https://doi.org/10.1175/1520-0469(1968)025<1015:ASINBP>2.0.CO;2, 1968.
Chen, T., Fu, J., Chan, P., He, Y., Liu, A., and Zhou, W.: Wind characteristics in typhoon boundary layer at coastal areas observed via a Lidar profiler, J. Wind Eng. Ind. Aerod., 232, 105253, https://doi.org/10.1016/j.jweia.2022.105253, 2023.
Deaves, D. and Harris, R.: A mathematical model of the structure of strong winds, CIRIA Report 76, Const. Ind. Research and Inf. Assoc., Mendeley, https://www.mendeley.com/catalogue/7eb2d35b-868a-3a78-8693-a81655228a84/ (last access: 18 July 2025), 1978.
Duan, Z., Yao, X., Li, Y., Lei, X., Fang, P., and Zhao, B.: Investigation of turbulent momentum flux in the typhoon boundary layer, J. Geophys. Res.-Oceans, 122, 2259–2268, https://doi.org/10.1002/2016JC012169, 2017.
Fang, Q., Chu, K., Zhou, B., Chen, X., Peng, Z., Zhang, C., Luo, M., and Zhao, C.: Observed turbulent dissipation rate in a landfalling tropical cyclone boundary layer, J. Atmos. Sci., 80, 1739–1754, https://doi.org/10.1175/JAS-D-22-0265.1, 2023.
Gryning, S.-E., Batchvarova, E., Brümmer, B., Jørgensen, H., and Larsen, S.: On the extension of the wind profile over homogeneous terrain beyond the surface boundary layer, Bound.-Lay. Meteorol., 124, 251–268, https://doi.org/10.1007/s10546-007-9166-9, 2007.
Guo, X., Guo, J., Zhang, D. L., and Yun, Y.: Vertical divergence profiles as detected by two wind-profiler mesonets over East China: Implications for nowcasting convective storms, Q. J. Roy. Meteor. Soc., 149, 1629–1649, https://doi.org/10.1002/qj.4474, 2023.
Harris, R.: The structure of strong winds, Proc. CIRIA Conf. on Wind engineering in the eighties, 12–13 November 1980, Manchester, UK, Construction Industry Research and Information Association, London, UK, ISBN 9780860171706, 1981.
He, J., He, Y., Li, Q., Chan, P., Zhang, L., Yang, H., and Li, L.: Observational study of wind characteristics, wind speed and turbulence profiles during Super Typhoon Mangkhut, J. Wind Eng. Ind. Aerod., 206, 104362, https://doi.org/10.1016/j.jweia.2020.104362, 2020.
He, J., Chan, P., Li, Q., Li, L., Zhang, L., and Yang, H.: Observations of wind and turbulence structures of Super Typhoons Hato and Mangkhut over land from a 356 m high meteorological tower, Atmos. Res., 265, 105910, https://doi.org/10.1016/j.atmosres.2021.105910, 2022.
He, J., Chan, P. W., Chan, Y. W., and Cheung, P.: Super Typhoon Saola (2023) over the Northern Part of the South China Sea – Aircraft Data Analysis, Atmosphere-Basel, 14, 1595, https://doi.org/10.3390/atmos14111595, 2023a.
He, J., Li, Q., Chan, P.-W., Choy, C.-W., Mak, B., Lam, C.-C., and Luo, H.-Y.: An observational study of Typhoon Talim over the northern part of the South China Sea in July 2023, Atmosphere-Basel, 14, 1340, https://doi.org/10.3390/atmos14091340, 2023b.
He, Y., Chan, P., and Li, Q.: Observational study on thermodynamic and kinematic structures of Typhoon Vicente (2012) at landfall, J. Wind Eng. Ind. Aerod., 172, 280–297, https://doi.org/10.1016/j.jweia.2017.11.008, 2018.
Jin, X., Song, X., Yang, Y., Wang, M., Shao, S., and Zheng, H.: Estimation of turbulence parameters in the atmospheric boundary layer of the Bohai Sea, China, by coherent Doppler lidar and mesoscale model, Opt. Express, 30, 13263–13277, https://doi.org/10.1364/OE.455079, 2022.
Lan, C., Xie, J., Li, L., Wang, B., Yang, H., and Lu, J.: Downward momentum flux: An important mechanism of typhoon maintaining ground destructive force, J. Geophys. Res.-Atmos., 128, e2022JD037470, https://doi.org/10.1029/2022JD037470, 2023.
Li, L., Kareem, A., Hunt, J., Xing, F., Chan, P., Xiao, Y., and Li, C.: Observed sub-hectometer-scale low level jets in surface-layer velocity profiles of landfalling typhoons, J. Wind Eng. Ind. Aerod., 190, 151–165, https://doi.org/10.1016/j.jweia.2019.04.016, 2019.
Li, Q., Cheng, X., Zeng, X., Zhou, G., Huang, J., Wu, L., and Zeng, Q.: Study of the Air-Sea Momentum Flux of the Coastal Marine Boundary Layer During Typhoons, J. Geophys. Res.-Atmos., 127, e2022JD036839, https://doi.org/10.1029/2022JD036839, 2022.
Liu, B., Ma, Y., Guo, J., Gong, W., Zhang, Y., Mao, F., Li, J., Guo, X., and Shi, Y.: Boundary layer heights as derived from ground-based Radar wind profiler in Beijing, IEEE T. Geosci. Remote, 57, 8095–8104, https://doi.org/10.1109/TGRS.2019.2918301, 2019.
Liu, B., Guo, J., Gong, W., Shi, L., Zhang, Y., and Ma, Y.: Characteristics and performance of wind profiles as observed by the radar wind profiler network of China, Atmos. Meas. Tech., 13, 4589–4600, https://doi.org/10.5194/amt-13-4589-2020, 2020.
Lu, X., Yu, H., Ying, M., Zhao, B., Zhang, S., Lin, L., Bai, L., and Wan, R.: Western North Pacific tropical cyclone database created by the China Meteorological Administration, Adv. Atmos. Sci., 38, 690–699, https://doi.org/10.1007/s00376-020-0211-7, 2021.
Luo, Y., Fu, J., Li, Q., Chan, P., and He, Y.: Observation of Typhoon Hato based on the 356 m high meteorological gradient tower at Shenzhen, J. Wind Eng. Ind. Aerod., 207, 104408, https://doi.org/10.1016/j.jweia.2020.104408, 2020.
Lussier III, L. L., Montgomery, M. T., and Bell, M. M.: The genesis of Typhoon Nuri as observed during the Tropical Cyclone Structure 2008 (TCS-08) field experiment – Part 3: Dynamics of low-level spin-up during the genesis, Atmos. Chem. Phys., 14, 8795–8812, https://doi.org/10.5194/acp-14-8795-2014, 2014.
Ming, J., Zhang, J. A., Rogers, R. F., Marks, F. D., Wang, Y., and Cai, N.: Multiplatform observations of boundary layer structure in the outer rainbands of landfalling typhoons, J. Geophys. Res.-Atmos., 119, 7799–7814, https://doi.org/10.1002/2014JD021637, 2014.
Ming, J., Zhang, J. A., and Rogers, R. F.: Typhoon kinematic and thermodynamic boundary layer structure from dropsonde composites, J. Geophys. Res.-Atmos., 120, 3158–3172, https://doi.org/10.1002/2014JD022640, 2015.
Ming, J., Zhang, J. A., Li, X., Pu, Z., and Momen, M.: Observational estimates of turbulence parameters in the atmospheric surface layer of landfalling tropical cyclones, J. Geophys. Res.-Atmos., 128, e2022JD037768, https://doi.org/10.1029/2022JD037768, 2023.
Shi, W., Tang, J., Chen, Y., Chen, N., Liu, Q., and Liu, T.: Study of the boundary layer structure of a landfalling typhoon based on the observation from multiple ground-based Doppler wind lidars, Remote Sens.-Basel, 13, 4810, https://doi.org/10.3390/rs13234810, 2021.
Shu, Z., Li, Q., He, Y., and Chan, P.: Vertical wind profiles for typhoon, monsoon and thunderstorm winds, J. Wind Eng. Ind. Aerod., 168, 190–199, https://doi.org/10.1016/j.jweia.2017.06.004, 2017.
Song, L., Chen, W., Wang, B., Zhi, S., and Liu, A.: Characteristics of wind profiles in the landfalling typhoon boundary layer, J. Wind Eng. Ind. Aerod., 149, 77–88, https://doi.org/10.1016/j.jweia.2015.11.008, 2016.
Sparks, N., Hon, K., Chan, P., Wang, S., Chan, J., Lee, T., and Toumi, R.: Aircraft observations of tropical cyclone boundary layer turbulence over the South China Sea, J. Atmos. Sci., 76, 3773–3783, https://doi.org/10.1175/JAS-D-19-0128.1, 2019.
Tang, J., Zhang, J. A., Aberson, S. D., Marks, F. D., and Lei, X.: Multilevel tower observations of vertical eddy diffusivity and mixing length in the tropical cyclone boundary layer during landfalls, J. Atmos. Sci., 75, 3159–3168, https://doi.org/10.1175/JAS-D-17-0353.1, 2018.
Tang, J., Zhang, J. A., Chan, P., Hon, K., Lei, X., and Wang, Y.: A direct aircraft observation of helical rolls in the tropical cyclone boundary layer, Sci. Rep.-UK, 11, 18771, https://doi.org/10.1038/s41598-021-97766-7, 2021.
Tsai, Y.-S., Miau, J.-J., Yu, C.-M., and Chang, W.-T.: Lidar observations of the typhoon boundary layer within the outer rainbands, Bound.-Lay. Meteorol., 171, 237–255, https://doi.org/10.1007/s10546-019-00427-6, 2019.
Tse, K. T., Li, S. W., Chan, P., Mok, H., and Weerasuriya, A. U.: Wind profile observations in tropical cyclone events using wind-profilers and doppler SODARs, J. Wind Eng. Ind. Aerod., 115, 93–103, https://doi.org/10.1016/j.jweia.2013.01.003, 2013.
Wang, X., Huang, C., Huang, P., and Yu, X.: Study on wind characteristics of a strong typhoon in near-ground boundary layer, Struct. Des. Tall Spec., 26, e1338, https://doi.org/10.1002/tal.1338, 2017.
Wang, X., Dai, G., Wu, S., Zhu, P., Li, Z., Song, X., Zhang, S., Xu, J., Yin, J., and Qin, S.: Classification of Turbulent Mixing Driven Sources in Marine Atmospheric Boundary Layer with use of Shipborne Coherent Doppler Lidar observations, J. Geophys. Res.-Atmos., 128, e2023JD038918, https://doi.org/10.1029/2023JD038918, 2023.
Wu, S., Liu, B., Liu, J., Zhai, X., Feng, C., Wang, G., Zhang, H., Yin, J., Wang, X., and Li, R.: Wind turbine wake visualization and characteristics analysis by Doppler lidar, Opt. Express, 24, A762–A780, https://doi.org/10.1364/OE.24.00A762, 2016.
Wu, S., Sun, K., Dai, G., Wang, X., Liu, X., Liu, B., Song, X., Reitebuch, O., Li, R., Yin, J., and Wang, X.: Inter-comparison of wind measurements in the atmospheric boundary layer and the lower troposphere with Aeolus and a ground-based coherent Doppler lidar network over China, Atmos. Meas. Tech., 15, 131–148, https://doi.org/10.5194/amt-15-131-2022, 2022.
Xia, D., Dai, L., Lin, L., Wang, H., and Hu, H.: A field measurement based wind characteristics analysis of a typhoon in near-ground boundary layer, Atmosphere-Basel, 12, 873, https://doi.org/10.3390/atmos12070873, 2021.
Ying, M., Zhang, W., Yu, H., Lu, X., Feng, J., Fan, Y., Zhu, Y., and Chen, D.: An overview of the China Meteorological Administration tropical cyclone database, J. Atmos. Ocean. Tech., 31, 287–301, https://doi.org/10.1175/JTECH-D-12-00119.1, 2014.
Zhang, J. A., Marks, F. D., Montgomery, M. T., and Lorsolo, S.: An estimation of turbulent characteristics in the low-level region of intense Hurricanes Allen (1980) and Hugo (1989), Mon. Weather Rev., 139, 1447–1462, https://doi.org/10.1175/2010MWR3435.1, 2010.
Zhang, J. A., Rogers, R. F., Nolan, D. S., and Marks, F. D.: On the characteristic height scales of the hurricane boundary layer, Mon. Weather Rev., 139, 2523–2535, https://doi.org/10.1175/MWR-D-10-05017.1, 2011.
Zhang, J. A., Atlas, R., Emmitt, G. D., Bucci, L., and Ryan, K.: Airborne Doppler wind lidar observations of the tropical cyclone boundary layer, Remote Sens.-Basel, 10, 825, https://doi.org/10.3390/rs10060825, 2018.
Zhao, Z., Chan, P., Wu, N., Zhang, J. A., and Hon, K.: Aircraft observations of turbulence characteristics in the tropical cyclone boundary layer, Bound.-Lay. Meteorol., 174, 493–511, https://doi.org/10.1007/s10546-019-00487-8, 2020.
Zhao, Z., Gao, R., Zhang, J. A., Zhu, Y., Liu, C., Chan, P., and Wan, Q.: Observations of boundary layer wind and turbulence of a landfalling tropical cyclone, Sci. Rep.-UK, 12, 11056, https://doi.org/10.1038/s41598-022-14929-w, 2022.
Zhou, Q. J., Li, L., Chan, P. W., Cheng, X. L., Yang, H. L., Lan, C. X., and Su, J. C.: Vertical coupling of gusts in the lower boundary layer during super typhoons and squall lines, J. Geophys. Res.-Atmos., 128, e2022JD038058, https://doi.org/10.1029/2022JD038058, 2023.