the Creative Commons Attribution 4.0 License.
the Creative Commons Attribution 4.0 License.
Ground-based contrail observations: comparisons with reanalysis weather data and contrail model simulations
Jade Low
Roger Teoh
Joel Ponsonby
Edward Gryspeerdt
Marc Shapiro
Marc E. J. Stettler
Observations of contrails are vital for improving our understanding of the contrail formation and life cycle, informing models, and assessing mitigation strategies. Here, we developed a methodology that utilises ground-based cameras for tracking and analysing young contrails (< 35 min) formed under clear-sky conditions, comparing these observations against reanalysis meteorology and simulations from the contrail cirrus prediction model (CoCiP) with actual flight trajectories. Our observations consist of 14 h of video footage recorded over 5 different days in Central London, capturing 1582 flight waypoints from 281 flights. The simulation correctly predicted contrail formation and absence for around 75 % of these waypoints, with incorrect contrail predictions occurring at warmer temperatures than those with true-positive predictions (7.8 K vs. 12.8 K below the Schmidt–Appleman criterion threshold temperature). When evaluating contrails with observed lifetimes of at least 2 min, the simulation's correct prediction rate for contrail formation increases to over 85 %. Among all waypoints with contrail observations, 78 % of short-lived contrails (observed lifetimes < 2 min) formed under ice-subsaturated conditions, whereas 75 % of persistent contrails (observed lifetimes > 10 min) formed under ice-supersaturated conditions. On average, the simulated contrail geometric width was around 100 m smaller than the observed (visible) width over its observed lifetime, with the mean underestimation reaching up to 280 m within the first 5 min. Discrepancies between the observed and simulated contrail formation, lifetime, and width can be associated with uncertainties in reanalysis meteorology due to known model limitations and sub-grid-scale variabilities, contrail model simplifications, uncertainties in aircraft performance estimates, and observational challenges, among other possible factors. Overall, this study demonstrates the potential of ground-based cameras to create essential observational and benchmark datasets for validating and improving existing weather and contrail models.
- Article
(8479 KB) - Full-text XML
- BibTeX
- EndNote
Contrails form behind an aircraft at altitudes of 8–13 km when conditions in the exhaust plume fulfil the Schmidt–Appleman criterion (SAC) (Schumann, 1996). Under these conditions, the relative humidity in the exhaust plume exceeds liquid saturation, enabling water vapour to condense onto the surface of soot particles to form water droplets that subsequently freeze to form contrail ice crystals. These newly formed contrail ice particles are entrained in the aircraft's wake vortices, and in most cases, contrails that are formed disappear within a few minutes as adiabatic heating causes the ice particles to sublimate (Lewellen and Lewellen, 2001; Unterstrasser, 2016). However, a small fraction of contrails can persist beyond a few minutes when the atmosphere is ice supersaturated, i.e. a relative humidity with respect to ice (RHi) exceeding 100 % (Jensen et al., 1998a). According to the definition provided by the World Meteorological Organization (2017), contrails that survive for at least 10 min are known as persistent contrails. Over time, persistent contrails tend to spread and mix with other contrails and natural clouds to form contrail cirrus clusters (Haywood et al., 2009), affecting the Earth's radiative balance and producing a net warming effect (Fuglestvedt et al., 2010; Meerkötter et al., 1999). Recent studies suggest that the global annual mean contrail cirrus net radiative forcing (RF) in 2018 and 2019 (best-estimate of between 61 and 72 mW m−2 across three studies) (Bier and Burkhardt, 2022; Märkl et al., 2024; Quaas et al., 2021; Teoh et al., 2024a) could be around 2 times greater than the RF from aviation's cumulative CO2 emissions (34.3 [31, 38]mW m−2 at a 95 % confidence interval) (Lee et al., 2021).
Different modelling approaches are available to simulate the contrail properties and climate forcing, including the following: (i) large-eddy simulations (LESs) (Lewellen, 2014; Lewellen et al., 2014; Unterstrasser, 2016); (ii) general circulation models (GCMs) (Bier and Burkhardt, 2022; Chen and Gettelman, 2013; Märkl et al., 2024); (iii) Lagrangian models based on parameterised physics, such as the contrail cirrus prediction model (CoCiP) (Schumann, 2012); and (iv) climate change functions (CCFs) and algorithmic climate change functions (aCCFs) (Dietmüller et al., 2023; Grewe et al., 2014). These contrail modelling approaches have been used to estimate the global and regional contrail climate forcing (Bier and Burkhardt, 2022; Chen and Gettelman, 2013; Schumann et al., 2021; Teoh et al., 2022a, 2024a) and explore the effectiveness of different mitigation strategies (Burkhardt et al., 2018; Caiazzo et al., 2017; Grewe et al., 2017; Märkl et al., 2024; Martin Frias et al., 2024; Schumann et al., 2011; Teoh et al., 2020, 2022b).
To enhance confidence and ensure that any proposed contrail mitigation solution yields a net climate benefit, it is crucial that these contrail models are extensively validated against measurements and observations. Existing studies have compared the simulated contrail properties from CoCiP relative to in situ measurements, remote-sensing data, and satellite observations and have generally found good agreement between the measured and simulated contrail properties at various stages of their life cycle (Jeßberger et al., 2013; Märkl et al., 2024; Schumann et al., 2017, 2021; Teoh et al., 2024a). However, these studies either focused on aggregate statistics derived from an ensemble of contrails or assessed the simulated contrail properties with in situ measurements of young contrails at a single point in time with a limited number of data points. While satellite observations can partially address some limitations of in situ measurements by enabling a large number of contrails to be measured, matched with specific flights, and tracked over time (Duda et al., 2019; Gryspeerdt et al., 2024; Iwabuchi et al., 2012; Marjani et al., 2022; Tesche et al., 2016; Vázquez-Navarro et al., 2015), they still face challenges with respect to detecting young contrails with sub-pixel width, aged contrail cirrus that has lost its line-shaped structure, instances of cloud–contrail overlap, and contrails with small optical depths (< 0.05) (Kärcher et al., 2010; Mannstein et al., 2010; Meijer et al., 2022).
Ground-based instruments, such as lidar and cameras, can complement in situ measurements and satellite observations in validating contrail models (Mannstein et al., 2010; Rosenow et al., 2023; Schumann et al., 2013). Notably, contrail observations from ground-based cameras can provide specific advantages over satellites, particularly with respect to observing contrail formation and the early stages of their life cycle as well as detecting optically thin contrails (Mannstein et al., 2010). However, previous research using ground-based instruments has predominantly focused on natural cirrus observations (Feister et al., 2010; Long et al., 2006; Seiz et al., 2007), with only two small-scale studies comparing a total of 16 observed contrail properties (e.g. 3D positions, width, and/or persistence) with model estimates (Rosenow et al., 2023; Schumann et al., 2013). Recognising the potential of ground-based cameras, this study aims to (i) develop a methodology for detecting and tracking contrails over time and extracting their widths from ground-based camera footage and (ii) evaluate these contrail observations against CoCiP simulations, which are informed by meteorological data from a reanalysis numerical weather prediction (NWP) model, on a larger scale than prior studies.
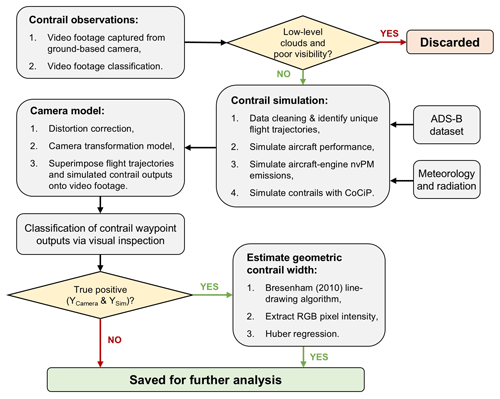
This section describes the contrail observations provided by the ground-based camera (Sect. 2.1), the workflow that is used to simulate the formation and evolution of contrails (Sect. 2.2), and the methods used to superimpose the actual flight trajectories and simulated contrails onto the video footage (Sect. 2.3) and to compare between the observed and simulated contrails properties (Sect. 2.4). Figure 1 provides an overview of the step-by-step process and datasets used to compare the ground-based contrail observations with the simulated contrail outputs.
2.1 Contrail observations
Contrail observations were made using a Raspberry Pi Camera Module v2.1, which features an 8 MP sensor (3280 pixel × 2464 pixel), a wide-angle field of view spanning 62.2° horizontally and 48.8° vertically, and a focal length of 3.04 mm (Raspberry Pi, 2023). The camera was positioned at Imperial College London's South Kensington Campus (51.4988° N, 0.1788° W) at an elevation of 25 m and pitched at a 25° angle above the horizontal plane. Recordings were taken between October 2021 and April 2022 during daylight hours at a temporal resolution of 5 s per frame. The captured footage was then filtered to remove the time intervals with low-level clouds and poor visibility (i.e. nighttime and periods with significant glare from direct sunlight) (Appendix A1). This filtering resulted in a final dataset containing 14 h of video footage collected over 5 different days.
2.2 Contrail simulation
The formation and evolution of contrails that were observed by the video footage are simulated using CoCiP (Schumann, 2012). For this study, we use the CoCiP algorithm hosted in the open-source pycontrails repository v0.52.2 (Shapiro et al., 2024). Several datasets and methods are required as inputs to CoCiP, including the following: (i) actual flight trajectories, (ii) historical meteorology and radiation fields, and (iii) aircraft performance and emissions estimates.
2.2.1 Flight trajectories and waypoint properties
The trajectories for each flight were derived using automatic dependent surveillance–broadcast (ADS-B) telemetry purchased from Spire Aviation (Teoh et al., 2024b). Each ADS-B waypoint contains the unique flight identifier (call sign and flight number) and its corresponding 4D position (longitude, latitude, barometric altitude, and time) provided at time intervals of 40 s, and we filter the dataset to only include waypoints within a defined spatial bounding box (40–60° N and 10° W–10° E) that extends ± 10° in longitude and latitude from camera's location.
The Base of Aircraft Data (BADA) Family 4 Release 4.2 aircraft performance model (EUROCONTROL, 2016) is used to estimate the following: (i) fuel mass flow rate; (ii) change in aircraft mass, assuming that the initial aircraft mass at the first known waypoint is set to the nominal mass provided by BADA; and (iii) overall efficiency (η). The aircraft-engine-specific non-volatile particulate matter (nvPM) number emissions index (EIn), which strongly influences the initial contrail ice crystal properties, is estimated by interpolating the engine-specific nvPM emissions profile from the ICAO Aircraft Engine Emissions Databank (EDB) (EASA, 2021) relative to the non-dimensional engine thrust settings (Teoh et al., 2024b). All flights are assumed to be powered by conventional Jet A-1 fuel.
2.2.2 Meteorology
The historical 4D meteorological fields within the defined spatial bounding box (40–60° N, 10° W–10° E) were provided by the European Centre for Medium-Range Weather Forecasts (ECMWF) ERA5 high-resolution realisation (HRES) reanalysis (ECMWF, 2021; Hersbach et al., 2020) at a spatial resolution of 0.25° longitude × 0.25° latitude over 37 pressure levels and at a 1 h temporal resolution. For each flight waypoint, the local meteorology is estimated from a quadrilinear interpolation across the three space coordinates and time (Schumann, 2012).
We apply the humidity correction methodology from Teoh et al. (2022a) to ensure that the ERA5-derived RHi has a probability density function that is consistent with in situ measurements from the In-service Aircraft for a Global Observing System (IAGOS) dataset (Boulanger et al., 2022; Petzold et al., 2015):
where RHimax = 1.65, aopt = 0.9779 and bopt = 1.635. Equation (1) is expected to be applicable to this study because its coefficients were calibrated using RHi measurements over the North Atlantic (40–75° N, 50–10° W), which corresponds to the same latitude band as our study domain (40–60° N, 10° W–10° E). While Eq. (1) improves the goodness of fit between the measured and ERA5-derived RHi distribution and corrects for average biases (Teoh et al., 2022a), we note that it does not correct for the RHi errors at specific waypoints (Teoh et al., 2024a). Thus, RHi uncertainties at each waypoint can remain significant.
2.2.3 Contrail cirrus prediction model
Contrails form when the ambient temperature (Tamb) at the flight waypoint is below the TSAC, which is estimated as follows:
where G is the gradient of the mixing line in a temperature-humidity diagram,
Here, is the water vapour emissions index and is assumed to be 1.237 kg kg−1 for Jet A-1 (Gierens et al., 2016); η is provided by the aircraft performance model (Sect. 2.2.1); pamb is the pressure altitude at each waypoint; cp is the isobaric heat capacity of dry air (1004 ); and R1 (461.51 ) and R0 (287.05 ) are the gas constant for water vapour and dry air, respectively.
Two successive waypoints that satisfy the SAC form a contrail segment that can either be short-lived or persistent (Schumann, 1996). A parametric wake vortex model is then used to simulate the wake vortex downwash (Holzapfel, 2003); CoCiP assumes that the wake vortex downwash process occurs instantaneously at time t = 0 without resolving the temporal evolution, which can unfold over several minutes in the real world (Schumann, 2012).
Persistent contrails in CoCiP are defined when their post-wake vortex ice water content (IWC) remains above 10−12 kg kg−1. The persistent contrail width (W) and depth (D) in CoCiP, defined as the dimensions along the y and z axis of a Gaussian plume, are initialised as follows:
where Sa is the aircraft wingspan and dZmax is the maximum vertical displacement of the contrail mid-point after the wake vortex breakup.
The evolution of different contrail properties is then simulated using a first-order Euler method with model time steps (dt) of 40 s. More specifically, the change in contrail dimensions over time is estimated as follows:
where σ is a dispersion matrix that captures the spread of the contrail plume along the y and z axes. σ is influenced by various factors, such as wind shear, contrail segment length, diffusivity, and dt (Schumann, 2012). CoCiP assumes that the contrail segment is sublimated when its ice particle number concentration or optical depth drops below 103 m−3 and 10−6, respectively, or when the mid-point of the contrail plume advects beyond the simulation domain (40–60° N, 10° W–10° E). We specifically selected a dt that is significantly smaller than the typical range that was used in previous studies (1800–3600 s) (Schumann et al., 2015; Teoh et al., 2020a, 2022a) to superimpose the simulated contrail outputs to the video footage and perform a more comprehensive assessment of the early-stage contrail evolution.
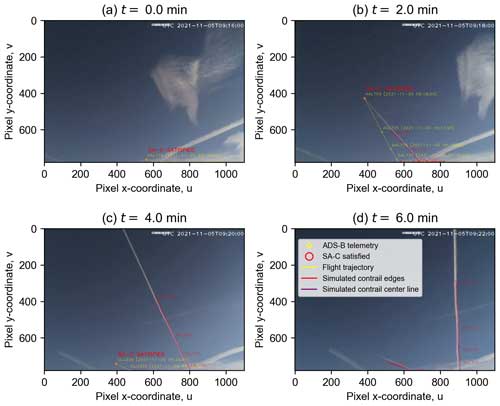
Figure 2Example of the flight trajectory and simulated contrail dimensions from the flight with call sign UAL31, both of which are superimposed onto the video footage using the camera transformation model (detailed in Sect. 2.3). The flight trajectory and persistent contrails were observed on 5 November 2021 between 09:37:20 and 09:45:20 UTC.
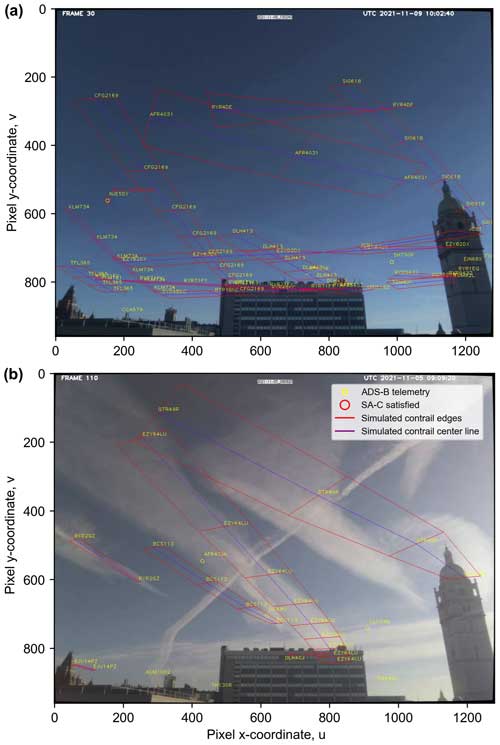
Figure 3Examples of the simulated contrails that were initially formed outside the camera's observation domain and subsequently drifted into view on (a) 9 November 2021 at 10:02:40 UTC and (b) 5 November 2021 at 09:09:20 UTC. The CoCiP-simulated contrail dimensions are superimposed onto the video footage using the camera transformation model (detailed in Sect. 2.3). In panel (a), the faint signals and absence of observed contrails suggest that they could be false-positive outcomes (NCamera and YSim=CoCiP). In panel (b), the absence of labels on some observed contrails indicates that they were most likely false-negative outcomes (YCamera and NSim=CoCiP).
2.3 Camera transformation model
Before comparing the camera observations with aircraft positions and simulated CoCiP outputs, we first correct any radial and tangential distortion of the video footage using the OpenCV homography method (Bradski, 2000), specifically applying the chessboard calibration technique (Tsai, 1987; Wu et al., 2015) described in Appendix A2. After correcting for distortions, we project the ADS-B waypoints and simulated contrail dimensions onto the video footage using a camera transformation model that follows a two-step process. First, the real-world 3D positions (i.e. ADS-B waypoints and the simulated mid-point and edges of the contrail plumes) are mapped into a 3D camera coordinate system () using an extrinsic (rotation) matrix. Next, the 3D camera coordinates () are transformed into a 2D pixel coordinate system (u,v) using an intrinsic (camera) matrix. Using this two-step process, Fig. 2 shows the ADS-B waypoints and simulated contrails superimposed onto the video footage, specifically young contrails less than 6 min old that were formed within the camera's field of view. Similarly, Fig. 3 projects the simulated dimensions of aged contrails (i.e. those initially formed outside the camera's field of view and subsequently advected into it) onto the footage and compares them with the observed contrails. Further details of the camera transformation model can be found in Appendix A3.
2.4 Comparison between contrail observation and simulation
We visually compare the simulated contrail formation with observations and classify each waypoint into four groups: (i) true-positive cases (YCamera and YSim), where contrails are both observed by the camera (YCamera) and predicted in the simulation (YSim); (ii) true-negative cases (NCamera and NSim), where no contrails are observed (NCamera) and predicted (NSim); (iii) false-positive cases (NCamera and YSim), where contrails are predicted in the simulation but not observed; and (iv) false-negative cases (YCamera and NSim), where contrails are observed but not predicted in the simulation. More specifically, we evaluate the accuracy of the contrail simulation workflow by first assessing whether it correctly identifies short-lived contrails based on the SAC (i.e. Tamb < TSAC), noting correct and incorrect predictions as YSim=SAC and NSim=SAC, respectively. Additionally, we also compare CoCiP's definition of persistent contrail formation (i.e. post-wake vortex contrail IWC > 10−12 kg kg−1) against observations, with accurate and missed predictions denoted as YSim=CoCiP and NSim=CoCiP, respectively. In instances where multiple observed contrail segments (YCamera) overlap and/or are closely clustered together, we assign them to the respective ADS-B waypoints through manual visual inspection of preceding frames (Segrin et al., 2007).
All waypoints with YCamera are further classified into three categories based on their observed contrail lifetime, defined as the duration during which the contrail is observed by the camera: (i) short-lived contrails with lifetimes of fewer than 2 min; (ii) contrails with lifetimes of between 2 and 10 min; and (iii) persistent contrails with lifetimes of least 10 min (World Meteorological Organization, 2017). We note that the observed contrail lifetime in our study is restricted by the contrail advecting out of the camera's field of view (see Fig. A2), becoming too small or faint to be visible in the footage, or sublimating within the observation domain.
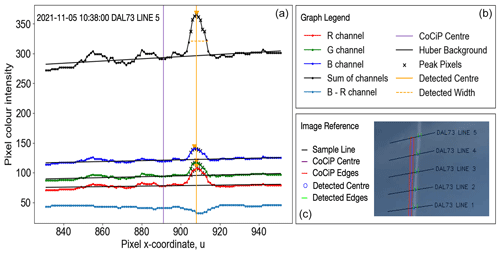
Figure 4Pixel colour intensity profiles of the contrail waypoint at Line 5 (shown in panel c). The contrail observed in panel (c) was formed by the flight with call sign DAL73. In panel (a), the black linear trend lines represent the best-fit background colour intensity for each RGB channel, the solid yellow vertical line marks the mid-point of the observed contrail plume, and the dashed (horizontal) yellow line indicates the estimated contrail pixel width. In panels (a) and (c), the purple line indicates the centre of the simulated contrail plume from CoCiP, and the red lines in panel (c) show the simulated contrail edges.
Additionally, for waypoints with true-positive cases (YCamera and YSim=CoCiP), we also compare their observed lifetimes and evolving contrail width relative to the simulated CoCiP outputs. To estimate the observed contrail pixel width from the video footage, we apply the Bresenham (2010) line-drawing algorithm at each ADS-B waypoint to extract (i) a line of pixels orthogonal to the flight trajectory and (ii) the red–green–blue (RGB) colour channel intensity of these pixels (Fig. 4). Previous studies have found that the presence of clouds can be identified by their prominent increase in pixel intensity, especially in the red channel relative to the blue channel, as the sky scatters more blue than red light, whereas clouds scatter both red and blue light equally (Long et al., 2006; Shields et al., 2013). However, due to day-to-day variability in atmospheric conditions, we were unable to consistently identify contrails from the video footage by applying a fixed threshold for the red-to-blue pixel intensity ratio. Instead, we compare the relative difference between the local pixel intensity (Pu, v) and the estimated background pixel intensity (), i.e. the estimated pixel intensity of the background sky assuming that the contrail is absent,
Here, , represented by the black line of best fit in the RGB plot of Fig. 4, is estimated using a Huber regression instead of a traditional least-squares regression to minimise the regression sensitivity to outliers (Pedregosa et al., 2012). The observed contrail pixel width at each waypoint and time slice is then estimated from the video footage as follows:
where and SD (ΔPu,v) are the mean and standard deviation (SD) of the line of pixels orthogonal to the flight trajectory, respectively. The centre of the observed contrail plume determined by locating the local maximum of ΔPu,v (see vertical yellow line in Fig. 4). The reverse camera transformation is then applied to convert the 2D plane pixel width to a geometric width within a 3D space. Notably, due to the lack of depth information from a single camera, we assume that the observed contrail altitude is equal to the modelled contrail altitude from CoCiP. This assumption introduces an additional source of error in the observed geometric contrail width when compared with the pixel contrail width, which we discuss in Sect. 3.3.
Section 3.1 compares the observed contrail formation with those predicted by the SAC and CoCiP. Section 3.2 evaluates the observed contrail lifetime against the ERA5-derived meteorology and simulated contrail lifetime, while Sect. 3.3 compares the temporal evolution of contrail width between the observations and simulation. Finally, Sect. 3.4 briefly explores the potential limitations in detecting contrails from the video footage. Across these sections, we discuss the known and potential factors that may contribute to the discrepancies between the observed and simulated contrail properties, while acknowledging that the list of factors may not be exhaustive.
Table 1Summary statistics for each day when contrails were observed by the camera. For each of the 5 d, the observed contrail formation from the video footage is compared with the two different definitions of contrail formation in the simulation, i.e. using the SAC (Tamb < TSAC) and CoCiP's definition of persistent contrail formation (post-wake vortex contrail IWC > 10−12 kg kg−1).
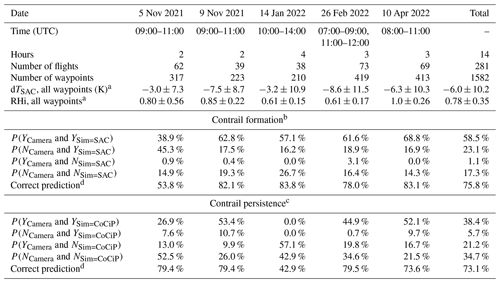
a Mean ± 1 standard deviation across all waypoints, as derived from the ERA5 HRES. For each of the 5 d, the ambient meteorological conditions across all flight waypoints are visualised in Fig. 6. b Contrail formation in the simulation is determined by the SAC, where YSim=SAC denotes that Tamb < TSAC, and NSim=SAC denotes thatTamb≥TSAC. c Contrail persistence in the simulation is determined by CoCiP, where YSim=CoCiP denotes that the post-wake vortex contrail IWC ≥ 10−12 kg kg−1, and NSim=CoCiP denotes that the contrail IWC < 10−12 kg kg−1. d The correct prediction is calculated by (YCamera and YSim) + (NCamera and NSim).
3.1 Contrail formation
A total of 1582 unique waypoints from 281 flights were identified across 5 d of video footage. Contrail formation was observed in 59.6 % of these waypoints (YCamera), 81.6 % of these waypoints satisfied the SAC in the simulation (YSim=SAC), and 44.2 % formed persistent contrails according to CoCiP's definition (YSim=CoCiP) (Table 1).
When evaluated using the SAC, the simulation correctly predicted contrail formation and absence for 75.8 % of the waypoints, i.e. true positives (YCamera and YSim=SAC = 58.5 %) and true negatives (NCamera and NSim=SAC = 17.3 %), of which (i) true-positive waypoints were always formed above 30 000 ft (9144 m), whereas (ii) true-negative waypoints were always formed below 32 000 ft (9754 m), where warmer temperatures limit contrail formation, or above 40 000 ft (12 192 m), where drier stratospheric conditions are more common (Fig. 5a). In contrast, the SAC incorrectly predicted contrail formation in 24.2 % of the waypoints, where the false positives (NCamera and YSim=SAC = 23.1 %) significantly outweighed the false negatives (YCamera and NSim=SAC = 1.1 %). This overestimation in contrail formation by the SAC may be due to observation challenges, as false-positive waypoints were often associated with very low RHi values (0.62 ± 0.38 at 1 SD; Fig. 6b) relative to true-positive waypoints (0.90 ± 0.30 at 1 SD; Fig. 6a), potentially resulting in very short-lived or faint contrails that might not be detected by cameras (Fig. 3a). Other factors that may influence the SAC accuracy include uncertainties in the following: (i) Tamb from the ERA5 HRES; (ii) TSAC, resulting from modelling errors in η, see Eqs. (2) and (3), and the assumption of homogenous plume mixing; and (iii) soot activation at Tamb≈TSAC, which is likely incomplete (Bräuer et al., 2021) and becomes strongly dependent on the soot dry-core radius and hygroscopicity, which are not accounted for by the SAC (Bier et al., 2022). Indeed, contrails at waypoints with incorrect predictions were generally formed at higher temperatures (dTSAC = Tamb−TSAC = −7.8 ± 4.3 K at 1 SD) compared with true-positive waypoints (dTSAC = −12.8 ± 3.7 K at 1 SD) (Fig. 5a).
CoCiP defines persistent contrail formation as occurring when the post-wake vortex contrail IWC exceeds 10−12 kg kg−1 (YSim=CoCiP), and adiabatic heating from the wake vortex downwash is assumed to occur instantaneously at the time of contrail initialisation. As a result, waypoints with YSim=CoCiP are a subset of YSim=SAC. Using CoCiP's definition of persistent contrails, the overall accuracy of contrail predictions over 5 d decreased slightly from 75.8 % (SAC approach) to 73.1 %, with significant variability between individual days (Table 1). Unlike with the SAC, the percentage of false-negative waypoints (YCamera and NSim=CoCiP = 21.2 %) is nearly 4 times higher than the false-positive waypoints (NCamera and YSim=CoCiP = 5.7 %) (cf. YCamera and NSim=SAC = 1.1 % vs. NCamera and YSim=SAC = 23.1 %). False-negative waypoints also tend to occur at lower altitudes (35 100 ± 2600 ft at 1 SD, equivalent to 10 698 ± 792 m) and under subsaturated RHi conditions (0.68 ± 0.19 at 1 SD) relative to those with true-positive outcomes (altitudes of 37 500 ± 2700 ft, equivalent to 11 430 ± 823 m, and RHi of 1.02 ± 0.29, respectively) (Fig. 5b). Notably, on 14 January 2022, correct contrail predictions dropped sharply from 83.8 % to 42.9 %, with no persistent contrails predicted in the simulation, as the ERA5-derived RHi values at all waypoints were well below ice supersaturation (0.07–0.79; Fig. 6). The difference in accuracy between the SAC and CoCiP's definition of persistent contrail formation is most likely due to contrail model simplifications (i.e. instantaneous wake vortex downwash) which can underestimate the simulated contrail lifetimes, particularly for short-lived contrails. Indeed, when waypoints are segmented by the observed contrail lifetime, the simulation correctly predicted contrail formation for only 55 % of waypoints with short-lived contrails (YCamera < 2 min and YSim=CoCiP). However, correct predictions increased significantly to 96 % for waypoints with observed lifetimes of between 2 and 10 min and to 86 % for waypoints with observed contrails persisting beyond 10 min.
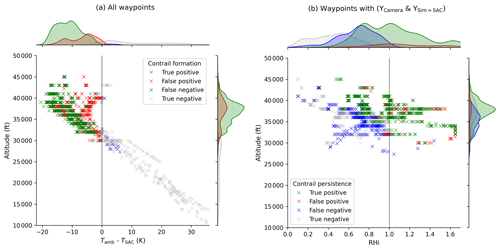
Figure 5Joint plot of the aircraft barometric altitude vs. the (a) difference between the ambient (Tamb) and SAC threshold temperature (TSAC) across all flight waypoints and (b) corrected RHi from the ERA5 HRES for waypoints that satisfy the SAC in the simulation (YSim=SAC). In both panels, green data points represent true-positive outcomes (YCamera and YSim), red data points represent false-positive outcomes (NCamera and YSim), blue data points represent false-negative outcomes (YCamera and NSim), and grey data points represent true-negative outcomes (NCamera and NSim). In panel (b), the false-negative (YCamera and NSim=CoCiP) and true-negative (NCamera and NSim=CoCiP) outcomes correspond to waypoints that satisfied the SAC in the simulation but did not persist beyond the wake vortex phase.
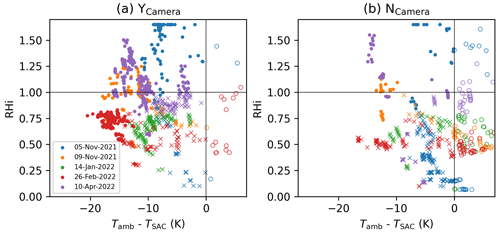
Figure 6Corrected RHi from the ERA5 HRES vs. the difference between the ambient (Tamb) and SAC threshold temperature (TSAC) for all waypoints across 5 d (a) with and (b) without contrails observed from the video footage. In both plots, data points with no fill (circles) represent waypoints for which contrails did not form in the simulation (NSim=SAC), crosses indicate waypoints that satisfied the SAC in the simulation (YSim=SAC), and filled data points denote waypoints for which persistent contrails were formed in the simulation (YSim=CoCiP).
3.2 Contrail lifetime
We categorise the 942 unique waypoints with observed contrails (YCamera) into three groups based on their observed contrail lifetimes (Sect. 2.4). Among these waypoints, 73.3 % of them are short-lived with observed lifetimes of less than 2 min. Of these short-lived contrails, 99.3 % of them either became too small to be tracked or sublimated within the camera's field of view, while 0.7 % advected out of it. Contrails with observed lifetimes ranging between 2 and 10 min made up 12.5 % of the observations, with 36 % of them drifting beyond the camera's field of view. The remaining 14.2 % of contrails had observed lifetimes exceeding 10 min, of which 64 % of them advected beyond the camera's field of view.
For waypoints with YCamera, we compared their observed contrail lifetimes against the ERA5-derived meteorology at the point and time of their formation (Fig. 7). Our analysis shows the following: (i) 98 % of the observed contrails fulfilled the SAC (Tamb < TSAC) in the simulation; (ii) 78 % of short-lived contrails (YCamera < 2 min) were formed under ice-subsaturated conditions (RHi < 100 %), with a mean RHi of 81 ± 25 % (1 SD); (iii) 59 % of contrails with observed lifetimes of between 2 and 10 min also formed under ice-subsaturated conditions, but the mean RHi is higher at 103 ± 32 %; and (iv) 75 % of persistent contrails (YCamera > 10 min) were formed under ice-supersaturated conditions (RHi > 100 %), with a mean RHi of 124 ± 26 %.
Figure 8 shows a poor visual agreement between the observed and simulated contrail lifetime, with the simulated lifetimes being strongly influenced by the ERA5-derived RHi. Specifically, the simulation always predicts contrails with lifetimes below 5 min when the RHi is less than 100 %, often underestimating the observed contrail lifetimes. Additionally, the simulation consistently predicts contrails with lifetimes exceeding 2 min when the RHi is above 100 %, even though around half of these waypoints were observed with short-lived contrails (< 2 min). It also tends to predict contrail lifetimes longer than 35 min when the RHi exceeds 120 %, although evaluating these predictions is challenging because the maximum observed contrail lifetime can be limited by the contrail drifting out of the field of view or becoming too small or faint to be tracked (Fig. 3a).
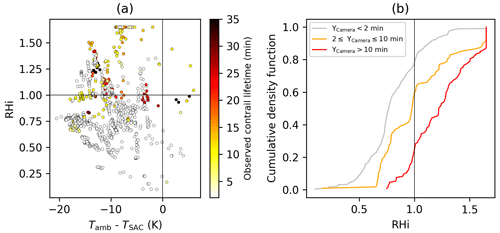
Figure 7Evaluation of the observed contrail lifetime relative to the ERA5-derived meteorology at the point and time of their formation for all waypoints with observed contrails (YCamera). Panel (a) compares the observed contrail lifetime with the RHi (y axis) and the difference between the ambient temperature (Tamb) and SAC threshold temperature (TSAC) (x axis). Panel (b) shows the cumulative density functions of the initial RHi, with the data points segmented into three groups based on their observed contrail lifetimes, i.e. those lasting fewer than 2 min (grey), between 2 and 10 min (orange), and more than 10 min (red).
Two known factors contribute to the uncertainty in ERA5-derived RHi estimates. Firstly, the ERA5 HRES humidity fields often produce weakly supersaturated RHi estimates (Agarwal et al., 2022; Reutter et al., 2020; Teoh et al., 2022a). Although corrections were applied to ensure that the ERA5-derived RHi distribution is consistent with in situ measurements (Sect. 2.2.2), RHi uncertainties remain large at the waypoint level (Teoh et al., 2024a). Secondly, the spatial resolution of the ERA5 HRES (0.25° longitude × 0.25° latitude ≈ 18 km × 28 km) is insufficient to capture the sub-grid-scale RHi variabilities that have been observed from in situ measurements (Wolf et al., 2024). Given the small study domain, for which the camera's field of view fits within 10 grid boxes of the ERA5 HRES (Fig. A2), our simulation would be particularly impacted by these sub-grid-scale effects. However, we do not evaluate these effects due to our small sample size (n=942 for waypoints with YCamera distributed over 14 h and 10 grid boxes). The observed decline in agreement between observations and simulations from contrail formation (Table 1) to contrail persistence (Fig. 8) is consistent with earlier studies that found the ERA5 HRES temperature fields to be more accurate than its humidity fields (Gierens et al., 2020; Reutter et al., 2020).
3.3 Contrail width
Figure 9 compares the temporal evolution of the observed and simulated contrail geometric widths for 70 waypoints with true-positive cases (YCamera and YSim=CoCiP) and observed lifetimes greater than 2 min. On average, the simulated contrail geometric widths are around 100 m smaller than the observed widths over the observed contrail lifetime, with the largest underestimations occurring within the first 5 min (−280 m, on average; Fig. 9b). The tendency to underestimate the simulated contrail widths is consistent with Schumann et al. (2013) and can be attributed to several known factors, including the following: (i) uncertainties in wind shear and turbulent mixing, where their sub-grid-scale variabilities cannot be resolved from the spatiotemporal resolution of the ERA5 HRES (Hoffmann et al., 2019; Paugam et al., 2010; Schumann et al., 2013); (ii) contrail model errors resulting from the use of simplified physics, such as the Gaussian plume assumption which may not adequately represent the contrail cross-sectional area (Jensen et al., 1998b; Sussmann and Gierens, 1999; Unterstrasser and Gierens, 2010), the instantaneous wake vortex assumption, and the initialisation of persistent contrail width solely based on the aircraft wingspan, see Eq. (4), without considering wake vortex dynamics and ambient meteorology (Lewellen and Lewellen, 2001; Schumann, 2012); and (iii) CoCiP's definition of the simulated contrail width (i.e. the length across the y axis of a Gaussian plume), which is inherently shorter than the maximum possible observed contrail width (i.e. length across the major axis of an inclined ellipse). These factors are among those identified and may not be exhaustive.
In addition to errors in the simulated contrail width, independent error sources in the observed contrail widths also contribute to the poor visual agreement between the observed and simulated contrail widths (Fig. 9a). Firstly, the presence of other contrails and natural cirrus can affect the Huber regression used to identify the contrail edges, see Eq. (9), thereby contributing to errors in the observed contrail pixel width (Fig. 3b). Secondly, converting the observed pixel width to geometric width introduces additional errors due to the lack of data on (i) the contrail altitude, for which we assume that the observed contrail altitude is equal to the simulated contrail altitude in CoCiP (Sect. 2.4), and (ii) the inclination angle of the elliptical contrail plume, where parallax errors can contribute to a larger variability in the observed geometric width relative to the pixel width. Assumption (i) is subject to uncertainties in the actual aircraft mass and local meteorology, which can result in additional errors when simulating the contrail vertical displacement caused by the wake vortex downwash. We evaluate the sensitivity of the observed geometric width to these factors by varying the assumed contrail altitude and the altitude at one of the contrail edges by ± 100 m. Our results indicate that the inclination angle has a significantly greater influence on the observed contrail geometric width (± 36 %) compared with the altitude assumption (± 0.9 %).
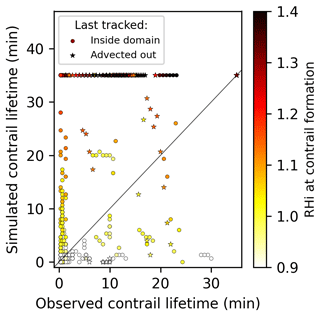
Figure 8Comparison between the observed and simulated contrail lifetime for waypoints with true-positive outcomes (YCamera and YSim=CoCiP). Observed contrails are categorised based on their final known position: circles represent contrails that either sublimated or became too small or faint within the observation domain, while stars indicate that the contrail drifted out of the observation domain and can no longer be tracked. The colour bar represents the corrected ERA5-derived RHi at the time of contrail formation. The simulated contrail lifetime in this plot is constrained to 35 min to align with the maximum observed contrail lifetime.
3.4 Contrail detection limits
We visually examined contrails that initially formed outside the observation domain and were subsequently advected into view, where the results yielded mixed outcomes. Firstly, on 5 November 2021 at 09:09:20 UTC, some predicted contrails aligned well with the observations (Fig. 3b). However, not all observed contrails were predicted by the model, and there were notable differences in the locations of predicted and observed contrails. We note that contrail–contrail and cloud–contrail overlapping further complicated the identification of contrail edges and the extraction of contrail widths.
Secondly, on 9 November 2021 at 10:02:40 UTC, we were unable to visually confirm the presence of contrails in the video footage (Fig. 3a), despite the simulation predicting contrail cirrus with a mean optical depth of 0.024 [0.002, 0.056] (5th and 95th percentile). This suggests that these contrails could be misclassified as false-positive cases (NCamera and YSim=CoCiP) because their optical depths were below or close to the lower visibility threshold limit for ground-based observers (optical depth of < 0.02) (Kärcher et al., 2009). Although faint white grains were visible in the video footage (Fig. 3a), it remains challenging to determine whether these features represent contrail cirrus. This difficulty underscores the challenges that remote-sensing methods, including ground-based cameras, face with respect to detecting optically thin contrails below a yet-to-be determined threshold optical depth (Driver et al., 2024; Mannstein et al., 2010; Meijer et al., 2022).
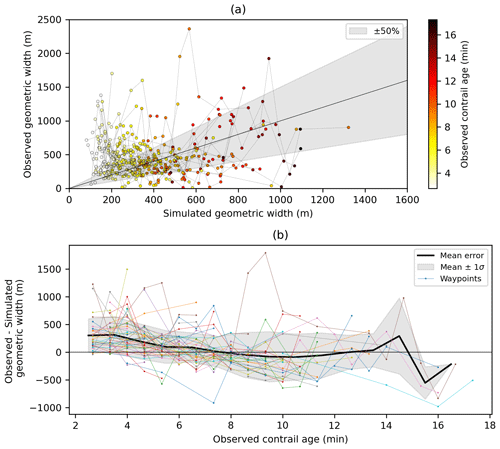
Figure 9Comparison between the observed and simulated contrail geometric width for waypoints with true-positive cases and with observed lifetimes exceeding 2 min (YCamera > 2 min and YSim=CoCiP). Panel (a) shows a parity plot between the observed and simulated widths at a single point in time, with the black line representing the 1:1 line. Panel (b) illustrates the difference between the observed and simulated geometric widths as a function of the observed contrail age. For panels (a) and (b), individual lines connecting different data points represent the temporal evolution of the contrail width at each contrail waypoint. The observed contrail pixel width is converted to the observed geometric width using the reverse camera transformation model (see Sect. 2.3).
Ground-based cameras can observe contrails at a higher spatiotemporal resolution than satellite imagery, making them potentially valuable for validating the early contrail life cycle as simulated by contrail models. In this study, we develop a methodology to analyse contrail formation, persistence, and their geometric widths from ground-based video footage and then subsequently compare these observations with contrail simulations. Our contrail observations consist of 14 h of video footage recorded on 5 different days at Imperial College London's South Kensington Campus. The actual flight trajectories intersecting with the camera's field of view were obtained from ADS-B telemetry, and contrails formed by these flights were simulated with CoCiP using historical meteorology from the ECMWF ERA5 HRES reanalysis.
In total, we identified 1582 flight waypoints from 281 flights from the video footage, with contrails observed in 60 % of these waypoints (YCamera) under clear-sky conditions. The simulation correctly predicted contrail formation and absence for 76 % of these waypoints when evaluated using the SAC (Tamb < TSAC), whereas it correctly predicted contrail formation and absence for 73 % of waypoints when evaluated using CoCiP's definition of persistent contrail formation (post-wake vortex contrail IWC > 10−12 kg kg−1) (Table 1). Among waypoints with incorrect predictions, the SAC overestimated contrail formation, with 23 % of waypoints being false positives (NCamera and YSim=SAC) vs. 1 % false negatives (YCamera and NSim=SAC). In contrast, CoCiP's definition underestimated contrail formation, with 6 % of false positives (NCamera and YSim=CoCiP) vs. 21 % of false negatives (YCamera and NSim=CoCiP). A comparison with reanalysis weather data suggests that incorrect predictions were often associated with warmer temperatures (dTSAC = −7.8 ± 4.3 K at 1 SD) and subsaturated RHi conditions (0.68 ± 0.19 at 1 SD) relative to those with true-positive outcomes (dTSAC = −12.8 ± 3.7 K and RHi = 1.02 ± 0.29) (Fig. 5).
When waypoints with YCamera are segmented based on their observed contrail lifetime, the simulation accurately predicted contrail formation for only 55 % of short-lived contrails (YCamera < 2 min and YSim=CoCiP), whereas correct predictions rose to over 85 % for contrails with observed lifetimes exceeding 2 min (YCamera ≥ 2 min and YSim=CoCiP). Notably, among the waypoints with YCamera, (i) 98 % of them fulfilled the SAC, (ii) 78 % of short-lived contrails (observed lifetimes < 2 min) initially formed at RHi < 100 %, (iii) 59 % of contrails with observed lifetimes ranging between 2 and 10 min also formed at RHi < 100 %, and (iv) 75 % of persistent contrails (observed lifetimes > 10 min) formed at RHi > 100 % (Fig. 7). The observed contrail geometric widths tend to be larger than the simulated widths by an average of 100 m over their observed lifetime, with the most significant underestimations (around 280 m) occurring during the first 5 min (Fig. 9).
Overall, our results show a gradual decline in agreement between observations and simulations, particularly as contrails progress from formation to persistence. Discrepancies between the observed and simulated contrail properties stem from multiple sources, including the following: (i) uncertainties in the ERA5 HRES humidity fields; (ii) sub-grid-scale variabilities that cannot be captured by the spatiotemporal resolution of existing NWP models; (iii) contrail model assumptions and simplifications; (iv) uncertainties in the simulated aircraft overall efficiency, which influences TSAC; (v) observational challenges (Fig. 3); and (vi) potentially other unidentified factors. Nevertheless, we acknowledge the potential limitations of our study, including the small sample size and an inherent bias toward selecting contrails formed under high-pressure systems (i.e. clear-sky conditions), which is estimated to account for only 15 % of all contrails in the Northern Hemisphere (Bedka et al., 2013). This selection bias excludes a significant portion of contrails formed in low-pressure systems associated with storms or overcast weather. Such discrepancies in synoptic weather conditions could introduce varying error patterns in NWP models, which may propagate and affect the accuracy of the simulated contrail outputs. Additionally, as we specifically selected days with observed contrails, our findings should not be interpreted as representative of the overall likelihood of contrail formation.
Future work can build upon our research by (i) developing a methodology to estimate the contrail optical thickness from ground-based cameras; (ii) establishing a network of ground-based cameras to observe contrails across a larger set of flights and over a wider domain, while also mitigating the sensitivity of camera models to contrail altitude; (iii) combining ground-based (i.e. cameras and lidars) and satellite observations to track the whole contrail life cycle and beyond cloud-free conditions; (iv) conducting a large-scale comparison between the observed and simulated contrails to establish benchmark datasets, which can be used to validate and improve the accuracy of contrail models and the humidity fields provided by NWP models; and (v) integrating ground-based observations with contrail forecasts, thereby reducing the uncertainties in the real-time decision-making processes for flight diversions to minimise the formation of strongly warming contrails.
A1 Video classification and camera field of view
Temporal variabilities in weather conditions influence the suitability of the video footage for contrail observations. To filter the video footage that can be used to observe, track, and extract the properties of contrails, we visually inspect each hourly recording and classify it based on the background cloud cover (Table A1) and lighting (Table A2) conditions. An example of each classification is shown in Fig. A1. The 14 h of video footage that was selected for further analysis has (i) clear-sky conditions and (ii) optimal lighting with a strong colour contrast between the (blue) sky and (white) contrails. Following the selection of video footage that is feasible for contrail analysis, we reduced the footage frame rate to 40 s per frame to match the temporal resolution of the ADS-B data and CoCiP outputs. Figure A2 shows the camera's position and the spatial distribution of observed contrails within its field of view. The camera transformation model, as will be described in Appendix A3, was applied to systematically superimpose ADS-B data and CoCiP outputs onto the video footage.
Table A1Classification of the video footage by the extent of background cloud cover.

∗ The unit “okta” is used to quantify the extent of cloud cover by dividing the sky into eights. A measurement of 0 oktas denotes a completely clear sky, whereas 8 oktas imply an entirely overcast sky.
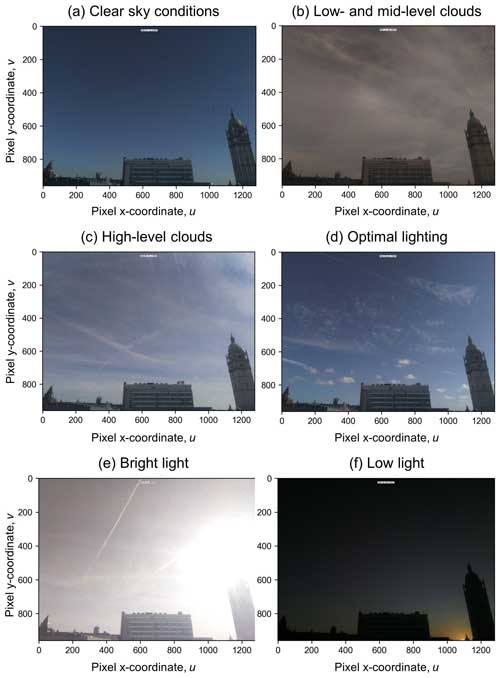
Figure A1Examples of the different background cloud cover, i.e. (a) clear-sky conditions, (b) low-level and mid-level clouds, and (c) high-level clouds), and lighting conditions, i.e. (d) optimal lighting, (e) bright-light, and (f) low-light conditions, as described in Tables A1 and A2, respectively.
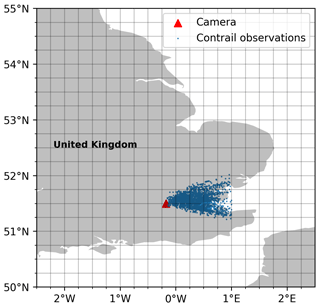
Figure A2Location of the camera (51.4988° N, 0.1788° W) and the spatial distribution of observed contrails within its field of view (n = 942 for waypoints with YCamera). The grid boxes represent the spatial resolution of ERA5 HRES (0.25° longitude × 0.25° latitude). Basemap plotted using Cartopy 0.22.0 and sourced from Natural Earth; licensed under public domain.
A2 Corrections to camera distortion
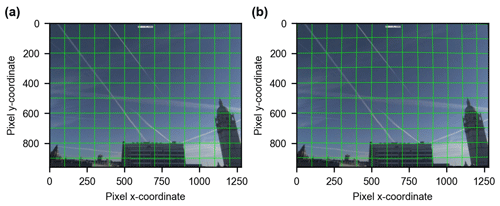
Unlike the ideal pinhole model, camera images contain radial and tangential distortion. Radial distortion occurs due to the bending of light rays near the edge of a lens, causing straight lines to appear curved. Tangential distortion occurs when the lens assembly is not directly parallel and centred over the image plane. Distortion coefficients are determined using a chessboard pattern and homography, and an example process can be found in Wu et al. (2015). Using the OpenCV Python package (Bradski, 2000), every pixel is mapped to a corrected position following these steps:
-
Step 1. The distorted pixel coordinates (udist,vdist) are converted to distorted camera coordinates (xdist, ydist, zdist) in Eq. (A1) using the inverse of the camera intrinsic matrix (K−1; see Appendix A3),
-
Step 2. The distorted camera coordinates are corrected using Eqs. (A2) and (A3), both of which are found in the OpenCV package documentation,
where and are normalised coordinates; , k1=0.580, , and k3=4.420 are radial distortion coefficients; and p1 = 5.803 × 10⁻¹ and p2 = −2.576 × 10⁻³ are tangential distortion coefficients.
-
Step 3. The undistorted pixel coordinates (u, v) are recalculated using Eq. (A4),
Figure A3 shows an original frame captured by the camera alongside a corrected frame using the three-step process. While these differences may not be visually discernible, it is crucial to remove distortions to minimise errors when extracting the observed contrail pixel and geometric width from these images. The correction of the minor distortion in the original frame is evident through the added grid lines. All video footage used in the study underwent initial frame-by-frame processing to eliminate distortion before conducting subsequent analysis.
A3 Camera transformation model
After correcting for distortions, a camera transformation method is used to project the aircraft positions and simulated contrail location, which are provided as 3D positions, to the camera observations, which utilise a 2D pixel coordinate (u,v). A two-step process is used to achieve this:
-
Step 1. The real-world 3D positions relative to the camera are mapped to a 3D camera coordinate system () using an extrinsic (rotation) matrix R,
R describes the camera rotation in relation to the world axis, where Rx, Ry, and Rz are the roll, pitch, and yaw of the camera, respectively. The R coefficients are estimated by minimising the residuals between the computed and measured pixel coordinates of known aircraft positions and landmarks that are visible in the camera frame.
-
Step 2. The 3D camera coordinates are then transformed to a 2D pixel coordinate system (u,v) using an intrinsic (camera) matrix K,
where the camera parameters fx and fy are the focal lengths in pixel units, (x0,y0) is the principal point of the image, and s represents the axis skew. Figure 2 in the main text provides an example of the superimposed flight trajectories and simulated contrail properties to the video footage.
The ADS-B telemetry used to derive the actual flight trajectories, along with the time-lapse videos, and observed contrail properties used in this study are publicly available from the Centre for Environmental Data Analysis (CEDA) Archive at https://doi.org/10.5285/f45a1a95ddcc480784640da6f3001904 (Imperial College London, 2024). The pycontrails repository that contains the CoCiP algorithm has been published and is publicly available at https://doi.org/10.5281/zenodo.13151570 (Shapiro et al., 2024).
MEJS and EG conceptualised the study. JL, RT, JP, and EG developed the methodology and undertook the investigation. JL, RT, JP, EG, and MS were responsible for software development and data curation. RT and JL created or sourced the figures. RT and JL wrote the original manuscript. MEJS, EG, and MS acquired funding. All authors have read, edited, and reviewed the manuscript and agreed upon the published version of the paper.
The contact author has declared that none of the authors has any competing interests.
This work used elements of Base of Aircraft Data (BADA) Family 4 Release 4.2, which has been made available by EUROCONTROL to Imperial College London. EUROCONTROL has all relevant rights to BADA. ©2019 The European Organisation for the Safety of Air Navigation (EUROCONTROL). EUROCONTROL shall not be liable for any direct, indirect, incidental, or consequential damages arising out of or in connection with this document, including the use of BADA.
This document contains Copernicus Climate Change Service information 2023. Neither the European Commission nor ECMWF is responsible for any use of the Copernicus information.
Publisher's note: Copernicus Publications remains neutral with regard to jurisdictional claims made in the text, published maps, institutional affiliations, or any other geographical representation in this paper. While Copernicus Publications makes every effort to include appropriate place names, the final responsibility lies with the authors.
Edward Gryspeerdt was supported by a Royal Society University Research Fellowship (grant no. URF/R1/191602) and the Natural Environment Research Council (project no. RECFI-4D; grant no. NE/X012255/1). Joel Ponsonby was supported by the Engineering and Physical Sciences Research Council (grant no. EP/S023593/1).
This paper was edited by Cuiqi Zhang and reviewed by two anonymous referees.
Agarwal, A., Meijer, V. R., Eastham, S. D., Speth, R. L., and Barrett, S. R. H.: Reanalysis-driven simulations may overestimate persistent contrail formation by 100–250 %, Environ. Res. Lett., 17, 1–14, https://doi.org/10.1088/1748-9326/AC38D9, 2022.
Bedka, S. T., Minnis, P., Duda, D. P., Chee, T. L., and Palikonda, R.: Properties of linear contrails in the Northern Hemisphere derived from 2006 Aqua MODIS observations, Geophys. Res. Lett., 40, 772–777, https://doi.org/10.1029/2012GL054363, 2013.
Bier, A. and Burkhardt, U.: Impact of Parametrizing Microphysical Processes in the Jet and Vortex Phase on Contrail Cirrus Properties and Radiative Forcing, J. Geophys. Res.-Atmos., 127, e2022JD036677, https://doi.org/10.1029/2022JD036677, 2022.
Bier, A., Unterstrasser, S., and Vancassel, X.: Box model trajectory studies of contrail formation using a particle-based cloud microphysics scheme, Atmos. Chem. Phys., 22, 823–845, https://doi.org/10.5194/acp-22-823-2022, 2022.
Boulanger, D., Bundke, U., Gallagher, M., Gerbig, C., Hermann, M., Nédélec, P., Rohs, S., Sauvage, B., Ziereis, H., Thouret, V., and Petzold, A.: IAGOS Time series, AERIS, https://doi.org/10.25326/06, 2022.
Bradski, G.: The OpenCV Library: Dr. Dobb's Journal of Software Tools, UBM Technology Group, 25, 120–125, https://www.proquest.com/docview/202684726?sourcetype=Trade Journals (last access: 17 December 2023), 2000.
Bräuer, T., Voigt, C., Sauer, D., Kaufmann, S., Hahn, V., Scheibe, M., Schlager, H., Diskin, G. S., Nowak, J. B., DiGangi, J. P., Huber, F., Moore, R. H., and Anderson, B. E.: Airborne Measurements of Contrail Ice Properties—Dependence on Temperature and Humidity, Geophys. Res. Lett., 48, e2020GL092166, https://doi.org/10.1029/2020GL092166, 2021.
Bresenham, J. E.: Algorithm for computer control of a digital plotter, IBM Syst. J., 4, 25–30, https://doi.org/10.1147/SJ.41.0025, 2010.
Burkhardt, U., Bock, L., and Bier, A.: Mitigating the contrail cirrus climate impact by reducing aircraft soot number emissions, npj Clim. Atmos. Sci., 1, 1–7, https://doi.org/10.1038/s41612-018-0046-4, 2018.
Caiazzo, F., Agarwal, A., Speth, R. L., and Barrett, S. R. H.: Impact of biofuels on contrail warming, Environ. Res. Lett., 12, 114013, https://doi.org/10.1088/1748-9326/aa893b, 2017.
Chen, C.-C. and Gettelman, A.: Simulated radiative forcing from contrails and contrail cirrus, Atmos. Chem. Phys., 13, 12525–12536, https://doi.org/10.5194/acp-13-12525-2013, 2013.
Dietmüller, S., Matthes, S., Dahlmann, K., Yamashita, H., Simorgh, A., Soler, M., Linke, F., Lührs, B., Meuser, M. M., Weder, C., Grewe, V., Yin, F., and Castino, F.: A Python library for computing individual and merged non−CO2 algorithmic climate change functions: CLIMaCCF V1.0, Geosci. Model Dev., 16, 4405–4425, https://doi.org/10.5194/gmd-16-4405-2023, 2023.
Driver, O. G. A., Stettler, M. E. J., and Gryspeerdt, E.: Factors limiting contrail detection in satellite imagery, EGUsphere [preprint], https://doi.org/10.5194/egusphere-2024-2198, 2024.
Duda, D. P., Bedka, S. T., Minnis, P., Spangenberg, D., Khlopenkov, K., Chee, T., and Smith Jr., W. L.: Northern Hemisphere contrail properties derived from Terra and Aqua MODIS data for 2006 and 2012, Atmos. Chem. Phys., 19, 5313–5330, https://doi.org/10.5194/acp-19-5313-2019, 2019.
EASA: ICAO Aircraft Engine Emissions Databank (07/2021), EASA, https://www.easa.europa.eu/domains/environment/icao-aircraft-engine-emissions-databank (last access: 17 August 2021), 2021.
ECMWF: The Copernicus Programme: Climate Data Store, ECMWF, https://cds.climate.copernicus.eu/#!/home (last access: 15 February 2022), 2021.
EUROCONTROL: User Manual for the Base of Aircraft Data (BADA) Family 4, EEC Technical/Scientific Report No. 12/11/22-58, EUROCONTROL Experimental Centre (EEC), https://www.eurocontrol.int/model/bada (last access: 17 August 2021), 2016.
Feister, U., Möller, H., Sattler, T., Shields, J., Görsdorf, U., and Güldner, J.: Comparison of macroscopic cloud data from ground-based measurements using VIS/NIR and IR instruments at Lindenberg, Germany, Atmos. Res., 96, 395–407, https://doi.org/10.1016/J.ATMOSRES.2010.01.012, 2010.
Fuglestvedt, J. S., Shine, K. P., Berntsen, T., Cook, J., Lee, D. S., Stenke, A., Skeie, R. B., Velders, G. J. M., and Waitz, I. A.: Transport impacts on atmosphere and climate: Metrics, Atmos. Environ., 44, 4648–4677, https://doi.org/10.1016/j.atmosenv.2009.04.044, 2010.
Gierens, K., Braun-Unkhoff, M., Le Clercq, P., Plohr, M., Schlager, H., and Wolters, F.: Condensation trails from biofuels/kerosene blends scoping study, ENER/C2/2013-627, European Commission, 2016.
Gierens, K., Matthes, S., and Rohs, S.: How Well Can Persistent Contrails Be Predicted?, Aerospace, 7, 169, https://doi.org/10.3390/AEROSPACE7120169, 2020.
Grewe, V., Frömming, C., Matthes, S., Brinkop, S., Ponater, M., Dietmüller, S., Jöckel, P., Garny, H., Tsati, E., Dahlmann, K., Søvde, O. A., Fuglestvedt, J., Berntsen, T. K., Shine, K. P., Irvine, E. A., Champougny, T., and Hullah, P.: Aircraft routing with minimal climate impact: the REACT4C climate cost function modelling approach (V1.0), Geosci. Model Dev., 7, 175–201, https://doi.org/10.5194/gmd-7-175-2014, 2014.
Grewe, V., Matthes, S., Frömming, C., Brinkop, S., Jöckel, P., Gierens, K., Champougny, T., Fuglestvedt, J., Haslerud, A., and Irvine, E.: Feasibility of climate-optimized air traffic routing for trans-Atlantic flights, Environ. Res. Lett., 12, 34003, https://doi.org/10.1088/1748-9326/aa5ba0, 2017.
Gryspeerdt, E., Stettler, M. E. J., Teoh, R., Burkhardt, U., Delovski, T., Driver, O. G. A., and Painemal, D.: Operational differences lead to longer lifetimes of satellite detectable contrails from more fuel efficient aircraft, Environ. Res. Lett., 19, 084059, https://doi.org/10.1088/1748-9326/AD5B78, 2024.
Haywood, J. M., Allan, R. P., Bornemann, J., Forster, P. M., Francis, P. N., Milton, S., Rädel, G., Rap, A., Shine, K. P., and Thorpe, R.: A case study of the radiative forcing of persistent contrails evolving into contrail-induced cirrus, J. Geophys. Res.-Atmos., 114, D24201, https://doi.org/10.1029/2009JD012650, 2009.
Hersbach, H., Bell, B., Berrisford, P., Hirahara, S., Horányi, A., Muñoz-Sabater, J., Nicolas, J., Peubey, C., Radu, R., Schepers, D., Simmons, A., Soci, C., Abdalla, S., Abellan, X., Balsamo, G., Bechtold, P., Biavati, G., Bidlot, J., Bonavita, M., De Chiara, G., Dahlgren, P., Dee, D., Diamantakis, M., Dragani, R., Flemming, J., Forbes, R., Fuentes, M., Geer, A., Haimberger, L., Healy, S., Hogan, R. J., Hólm, E., Janisková, M., Keeley, S., Laloyaux, P., Lopez, P., Lupu, C., Radnoti, G., de Rosnay, P., Rozum, I., Vamborg, F., Villaume, S., and Thépaut, J. N.: The ERA5 global reanalysis, Q. J. Roy. Meteor. Soc., 146, 1999–2049, https://doi.org/10.1002/qj.3803, 2020.
Hoffmann, L., Günther, G., Li, D., Stein, O., Wu, X., Griessbach, S., Heng, Y., Konopka, P., Müller, R., Vogel, B., and Wright, J. S.: From ERA-Interim to ERA5: the considerable impact of ECMWF's next-generation reanalysis on Lagrangian transport simulations, Atmos. Chem. Phys., 19, 3097–3124, https://doi.org/10.5194/acp-19-3097-2019, 2019.
Holzapfel, F.: Probabilistic Two-Phase Wake Vortex Decay and Transport Model, J. Aircraft, 40, 323–331, https://doi.org/10.2514/2.3096, 2003.
Imperial College London: Breakthrough Energy, Low, J., Teoh, R., Gryspeerdt, E., Stettler, M., Ponsonby, J., and Shapiro, M.: Flight matched contrails in ground based camera imagery over London between November 2021 and April 2022, NERC EDS Centre for Environmental Data Analysis [data set], https://doi.org/10.5285/f45a1a95ddcc480784640da6f3001904, 2024.
Iwabuchi, H., Yang, P., Liou, K. N., and Minnis, P.: Physical and optical properties of persistent contrails: Climatology and interpretation, J. Geophys. Res.-Atmos., 117, D06215, https://doi.org/10.1029/2011JD017020, 2012.
Jensen, E. J., Toon, O. B., Kinne, S., Sachse, G. W., Anderson, B. E., Chan, K. R., Twohy, C. H., Gandrud, B., Heymsfield, A., and Miake-Lye, R. C.: Environmental conditions required for contrail formation and persistence, J. Geophys. Res.-Atmos., 103, 3929–3936, https://doi.org/10.1029/97JD02808, 1998a.
Jensen, E. J., Ackérman, A. S., Stevens, D. E., Toon, O. B., and Minnis, P.: Spreading and growth of contrails in a sheared environment, J. Geophys. Res.-Atmos., 103, 31557–31567, https://doi.org/10.1029/98JD02594, 1998b.
Jeßberger, P., Voigt, C., Schumann, U., Sölch, I., Schlager, H., Kaufmann, S., Petzold, A., Schäuble, D., and Gayet, J.-F.: Aircraft type influence on contrail properties, Atmos. Chem. Phys., 13, 11965–11984, https://doi.org/10.5194/acp-13-11965-2013, 2013.
Kärcher, B., Burkhardt, U., Unterstrasser, S., and Minnis, P.: Factors controlling contrail cirrus optical depth, Atmos. Chem. Phys., 9, 6229–6254, https://doi.org/10.5194/acp-9-6229-2009, 2009.
Kärcher, B., Burkhardt, U., Ponater, M., and Fromming, C.: Importance of representing optical depth variability for estimates of global line-shaped contrail radiative forcing, P. Natl. Acad. Sci. USA, 107, 19181–19184, https://doi.org/10.1073/pnas.1005555107, 2010.
Lee, D. S., Fahey, D. W., Skowron, A., Allen, M. R., Burkhardt, U., Chen, Q., Doherty, S. J., Freeman, S., Forster, P. M., Fuglestvedt, J., Gettelman, A., De León, R. R., Lim, L. L., Lund, M. T., Millar, R. J., Owen, B., Penner, J. E., Pitari, G., Prather, M. J., Sausen, R., and Wilcox, L. J.: The contribution of global aviation to anthropogenic climate forcing for 2000 to 2018, Atmos. Environ., 244, 117834, https://doi.org/10.1016/J.ATMOSENV.2020.117834, 2021.
Lewellen, D. C.: Persistent contrails and contrail cirrus. Part II: Full lifetime behavior, J. Atmos. Sci., 71, 4420–4438, https://doi.org/10.1175/JAS-D-13-0317.1, 2014.
Lewellen, D. C. and Lewellen, W. S.: The Effects of Aircraft Wake Dynamics on Contrail Development, J. Atmos. Sci., 58, 390–406, https://doi.org/10.1175/1520-0469(2001)058<0390:TEOAWD>2.0.CO;2, 2001.
Lewellen, D. C., Meza, O., Huebsch, W. W., Lewellen, D. C., Meza, O., and Huebsch, W. W.: Persistent Contrails and Contrail Cirrus. Part I: Large-Eddy Simulations from Inception to Demise, J. Atmos. Sci., 71, 4399–4419, https://doi.org/10.1175/JAS-D-13-0316.1, 2014.
Long, C. N., Sabburg, J. M., Calbó, J., and Pagès, D.: Retrieving Cloud Characteristics from Ground-Based Daytime Color All-Sky Images, J. Atmos. Ocean. Tech., 23, 633–652, https://doi.org/10.1175/JTECH1875.1, 2006.
Mannstein, H., Brömser, A., and Bugliaro, L.: Ground-based observations for the validation of contrails and cirrus detection in satellite imagery, Atmos. Meas. Tech., 3, 655–669, https://doi.org/10.5194/amt-3-655-2010, 2010.
Marjani, S., Tesche, M., Bräuer, P., Sourdeval, O., and Quaas, J.: Satellite Observations of the Impact of Individual Aircraft on Ice Crystal Number in Thin Cirrus Clouds, Geophys. Res. Lett., 49, e2021GL096173, https://doi.org/10.1029/2021GL096173, 2022.
Märkl, R. S., Voigt, C., Sauer, D., Dischl, R. K., Kaufmann, S., Harlaß, T., Hahn, V., Roiger, A., Weiß-Rehm, C., Burkhardt, U., Schumann, U., Marsing, A., Scheibe, M., Dörnbrack, A., Renard, C., Gauthier, M., Swann, P., Madden, P., Luff, D., Sallinen, R., Schripp, T., and Le Clercq, P.: Powering aircraft with 100 % sustainable aviation fuel reduces ice crystals in contrails, Atmos. Chem. Phys., 24, 3813–3837, https://doi.org/10.5194/acp-24-3813-2024, 2024.
Martin Frias, A., Shapiro, M., Engberg, Z., Zopp, R., Soler, M., and Stettler, M. E. J.: Feasibility of contrail avoidance in a commercial flight planning system: an operational analysis, Environmental Research: Infrastructure and Sustainability, 4, 015013, https://doi.org/10.1088/2634-4505/ad310c, 2024.
Meerkötter, R., Schumann, U., Doelling, D. R., Minnis, P., Nakajima, T., and Tsushima, Y.: Radiative forcing by contrails, Ann. Geophys., 17, 1080–1094, https://doi.org/10.1007/s00585-999-1080-7, 1999.
Meijer, V. R., Kulik, L., Eastham, S. D., Allroggen, F., Speth, R. L., Karaman, S., and Barrett, S. R. H.: Contrail coverage over the United States before and during the COVID-19 pandemic, Environ. Res. Lett., 17, 034039, https://doi.org/10.1088/1748-9326/AC26F0, 2022.
Paugam, R., Paoli, R., and Cariolle, D.: Influence of vortex dynamics and atmospheric turbulence on the early evolution of a contrail, Atmos. Chem. Phys., 10, 3933–3952, https://doi.org/10.5194/acp-10-3933-2010, 2010.
Pedregosa, F., Varoquaux, G., Gramfort, A., Michel, V., Thirion, B., Grisel, O., Blondel, M., Prettenhofer, P., Weiss, R., Dubourg, V., Vanderplas, J., Passos, A., Cournapeau, D., Brucher, M., Perrot, M., and Duchesnay, É.: Scikit-learn: Machine Learning in Python, J. Mach. Learn. Res., 12, 2825–2830, https://arxiv.org/abs/1201.0490v4 (last access: 7 September 2023), 2012.
Petzold, A., Thouret, V., Gerbig, C., Zahn, A., Brenninkmeijer, C. A. M., Gallagher, M., Hermann, M., Pontaud, M., Ziereis, H., Boulanger, D., Marshall, J., NéDélec, P., Smit, H. G. J., Friess, U., Flaud, J. M., Wahner, A., Cammas, J. P., Volz-Thomas, A., Thomas, K., Rohs, S., Bundke, U., Neis, P., Berkes, F., Houben, N., Berg, M., Tappertzhofen, M., Blomel, T., Pätz, W., Filges, A., Boschetti, F., Verma, S., Baum, S., Athier, G., Cousin, J. M., Sauvage, B., Blot, R., Clark, H., Gaudel, A., Gressent, A., Auby, A., Fontaine, A., Gautron, B., Bennouna, Y., Petetin, H., Karcher, F., Abonnel, C., Dandin, P., Beswick, K., Wang, K. Y., Rauthe-Schöch, A., Baker, A. K., Riede, H., Gromov, S., Zimmermann, P., Thorenz, U., Scharffe, D., Koeppel, C., Slemr, F., Schuck, T. J., Umezawa, T., Ditas, J., Cheng, Y., Schneider, J., Williams, J., Neumaier, M., Christner, E., Fischbeck, G., Safadi, L., Petrelli, A., Gehrlein, T., Heger, S., Dyroff, C., Weber, S., Assmann, D., Rubach, F., Weigelt, A., Stratmann, G., Stock, P., Penth, L., Walter, D., Heue, K. P., Allouche, Y., Marizy, C., Hermira, J., Bringtown, S., Saueressig, G., Seidel, N., Huf, M., Waibel, A., Franke, H., Klaus, C., Stosius, R., Baumgardner, D., Braathen, G., Paulin, M., and Garnett, N.: Global-scale atmosphere monitoring by in-service aircraft – current achievements and future prospects of the European Research Infrastructure IAGOS, Tellus B, 67, 1–24, https://doi.org/10.3402/TELLUSB.V67.28452, 2015.
Quaas, J., Gryspeerdt, E., Vautard, R., and Boucher, O.: Climate impact of aircraft-induced cirrus assessed from satellite observations before and during COVID-19, Environ. Res. Lett., 16, 064051, https://doi.org/10.1088/1748-9326/ABF686, 2021.
Raspberry Pi: Accessories: Camera, https://www.raspberrypi.com/documentation/accessories/camera.html (last access: 16 August 2023), 2023.
Reutter, P., Neis, P., Rohs, S., and Sauvage, B.: Ice supersaturated regions: properties and validation of ERA-Interim reanalysis with IAGOS in situ water vapour measurements, Atmos. Chem. Phys., 20, 787–804, https://doi.org/10.5194/acp-20-787-2020, 2020.
Rosenow, J., Hospodka, J., Lán, S., and Fricke, H.: Validation of a Contrail Life-Cycle Model in Central Europe, Sustainability, 15, 8669, https://doi.org/10.3390/SU15118669, 2023.
Schumann, U.: On conditions for contrail formation from aircraft exhausts, Meteorol. Z., 5, 4–23, https://doi.org/10.1127/metz/5/1996/4, 1996.
Schumann, U.: A contrail cirrus prediction model, Geosci. Model Dev., 5, 543–580, https://doi.org/10.5194/gmd-5-543-2012, 2012.
Schumann, U., Graf, K., and Mannstein, H.: Potential to reduce the climate impact of aviation by flight level changes, in: 3rd AIAA Atmospheric Space Environments Conference, 27 June 2011–30 June 2011, Honolulu, Hawaii, American Institute of Aeronautics and Astronautics, https://doi.org/10.2514/6.2011-3376, 2011.
Schumann, U., Hempel, R., Flentje, H., Garhammer, M., Graf, K., Kox, S., Lösslein, H., and Mayer, B.: Contrail study with ground-based cameras, Atmos. Meas. Tech., 6, 3597–3612, https://doi.org/10.5194/amt-6-3597-2013, 2013.
Schumann, U., Penner, J. E., Chen, Y., Zhou, C., and Graf, K.: Dehydration effects from contrails in a coupled contrail–climate model, Atmos. Chem. Phys., 15, 11179–11199, https://doi.org/10.5194/acp-15-11179-2015, 2015.
Schumann, U., Baumann, R., Baumgardner, D., Bedka, S. T., Duda, D. P., Freudenthaler, V., Gayet, J.-F., Heymsfield, A. J., Minnis, P., Quante, M., Raschke, E., Schlager, H., Vázquez-Navarro, M., Voigt, C., and Wang, Z.: Properties of individual contrails: a compilation of observations and some comparisons, Atmos. Chem. Phys., 17, 403–438, https://doi.org/10.5194/acp-17-403-2017, 2017.
Schumann, U., Poll, I., Teoh, R., Koelle, R., Spinielli, E., Molloy, J., Koudis, G. S., Baumann, R., Bugliaro, L., Stettler, M., and Voigt, C.: Air traffic and contrail changes over Europe during COVID-19: a model study, Atmos. Chem. Phys., 21, 7429–7450, https://doi.org/10.5194/acp-21-7429-2021, 2021.
Segrin, M. S., Coakley, J. A., and Tahnk, W. R.: MODIS Observations of Ship Tracks in Summertime Stratus off the West Coast of the United States, J. Atmos. Sci., 64, 4330–4345, https://doi.org/10.1175/2007JAS2308.1, 2007.
Seiz, G., Shields, J., Feister, U., Baltsavias, E. P., and Gruen, A.: Cloud mapping with ground-based photogrammetric cameras, Int. J. Remote Sens., 28, 2001–2032, https://doi.org/10.1080/01431160600641822, 2007.
Shapiro, M., Engberg, Z., Teoh, R., Stettler, M., Dean, T., and Abbott, T.: pycontrails: Python library for modeling aviation climate impacts (v0.52.2), Zenodo [code], https://doi.org/10.5281/zenodo.13151570, 2024.
Shields, J. E., Karr, M. E., Johnson, R. W., and Burden, A. R.: Day/night whole sky imagers for 24-h cloud and sky assessment: history and overview, Appl. Optics, 52, 1605–1616, https://doi.org/10.1364/AO.52.001605, 2013.
Sussmann, R. and Gierens, K. M.: Lidar and numerical studies on the different evolution of vortex pair and secondary wake in young contrails, J. Geophys. Res.-Atmos., 104, 2131–2142, https://doi.org/10.1029/1998JD200034, 1999.
Teoh, R., Schumann, U., Majumdar, A., and Stettler, M. E. J.: Mitigating the Climate Forcing of Aircraft Contrails by Small-Scale Diversions and Technology Adoption, Environ. Sci. Technol., 54, 2941–2950, https://doi.org/10.1021/acs.est.9b05608, 2020.
Teoh, R., Schumann, U., Gryspeerdt, E., Shapiro, M., Molloy, J., Koudis, G., Voigt, C., and Stettler, M. E. J.: Aviation contrail climate effects in the North Atlantic from 2016 to 2021, Atmos. Chem. Phys., 22, 10919–10935, https://doi.org/10.5194/acp-22-10919-2022, 2022a.
Teoh, R., Schumann, U., Voigt, C., Schripp, T., Shapiro, M., Engberg, Z., Molloy, J., Koudis, G., and Stettler, M. E. J.: Targeted Use of Sustainable Aviation Fuel to Maximise Climate Benefits, Environ. Sci. Technol,. 56, 17246–17255, https://doi.org/10.1021/acs.est.2c05781, 2022b.
Teoh, R., Engberg, Z., Schumann, U., Voigt, C., Shapiro, M., Rohs, S., and Stettler, M. E. J.: Global aviation contrail climate effects from 2019 to 2021, Atmos. Chem. Phys., 24, 6071–6093, https://doi.org/10.5194/acp-24-6071-2024, 2024a.
Teoh, R., Engberg, Z., Shapiro, M., Dray, L., and Stettler, M. E. J.: The high-resolution Global Aviation emissions Inventory based on ADS-B (GAIA) for 2019–2021, Atmos. Chem. Phys., 24, 725–744, https://doi.org/10.5194/acp-24-725-2024, 2024b.
Tesche, M., Achtert, P., Glantz, P., and Noone, K. J.: Aviation effects on already-existing cirrus clouds, Nat. Commun., 7, 1–6, https://doi.org/10.1038/ncomms12016, 2016.
Tsai, R. Y.: A Versatile Camera Calibration Technique for High-Accuracy 3D Machine Vision Metrology Using Off-the-Shelf TV Cameras and Lenses, IEEE Journal on Robotics and Automation, 3, 323–344, https://doi.org/10.1109/JRA.1987.1087109, 1987.
Unterstrasser, S.: Properties of young contrails – a parametrisation based on large-eddy simulations, Atmos. Chem. Phys., 16, 2059–2082, https://doi.org/10.5194/acp-16-2059-2016, 2016.
Unterstrasser, S. and Gierens, K.: Numerical simulations of contrail-to-cirrus transition – Part 1: An extensive parametric study, Atmos. Chem. Phys., 10, 2017–2036, https://doi.org/10.5194/acp-10-2017-2010, 2010.
Vázquez-Navarro, M., Mannstein, H., and Kox, S.: Contrail life cycle and properties from 1 year of MSG/SEVIRI rapid-scan images, Atmos Chem Phys, 15, 8739–8749, https://doi.org/10.5194/acp-15-8739-2015, 2015.
Wolf, K., Bellouin, N., and Boucher, O.: Distribution and morphology of non-persistent contrail and persistent contrail formation areas in ERA5, Atmos. Chem. Phys., 24, 5009–5024, https://doi.org/10.5194/acp-24-5009-2024, 2024.
World Meteorological Organization: International Cloud Atlas: Aircraft condensation trails, WMO, https://cloudatlas.wmo.int/en/aircraft-condensation-trails.html (last access: 13 May 2023), 2017.
Wu, Y., Jiang, S., Xu, Z., Zhu, S., and Cao, D.: Lens distortion correction based on one chessboard pattern image, Frontiers of Optoelectronics, 8, 319–328, https://doi.org/10.1007/S12200-015-0453-7, 2015.


