the Creative Commons Attribution 4.0 License.
the Creative Commons Attribution 4.0 License.
 | 08 Sep 2025
Seasonal variation of total column formaldehyde, nitrogen dioxide, and ozone over various Pandora spectrometer sites with a comparison of OMI and diurnally varying DSCOVR-EPIC satellite data
Jay Herman
Jianping Mao
Observations of trace gases, such as O3, HCHO, and NO2, and their seasonal dependence can be made using satellite and ground-based data from the Ozone Monitoring Instrument (OMI) satellite and Pandora ground-based instruments. Both operate with spectrometers that have similar characteristics in wavelength range and spectral resolution that enable them to retrieve total column amounts of formaldehyde (TCHCHO) and nitrogen dioxide (TCNO2) and total column ozone (TCO). The polar orbiting OMI observes at 13:30 ± 0:25 LST (local solar time) plus an occasional second side-scan point 90 min later at mid-latitudes. The ground-based Pandora spectrometer system observes the direct sun all day, with a temporal resolution of 2 min. At most sites, the Pandora data show a strong seasonal dependence for TCO and TCHCHO and less seasonal dependence for TCNO2. Use of a low-pass filter LOWESS(3-month) can reveal the seasonal dependence of TCNO2 for both OMI and Pandora at mid-latitude sites usually correlated with seasonal heating using natural gas or oil. Compared to Pandora, OMI underestimates the amount of NO2 air pollution that occurs during most days, as the OMI TCNO2 retrieval occurs around 13:30 ± 0:25 LST, which tends to be near the frequent minimum of the daily TCNO2 time series. Even when the Pandora data are restricted to between 13:00 and 14:00 LST, OMI retrieves less TCNO2 than Pandora over urban sites because of OMI's large field of view. The seasonal behavior of TCHCHO is mostly caused by the release of HCHO precursors from plant growth and emissions from lakes that peak in the summer, as observed by Pandora and OMI. Long-term averages show that OMI TCHCHO usually has the same seasonal dependence but differs in magnitude from the amount measured by Pandora and is frequently larger. Comparisons of OMI total column NO2 and HCHO with Pandora daily time series show both agreement and disagreement at various sites and for different days, with the Pandora results frequently being larger. For ozone, daily time-dependent comparisons of OMI TCO with those retrieved by Pandora show good agreement in most cases. Additional diurnal comparisons are shown of Pandora TCO with hourly retrievals during a day from the EPIC (Earth Polychromatic Imaging Camera) spacecraft instrument orbiting the Earth–Sun Lagrange point L1.
- Article
(7608 KB) - Full-text XML
- BibTeX
- EndNote


Formaldehyde, or HCHO, is ubiquitous in the atmosphere and, as with other VOCs (volatile organic compounds), are derived from natural and anthropogenic sources, such as plants, animals, biomass burning, fossil fuel combustion, and industrial processes (Zhang et al., 2019; Morfopoulos et al., 2021). Formaldehyde is mainly produced from the oxidation of VOCs such as isoprene, methane, and anthropogenic emissions (Wittrock et al., 2006). Formaldehyde can also be directly emitted from some sources, such as vehicle exhaust, tobacco smoke, building materials, and wood burning, affecting pollution levels both indoors and outdoors. The majority of gaseous and atmospheric formaldehyde derives from microbial and plant decomposition (Peng et al., 2022). HCHO concentrations in the first few kilometers of the atmosphere vary depending on the location, time of day, season, and meteorological conditions. Some of the factors that influence total atmospheric column amounts of HCHO are:
-
Solar radiation. Formaldehyde is photolyzed by solar ultraviolet radiation (Nussbaumer et al., 2021) and broken down into smaller molecules and radicals. The photolysis rate of formaldehyde depends on the solar zenith angle, the cloud cover, and the atmospheric composition. Generally, formaldehyde photolysis is faster in the summer and during midday.
-
Temperature. The thermal decomposition rate of formaldehyde increases with temperature, which means it is faster in warmer regions and seasons.
-
Humidity. Formaldehyde reacts with water vapor in the atmosphere, forming formic acid and hydroxyl radicals. The reaction rate of formaldehyde with water vapor depends on the relative humidity, which varies with the temperature and the precipitation. Generally, formaldehyde reaction with water vapor is faster in humid regions and seasons.
The largest sources of NO2 are fossil fuel burning from various types of automobiles, truck emissions, and power generation, followed by industrial processes and oil and gas production (Van der A et al., 2008; Stavrakou et al., 2020). Additional sources are soils with natural vegetation, oceans, agriculture with the use of nitrogen-rich fertilizers, forest fires, and lightning. In populated areas requiring winter heating, anthropogenic sources of lower tropospheric NO2 are larger than natural sources. Nitrogen oxides play a major role in atmospheric chemistry and the production and destruction of ozone in both the troposphere and stratosphere. In the boundary layer, high concentrations of both HCHO (Kim et al., 2011) and NO2 (Faustini et al., 2014) are health hazards for humans.
Total column amounts of formaldehyde (TCHCHO) and nitrogen dioxide (TCNO2) and total column ozone (TCO) in the atmosphere are typically measured by satellite and ground-based instruments.
-
Satellite. The Ozone Monitoring Instrument (OMI) is a satellite sensor launched in July 2004 that measures HCHO, NO2, O3, and other atmospheric constituents from space (Levelt et al., 2018). Detailed descriptions of the OMI instrument are given in Levelt et al. (2006) and Dobber et al. (2006). Briefly, OMI is a side-scanning spectrometer instrument (270 to 500 nm in steps of 0.5 nm) with a nadir spatial resolution of 13 × 24 km2. OMI data can be used to monitor the global distribution and long-term trends of these trace gases and to investigate the role of NO2 and HCHO in atmospheric chemistry and air quality (Lamsal et al., 2014, 2015; Boeke et al., 2011). For ozone, DSCOVR (Deep Space Climate Observatory), located at the Earth–Sun gravitational balance Lagrange point L1, contains a filter-based instrument called EPIC (Earth Polychromatic Imaging Camera) capable of obtaining TCO once per hour (90 min in Northern Hemisphere winter) simultaneously for the entire sunlit globe as the Earth rotates (Herman et al., 2018), with a nadir resolution of 18 × 18 km2.
-
Ground-based spectrometer. The Pandora spectrometer system forms a worldwide network of over 150 currently working direct-sun-observing instruments that match atmospheric observations with known laboratory spectra of HCHO, NO2, and O3 to obtain the total vertical column above the Pandora instrument every 2 min from multiple co-added spectra. Pandora uses a single-grating spectrometer and a charge-coupled device (CCD) 2048 × 64 px detector to record the direct-sun spectra in the ultraviolet and visible wavelength range, i.e., 280–525 nm, with an oversampled 0.6 nm spectral resolution. The retrieval algorithm is based on a spectral fitting technique to retrieve the slant column densities of O3, HCHO, NO2, and other gases and then convert them to vertical column densities using geometric air mass factors appropriate for direct-sun observations. Pandora spectrometers have been deployed in various field campaigns and locations to monitor the spatial and temporal variability of TCHCHO and TCNO2 to validate and improve the satellite observations of TCHCHO (Herman et al., 2009; Tzortziou et al., 2015; Spinei et al., 2018).
Previous validation studies of TCNO2 and TCHCHO have been made with emphasis on the amount of bias between ground-based and satellite retrievals of total column NO2 and HCHO (Pinardi et al., 2020; De Smedt et al., 2021; and references therein). Validation studies using Pandora measurements have shown that OMI TCNO2 retrievals tend to underestimate the degree of NO2 pollution, especially in urban areas where the coarse OMI spatial resolution tends to reduce the spatially averaged amount (Celarier et al., 2008; Lamsal et al., 2014; Judd et al., 2019; Zhao et al., 2019). In addition to the different fields of view, the agreement between OMI and Pandora depends strongly on determining the OMI effective air mass factor for a wide variety of observing and solar zenith angles (Lorente et al., 2017), whereas Pandora uses a simple geometric direct-sun air mass factor (Herman et al., 2009, Eq. 3). Studies of TCHCHO involving Pandora prior to 2020 are probably not valid because of a problem with internal generation of HCHO in the Pandora instrument (Spinei et al., 2021). More recent studies (Wang et al., 2022) obtain a seasonal dependence of surface concentrations similar to the TCHCHO in this study. The largest sources of error in TCHCHO retrievals are the determinations of the air mass factor for satellite observations and the fact that ozone and formaldehyde have overlapping absorption spectra such that a small error in ozone retrieval can affect the formaldehyde results. A comparison of direct-sun Pandora TCHCHO retrievals with the Geostationary Environment Monitoring Spectrometer (GEMS) shows a similar seasonal dependence (Fu et al., 2025).
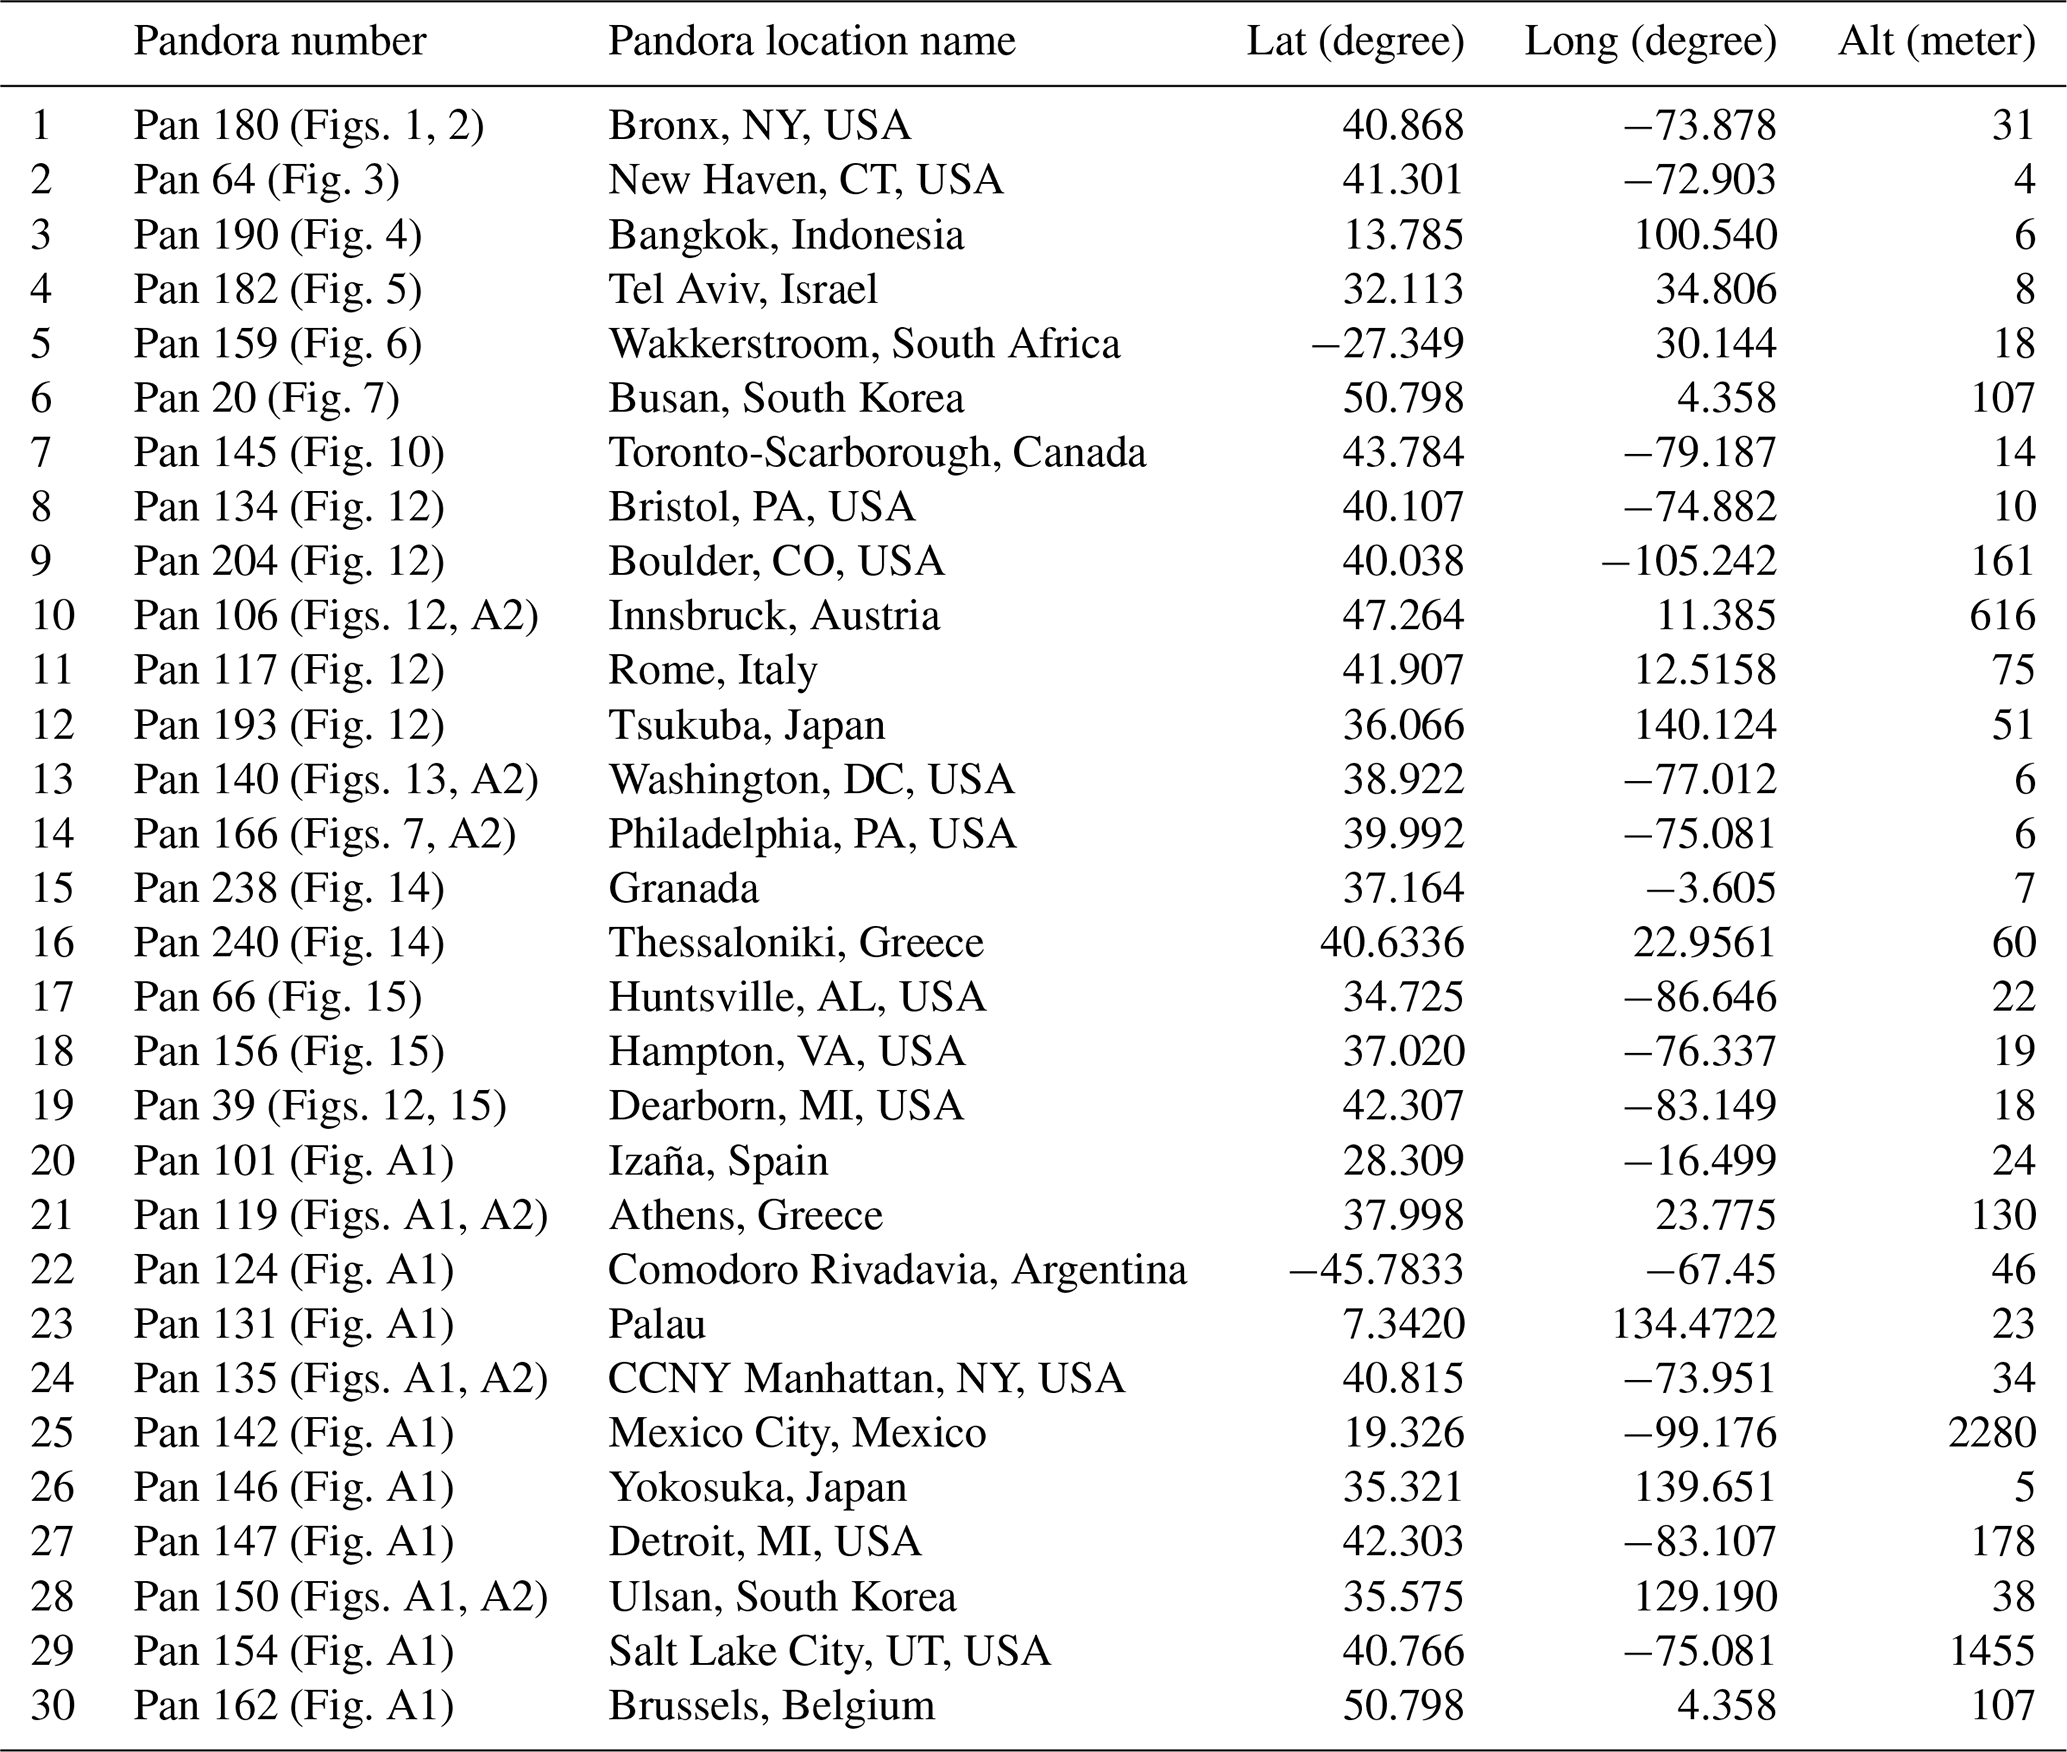
This study will examine the offsets and seasonal cycles of total column NO2, HCHO, and O3 seen by the Pandora instruments by examining multi-year (2021–2024) time series for seasonal and daily behavior at various sites and will compare with observations made from the OMI satellite overpass measurements (based on OMI gridded 0.25° × 0.25° data) for the Pandora sites. Pandora ozone measurements will be additionally compared to hourly data obtained from EPIC. All of the Pandora data used in this study are from after the upgrade of the instruments to eliminate internal sources of HCHO (Spinei et al., 2021). Part of this study (TCNO2 and TCO) is an extension of Herman et al. (2019), who used Pandora data (2012–2017) from before the internal upgrade. A difference is that Pandora TCO is now compared with hourly TCO retrieved by DSCOVR-EPIC. Table 1 shows a list of 30 Pandora sites used in this study.
Table 1List of 30 Pandora locations used in this study, in order of appearance.
Worldwide Pandora total column data can be downloaded from the Austrian Pandonia project website https://data.pandonia-global-network.org/ (last access: 22 August 2025). Of interest for this study are the Level-2 (L2) time series ASCII files for direct-sun observations. For example, the Bronx New York City files for Pandora instrument 180 for TCNO2 data are in Pandora180s1_BronxNY_L2_rnvs3p1-8.txt, TCHCHO in Pandora180s1_BronxNY_L2_rfus5p1-8.txt, and TCO data in Pandora180s1_BronxNY_L2_rout2p1-8.txt, with the nine bold characters identifying the file contents. This naming convention applies to all Pandora sites.
The Pandora data are arranged in irregular columns that are identified in the metadata header for each file. In the current version, column 1 contains the GMT date and time for each measurement, and column 39 contains the measured column density in moles m−2 (multiply by = 2241.4638 to convert to DU, where 1 DU = 2.6867 ×10²⁰ molec. m−2). The Pandora data also contain measurements of water vapor and SO2 total column amounts in different files.
The original OMI data have a resolution of 13 × 24 km2 at the center of the OMI side-to-side scan. The overpass OMI data are based on the latest gridded version with 0.25° × 0.25° px resolution (mid-latitudes approximately 30 × 30 km2). The closest OMI pixel to each Pandora site within 50 km is used for time-matched comparisons. Long time series use all available Pandora data between 07:00 and 17:00, filtered for data quality (values with large RMS errors and with negative values are removed). Diurnal comparisons with OMI on specified days use Pandora minute-by-minute data that are nearly continuous, suggesting that Pandora is observing the direct sun under clear-sky conditions. Clouds cause some scatter in consecutive data points.
Figure 1 shows the seasonal and daily variation of total column HCHO (TCHCHO) and NO2 (TCNO2) in the Bronx, New York. The daily data for 1 week in July and September show the range of values for both weekdays and weekends. When all the Bronx TCHCHO data are plotted as an aggregate for 3 years, there is a strong seasonal pattern with a maximum in July and a minimum near the end of December. The summer seasonal dependence of TCHCHO is consistent with the surface HCHO values observed by the ground-based Air-Quality System (AQS; Wang et al., 2022). For TCNO2, there is a weaker seasonal pattern, as shown in the LOWESS(0.033) fit to the data (Cleveland, 1979; Cleveland and Devlin, 1988), with moderate maxima in January–February, because the sources of NO2 are largely from the nearly constant flow of cars and trucks. The parameter 0.033 is the fraction of the time-series data included in the local least-squares estimate, or about 1 month for Pan 180.
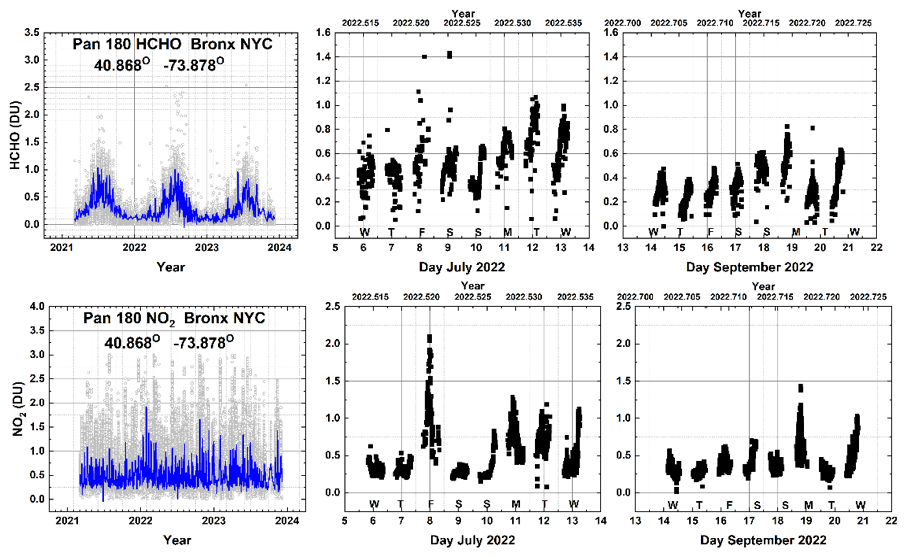
Figure 1Seasonal and daily behavior of HCHO and NO2 from Pan 180 located in the Bronx, NYC, at 40.868° N, −73.878° W. The blue lines are a LOWESS(0.033) fit to the data (light gray), which is approximately a 1-month local least-squares average. Local principal investigator for Pan 180: Luke Valin.
Figure 2 shows the daily average of Pandora data obtained from diurnal variation of TCHCHO and TCNO2 from 09:00 to 15:00 local standard time (GMT−5). The primary emission sources of atmospheric HCHO include direct emissions of HCHO precursors from vegetation and lakes, primarily through the release of biogenic volatile organic compounds such as isoprene and terpenes from vegetation, the soil, biomass burning, and decaying plant and animal matter. This is consistent with the Bronx location, which is adjacent to a large, vegetated park with a small lake near Fordham University. The same TCHCHO seasonal dependence and magnitude occur when the Pandora sampling is restricted to 13:00 to 14:00 local standard time, similar to the OMI overpass time.
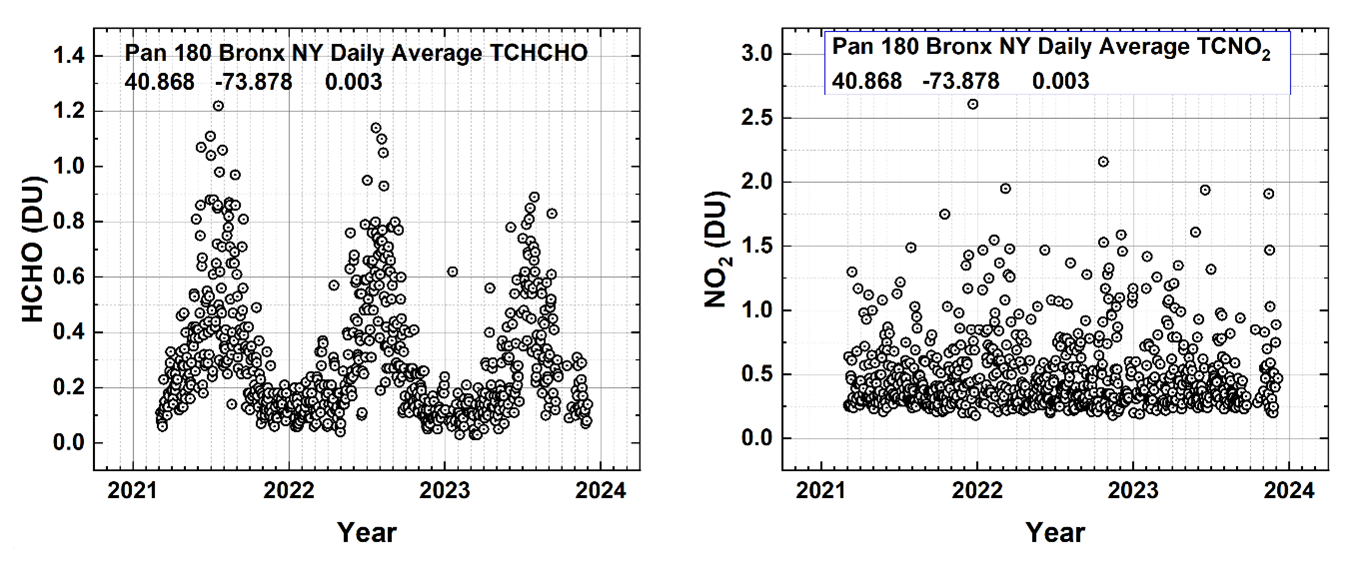
Figure 2The daily average seasonal variation of TCHCHO and TCNO2 in DU over Fordham University in the Bronx, New York City, from Pandora 180 at 40.868° latitude, −73.878° longitude, and 0.003 km altitude. Each point is a daily average of the data in Fig. 1. Local principal investigator: Luke Valin.
There are three Pandora sites in New York City and one in nearby Bayonne, New Jersey. The NYC sites are in the Bronx (Fordham University), Manhattan (City College NY (CCNY)), and Queens (Queens College). All four successfully measured NO2 in the period 2021–2023. A strong seasonal cycle in TCNO2 is not seen (Figs. 1 and 2) in the traffic-driven production of NO2 in the Bronx, New York. The mean value of the total column NO2 (TCNO2) for each of the three New York sites is 0.5 DU, whereas the TCNO2 for the port city of Bayonne, NJ, is substantially higher at 0.7 DU. None of the four sites show a large seasonal daily average TCNO2 pattern. For TCHCHO, all four sites show an annual seasonal cycle, with three of the sites having a 3-year average of 0.3 DU, except for the Queens site at 0.45 DU. The Queens site may be anomalous because of many missing points affecting the average.
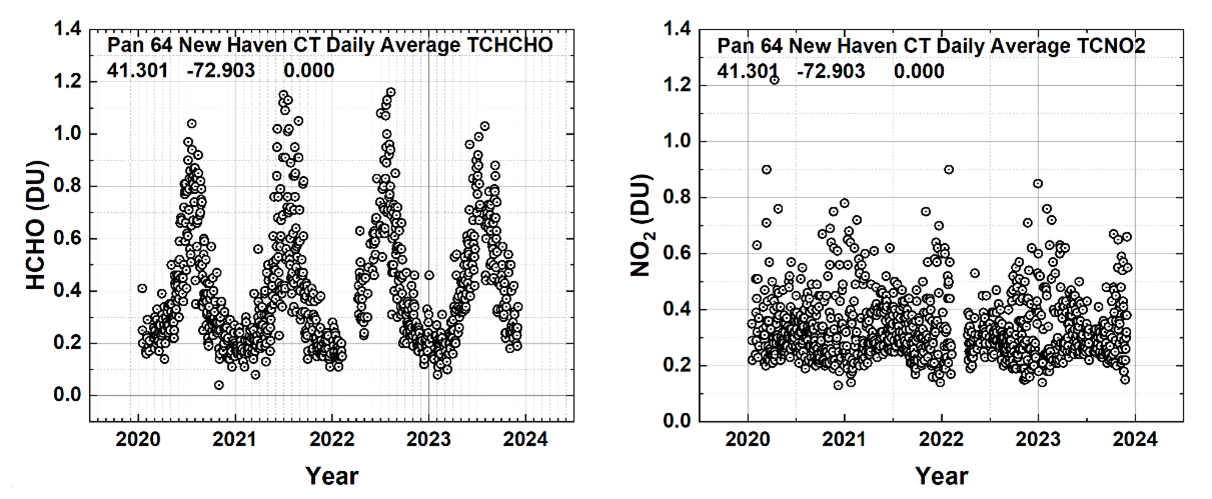
Figure 3The seasonal variation of TCHCHO and TCNO2 over New Haven, Connecticut, from Pandora 64 at 41.301° N latitude and −72.903° W longitude. Each point is a daily average. Local principal investigator: Nader Abuhassan.
Similar behavior is seen at other sites, such as the one from New Haven, Connecticut, located in a vegetated area adjacent to two rivers (Fig. 3). TCHCHO has a clear summer peak in June–July and a weak winter TCNO2 peak in December–January coinciding with the maximum heating season.
The seasonal variation of TCHCHO could not be studied prior to the internal upgrade of Pandora after 2019, which was needed because of the release of HCHO from polyoxymethylene (POM-H Delrin) out-gassing as a function of daytime temperature within the Pandora sun-pointing optical head (Spinei et al., 2021).
An equatorial Pandora site (Fig. 4) with a sufficiently long data record is located in Bangkok, Indonesia, near a small park and lake. Bangkok has a tropical monsoon climate with three main seasons: hot season from March to June, rainy season from July to October, and cool season between November and February. TCHCHO has a seasonal cycle peaking in March–April, when the sun is nearly overhead, and a minimum during the rainy season. TCNO2 has a clear seasonal cycle peaking in December–January and a minimum during the rainy season. Bangkok has a tropical climate, with April as the hottest month with temperatures averaging 30.5 °C (87 °F) and December as the coldest month with an average temperature of 26 °C (79 °F).
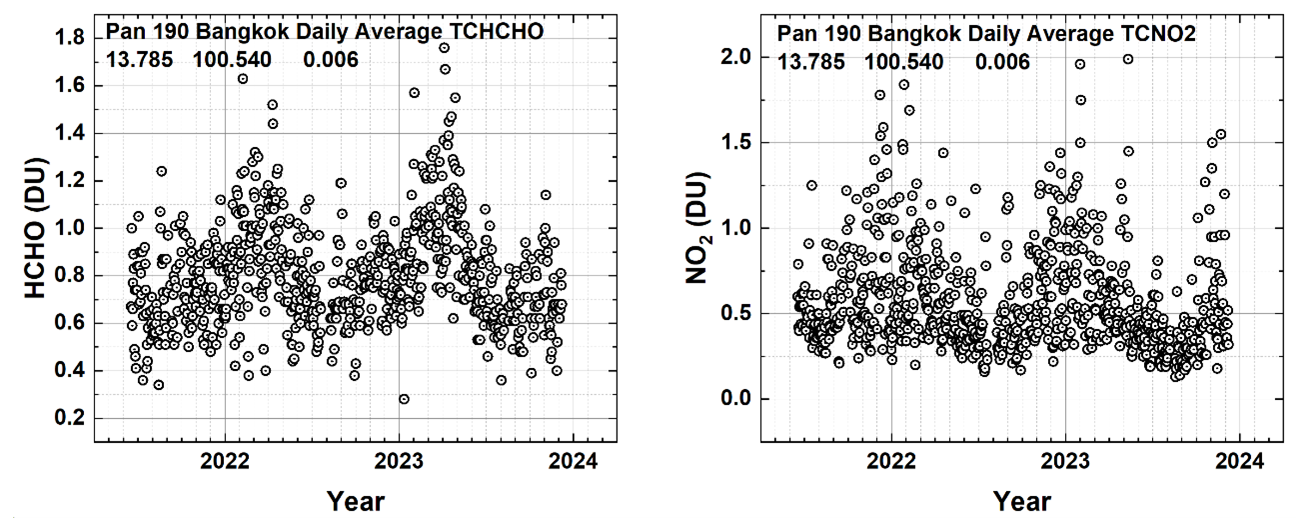
Figure 4The seasonal variation of TCHCHO and TCNO2 over equatorial Bangkok, Indonesia, at 13.785° N and 100.540° E. Local principal investigator: Surassawadee Phoompanit.
An unusual counterexample to the typical TCHCHO seasonal cycle is for the Pandora site located in Tel Aviv, Israel. Tel Aviv has significant amounts of HCHO but does not show seasonal variation in TCHCHO because of its coastal location in a warm climate even at mid-latitudes, located at 32.113° N, 34.085° E, that has essentially two seasons: a cool, rainy winter (October–April) and a dry, hot summer (May–September). The result is that there is a limited seasonal increase in vegetational activity and almost no seasonal variation in HCHO (Fig. 5). However, TCNO2 shows a clear seasonal increase in the December–January months, frequently reaching over 0.5 DU. The TCNO2 seasonality is similar to that of the near-surface concentrations reported by Boersma et al. (2009). The Pandora instrument 182 is located at Tel Aviv University, about 1 km from a major highway. Tel Aviv has frequent episodes of smog associated with heavy automobile and truck traffic (Newmark, 2001). Heating and cooling in Tel Aviv are mainly electrical, with the maximum power generation occurring in the summer, suggesting that the winter TCNO2 peak is not caused just by electrical power generation from natural gas that emits NO2.
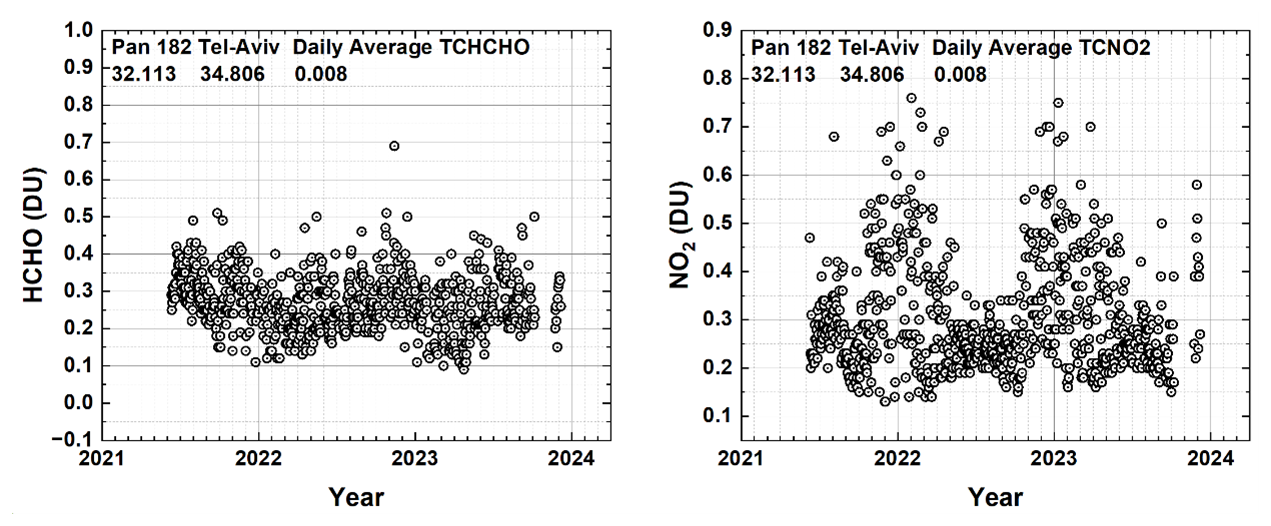
Figure 5Seasonal variation in daily average TCHCHO and TCNO2 in Tel Aviv, Israel, from Pandora 182 located at 32.113° N, 34.085° E at a height of 8 m. Local principal investigator for Pan 182: Michal Rozenhaimer.
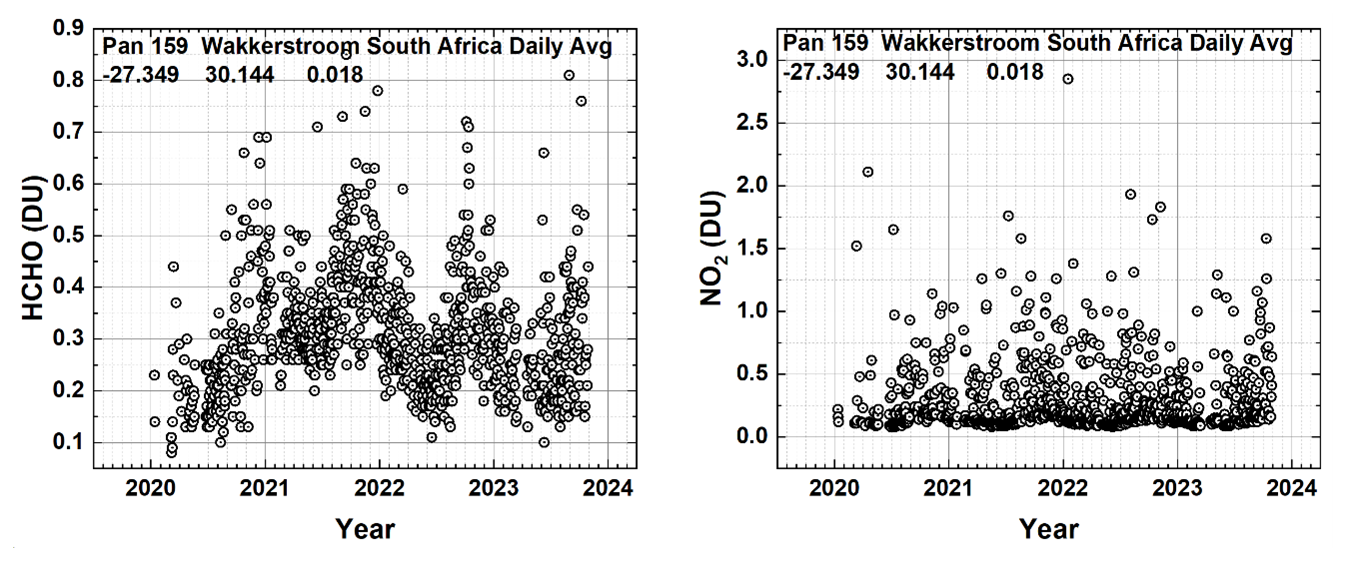
Figure 6Seasonal variation in daily average HCHO and NO2 in Wakkerstroom, South Africa, from Pandora 159 located at −27.359° S and 30.144° E at a height of 18 m. Local principal investigator: Robert Scholes.
Finally, a Pandora example from the Southern Hemisphere (SH) is given, i.e., Wakkerstroom, South Africa, which is located in a rural area near the ocean a few degrees outside of the equatorial zone at −27.359° S and 30.144° E.
As expected, the peak value of TCHCHO occurs near the SH summer in November–December, while TCNO2 has no significant seasonal dependence.
2.1 Comparisons between Pandora and OMI retrievals of NO2 and HCHO
In this section, three types of comparisons of Pandora with OMI satellite data are considered. First (Fig. 7a, b) is the TCNO2 time series consisting of the data record of Pandora and OMI from 2020–2023. The second (Fig. 7c–f) is a low-pass LOWESS(3-month) filter of midday TCNO2 showing the seasonal variation. The third (Fig. 8) looks at a few selected days in May, July, and December and compares typical Pandora clear-sky values with the mid-afternoon OMI overpass at times near 13:30 Equator crossing time. The Pandora and OMI data are matched at the same GMT and then converted to local solar time, GMT + Longitude/15. The OMI overpass HCHO, NO2, and O3 data for 2004–2025 can be found at https://zenodo.org/uploads/15468213 (last access: 22 August 2025) in 7Zip ASCII format.
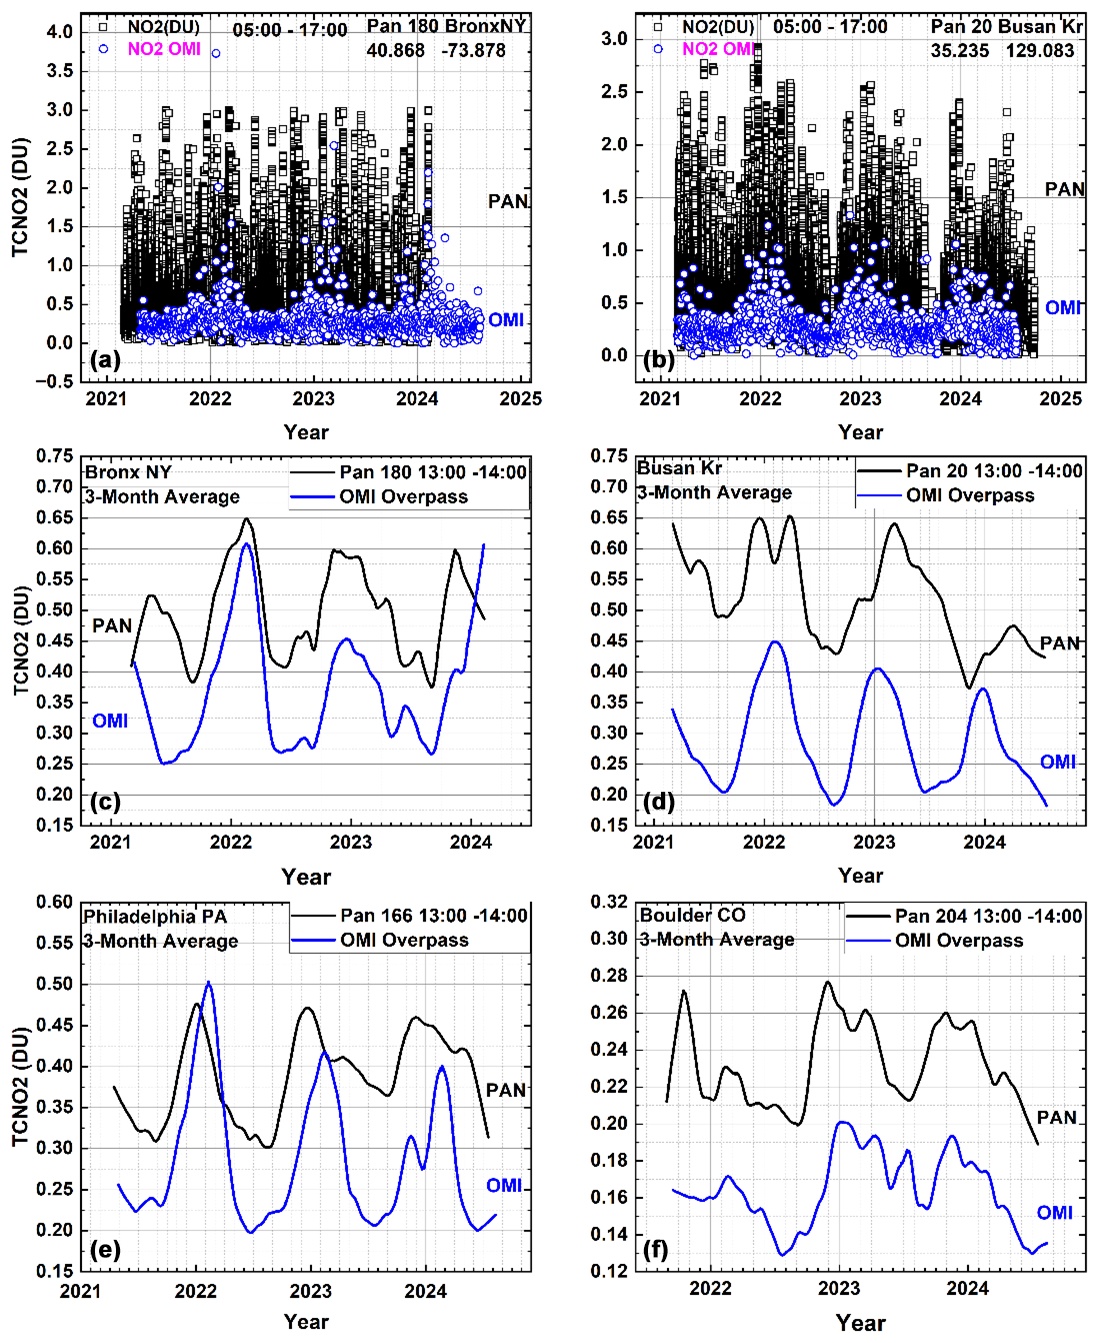
Figure 7(a, b) Comparison of OMI (approximately 13:30) and Pandora (07:00–17:00) total column NO2 time series in the Bronx, NY, (40.868° N, −73.878° W) and Busan, South Korea, (35.235° N, 129.083° E). (c–f) Pandora data for the Bronx, Busan, Philadelphia (39.992° N, −75.081° W), and Boulder (40.0375° N, −105.242° W) are averaged between 13:00 and 14:00. Both OMI (blue) and Pandora (black) then have a LOWESS(3-month) low-pass filter applied. Local principal investigator for Pan 20 is Jae Hwan Kim, for Pan 180 and Pan 166 is Luke Valin, and for Pan 204 is Nader Abuhassan.
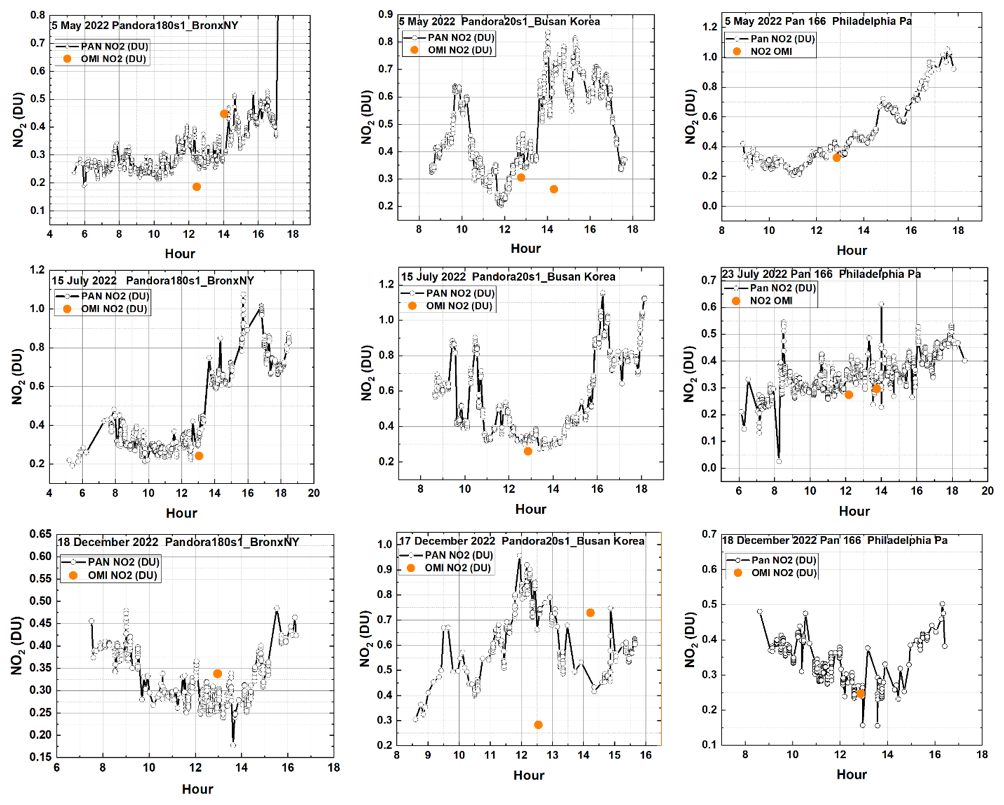
Figure 8A comparison between Pandora and OMI (Orange circle) total column NO2 for three locations (Bronx, New York; Busan, South Korea; Philadelphia, Pennsylvania). Local principal investigator for Pan 180 and Pan 166 is Lukas Valin and for Pan 20 is Jae Hwan Kim.
Figure 7a and b illustrate that OMI captures only the midday fraction of the daily values of total column NO2 and fails to detect the extent of the daily pollution at both the Bronx, New York City, and Busan, South Korea, sites. This is because OMI and other polar orbiting satellites collect data only once per day (occasionally twice per day) at any given location at mid-afternoon, frequently when TCNO2 is below its daily maximum (Lamsal et al., 2015; Herman et al., 2019). Figure 7c–f reveal the seasonal dependence of TCNO2 at two mid-latitude Northern Hemisphere sites found by using a 3-month low-pass filter LOWESS(3-month), showing that there is an annual TCNO2 cycle peaking in the winter that corresponds to the natural gas and oil heating use. The Pandora (13:00 to 14:00) values are larger than those from OMI, especially at Busan, suggesting that the OMI gridded overpass field of view (0.25° × 0.25°) includes areas of lower NO2 values over the nearby ocean. In the case of the Bronx, the differences are smaller but also include areas over rivers. Philadelphia, Pennsylvania, is landlocked but smaller than an OMI gridded footprint; thus, the OMI field of view contains somewhat less polluted suburbs, making the OMI TCNO2 closer to the Pandora values. The Boulder, Colorado, Pandora is in a small landlocked city where the OMI field of view extends over sparsely populated regions, leading to OMI TCNO2 lower than the Pandora values.
Figures 8 and 9 show the diurnal daytime variation for 3 selected days for Pandora-retrieved total column NO2 and HCHO compared with OMI at the overpass time for both the Bronx in New York City, Busan, South Korea, and Philadelphia, Pennsylvania. These are typical examples of the highly variable hourly variation of TCHCHO and TCNO2 as observed by Pandora on clear-sky days at most sites.
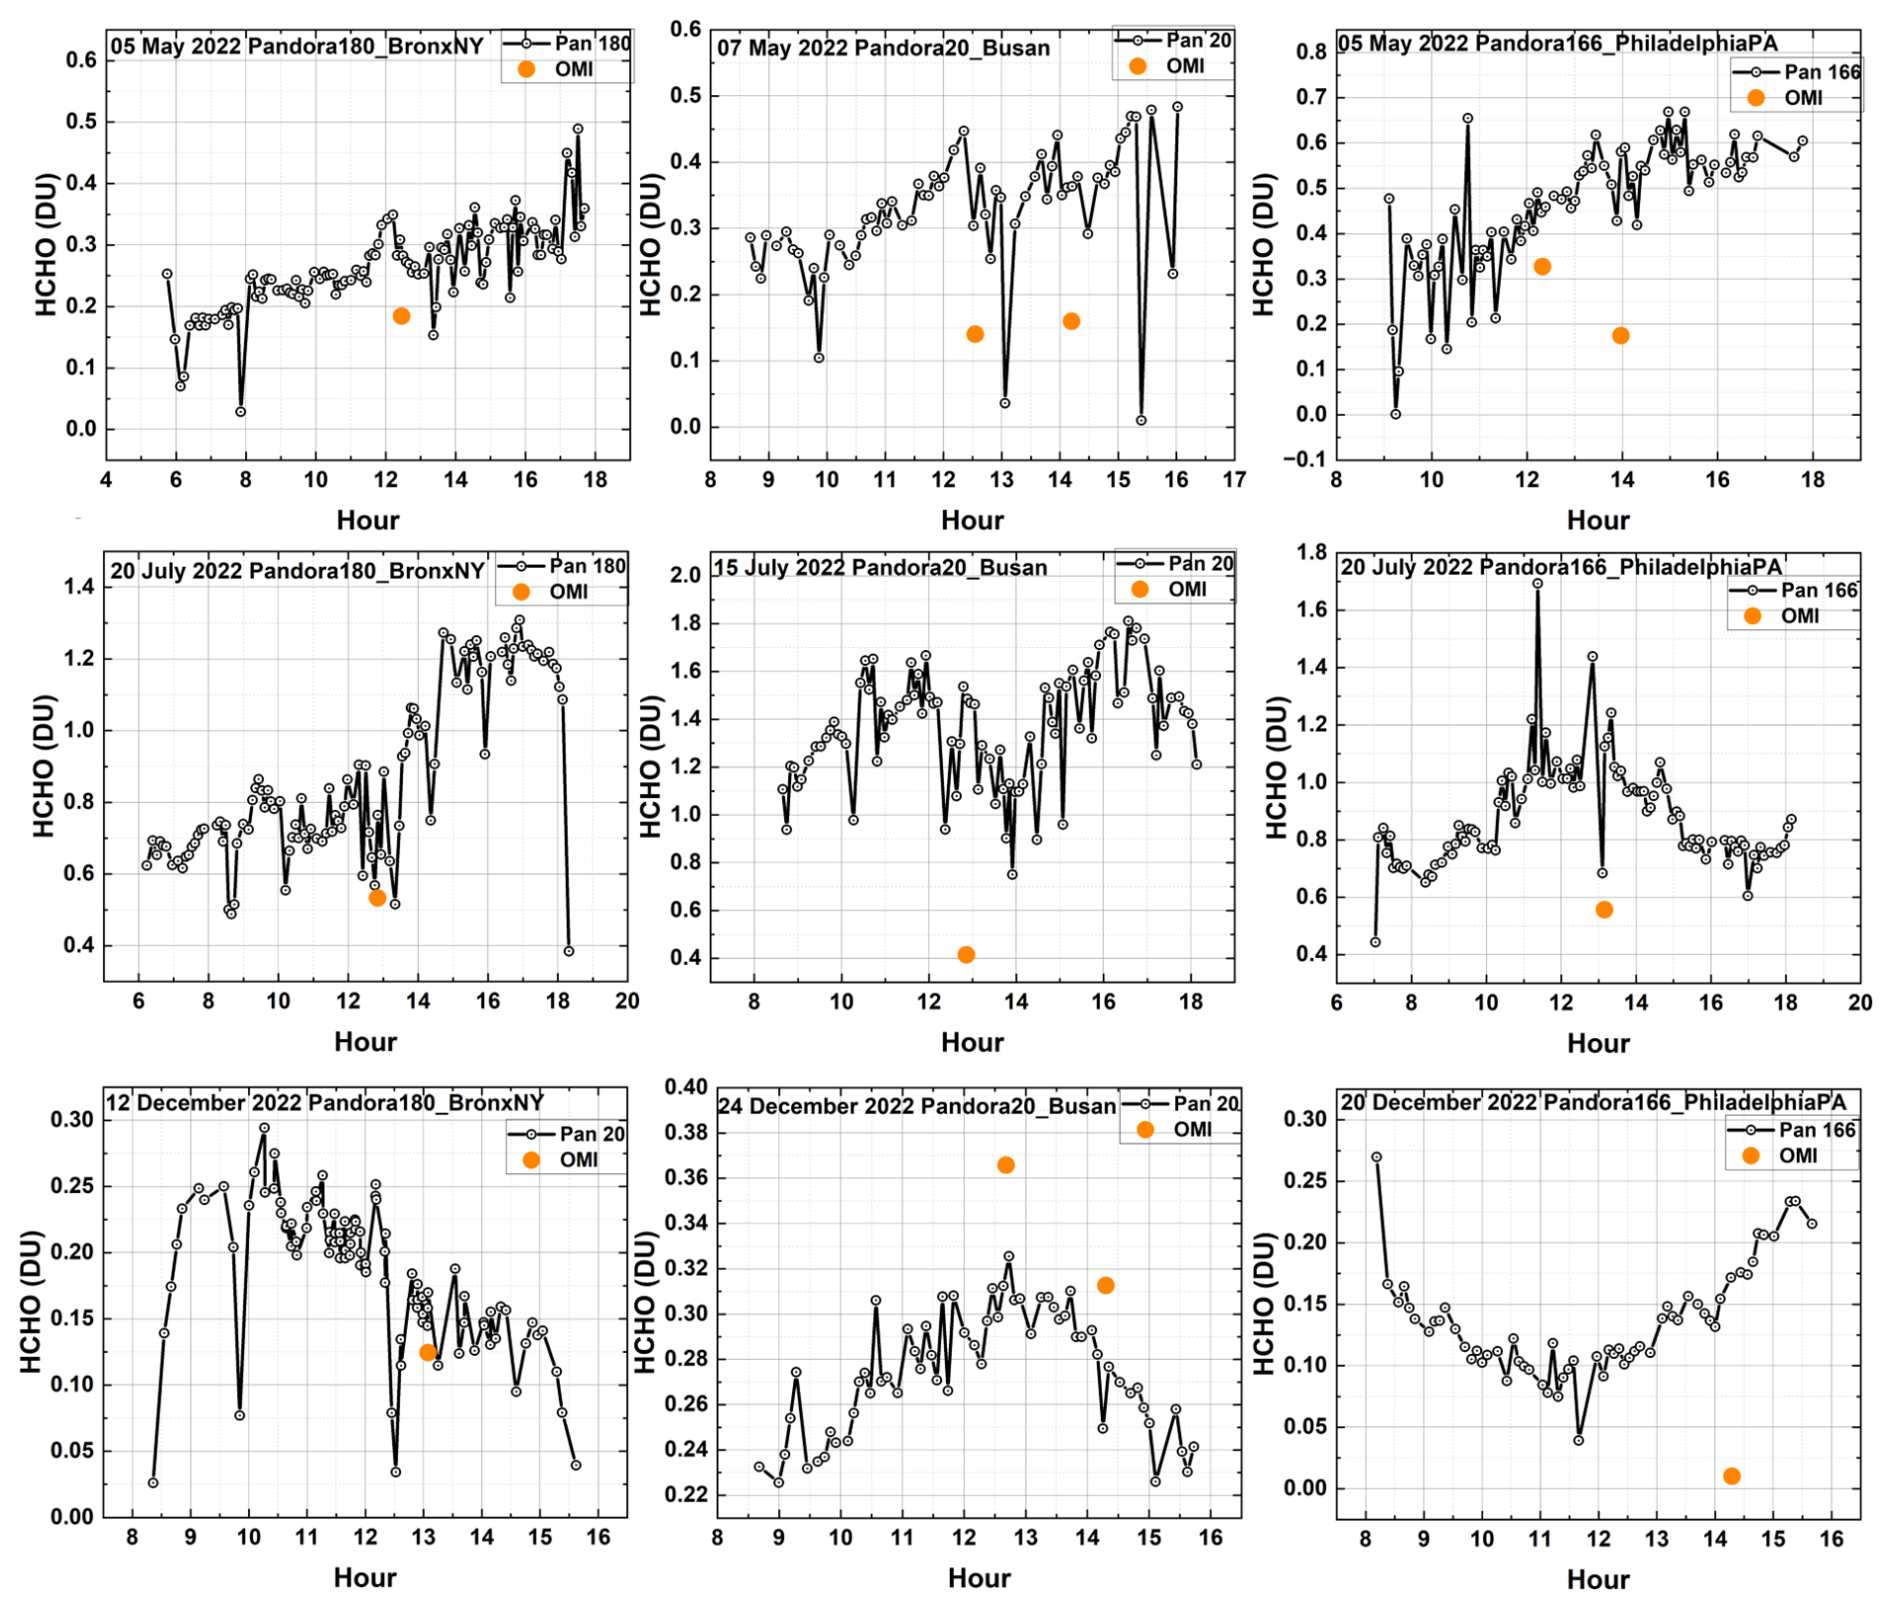
Figure 9A comparison between Pandora and OMI (orange circle) total column HCHO. Local principal investigator for Pan 180 and Pan 166 is Luke Valin and for Pan 20 is Jae Hwan Kim.
The hourly variation of TCHCHO and TCNO2 on any given day can take on unique shapes depending on the presence of surface winds, changes in temperature, and the amount of sunlight. The variability of TCNO2 is also driven by the strength of the sources (automobile exhaust, power generation, industry, etc.) as well as the meteorological conditions. On some days, there is good agreement (within 10 %), but in general the OMI overpass values do not agree with the Pandora-retrieved values for both TCHCHO and TCNO2. In the sample shown in Figs. 8 and 9, the cases of agreement are about 70 % of the time for TCNO2 and 30 % for TCHCHO. Also, the OMI TCNO2 frequently is less than the daily maximum of TCNO2.
Figure 9 illustrates the comparison of TCHCHO retrievals from Pandora and OMI. The spectral fitting algorithm for detecting HCHO absorption is in the same short-wavelength UV spectral region as used for ozone retrieval, i.e., 300–360 nm (Gratien et al., 2007). This means that the retrieval sensitivity for “seeing” all the way to the surface is reduced because of ozone absorption and Rayleigh scattering. Also, small errors in ozone retrieval can affect the detection of HCHO. This problem is not present for the spectral fitting of NO2, as that usually occurs in the visible range of 410–450 nm, where there is only interference from a weak and narrow water vapor line.
Pandora TCHCHO daily average data (Fig. 10) for the University of Toronto in Toronto-Scarborough (Lat = 43.784° N, Long = −79.187° W) show clear peaks in the summer from the vegetation in a surrounding park area, whereas TCNO2 shows only small seasonal variation, with small peaks also occurring in the summer for values less than 0.4 DU. Higher values do not show any seasonal variation. The University of Toronto is located near a major highway, which is a strong source of NO2 from automobiles and trucks. Unlike many sites, OMI TCHCHO data over Toronto East (centered on 43.74° N, −79.27° E, about 8 km from the Pandora site) also show sporadic summer peak values that are higher than the Pandora 13:00–14:00 averages and all of the Pandora data (Fig. 11).
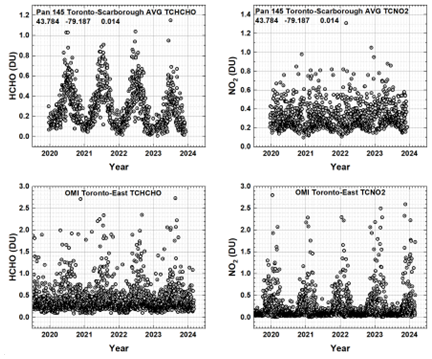
Figure 10A comparison of Pandora TCHCHO and TCNO2 daily average total column amounts for Toronto-Scarborough (University of Toronto) and OMI data for Toronto East (43.740° N, −79.270° W, at approximately 13:20 ± 0:20 local solar time, GMT + Longitude/15). Local principal investigator for Pan 145: Vitali Fioletov.
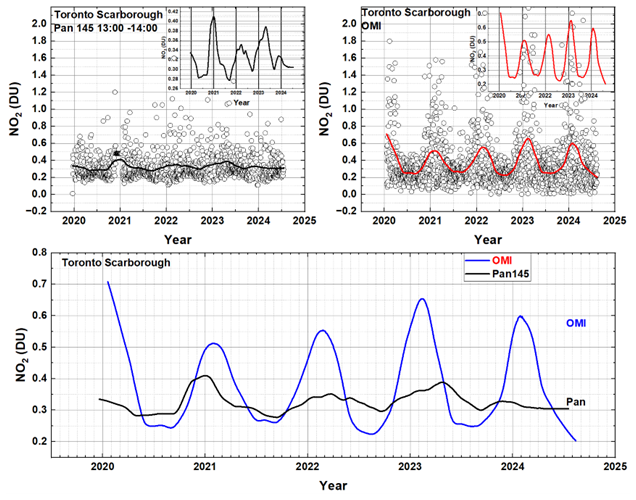
Figure 11TCNO2 annual cycle for Toronto-Scarborough from Pan 145, averaged between 13:00 and 14:00, and OMI. The smooth curves are LOWESS(6-month).
The daily average Pandora data over Toronto-Scarborough (Fig. 10, upper right) shows no visible hint of a TCNO2 annual cycle that peaks in winter, whereas the OMI TCNO2 amounts at 13:40 show a clear peak in December–January corresponding to the peak winter heating for the city (Fig. 10, lower right). Instead of the daily average data, using the average TCNO2 from 13:00 to 14:00 to correspond to the OMI overpass time and then applying a LOWESS(3-month) low-pass filter (Fig. 11) shows less TCNO2 and a weaker annual cycle that corresponds to the annual cycle observed by OMI. The OMI field of view (FOV) includes the city of Toronto.
The lower panel in Fig. 11 reproduces the inset values, showing that the OMI has a stronger TCNO2 annual cycle because it includes the city area of Toronto. Pandora 145 picks up a small amount of the seasonal signal from Toronto.
As shown in Fig. 12, the TCHCHO low-pass-filtered time series (2021–2024), LOWESS(3-month), measured by OMI and Pandora frequently do not agree. An example is the comparison over the Bronx, NY (Lat = 40.868°, Long = −73.878°), where Pandora 180 is located in a park with a small lake, while the OMI gridded data is averaged over a large area (33 × 33 km2) in New York City with little vegetation. In five of the six sites shown in Fig. 12, the OMI retrieval shows more TCHCHO than observed by Pandora. Tsukuba, Japan, is an exception. Six additional sites are shown in Fig. A2.
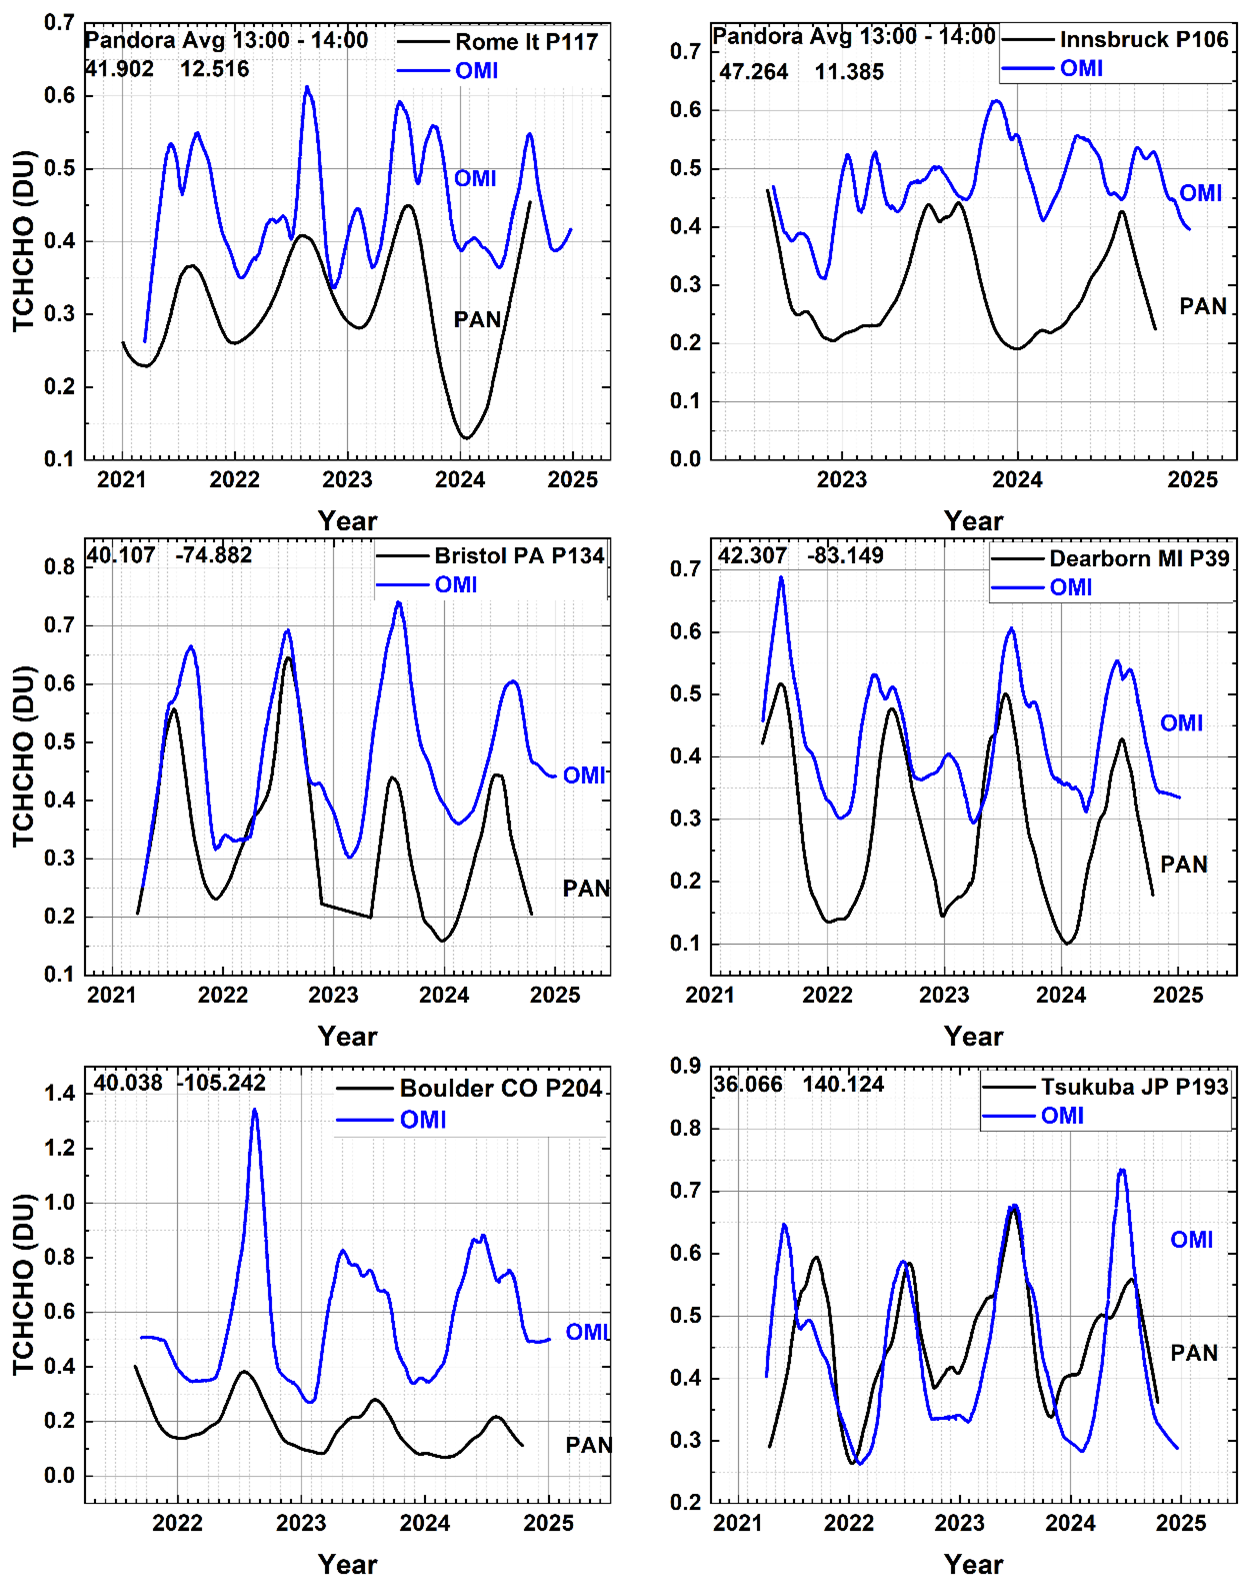
Figure 12A comparison between low-pass-filtered, LOWESS(3-month), OMI and Pandora at six sites with varying degrees of agreement, with TCHCHO(Pan) < TCHCHO(OMI). Local principal investigators: Stefano Casadio (P106), Kei Shiomi (P193), Alexander Cede (P204), Lukas Valin (P39, P134), and Martin Tiefengraber (P106). Latitudes and longitudes are in each upper-left corner.
The disagreement over Boulder, Colorado, may be caused by OMI's large field of view, which includes lower-altitude grasslands. Similarly, the Innsbruck Pandora is located in a valley at the University of Innsbruck surrounded by mountainous areas, where TCHCHO varies over the OMI FOV. Except for a few cases (e.g., Bronx, NY, and Innsbruck, Austria), OMI and Pandora see the same TCHCHO annual cycle.
2.2 Total ozone column
The retrieval of total column ozone (TCO) amounts (Fig. 13) serves as a check on the calibration of both OMI and Pandora that is also needed for spectrally overlapping TCHCHO retrievals. Comparisons of Pandora TCO with TCO measured by OMI show good agreement, suggesting that both instruments are well calibrated in the UV range also needed for retrieving TCHCHO. The good TCO agreement is partly because most of the O3 is in the stratosphere near 25 km and the fact that ozone is slowly changing spatially over the OMI field of view for the overpass data. Figure 13 shows an example obtained over Washington, DC, from the roof of the NASA headquarters building and from the roof of a building at Pusan University, South Korea. The other sites in Table 1 show similar good monthly average agreement.
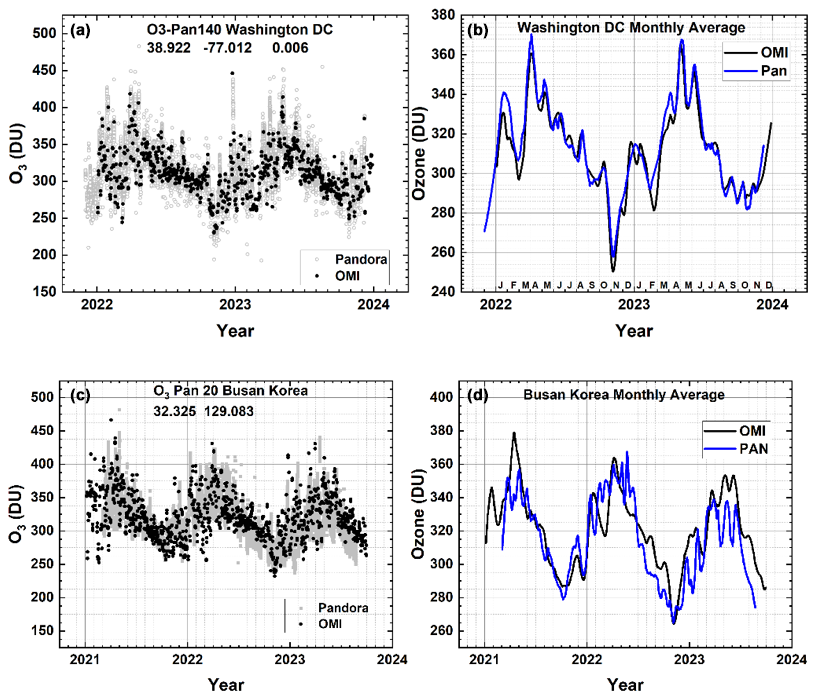
Figure 13A comparison of OMI total column ozone values with those obtained from Pandora 140 over the Washington, DC, site at 38.922° N and −77.012° W and with those obtained from Pandora 20 over the Busan, South Korea, site at 32.325° N and 129.083° E. The smooth curves (b, d) are LOWESS(6-month) fits to the data in panels (a) and (c). Local principal investigator for Pan 140 is Dr. Jim Szykman and for Pan20 is Jae Hwan Kim.
A test of the Pandora UV data is a comparison between EPIC, OMI, and Pandora TCO at the specific OMI and EPIC overpass times (Figs. 14 and 15), which shows good agreement within 1 % to 3 %. The OMI TCO overpass data for all Pandora sites and more are available from https://avdc.gsfc.nasa.gov/pub/data/satellite/Aura/OMI/V03/L2OVP/OMTO3/ (last access: 22 August 2025).
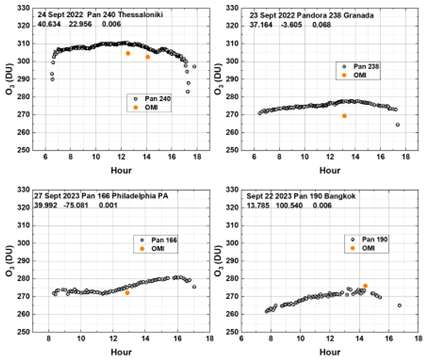
Figure 14A comparison of Pandora and OMI retrievals of total column O3 at the time of the OMI satellite overpass. Local principal investigators: Pan 240, Alexander Cede; Pan 238, Inmaculada Foyo Moreno; Pan 166, Lukas Valin; and Pan 190, Surassawadee Phoompanit. The diurnal variation of TCO seen by Pandora can be compared (Fig. 15) with that observed by the Earth Polychromatic Imaging Camera (EPIC) on the DSCOVR (Deep Space Climate Observatory) satellite orbiting about the Earth–Sun gravitational balance Lagrange-1 point (Herman et al., 2018). EPIC obtains simultaneous data from sunrise to sunset once per hour (once per 90 minutes during Northern Hemisphere winter) as the Earth rotates in EPIC's FOV (field of view). Examples of EPIC's view of the whole illuminated Earth are available from https://epic.gsfc.nasa.gov/ (last access: 22 August 2025). The spatial resolution for TCO is 18 × 18 km2 at the center of the image (the color images have 10 × 10 km2 resolution). Retrievals earlier than 07:00 and after 17:00 are not reliable for EPIC or Pandora because of high solar zenith angle (SZA) effects (spherical geometry effects for SZA > 75°) not included in the retrieval algorithms. In the case of EPIC, this is compounded by high view zenith angles (VZAs) outside of 07:00 to 17:00 local solar time.
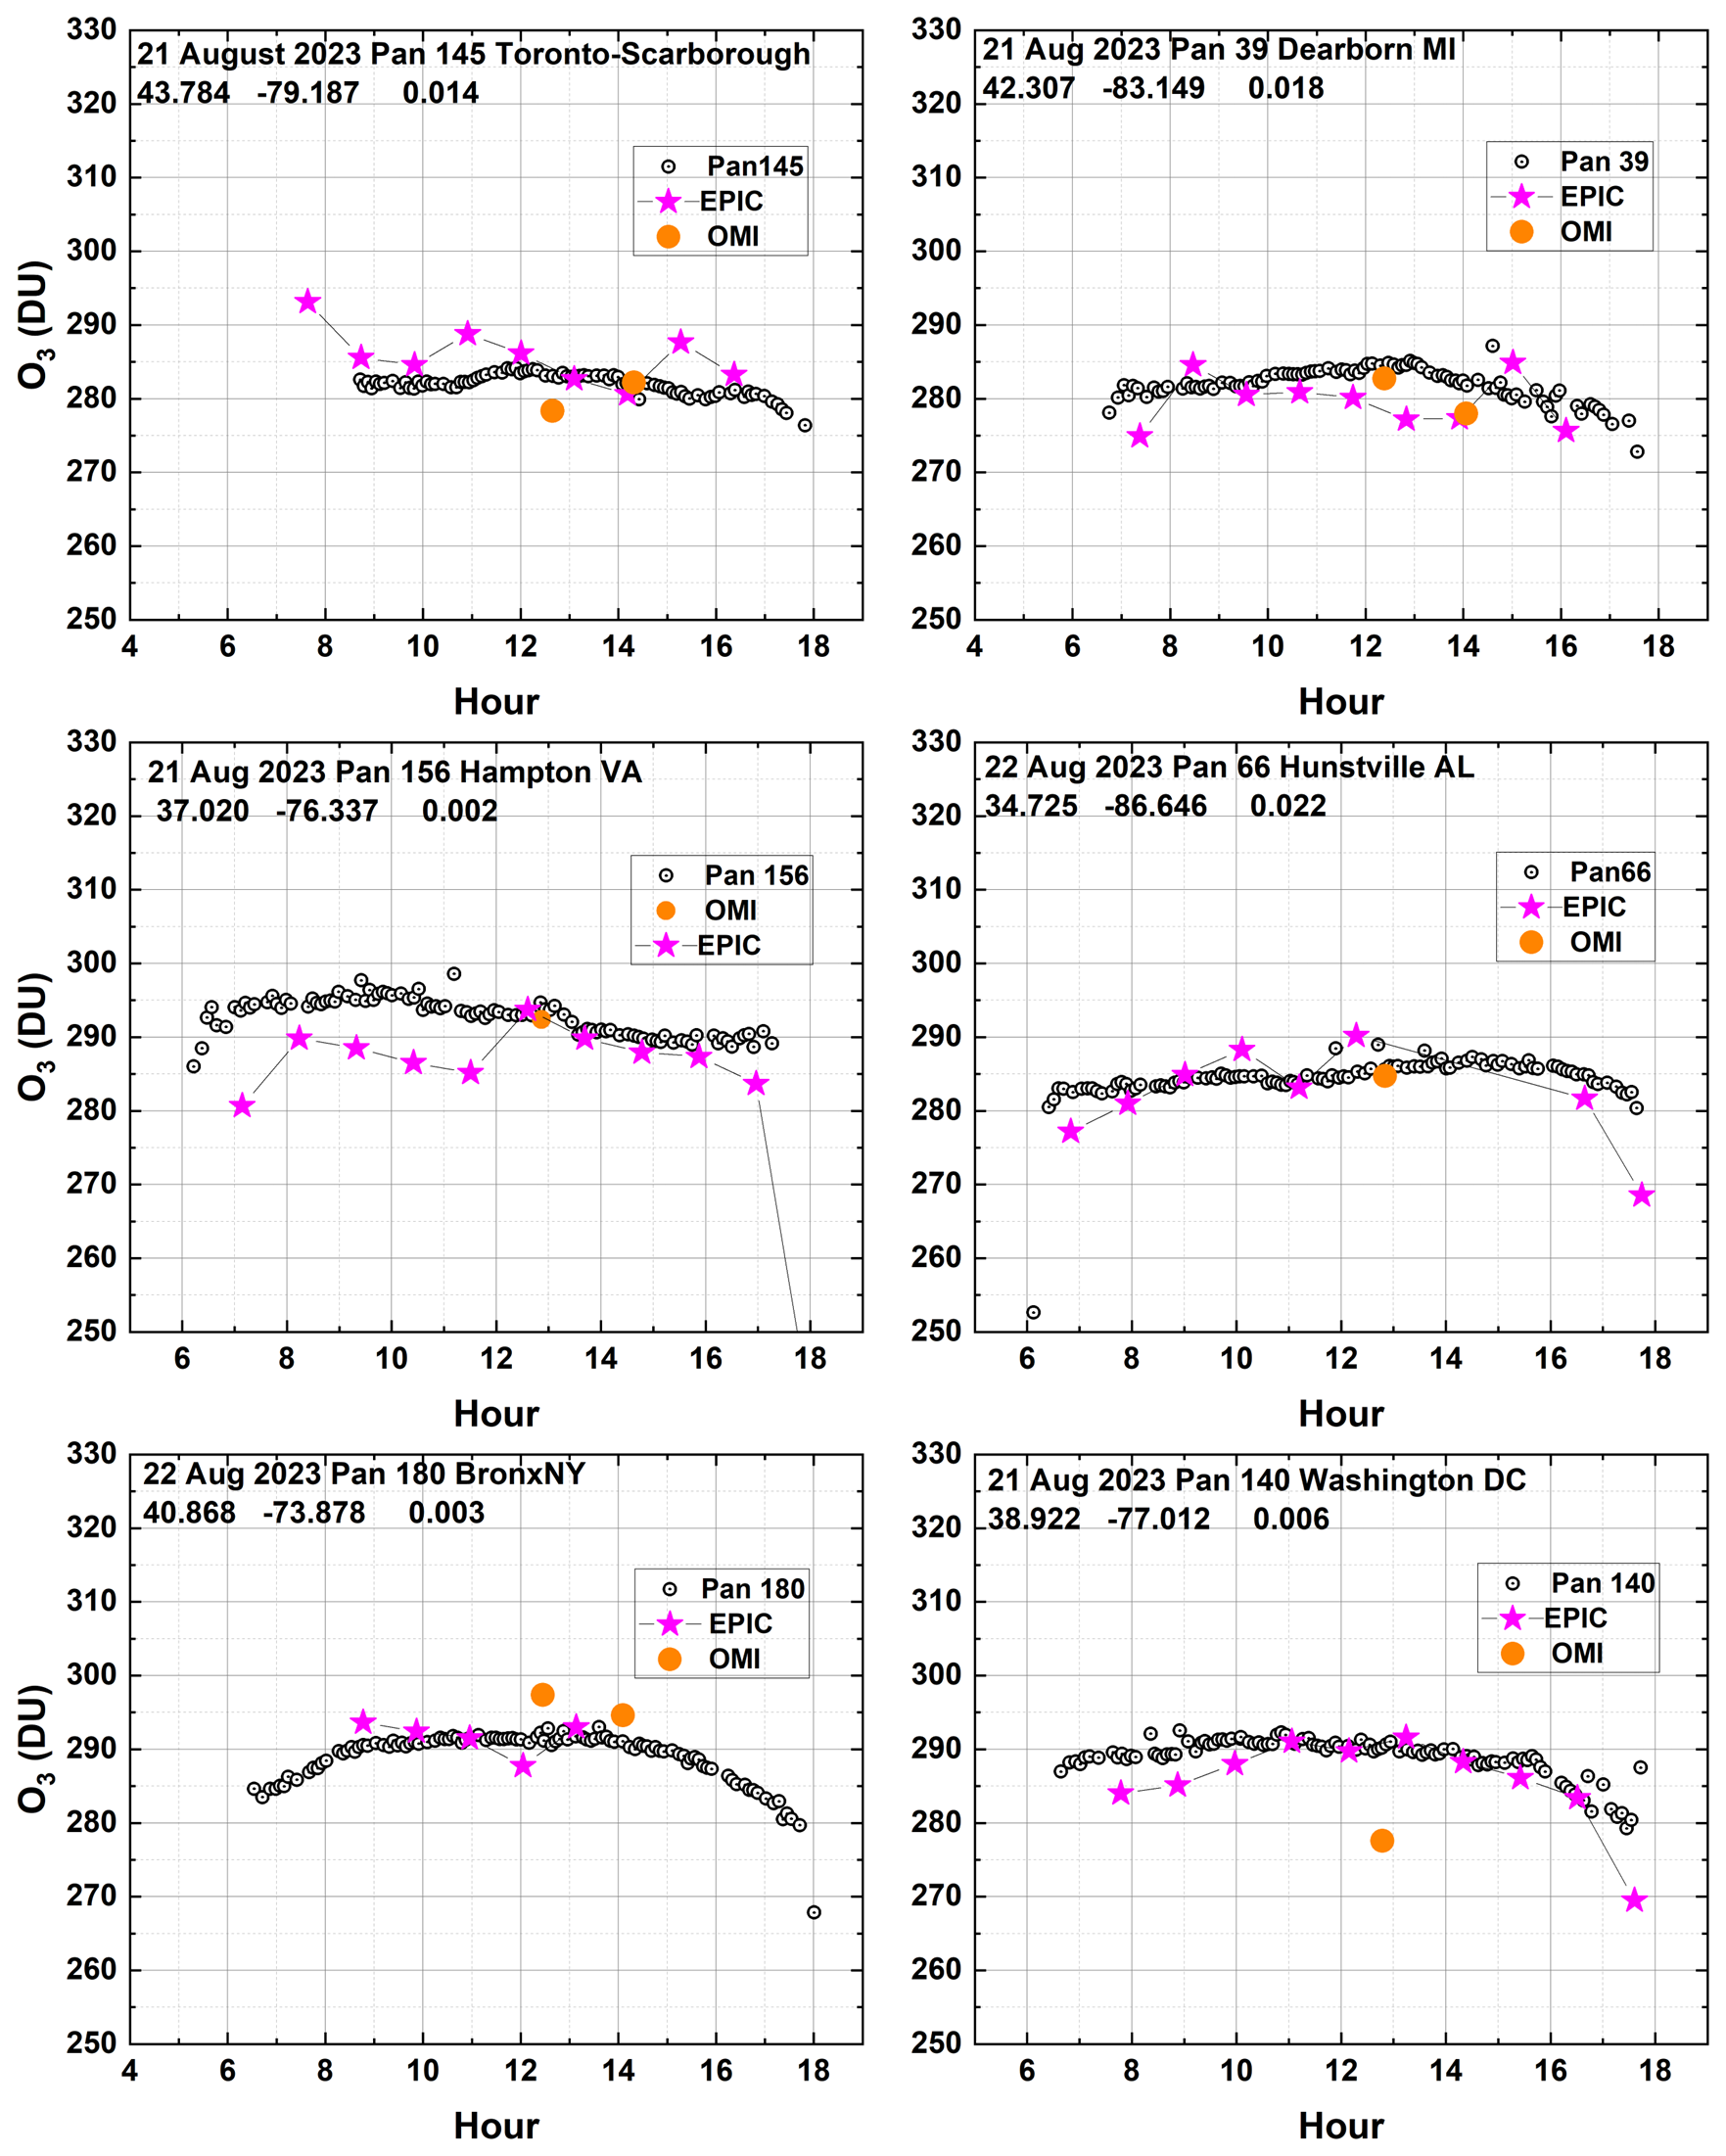
Figure 15A comparison of Pandora (open circles), EPIC (magenta stars), and OMI (orange circles) retrievals of total column O3 at the times of the satellite overpasses. Latitude, longitude, and altitude (km) are in the upper-left corner. Local principal investigators: Pan 145, Vitali Fioletov; Pan 66, Lukas Valin; Pan 39, Lukas Valin; Pan 156, Alexander Cede; Pan 66, Nader Abuhassan; Pan 180, Lukas Valin; and Pan 140, Jim Szykman.
There is also good agreement between daily OMI TCO with that obtained from Pandora (Fig. 14) at most sites. The values obtained at Granada differ by about 8 DU, or 2.9 %.
For the cases shown, the TCO data are properly retrieved between 07:00 and 17:00 local solar time. The 10:20 and 11:30 EPIC value for Hampton, VA, of 286.5 and 285 DU differs from Pandora by −3 %. Other differences are smaller. Occasionally, OMI differs from the Pandora values, as is the case, i.e., −4.6 %, for 21 August 2023 over Washington, DC.
Typical examples of the seasonal variability of HCHO, NO2, and O3 in terms of their measured total column TCHCHO, TCNO2, and TCO have been presented from both ground-based Pandora spectrometer instruments and the OMI satellite spectrometer instrument overpass retrievals for selected Pandora sites. For most sites, OMI observes the strong seasonal variation of TCHCHO that is also clearly seen in the Pandora data and in surface measurements (Wang et al., 2022). OMI TCHCHO retrievals are usually larger than those retrieved by Pandora, but not always (Fig. A2). The amount of seasonal variation for TCHCHO varies depending on the site. For most mid-latitude sites, the seasonal variation is significant, with peak values occurring during the summer.
A comparison between the multi-year time series of Pandora and OMI TCNO2 in urban areas shows that OMI is underestimating the degree of atmospheric NO2 pollution. The results for TCNO2 and TCO agree with the Pandora data for the period 2012–2017 from a previous study before the Pandora upgrade (Herman et al., 2019). When Pandora is limited to an average of data obtained between 13:00 and 14:00, the agreement between Pandora and OMI TCNO2 is better but with OMI TCNO2 frequently less than that observed by Pandora. Comparisons of Pandora daily diurnal time series of TCHCHO and TCNO2 with the OMI overpass values show agreement about 30 % and 50 % of the time, respectively, with OMI frequently retrieving more TCHCHO than Pandora.
OMI TCNO2 at one shown site, Toronto-Scarborough, shows seasonal variability that the Pandora 145 device does not appear to see. However, limiting the data to the OMI overpass time between 13:00 and 14:00 and applying a LOWESS(3-month) low-pass filter reveals a weak annual cycle compared to OMI. This could be because OMI detects the NO2 source from winter heating in the city, while the Pandora site (University of Toronto campus) is fairly remote from Toronto city buildings and is mostly affected by road traffic as the source of NO2. The same low-pass filter technique applied to other sites (e.g., Bronx, NY; Busan, South Korea; Philadelphia, Pennsylvania; and Boulder, Colorado) also shows an annual cycle corresponding to winter heating based on combustion.
Total column ozone agrees well in both seasonal variation and in comparison with Pandora at the OMI overpass time. Given the nature of the ozone retrieval algorithm, the good agreement with TCO suggests that the UV calibrations for Pandora and OMI are correct. At most well-calibrated Pandora sites, there is good agreement between Pandora TCO and the hourly TCO obtained from the DSCOVR-EPIC instrument observing the Earth from an orbit about the Earth–Sun gravitational balance Lagrange-1 point.
Figure A1 shows the seasonal dependence of TCHCHO, with the majority of sites showing a maximum TCHCHO in mid-summer.
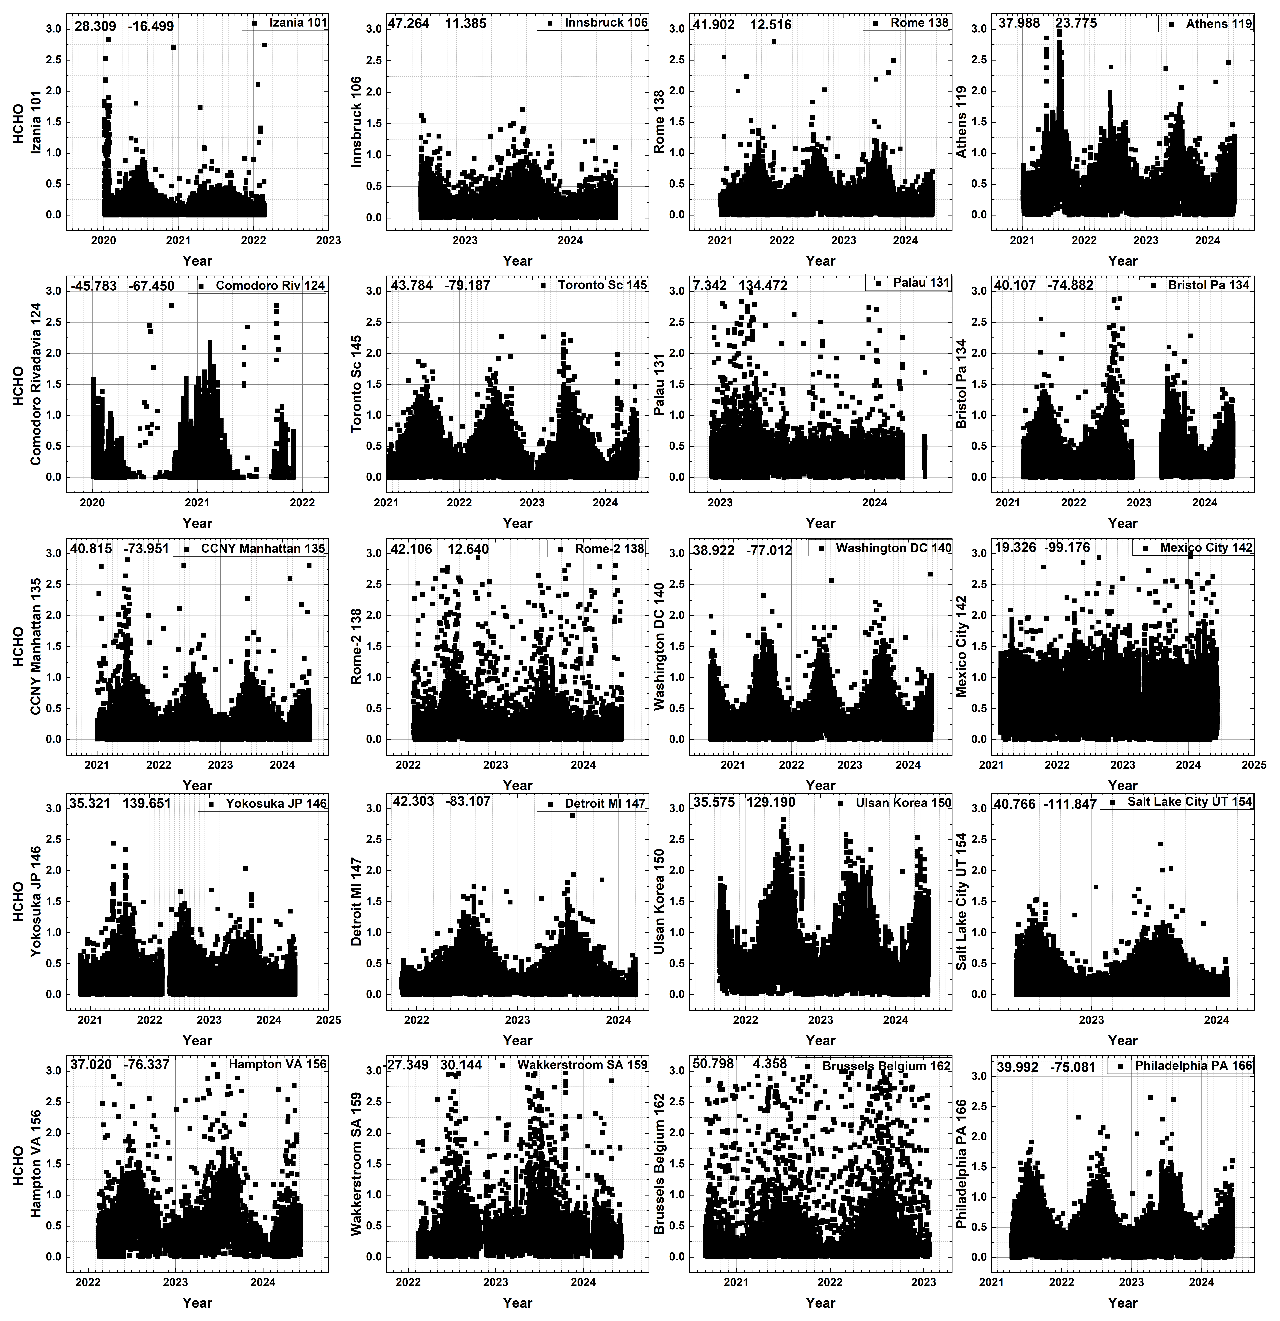
Figure A1The seasonal cycle of TCHCHO in DU from 20 randomly selected Pandora TCHCHO time series. The numbers in the upper-left corner are the latitude and longitude in degrees, and the Pandora instrument number is shown in the upper-right corner.
Figure A2 shows additional cases where OMI and Pandora see the same seasonal dependence but differ on the amount of TCHCHO retrieved.
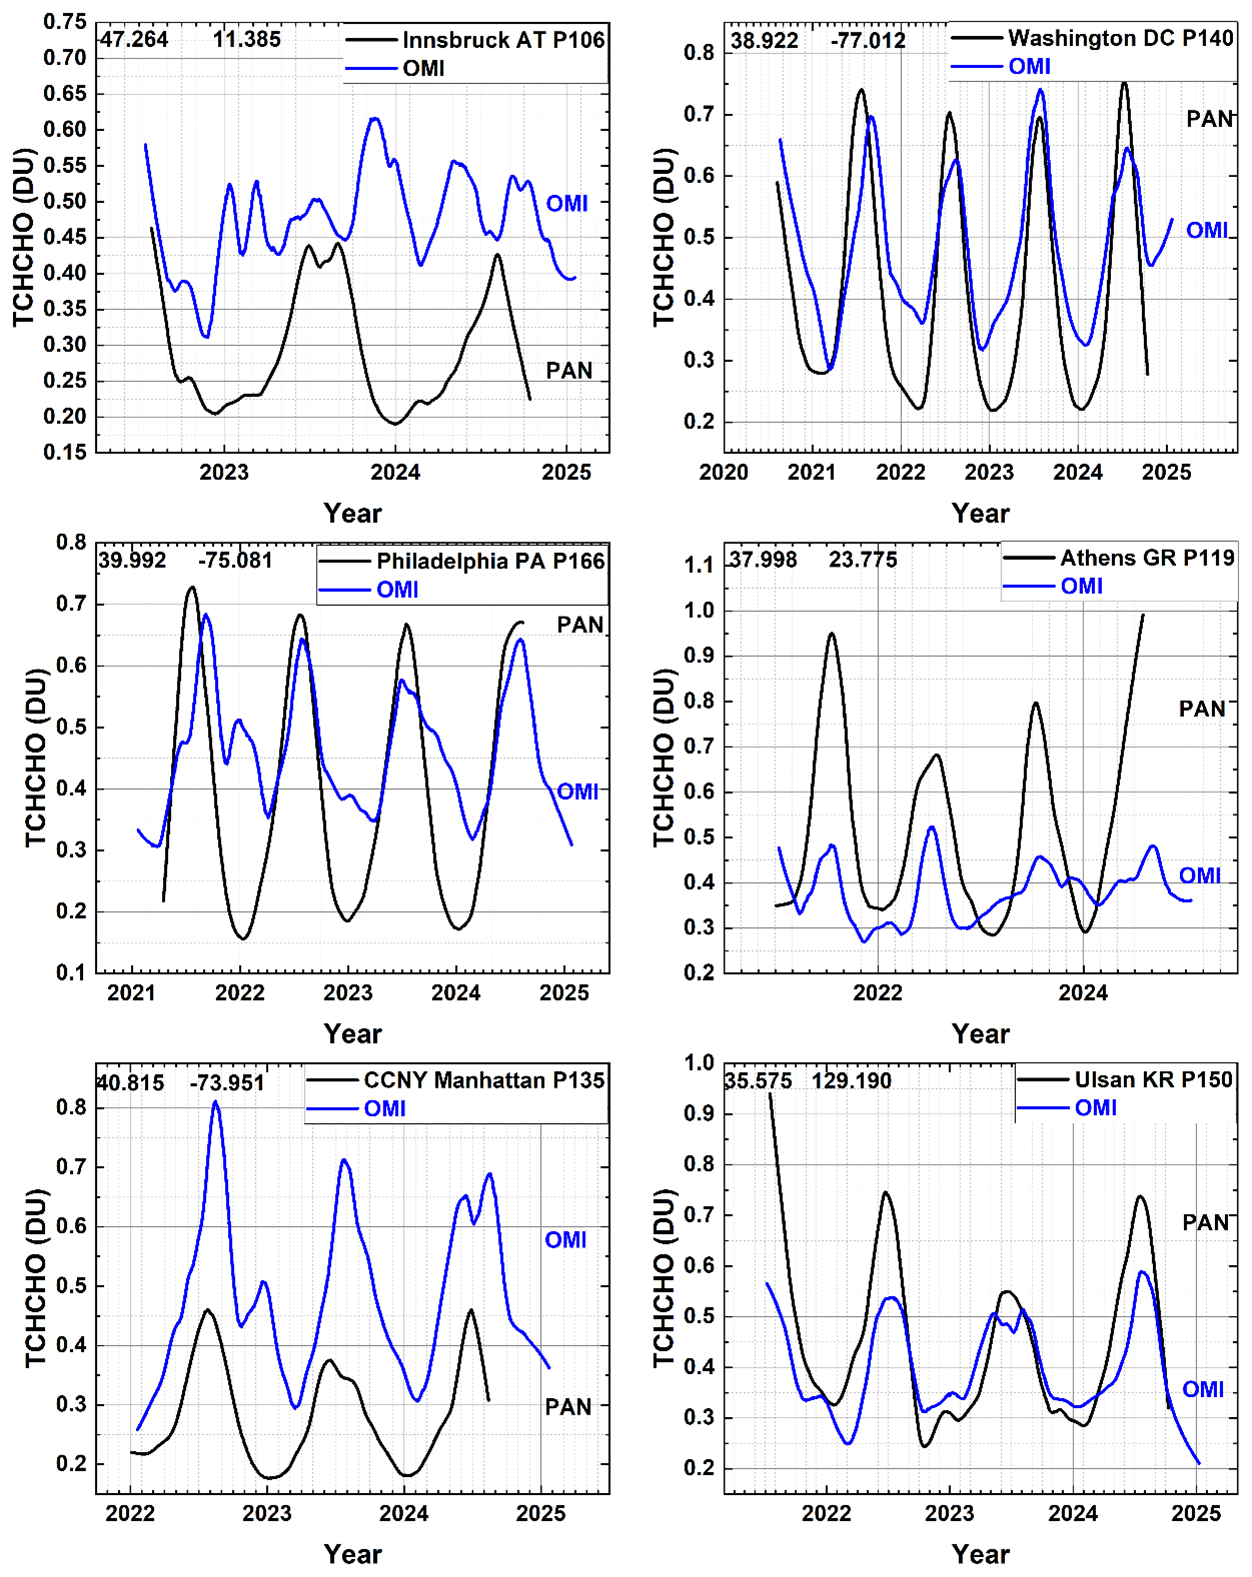
Figure A2Six cases from Fig. A1 that have significant seasonal variation in TCHCHO. The numbers in the upper-left corner are the latitude and longitude in degrees, and the Pandora instrument number is given in the upper-right corner. Principal investigators: P106, Martin Tiefengraber; P140, Jim Szykman; P166, Lucas Valin; P119, Stelios Kazadsi; P135, Maria Tzortziou; and P150, Chang Keun Song.
Worldwide Pandora data for 63 sites are available from the Austrian Pandonia project website: https://data.pandonia-global-network.org/ (Cede, 2025).
The OMI overpass HCHO, NO2, and O3 data, covering 2004–2025, are found at https://doi.org/10.5281/zenodo.15468213 in 7Zip ASCII format (Herman, 2025).
JH is responsible for writing the paper and creating the figures. JM obtained the EPIC overpass data for the Pandora sites and discussed aspects of the paper.
The contact author has declared that neither of the authors has any competing interests.
Publisher’s note: Copernicus Publications remains neutral with regard to jurisdictional claims made in the text, published maps, institutional affiliations, or any other geographical representation in this paper. While Copernicus Publications makes every effort to include appropriate place names, the final responsibility lies with the authors.
The authors want to acknowledge the contribution of each of the Pandora principal investigators included in the figure captions and the OMI team and Lok Lamsal for making the OMI overpass data available. Acknowledgement is also due to the Pandonia team, led by Alexander Cede, for processing all of the Pandora data and devising the retrieval algorithms and to Nader Abuhassan for building and calibrating all of the Pandora spectrometer systems. The Pandonia Global Network (PGN) is a bilateral project supported by funding from NASA and ESA.
This study is funded by the DSCOVR-EPIC project through the University Of Maryland, Baltimore County.
This paper was edited by Michel Van Roozendael and reviewed by two anonymous referees.
Boeke, N. L., Marshall, J. D., Alvarez, S., Chance, K. V., Fried A., Kurosu, T. P., Rappenglück, B., Richter D., Walega, J., Weibring, P., and Millet, D. B., Formaldehyde columns from the Ozone Monitoring Instrument: Urban versus background levels and evaluation using aircraft data and a global model, J. Geophys. Res., 116, D05303, https://doi.org/10.1029/2010jd014870, 2011.
Boersma, K. F., Jacob, D. J., Trainic, M., Rudich, Y., DeSmedt, I., Dirksen, R., and Eskes, H. J.: Validation of urban NO2 concentrations and their diurnal and seasonal variations observed from the SCIAMACHY and OMI sensors using in situ surface measurements in Israeli cities, Atmos. Chem. Phys., 9, 3867–3879,https://doi.org/10.5194/acp-9-3867-2009, 2009.
Cede, A.: Pandora Data, Pandonia global Network, https://data.pandonia-global-network.org/, last access: 22 August 2025.
Celarier, E. A., Brinksma, E. J., Gleason, J. F., Veefkind, J. P., Cede, A., Herman, J. R., Ionov, D., Goutail, F., Pommereau, J.-P., Lambert, J.-C., van Roozendael, M., Pinardi, G., Wittrock, F., Schönhardt, A., Richter, A., Ibrahim, O. W., Wagner, T., Bojkov, B., Mount, G., Spinei, E., Chen C. M., Pongetti, T. J., Sander, S. P., Bucsela, E. J., Wenig, M. O., Swart, D. P. J., Volten, H., Kroon, M., and Levelt, P. F.: Validation of Ozone Monitoring Instrument nitrogen dioxide columns, Validation of Ozone Monitoring Instrument nitrogen dioxide columns, J. Geophys. Res., 113, D15S15, https://doi.org/10.1029/2007JD008908, 2008.
Cleveland, W. S.: Robust Locally Weighted Regression and Smoothing Scatterplots, J. Am. Stat. Assoc., 74, 829–836, https://doi.org/10.2307/2286407, 1979.
Cleveland, W. S. and Devlin, S. J.: Locally Weighted Regression: An Approach to Regression Analysis by Local Fitting, J. Am. Stat. Assoc., 83, 596–610, https://doi.org/10.1080/01621459.1988.10478639, 1988.
De Smedt, I., Pinardi, G., Vigouroux, C., Compernolle, S., Bais, A., Benavent, N., Boersma, F., Chan, K.-L., Donner, S., Eichmann, K.-U., Hedelt, P., Hendrick, F., Irie, H., Kumar, V., Lambert, J.-C., Langerock, B., Lerot, C., Liu, C., Loyola, D., Piters, A., Richter, A., Rivera Cárdenas, C., Romahn, F., Ryan, R. G., Sinha, V., Theys, N., Vlietinck, J., Wagner, T., Wang, T., Yu, H., and Van Roozendael, M.: Comparative assessment of TROPOMI and OMI formaldehyde observations and validation against MAX-DOAS network column measurements, Atmos. Chem. Phys., 21, 12561–12593,https://doi.org/10.5194/acp-21-12561-2021, 2021.
Dobber, M. R., van den Oord, G. H. J., Mälkki, A., Visser, H., de Vries, J., Stammes, P., Lundell, J. O. V., and Saari, H.: Prelaunch characterization of the Ozone Monitoring Instrument (OMI) on board the Earth Observing System Aura satellite, Appl. Opt., 45, 3907–3914, 2006.
Faustini, A., Rapp, R., and Forastiere, F.: Nitrogen dioxide and mortality: review and meta-analysis of long-term studies, Eur. Respir. J., 44, 744–753, https://doi.org/10.1183/09031936.00114713, 2014.
Fu, W., Zhu, L., Kwon, A., Park, R. J., Lee, G. T., Smedt, I. D., Liu, S., Li, X., Chen, Y., Pu, D., Li, J., Zuo, X., Zhang, P., Li, Y., Yan, Z., Zhang, X., Zhang, J., Wu, X., Shen, H., Ye, J., Wang, C., Fu, T.-M., and Yang, X.: Evaluating GEMS HCHO Retrievals With TROPOMI Product, Pandora Observations, and GEOS-Chem Simulations, Earth and Space Science, 12, e2024EA003894, https://doi.org/10.1029/2024EA003894, 2025.
Gratien, A., Picquet-Varrault, B., Orphal, J., Perraudin, E., Doussin, J.-F. and, Flaud, J.-M.: Laboratory intercomparison of the formaldehyde absorption cross sections in the infrared (1660–1820 cm−1 and ultraviolet (300–360 nm) spectral regions, J. Geophys. Res., 112, D05305, https://doi.org/10.1029/2006JD007201, 2007.
Herman, J.: OMI Overpass files for NO2, O3, HCHO in 7zip format, in: Seasonal Variation of Total Column Formaldehyde, Nitrogen Dioxide, and Ozone Over Various Pandora Spectrometer Sites with a Comparison of OMI and Diurnally Varying DSCOVR-EPIC Satellite Data, Zenodo [data set], https://doi.org/10.5281/zenodo.15468213, 2025.
Herman, J., Cede, A., Spinei, E., Mount, G., Tzortziou, M., and Abuhassan, N.: NO2 column amounts from ground-based Pandora and MFDOAS spectrometers using the direct-sun DOAS technique: Intercomparisons and application to OMI validation, J. Geophys. Res., 114, D13307, https://doi.org/10.1029/2009JD011848, 2009.
Herman, J., Huang, L., McPeters, R., Ziemke, J., Cede, A., and Blank, K.: Synoptic ozone, cloud reflectivity, and erythemal irradiance from sunrise to sunset for the whole earth as viewed by the DSCOVR spacecraft from the earth–sun Lagrange 1 orbit, Atmos. Meas. Tech., 11, 177–194,https://doi.org/10.5194/amt-11-177-2018, 2018.
Herman, J., Abuhassan, N., Kim, J., Kim, J., Dubey, M., Raponi, M., and Tzortziou, M.: Underestimation of column NO2 amounts from the OMI satellite compared to diurnally varying ground-based retrievals from multiple PANDORA spectrometer instruments, Atmos. Meas. Tech., 12, 5593–5612,https://doi.org/10.5194/amt-12-5593-2019, 2019.
Judd, L. M., Al-Saadi, J. A., Janz, S. J., Kowalewski, M. G., Pierce, R. B., Szykman, J. J., Valin, L. C., Swap, R., Cede, A., Mueller, M., Tiefengraber, M., Abuhassan, N., and Williams, D.: Evaluating the impact of spatial resolution on tropospheric NO2 column comparisons within urban areas using high-resolution airborne data, Atmos. Meas. Tech., 12, 6091–6111,https://doi.org/10.5194/amt-12-6091-2019, 2019.
Kim, K.-H., Jahan, S. A., and Lee, J.-T.: Exposure to Formaldehyde and Its Potential Human Health Hazards, J. Environ. Sci. Heal. C, 29, 277–299, https://doi.org/10.1080/10590501.2011.629972, 2011.
Lamsal, L. N., Krotkov, N. A., Celarier, E. A., Swartz, W. H., Pickering, K. E., Bucsela, E. J., Gleason, J. F., Martin, R. V., Philip, S., Irie, H., Cede, A., Herman, J., Weinheimer, A., Szykman, J. J., and Knepp, T. N.: Evaluation of OMI operational standard NO2 column retrievals using in situ and surface-based NO2 observations, Atmos. Chem. Phys., 14, 11587–11609,https://doi.org/10.5194/acp-14-11587-2014 , 2014.
Lamsal, L., Duncan, B., Yoshida, Y., Krotkov, N., Pickering, K., Streets, D., and Lu, Z.: U.S. NO2 trends (2005–2013): EPA Air Quality System (AQS) data versus improved observations from the Ozone Monitoring Instrument (OMI), Atmos. Environ., 110, 130–143, https://doi.org/10.1016/j.atmosenv.2015.03.055, 2015.
Levelt, P. F., Van Den Oord, G. H. J., Dobber, M. R., Malkki, A., Visser, H., De Vries, J., et al.: The ozone monitoring instrument, IEEE Trans. Geosci. Remote Sens., 44, 1093–1101, https://doi.org/10.1109/TGRS.2006.87233, 2006.
Levelt, P. F., Joiner, J., Tamminen, J., Veefkind, J. P., Bhartia, P. K., Stein Zweers, D. C., Duncan, B. N., Streets, D. G., Eskes, H., van der A, R., McLinden, C., Fioletov, V., Carn, S., de Laat, J., DeLand, M., Marchenko, S., McPeters, R., Ziemke, J., Fu, D., Liu, X., Pickering, K., Apituley, A., González Abad, G., Arola, A., Boersma, F., Chan Miller, C., Chance, K., de Graaf, M., Hakkarainen, J., Hassinen, S., Ialongo, I., Kleipool, Q., Krotkov, N., Li, C., Lamsal, L., Newman, P., Nowlan, C., Suleiman, R., Tilstra, L. G., Torres, O., Wang, H., and Wargan, K.: The Ozone Monitoring Instrument: overview of 14 years in space, Atmos. Chem. Phys., 18, 5699–5745,https://doi.org/10.5194/acp-18-5699-2018, 2018.
Morfopoulos, C., Müller, J.-F., Stavrakou, T., Bauwens, M., De Smedt, I., Friedlingstein, P., Prentice, I. C., and Regnier, P.: Vegetation responses to climate extremes recorded by remotely sensed atmospheric formaldehyde, Glob. Change Biol., 28, 1809–1822, https://doi.org/10.1111/gcb.15880, 2021.
Lorente, A., Folkert Boersma, K., Yu, H., Dörner, S., Hilboll, A., Richter, A., Liu, M., Lamsal, L. N., Barkley, M., De Smedt, I., Van Roozendael, M., Wang, Y., Wagner, T., Beirle, S., Lin, J.-T., Krotkov, N., Stammes, P., Wang, P., Eskes, H. J., and Krol, M.: Structural uncertainty in air mass factor calculation for NO2 and HCHO satellite retrievals, Atmos. Meas. Tech., 10, 759–782, https://doi.org/10.5194/amt-10-759-2017, 2017.
Newmark, G.: Emissions Inventory Analysis of Mobile Source Air Pollution In Tel Aviv, Israel, Transp. Res. Record, 1750, 40–48, https://doi.org/10.3141/1750-05, 2001.
Nussbaumer, C. M., Crowley, J. N., Schuladen, J., Williams, J., Hafermann, S., Reiffs, A., Axinte, R., Harder, H., Ernest, C., Novelli, A., Sala, K., Martinez, M., Mallik, C., Tomsche, L., Plass-Dülmer, C., Bohn, B., Lelieveld, J., and Fischer, H.: Measurement report: Photochemical production and loss rates of formaldehyde and ozone across Europe, Atmos. Chem. Phys., 21, 18413–18432, https://doi.org/10.5194/acp-21-18413-2021, 2021.
Peng, W.-X., Yue, X.-C. , Chen, H.-L., Ma, N.L., Quan, Z., Yu, Q., and Sonne, C.: A review of plants formaldehyde metabolism: Implications for hazardous emissions and phytoremediation, J. Hazard. Mater., 436, 129304, https://doi.org/10.1016/j.jhazmat.2022.129304, 2022.
Pinardi, G., Van Roozendael, M., Hendrick, F., Theys, N., Abuhassan, N., Bais, A., Boersma, F., Cede, A., Chong, J., Donner, S., Drosoglou, T., Dzhola, A., Eskes, H., Frieß, U., Granville, J., Herman, J. R., Holla, R., Hovila, J., Irie, H., Kanaya, Y., Karagkiozidis, D., Kouremeti, N., Lambert, J.-C., Ma, J., Peters, E., Piters, A., Postylyakov, O., Richter, A., Remmers, J., Takashima, H., Tiefengraber, M., Valks, P., Vlemmix, T., Wagner, T., and Wittrock, F.: Validation of tropospheric NO2 column measurements of GOME-2A and OMI using MAX-DOAS and direct sun network observations, Atmos. Meas. Tech., 13, 6141–6174, https://doi.org/10.5194/amt-13-6141-2020, 2020.
Spinei, E., Whitehill, A., Fried, A., Tiefengraber, M., Knepp, T. N., Herndon, S., Herman, J. R., Müller, M., Abuhassan, N., Cede, A., Richter, D., Walega, J., Crawford, J., Szykman, J., Valin, L., Williams, D. J., Long, R., Swap, R. J., Lee, Y., Nowak, N., and Poche, B.: The first evaluation of formaldehyde column observations by improved Pandora spectrometers during the KORUS-AQ field study, Atmos. Meas. Tech., 11, 4943–4961, https://doi.org/10.5194/amt-11-4943-2018, 2018.
Spinei, E., Tiefengraber, M., Müller, M., Gebetsberger, M., Cede, A., Valin, L., Szykman, J., Whitehill, A., Kotsakis, A., Santos, F., Abbuhasan, N., Zhao, X., Fioletov, V., Lee, S. C., and Swap, R.: Effect of polyoxymethylene (POM-H Delrin) off-gassing within the Pandora head sensor on direct-sun and multi-axis formaldehyde column measurements in 2016–2019, Atmos. Meas. Tech., 14, 647–663, https://doi.org/10.5194/amt-14-647-2021, 2021.
Stavrakou, T., Müller, J.-F., Bauwens, M., Boersma, K. F., and van Geffen, J.: Satellite evidence for changes in the NO2 weekly cycle over large cities, Sci. Rep., 10, 10066, https://doi.org/10.1038/s41598-020-66891-0, 2020.
Tzortziou, M., Herman, J. R., Cede, A., Loughner, C. P., Abuhassan, N., and Naik, S.: Spatial and temporal variability of ozone and nitrogen dioxide over a major urban estuarine ecosystem, J. Atmos. Chem., 72, 287–309, https://doi.org/10.1007/s10874-013-9255-8, 2015.
Van der A, R. J., Eskes, H. J., Boersma, K. F., van Noije, T. P. C., Van Roozendael, M., De Smedt, I., Peters, D. H. M. U., and Meijer, E. W.: Trends, seasonal variability and dominant NOx source derived from a ten year record of NO2 measured from space, J. Geophys. Res., 113, D04302, https://doi.org/10.1029/2007JD009021, 2008.
Wang, P., Holloway, T., Bindl, M., Harkey, M., and De Smedt, I.: Ambient Formaldehyde over the United States from Ground-Based (AQS) and Satellite (OMI) Observations, Remote Sens., 14, 2191, https://doi.org/10.3390/rs14092191, 2022.
Wittrock, F., Richter, A., Oetjen, H., Burrows, J. P., Kanakidou, M., Myriokefalitakis, S., Volkamer, R., Beirle, S., Platt, U., and Wagner, T.: Simultaneous global observations of glyoxal and formaldehyde from space, Geophys. Res. Lett., 33, L16804, https://doi.org/10.1029/2006GL026310, 2006.
Zhao, X., Griffin, D., Fioletov, V., McLinden, C., Davies, J., Ogyu, A., Lee, S. C., Lupu, A., Moran, M. D., Cede, A., Tiefengraber, M., and Müller, M.: Retrieval of total column and surface NO2 from Pandora zenith-sky measurements, Atmos. Chem. Phys., 19, 10619–10642, https://doi.org/10.5194/acp-19-10619-2019, 2019.
Zhang, Y., Li, R., Min, Q., Bo, H., Fu, Y., Wang, Y., and Gao, Z.: The controlling factors of atmospheric formaldehyde (HCHO) in Amazon as seen from satellite, Earth and Space Science, 6, 959–971, https://doi.org/10.1029/2019EA000627, 2019.