the Creative Commons Attribution 4.0 License.
the Creative Commons Attribution 4.0 License.
 | 09 Sep 2025
The role of fuel and environmental conditions on the amount and composition of primary, fresh, and aged aerosol emissions originating from diesel- and gasoline-operated auxiliary heaters of passenger cars
Anni Hartikainen
Pauli Simonen
Miska Olin
Ukko-Ville Mäkinen
Petteri Marjanen
Laura Salo
Ville Silvonen
Sampsa Martikainen
Jussi Hoivala
Mika Ihalainen
Pasi Miettinen
Pasi Yli-Pirilä
Olli Sippula
Santtu Mikkonen
Panu Karjalainen
Fuel-operated auxiliary heaters (AHs) are potentially significant additional sources of particle- and gas-phase pollution from vehicles, but information on their emissions is scarce. In particular, an understanding of secondary aerosol formation originating from AH exhaust is lacking. In this study, we measured the gas and particle emissions, including secondary emissions, of diesel- and gasoline-operated AHs used in passenger cars. Investigation revealed the importance of peak emissions during start and shutdown events of the heaters and differences between emissions of gasoline- and diesel-fuelled AHs: gasoline-operated AHs also produced particles under steady-state operating conditions, while their diesel counterparts did not. Furthermore, ambient air temperature was observed to impact the emission profiles, with, for example, higher nitrogen oxide (NOx) and particle mass emissions but lower particle number (PN) emissions observed in outdoor (−19 to −7 °C) measurements compared to laboratory measurements (+25 °C). However, further quantification is necessary to fully connect the temperature-related effects and AH emissions. Our findings highlight the importance of also characterizing the atmospherically aged aerosols, specifically secondary organic aerosol (SOA) formation, which was simulated here both by an environmental chamber and by an oxidation flow reactor (OFR). The particle mass in photochemically aged aerosols surpassed the fresh exhaust particulate mass emissions by 1 to 3 orders of magnitude, with the increase depending mainly on fuel, combustion conditions, and ageing methods. Further research into formation pathways of secondary aerosols from precursors is still needed, along with the quantification of vehicle AH emissions at the fleet level, to enable the estimation of atmospheric and air quality effects of AH usage.
- Article
(7156 KB) - Full-text XML
-
Supplement
(2019 KB) - BibTeX
- EndNote


In recent decades, the automotive industry has witnessed a shift towards the integration of various auxiliary heating systems aimed at enhancing the comfort and functionality of vehicles in cold climates. One such system is a fuel-operated auxiliary heater (AH), a technology designed to provide supplementary heating to the vehicle cabin and engine. These systems, exemplified by the widely used heaters manufactured by Webasto, Eberspächer, and others, offer the convenience of preheating the vehicle interior while reducing the strain on the engine during initial cold ignition. This improves passenger comfort and claims reduced wear on critical engine components. The popularity of AHs has somewhat grown in response to the need for cabin and engine heating due to the increased efficiency of combustion engines and powertrain hybridization. Cold weather conditions not only create discomfort for occupants but also pose challenges to the usability, efficiency, and emissions of internal combustion engines, but this needs to be balanced against calculated environmental impact of AH usage. This has brought AHs into the spotlight of automotive engineering.
As emission regulations become progressively more stringent worldwide, there is a growing concern regarding the potential impact of AHs on air quality and climate. AHs introduce an additional source of transport sector pollutants into the atmosphere. The emissions from AHs, including particulate matter (PM), black carbon (BC), nitrogen oxides (NOx), and carbon monoxide (CO), are of particular interest due to their harmful impacts for air quality and human health. The current AH emission regulation in use in the EU and some other countries limits only CO, NOx, and hydrocarbon (HC) emissions with maximum concentrations under stable flame conditions of 1000, 200, and 100 ppm, respectively (European Union, 2010). The literature covering the aerosol emissions from fuel-operated AHs is limited. Besides our recent studies (Karjalainen et al., 2021; Oikarinen et al., 2022), only few peer-reviewed studies on AH emissions (Nagy et al., 2024; Pettinen et al., 2023) exist. For example, AHs have been observed to produce non-volatile particle number (PN) concentrations over 3 orders of magnitude higher than those of diesel or gasoline engines on idle (Karjalainen et al., 2021). The environmental impact of AHs may be further impacted by atmospheric processes.
In addition to primary pollutants, such as PM mass, PN, and BC, gasoline and diesel combustion engines also generate precursors capable of forming secondary aerosols in the atmosphere. Interestingly, the quantity of secondary aerosol emissions can vastly surpass that of primary or fresh aerosol emissions (Hartikainen et al., 2023; Karjalainen et al., 2016; Kostenidou et al., 2024), especially in the case of PM mass. Fuel composition influences precursor emissions (Karjalainen et al., 2019; Timonen et al., 2017), which subsequently influence the formation of secondary organic aerosol (SOA). However, SOA emissions have not yet been reported for AH exhaust.
Aims of this study are to determine emission factors of primary and secondary aerosol pollutants and gas-phase pollutants from AHs. Emissions of gas-phase pollutants are also compared against both regulation limits and mean fleet emission factors of EU road transport emissions. We strive to understand how both ambient temperature and atmospheric photochemical ageing influence AH exhaust aerosols. Furthermore, we aim to validate AH emissions aged with an oxidation flow reactor (OFR) against those emissions aged with a more realistic atmospheric oxidation chamber. Chamber experiments also provide insight into the timescales of the ageing process.
Experiments conducted for this research consist of outdoor and laboratory measurement campaigns. The outdoor study that was carried out under real winter conditions in Finland employed partial exhaust sampling and an oxidation flow reactor (OFR) system to capture the evolving nature of emissions in real-world scenarios. The laboratory investigation, on the other hand, employed a large atmospheric oxidation chamber of the University Eastern Finland that allows controlled and replicable batch-type ageing measurements. Both measurement campaigns focused on a broad range of emission parameters measured in real time, including various particle and gaseous emissions, particle number and mass, black carbon concentration, and chemical composition analysis.
2.1 Laboratory measurement campaign (ILMARI)
2.1.1 Sampling and experimental setup
The indoor laboratory measurement campaign was conducted within the ILMARI laboratory of the University of Eastern Finland using a Euro 6compliant gasoline vehicle (Skoda Octavia) and a Euro 5b diesel vehicle (Seat Alhambra) that were both equipped with 5 kW Termo Top Evo fuel-operated auxiliary heaters manufactured by Webasto. It should be noted that both measured AHs lacked emission aftertreatment devices such as particle filters and oxidation catalysts commonly used to reduce engine emissions of vehicles. However, a lack of aftertreatment devices is typical for commercially available AHs. The gasoline vehicle AH was operated on commercially available 95E10 fuel (EN228, 95 octane, max 10 % ethanol). For the diesel AH experiments, two different fuel types were used: a renewable diesel produced by hydrotreatment of waste oils and fats (Neste MY Diesel, EN15940) and more conventional fossil-based diesel (Futura, EN590). Tests were conducted indoors at approx. 25 °C on different days, giving the AHs sufficient time for cooling back to room temperature overnight after the previous experiment was finished.
The test procedure consisted of an approximately 20 min period of AH operation, during which the AH exhaust was sampled with on-line instrumentation to provide a time series of emissions. A partial flow of the exhaust was introduced to an environmental chamber (Sect. 2.1.3) simultaneously. When the AH running period was finished, the on-line instrumentation sampling point was switched from the exhaust pipe to the environmental chamber with a three-way valve. The complete setup of the laboratory experiments is illustrated in Fig. 1a.
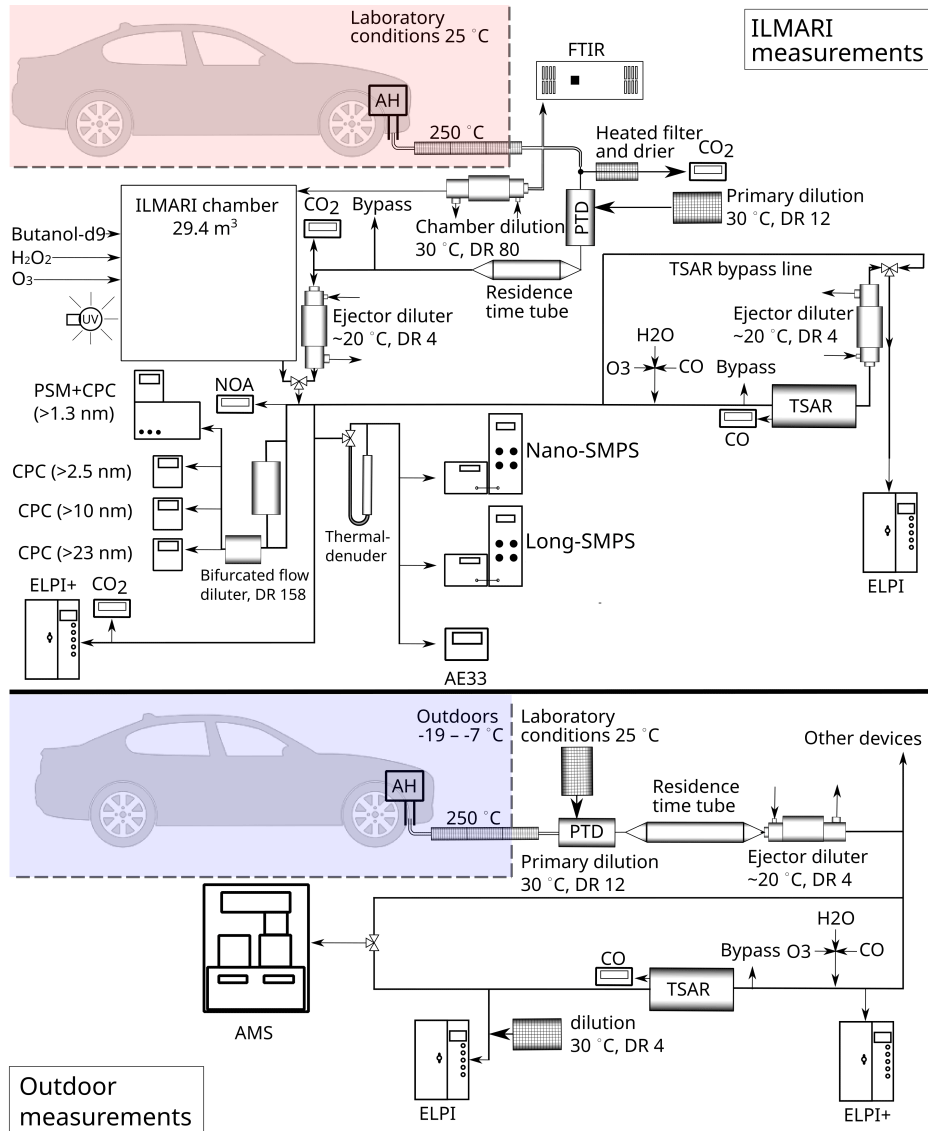
Figure 1Measurement setup in the ILMARI research environment and the outdoor research environment.
The exhaust was transferred with a heated line (250 °C), from which the sample was divided between the on-line instrumentation and the environmental chamber. The sample for on-line instrumentation was diluted and cooled down with a combination of a porous tube diluter (PTD) and an ejector diluter (ED). The air temperature of the PTD was controlled at 30 °C, and the dilution flow was adjusted to obtain a dilution ratio (DR) of 12. The PTD was followed by a residence time tube with a residence time of 2.5 s, after which the sample was further diluted with an ejector diluter. These parameters of the PTD have been shown to mimic the atmospheric dilution process well in a real-world driving situation (Keskinen and Rönkkö, 2010). An additional dilution step was also applied for a battery of condensation particle counters (CPCs) with a bifurcated flow diluter with a DR of 158 to avoid exceeding the upper detection limit of the single-count mode of the condensation particle counters.
A partial flow of the exhaust sample downstream of the PTD and the ejector was led through an OFR to provide time series of the secondary aerosol formation potential of the transient exhaust. The OFR operation is described in Sect. 2.1.3.
2.1.2 Photochemical processing in the chamber
The laboratory campaign utilized a 29 m3 Teflon fluorinated ethylene propylene (FEP) chamber (Leskinen et al., 2015) for tracing the atmospheric ageing process of AH emissions in well-characterized conditions. The chamber was surrounded by UV blacklights centred at a wavelength of 340 nm. The chamber had a moving top frame, intended to maintain slight constant overpressure to prevent sample dilution and contamination with air outside the chamber during an experiment. This controlled setting allowed the precise simulation and measurement of AH emissions, providing invaluable insights into emissions' behaviour, composition, and transformations during atmospheric processing.
Exhaust emission was sampled to the chamber throughout the AH operation and diluted by a factor of 80 prior to chamber input by a two-step dilution system consisting of a PTD and an ED. As the chamber had been pre-filled with clean air, the total DRs in the chamber were in the range of 640 to 720. After a stabilization and primary measurement period (30 to 35 min in total), O3 was injected to the chamber to oxidize NO to NO2 before initiation of the photochemical ageing. O3 concentrations in the chamber remained below 25 ppb after the NO2 conversion. After the NO oxidation, the UV lights were turned on and the chamber was operated in a batch mode for 180 to 280 min. In the diesel AH experiments and in one gasoline AH experiment, 0.5 mL of H2O2 in 30 % solution in water was evaporated into clean air and injected to the chamber as precursor for hydroxyl radicals (OH•) to guarantee an adequate degree of OH• exposure. Temperature in the chamber was 21 ± 1.2 °C and relative humidity was 59 ± 5.3 % during the AH ageing experiments.
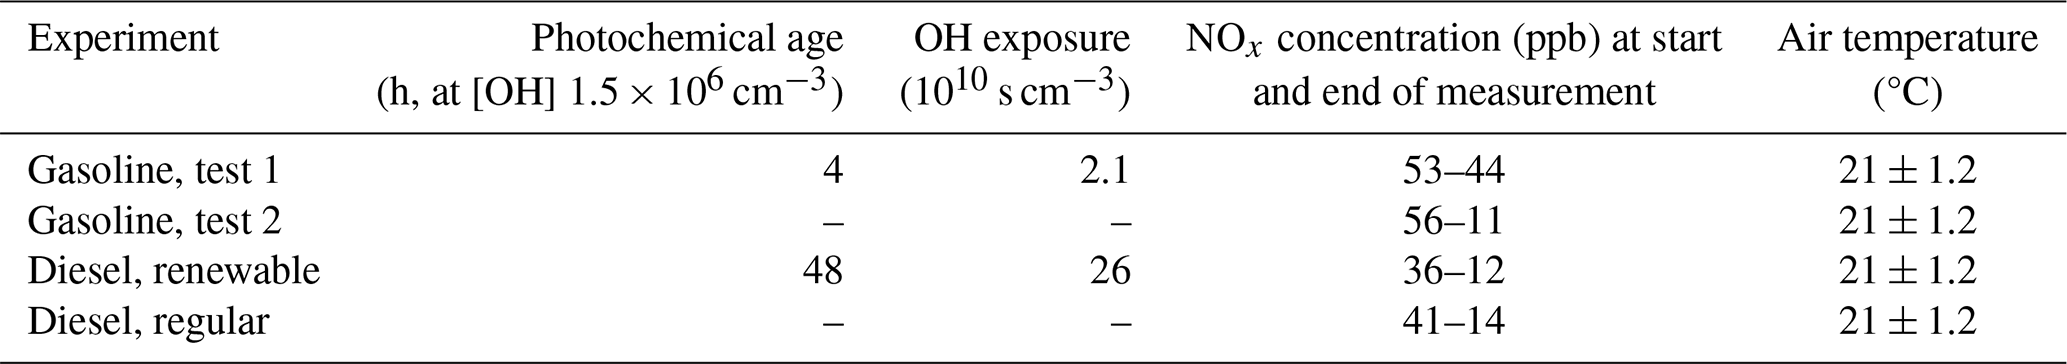
The photochemical age in the chamber was determined based on the decay in the reactive gases (Barmet et al., 2012). However, due to malfunctioning of the VOCUS-PTR used to estimate the OH exposure, the value for photochemical age is known only for a single gasoline and diesel experiment of the two conducted for each fuel type. For the gasoline AH experiment, the photochemical age in the chamber extended up to 0.2 atmospheric equivalent days at the average ambient OH concentration of 1.5 × 106 cm−3 (Fig. S1 in the Supplement). A notably higher exposure (up to 2 atmospheric equivalent days) was reached during the diesel vehicle experiment due to the notably lower amounts of reactive components that consume the OH in the chamber. Known ageing conditions in the chamber are provided in Table 1 for photochemical age, OH exposure, NOx concentrations at both the start and end of the ageing experiment, and chamber temperature.
Table 1Ageing chamber conditions for laboratory experiments. Photochemical age equivalent relative to 1.5×10⁶ molec. cm−3 OH concentration and the corresponding cumulative OH exposure. Also, NOx concentrations at start and end of the ageing process and the temperature of the chamber are included.
Particle wall losses in the chamber were estimated using the polydisperse particle loss rate previously measured for the chamber (Leskinen et al., 2015). Fates of the low-volatility organic compounds (LVOCs) in the chamber were assessed as in the studies by Palm et al. (2016) and Hartikainen et al. (2023). For the diesel experiment with the lowest condensation rate to particles, the LVOC loss rates to the chamber walls were estimated to be in the same range as their condensation rates to particles. For the gasoline experiments, in contrast, the role of the wall losses was minor due to the higher level of particulate condensation sink present (Fig. S2). Higher particulate condensation sink of gasoline experiments is due to higher initial PM concentrations in the chamber. Consequently, during gasoline experiments, the LVOCs are expected to have condensed on the particle surfaces within minutes. See Sect. S1 in the Supplement for detailed consideration of the chamber conditions.
2.1.3 Photochemical processing in the TSAR
The Tampere Secondary Aerosol Reactor (TSAR) (Simonen et al., 2017) facilitated the assessment of the secondary aerosol potential in AH exhausts in three different scenarios: (1) directly from the AH tailpipe during the sample input period, providing time-resolved secondary aerosol potentials for AH operation; (2) from the stabilized exhaust emission from the chamber, before the photochemical ageing, giving insights on the average potential in the exhaust; and (3) at the end of the chamber experiments (after 3–5 h), in order to obtain the unrealized secondary aerosol formation potential.
TSAR is an oxidative flow reactor (OFR) with UV lamps with an emission spectrum centred at 254 nm. It is optimized for monitoring the secondary aerosol potential in transient vehicle exhausts by having a near-laminar flow and relatively short residence time (40 s). The photochemical ages of TSAR-aged exhausts were assessed to be in the range of 4.5–6.8 atmospheric equivalent days, based on the decrease in CO concentration caused by TSAR when its UV lights were turned on. The TSAR was also used in the outdoor campaign (Sect. 2.2) with the same settings.
2.1.4 Instrumentation and measurements
The measurement instrumentation for the laboratory campaign aimed to capture various aspects of the emitted aerosols' characteristics, including both the particulate and gaseous phases. Gaseous pollutants, including CO2, CO, and a range of volatile organic compounds (Table S1 in the Supplement), in the directly emitted exhaust aerosol were measured by a Fourier-transform infrared (FTIR) spectrometer (Gasmet Technologies, Inc.). The concentrations of the sample total organic gaseous compounds (OGCs) were calculated from the measured organic subspecies of methane, alkane, unsaturated HCs, aromatic HCs, oxygenated HCs, and oxygenated aromatic HC groups. The OGC concentration (in ppmC) was calculated by weighing the concentrations of individual species by their respective number of carbon atoms per molecule. The NOx concentrations were measured with a chemiluminescence-based analyser (Model T200; Teledyne Instruments, Inc.). A VOCUS-PTR (Aerodyne, Model 2R) was used for the validation of the photochemical ageing of chamber experiments.
Particle number and size distributions were measured by two scanning mobility particle sizer (SMPS) systems, covering size ranges of 8.2 to 346 nm (“long-SMPS”; TSI DMA 3071, TSI CPC 3775) and 3.5 to 64 nm (“nano-SMPS”; TSI DMA 3085, TSI CPC 3776). The particle size distributions (PSDs) measured by the two instruments were combined by calculating the weighted mean for the size bins covered by both instruments (8.2 to 64 nm). Weighting coefficients were obtained from a cubic fit from 1 to 0, with results from nano-SMPS emphasized for the small end of overlapping PSDs, with an initial weight of 1 for an 8.2 nm size bin, and results from long-SMPS emphasized for the large end of PSDs. Geometric mean diameters (GMDs) were calculated from the combined PSDs. It should be noted that the SMPSs were operated on a time resolution of 3 min per scan over the whole PSD. The rapid changes that occurred within roughly 1–2 min during the initial ignition and shutdown phases of the AH heating cycle were thus not fully captured by the SMPSs. Furthermore, since the SMPSs scanned the particle size bins from smallest to largest, there is a misalignment in the true underlying PSD and the one measured with SMPSs, as there is over 1 min of time difference between first and last size bin measured during scan.
A condensation particle counter (CPC) battery, consisting of four CPCs with different cut-off particle diameters, was employed to determine particle number concentrations with information on particle size distributions. The numbers of particles above the mobility diameters of 23, 10, and 2.5 nm were measured by Airmodus A23, Airmodus A20, and TSI 3756, respectively, whereas the total number of particles larger than 1.3 nm was monitored by a Particle Size Magnifier (PSM; Airmodus) coupled with the Airmodus A20 CPC. The same CPC battery was also used in the outdoor measurement campaign. However, it should firstly be noted that differences in sampling systems used affect the effective cut-off diameters of CPCs, with effective cut-off diameter defined here as the particle diameter of which 50 % is detected after sampling line losses are accounted for. Effective cut-off diameters for CPCs are presented for both campaigns in Fig. S7, and, based on this, we note that, for CPCs with cut-off diameters of 1.3, 10, and 22 nm, effective cut-off diameters match well for both campaigns and are thus comparable. However, for the CPC with a cut-off diameter of 2.2 nm, the difference in effective cut-offs is significant, with it being 3.7 and 6.3 nm in outdoor measurements and laboratory measurements, respectively, due to which we present a comparison of PN values from that CPC in Table 3 but exclude it from further emission factor (EF) analysis.
An aethalometer (AE33, Aerosol Magee Scientific) was used to measure the equivalent black carbon (eBC) mass concentrations and the wavelength dependency of light absorbance. eBC was quantified from the optical attenuation of light at 880 nm assuming a mass absorbance cross-section of 7.77 m2 g−1 and the instrument's standard multiple-scattering correction factor of 1.39. Absorption Ångström exponents (AAEs) were calculated from the absorption of light at wavelengths of 470 and 950 nm.
Two electrical low-pressure impactors (ELPIs; Dekati) were utilized to determine the mass concentrations of fresh and aged exhaust. An ELPI+ (Järvinen et al., 2014) measured the concentration upstream of the TSAR, which was sampling either from the Teflon chamber or diluted exhaust. Furthermore, an ELPI (Keskinen et al., 1992) measured the concentration downstream of the TSAR. The ELPI was equipped with a filter stage (Marjamäki et al., 2002) and an additional impactor stage (Yli-Ojanperä et al., 2010) so that its size bins matched the ELPI+ as closely as possible. The small particles generated in the TSAR caused difficulties when inverting the measured current distribution into mass size distribution. A fraction of the small particles deposited onto the impactor stages representing larger particles due to diffusion (Virtanen et al., 2001). Thus, the inversion required special treatment, which is described in Sect. S2.
2.2 Outdoor measurement campaign
The outdoor measurement campaign was built upon the experiments outlined in the study by Oikarinen et al. (2022). The objective was to capture AH emissions under real-world conditions, providing crucial data for assessing emissions in natural environments. The campaign incorporated the TSAR for the photochemical ageing of the exhaust.
2.2.1 Test vehicles
Information about the vehicles, their AHs, and the measurement setup is presented in the study by Oikarinen et al. (2022). The test matrix included six vehicles in total, three of which were operated with gasoline and three of which were operated with diesel. However, here we focus on the same two vehicles, Skoda Octavia and SEAT Alhambra, that were also used in the laboratory campaign. The gasoline fuels used were of the 95E10 grade, and the diesel fuels met the EN 590 standard. The AHs used the same fuel as the vehicles they were installed in.
2.2.2 Environmental conditions, sampling strategy, and instrumentation
The tests were conducted within 4 consecutive days under Finnish winter conditions (−19 to −7 °C), and each AH was measured four times. The measurement protocol included an overnight cooling period of at least 18 h, after which the vehicle was driven from the nearby parking slot to the sampling location (both outdoors, open air). This transfer was kept as brief as possible (less than 20 s) to prevent excessive engine heating and automatic starting of the AH typically occurring after roughly 1 min of driving.
After the sampling line was attached to the exhaust pipe of the AH, the heater was turned on and left to run for about 30 min. Both the total run time and the general operation pattern of the AHs varied between the vehicles. Gasoline AH ran steadily for the predetermined heating time until manual shutdown, whereas diesel AH sometimes switched to half power for few minutes during the end of preheating due to the heater reaching its nominal target temperature of 67 °C. Parameters describing the operation of the heater were recorded using onboard diagnostics.
The outdoor campaign employed a partial sampling strategy to directly capture emissions from vehicles equipped with AHs. The collected emissions were analysed for PM and PN concentration, gaseous pollutants, and black carbon content. The inclusion of a TSAR allowed the investigation of emissions' secondary aerosol formation potential and ageing effects on the chemical composition of particles. The photochemical age in TSAR was in the range of 4.6–5.9 d, based on a decrease in CO concentrations inside TSAR when the UV lights were turned on.
2.2.3 Chemical composition analysis
The chemical composition of the emissions was measured using the Soot Particle Aerosol Mass Spectrometer (SP-AMS; Aerodyne Inc.; Onasch et al., 2012), with which half of the measurements were measured with the TSAR (aged exhaust) and half were measured without the TSAR (fresh). The SP-AMS analysis provided critical insights into the chemical composition of emitted particles, enhancing the understanding of the potential environmental impacts of AH emissions. The SP-AMS is based on the high-resolution time-of-flight aerosol mass spectrometer (HR-ToF-AMS; DeCarlo et al., 2006) with an SP module for detecting refractory species, including refractory black carbon (rBC) and some metals. The transmission efficiency for particles in the size range of 50 to 1000 nm is reasonable, while smaller and larger particles can be lost in the aerodynamic lens (Liu et al., 2007). A rotating chopper can be operated in open, closed, or particle time-of-flight (PToF) position, allowing particles to pass through it, not allowing them to pass, or allowing them to pass periodically, respectively. This is used for determination of the background signal and for size-resolved composition analysis of the particles. The sample is vaporized using a tungsten vaporizer (600 °C) and an Nd:YAG laser vaporizer (1064 nm) and ionized with 70 eV electron ionization (DeCarlo et al., 2006).
The data analysis was performed in PIKA (v.1.25) and SQUIRREL (v.1.65) using Igor Pro 9 (Wavemetrics Inc.). The ionization efficiency (IE) and relative ionization efficiency for black carbon (RIEBC) were measured using methods described by Onasch et al. (2012) and have been applied to the data. Composition-dependent collection efficiencies (CDCEs) have also been calculated and applied to the data (Middlebrook et al., 2012). To simplify the analysis of the hundreds of observed compounds, the results are divided into families of ammonium, chloride, nitrate, organic matter, refractory BC, and sulfates.
A flame ionization detector (FID; Mocon Baseline 9000) was used for quantification of total gaseous hydrocarbon (THC) content. It should be noted that THCs measured with an FID in the outdoor campaign and OGCs from an FTIR spectrometer in the laboratory campaign are both approximations of the true gaseous organic content of exhausts due to the FID's low sensitivity to oxygenated HCs and formaldehyde and due to the FTIR spectrometer not exhaustively detecting all gaseous organic species. Nevertheless, a review of studies comparing HC content measured by the FTIR spectrometer to that measured by the FID for vehicle exhaust found out that differences typically fall within the 15 % range but that underestimation by 50 % and overestimation of up to 34 % have also been reported (Giechaskiel and Clairotte, 2021).
2.3 Emission factor calculations
Emission factors (EFs) of AHs were calculated (1) over the whole 30 min heating cycle (EF30 min), (2) per 1 min of stable operation by excluding the ignition and shutdown parts of the heating cycle (EFmin), (3) per kg of fuel consumed during the 30 min heating cycle (EFfuel), and (4) as a fraction of total emissions produced during ignition and shutdown spikes for both outdoor and laboratory measurement campaigns. EFs were calculated using the integral method outlined in (Oikarinen et al., 2022). Total emission E is calculated with Eq. (1):
where [x] (kg or particle per cubic metre) is the measured concentration of substance, t (h) is the duration of the heating cycle, K (L h−1) is the fuel consumption rate of AH, ρ is the density of the fuel (0.740 kg L−1 for gasoline and 0.805 kg L−1 for diesel), mC,fuel m is the carbon mass fraction of fuel, and is the ratio of mass increase when carbon in fuel is transformed into CO2 and released in combustion. From the total emission E, the emission factor relative to fuel consumption was calculated with the simple division of E by the mass of consumed fuel. EFs relative to a heating time of either 30 or 1 min are simply the total emission E for the respective duration of AH heating. EFmin was calculated by excluding ignition and shutdown phases from the time series of the measurement and calculating the mean EF for 1 min of emissions.
The fraction of total emissions produced during ignition and shutdown was further calculated by comparing E over only ignition and shutdown phases. Ignition and shutdown phases are defined here as the time it takes CO2 to change from a background level to stable operating levels for the ignition phase and vice versa for the shutdown phase. For AHs used in these measurements, the ignition and shutdown phases correspond approximately to the first 2.5 min and last 2 min of AH operation, respectively.
EFs from these two campaigns are compared to detect how operating temperature affects the emission profile of the AH during operation. For the laboratory measurements, EFs of exhaust sample aged with the ILMARI chamber are also calculated to account for the effects of secondary aerosol formation.
Fresh particle emissions were compared to aged emissions in both outdoor and laboratory measurements. Fresh emission factors were calculated either directly from emissions during the AH heating cycle or from concentration in the chamber at the beginning of the 4 h ageing process. Aged emission factors were calculated by multiplying fresh EFs by the ratio of (TSAR- and/or chamber-) aged emission concentrations to fresh concentrations measured from the environmental chamber, an example of which is provided in Fig. S10.
It should be noted that emission factors were calculated based on the assumption that fuel consumption and exhaust airflow are constant, as neither was measured in real time. These assumptions systematically overestimate the contribution of both ignition and shutdown emission spikes to EFs of a single preheating cycle. During ignition, it takes a while for the airflow out of the AH to stabilize. During the shutdown phase, after fuel consumption has ended, the airflow out of the AH decreases, while concentrations of exhaust emissions increase, as can be seen in Figs. 2–6. Thus, when we convert concentrations to EFs, we overestimate these emission spikes due to an overestimation of the exhaust flow.
3.1 Gaseous emissions
3.1.1 Carbon dioxide emissions and implications on emission factors
Temporal variation in CO2 concentrations presented in Fig. 2 showed a steep increase during roughly the first 2.5 min from ignition, constant concentrations during the stable operating period, and a steep decrease lasting roughly 2 min during the shutdown phase. This behaviour was, in general, similar in both laboratory and outdoor measurements. In one of the outdoor experiments, the AH switched to half power near the end of operation after a sufficiently high coolant temperature had been reached, causing a clear decrease in CO2 concentrations Fig. 2d.
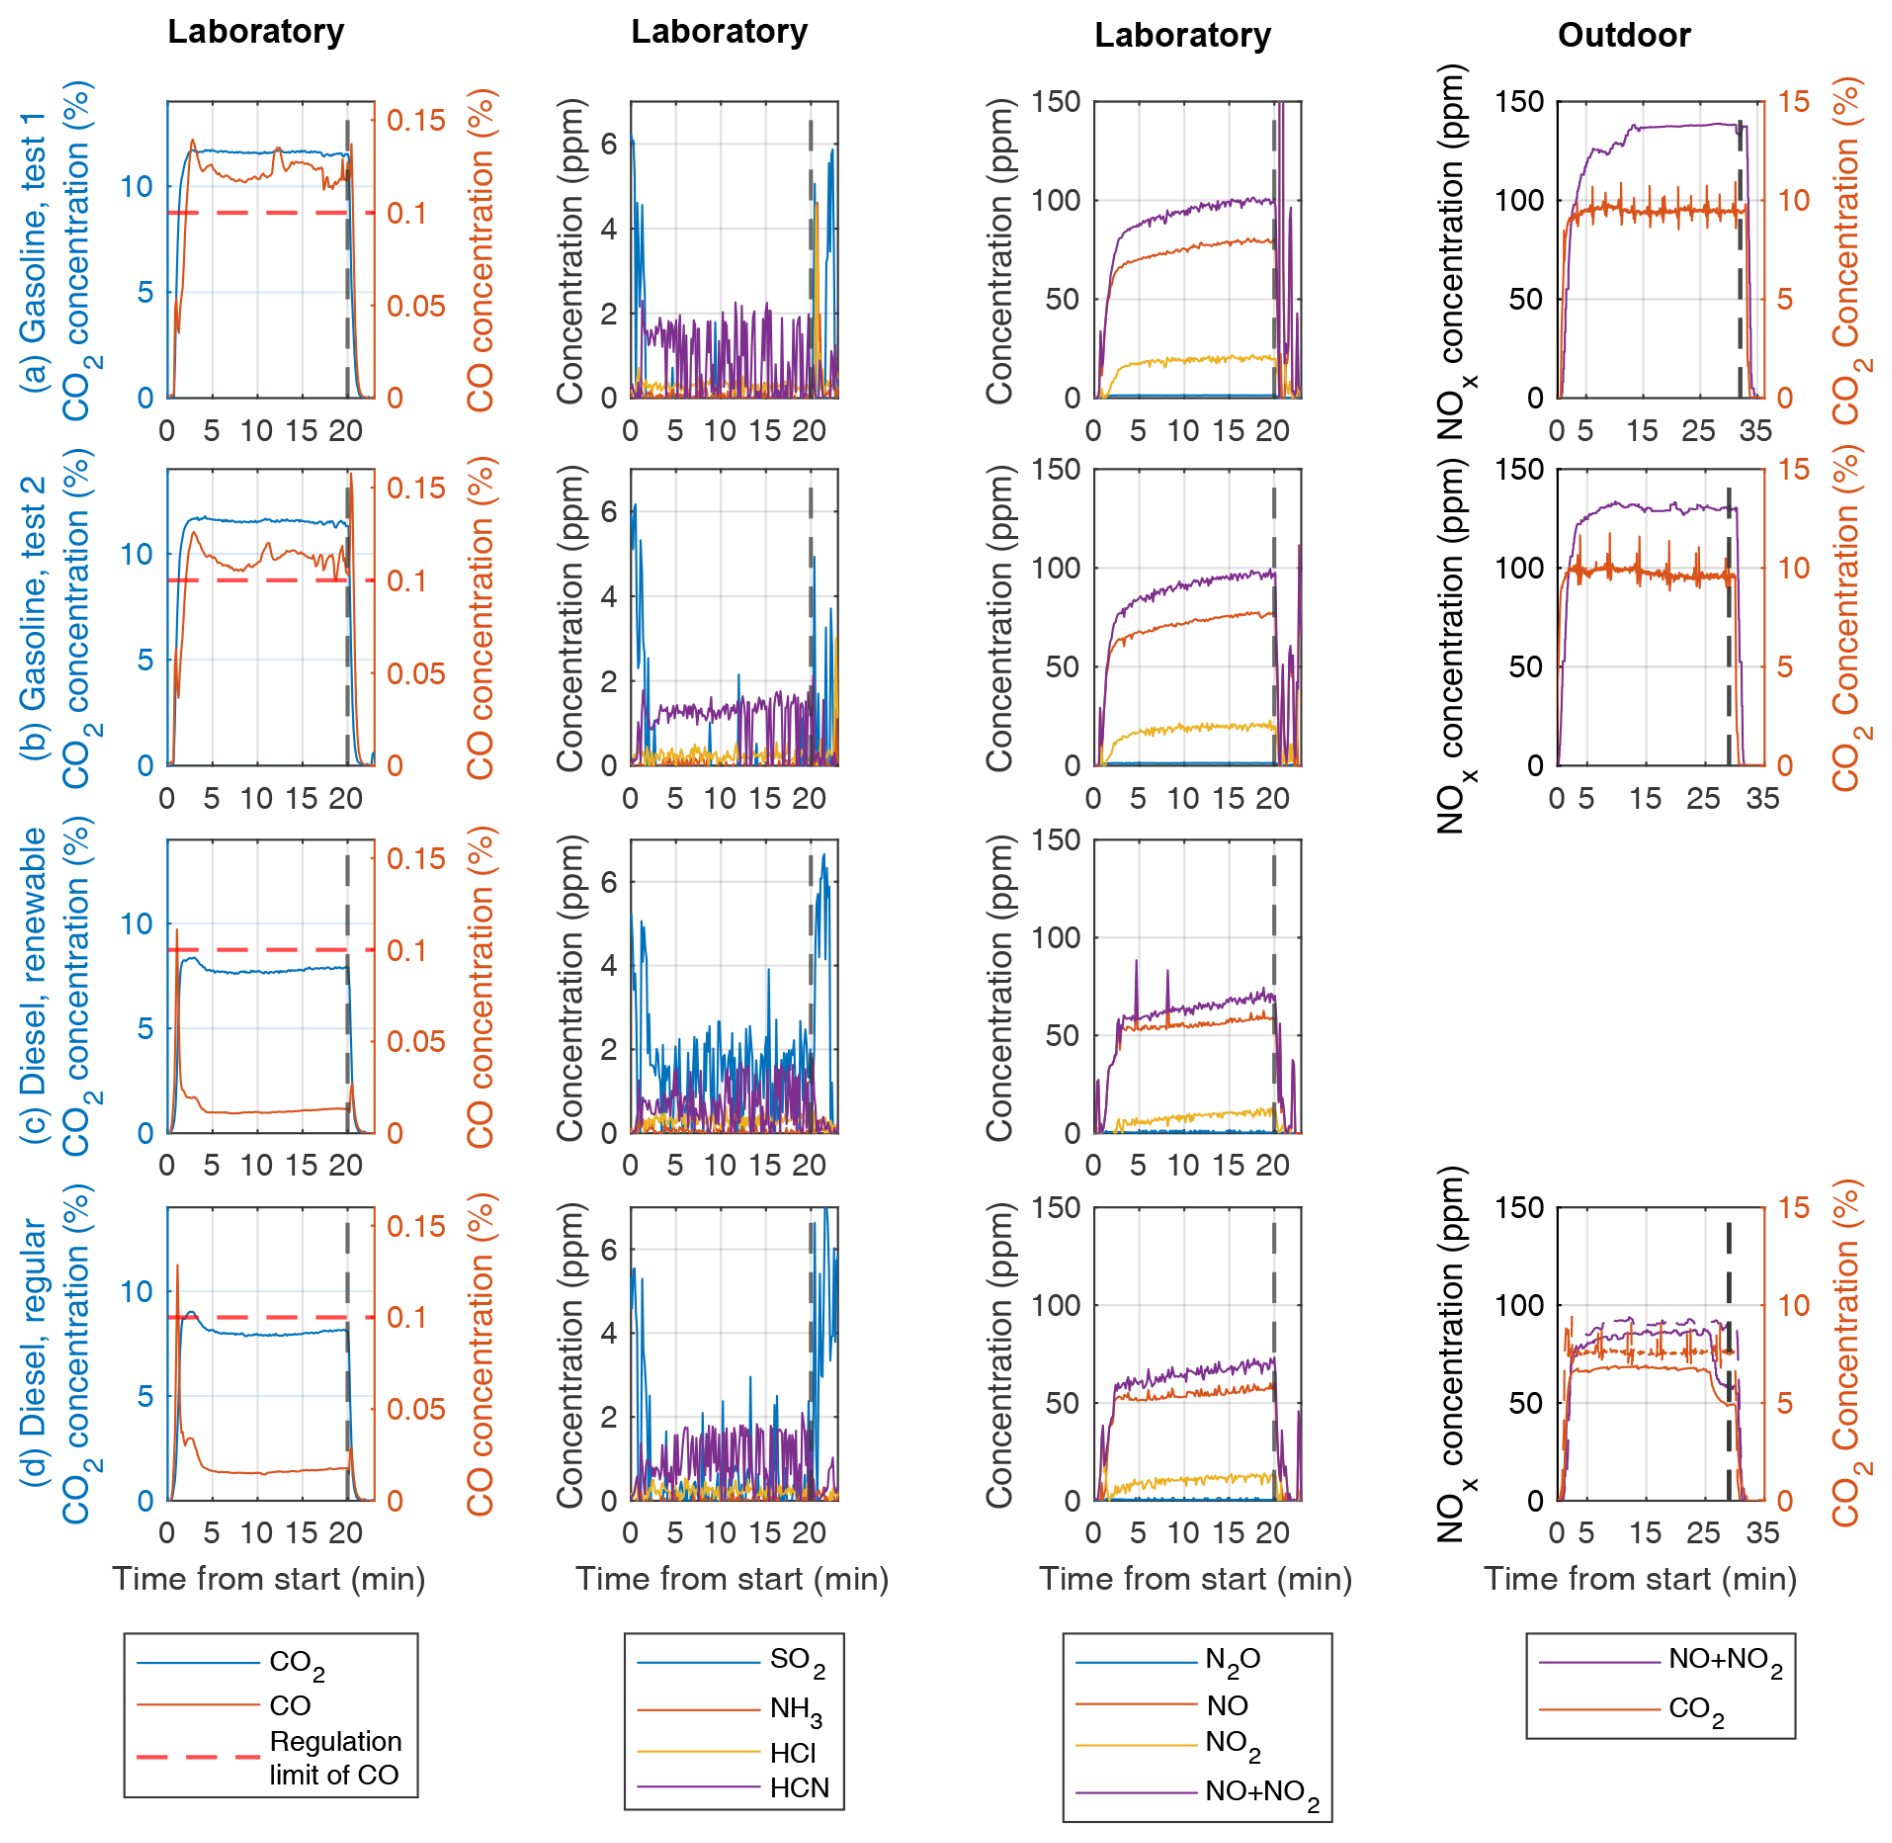
Figure 2Concentrations of inorganic gaseous substances measured by an FTIR spectrometer in the laboratory measurements from the raw exhaust gas and with an FID for outdoor NO+NO2 for (a–b) gasoline experiments, (c) renewable diesel, and (d) regular diesel. Shutdown of the AH at the end of the preheating cycle is indicated with the vertical dashed black lines, and for CO regulation, the limit of 1000 ppm is marked with horizontal dashed red lines.
The mean exhaust CO2 concentrations were different in laboratory and outdoor conditions, with 21 % and 37 % higher concentrations under laboratory conditions for gasoline AHs and diesel AHs, respectively. This indicates variation in the air–fuel ratio (AFR) of combustion, likely caused by temperature dependency on the amount of combustion air injected into combustion chamber of AH. Since assuming a constant volumetric flow of air into the combustion chamber, the mass flow of air was greater by a factor of 1.12–1.17 in sub-zero outdoor conditions (when 25 °C indoor air is compared to −7 or −19 °C outdoor air), leading to a higher AFR, which explains most of the difference in CO2 concentrations in exhaust gas in cold outdoor operating conditions. Another explanation for the varying CO2 concentrations would be variation in fuel consumption rate, which was not directly measured for these experiments. However, the fuel consumption of AHs was estimated to be constant irrespective of the temperature outside the vehicle in a separate set of experiments (results not shown here). For laboratory measurements, changes in chemical composition in renewable diesel compared to regular diesel might also have caused a slight decrease in CO2 concentrations due to renewable diesel containing a larger fraction of aliphatic hydrocarbons, which, under ideal stoichiometric conditions, is expected to produce lower CO2 concentration to exhaust.
The differences in CO2 concentrations between the campaigns also directly impacted the ratios of EFs to exhaust concentrations. As change in the AFR affects both [CO2] and [x], calculated EFs are not as affected by the changes in AFR as concentrations are. Due to this, even if an almost equal concentration for [x] is observed between measurement campaigns, it does not result in equal EFs.
3.1.2 Inorganic gaseous emissions
Time series of inorganic gaseous emissions are presented in Fig. 2 for CO2 and NOx emissions from both measurement campaigns and additionally for carbon monoxide (CO), sulfur dioxide (SO2), ammonia (NH3), hydrogen chloride (HCI), and hydrogen cyanide (HCN) emissions for the laboratory campaign where FTIR spectroscopy data were available. For these gaseous emissions, mean concentrations, EFs, and spike fractions of total emissions are presented in Table 2, with spike fraction defined as the fraction of total emissions produced during the ignition and shutdown periods. Carbonyl sulfide (COS) and hydrogen fluoride (HF) emissions were also measured during the laboratory campaign and found to be below detectable levels for all AH tests and are thus omitted from Table 2 and Fig. 2.
Table 2Mean concentrations, emission factors per kg of consumed fuel, emission factors for the whole 30 min cycle, emission factors for 1 min of stable operation, and the fraction of emissions emitted during the spike periods (ignition and shutdown) for the gaseous emission, with standard deviations of respective values inside parentheses. The number of measured heating cycles was used to calculate the means, and the standard deviation was 4 for outdoor measurements and 2 for laboratory measurements for both gasoline and diesel AHs. Measurements for which measured values were below the device detection limit are marked with BD, whereas “–” indicates data not being available.
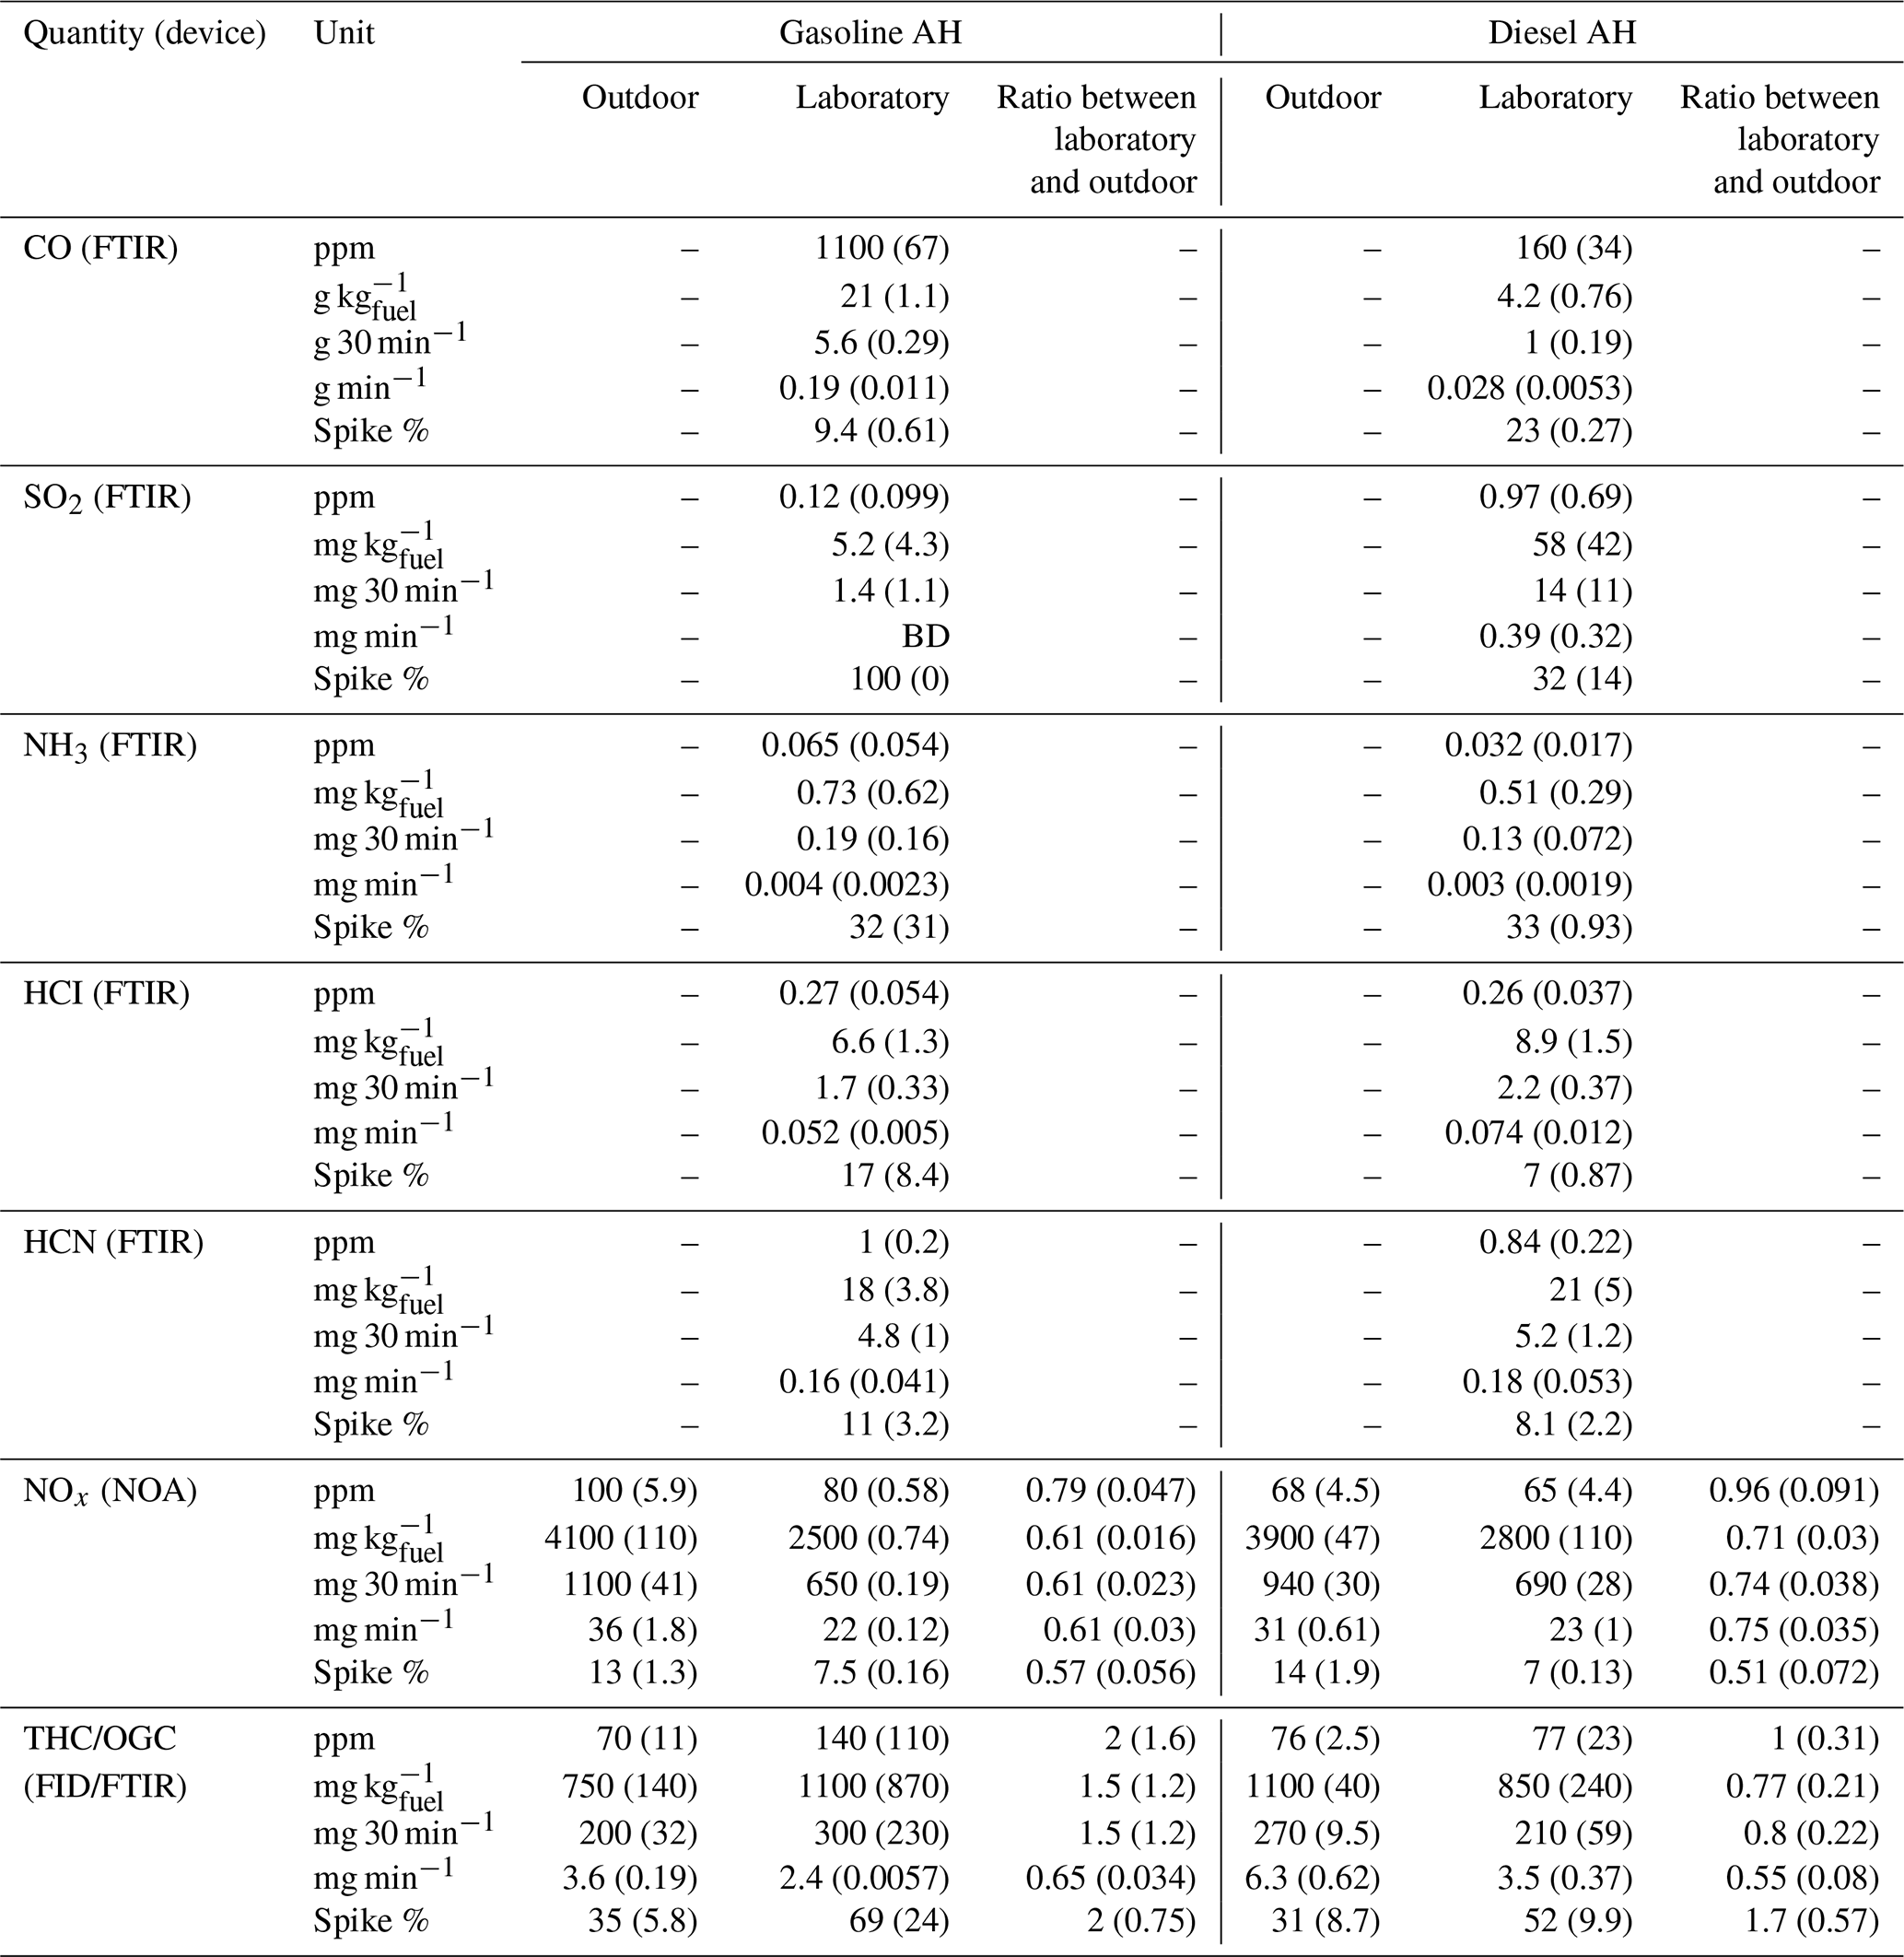
For gasoline AHs (Fig. 2a–b), CO emissions exceeded the regulation limit of 0.1 % for most of the preheating cycle. For the diesel AHs, CO emissions remained below the regulation limit after a brief exceedance during the ignition spike (Fig. 2c–d). EFfuel values for CO showed clear differences between fuel types, with gasoline and diesel AHs producing on average 21 and 4.2 g CO kg, respectively (Table 2). If CO emissions of AHs are compared against driving emissions of cars, with the estimated mean EU fleet EFfuel values for road transport being 48.36 g kg for gasoline and 2.41 g kg for diesel, then gasoline AH produces more CO than road transport and diesel AH produces less CO. If CO emissions of AHs are instead measured against newer Euro 5 compatible vehicles with an estimated mean EFfuel values of 8.60 g kg for gasoline and 0.52 g kg for diesel, then AH emissions are significantly higher than emissions of newer vehicles for both gasoline and diesel (Ntziachristos et al., 2024).
SO2 emissions of gasoline AH were almost exclusively released at ignition and shutdown, with only short bursts of SO2 detected during the stable operating period (Fig. 2a–c). The diesel AH operated with regular diesel produced SO2 similarly to the gasoline AH (Fig. 2d). Instead, when using renewable diesel, the concentration of SO2 was detectable during the whole preheating cycle. This is also reflected in the SO2 EFfuel values, where diesel produced 1 order of magnitude more SO2 emissions on average, with 5.2 and 58 mg of SO2 per kilogram of fuel for gasoline and diesel, respectively.
SO2 emissions from AHs are not directly regulated, but the European Union has regulations limiting the maximum sulfur content of commercial fuels used in road vehicles to 10 mg kg (European Union, 1998). Assuming that all detected SO2 originates solely from the combustion of sulfur present in the fuel, the EFfuel of SO2 can be used to estimate the sulfur content of the fuel. The fuel sulfur contents corresponding to gasoline and diesel AH measurements would be 2.6 and 29 mg kg, respectively, which would be well below the regulation limit for gasoline but above the limit for diesel. Of the two types of diesel fuel measured, the renewable diesel had higher SO2 emissions, with corresponding estimates for fuel sulfur contents being 44 and 14 mg kg for renewable and regular diesel, respectively. Even for more conservative estimates, where the EFfuel of SO2 is calculated only from stable operation period emissions, the sulfur content of the diesel fuel would still be 24 mg kg−1 on average, with regular diesel specifically having 10 mg kg and renewable diesel having a higher estimated content of 37 mg kg. Fuel sulfur contents higher than the 10 mg kg allowed by regulation have also been observed for similar renewable diesel to that used in this study based on chemical characterization of the fuel, where a fuel sulfur content of 11 mg kg reported (Karjalainen et al., 2019). Therefore, similar renewable diesel to that used in this study having a sulfur content higher than the regulation limit is not unprecedented.
HCl concentrations of 0.27 and 0.26 ppm were measured for gasoline and diesel AHs, respectively, with corresponding EFfuel values of 6.6 and 8.9 mg kg. HCl was mostly released evenly during the whole heating cycle, with spikes in gasoline AH only detected during shutdown. Possible sources of HCl emissions from AHs could be trace amounts of chlorine in fuel left over from crude oil used to refine fuels or due to contamination of the fuel with chlorine-based cleaning agents used to clean fuel tanks of gas stations or tanks used to transport the fuel from the refinery to the gas station (La Battaglia et al., 2025).
NH3 emissions of gasoline and diesel AHs lacked detectable ignition spikes, with most of the emissions produced at a steady rate during the whole preheating cycle. Further notable shutdown spikes in NH3 were detected for gasoline AH. Mean NH3 EFfuel values were 0.73 and 0.51 g kg for gasoline and diesel, respectively. Compared against driving emissions, these EFfuel values are significantly lower than even the lower estimate of Euro 5 compatible EU vehicle fleet mean EFfuel values: 20 and 10 g kg for gasoline and diesel, respectively (Ntziachristos et al., 2024).
The NOx emissions were stable for almost all measurements and stayed below the regulation limit of 200 ppm. A slight increasing trend in NOx concentrations during the preheating cycle was observed. The NOx emissions lacked the distinctive ignition and shutdown spikes observed for other measured pollutants, except for the first gasoline AH measurement, where the NO2 concentration momentarily exceeded 5000 ppm at shutdown. This is, however, acceptable according to regulations, since the spike did not occur under stable flame conditions but coincided with a decreasing CO2 concentration typical for the shutdown period. The NOx EFs for both gasoline and diesel AHs were smaller by roughly one-third under laboratory conditions compared to outdoor conditions (Table 2). Observed temperature dependency of NOx emissions from AHs is consistent with studies of temperature dependency of vehicle NOx emissions, where both warm initial vehicle temperatures before driving (Olin et al., 2023) and warm outdoor temperatures (Wærsted et al., 2022) have been observed to correlate with lower NOx emissions when compared to cold temperatures.
3.1.3 Organic gaseous emissions
The concentrations of THCs (outdoor) or OGCs (laboratory) remained well within the regulation limit of 100 ppm during the stable period of AH operation, although this limit was exceeded during the ignition phase and especially during the shutdown phase for nearly all test cases (Fig. 2). On average, the measured THC and OGC concentrations were similar for diesel AHs in outdoor and indoor conditions, with the main differences being the temporal distribution of emissions during the preheating cycle. Compared to the outdoor measurements, the laboratory experiments produced higher concentrations of organic gases during ignition and shutdown, but stable operating period concentrations were lower. The gasoline AH produced twice the THC or OGC concentrations of the diesel AH on average, in both measurement campaigns. The temporal distribution was similar for all cases, with the shutdown spike in gasoline test 1 in Fig. 3b being a major outlier, with a shutdown spike concentration 1 order of magnitude higher when compared to gasoline test 2. When outdoor emission factors for THCs are compared against OGC emission factors in the laboratory, as presented in Table 2, they show a relative increase by a factor of 1.5 for gasoline and a decrease by factor of 0.77 for diesel. Based on these results and known uncertainties between the FID-measured THCs and FTIR-spectrometer-measured OGCs, it cannot clearly be concluded if the operating temperature significantly affects the organic gaseous emissions of AHs if the most extreme estimates for FTIR-spectrometer-measured OGC and FID-measured THC differences are used, especially when large variations in spike concentrations are also a major source of uncertainty.
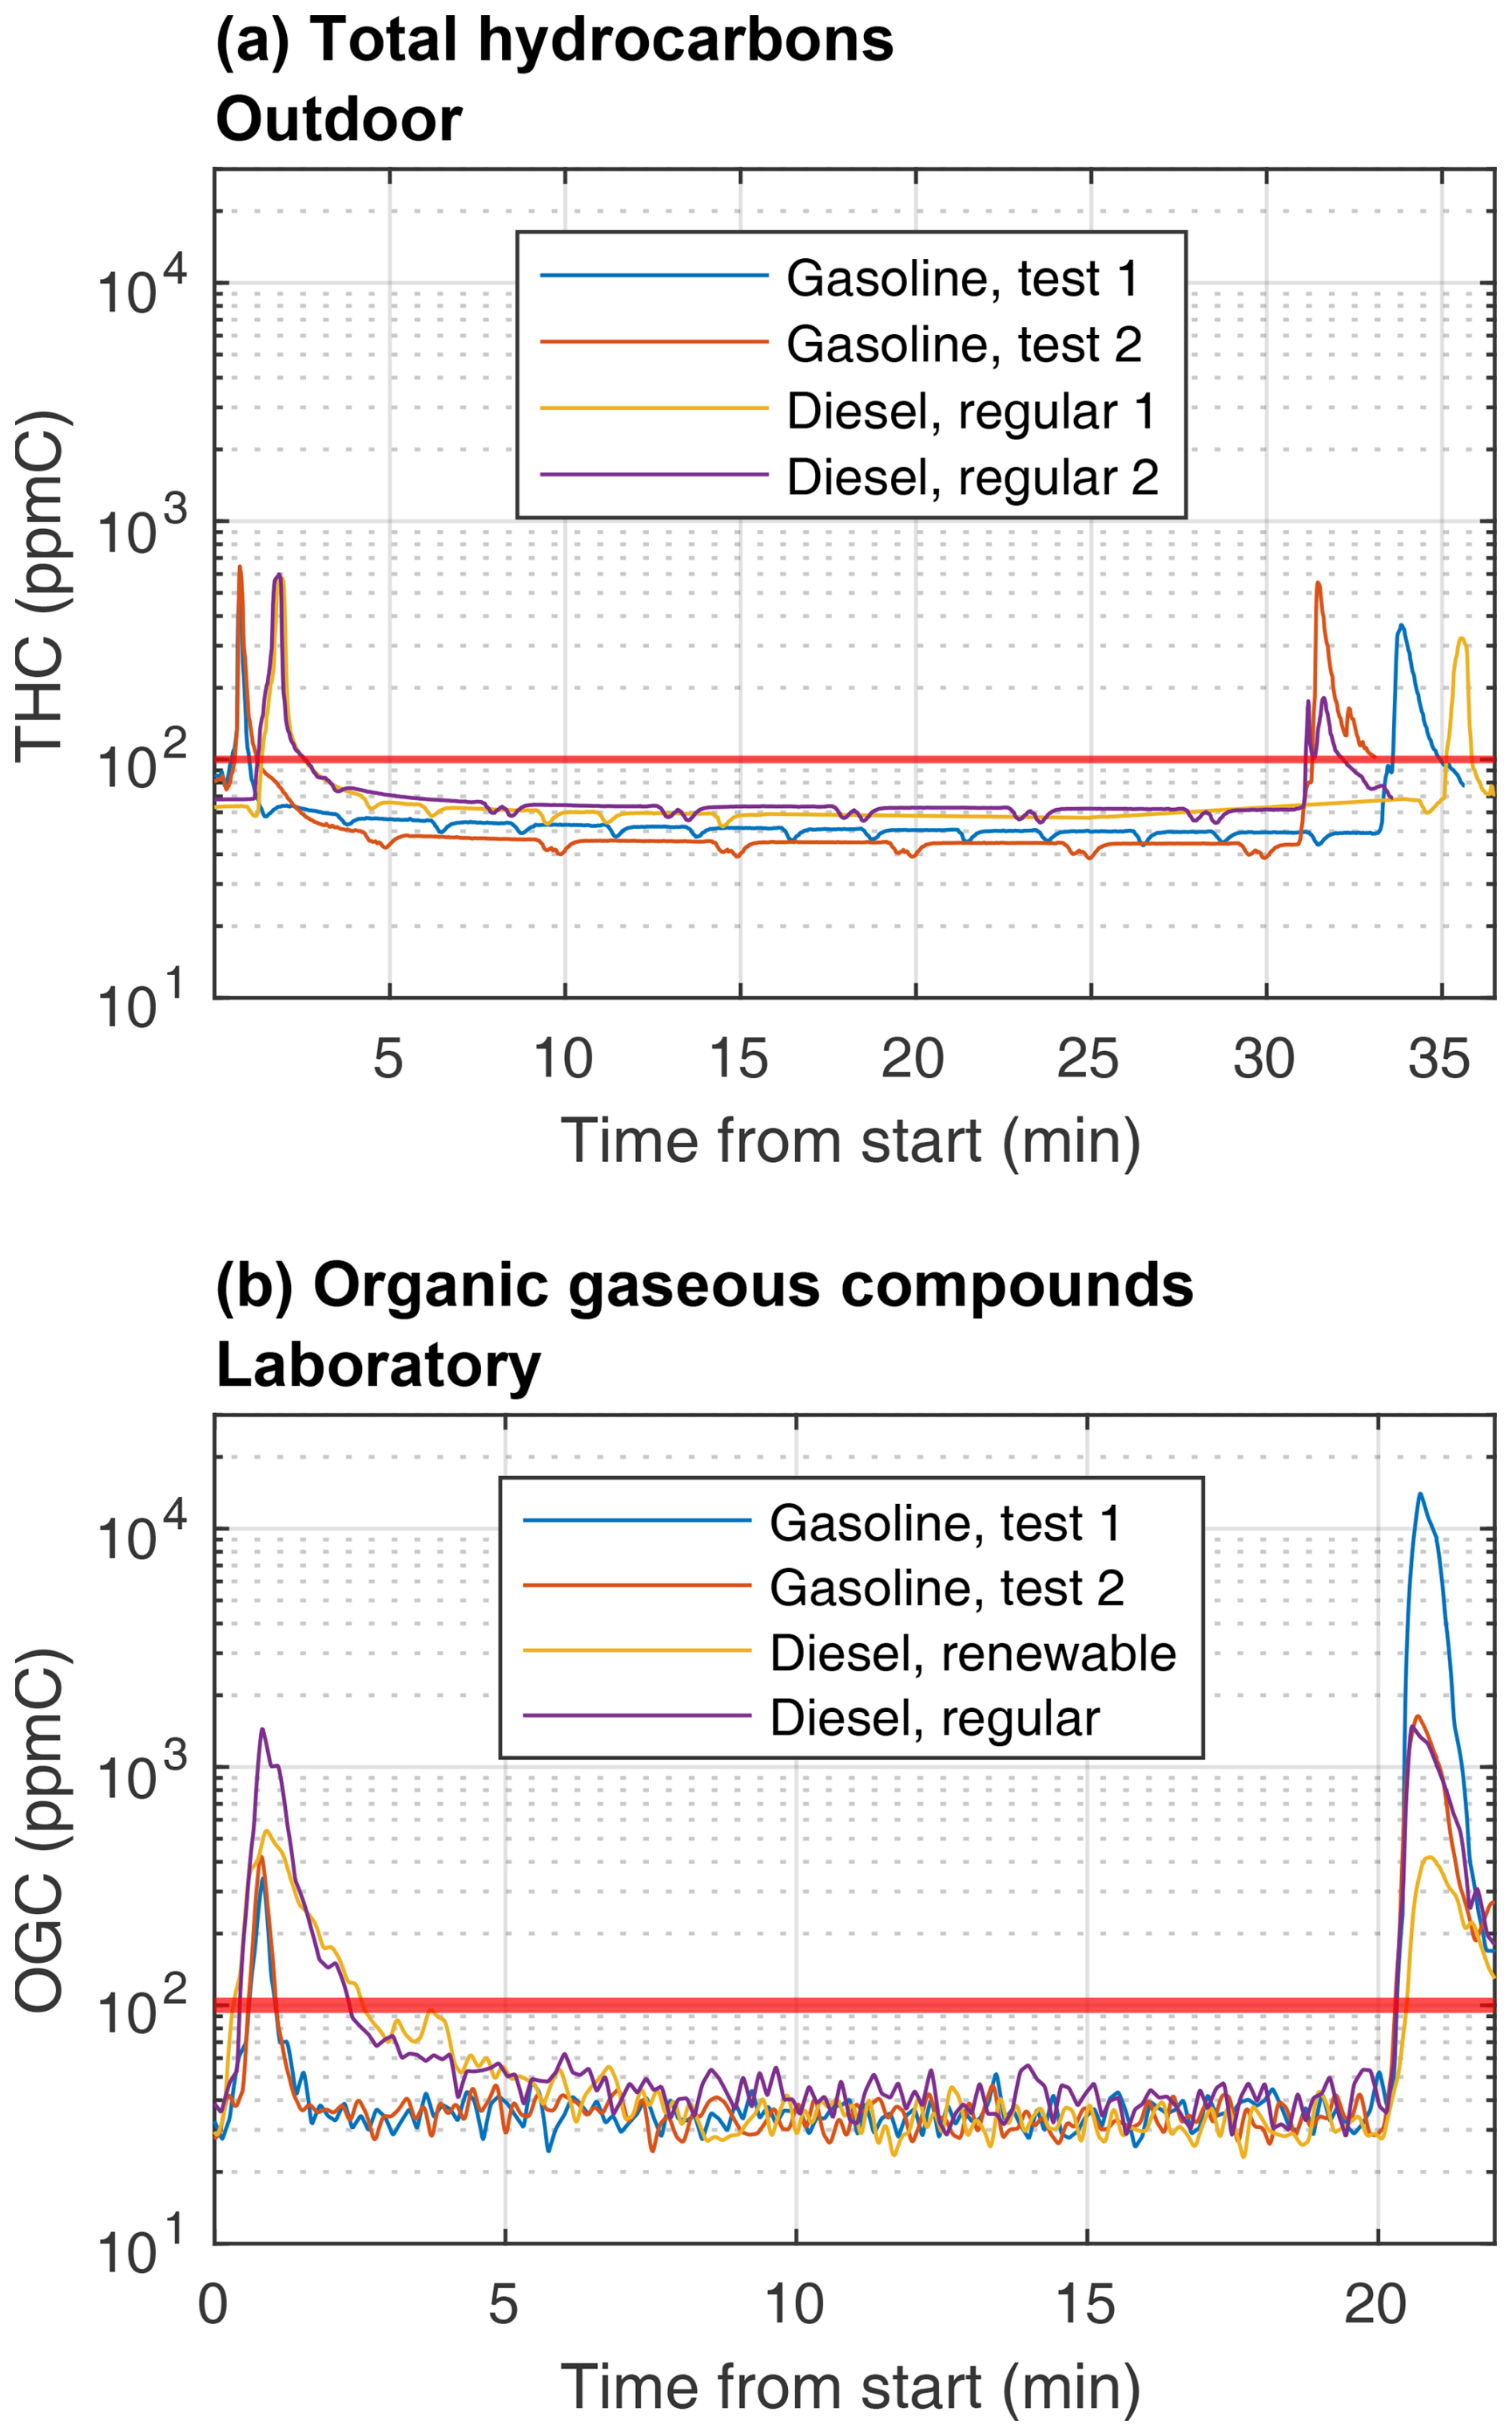
Figure 3Total gaseous hydrocarbon (THC) or organic gaseous compound (OGC) concentrations in the AH exhausts directly measured (a) by an FID for the outdoor measurements and (b) by an FTIR spectrometer for the laboratory measurements. The regulation limit of 100 ppmC for gaseous hydrocarbons is illustrated with the red horizontal line.
Chemical compositions of the OGCs from the indoor measurements are presented in Fig. S5. During the stable period, the unsaturated HCs were the most abundant component of the OGC emissions. The concentration of unsaturated hydrocarbons increased little during ignition and shutdown, when compared to alkane, aromatic, and oxygenated HCs, which consequently dominated the organic gaseous emissions of the gasoline during ignition and shutdown periods. For diesel AH, alkanes, aromatic hydrocarbons, and unsaturated hydrocarbons had similar concentrations during the stable period, and, during the shutdown spike, oxygenated HCs overtook unsaturated ones.
Renewable diesel was observed to reduce the overall levels of OGCs by 38 % compared to regular diesel. The type of diesel fuel used seems to also affect composition during the ignition phase, with aromatic HCs replacing alkanes as the second most common HCs when regular diesel is used when compared to renewable diesel. The observed lower OGC emissions for renewable diesel are likely related to its chemical composition and combustion characteristics. While the chemical composition of used fuels was not independently verified in this study, it has been characterized in detail for similar diesel fuel types to those used in these experiments (Karjalainen et al., 2019). Based on this, renewable diesel fuel used in these experiments contains almost no aromatic compounds and consists mainly of paraffinic hydrocarbons, while regular fossil diesel contains significant amounts of aromatics (28.6 wt %). Aromatic compounds are known to be more resistant to complete combustion, leading to higher emissions of unburned or partially oxidized organic species. In addition, higher cetane numbers and heating values of renewable diesel compared to regular diesel enable more efficient combustion, leading to reduced formation of organic gaseous compounds due to incomplete combustion of hydrocarbons present in the fuel.
3.2 Transient particle emissions
3.2.1 Particle number
PN emissions from gasoline AHs were considerably higher than diesel AH. During the laboratory measurements, gasoline AH produced average PN concentrations of 56 × 106 and 12 × 106 cm−3 for > 3.4 and > 22 nm particles, respectively, during the preheating, whereas diesel AH produced on average 1.5 × 10⁶ and 0.27 × 106 cm−3 for > 3.4 and > 22 nm particles, respectively. For diesel AH, the emissions of the preheating were concentrated on ignition and shutdown spikes (99 % of total PN emissions) with low stable period concentrations in the range of 102 to 104 cm−3 (Fig. 4). Interestingly, there was also a difference in the magnitude of ignition and shutdown spikes between diesel fuel types. For renewable diesel, the ignition spike is smaller, with a concentration of 0.14 × 108 cm−3 compared to 0.5 × 108 cm−3 for regular diesel. For the shutdown spike, the effect of fuel was reversed, with renewable diesel producing a larger shutdown spike of 1.3 × 108 cm−3 compared to 0.7 × 108 cm−3 for regular diesel. Gasoline AH also produced PN spikes during ignition and shutdown, but it had higher stable operating emissions, with 70 % of the total preheating-originated PN emitted during the stable operating period and the ratio of the spike concentrations to stable ones being in the range of 2–3. Despite the fact that the type of gasoline fuel used was the same in both gasoline tests, there are still major differences in the PN concentrations, with the stable operation concentrations being 2.0 times greater in test 2 when compared to test 1 and the ignition and shutdown spikes being 2.3 times greater. The major difference in PN values of tests 1 and 2 is mostly explained by differences in sub-11 nm particles, since, if PN > 11 nm values are compared, they remain relatively similar between the tests. The ratios of the mean concentrations of test 2 to test 1 PN > 11 nm are 0.86 and 0.94 for stable period concentrations and spike concentrations, respectively.
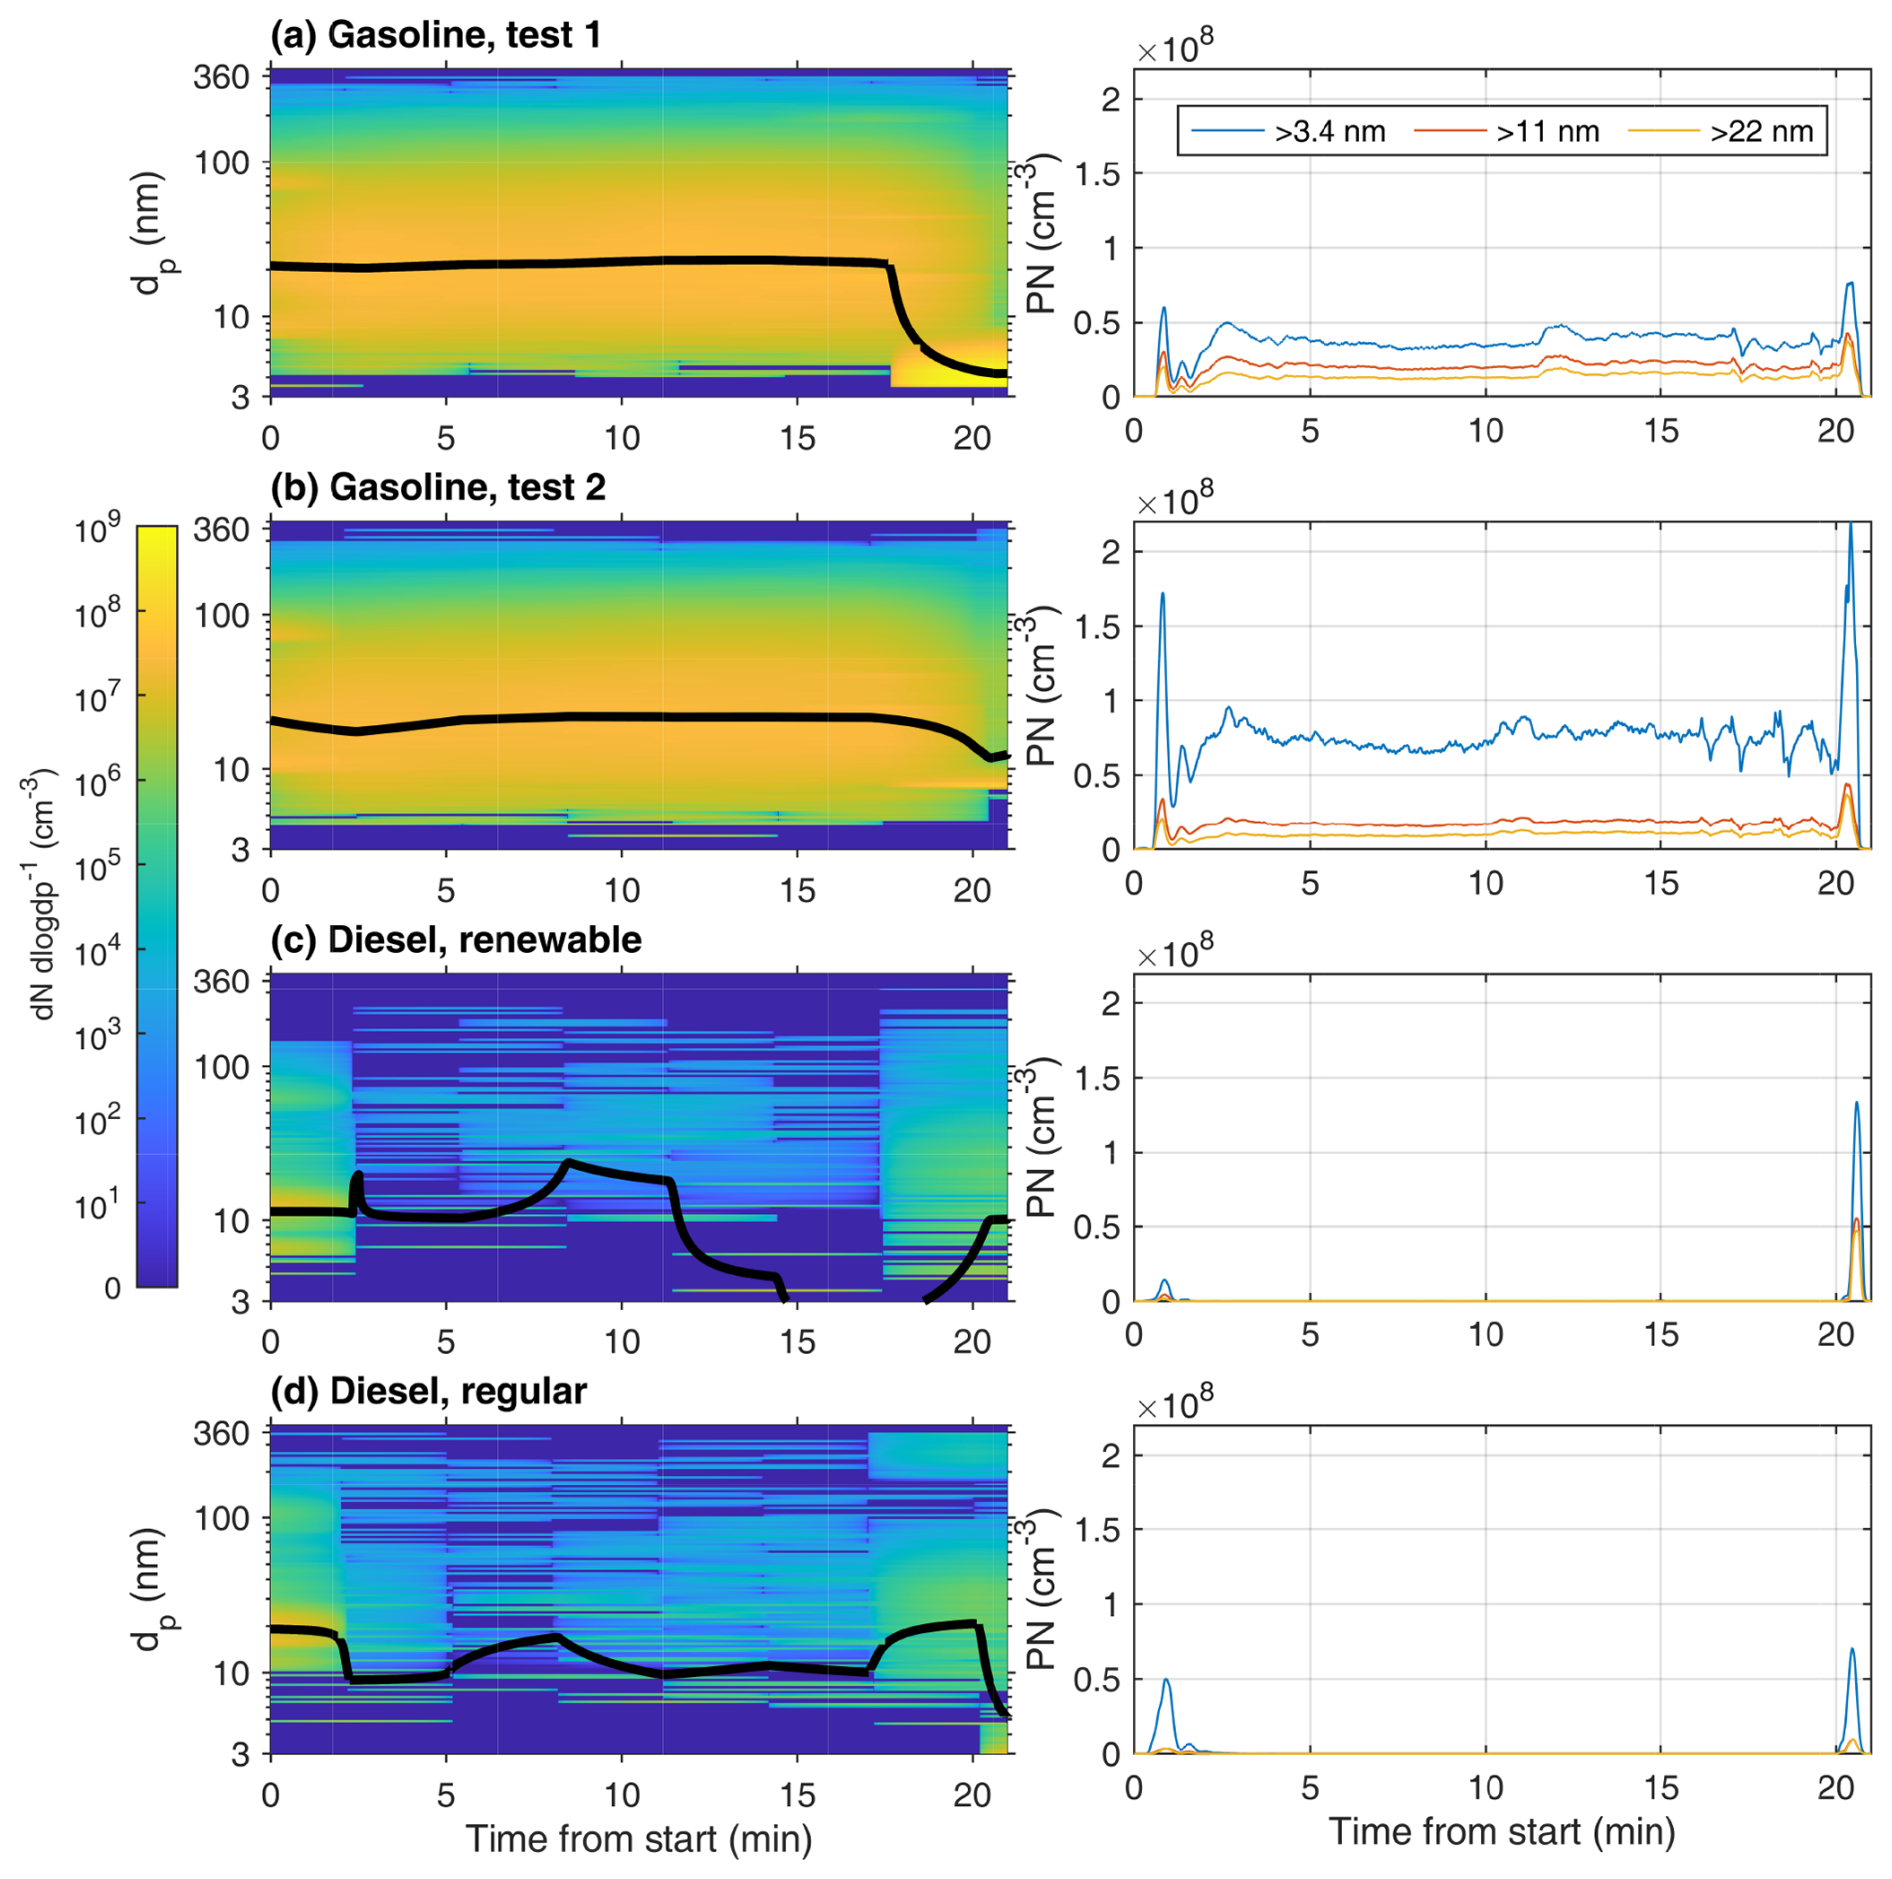
Figure 4Fresh PN size distribution measured by the SMPSs for (a–b) the gasoline experiments, (c) the renewable diesel experiment, and (d) the regular diesel experiment (left) and PN concentrations measured by the CPCs with effective cut-off diameters of 3.4, 11, and 22 nm (right). Geometric mean diameters (GMDs) of the SMPS size distributions are presented as black lines. Due to overlapping size ranges of SMPSs, composite size distribution was formed by taking the weighted average for concentration values in an overlapping portion of the size range.
The AH PN emissions in outdoor PN conditions have already been published in Oikarinen et al. (2022). In laboratory measurements, similar features in the time series of PN were observed between the diesel and gasoline AHs, as was observed in outdoor measurements with clear ignition and shutdown spikes and low stable period emissions for diesel AHs. For the gasoline AH, major differences in PN concentrations in outdoor compared to indoor measurements were detected, with the ratio of laboratory to outdoor mean PN concentrations being 6.7, 4, and 4.3 for cut-off diameters of 3.4, 11, and 22 nm, respectively. Meanwhile, results for the diesel AH showed a shift in particle size distribution with an increase in sub-11 nm particle concentration, with corresponding reduction in larger particles. The ratios of laboratory to outdoor mean PN were 1.7, 0.64, and 0.95 for cut-off diameters of 3.4, 11, and 22 nm, respectively, for diesel AH.
For the gasoline AH, PN emission factors were clearly higher in the laboratory compared to the outdoor conditions: the EFfuel values were 5.1, 2.8, and 3.3 times higher for 3.4, 11, and 22 nm effective cut-off diameters, respectively. For the stable operating periods of the gasoline AHs, the difference between outdoor and laboratory conditions was even greater, with factor of 5.5, 3.3, and 3.5 increase in PN EFfuel values for 3.4, 11, and 22 nm cut-offs, respectively. Consequently, the relative contribution of ignition and shutdown spikes to the total preheating cycle emissions was 60 % lower in the laboratory. Compared to gasoline AH, the diesel AH had overall smaller EFs, and the effect of operating temperature is not as straightforward as with gasoline. There was a slight increase in EFfuel of PN > 3.4 nm by a factor of 1.2 in laboratory conditions, which is almost entirely due to increases in spikes contributing to overall emissions, as stable operating EFmin values are almost zero, with the ratio of laboratory to outdoor EFmin being only 2.3 %. For diesel, the EFfuel of PN > 11 nm decreased by factor of 0.44, whereas the EFfuel of PN > 22 nm did not change due to operating temperature change. For both PN > 11 and PN > 22, there has similarly been a shift in the temporal composition of emissions, with more pronounced spikes and smaller stable operating emissions. The relative contribution of spikes to preheating cycle PN emissions was in the range of 53 %–60 % and 98 %–99 % for outdoor measurements and laboratory measurements, respectively.
The effect of ageing on PN emissions was assessed in the laboratory measurements with the environmental chamber. For gasoline AH, there was no detectable new particle formation during the exhaust ageing process, which resulted in a reduction in all measured PN EFfuel values by 29 %, 31 %, and 4 % for 3.4, 11, and 22 nm cut-offs, respectively. The smaller decrease in the largest cut-off can be explained by coagulation removing mostly smaller particles and increasing the GMD of particle size distribution and also condensation into the existing smaller particles, growing them into a size range detectable by the largest cut-off CPC, mitigating the effects of particle losses during the ageing process. In contrast, for the diesel AH, there was a notable increase in PN EFfuel values growing by factors of 10, 4.9, and 5.1 for 3.4, 11, and 22 nm cut-offs, respectively, due to the new particle formation in the relatively clean chamber (Fig. 8c–d). It should be noted that ageing of PN emissions is extremely sensitive to experimental conditions. Thus, it is probable that, if exhausts measured in these experiments were to be released into the (same) clean outdoor air and allowed to dilute freely, new particle formation would be (more) similar between the diesel and gasoline AH exhausts.
3.2.2 Particle size distributions
During the stable operation period of the gasoline AHs, the PSDs remaining were relatively invariable (Fig. 4a–b), with average GMDs of measurements ranging from 21 to 24 nm. These results align well with results from previous outdoor measurements, where the stable period GMD was found to be 21 nm for gasoline AHs and 16 nm for diesel AHs (Oikarinen et al., 2022). For the diesel AH, the number of particles detected during the steady period were low enough to cause larger variation in the geometric mean diameter during a preheating cycle (Fig. 4c–d). On average, the detected particles were smaller than for the gasoline AHs, with average GMD ranging from 8 to 11 nm for renewable and regular diesel, respectively, where the 8 nm averaged GMD is from renewable diesel.
Considering changes in the PSDs during the preheating cycle, all AHs produced the largest particles during the ignition phase, while, for the shutdown phase, there is a clear downward shift in GMD. There are, however, notable differences in the degree of these shifts between vehicles and even repeated measurements with same vehicle, as can be seen from the gasoline AH measurements with a distinctly strong downward shift in the GMD during the first measurement (Fig. 4a). This strong downward shift in the first measurement also coincided with large OGC emissions (Fig. 3b, gasoline test 1), possibly indicating enhanced new particle formation via nucleation from oxidation products of extremely low volatile organic compounds in the AH exhaust either in the tailpipe or during dilution. However, a more likely explanation for differences between detected PSDs during shutdown spikes would be that the low time resolution of SMPS of 3 min relative to the duration of the shutdown spike lasting 1–2 min makes it hard to accurately compare differences in shutdown spikes, as the differences between the two gasoline tests in Fig. 4a–b could also be caused by timing differences in PSD scans resulting in different parts of the PSD spikes being measured. This is supported by PN concentrations detected with high-time-resolution CPCs (∼ 1 s−1), with both gasoline tests showing similar concentrations during shutdown spikes for a cut-off diameter of 11 nm, but, for > 3.4 nm, the second gasoline test (Fig. 4b) shows much higher concentration than first test (Fig. 4a), indicating that a higher concentration of 3.4–11 nm particles should be observable for the second test than for the first. As this is not the case, the SMPSs have insufficient time resolution to accurately compare rapid changes in PSDs during ignition and shutdown spikes in AH heating cycles.
Faster changes in PSDs during ignition and shutdown periods can be estimated by comparing total concentrations of CPCs with different cut-off diameters and relative fractions of size bins calculated from CPCs (Fig. S6). For both gasoline and diesel AHs, PSD shows a shift towards larger particles during ignition spike, when the fraction of particles in size ranges of 11–22 and > 22 nm grows rapidly. Shutdown spikes in diesel AHs were observed to behave similarly to ignition spikes, with an initial increase in > 11 nm particles followed by a stronger growth in concentration of sub-11 nm particles. Meanwhile, shutdown spikes for the gasoline AH differed from ignition spikes during the first seconds of shutdown spike: the fraction of > 22 nm particles increases slightly but with no corresponding increase in 11–22 nm fraction as was observed for ignition spikes. After those initial seconds, the shutdown spike in gasoline AH behaved similarly to other observed spikes, with the increase in sub-11 nm fraction coinciding with the reduction in larger fractions.
3.2.3 Particle mass
Both gasoline and diesel AH exhaust had clear peaks in the PM mass during the ignition and shutdown phases (Fig. 5). For the gasoline AH, the freshly emitted PM mass was higher during shutdown phase compared to ignition phase, in contrast to the diesel AHs, for which the exceedance of the stable level was similar for both phases. During the stable operating period, fresh PM emissions of gasoline AH remained at elevated levels during both outdoor and laboratory measurements, especially when compared against low stable period PM emissions of diesel AH.
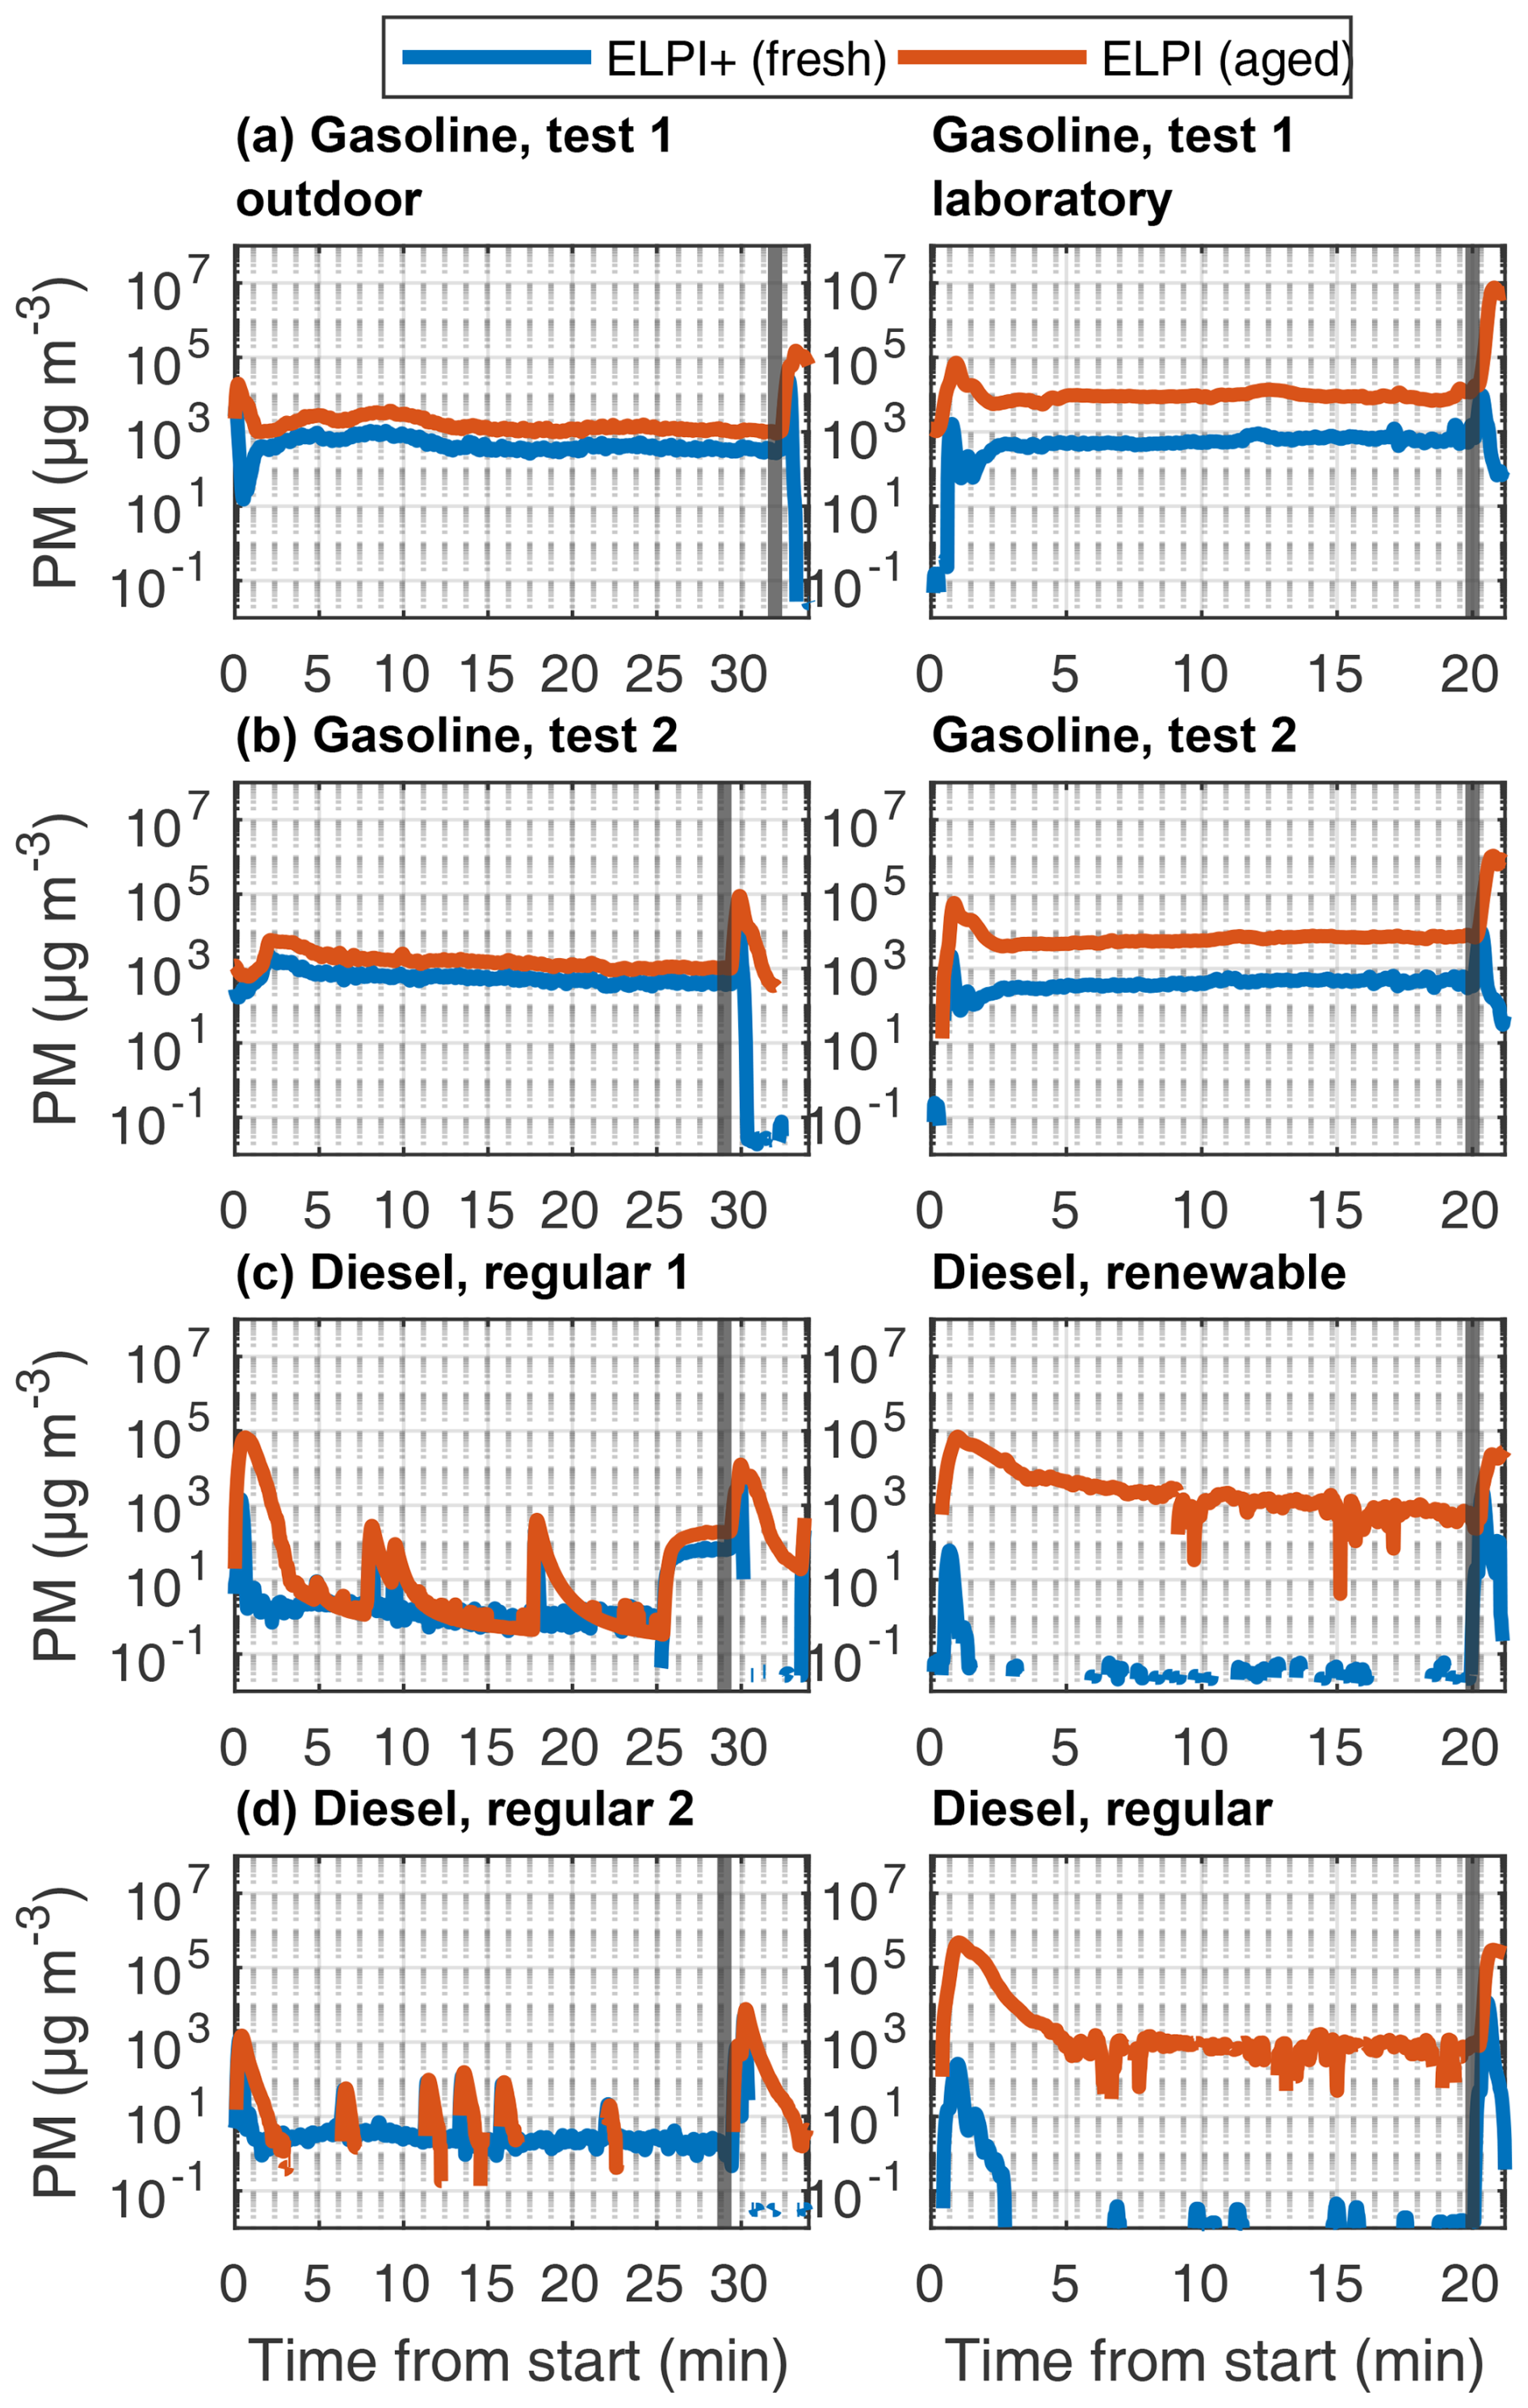
Figure 5Fresh and aged PM mass concentrations in raw exhaust emissions, measured by ELPIs. The aged time series are adjusted by −20 s to account for the delay due to the longer sampling line and TSAR.
During laboratory measurements for the stable operation period, diesel AH did not produce enough PM mass to be detectable with ELPI, which is in line with low PN concentrations. The PM mass was similar for both tested diesel fuel types during steady phase. During ignition and shutdown phase, in contrast, the fossil-based diesel produced notably higher emissions compared to the renewable diesel, especially during ignition phase, and this effect is more pronounced on the aged emissions.
The photochemical ageing in TSAR increased the particle mass concentrations from the tailpipe by 2 to 3 orders of magnitude in the laboratory conditions and by a factor of 3 to 30 in the outdoor measurements. The difference between fresh and aged concentrations was especially prominent in the ignition and shutdown phases of the AH preheating cycle, as these were the phases with excessive emission of gaseous SOA precursors. The SOA enhancement ratio was especially prominent in laboratory diesel measurements, where primary PM mass is very low. EFfuel values of fresh PM mass were 9 and 1.1 mg kg for gasoline and diesel AH exhausts, respectively, and corresponding aged EFfuel values were 64 and 400 mg kg. The results show that low primary emissions do not necessarily result in low total PM when effects of ageing are accounted for and that the direct PM emission from the AH may pale in comparison to secondary PM emissions. The SOA formation potential and emission factors by photochemical ageing in the TSAR were also compared to SOA formation in the environmental chamber; see Sect. 3.3.2.
When outdoor PM mass measurements are compared against laboratory measurements, the fresh mass EF30 min values for the gasoline AH were found to be similar between outdoor and laboratory measurements (Fig. 9). The fresh EF30 min values from both gasoline laboratory tests fall within 1 standard deviation of the EF30 min values determined from outdoor measurements. The fresh EF30 min values with the regular diesel were slightly over 1 standard deviation larger in the laboratory conditions compared to the field conditions, whereas the fresh EF30 min values from renewable diesel were notably (factor 4.4) lower in the lab compared to the outdoor EF30 min values. Emissions for the renewable diesel were not measured in outdoor measurements, so direct comparison of operating temperature cannot be directly inferred. However, when compared against fresh EF30 min of regular diesel during laboratory measurements, a clear decrease in fresh mass is observable.
3.2.4 Black carbon and Ångström exponent
The gasoline-powered AH produced far greater eBC concentrations compared to the diesel-powered AH in both outdoor and laboratory conditions (Fig. 6). The eBC showed similar ignition and shutdown spikes and stable operating period shape to the total PM mass. For diesel AHs, the eBC concentrations were below the aethalometer detection limit, apart from the ignition and shutdown spikes in both outdoor and laboratory measurements. Changes in ambient temperature affected eBC emissions for both AH types. The EFfuel values of the gasoline AH eBC were greater under laboratory conditions by a factor of 2.2 when compared to the outdoor measurements. For the diesel AHs, the effect of operating temperature was the opposite, and eBC EFfuel values in laboratory conditions were reduced by 78 % when compared to the outdoor EFfuel values.
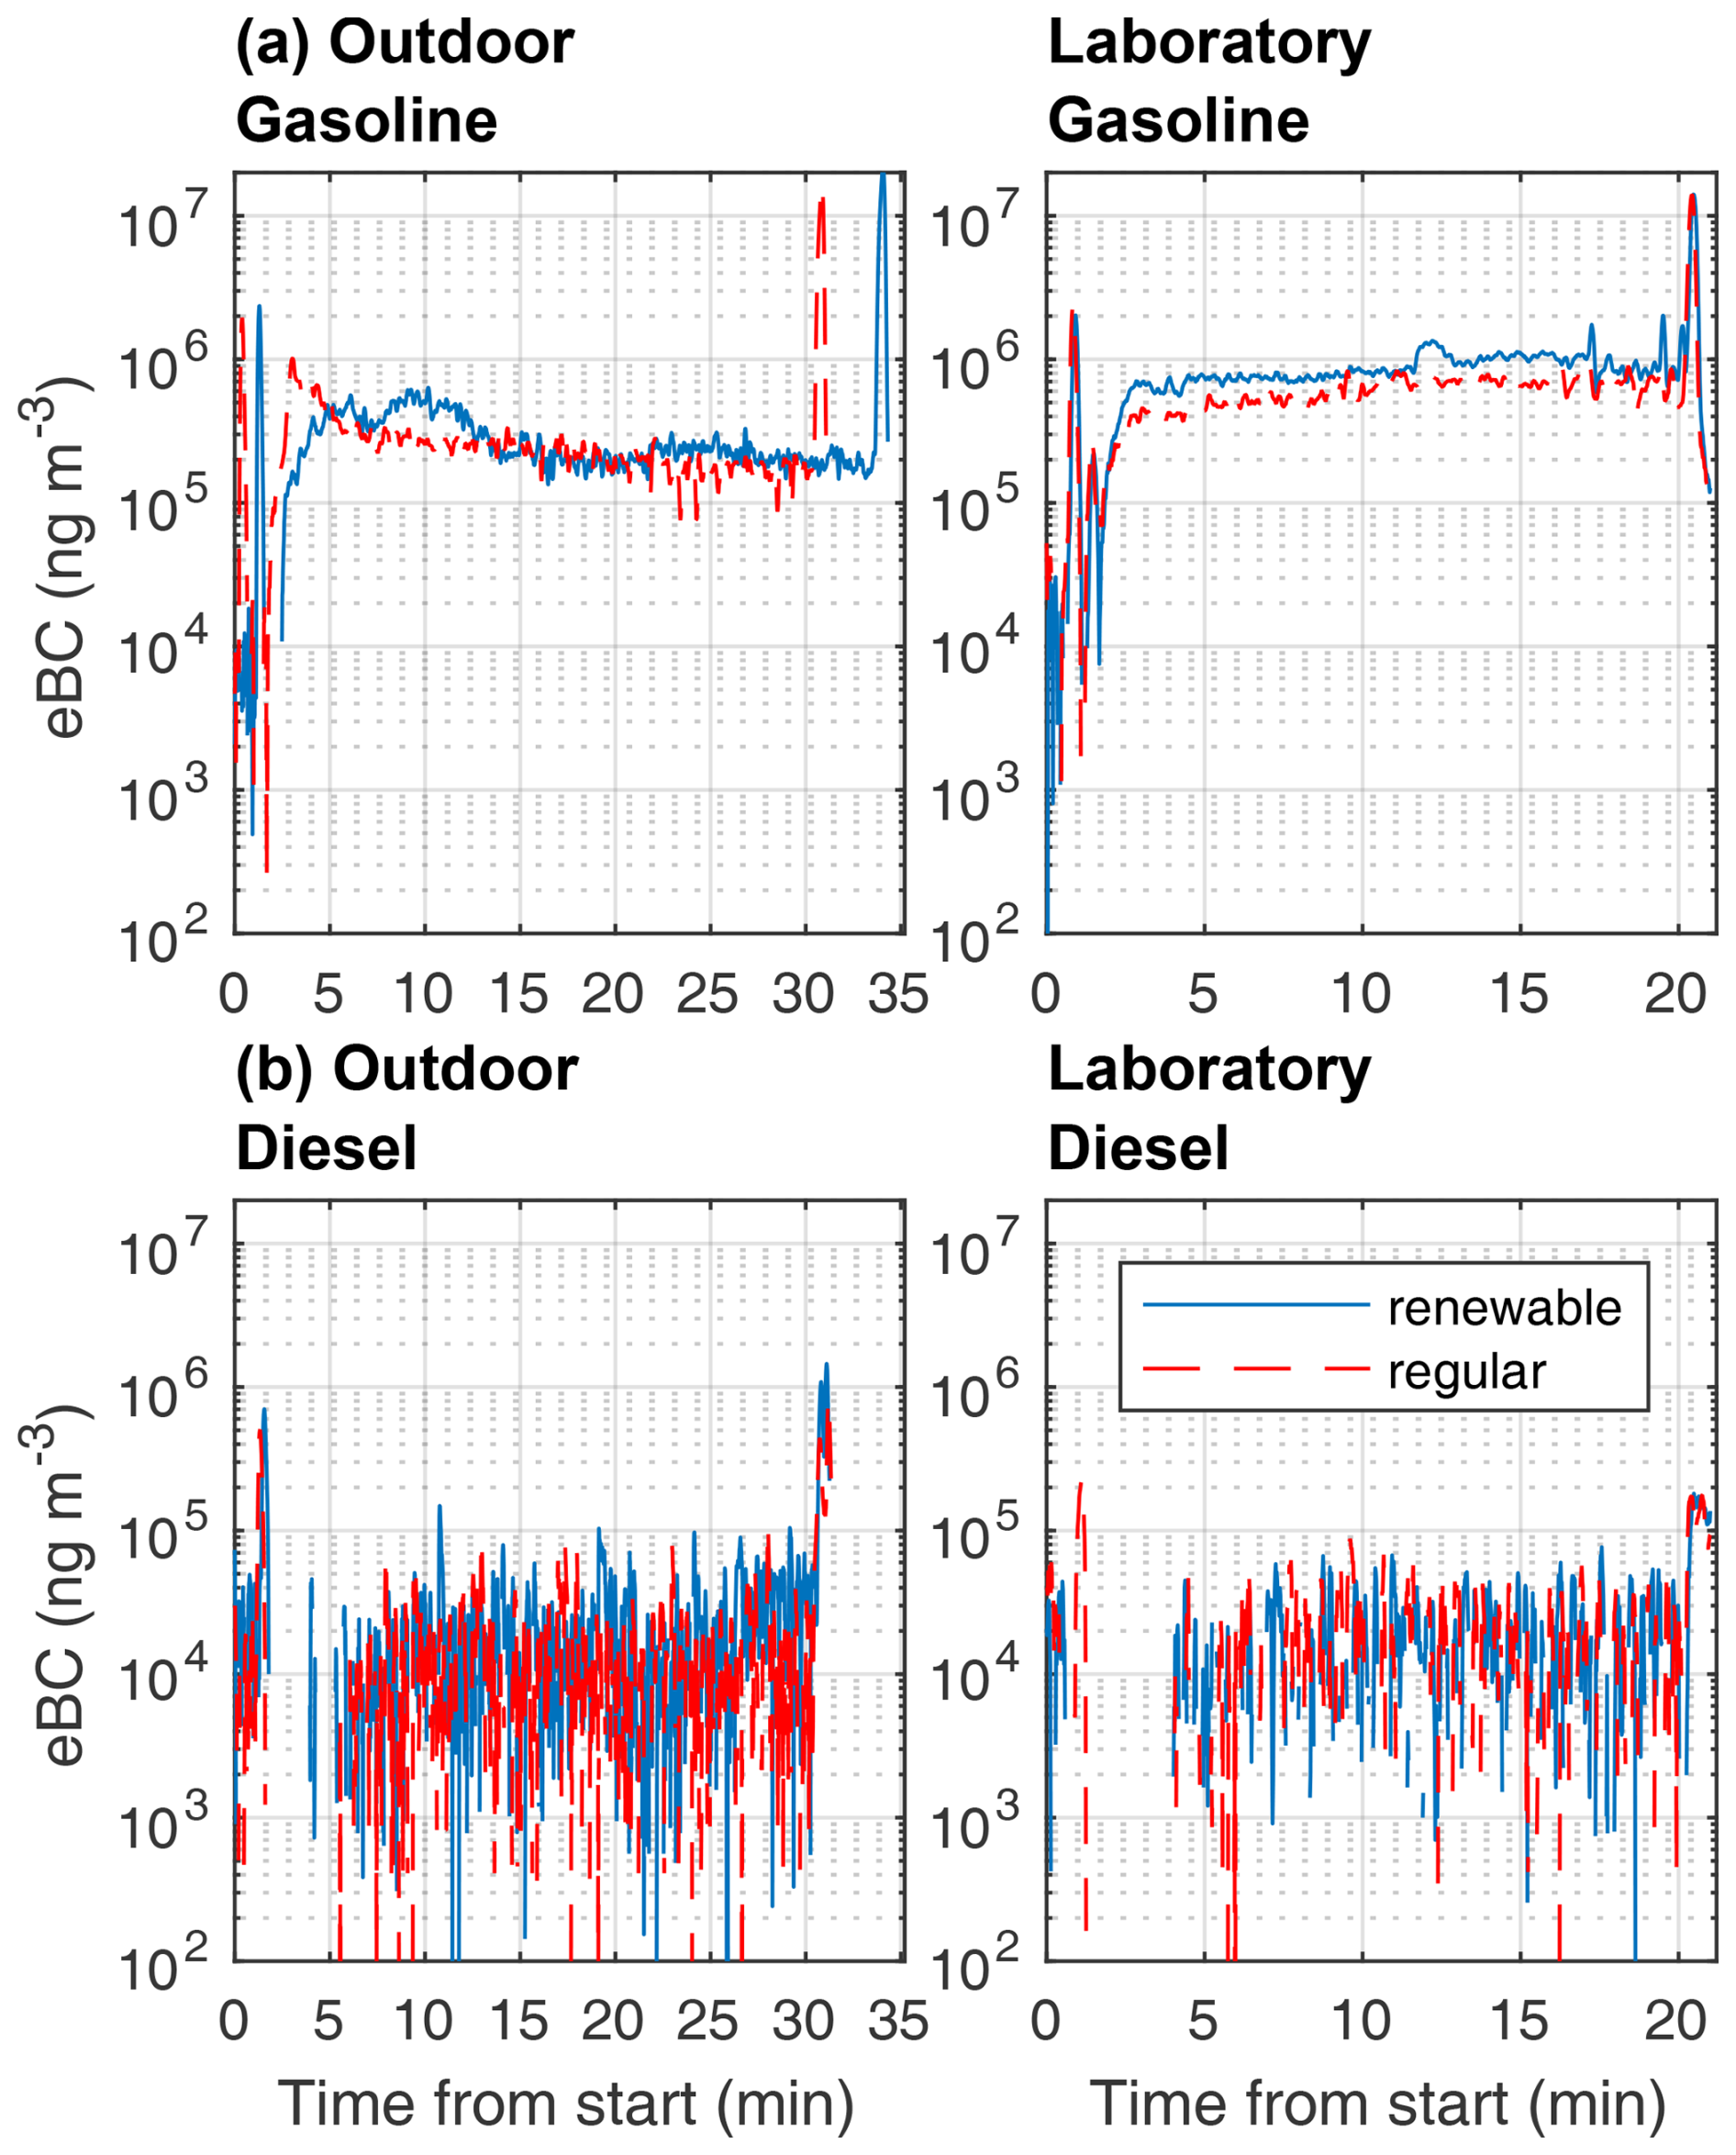
Figure 6Fresh black carbon mass concentrations of measured auxiliary heaters. On the left side are results from outdoor winter measurements, and on the right side are results from indoor laboratory measurements. Laboratory diesel AH measurements were performed using renewable and regular diesel fuels; for all the other tests, the fuel was the same for both tests. It should be noted that missing parts of time series indicate negative eBC signal from the measurement device.
The AAEs of the gasoline AH exhaust particles during stable operation were in the range of 1.06 to 1.53 during the outdoor measurements and in the range of 1.47 to 1.48 during the indoor measurements. For the diesel AH, AAEs could not be reliably determined due to the low concentration of absorbing aerosols. For ignition and shutdown periods, the AAEs could, however, be estimated for both vehicles when sufficient signals for eBC were detected (Fig. S8). During ignition, AAE tended to increase roughly at the same time as eBC spiked. For gasoline AH, the highest AAE values were observed after the end of the ignition spike in eBC, which stabilized to values in the range of 1.7 to 2 together with the stabilization of the eBC. The AAE of the diesel AH exhaust emission clearly decreased after ignition spike in the eBC spike. During shutdown, AAE decreased slightly at the beginning or just before shutdown spike formation, but no clear changes in the AAE were observed afterwards. Gasoline AH AAEs returned to pre-decrease levels during the shutdown period as long as a clear eBC signal could be observed, while the diesel AHs had a decreasing trend in AAE during the shutdown period, with a sharp decrease in AAE at the end of measurement as the eBC signal returned to near zero.
3.2.5 Chemical composition
The chemical composition of the fresh exhaust particles, measured by the SP-AMS, was dominated by rBC, followed by organic matter (Fig. 7). The contribution by other constituents was minor. It should be noted that the composition presented in Fig. 7 only includes particles with an aerodynamic diameter above ∼ 50 nm due to the limitations of the SP-AMS, which represents 94 % to 96 % of the total particulate mass estimated based on ELPI. For the gasoline AH experiments, the rBC measured by the SP-AMS was only 10 % to 15 % of the eBC, whereas, for the diesel experiments, rBC was higher than eBC in the fresh exhaust (Fig. S9).
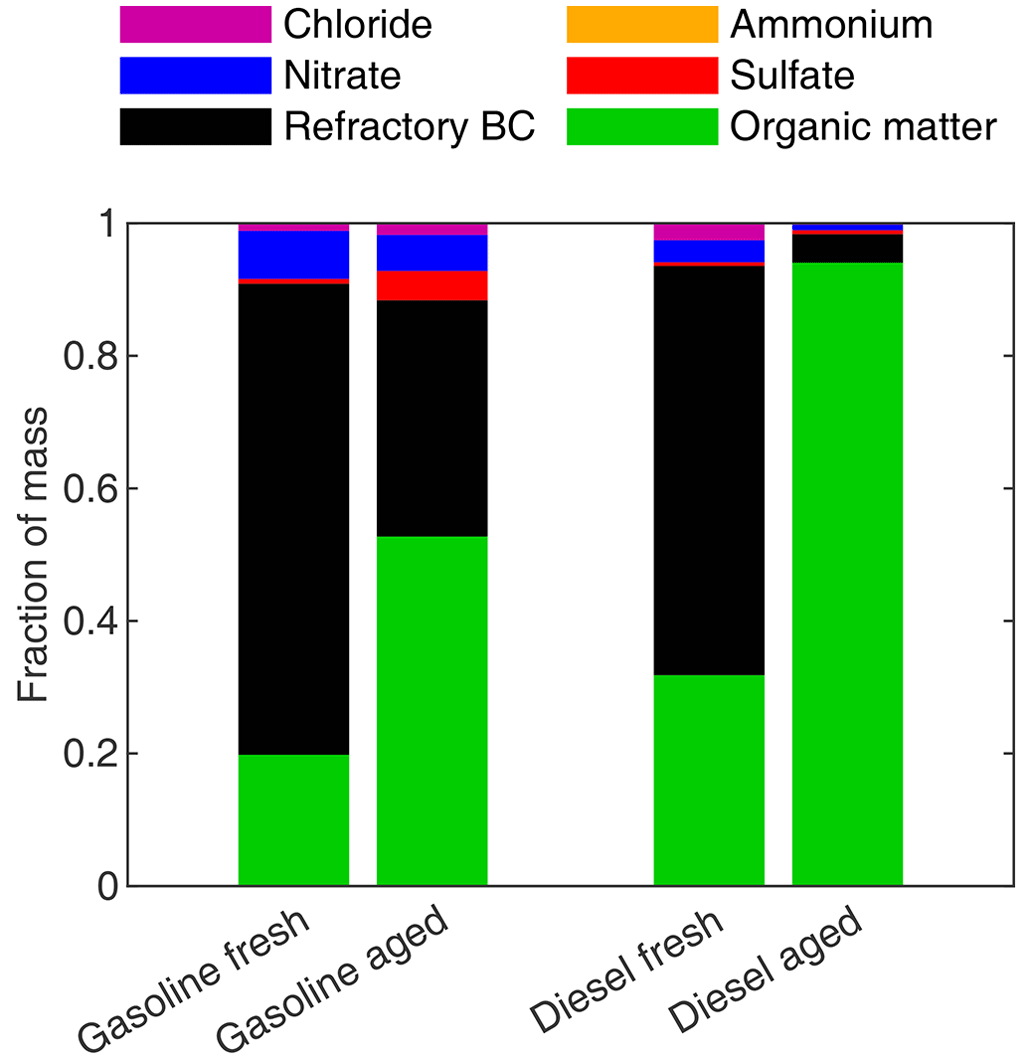
Figure 7Mean chemical compositions of the fresh and aged AH particle mass fractions for gasoline and diesel measurements.
Organic matter became the dominating factor for the diesel AH after photochemical processing due to the high SOA formation relative to the primary soot emissions in the primary emission (Fig. 7). For the gasoline measurement, the fraction of rBC in the secondary emissions was higher than for the diesel due to lower SOA enhancement ratio. In addition to organic matter, there was a slight increase in the fraction of sulfates (4 %) for gasoline AHs but not for diesel AH exhausts.
A more detailed composition of the organic fraction can be seen in Fig. S11. The fresh exhaust for both gasoline and diesel experiments is dominated by a strong signal at 29 and a typical repeating pattern for hydrocarbon-like organic aerosol (HOA) with signal at 41, 43, 55, and 57. These results are similar to previous studies of vehicle exhaust (Mohr et al., 2009). The secondary aerosol mass spectra are similar to those of oxygenated organic aerosol (OOA), with an increased signal at 44 and a clear shift to more oxygenated species. The secondary emissions are also what could be expected from secondary aerosol of vehicle exhaust (Mohr et al., 2009; Zhu et al., 2021). These results indicate that AH emissions can be difficult to distinguish from engine exhaust emissions and that, for example, finding a factor relating to AH emissions with positive matrix factorization could be difficult without clear differences from engine exhaust mass spectra.
3.3 Development of the photochemically aged exhaust in the chamber
3.3.1 Particle formation and growth
The first test for gasoline AH (Fig. 8a) showed no new particle formation events and only a fairly linear increase in GMD from 32 to 47 nm. Increase in [OH] by added H2O2 for gasoline test 2 (Fig. 8b) led to notably faster particle growth, with GMD changing from 30 to 60 nm. Nevertheless, the particle size distribution remained unimodal and log-normally distributed (Fig. 8b). The impact of coagulation on the particle growth was minor compared to condensational growth, with an estimated 3 to 4 nm increase in diameter for the gasoline experiments by coagulation only. However, the impact of coagulation on the particle population was evident, as it explained most of the decrease in particle number in the chamber. For diesel AHs, coagulation was determined to be negligible due to the low initial particle concentration.
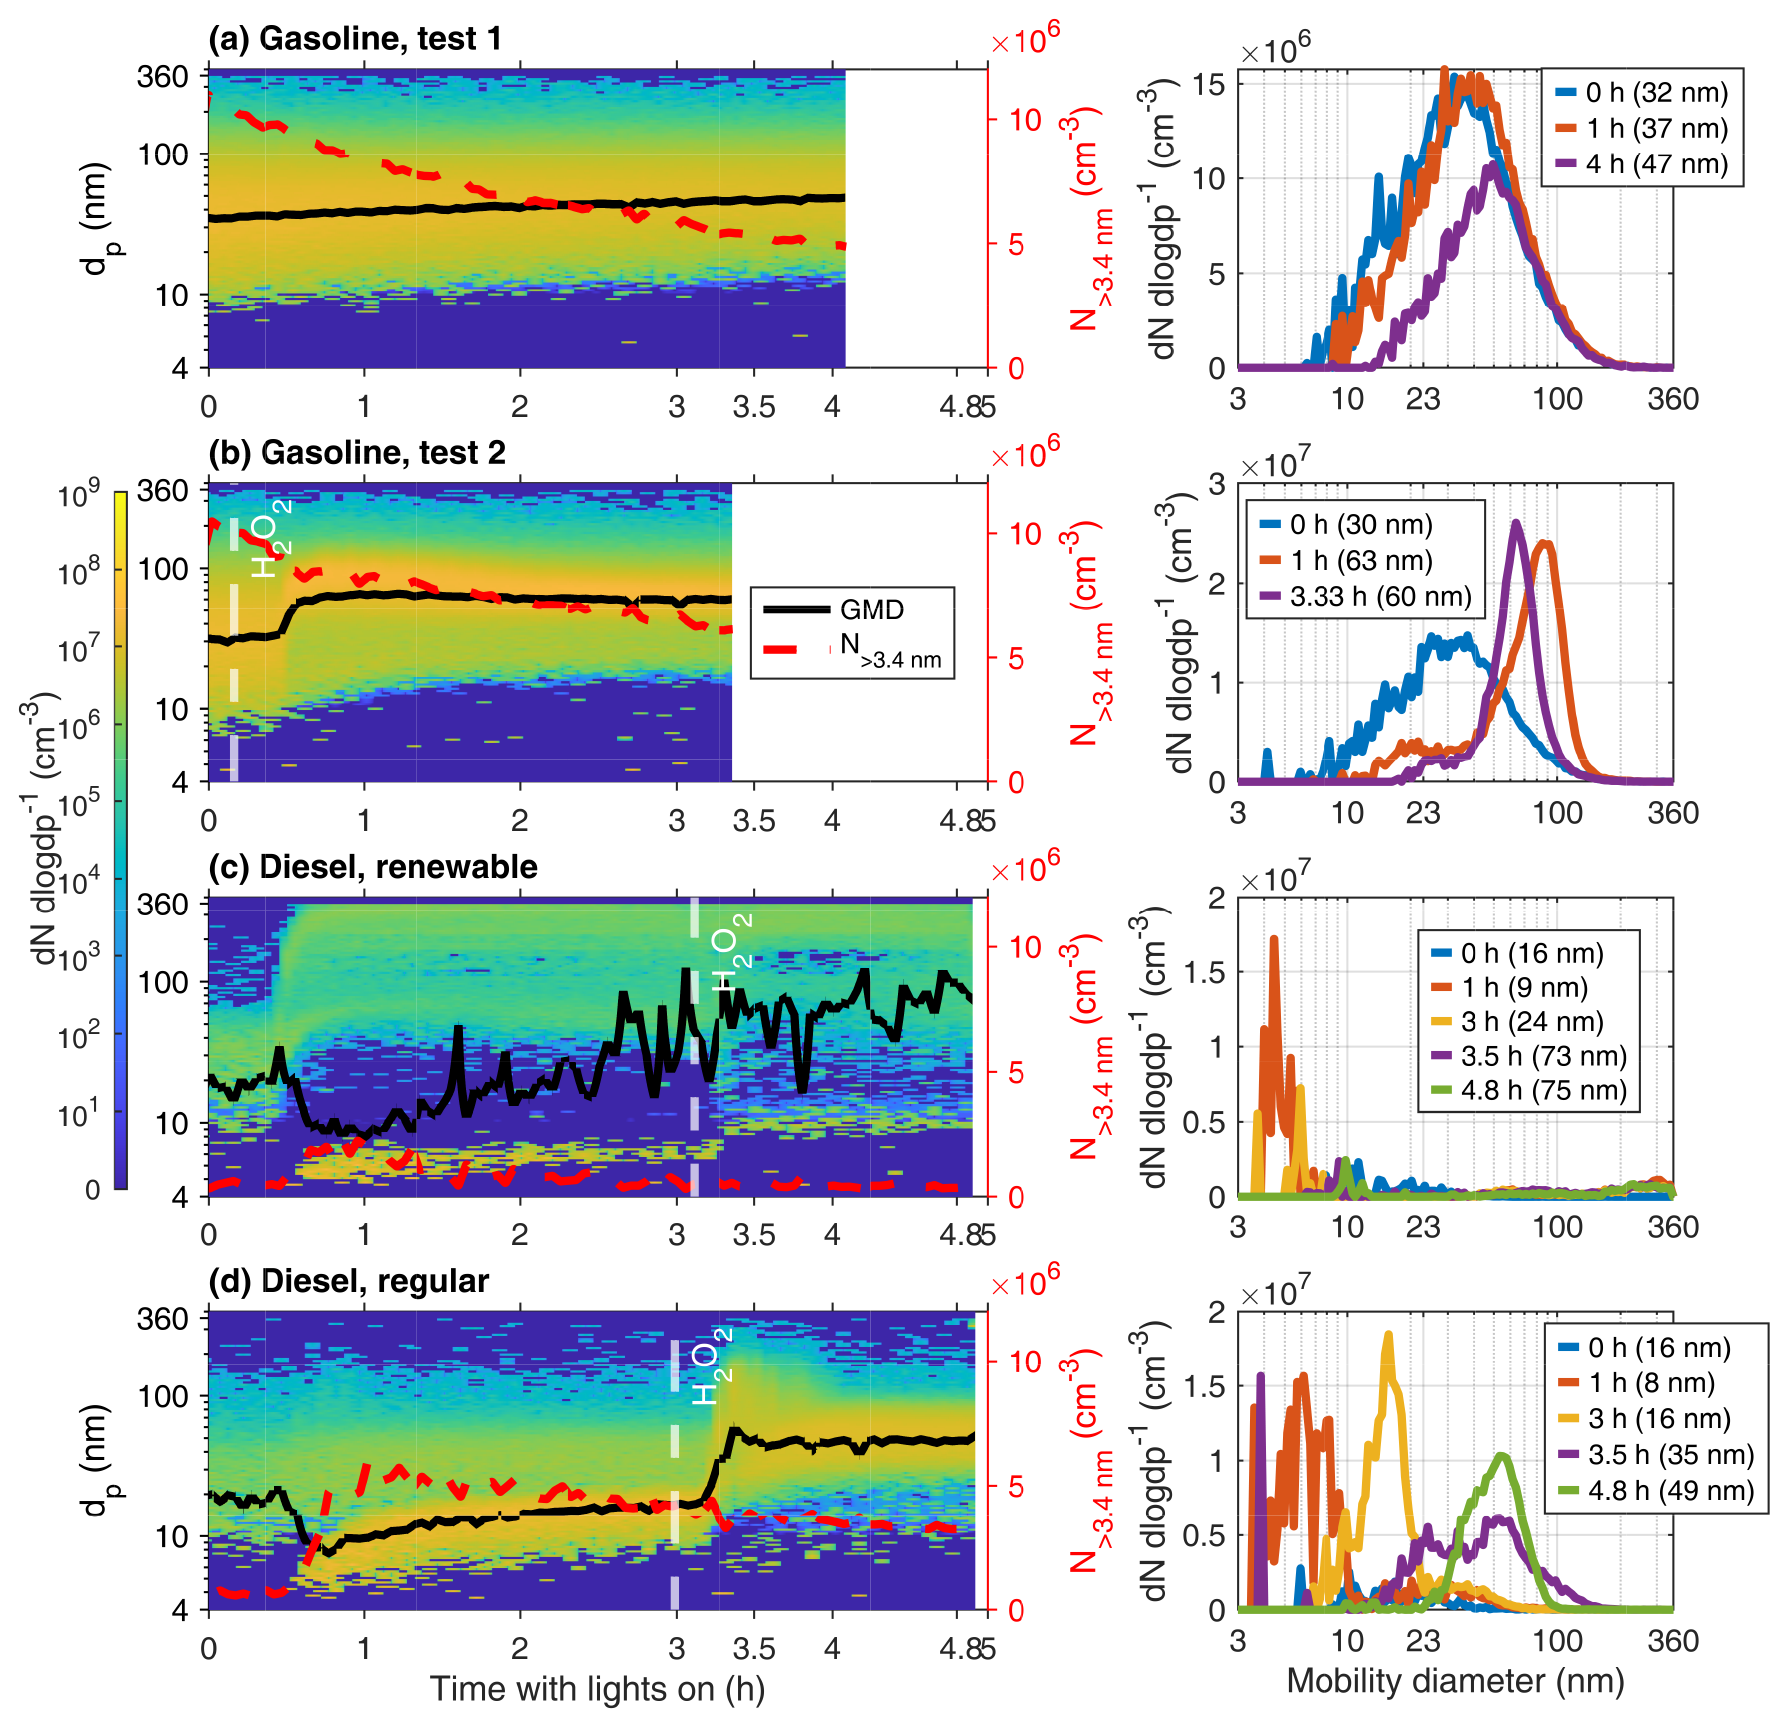
Figure 8Development of the wall-loss-corrected particle number size distributions in the chamber as measured by the SMPSs (left) and momentary size distributions at selected times after the UV lights were turned on (right). t = 0 corresponds to the moment the chamber UV lights were turned on.
The diesel AH exhaust experiments exhibited a similar increase in original distribution particle sizes. Additionally, new particle formation occurred at roughly the 40 min mark (Fig. 8c–d). For fossil diesel, a second event happened around the 200 min mark after the addition of H2O2, where growth of smaller particles was observed (Fig. 8d). Both the final amount and growth rate of new particles were greater for the emissions of fossil-based diesel.
3.3.2 Secondary particle mass formation potential
For the TSAR-aged EF30 min values, gasoline test 1 (Fig. 9) showed slightly greater deviation from the outdoor mean, with deviation just slightly greater than 2 standard deviations. The aged PM mass EF30 min values of the diesel AH, in contrast, depended on the type of fuel used. The TSAR-aged PM mass EF30 min values of the diesel exhaust were 1 order of magnitude greater in laboratory conditions when compared to outdoor measurements. It should be noted that, although the fresh PM mass EF30 min was smaller for the regular diesel, the aged EF30 min values were greater for the renewable fuel, and this applies to both TSAR and chamber ageing. Furthermore, the laboratory measurement EF30 min values provided in Fig. 9 differ slightly from the ones provided in Table 3, since EF30 min values presented in Fig. 9 were calculated from ELPI data, whereas values in Table 3 are calculated with ELPI+; this was done so that PM values for both outdoor and laboratory measurements are calculated from the same ELPI device.
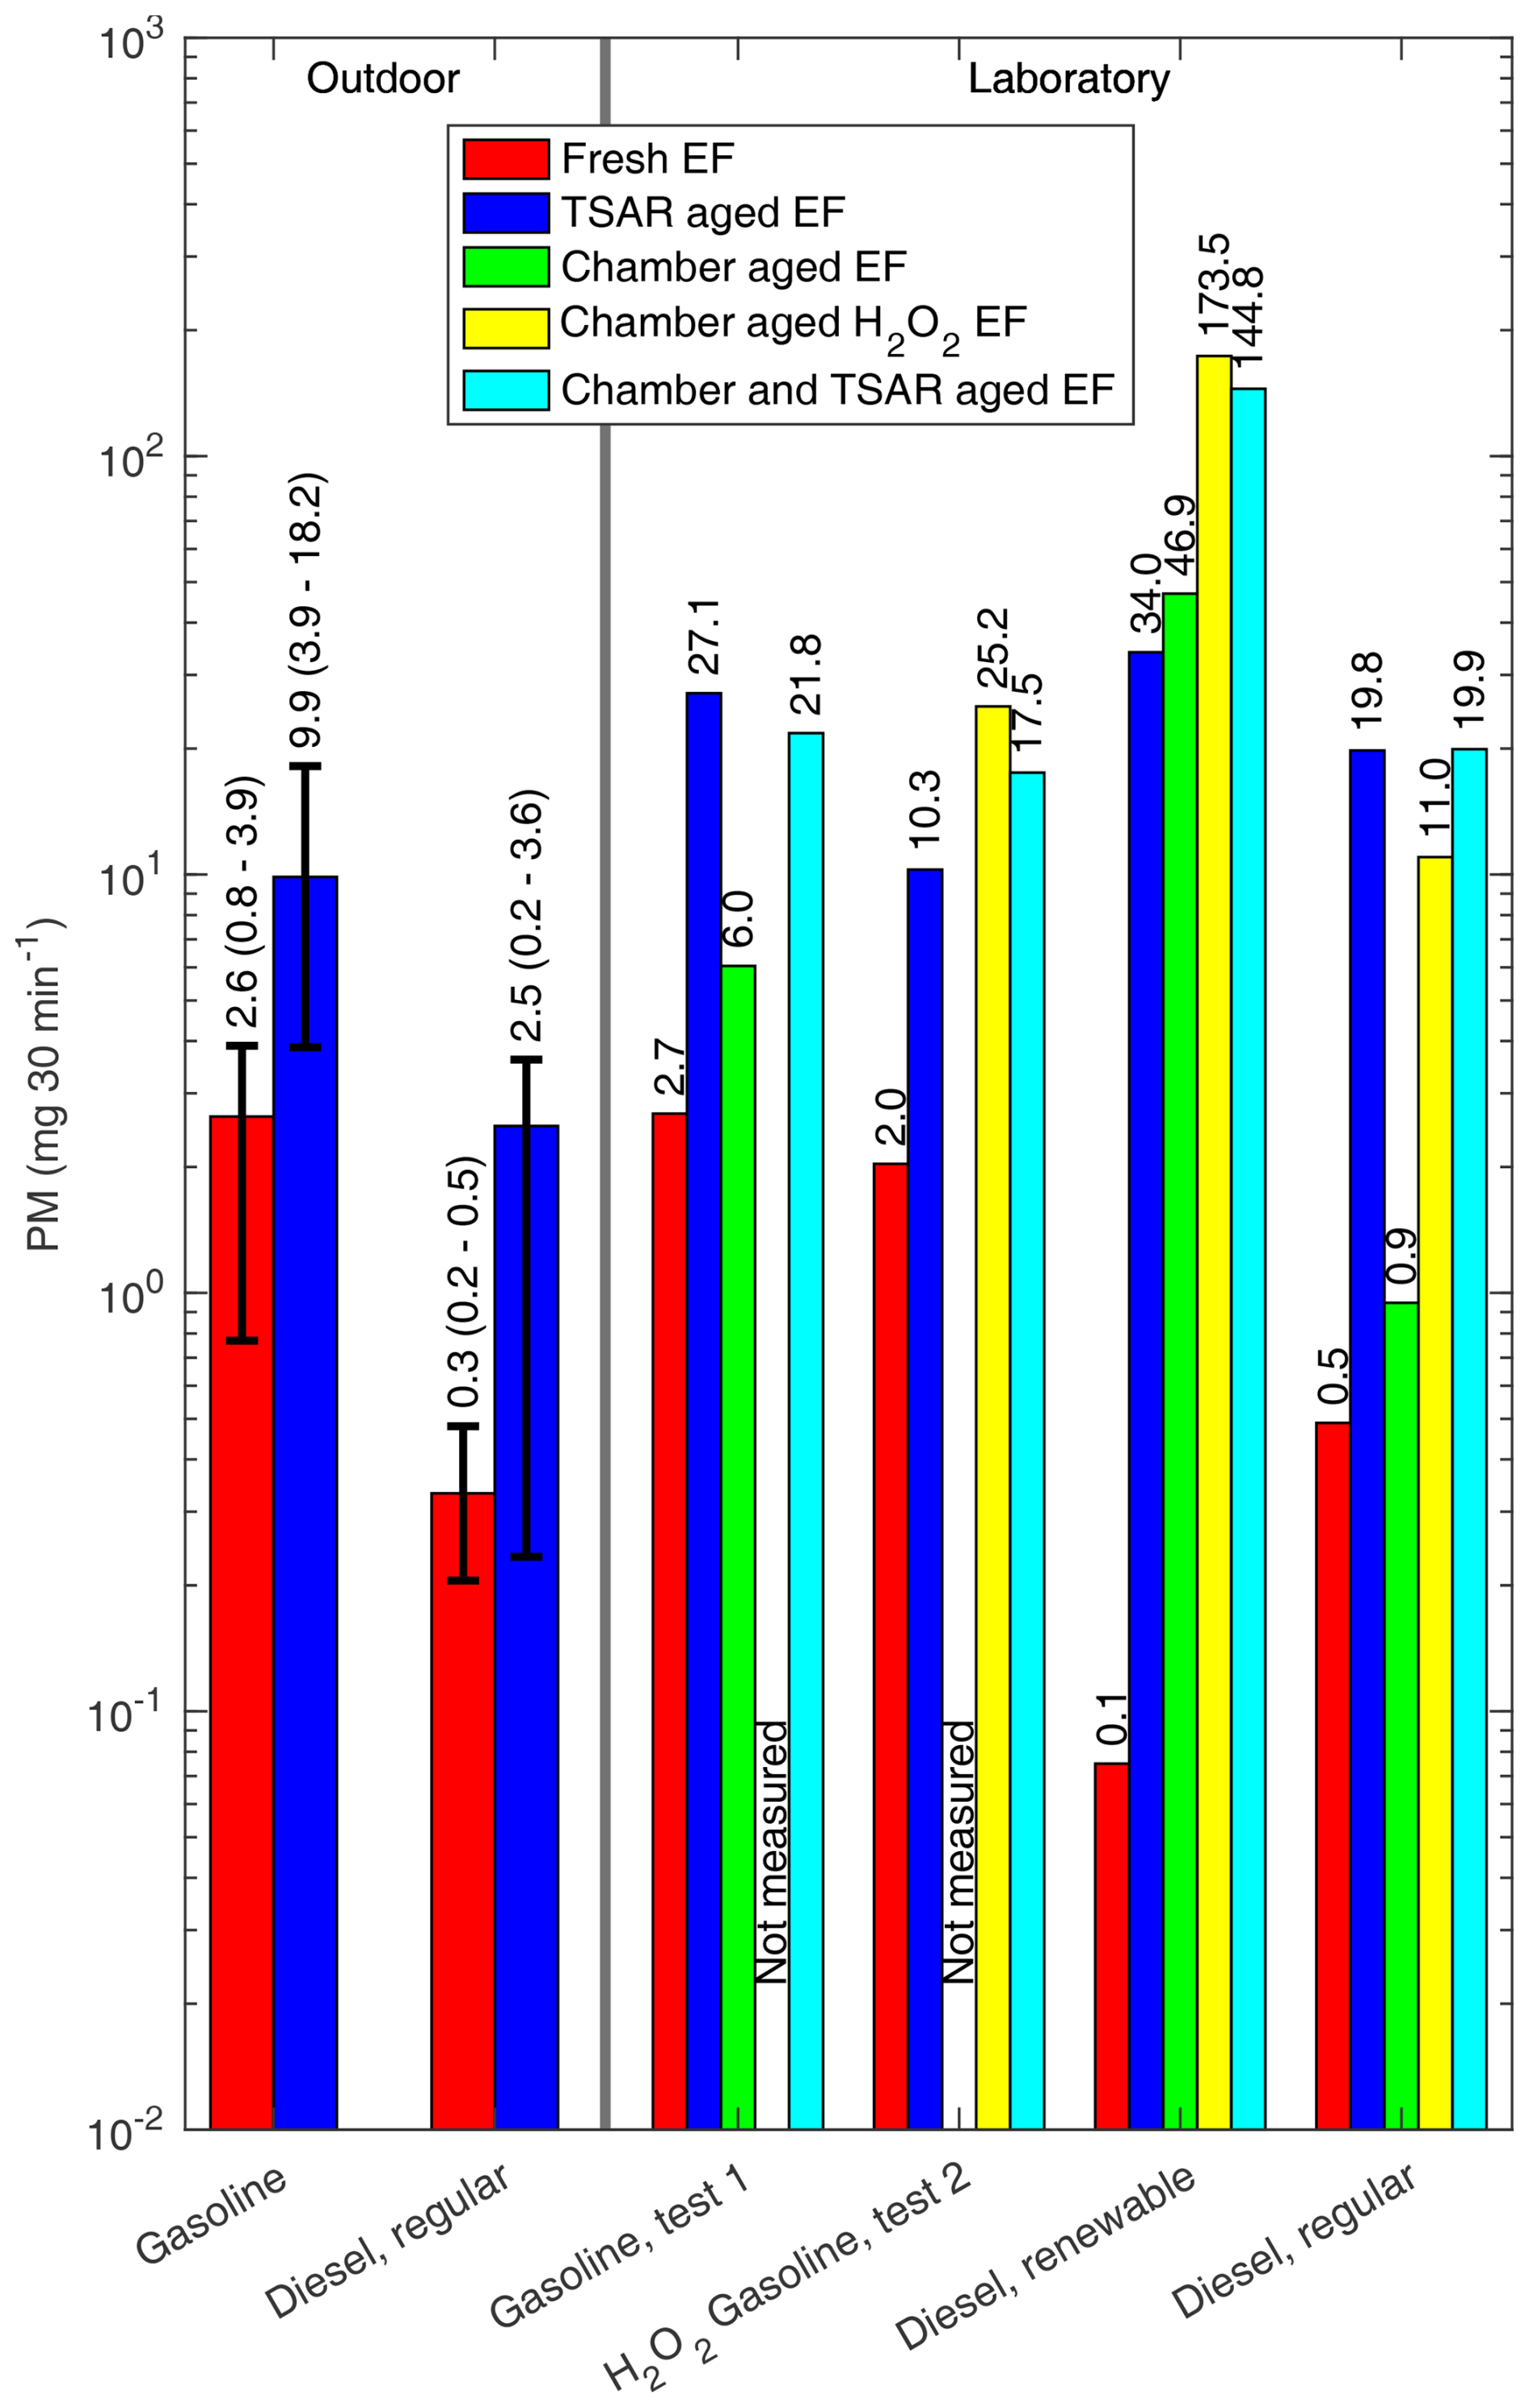
Figure 9Fresh and aged emission factors of particle masses for both outdoor and laboratory measurements. During outdoor measurements, fresh EF30 min was measured with ELPI+, and TSAR-aged EF30 min was measured simultaneously with ELPI. For laboratory measurements, all particle mass concentrations were measured with ELPI. For outdoor measurements, a range of four repeated measurements is presented with error bars. For laboratory measurements, EFs of each individual experiment are presented separately.
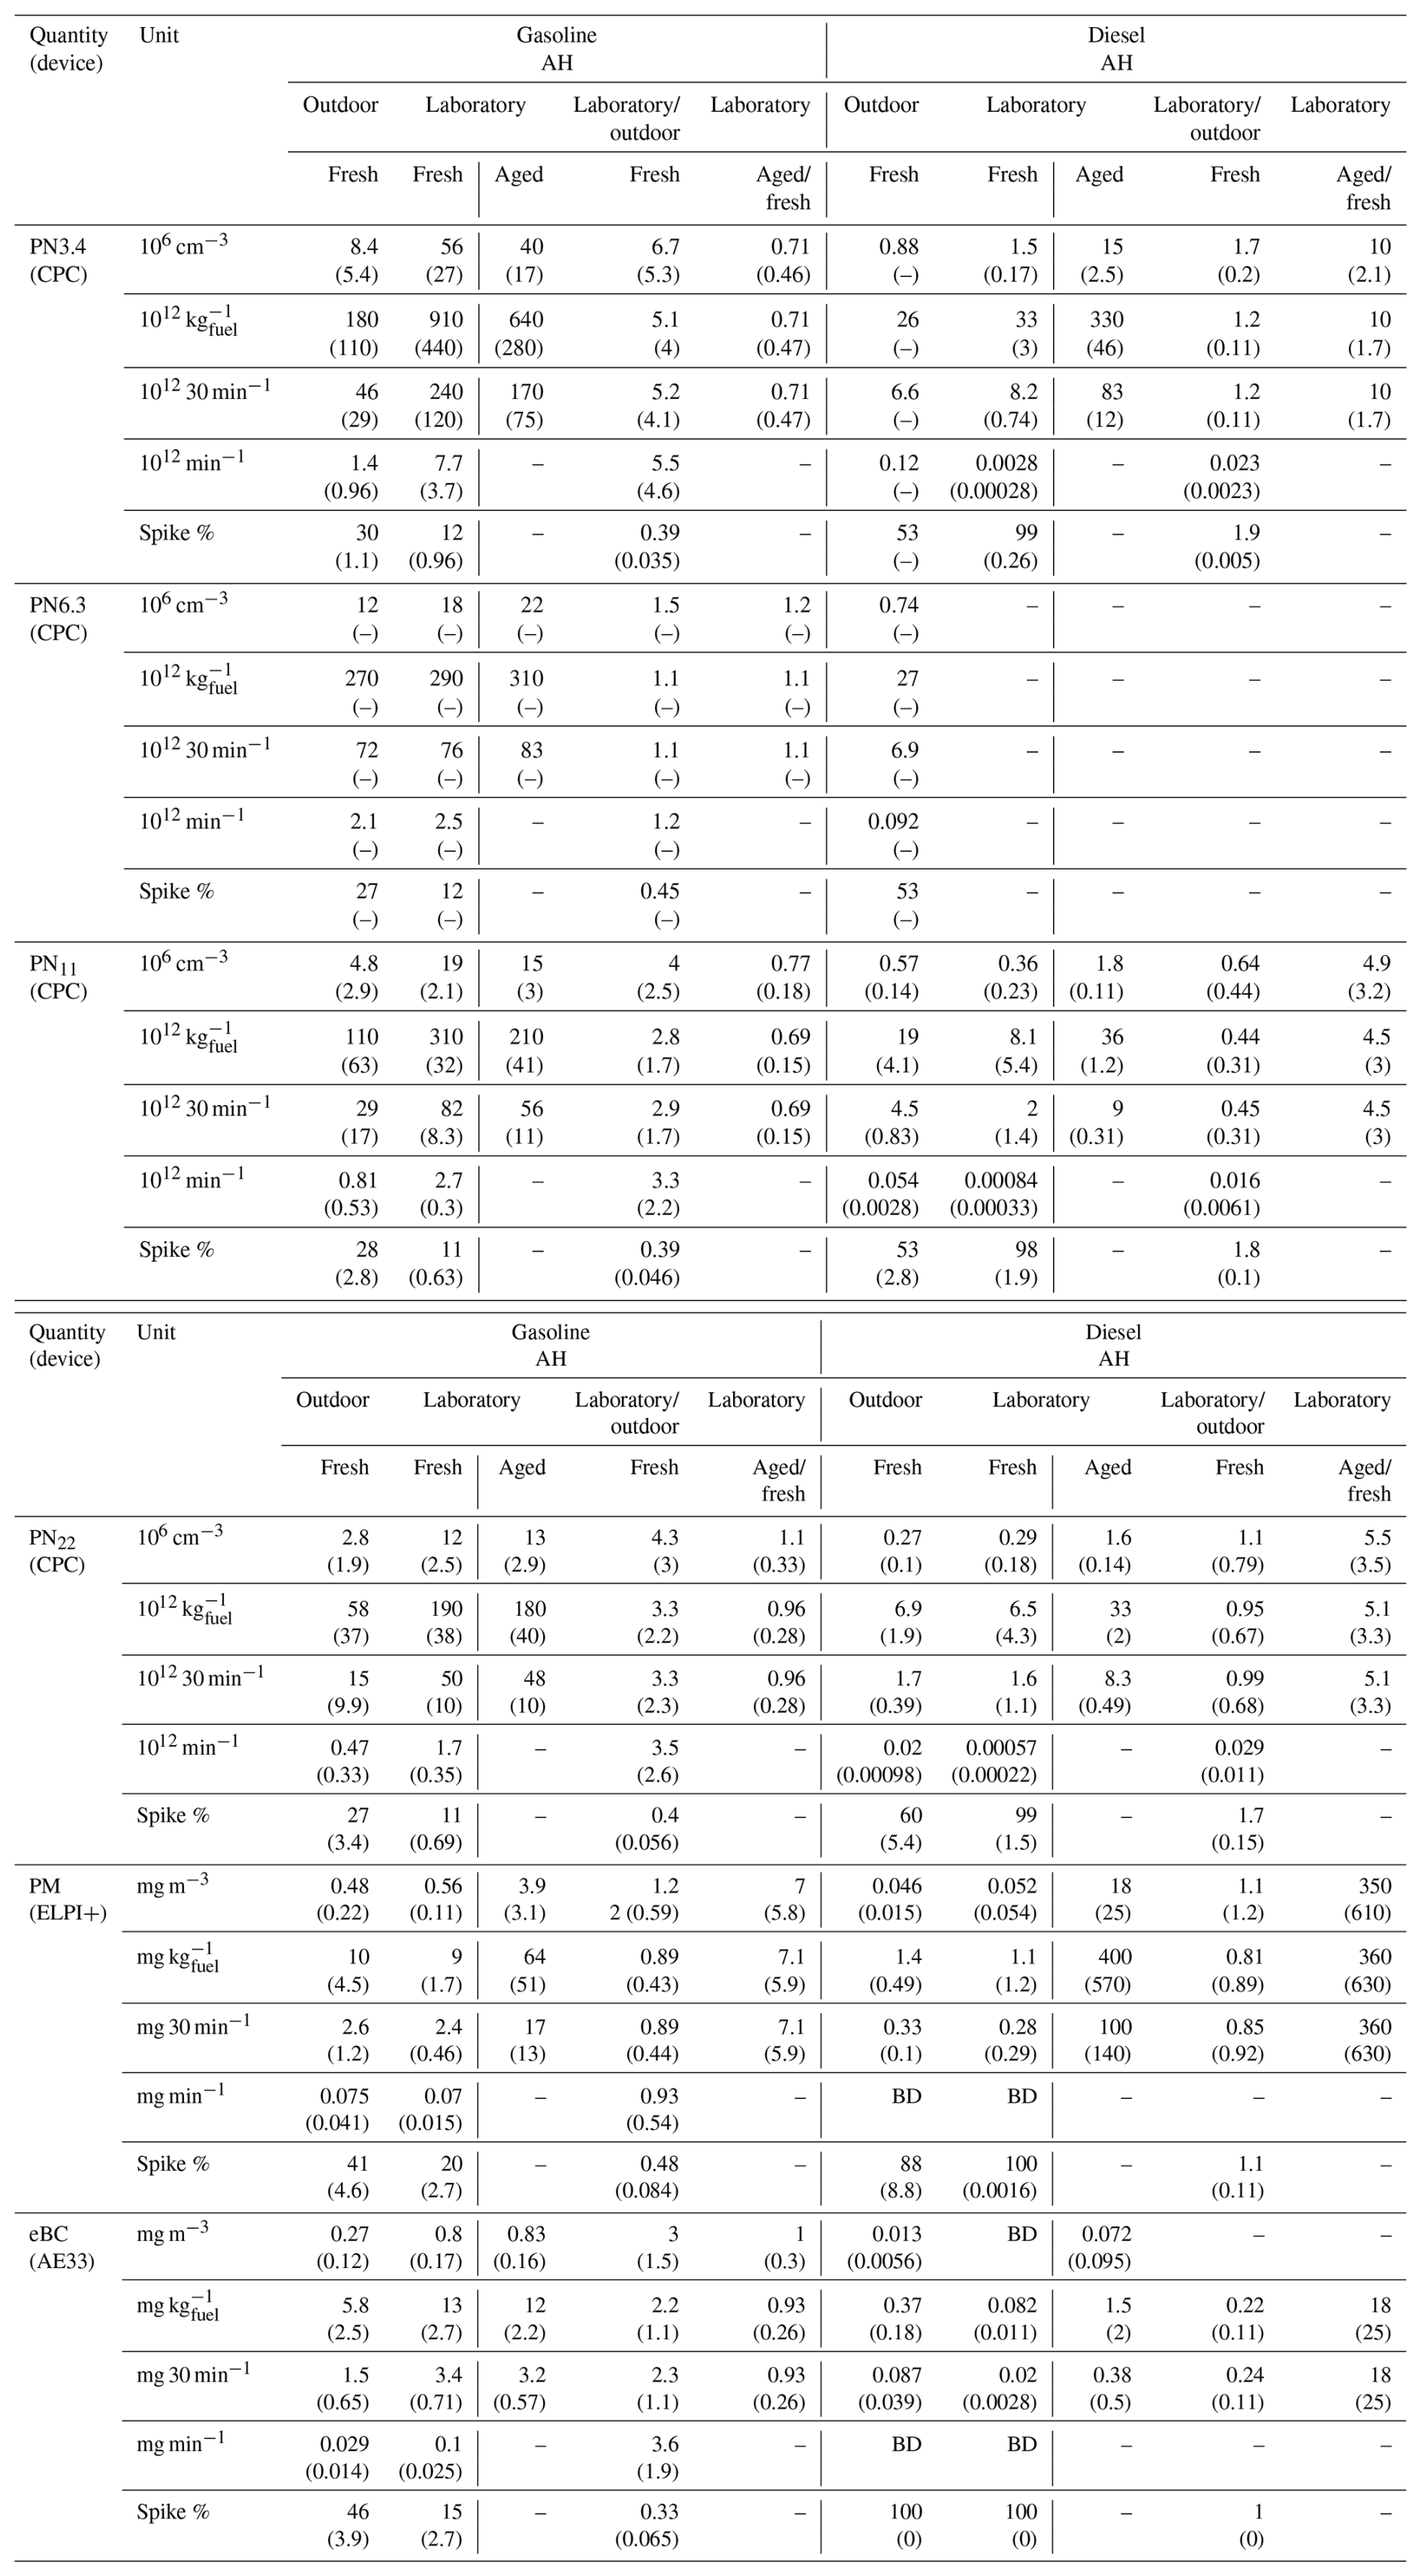
Table 3Mean concentrations, emission factors per kg of consumed fuel, emission factors for the whole 30 min cycle, emission factors for 1 min of stable operation, and the fraction of emissions emitted during the spike periods (ignition and shutdown) for the particle emissions, with standard deviations of respective values inside parentheses. The chamber-aged EFs from the laboratory measurement campaign are also presented. Aged to fresh ratios were calculated from changes in concentrations in the chamber. For the outdoor measurements, the number of repeated measurements used to calculate means and standard deviations for all instruments besides CPCs was four; for the CPCs, PN3.4 had one measurement for diesel AH and two for gasoline AH, while PN6.3 nm had one measurement for both fuel types. For the laboratory measurements, the number of repeated measurements used to calculate means and standard deviations was two for all instruments besides CPCs; for CPCs, PN3.4 had two measurements for both AHs, and PN6.3 had one measurement for gasoline and zero for diesel. Measurements for which measured values were below the device detection limit are marked with BD, whereas “–” indicates data not being available, and, for measurements with only single measurement available, the lack of standard deviation is denoted with (–).
Chamber-aged EF30 min values were 5 to 10 times smaller than TSAR-aged EF30 min values, with the renewable diesel measurement being a major outlier, with the chamber-aged EF30 min being 1.4 times greater than the TSAR-aged EF30 min (Fig. 9). This might be due to the differing chemical composition of both particles and secondary aerosol precursors produced by combustion of renewable diesel having different reactivity to rapid ozone and UV-light-induced ageing process of TSAR, whereas, in the chamber ageing, SOA formation pathways might differ.
In the measurements where H2O2 was injected into the chamber, more SOA formation occurred in the chamber than in the TSAR. It is especially noteworthy that, after H2O2 boosted chamber ageing, the detected PM concentrations decreased if chamber-aged sample was also aged with TSAR (Fig. 9). Without H2O2 addition, chamber ageing roughly doubled PM EF30 min values when compared to fresh emissions for gasoline and regular diesel. H2O2 addition caused further increase by a factor of 4.2 and 12 for gasoline and diesel AH exhausts, respectively. For the renewable diesel, increase was by a factor of 630, and H2O2 caused further increase by a factor of 3.6. It is assumed that the chamber-aged EFs are most representative for SOA formation from exhaust emissions under normal atmospheric ageing conditions, whereas TSAR provides information on the maximal SOA formation potential under extremely favourable SOA formation conditions.
Relative variances in the measured fresh and aged EF30 min values were compared to estimate similarities of differently aged EF measurements between fuel types and consistency of repeated measurements with the same fuel. The directly measured fresh EF30 min values had the smallest relative variance of 1.2 between repeated measurements and different fuel types. Of the aged EF30 min values, the TSAR-aged EF30 min has the smallest relative variance of 4.6. In contrast, the chamber-aged EF30 min, H2O2-boosted chamber-aged EF30 min, and chamber- and TSAR-aged EF30 min have relative variances of 35, 113, and 72, respectively. This means that, despite relatively small variances in fresh EF30 min values between measurements, the ageing process with chamber or TSAR increases the variability in PM emissions. It should be noted that renewable diesel measurement is a major outlier from the rest of the measurements. If renewable diesel was excluded from the calculations, then the relative variances would be significantly lower, with 0.74, 3.8, 3.7, 5.4, and 0.2 for fresh EF30 min, TSAR-aged EF30 min, chamber-aged EF30 min, H2O2-boosted chamber-aged EF30 min, and chamber- and TSAR-aged EF30 min, respectively.
A multifaceted analysis of the emissions produced by auxiliary heaters was conducted in order to comprehensively address the environmental concerns arising from their use in passenger cars. This study utilized a combination of controlled outdoor experiments and laboratory investigations to provide a holistic understanding of the emission profiles AH systems operated with common fuels. By comprehensively analysing emissions under various conditions and fuel scenarios, this research contributes to a deeper understanding of AH emissions in atmospheric context.
We explored the impact of the operating temperature on emission profiles, mainly the role of laboratory and Finnish winter conditions (−19 to −7 °C), uncovering distinct effects across various emission components. For most emission components, the cold environmental temperature usually led to lowered emission factors of exhaust pollutants; however, there are some contradictory observations. One important feature of the cold combustion conditions is the denser intake air, which is due to ideal gas law which naturally leads to higher air-to-fuel mass ratios. This can enable cleaner combustion conditions.
Our investigation revealed the importance of start and shutdown events on emission rates, and further disparities between gasoline and diesel emissions, during steady-state conditions where significant particle emissions persist in gasoline engines. This significant effect of ignition and shutdown to AH emissions indicates that AH heating is less polluting when it is done in longer continuous periods to avoid excessive on–off switching producing emission spikes. The effect of frequent ignitions is especially important for those vehicles where AH heating is also periodically needed during driving.
Of the regulated gaseous emissions, the CO concentrations exceeded the regulation limits of 1000 ppm for gasoline AH. This especially should be taken account when the AHs are used in closed environments, such as unheated parking garages. THC and OGC concentrations stayed under regulation limits during stable operation, but, during ignition and shutdown, the limits were exceeded.
The detailed quantification of gaseous and particle emissions included an assessment of the role of secondary aerosol formation from the AH exhausts. Our findings highlight the emergence of aged aerosols, specifically secondary organic aerosol formation, under simulated photochemical OH-exposure conditions. These aged aerosols were seen to surpass fresh PM mass emissions by 1 to 3 orders of magnitude, and the effect of ageing was found to be especially prominent during the ignition and shutdown phases of AH operation. This indicates that main atmospheric PM effects of AH are released in the gas phase from the exhaust line. This gives the indication that functioning oxidation catalysts, for example, could be a solution for secondary organic PM reduction. Further research is still needed to quantify which specific chemical and physical processes are the main drivers of secondary organic aerosol formation from AH exhaust.
We emphasize the need for continued research to enhance our understanding of emissions of fuel-operated auxiliary heaters at vehicle fleet level to more accurately quantify their effects on air quality and global road transport emissions. There is a need to revise the emission regulation for auxiliary heating devices. As with the current legislation, it is possible to surpass the emission limits defined for vehicles with the auxiliary heater taking care of additional heating for the engine and cabin, as AH emissions are not counted as part of regulated vehicle emissions. The current specific regulations of AHs are also less restrictive than vehicle emission regulations. Less restrictive regulations combined with AH emissions not being counted as part of vehicle emissions allow greater total emissions from vehicle use, if heat required by the vehicle is generated in a separate AH unit as opposed to generating the same heat with an internal combustion engine.
The data and codes are currently available by reasonable request from the authors.
The supplement related to this article is available online at https://doi.org/10.5194/amt-18-4271-2025-supplement.
HO: conceptualization, methodology, formal analysis, investigation, software, visualization, writing (original draft and revision). AH: formal analysis, visualization, writing (original draft preparation and review and editing). PS: investigation, data curation, formal analysis, writing (original draft preparation and review and editing). MO: conceptualization, data curation, investigation, methodology, project administration, resources, writing (review and editing). UVM: formal analysis, visualization, writing (review and editing). PeM: investigation. LS: investigation, writing (review and editing). VS: investigation. SMa: conceptualization, data curation, investigation. JH: investigation. MI: investigation. PaM: investigation. PY: investigation. OS: investigation, writing (revised article). SMi: conceptualization, methodology, funding acquisition, project administration, supervision, writing (original draft and revision). PK: conceptualization, investigation, methodology, funding acquisition, project administration, supervision, writing (original draft and revision).
The contact author has declared that none of the authors has any competing interests.
Publisher’s note: Copernicus Publications remains neutral with regard to jurisdictional claims made in the text, published maps, institutional affiliations, or any other geographical representation in this paper. While Copernicus Publications makes every effort to include appropriate place names, the final responsibility lies with the authors.
This research has been supported by the Jane ja Aatos Erkon Säätiö (AHMA 2020), the Tampere Institute for Advanced Study (Tampere IAS), the Kone Foundation (Sampsa Martikainen, 2019), Henry Fordin Säätiö (grant no. 20230042), and the following Research Council of Finland (RCoF) grants: competitive funding to strengthen university research profiles (PROFI) for the University of Eastern Finland (grant nos. 325022 and 352968), flagship programme “ACCC” (grant nos. 337550, 337551, 359343, and 357903), and Academy Research Fellowship (grant no. 354226).
This paper was edited by Yoshiteru Iinuma and reviewed by two anonymous referees.
Barmet, P., Dommen, J., DeCarlo, P. F., Tritscher, T., Praplan, A. P., Platt, S. M., Prévôt, A. S. H., Donahue, N. M., and Baltensperger, U.: OH clock determination by proton transfer reaction mass spectrometry at an environmental chamber, Atmos. Meas. Tech., 5, 647–656, https://doi.org/10.5194/amt-5-647-2012, 2012.
DeCarlo, P. F., Kimmel, J. R., Trimborn, A., Northway, M. J., Jayne, J. T., Aiken, A. C., Gonin, M., Fuhrer, K., Horvath, T., Docherty, K. S., Worsnop, D. R., and Jimenez, J. L.: Field-Deployable, High-Resolution, Time-of-Flight Aerosol Mass Spectrometer, Anal. Chem., 78, 8281–8289, https://doi.org/10.1021/ac061249n, 2006.
European Union: Consolidated text: Directive 98/70/EC of the European Parliament and of the Council of 13 October 1998 relating to the quality of petrol and diesel fuels and amending Council Directive 93/12/EEC, http://data.europa.eu/eli/dir/1998/70/2023-11-20 (last access: 6 June 2025), 1998.
European Union: Regulation 122/2010, Regulation No 122 of the Economic Commission for Europe of the United Nations (UN/ECE) — Uniform technical prescriptions concerning the approval of vehicles of categories M, N and O with regard to their heating systems, https://data.europa.eu/eli/reg/2010/122(2)/oj (last access: 31 January 2025), 2010.
Giechaskiel, B. and Clairotte, M.: Fourier Transform Infrared (FTIR) Spectroscopy for Measurements of Vehicle Exhaust Emissions: A Review, Appl. Sci., 11, 7416, https://doi.org/10.3390/app11167416, 2021.
Hartikainen, A. H., Ihalainen, M., Yli-Pirilä, P., Hao, L., Kortelainen, M., Pieber, S. M., and Sippula, O.: Photochemical transformation and secondary aerosol formation potential of Euro6 gasoline and diesel passenger car exhaust emissions, J. Aerosol Sci., 171, 106159, https://doi.org/10.1016/j.jaerosci.2023.106159, 2023.
Järvinen, A., Aitomaa, M., Rostedt, A., Keskinen, J., and Yli-Ojanperä, J.: Calibration of the new electrical low pressure impactor (ELPI+), J. Aerosol Sci., 69, 150–159, https://doi.org/10.1016/j.jaerosci.2013.12.006, 2014.
Karjalainen, P., Timonen, H., Saukko, E., Kuuluvainen, H., Saarikoski, S., Aakko-Saksa, P., Murtonen, T., Bloss, M., Dal Maso, M., Simonen, P., Ahlberg, E., Svenningsson, B., Brune, W. H., Hillamo, R., Keskinen, J., and Rönkkö, T.: Time-resolved characterization of primary particle emissions and secondary particle formation from a modern gasoline passenger car, Atmos. Chem. Phys., 16, 8559–8570, https://doi.org/10.5194/acp-16-8559-2016, 2016.
Karjalainen, P., Rönkkö, T., Simonen, P., Ntziachristos, L., Juuti, P., Timonen, H., Teinilä, K., Saarikoski, S., Saveljeff, H., Lauren, M., Happonen, M., Matilainen, P., Maunula, T., Nuottimäki, J., and Keskinen, J.: Strategies to diminish the emissions of particles and secondary aerosol formation from diesel engines, Environ. Sci. Technol., 53, 10408–10416, https://doi.org/10.1021/acs.est.9b04073, 2019.
Karjalainen, P., Nikka, M., Olin, M., Martikainen, S., Rostedt, A., Arffman, A., and Mikkonen, S.: Fuel-Operated Auxiliary Heaters Are a Major Additional Source of Vehicular Particulate Emissions in Cold Regions, Atmosphere, 12, 1105, https://doi.org/10.3390/atmos12091105, 2021.
Keskinen, J. and Rönkkö, T.: Can Real-World Diesel Exhaust Particle Size Distribution be Reproduced in the Laboratory? A Critical Review Jorma Keskinen, J. Air Waste Manage., 60, 1245–1255, https://doi.org/10.3155/1047-3289.60.10.1245, 2010.
Keskinen, J., Pietarinen, K., and Lehtimäki, M.: Electrical low pressure impactor, J. Aerosol Sci., 23, 353–360, https://doi.org/10.1016/0021-8502(92)90004-F, 1992.
Kostenidou, E., Marques, B., Temime-Roussel, B., Liu, Y., Vansevenant, B., Sartelet, K., and D'Anna, B.: Secondary organic aerosol formed by Euro 5 gasoline vehicle emissions: chemical composition and gas-to-particle phase partitioning, Atmos. Chem. Phys., 24, 2705–2729, https://doi.org/10.5194/acp-24-2705-2024, 2024.
La Battaglia, V., Mussi, V., Marini, S., and Giorgetti, A.: Investigation of Damage Caused by Chlorine-Contaminated Fuel in Standard Vehicle Components, Eng. Proc., 85, 8, https://doi.org/10.3390/Engproc2025085008, 2025.
Leskinen, A., Yli-Pirilä, P., Kuuspalo, K., Sippula, O., Jalava, P., Hirvonen, M.-R., Jokiniemi, J., Virtanen, A., Komppula, M., and Lehtinen, K. E. J.: Characterization and testing of a new environmental chamber, Atmos. Meas. Tech., 8, 2267–2278, https://doi.org/10.5194/amt-8-2267-2015, 2015.
Liu, P. S. K., Deng, R., Smith, K. A., Williams, L. R., Jayne, J. T., Canagaratna, M. R., Moore, K., Onasch, T. B., Worsnop, D. R., and Deshler, T.: Transmission Efficiency of an Aerodynamic Focusing Lens System: Comparison of Model Calculations and Laboratory Measurements for the Aerodyne Aerosol Mass Spectrometer, Aerosol Sci. Tech., 41, 721–733, https://doi.org/10.1080/02786820701422278, 2007.
Marjamäki, M., Ntziachristos, L., Virtanen, A., Ristimäki, J., Keskinen, J., Moisio, M., Palonen, M., and Lappi, M.: Electrical filter stage for the ELPI, SAE Technical Paper, 7, https://doi.org/10.4271/2002-01-0055, 2002.
Middlebrook, A. M., Bahreini, R., Jimenez, J. L., and Canagaratna, M. R.: Evaluation of Composition-Dependent Collection Efficiencies for the Aerodyne Aerosol Mass Spectrometer using Field Data, Aerosol Sci. Tech., 46, 258–271, https://doi.org/10.1080/02786826.2011.620041, 2012.
Mohr, C., Huffman, A., Cubison, M., Aiken, A., Docherty, K., Kimmel, J., Ulbrich, I., Hannigan, M., and Jimenez, J.: Characterization of Primary Organic Aerosol Emissions from Meat Cooking, Trash Burning, and Motor Vehicles with High-Resolution Aerosol Mass Spectrometry and Comparison with Ambient and Chamber Observations, Environ. Sci. Technol., 43, 2443–2449, https://doi.org/10.1021/es8011518, 2009.
Nagy, P., Szabó, Á. I., Zsoldos, I., and Szabados, G.: Particle Number Concentration and SEM-EDX Analyses of an Auxiliary Heating Device in Operation with Different Fossil and Renewable Fuel, Inventions, 9, 13, https://doi.org/10.3390/inventions9010013, 2024.
Ntziachristos, L., Samaras, Z., Kouridis, C., Samaras, C., Hassel, D., Mellios, G., McCrae, I., Hickman, J., Zierock, K.-H., Keller, M., Rexeis, M., Andre, M., Winther, M., Gorissen, N., Boulter, P., Katsis, P., Journard, R., Rijkeboer, R., Geivanidis, S., Hausberger, S., Karageorgiou, T., and Lekaki, D.: EMEP/EEA air pollutant emission inventory guidebook 2023 – Update 2024, Chap. 1.A.3.b.i-iv Road transport 2024, European Environment Agency, https://www.eea.europa.eu/publications/emep-eea-guidebook-2023/part-b-sectoral-guidance-chapters/1-energy/1-a-combustion/1-a-3-b-i (last access: 31 January 2025), 2024.
Olin, M., Leinonen V., Martikainen, S., Mäkinen, U.-V., Oikarinen, H., Mikkonen, S., and Karjalainen, P.: Engine preheating under real-world subfreezing conditions provides less than expected benefits to vehicle fuel economy and emission reduction for light-duty vehicles, Appl. Energ., 351, 121805, https://doi.org/10.1016/j.apenergy.2023.121805, 2023.
Oikarinen, H., Olin, M., Martikainen, S., Leinonen, V., Mikkonen, S., and Karjalainen, P.: Particle number, mass, and black carbon emissions from fuel-operated auxiliary heaters in real vehicle use, Atmospheric Environment: X, 16, 100189, https://doi.org/10.1016/j.aeaoa.2022.100189, 2022.
Onasch, T. B., Trimborn, A., Fortner, E. C., Jayne, J. T., Kok, G. L., Williams, L. R., Davidovits, P., and Worsnop, D. R.: Soot Particle Aerosol Mass Spectrometer: Development, Validation, and Initial Application, Aerosol Sci. Tech., 46, 804–817, https://doi.org/10.1080/02786826.2012.663948, 2012.
Palm, B. B., Campuzano-Jost, P., Ortega, A. M., Day, D. A., Kaser, L., Jud, W., Karl, T., Hansel, A., Hunter, J. F., Cross, E. S., Kroll, J. H., Peng, Z., Brune, W. H., and Jimenez, J. L.: In situ secondary organic aerosol formation from ambient pine forest air using an oxidation flow reactor, Atmos. Chem. Phys., 16, 2943–2970, https://doi.org/10.5194/acp-16-2943-2016, 2016.
Pettinen, R., Anttila, J., Muona, T., Pihlatie, M., and Åman, R.: Testing Method for Electric Bus Auxiliary Heater Emissions, Energies, 16, 3578, https://doi.org/10.3390/en16083578, 2023.
Simonen, P., Saukko, E., Karjalainen, P., Timonen, H., Bloss, M., Aakko-Saksa, P., Rönkkö, T., Keskinen, J., and Dal Maso, M.: A new oxidation flow reactor for measuring secondary aerosol formation of rapidly changing emission sources, Atmos. Meas. Tech., 10, 1519–1537, https://doi.org/10.5194/amt-10-1519-2017, 2017.
Timonen, H., Karjalainen, P., Saukko, E., Saarikoski, S., Aakko-Saksa, P., Simonen, P., Murtonen, T., Dal Maso, M., Kuuluvainen, H., Bloss, M., Ahlberg, E., Svenningsson, B., Pagels, J., Brune, W. H., Keskinen, J., Worsnop, D. R., Hillamo, R., and Rönkkö, T.: Influence of fuel ethanol content on primary emissions and secondary aerosol formation potential for a modern flex-fuel gasoline vehicle, Atmos. Chem. Phys., 17, 5311–5329, https://doi.org/10.5194/acp-17-5311-2017, 2017.
Virtanen, A., Marjamäki, M., Ristimäki, J., and Keskinen, J.: Fine particle losses in electrical low-pressure impactor, J. Aerosol Sci., 32, 389–401, https://doi.org/10.1016/S0021-8502(00)00087-2, 2001.
Wærsted, E., Sundvor, I., Denby, B., and Mu, Q.: Quantification of temperature dependence of NOx emissions from road traffic in Norway using air quality modelling and monitoring data, Atmospheric Environment: X, 13, 100160, https://doi.org/10.1016/j.aeaoa.2022.100160, 2022.
Yli-Ojanperä, J., Kannosto, J., Marjamäki, M., and Keskinen, J.: Improving the Nanoparticle Resolution of the ELPI, Aerosol Air Qual. Res., 10, 360–366, https://doi.org/10.4209/aaqr.2009.10.0060, 2010.
Zhu, W., Guo, S., Zhang, Z., Wang, H., Yu, Y., Chen, Z., Shen, R., Tan, R., Song, K., Liu, K., Tang, R., Liu, Y., Lou, S., Li, Y., Zhang, W., Zhang, Z., Shuai, S., Xu, H., Li, S., Chen, Y., Hu, M., Canonaco, F., and Prévôt, A. S. H.: Mass spectral characterization of secondary organic aerosol from urban cooking and vehicular sources, Atmos. Chem. Phys., 21, 15065–15079, https://doi.org/10.5194/acp-21-15065-2021, 2021.