the Creative Commons Attribution 4.0 License.
the Creative Commons Attribution 4.0 License.
 | 27 Jan 2025
Discriminating between “drizzle or rain” and sea salt aerosols in Cloudnet for measurements over the Barbados Cloud Observatory
Johanna Roschke
Jonas Witthuhn
Marcus Klingebiel
Moritz Haarig
Andreas Foth
Anton Kötsche
Heike Kalesse-Los
The highly sensitive Ka-band cloud radar at the Barbados Cloud Observatory (BCO) frequently reveals radar reflectivity signals below −50 dBZ within the convective sub-cloud layer. These so-called haze echoes are signals from hygroscopically grown sea salt aerosols. Within the Cloudnet target classification scheme, haze echoes are generally misclassified as precipitation (target class: “drizzle or rain”). We present a technique to discriminate between “drizzle or rain” and sea salt aerosols in Cloudnet that is applicable to marine Cloudnet sites. The method is based on deriving heuristic probability functions utilizing a combination of cloud radar reflectivity factor, radar mean Doppler velocity, and the ceilometer attenuated backscatter coefficient. The method is crucial for investigating the occurrence of precipitation and significantly improves the Cloudnet target classification scheme for measurements at the BCO. The results are validated against the amount of precipitation detected by the Virga-Sniffer tool. We analyze data for measurements at BCO covering 2 years (July 2021–July 2023). A first-ever statistical analysis of the Cloudnet target classification product including the new “haze echo” target over 2 years at the BCO is presented. In the atmospheric column above the BCO, “drizzle or rain” is on average more frequent during the dry season compared to the wet season due to the higher occurrence of warm clouds contributing to the amount of precipitation. Haze echoes are identified about 4 times more often during the dry season compared to the wet season. The frequency of occurrence of “drizzle or rain” in Cloudnet caused by misclassified haze echoes is overestimated by up to 16 %. Supported by the Cloudnet statistics and the results obtained from the Virga-Sniffer tool, 48 % of detected warm clouds in the dry and wet season precipitate. The proportion of precipitation evaporating fully before reaching the ground (virga) is higher during the dry season.
- Article
(9491 KB) - Full-text XML
- BibTeX
- EndNote


The uncertainty in tropical low-cloud feedback in model estimates of climate sensitivity limits our ability to project the magnitude of future climate change impacts (Cesana and Del Genio, 2021). The prevailing cloud type in the trade wind region that covers most of the tropical oceans is shallow cumulus clouds or, in other words, “trade wind cumuli” (Medeiros et al., 2015). A comprehensive characterization of these clouds from observations is necessary for evaluating their representation in models. Their macrophysical properties have been widely studied (Nuijens et al., 2014, 2015a, b). However, obtaining appropriate microphysical parameterizations is still a challenge. An often cited reason is the lack of representative observations and radiative measurements for verification (Stevens et al., 2016).
Trade wind cumuli redistribute moisture within the atmosphere, which is necessary for the formation of deep convection, and help drive the Hadley cell circulation (Lonitz, 2014). Their spatial structure and evolution can be influenced by precipitation (Albrecht et al., 1995; Albrecht, 1993). Precipitation from trade wind cumuli often occurs in the form of drizzle (Wu et al., 2017) that often evaporates before reaching the ground (Kalesse-Los et al., 2023). Precipitation evaporation influences the moisture and heat budgets of clouds themselves (Emanuel et al., 1994) as well as the sub-cloud environment via the formation of cold pools (Langhans and Romps, 2015). Accurate estimates of the frequency and intensity of precipitation from trade wind clouds, especially over extended periods, are rare.
A suitable location with the necessary instrumentation to study precipitation from trade wind cumuli is the Barbados Cloud Observatory (BCO). The observatory is equipped with ground-based remote sensing instruments and provides consistent long-term observational datasets that make it a unique measurement station in the maritime tropics (Stevens et al., 2016). The highly sensitive vertical-profiling Ka-band cloud radar at the BCO frequently reveals radar reflectivities between −50 and −65 dBZ that are referred to as haze echoes (Klingebiel et al., 2019). The majority of these haze echoes occur within updrafts and below the cloud-base height of shallow cumulus clouds and are caused by hygroscopically grown sea salt aerosols (Klingebiel et al., 2019).
The processes leading to the frequent existence of large sea salt aerosols in the sub-cloud layer at BCO are illustrated in Fig. 1 and can be summarized as follows: sea salt aerosols are injected into the atmosphere from whitecaps of breaking waves. Whitecap formation strongly depends on wind speed, which controls the concentration and sizes of sea salt aerosols (Woodcock, 1953; Lewis and Schwartz, 2004). For wind speeds larger than 5 m s−1 the percentage covered by whitecaps increases as the square of the wind speed. While wind speed is certainly the most important factor, parameters such as sea surface temperature and salinity, atmospheric stability, and wave height have been found to influence the production of sea salt aerosols at the ocean surface (Lewis and Schwartz, 2004). Over Barbados, the average near-surface relative humidity is found to be larger than 70 % throughout the year (Klingebiel et al., 2019). From the surface, the relative humidity increases almost linearly to saturation at the base of the cloud (Nuijens et al., 2015a). Consequently, the humidity conditions over Barbados favor the existence of sea salt particles in a deliquescent state (Haarig et al., 2017). Within the convective boundary layer, sea salt aerosols are transported towards higher altitudes (indicated by positive radar mean Doppler velocities in Fig. 1). Due to their hygroscopicity, the sea salt particles grow in size with increasing relative humidity, which can be observed by an increase in the radar reflectivity factor from lower sub-cloud layer altitudes towards the cloud base (Klingebiel et al., 2019). The diameter of sea salt aerosols can range between 0.2 µm and greater than 50 µm (Lewis and Schwartz, 2004). Measurements of marine aerosol particles in Oahu, Hawaii, show that coastal breaking waves produce aerosol particles with dry diameters of around 7 µm that double in size for ambient relative humidities of 80 % (Clarke et al., 2003). Klingebiel et al. (2019) retrieved equivolumetric particle diameters following the method of O'Connor et al. (2005) for atmospheric profiles containing haze echoes at the BCO. The retrieved diameters range between 6 and 11 µm with total number concentrations of 20 cm−3 near the cloud base (Klingebiel et al., 2019). This means that sea salt aerosols can grow to the size of cloud droplets, which typically have a diameter of around 5 to 20 µm in maritime clouds (Wallace and Hobbs, 2006). The size at which cloud droplets transition to precipitation varies in the literature. Glienke et al. (2017) define drizzle as drops that are large enough to have fall velocities that exceed the typical fluctuations of vertical velocity in the cloud. For a reasonable range of stratocumulus vertical velocities of 0.1 to 1 m s−1, the corresponding diameters are approximately 50 to 250 µm (Glienke et al., 2017). This is also in line with O'Connor et al. (2005), who defined drizzle as drops with a diameter greater than 50 µm.
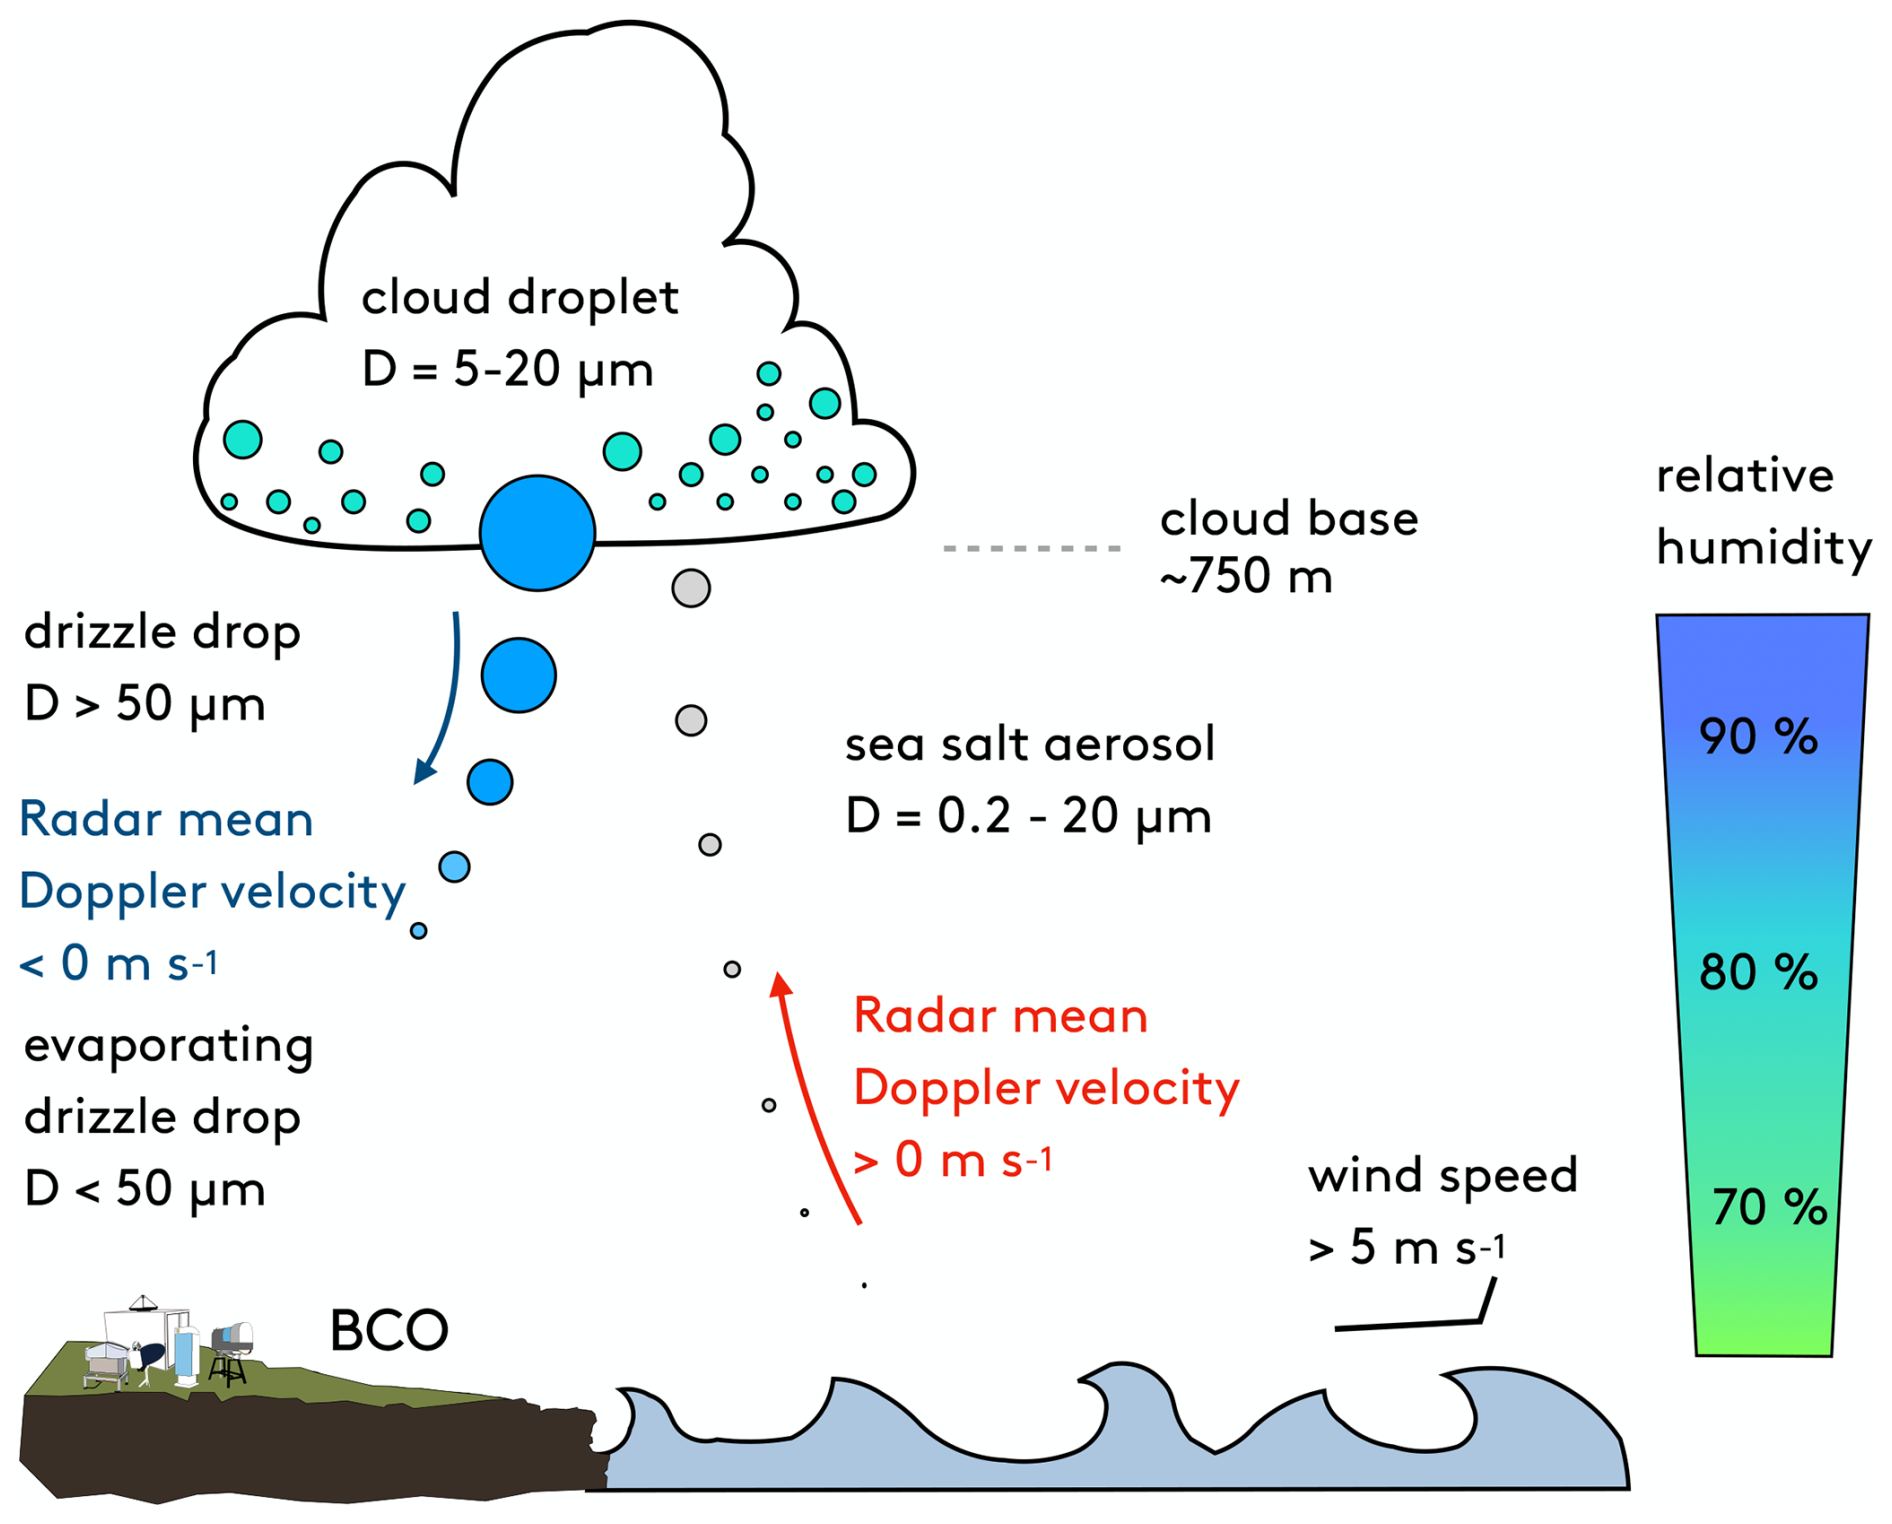
Figure 1Schematic showing the range of diameters (D) for different hydrometeors and sea salt aerosols occurring in the marine boundary layer over the Barbados Cloud Observatory (BCO).
Various threshold-based techniques exist to distinguish between clouds, drizzle, and sea salt particles from ground-based cloud radar observations. However, the proportion of radar reflectivity signals associated with cloud droplets, precipitating hydrometeors, or sea salt aerosol particles is poorly constrained and often depends on the choice of threshold values. Nuijens et al. (2014) chose a threshold value of −40 dBZ for the radar reflectivity measurements to filter out clutter and atmospheric plankton from the measurements of the Ka-band cloud radar (KATRIN) at the BCO. Their study demonstrates that the proportion of detected clouds near the lifting condensation level (LCL) increases when lowering this radar reflectivity threshold as more optically thin clouds will contribute to the derived cloud cover.
Lamer et al. (2015) also commented on the challenges in choosing an appropriate method to filter out cloud radar echoes affected by precipitation size particles and sea clutter at BCO. They discarded the lowest 510 m of KATRIN radar data, which (mostly) does not eliminate cloud echoes (as cloud-base heights are usually higher) but filters out rain shafts below the cloud base. Acquistapace et al. (2019) introduced a new algorithm to detect drizzle development in warm clouds based on the skewness of Ka-band radar Doppler spectra. For a case study over the BCO in 2013, they found that radar reflectivities below −50 dBZ exist when the algorithm identifies precipitating particles or Cloudnet classifies “drizzle or rain”. With the replacement of the KATRIN cloud radar by the Combined Radar And Lidar (CORAL) instrument at BCO in April 2015, studies commonly employed a threshold of −50 dBZ to filter out haze echoes in the BCO radar measurements (Klingebiel et al., 2019; Schulz et al., 2021; Vogel et al., 2021). However, it remains unclear if this threshold also eliminates radar echoes caused by precipitation below the cloud base at BCO as the Cloudnet target classification suggests. If so, radar-based precipitation statistics would be influenced.
Synergistic retrievals such as Cloudnet provide the potential to identify different hydrometeors by applying state-of-the-art data processing chains for a complex combination of data from ground-based remote sensing instruments (Illingworth et al., 2007). Cloudnet, which began in 2002 as a European research project with three stations, has since developed into a continuously operating network of 25 stations throughout Europe. Currently, Cloudnet is funded by the European Commission under the Seventh Framework Program as part of ACTRIS (Aerosol, Clouds and Trace Gases Research Infrastructure) (Laj et al., 2024). Cloudnet offers a range of products, including the target classification scheme, designed to identify the physical phase of hydrometeors. However, based on its simple approach of classifying all continuous radar reflectivities below the cloud base as precipitation, haze echoes from sea salt aerosol at BCO are also classified as “drizzle or rain” within the Cloudnet target classification scheme.
More recently, Kalesse-Los et al. (2023) introduced the functionality of a tool, called the Virga-Sniffer, to distinguish precipitation that fully evaporates in dry sub-cloud layers (virga) from precipitation that reaches the ground based on a synergy of cloud radar and ceilometer measurements. During the Elucidating the Role of Cloud–Circulation Coupling in Climate (EUREC4A) field experiment (Stevens et al., 2021) in January and February 2020 in the tropical western Atlantic, they observed that a substantial quantity of trade wind cumuli over the research vessel (RV) Meteor produce virga (Kalesse-Los et al., 2023).
The structure of the paper is as follows: the relevant instrumentation, datasets, and tools, including the standard Cloudnet target classification and the Virga-Sniffer tool, are described briefly in Sect. 2. The method developed in the present study for discriminating between “drizzle or rain” and sea salt aerosols (from here on used synonymously for “haze echoes”), as well as the object-based cloud type classification technique, is introduced in Sect. 4.1. For the long-term statistics based on 2 years of observations between July 2021 and July 2023 at the BCO, the impact of environmental factors controlling the occurrence of haze echoes is investigated in Sect. 4.3. For the first time we conduct long-term statistics of the proposed modified Cloudnet target classification including haze echoes at the BCO (Sect. 4.2). Moreover, we compare our method with the −50 dBZ haze echo detection threshold method and to the Virga-Sniffer tool in Sect. 4.3. Limitations of the newly developed haze echo identification method are discussed in Sect. 4.4. Conclusions are given in Sect. 5.
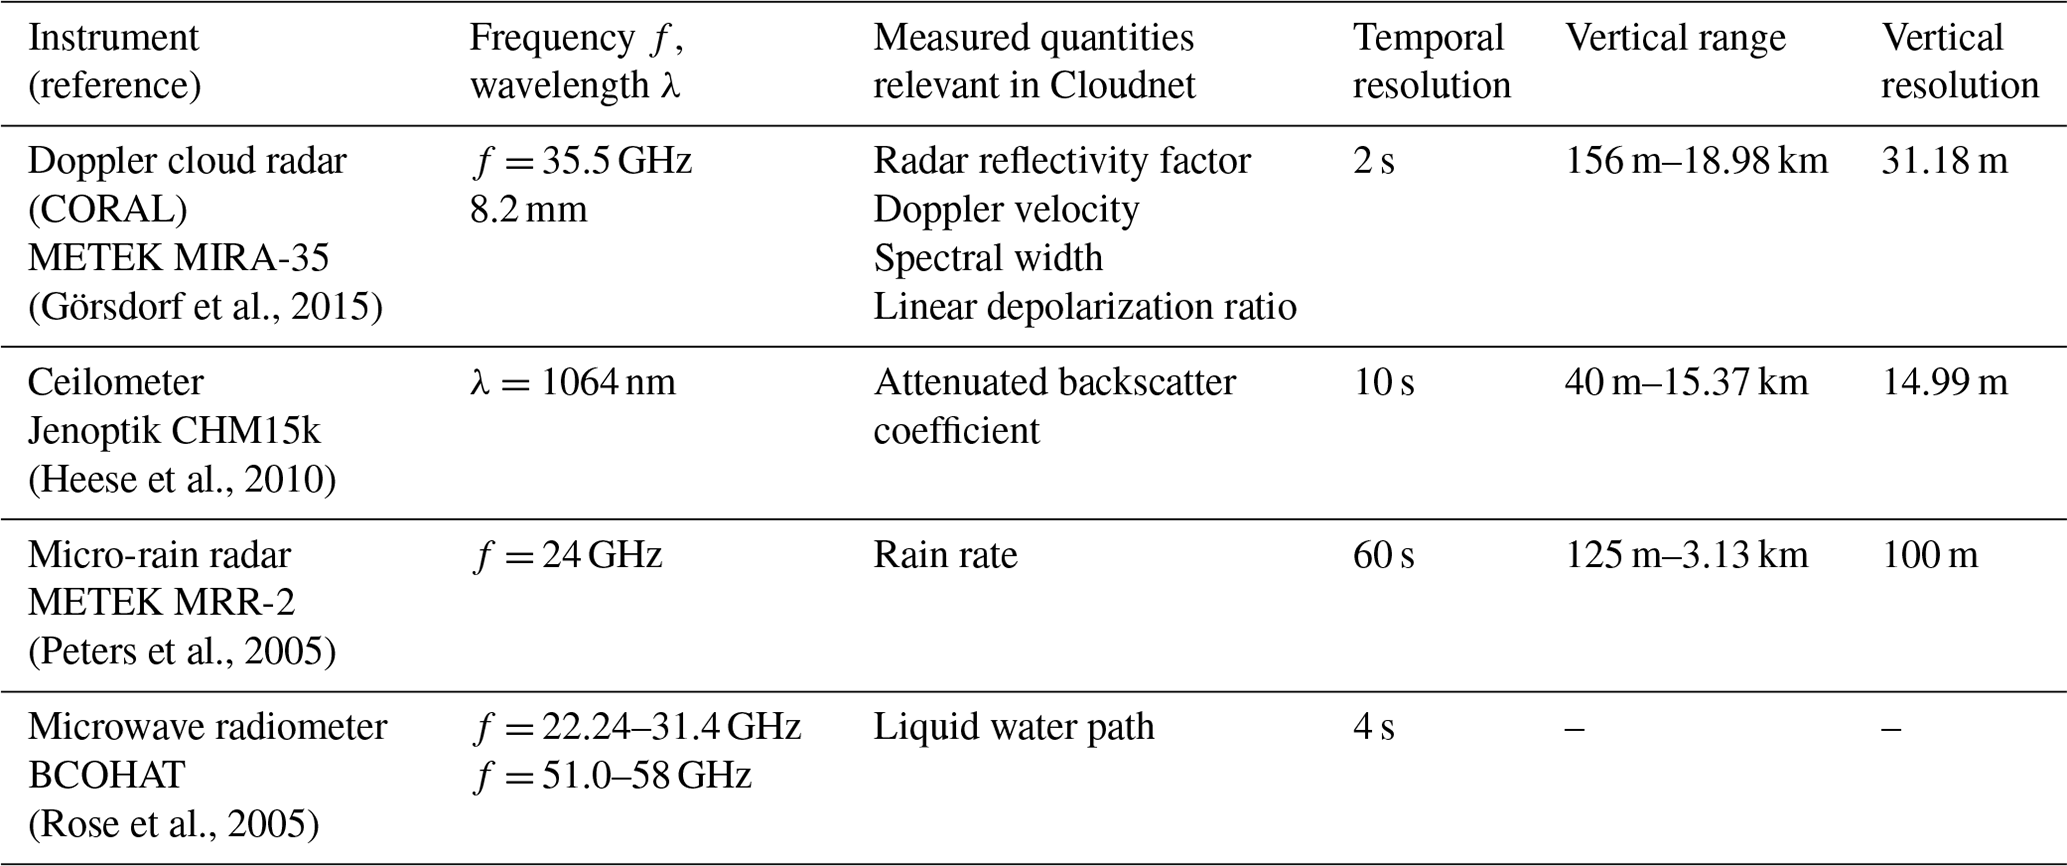
Continuous observations at the BCO started in April 2010. Core instruments include a cloud radar, a multiwavelength polarization Raman lidar, a ceilometer, a microwave radiometer (MWR), and a micro-rain radar (MRR) (Stevens et al., 2016). Such advanced ground-based instrumentation forms the basis of Cloudnet (Illingworth et al., 2007). A summary of BCO instrumentation used in this study is provided in the following and in Table 1.
(Görsdorf et al., 2015)(Heese et al., 2010)(Peters et al., 2005)(Rose et al., 2005)Table 1Specifications of the instruments from the Barbados Cloud Observatory and measured quantities used in Cloudnet.
2.1 Cloud radar
The polarized Ka-band Doppler cloud radar operates at a frequency of 35 GHz and is part of the Combined Radar And Lidar (CORAL) instrument at BCO. CORAL has been operating since April 2015 as a successor of the lower-sensitivity cloud radar KATRIN, which had been in operation since December 2010. Until June 2018, measurements with CORAL were obtained at a temporal resolution of 10 s; from July 2018 onward the temporal resolution was increased to 2 s (Klingebiel et al., 2019).
Compared to the 10 s resolution, the 2 s measurement configuration of the radar has led to a sensitivity decrease to −62 dBZ at an altitude of 500 m and −41 dBZ at an altitude of 5 km. The joint histogram of radar reflectivity per range can be seen in Fig. 2. The histogram is normalized by the total number of counts per radar range gate such that the histogram values represent the frequency of occurrence. There seems to be a cutoff at around 300 m for reflectivities below −60 dBZ, which is related to radar antenna near-field effects. The calibration of the radar shows an uncertainty of 1.3 dB for the radar reflectivity measurements (Görsdorf et al., 2015). It measures in a vertical range between 150 m and 18.9 km with a range resolution of 31.18 m. The large antenna generates a narrow beam width of 0.3° (Klingebiel et al., 2019).

Figure 2Joint histogram of radar reflectivity factor with height observed by the 35 GHz CORAL from July 2021 until July 2023 over the BCO.
2.2 Ceilometer
The Jenoptik CHM15k laser ceilometer at the BCO operates at a wavelength of 1064 nm. Backscattered energy from aerosols and clouds is measured with a temporal resolution of 10 s between 15 m and 15 km height and a range resolution of 15 m (Heese et al., 2010). The ceilometer is well-suited for identifying aerosol and cloud liquid layers in vertical profiles. Its ability to detect liquid layers, however, is often limited to the lowest cloud layer (in multilayer cloud situations) or to the cloud base due to strong signal attenuation. Additionally, strong signal attenuation in heavy precipitation can hamper the cloud-base detection (Tuononen et al., 2019).
2.3 Micro-rain radar
The micro-rain radar (MRR) operating at the BCO is a compact frequency-modulated continuous-wave (FMCW) vertically pointing Doppler radar. The instruments measure at a frequency of 24.23 GHz up to 3.1 km above the ground level. The temporal resolution is 60 s and the range gate resolution is 100 m. Quantities like rain rates, drop size distributions, radar reflectivity, fall velocity of hydrometeors, and other rain parameters can be retrieved simultaneously (Peters et al., 2005).
2.4 Microwave radiometer
The humidity and temperature profiling radiometer (BCOHAT) measures seven brightness temperatures around the water vapor absorption band between 22–31 GHz and in the oxygen absorption complex between 51–58 GHz. Measurements around the water vapor absorption line are used to derive a column-integrated liquid water path (LWP), which is retrieved by a neural network provided by RPG Radiometer Physics GmbH. The vertical resolution is less than 40 m in the sub-cloud layer with a temporal resolution of 4 s. Data from the current microwave radiometer are available since April 2017 (Stevens et al., 2016).
2.5 The synergistic retrieval Cloudnet
The European research project Cloudnet started in 2002 to optimize the representation of clouds in forecast models. From a combination of remote sensing instruments, uniform datasets in the NetCDF format are created within the Cloudnet processing scheme (https://cloudnet.fmi.fi, last access: 21 December 2021). On this basis, algorithms for the evaluation of cloud profiles can be applied for various measurement stations (Illingworth et al., 2007). To reliably process gigabytes of cloud remote sensing data per day in near-real time, the CloudnetPy software package was designed. Compared to the older Cloudnet MATLAB software, the new Python implementation of the Cloudnet processing scheme is open-source, is more user-friendly, and contains detailed documentation and tests. Thus, CloudnetPy enables the research community to further develop methods for new products (Tukiainen et al., 2020).
The basic instrumentation of a Cloudnet station includes a cloud radar, a ceilometer, and an MWR. Additional instruments are an MRR, a rain gauge, and/or a distrometer. Information on the rain rate from the MRR is used to flag time steps where rain is reaching the ground. The MWR is needed to provide the liquid water path (LWP), which is used to correct for liquid attenuation in the cloud radar measurements within the CloudnetPy processing. The observations from the instruments are combined with thermodynamic data from a model or radiosonde to accurately characterize clouds up to 15 km with high temporal and vertical resolution (Illingworth et al., 2007). In this study, Cloudnet data are processed with CloudnetPy (Tukiainen et al., 2020, version 1.43.1).
The Cloudnet target classification is a profile-based Cloudnet data product that provides information about atmospheric constituents in the atmospheric column above the observation site. For each time step, the cloud-base height is determined to identify which grid points are part of a cloud. The cloud-base height (CBH) is determined by analyzing the shape of the attenuated backscatter profile from the ceilometer data using the method of Tuononen et al. (2019). Due to its sensitivity to particle number concentration, the ceilometer backscatter signal strongly increases at cloud base. Further up, the ceilometer signal quickly attenuates while penetrating the cloud liquid layer. Accordingly, the CBH is detected from the ceilometer attenuated backscatter coefficient profiles that show a sudden increase and decrease (in Cloudnet within 150 m around the maximum value of attenuated backscatter coefficient). Profiles that contain precipitation also lead to increased values in the attenuated backscatter coefficient. However, due to the lower number concentration of precipitation particles, the attenuation of the ceilometer signal is less strong compared to when the signal reaches the liquid cloud base. A criterion that determines the vertical width of the peak in the attenuated backscatter coefficient profile therefore prevents the cloud base from being detected below the true cloud base in situations where precipitation is present (Tuononen et al., 2019).
Cloud-top height (CTH) in Cloudnet can be determined using the ceilometer based on a similar method as the CBH detection. However, the radar is used for CTH detection when it detects a signal above that defined by the ceilometer, which is the case for all but very optically thin clouds. Consequently, CTH is usually taken to be the last pixel below the pixel where no radar signal is detected (Hogan and O'Connor, 2004). A pixel represents the smallest unit of measurement in both time and space within the Cloudnet dataset.
Within CloudnetPy data from different instruments are interpolated onto a common grid with a temporal resolution of 30 s and height resolution of 30 m (Illingworth et al., 2007). In the Cloudnet target classification (Hogan and O'Connor, 2004), grid points are classified as “cloud droplets only” when the wet-bulb temperature Tw is above zero and no falling particles are identified between CBH and CTH. When drizzle is present inside the cloud, the whole profile between CBH and CTH is classified as “drizzle/rain and cloud droplets”. For example, drizzle inside a cloud is identified when precipitation falls from a higher layer into the cloud or when the radar reflectivity factor increases towards the cloud base due to the coalescence of drops. “Drizzle or rain” is classified for all radar signals below cloud base when the surface rain flag indicates that precipitation is reaching the ground. When the surface rain flag is not set, radar signals are only classified as “drizzle or rain” when they are continuous below CBH. The surface rain flag is set when the radar reflectivity factor exceeds 0 dBZ at the lowest radar range gate (here: 156 m) or when additional instruments like the MRR indicate that precipitation is reaching the ground. The interested reader is referred to the original paper by Hogan and O'Connor (2004) for additional information about the Cloudnet target classification procedure.
An overview of the data availability of the Cloudnet target classification product from 2020 to 2023 is presented in Fig. 3. Cloudnet data after August 2023 were not processed for this study. The BCOHAT was not operating at the BCO after the EUREC4A campaign in February 2020 until July 2021, which is why Cloudnet data could not be retrieved. Data between 2015 and 2020 were not included in the study because of frequent issues with the time stamp of the ceilometer data, which hampered Cloudnet processing.
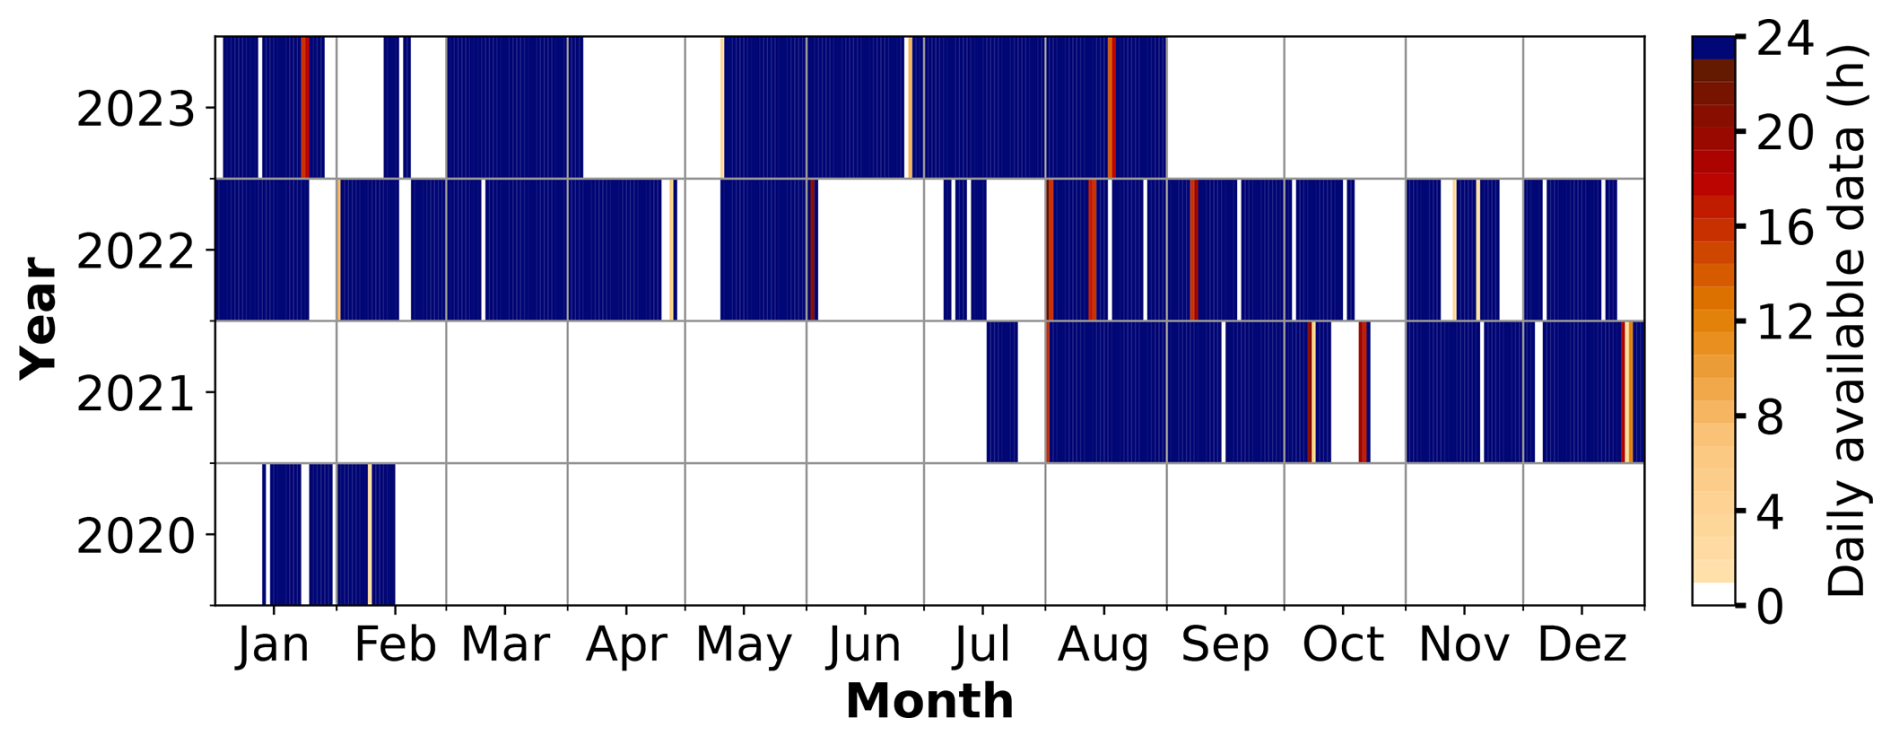
Figure 3Daily available data from the Cloudnet target classification product over the BCO from 2020 to 2023.
2.6 Virga-Sniffer tool
The Virga-Sniffer is a Python package tool developed by Kalesse-Los et al. (2023) that serves as a profile-based detection scheme for identifying precipitation, virga, and clouds using observations of vertically pointing cloud radar reflectivity, and ceilometer measurements of CBH. The tool's first application is the observations on board the RV Meteor during the EUREC4A campaign. The detection process relies on a set of empirical thresholds, which have been manually adjusted for this study using the Cloudnet data from the BCO. The configuration of the Virga-Sniffer tool employed in this study is described in Roschke et al. (2024).
Cloud radar data are fundamental to the Virga-Sniffer as they establish the temporal and vertical resolution for the detection algorithm. Specifically, for the BCO dataset, CORAL data were taken from the Cloudnet target categorization dataset. As further Virga-Sniffer input, CBH is taken from the Cloudnet target classification product. In this study, the CBH data from the ceilometer internal cloud-base algorithm are used to fill gaps in the Cloudnet CBH data. For detailed information on the CBH processing the reader is referred to the technical note of the Virga-Sniffer configuration for the BCO in Roschke et al. (2024).
The detection of precipitation, clouds, and CTH is performed by analyzing radar signals. Precipitation is identified at each range gate of the radar reflectivity mask below CBH. The process involves downward assignment from the CBH until the lowest radar signal. Surface rain is detected from radar reflectivities in combination with the Cloudnet rain flag, which incorporates measurements from the MRR. The virga mask is refined through the incorporation of cloud radar mean Doppler velocity data. The velocity mask restricts virga from occurring for negative mean Doppler velocities.
An example of the Virga-Sniffer output can be seen in Fig. 4b together with the Cloudnet target classification (Fig. 4a) for BCO observations on 2 December 2021. Note that there is a large proportion of pixels classified as “drizzle or rain” by Cloudnet below shallow cumulus clouds after 07:15 UTC with a radar reflectivity factor below −50 dBZ that are not classified as virga by the Virga-Sniffer. Unclassified radar signals can represent cloud, precipitation, and haze echo pixels when no information about the CBH is available. Pixels not classified by the Virga-Sniffer while information about CBH is available and rain is not detected at the surface are filtered by the clutter and velocity mask (Kalesse-Los et al., 2023). As a novelty, in this study, the clutter mask was modified so that all unclassified radar signals with radar reflectivities below −50 dBZ are identified as haze echoes by the Virga-Sniffer. The configurations of both the clutter mask and velocity mask are detailed in Roschke et al. (2024).
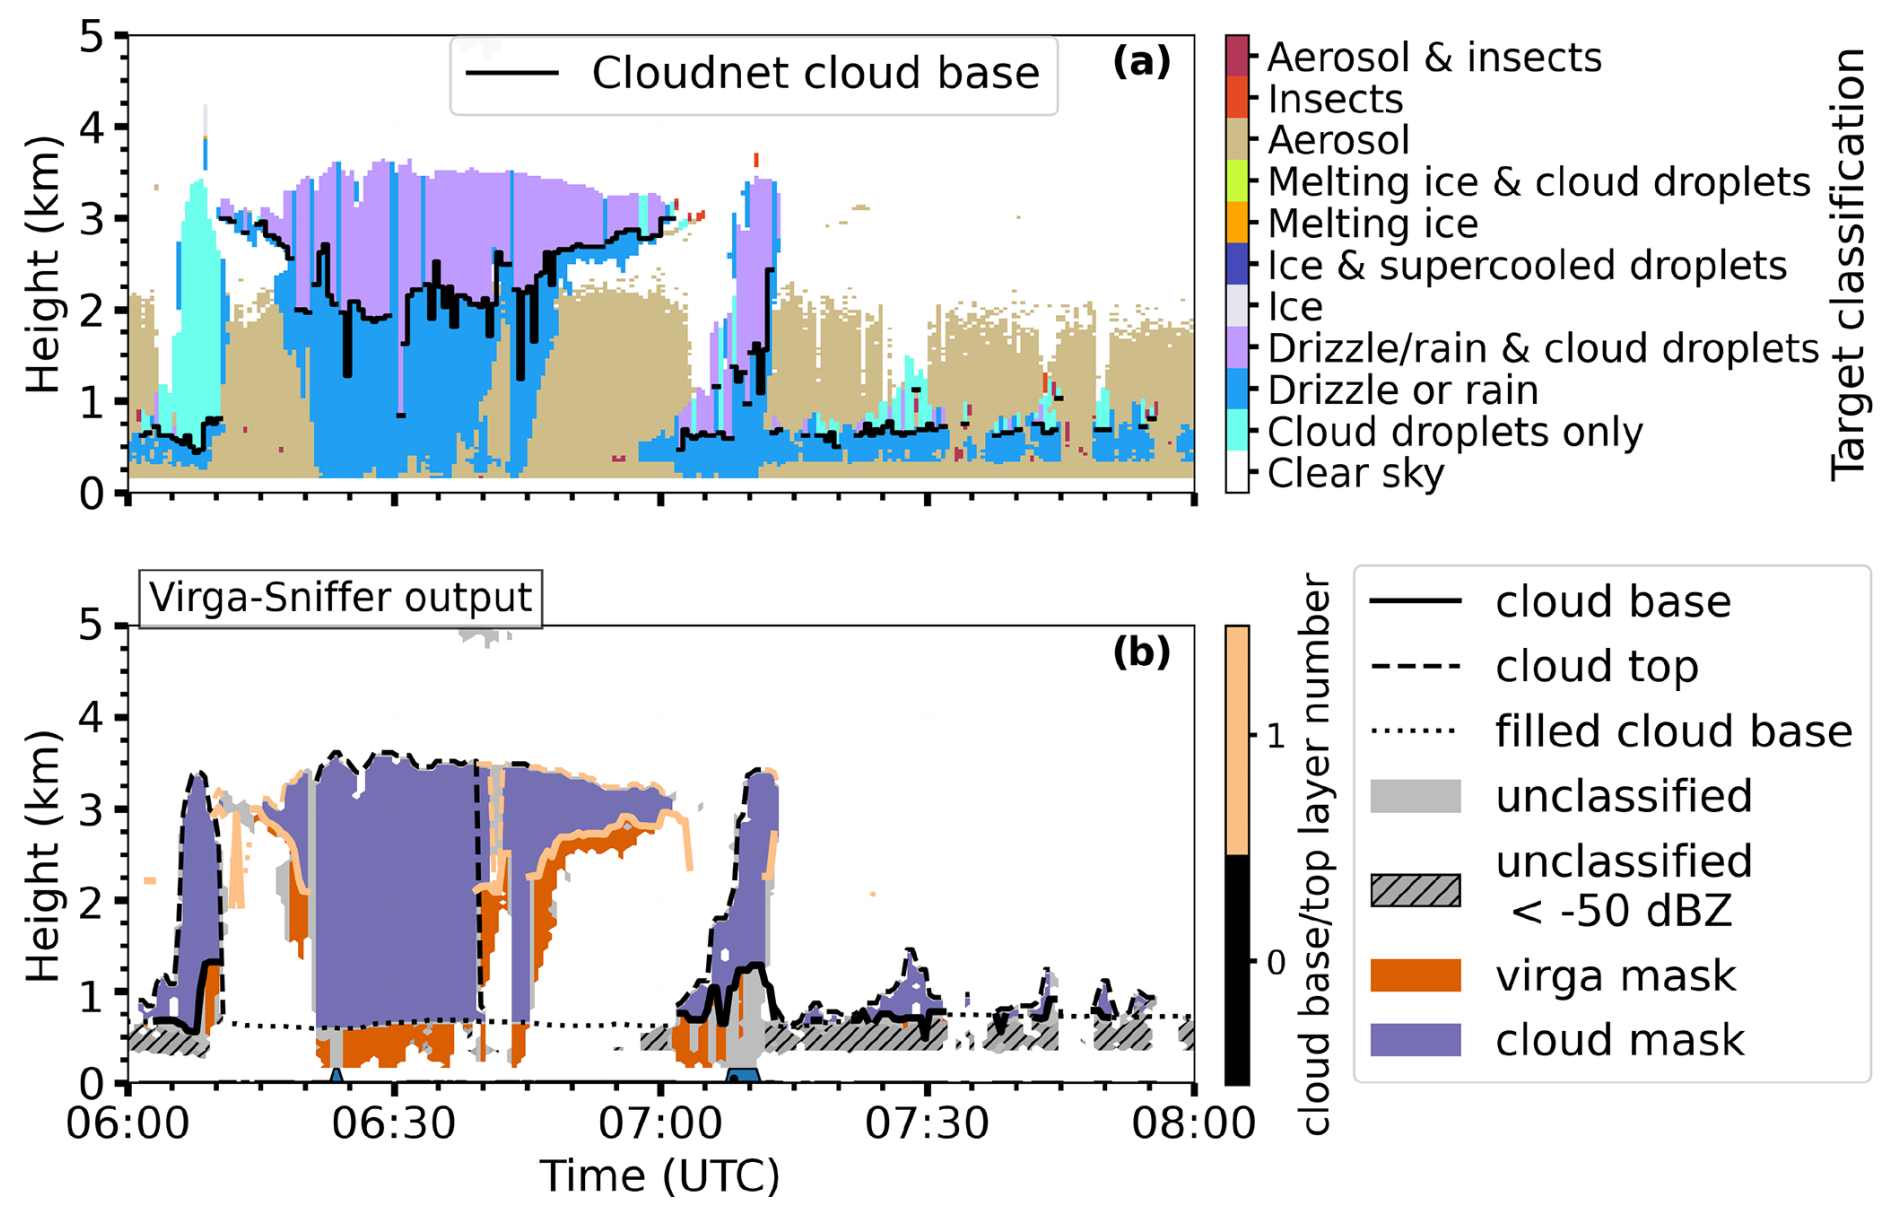
Figure 4BCO case study for 2 December 2021: (a) Cloudnet target classification and (b) Virga-Sniffer output. The term “filled cloud base” refers to time steps where the LCL is used as the CBH. Haze echoes from the Virga-Sniffer output are unclassified, with radar reflectivities lower than −50 dBZ. Rain reaching the surface is marked in blue along the x axis.
Also note that for this case study the CBH of the Virga-Sniffer tool differs from the CBH in Cloudnet (Fig. 4). In this case, the differences in CBH are due to the configurations of the Virga-Sniffer, where the LCL is used to fill gaps in the first CBH layer. The LCL is calculated from surface measurements of pressure, temperature, and humidity. In this particular case, the LCL is set as CBH for the cloud around 06:30 UTC and not the observed CBH at about 2 km altitude due to the Virga-Sniffer configuration. Since all range gates between the LCL, which fills the gap of the lowest CBH layer, and the second CBH layer with the Cloudnet CBH have a radar signal, the lowest CBH layer is selected by the Virga-Sniffer in this configuration. Further information about the CBH processing is described in Roschke et al. (2024).
The primary objective of using the Virga-Sniffer is to evaluate the precipitation and haze echo detection efficiency of Cloudnet. Additionally, given the rarity of long-term statistics on precipitation evaporation in the tropics, we present such statistics for the BCO and during the EUREC4A campaign. These findings are presented in Appendix A2.
This section gives an overview of the method that was developed to discriminate between sea salt aerosols and “drizzle or rain” in Cloudnet. The method is similar to the approach for insect detection in Cloudnet. Insects are classified by combining the heuristic probabilities derived from various radar parameters and additional variables such as temperature. As highlighted in the CloudnetPy code, insect detection is novel and still needs to be validated. The advantage of using a similar approach is, that it can be easily implemented within the Cloudnet target classification scheme and that it is configurable for marine Cloudnet sites and their particular instrumentation.
3.1 Defining a sea salt (or haze echo) probability in Cloudnet
The frequent occurrence of haze echoes at the BCO becomes evident in the 2D histogram in Fig. 5a for the radar reflectivity factor and the mean Doppler velocity for the period between 1 July 2021 and 1 July 2022. Two distinct modes with high data point density are visible. The first mode is centered around a radar reflectivity factor of −60 dBZ and a mean Doppler velocity of 0.2 m s−1, which we attribute to the frequent occurrence of haze echoes over the BCO. The second mode represents the cloud and precipitation mode with a high data point density at radar reflectivities from −40 to 20 dBZ.
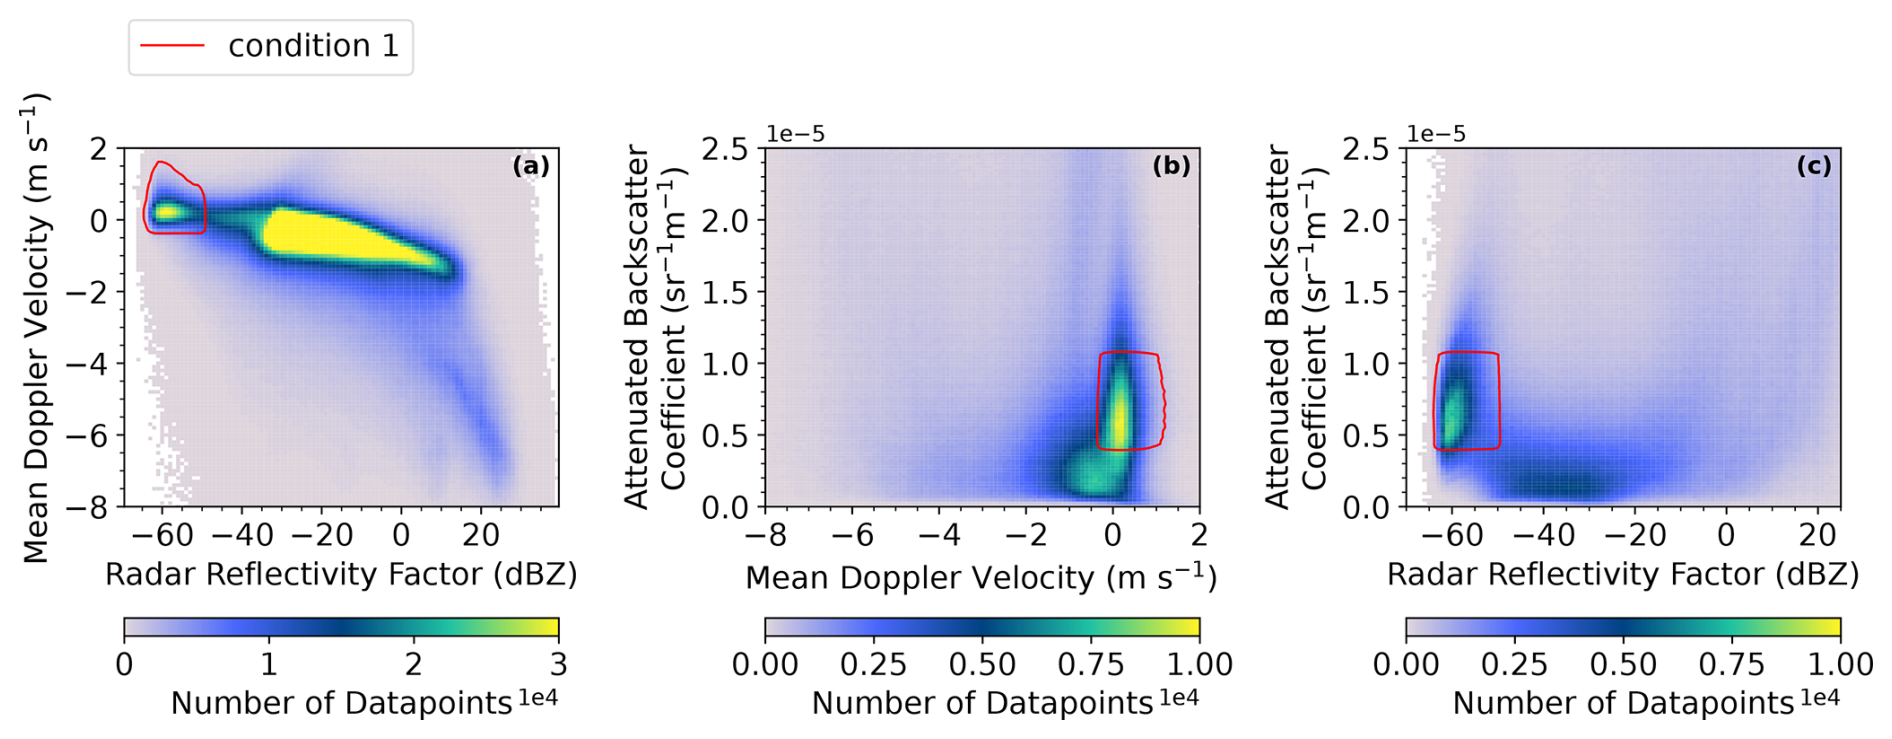
Figure 5BCO 35 GHz cloud radar and ceilometer (1 July 2021–1 July 2022): histograms of the mean Doppler velocity and radar reflectivity factor in panel (a), the attenuated backscatter coefficient and mean Doppler velocity in panel (b), and the attenuated backscatter coefficient and radar reflectivity factor in panel (c). The radar reflectivity bin width is 1 dBZ, the Doppler velocity bin width is 0.1 m s−1, and the attenuated backscatter coefficient bin width is 2.3 × 10⁻⁶ sr−1 m−1. Note that due to the attenuation of the ceilometer signal within liquid layers, the number of data points is lower in panels (b) and (c). Histogram areas for a minimum of 500 data points that fulfill haze echo condition 1 (Table 2) are marked by the red line.
The haze echo mode is also evident in the 2D histogram of the attenuated backscatter coefficient and mean Doppler velocity shown in Fig. 5b. The first mode is centered at approximately 0.2 m s−1 and spans a broad range of attenuated backscatter coefficients, from about to sr−1 m−1. In contrast, the second mode peaks at −0.5 m s−1 and is associated with attenuated backscatter coefficients below sr−1 m−1. The first mode is attributed to haze echoes, while the second likely corresponds to pixels characterized by lower aerosol loads, potentially caused by wet deposition due to precipitation.
The two modes are distinctly separated in the 2D histogram of radar reflectivity factor and attenuated backscatter coefficient (Fig. 5c). The first mode is associated with radar reflectivities below −50 dBZ and attenuated backscatter coefficients ranging between and sr−1 m−1. The second mode, with radar reflectivities between −50 and −20 dBZ, corresponds to attenuated backscatter coefficients below sr−1 m−1. Once again, the first mode is attributed to haze echoes, whereas the second mode is linked to clouds or precipitating particles.
Following these observations, we isolate the haze echo mode by deriving a combined haze echo probability from heuristic probability functions from individual parameters (namely radar reflectivity, radar mean Doppler velocity, and ceilometer attenuated backscatter coefficient). For each pixel, a probability is estimated. The probability of an observed value being less than or equal to a given input value is estimated with the cumulative distribution function of the normal distribution of the input variable. The probability function (P(X)) in Eq. (1) is a built-in function in SciPy called scipy.stats.norm.cdf (Virtanen et al., 2020). The center of the distribution can be selected individually as well as the peak width, determining the rate at which the probability changes. The probability P(X) of a variable X is given by
where μ represents the mean of the distribution and σ the standard deviation. μ determines the center of the probability distribution. Values smaller than μ will have small probabilities, while values greater than μ will have large probabilities. σ determines the width of the probability distribution. A larger value will result in a wider distribution, indicating a higher spread of the data. Conversely, a smaller value will lead to a narrower distribution. For the radar reflectivity factor, the center was set to −45 dBZ and the width to 6 dBZ. Furthermore, the probability distribution was inverted to ensure that low radar reflectivities lead to the highest haze echo probabilities. For the mean Doppler velocity, μv was set to −1 m s−1 and the width σv to 0.2 m s−1.
Implementing a haze echo probability function for ceilometer measurements in Cloudnet is performed by using the following equation:
where μ represents the mean of the distribution, which in this case would mark the location of 100 % probability. The width of the distribution is controlled by σ, and Γ represents the gamma distribution. The shape of the distribution is defined by β. In our measurements β=6.
For the ceilometer measurements μβ is set to sr−1 m−1 and σβ is set to sr−1 m−1. The choice of this distribution ensures that the probability for haze echo increases close to the value of sr−1 m−1 and starts to decrease for the threshold close to sr−1 m−1 that is used to locate liquid cloud layers in Cloudnet. By performing element-wise multiplication of the haze echo probability arrays for the radar reflectivity factor, mean Doppler velocity, and ceilometer attenuated backscatter coefficient, the combined probability (Pcombined) can be estimated. When the Pcombined exceeds 60 % for grid points below the CBH or at altitudes below 2 km (average top of the height of the marine aerosol layer over Barbados) in cloud-free situations, the haze echo category is implemented and replaces targets previously classified as “drizzle or rain” in the Cloudnet target classification.
Table 2Minimum probabilities for the radar reflectivity factor (), mean Doppler velocity (Pv), and attenuated backscatter coefficient (Pβ), along with their respective minimum and maximum values required to achieve a combined probability (Pcombined) of 60 %.
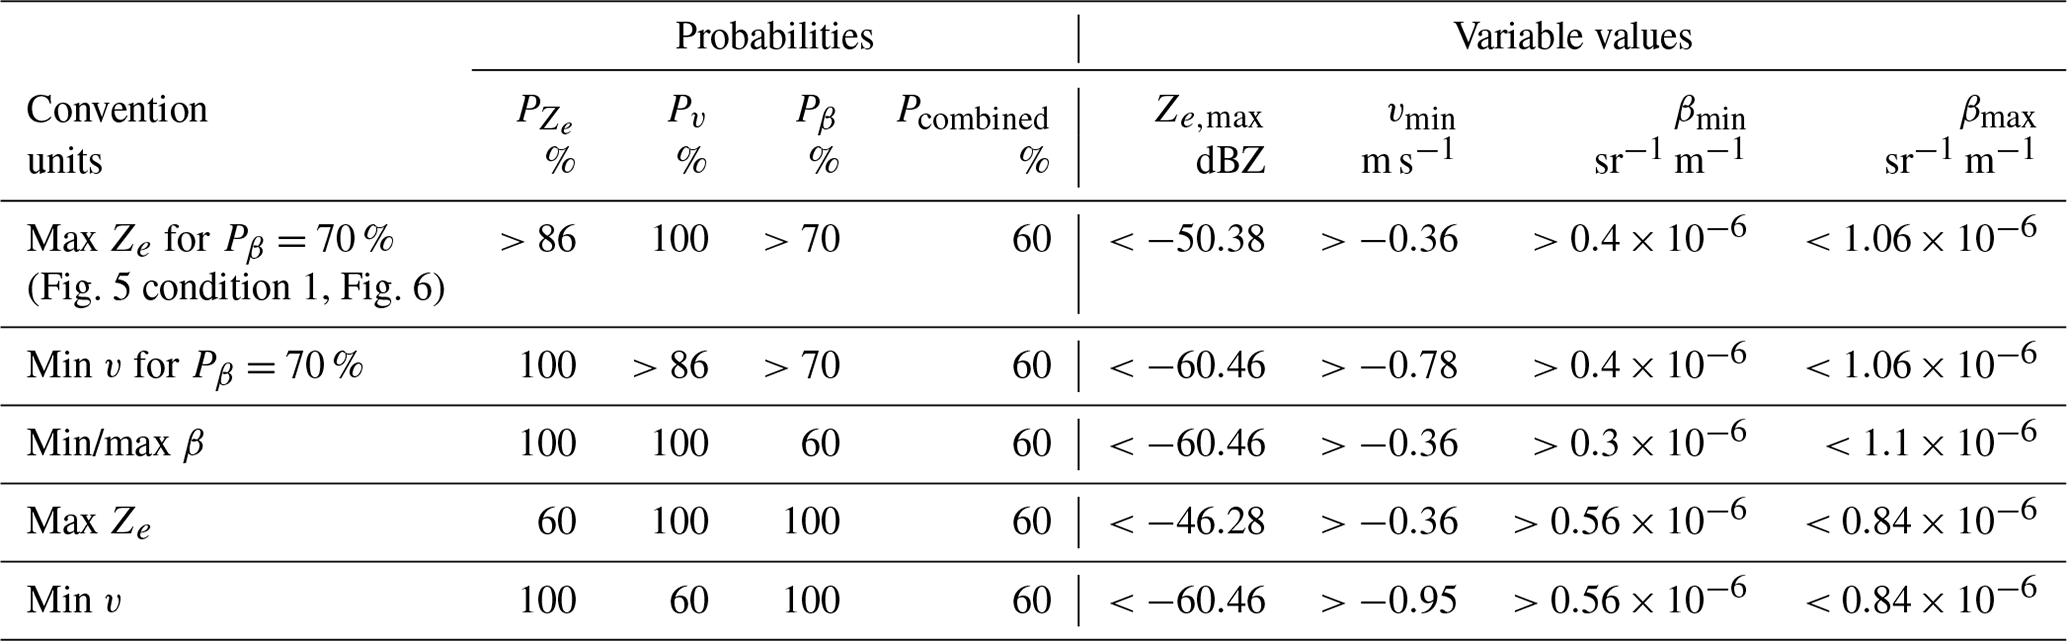
The heuristic probability distributions for radar and ceilometer variables are visualized in Fig. 6 for the combination of probabilities in line 1 (condition 1) of Table 2. In scenarios where the probability of the attenuated backscatter coefficient (Pβ) reaches 70 %, the probability of the mean Doppler velocity (Pv) must be close to 100 % when the probability of the radar reflectivity factor (Ze) is 86 % to reach a combined probability threshold of (Pcombined) greater than 60 % for haze echo identification. Pβ reaches 70 % for β values between and sr−1 m−1. Minimum and maximum values for each variable's probability are summarized in Table 2. For the example scenario of = 86 %, the mean Doppler velocity must be greater than −0.36 m s−1 for maximum radar reflectivity factors of −50 dBZ. For stronger downdrafts, with velocities down to −0.78 m s−1, the radar reflectivity factor needs to be lower than −60.46 dBZ for haze echoes to be classified. Note that if any individual probability is at 60 %, the remaining probabilities must reach 100 % for haze echo classification. In such cases, the minimum mean Doppler velocity is −0.95 m s−1, and the maximum radar reflectivity factor is −46.46 dBZ (see Table 2).
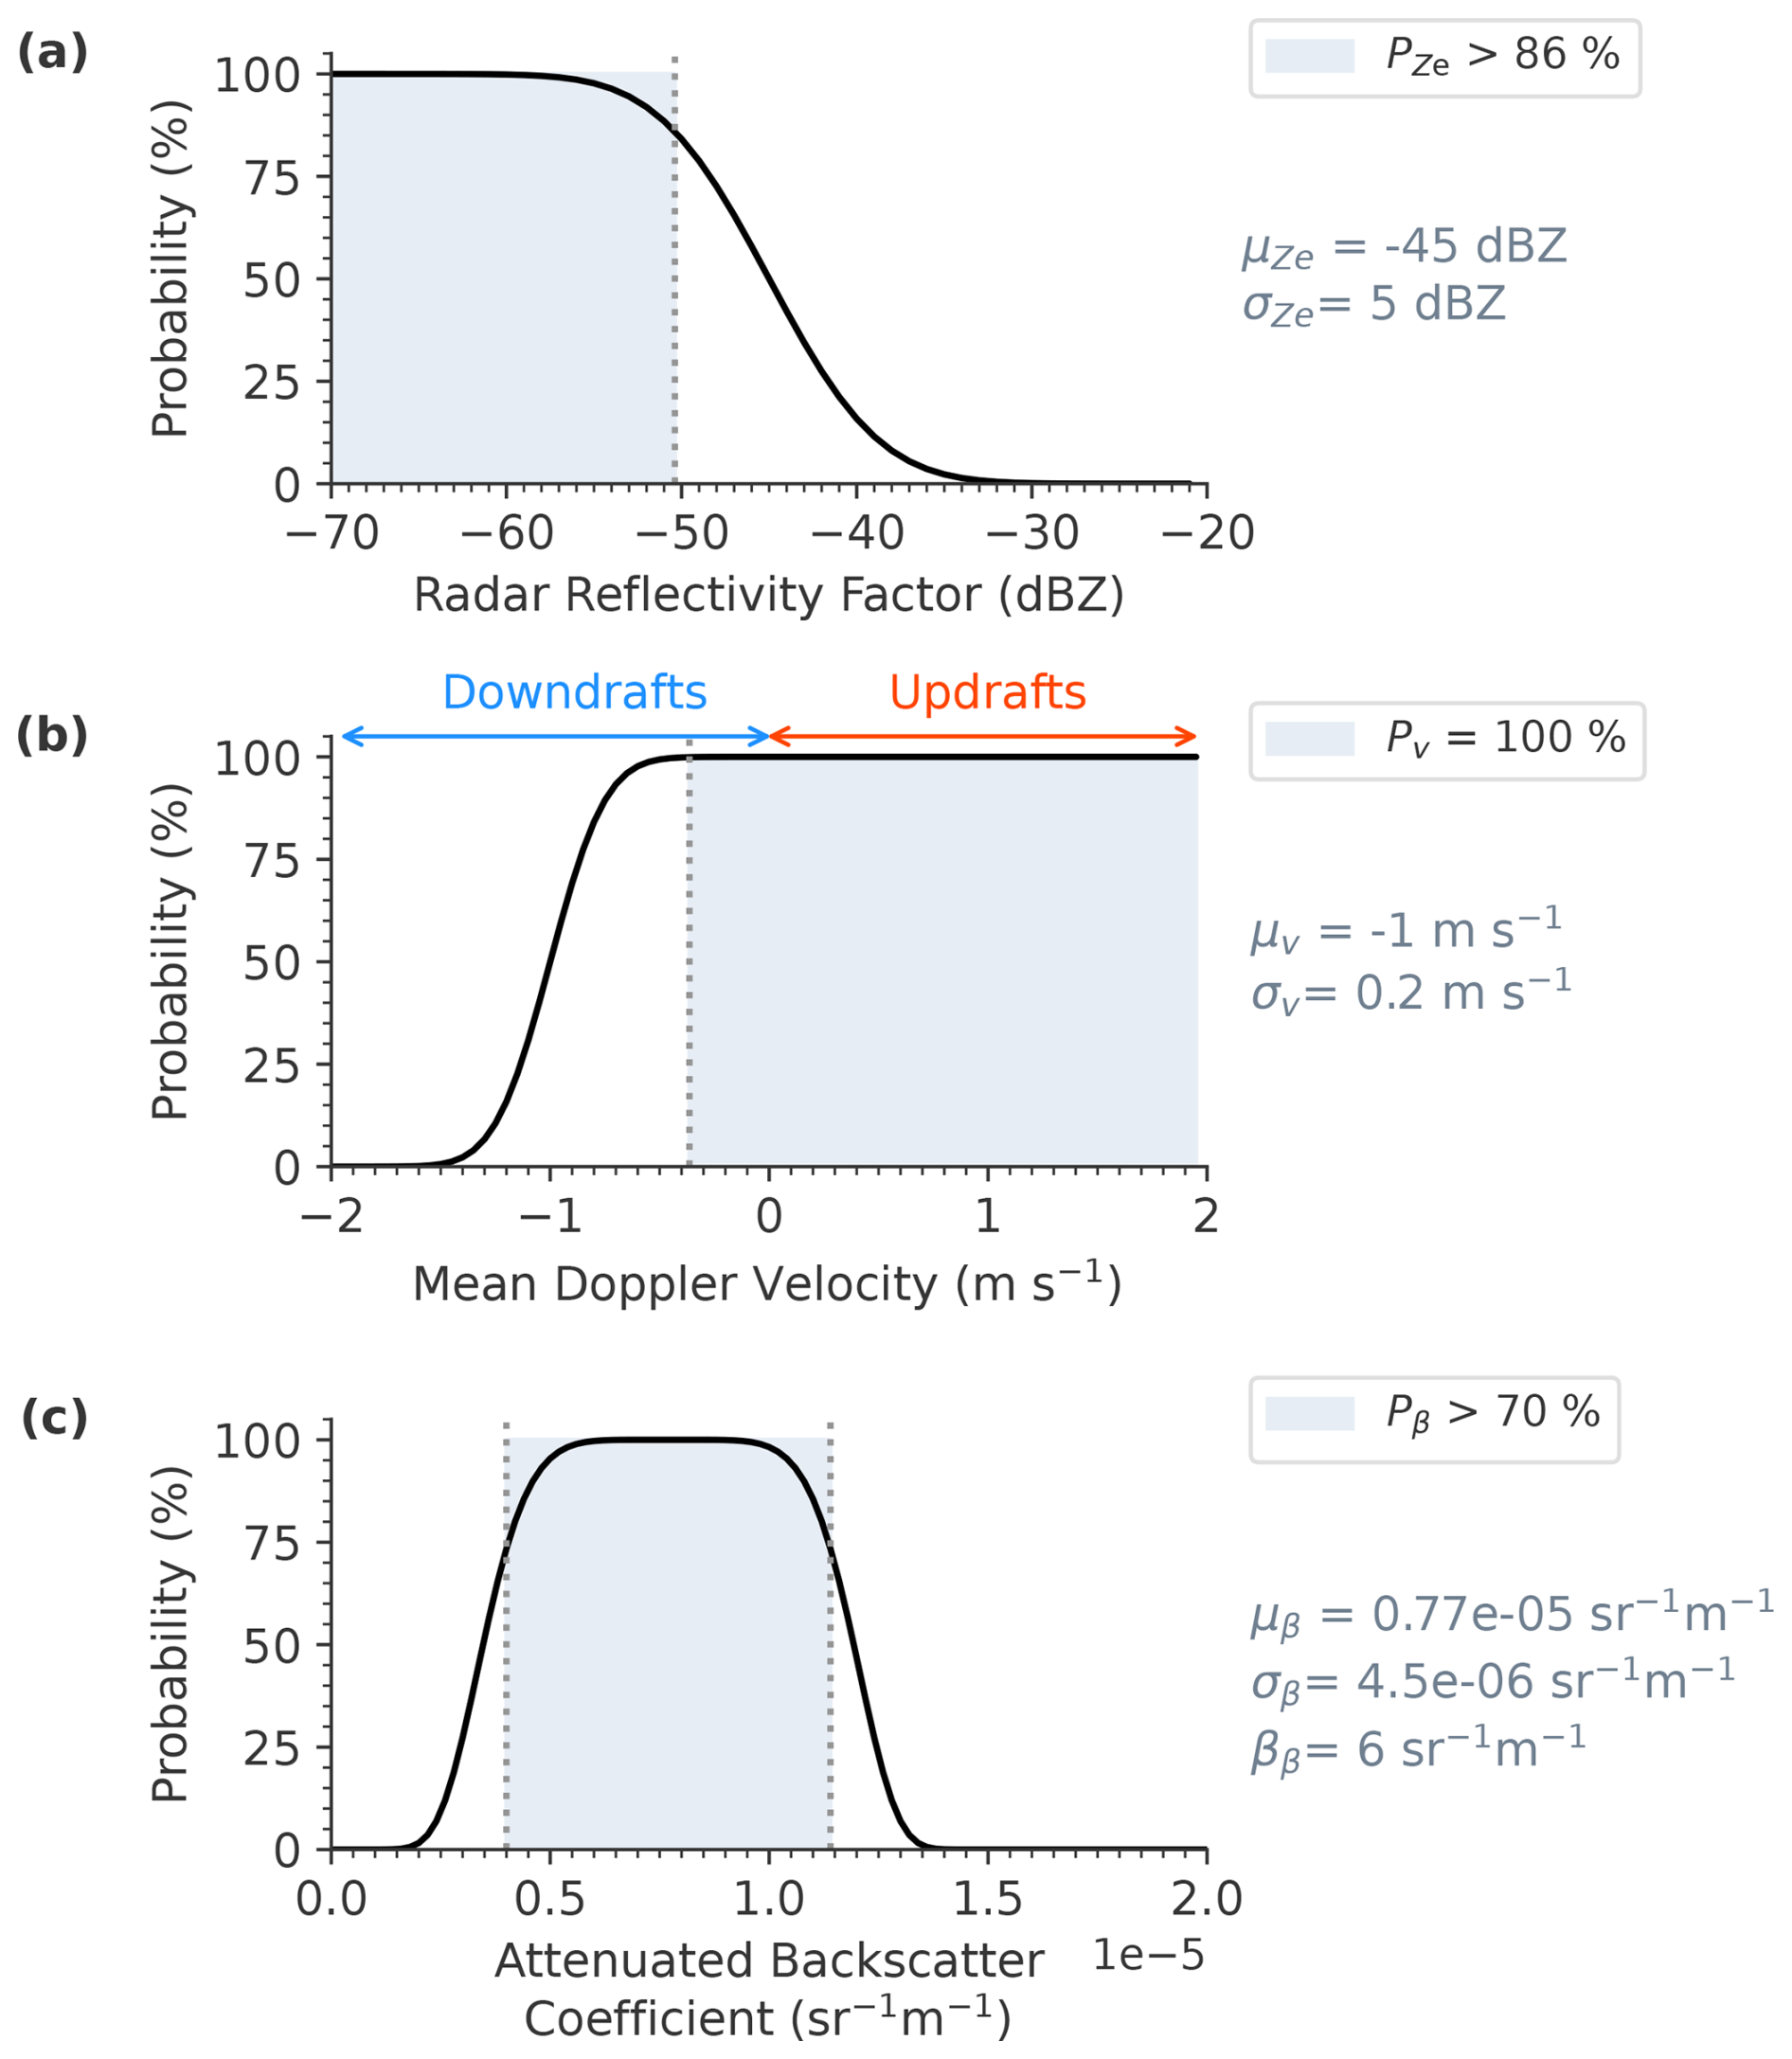
Figure 6Heuristic probability distribution for the radar reflectivity factor () in panel (a), mean Doppler velocity (Pv) in panel (b), and attenuated backscatter coefficient (Pβ) in panel (c), together with the selected values of the parameters μ, σ, and β for each distribution. The respective values can also be found in Table 2.
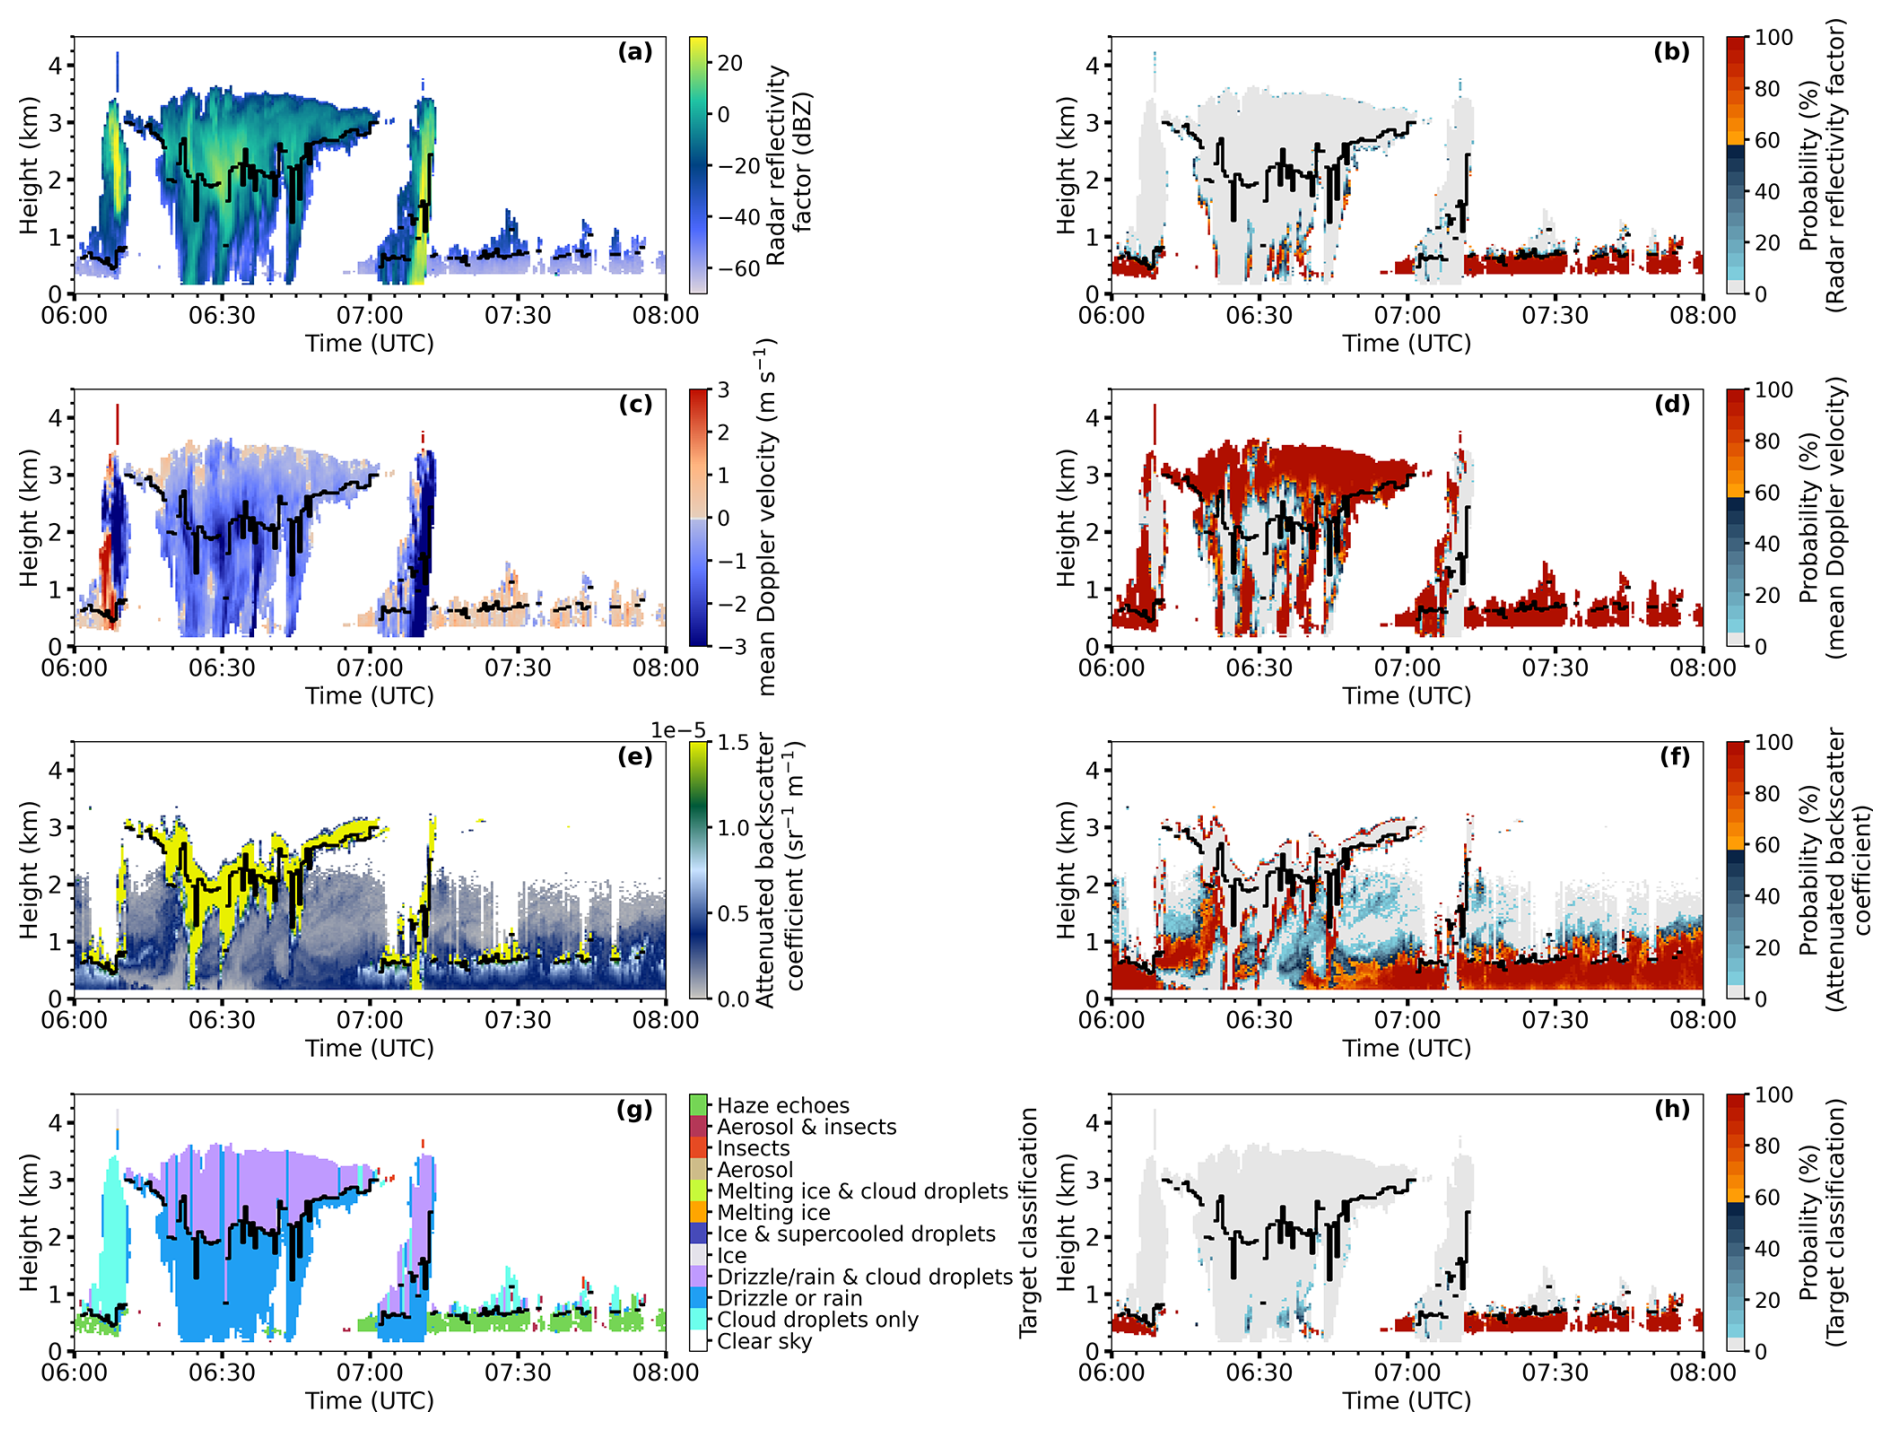
Figure 7BCO case study for 2 December 2021: observations and corresponding sea salt probabilities for the radar reflectivity factor (a, b), radar mean Doppler velocity (c, d), ceilometer attenuated backscatter coefficient (e, f), and Cloudnet target classification (including the haze echo classification) as well as the (g) combined haze echo probability (h). Haze echoes are classified when the combined probability in panel (h) exceeds 60 %.
Figure 7 illustrates the haze echo probability estimation procedure for the same case study shown in Fig. 4. The detailed discussion below shows that a haze echo probability based on a single variable is not suitable and that, instead, the combined haze echo probability leads to the most confident estimates of haze echo occurrence. In the radar and ceilometer observations at the BCO shown here for 2 December 2021 between 06:00–08:00 UTC, several cloud types were present: a precipitating stratiform cloud between 06:15–07:00 UTC with CBH of around 2 km, two deeper cumulus clouds with CTHs of around 3.5 km, and shallow cumulus clouds with CTHs below 1 km. The black line in Fig. 7 denotes the CBH detected by Cloudnet. Rain on the ground was observed from two short showers at around 06:25 and 07:10 UTC. The presence of virga is visually evident through the distinctive fall streaks in the time series of the radar reflectivity factor in Fig. 7a with low radar reflectivities at the edges of the fall streaks between 06:10–06:50 UTC, a characteristic attributed to the evaporation of drizzle drops. The estimated probability of sea salt aerosols (haze echoes) based on radar reflectivity alone in Fig. 7b shows that parts of the fall streaks show probabilities over 60 %.
High haze echo probabilities based solely on radar mean Doppler velocity observations in Fig. 7d relate to upward motion below the CBH between 06:00–06:10 and after 07:10 UTC in Fig. 7c. The threshold for estimating haze echo probability based on radar mean Doppler velocity is chosen in a way to ensure that haze echoes that are too small to overcome the background motion are also identified in downdrafts. It can be seen that when rain was observed at the ground, radar reflectivities exceeded approximately 0 dBZ at the lowest radar range gate between 06:20–06:30 UTC and the near-surface attenuated backscatter coefficient (Fig. 7e) was larger than the liquid CBH threshold of sr−1 m−1 due to large rain and drizzle drops that dominate the signal. However, owing to the limited number concentration of drizzle or raindrops relative to cloud droplets, the ceilometer signal is not fully attenuated by the near-surface precipitation, so ceilometer-based CBH retrieval was – except for times of stronger precipitation – still reliable. What is also evident in Fig. 7e is that the ceilometer attenuated backscatter coefficient below the precipitating stratiform cloud is lower compared to the times when haze echoes occur below the shallow cumulus clouds. This can be attributed to the wet deposition of aerosol particles within the marine boundary layer during or after precipitation periods that lead to comparatively cleaner atmospheric conditions. The resulting haze echo probability based on the thresholds of the attenuated backscatter coefficient can be seen in Fig. 7f. The choice of thresholds ensures that sea salt probabilities are low during and after times of precipitation, as illustrated in the combined haze echo probability in Fig. 7h. The resulting Cloudnet target classification with haze echoes as a new target class is shown in Fig. 7g. For the presented case study, the Cloudnet classification of “drizzle or rain” is now limited to times when the precipitation-producing stratiform cloud and the deeper trade wind cumuli (around 07:00–07:10 UTC) occur and misclassifications of “drizzle or rain” below the shallow trade-wind cumuli are now replaced by the new class “haze echo”.
3.2 Cloud type classification
Existing statistics on clouds and precipitation over Barbados focus on warm clouds and trade wind cumuli (e.g., Kalesse-Los et al., 2023; Nuijens et al., 2014; Acquistapace et al., 2019; Schulz et al., 2021). In order to compare our statistics with existing literature and to investigate precipitation properties of warm clouds and haze echo occurrence, an object-based cloud classifier was developed. “Object-based method” in this context means an approach to identify continuous radar signals in time and space (connected pixels). Once a cloud object has been detected, information about the CBH can be analyzed within this object. In contrast, profile-based cloud identification relies on the number of detected cloud-base heights (CBHs). Profile-based approaches like Cloudnet or the Virga-Sniffer suffer from two issues: firstly, if gaps occur in the CBH measurements of the ceilometer (e.g., for multilayer cloud situations or during heavy precipitation), even when the radar detects signals from clouds, profile-based methods do not register these cloud profiles. Secondly, when distinguishing different clouds by the altitude of their CBH, profile-based approaches could erroneously classify individual cloud profiles within a single cloud object as different cloud types if the CBH varies strongly within the cloud. A disadvantage of object-based cloud detection methods, however, is that multiple contiguous cloud objects (when clouds touch at the cloud edges or grid points overlap) are recognized as a single cloud object. This can be the case, for example, when fall streaks of a stratiform cloud fall into an underlying trade wind cloud. In Schulz et al. (2021), for example, a combined cloud category was introduced for such situations as “a mixture of cumulus with an attached stratiform layer” (StSc + Cu) and in Lamer et al. (2015) the category is “precipitating cumulus with stratiform outflow” (Precip. Cu.Str.).
Similar to Kalesse-Los et al. (2023), we group individual clouds by their CBH into three cloud categories (Fig. 8), namely warm clouds, warm clouds with CBH below 1 km (i.e., trade wind cumuli), and cold clouds. Warm clouds are defined as clouds with bases and tops below the height of the 0 °C wet-bulb temperature isotherm that is taken from data of the Cloudnet target categorization. Trade wind clouds are defined here as clouds with CBH below 1 km and a cloud top below the height of the 0 °C wet-bulb temperature isotherm. Cold or ice-containing clouds are usually defined as clouds with a cloud top above the height of the 0 °C wet-bulb temperature isotherm.
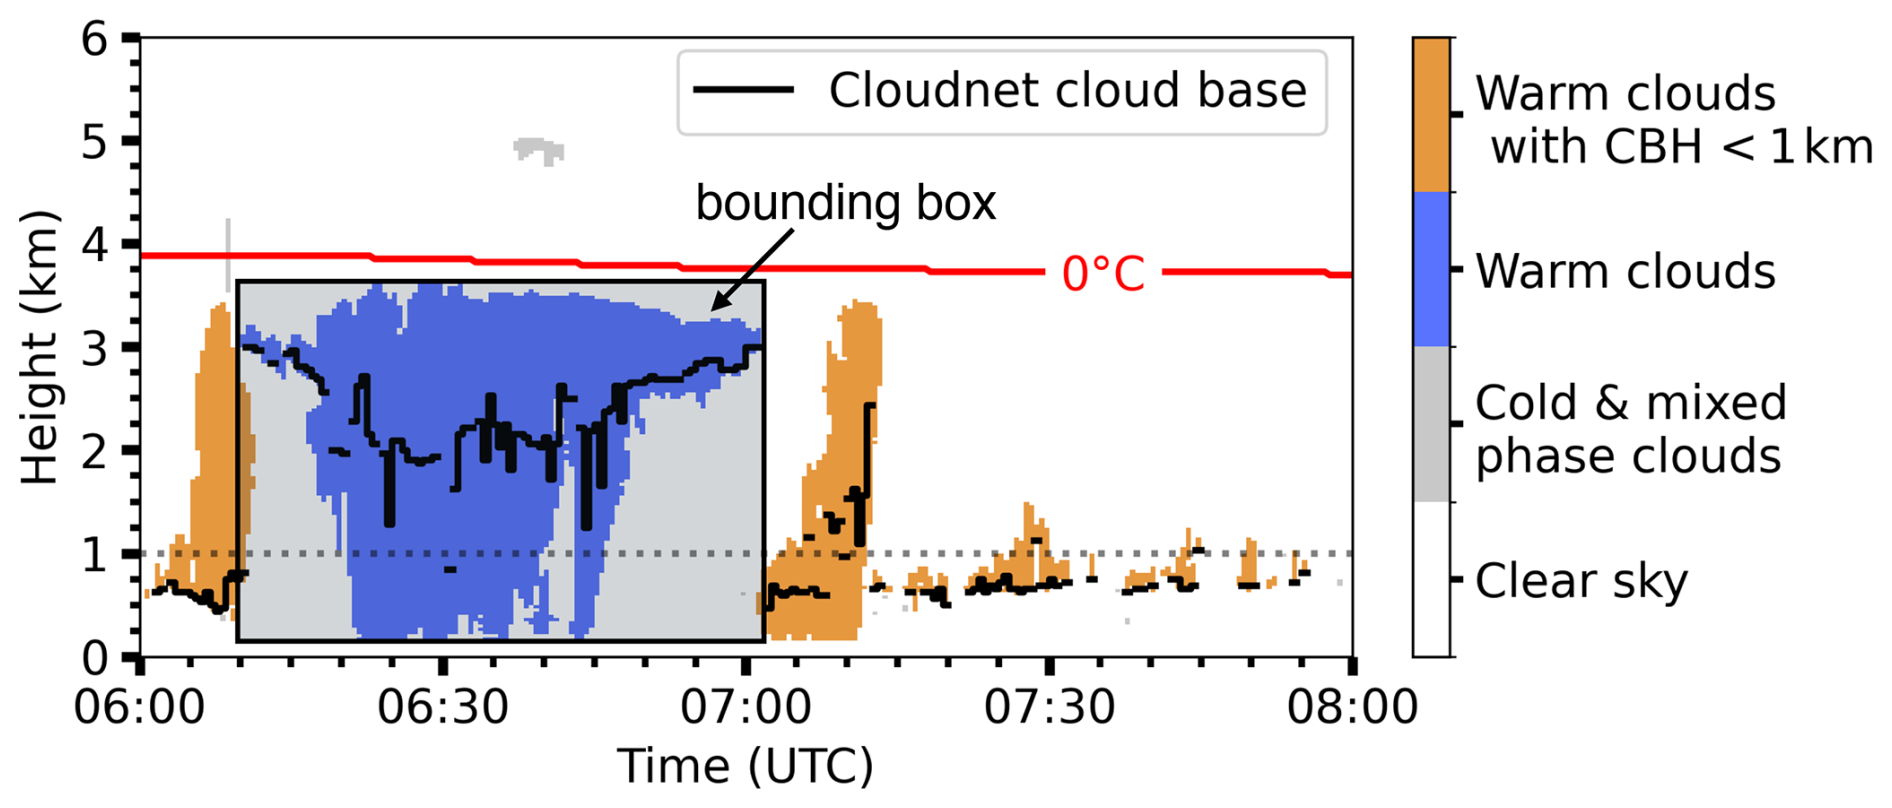
Figure 8BCO case study for 2 December 2021 illustrating the cloud type classification. The cloud-base height (from Cloudnet) is denoted by the black line when detected.
The object-based cloud classification algorithm, utilizing object-based feature detection methods from the scikit-image library (Van der Walt et al., 2014), is applied to all radar signals, excluding haze echo radar pixels. As a result, haze echo occurrence statistics are unaffected by the cloud classification, as haze echo pixels are counted independently whenever they occur in a profile. A hydrometeor cluster is defined as a group of at least three connected pixels. CTH is determined by the highest located radar pixel of a hydrometeor cluster that can be estimated from the location of the bounding box (Fig. 8) of the cluster. The bounding box bounds for each cluster are extracted using the regionprops function from the skimage.measure module, which is part of the scikit-image library (Van der Walt et al., 2014). Warm cloud objects with a majority of detected CBH values below 1 km are defined as trade wind clouds. Cloud objects with a majority of CBH values above 1 km are assigned as warm clouds. An example of the cloud classification output on 2 December 2021 can be seen in Fig. 8. Between 07:00–07:20 UTC the cloud is identified as a trade wind cumulus cloud as the majority of detected CBHs within the cloud object are detected below 1 km.
Impacts of environmental factors on seasonal haze echo occurrence are presented in Sect. 4.1. Section 4.2 is comprised of a statistical analysis of the extended Cloudnet target classification including “haze echoes” with a focus on clouds below the freezing level for 2 full years between 1 July 2021 and 1 July 2023 (508 d of data). A comparison of the introduced haze echo detection method to other classifiers is given in Sect. 4.3. Finally, limitations of the proposed haze echo classification for sea salt aerosol occurrence are discussed in Sect. 4.4.
4.1 Impact of environmental factors on seasonal changes in haze echo occurrence
Following the method proposed by Klingebiel et al. (2019), a dimensionless haze echo occurrence parameter is used, representing the cumulative sum of all pixels per time step where haze echoes are detected. To test the influence of environmental factors, haze echo occurrence is set into context with 2 m surface observations of wind speed, wind direction, and relative humidity. Both the haze echo occurrence data and the 2 m surface observations are averaged over a 6 h time window to be in line with previous studies. This time window balances maintaining consistency in observed air masses with ensuring a sufficiently large statistical sample (Nuijens et al., 2009; Klingebiel et al., 2019).
Analyses are performed separately for the dry season (December to June) and wet season (June to December) over Barbados. The seasonal changes in cloud cover over Barbados can be attributed to the migration of the Intertropical Convergence Zone (ITCZ). During the dry season, the ITCZ is furthest away from the island and the region experiences strong subsidence. During the wet season, the low-altitude convergence favors deep convection. Seasonal differences in cloud cover and the occurrence of precipitation events are therefore mainly characterized by the higher proportion of deep convective events with higher rainfall rates during the wet season (Stevens et al., 2016).
Figure 9 shows the haze echo occurrence for the dry and wet season over 2 years (July 2021 until July 2022 and July 2022 until July 2023). Occurrences of haze echo larger than two (representing deeper haze echo layers) are more frequent during the dry season compared to the wet season (Fig. 9a, b). Interestingly, a haze echo occurrence larger than two is less frequent in 2022/23 for both seasons compared to 2021/22. This can be attributed to lower wind speeds in 2022/23 (Fig. 9c, d) since wind speed is known to have the strongest effect on the production of sea spray (Lewis and Schwartz, 2004). Furthermore, the variation in wind direction is higher in 2022/23 compared to 2021/22, especially for the dry season. Remarkably, wind direction during the dry season of 2022/23 (Fig. 9e) indicates that the trade winds were also less constant and showed a similar variation typical for the conditions during the wet season. What also stands out is that surface relative humidity for both the dry and wet seasons is much higher in 2022/23 compared to 2021/22 (Fig. 9g, h). Higher surface relative humidity results in lower cumulus cloud-base height, leading to lower haze echo occurrences in the sub-cloud profiles. Higher near-surface relative humidity, lower wind speeds, and more southerly wind directions over Barbados are associated with the northward shift of the ITCZ and a weakening of the subtropical high in the northeastern North Atlantic. Therefore, the meteorological conditions in the first half of 2023 at BCO are likely related to a remote El Niño–Southern Oscillation response (Brueck et al., 2015). It is important to acknowledge that this analysis focused on specific variables, and there might be other factors unaccounted for that can influence the occurrence of haze echoes. More comprehensive investigations are needed to fully understand the factors influencing haze echo occurrences and their seasonality.
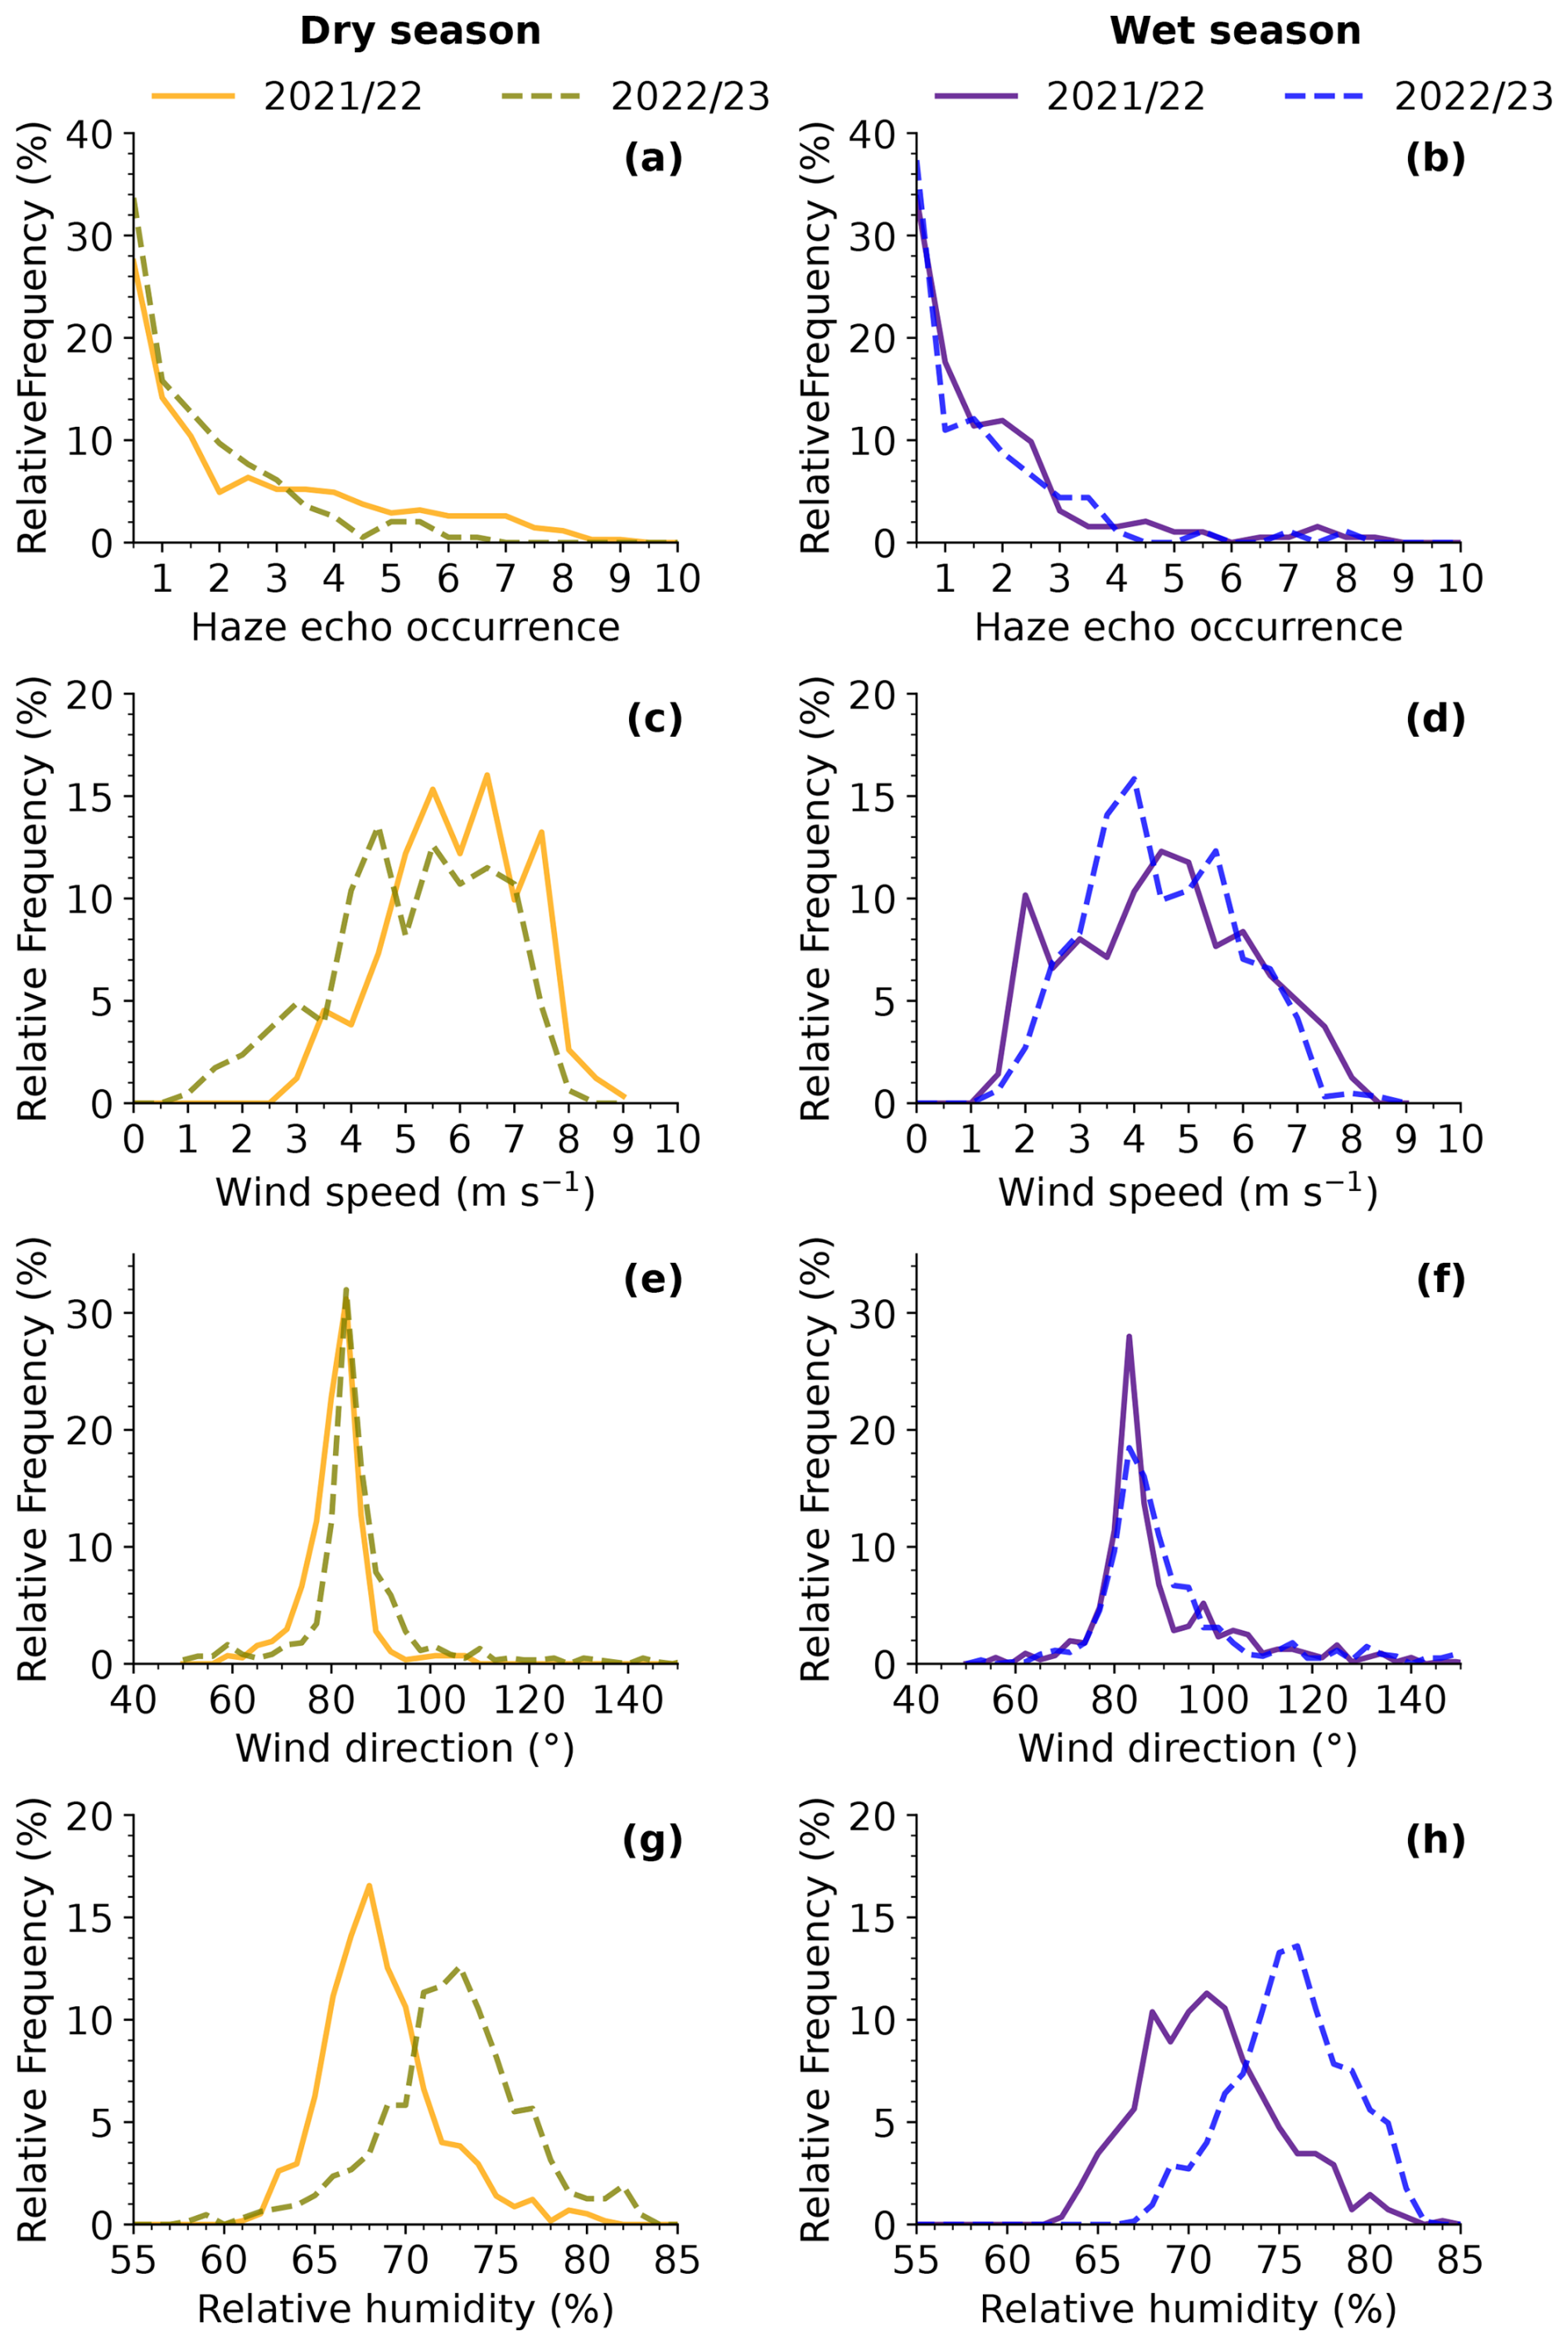
Figure 9The 6 h mean haze echo occurrence (bars) in panels (a) and (b). The 6 h mean 2 m surface observation of wind speed in panels (c) and (d), wind direction in panels (e) and (f), and relative humidity in panels (g) and (h) for the dry and wet season. The 2-year dataset was divided into two periods spanning July 2021 until July 2022 (labeled as 2021/2022 in yellow for the dry season and purple for the wet season) and July 2022 until July 2023 (labeled as 2022/23 in dashed green for the dry season and blue for the wet season).
4.2 Cloudnet statistics including haze echoes
Seasonal changes in cloudiness, precipitation, and haze echo occurrence for warm clouds and the warm cloud subset trade wind cumuli are evident in the measurements at the BCO between the dry and wet seasons from 1 July 2021 to 1 July 2023 in Fig. 10 and can be analyzed by using the proposed enhanced Cloudnet target classification. Here, “liquid droplets” (in Fig. 10a) refer to the combined Cloudnet target classifications “cloud droplets only” and “drizzle/rain and cloud droplets”. In the dry season, the frequency of occurrence of liquid droplets is on average higher (for warm clouds and trade wind cumuli) compared to the wet season. The relative frequency of “liquid droplets” in warm clouds and trade wind cumuli peaks near the LCL at 790 m in the dry season and 670 m in the wet season. Due to higher surface relative humidities during the wet season, the average height of the LCL is lower, which shifts the CBH downwards as also found by Nuijens et al. (2015a). The heights of these maxima are within the range of the average heights of the cloud bases during the dry and wet season derived by Nuijens et al. (2014). In general, the shape of the distribution of “liquid droplets” from trade wind cumuli reflects the presence of shallow cumulus humilis with cloud tops near 1.0–1.5 km as well as deeper cumuli with cloud tops up to 2–4 km as discussed by Nuijens et al. (2014). The secondary maximum of “liquid droplets” in warm clouds at altitudes between 1.5 and 2.0 km indicates the presence of stratiform clouds below the trade inversion. Thus, the seasonally higher occurrence of warm clouds in the dry season compared to the wet season is caused by a higher proportion of trade wind cumuli and of stratiform clouds with CBH above 1 km.
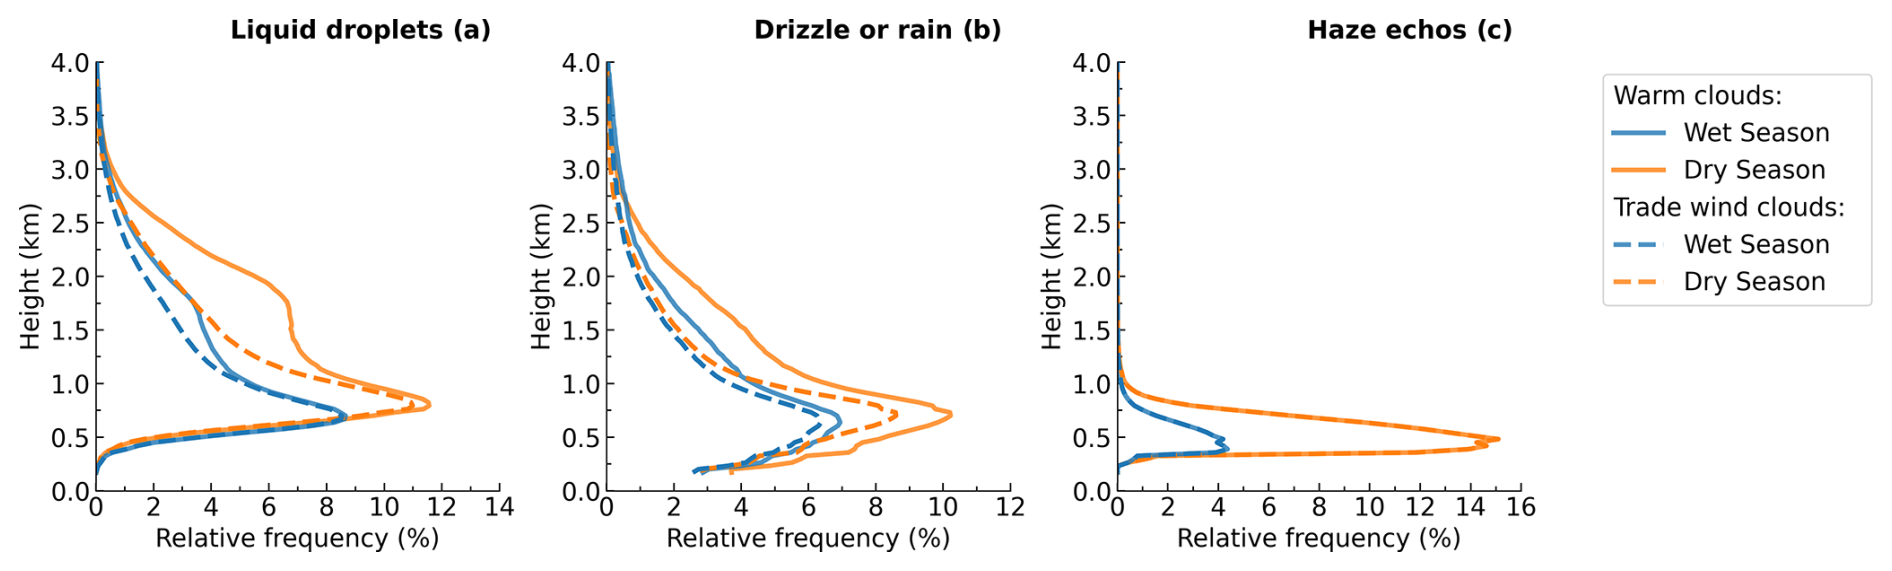
Figure 10Statistics of enhanced Cloudnet target classification including the “haze echo” target class for BCO based on data from 1 July 2021 until 1 July 2023: liquid droplets (a), drizzle or rain (b), and haze echoes (c). Results for warm clouds (solid line) and trade wind cumuli (dashed line) for the dry and wet season are shown.
“Drizzle or rain” is more frequent during the dry season compared to the wet season (Fig. 10b), which can be attributed to the higher frequency of occurrence of warm clouds during the dry season. From the location of the peak in the “drizzle or rain” relative frequency at 700 m during the dry season, the relative frequency of “drizzle or rain” decreases by around 7 % (from 10 % to 3 %) towards the height of the first radar range gate, indicating that a large proportion of “drizzle or rain” from warm clouds evaporates before reaching the ground. A similar shape in the vertical relative frequency distribution of “drizzle or rain” is evident for trade wind cumuli. In the wet season, sub-cloud evaporation of “drizzle or rain” is still evident, albeit less pronounced.
Haze echo distributions in the presence of warm clouds and trade wind cumuli are identical (Fig. 10c). Haze echoes occur a lot less frequently during the wet season compared to the dry season, which can be attributed to the prevalence of different environmental conditions as detailed in Sect. 4.1. Moreover, the interplay between dust transport and precipitation leads to the wet scavenging of aerosols and very clean periods despite the higher dust loading during the wet season (Stevens et al., 2016). Specifically, the haze echo relative frequency was found to decrease by a factor of 4 from about 16 % in the dry season to 4 % in the wet season. At the same time, haze echo layers in the wet season are on average shallower than during the dry season, which is substantiated by Fig. 9a and b. These results answer the question of how frequently “drizzle or rain” is misclassified in the standard Cloudnet target classification for the BCO: Fig. 10c shows that the frequency of occurrence of “drizzle or rain” in Cloudnet for the BCO without filtering haze echoes as proposed here is overestimated by up to 16 % (at 482 m altitude) in the dry season.
4.3 Comparison to classifiers
This subsection compares the haze echo detection method with the −50 dBZ reflectivity threshold method and the results from the Virga-Sniffer. Recall that the Virga-Sniffer haze echo detection (see Sect. 2.6) uses a profile-based cloud identification method combined with a pixel-based precipitation detection, while the newly developed haze echo detection method is solely pixel-based.
4.3.1 Reflectivity threshold approach
An example of the frequent occurrence of haze echoes below the CBH of cumulus clouds can be seen in the 19 December 2022 BCO case study in Fig. 11. Haze echoes occur in 86 % of the time steps. The old Cloudnet target classification in Fig. 11a shows a large number of pixels classified as “drizzle or rain” that are identified as haze echoes by our method in Fig. 11b. Radar reflectivities shown in Fig. 11d are hatched in Fig. 11b when they are lower than −50 dBZ. For this case study, 96 % of the pixels determined to be haze echoes with our combined heuristic probability method are identified by the −50 dBZ threshold.
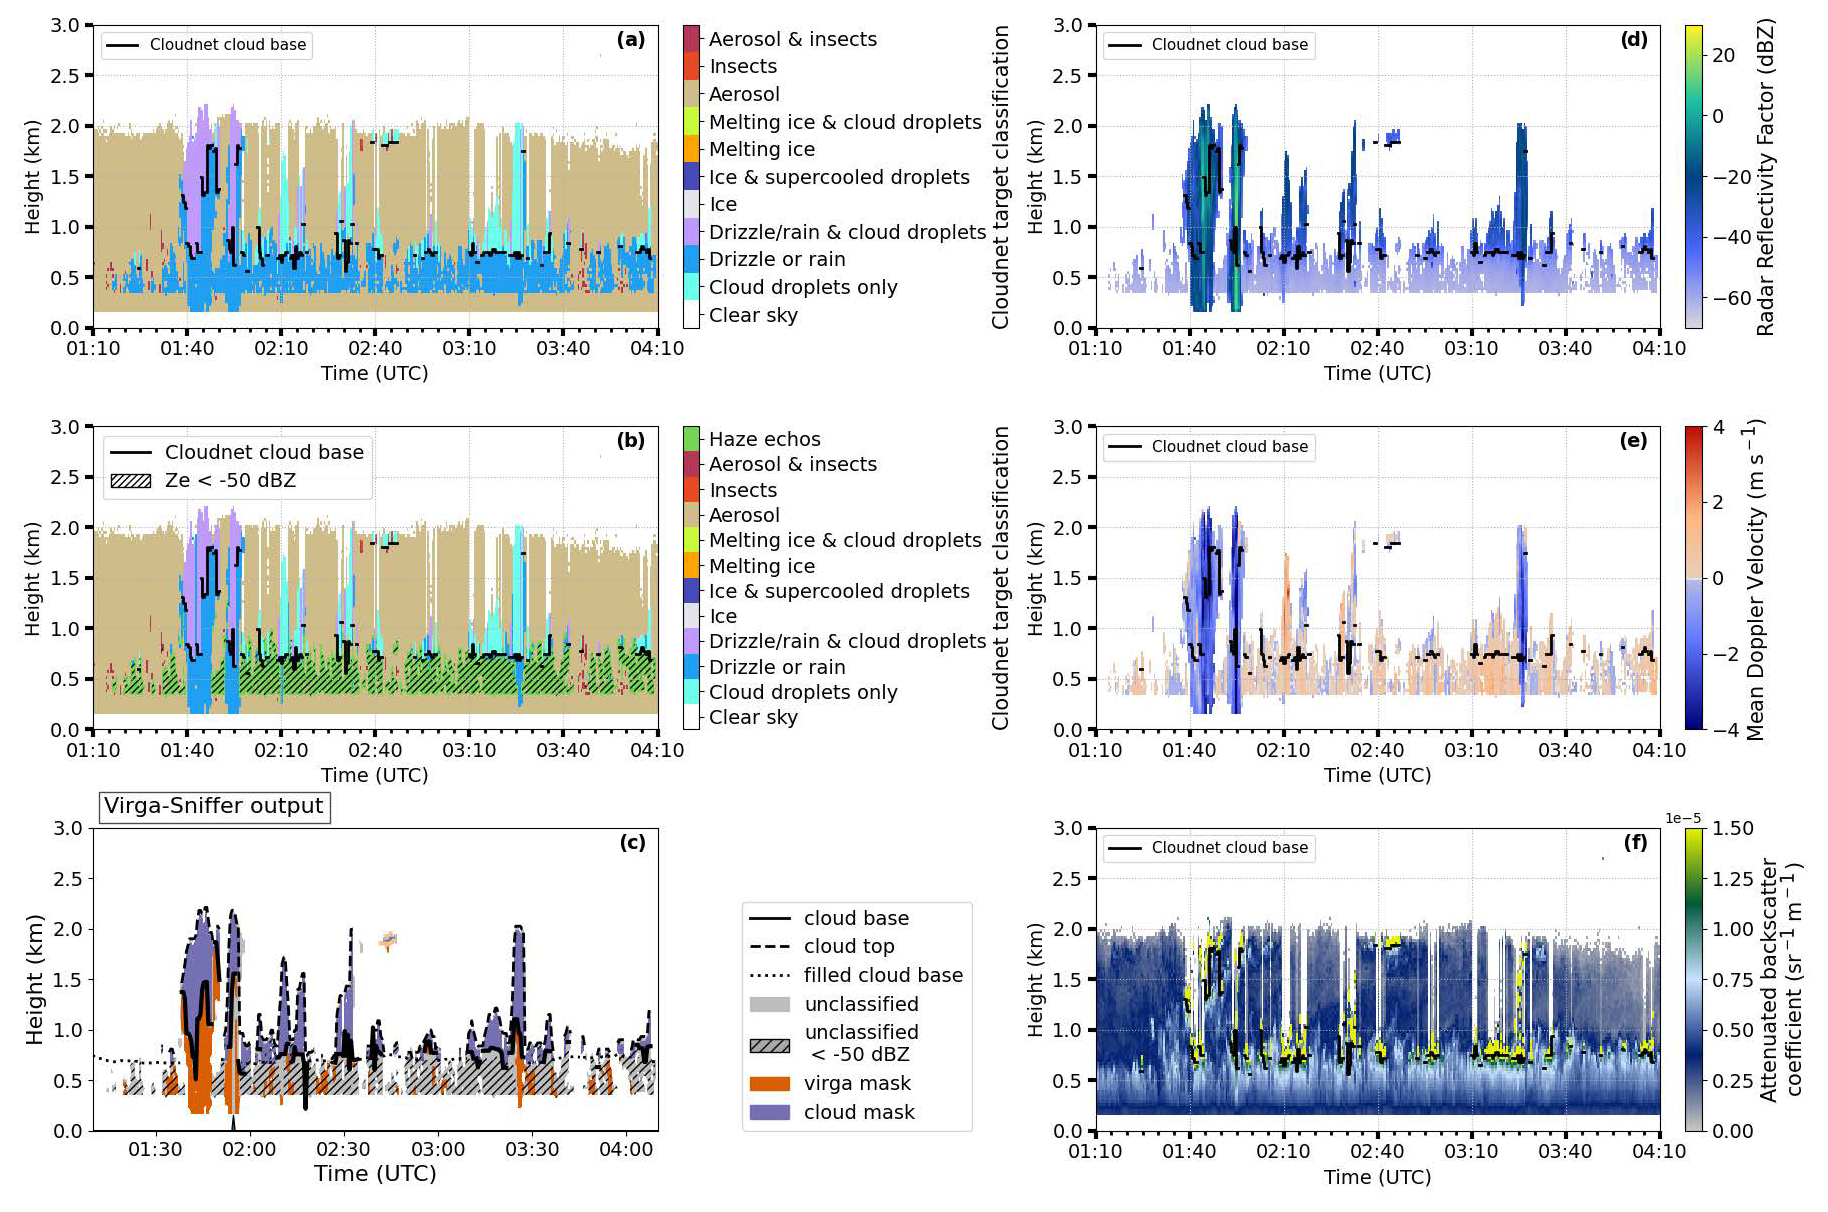
Figure 11BCO case study for 19 December 2022: Cloudnet target classification (old) (a), Cloudnet target classification (with new haze echo category) (b), Virga-Sniffer output (c), radar reflectivity factor (d), radar mean Doppler velocity (e), and ceilometer attenuated backscatter coefficient (f). Pixels with radar reflectivity below −50 dBZ are hatched in panels (b) and (c).
While case studies like this seem to highlight that a simple −50 dBZ reflectivity threshold is sufficient for filtering haze echoes from radar signals, there are other more complex situations. Evaporation of drizzle drops below a cumulus cloud at 21:10 UTC on 26 September 2021 at the BCO can be seen in Fig. 12. Pixels with radar reflectivities below −50 dBZ are hatched in the Cloudnet target classification plot (Fig. 12a). It can be seen that almost half of the pixels identified as “drizzle or rain” would be discarded when applying a simple −50 dBZ threshold. As shown in Fig. 12a, haze echoes were not classified for this case study, which is substantiated by the low values of the ceilometer attenuated backscatter coefficient plot (Fig. 12d).
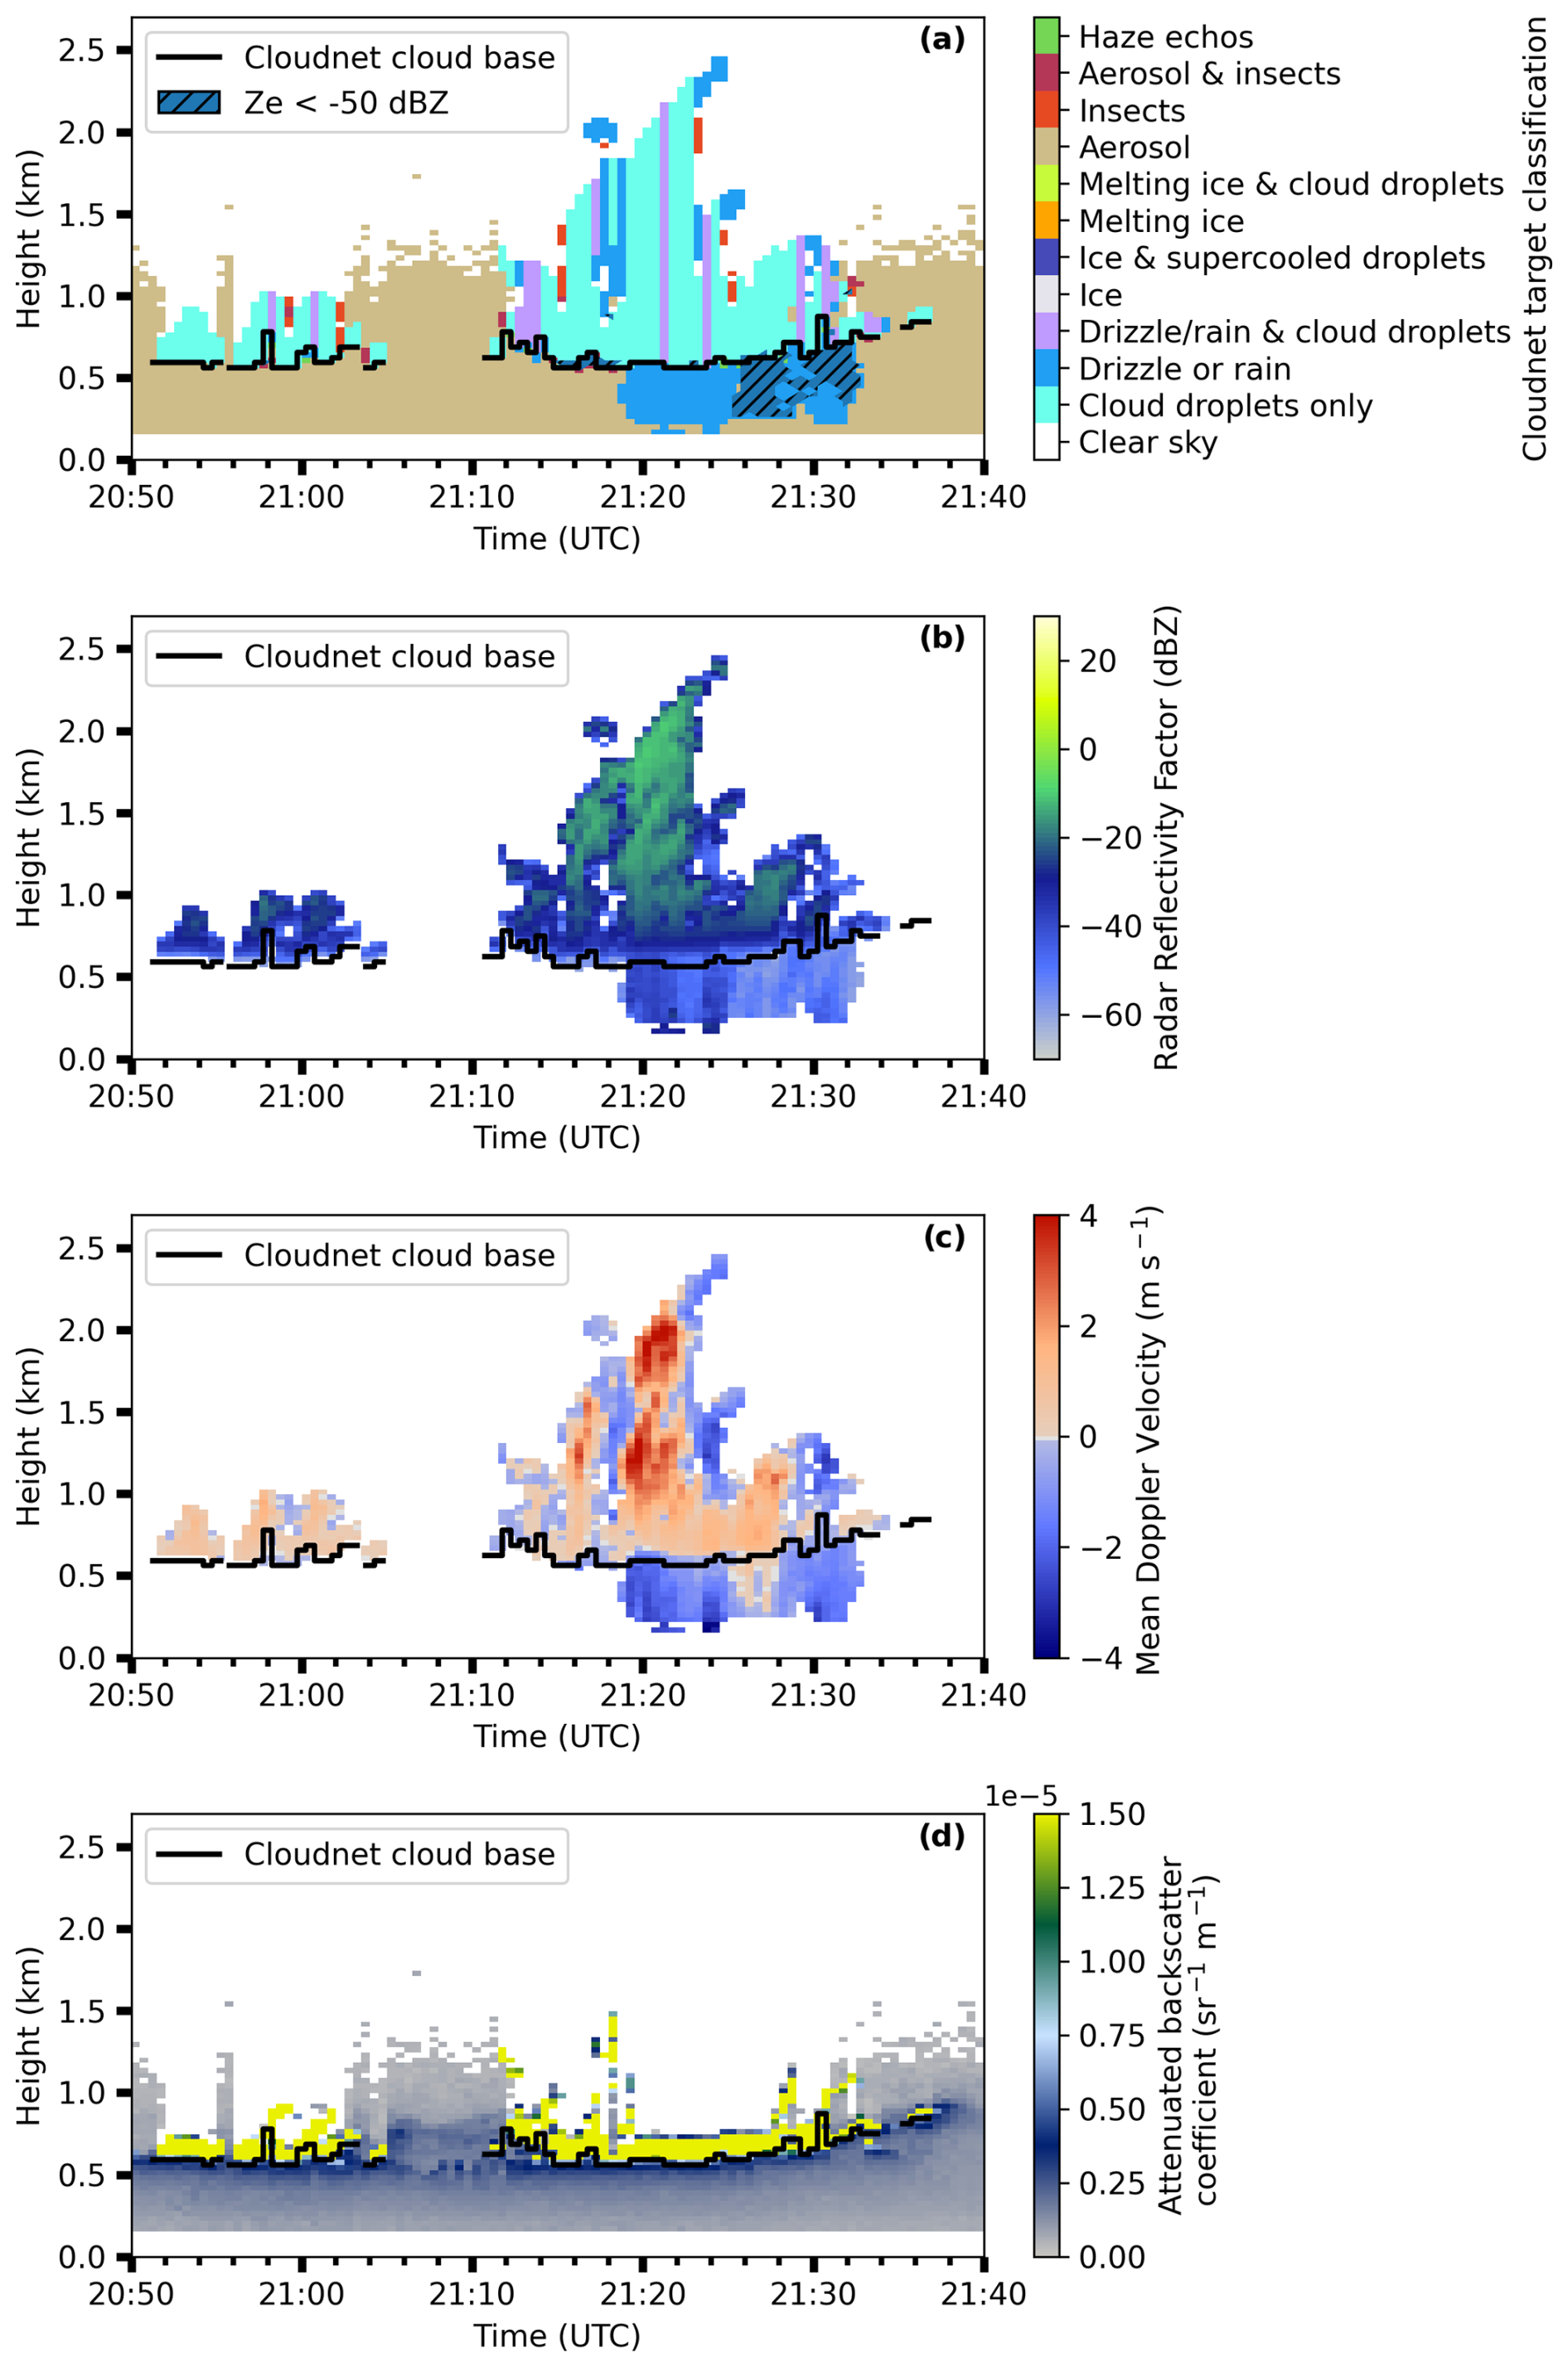
Figure 12BCO case study for 26 September 2021: Cloudnet target classification (a), radar reflectivity factor (b), radar mean Doppler velocity (c), and ceilometer attenuated backscatter coefficient (d). Pixels with radar reflectivity below −50 dBZ are hatched in panel (a).
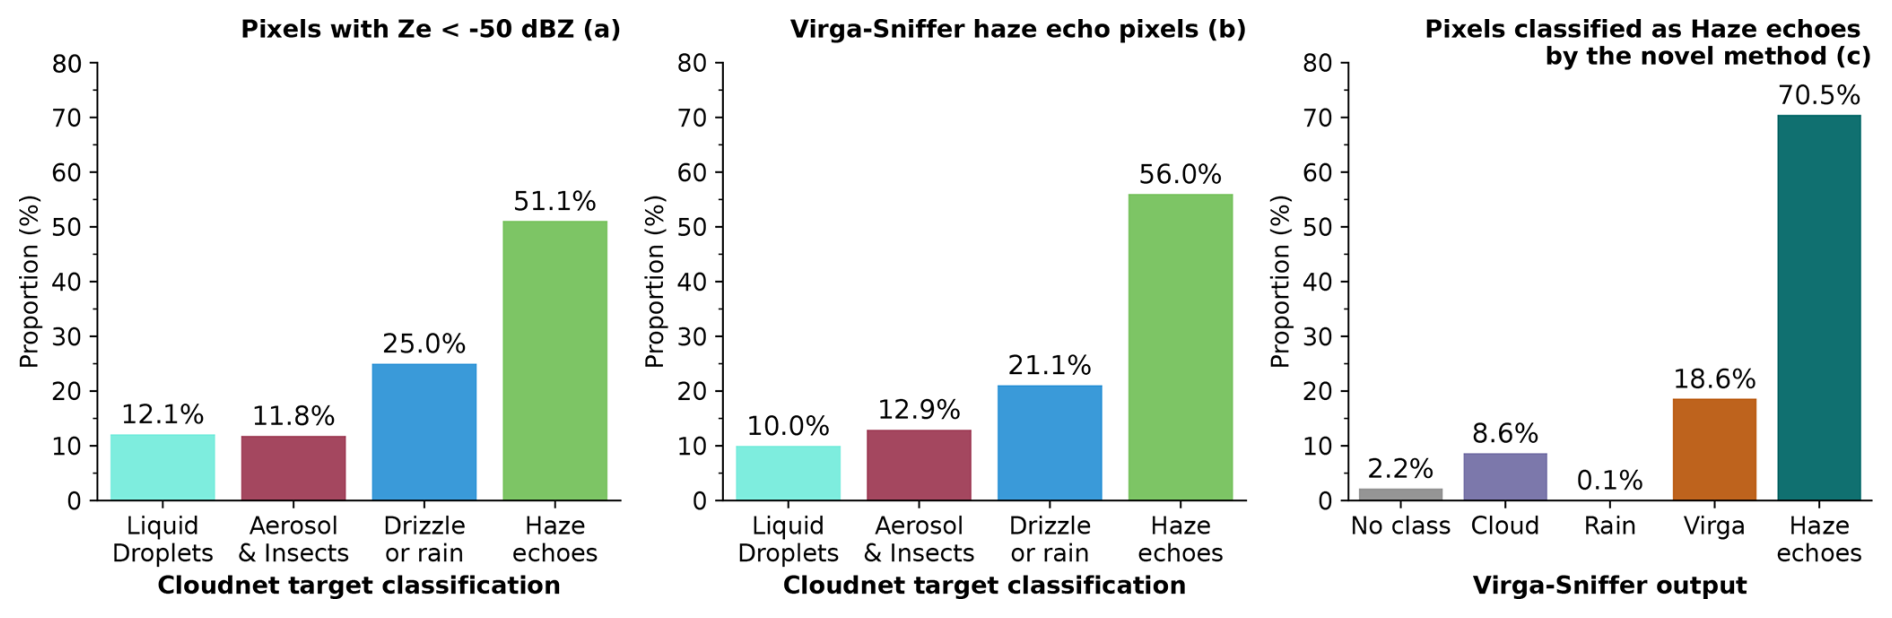
Figure 131 July 2021 until 1 July 2023 BCO: proportion of liquid droplets, drizzle or rain, aerosols and insects, and haze echoes of all pixels with radar reflectivity below −50 dBZ in panel (a) and for all pixels identified as haze echoes by the Virga-Sniffer in panel (b). Proportion of Virga-Sniffer pixels labeled as unclassified (no class), cloud, rain, virga, and haze echoes for pixels identified as haze echoes in Cloudnet in panel (c).
An analysis of the proportions of Cloudnet targets (including the new haze echo class) for all radar reflectivities below −50 dBZ for the period between 1 July 2021 and 1 July 2023 is shown in Fig. 13. Figure 13a shows that 12 % of all pixels with 50 dBZ are classified as “liquid droplets”, 25 % as “drizzle or rain”, 51 % as “haze echoes”, and 12 % as aerosols and insects. This means only about half of all targets that are filtered by the −50 dBZ threshold are haze echoes. Applying a −50 dBZ threshold-based method would lead to an underestimation of 6 % of all pixels classified as “drizzle or rain” and an underestimation of 4 % of all pixels classified as “liquid droplets”. While this proportion seems rather small, it can influence precipitation statistics for specific case studies.
4.3.2 Virga-Sniffer
For the 19 December 2022 case study, the Virga-Sniffer identifies 76 % of the haze echoes (see Fig. 11c). Pixels identified as virga in Fig. 11c and classified as haze echoes by the new method Fig. 11b have positive mean Doppler velocities. This can be explained by the Virga-Sniffer configuration, which excludes the occurrence of virga in these cases.
The Virga-Sniffer haze echo detection results for the long-term period between July 2021 and July 2023 is compared to the Cloudnet target classification that includes the new haze echo detection method in Fig. 13b. The proportions of pixels identified as haze echoes by the Virga-Sniffer are comprised of 10 % “liquid droplets”, 22 % “drizzle or rain”, 55 % “haze echoes”, and 13 % insects and aerosols. This result is very similar to the −50 dBZ threshold result in Fig. 13a, which is related to the fact that haze echo detection by the Virga-Sniffer is based on the same radar reflectivity threshold.
When comparing the pixels identified as haze echoes by the newly proposed haze echo classification method with the Virga-Sniffer output (Fig. 13c), the Virga-Sniffer identifies 71 % as haze echoes, 9 % as clouds, 19 % as virga, 0 % as precipitation reaching the ground, and 2 % as unclassified. These results indicate that both methods compare reasonably well. The optimal configuration of the Virga-Sniffer is a prerequisite for comparing its results with those of the developed method for the detection of sea salt aerosols. The proportion of pixels classified as virga for pixels classified as haze echoes by our new method is influenced by the configuration of the clutter mask and velocity mask of the Virga-Sniffer. In the standard Virga-Sniffer configuration, precipitation is restricted to occur for negative mean Doppler velocities.
Consequently, precipitation is not identified in updrafts (indicated by positive Doppler velocities). Changing the clutter mask to and reduces the proportion of identified virga by the Virga-Sniffer for haze echo pixels as classified by the new method to 0 %. Consequently, haze echoes identified with the newly developed method that are also labeled as haze echoes by the Virga-Sniffer would then increase to 89 % (sum of virga + haze echo proportion in Fig. 13c). Summarizing, the parameter settings of the highly configurable Virga-Sniffer should be chosen with care as they largely explain the differences in the proportion of haze echoes between the method developed here and that of the Virga-Sniffer. The remaining differences demonstrate the uncertainties of both methods, which cannot reliably distinguish between drizzle and haze echoes when they potentially co-occur.
4.4 Limitations of the proposed haze echo identification method
As shown by Klingebiel et al. (2019), it is most likely that haze echoes are caused by hygroscopically grown sea salt particles and not by precipitation. However, we want to discuss the possibility that the signals we classify as haze echoes are caused by drizzle drops that fall into strong updrafts, evaporate, and decrease in size, indicated by a downward decrease in radar reflectivity factor.
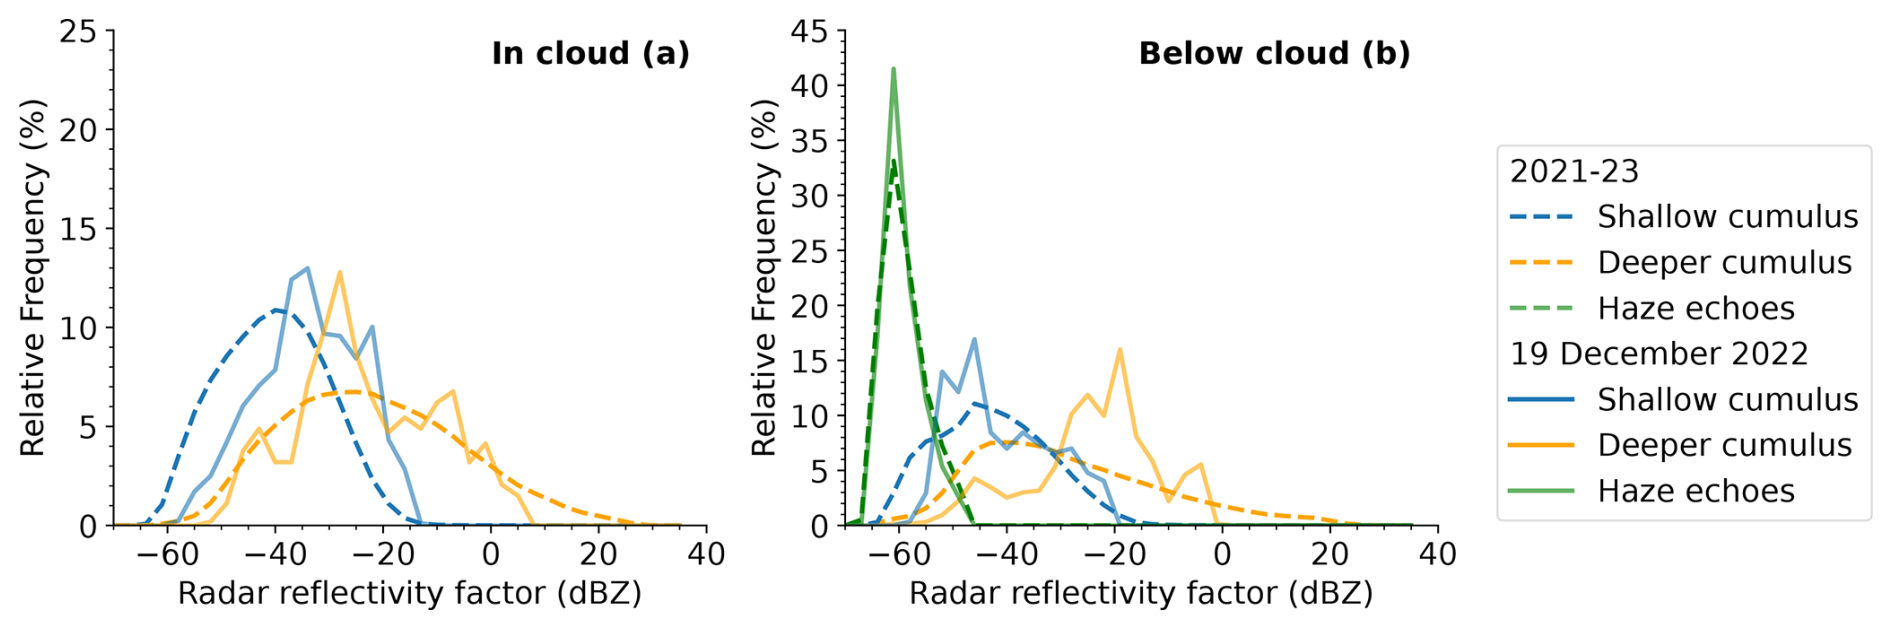
Figure 14Relative frequency distributions of radar reflectivity in clouds (a) and below clouds (b) on 19 December 2022 (solid lines) and for the long-term period (from 1 July 2021 to 1 July 2023, dashed lines). Distributions comprise pixels identified as liquid droplets for in-cloud reflectivities in panel (a) and pixels classified as “drizzle or rain” or “haze echoes” for below-cloud radar reflectivities in panel (b). Distributions are further separated into the contribution from shallow cumulus clouds in blue and for deeper cumulus clouds in yellow.
The radar reflectivity factor is proportional to the sixth power of the drop diameter. A few large drops can therefore lead to large radar reflectivity values. In that case, high radar reflectivity factors within the cloud would indicate the presence of drizzle drops. Typical threshold values for the presence of drizzle in a cloud range between −20 and −15 dBZ (Kogan et al., 2012; Frisch et al., 1995). For a case study at the BCO, Acquistapace et al. (2019) showed that the radar reflectivity factor increases inside shallow cumulus clouds from −40 dBZ for no drizzling clouds to −10 dBZ in the presence of larger drizzle drops. In this study, skewness was used as a criterion for the detection of drizzle formation. The value of −30 dBZ indicates the potential presence of embryonic drizzle drops, while drizzle drops that are large enough and dominate the signal in the radar measurements have radar reflectivity factors of around −10 dBZ (Acquistapace et al., 2019). The BCO data available to us are missing information about the radar Doppler spectrum, which is why higher moments such as skewness could not be determined. Consequently, we focus on analyzing the radar reflectivity factor inside and below cumulus clouds (Fig. 14).
Shallow cumulus clouds in the case study of Acquistapace et al. (2019) have CTH below 2 km. Subsequently, we define clouds with CBH below 1 km and CTH below 2 km as shallow cumulus clouds and clouds with CTH above 2 km as deeper cumulus clouds. In the following, we extend the analysis from case study descriptions – that might not be representative for larger datasets – to the 2-year period between July 2021 and July 2023. The question “drizzle or haze echoes?” can only be asked when there is a cloud present above (when excluding the signals caused by tilted precipitation fall streaks). Consequently, we analyze how often haze echoes occur below shallow and deeper cumulus clouds to identify how often a misclassification of haze echoes for true drizzle signals by our method might occur. In the 2-year time period, haze echoes occur in 52 % of the time steps below the CBH of the shallow cumulus clouds. For the same time period, haze echoes below CBH of deeper cumulus clouds occur 36 % of the time.
As shown in Fig. 14a, for shallow cumulus clouds, the in-cloud radar reflectivity factor remains well below −10 dBZ for both the 19 December 2022 case study and the long-term period. Both distributions could indicate the presence of larger drizzle drops. However, we cannot be certain because of lacking skewness information. For the long-term statistics, only 17 % of radar reflectivity values within shallow cumulus clouds range between −30 and −10 dBZ, indicating possible drizzle growth and reaching the typical drizzle thresholds as suggested by Kogan et al. (2012) and Frisch et al. (1995). This low percentage implies that, while drizzle formation inside the clouds is possible, it is not dominant in the shallow cumulus clouds at the BCO. A study by Albright et al. (2023) at the BCO further supports the idea that very shallow clouds over Barbados rarely produce precipitation. From their observations, they hypothesize that a large part of the condensate from clouds that form within the transition layer between 550 and 700 m and have CTH below 1.3 km evaporates as the role of these clouds is to humidify the transition layer. In the 2-year dataset analyzed here, we also detect haze echoes below these very shallow clouds and in line with Albright et al. (2023) conclude that for these clouds, misclassification of precipitation as sea salt aerosols is unlikely.
For deeper cumulus, 69 % of all in-cloud pixels have radar reflectivity values greater than −30 dBZ as shown in Fig. 14a. For these deeper clouds, values of the radar reflectivity factor range from −60 to 35 dBZ. In general, the in-cloud reflectivity distributions of deeper cumulus clouds are similar compared to the case study of Acquistapace et al. (2019), where the majority of selected clouds have CBH above 1 km. For the long-term period, the majority of pixels within deeper cumulus clouds indicate drizzle growth and larger drizzle drops. This is also supported by the results obtained by Nuijens et al. (2009), who found that deeper clouds produce rain more frequently.
Figure 14b shows the frequency distributions of radar reflectivity for all pixels identified as “drizzle or rain” and as “haze echoes” below shallow and deeper cumulus clouds. Radar reflectivity values for pixels identified as “drizzle or rain” extend down to −67 dBZ, thus overlapping with the haze echo reflectivity distributions. However, for the long-term radar reflectivity distribution, the occurrence of these low radar reflectivities for the “drizzle or rain” class is below 5 %. From these results, we conclude that in deeper cumulus clouds with haze echoes below the CBH, the possibility exists that in a few cases, precipitation and haze echoes can occur together in one profile. However, as this is only true for a minority of cases, our method is mostly able to discriminate between drizzle and haze echoes.
For a complete picture of haze echo occurrence at BCO as determined by our new method, we would also like to report haze echo occurrence for the entire time – whether clouds or precipitation were present or not. For the analyzed 2-year period, using the 30 s Cloudnet resolution, haze echoes occurred 21 % of the time.
We would like to mention that this statistic is not directly comparable to the 76 % haze echo occurrence reported by Klingebiel et al. (2019). Their analysis focused on the fraction of high haze echo occurrences (> 4 pixels per profile) within 6 h mean time windows, excluding profiles affected by precipitation or clear-sky conditions during these periods.
Here, we build upon the study by Klingebiel et al. (2019), which concluded that haze echoes over the BCO are caused by hygroscopically grown sea salt particles. We developed a method to discriminate between haze echoes and “drizzle or rain” in Cloudnet, utilizing a combined probability threshold based on cloud radar reflectivity factor, radar mean Doppler velocity, and the ceilometer attenuated backscatter coefficient. Our method, which works similarly to the insect detection algorithm in Cloudnet, relies on the appropriate selection of thresholds as inputs for deriving heuristic probability functions. We do acknowledge that the method has limitations, and some residual misclassification may remain in Cloudnet, particularly in cases where small drizzle drops fall into a layer of haze echoes.
The results of the Cloudnet statistics with the method developed here for a 2-year period from July 2021 to July 2023 focus on warm clouds over the BCO, which were selected from the observations using an object-based approach. Specifically, this approach distinguishes between warm clouds (CBH below 4 km and CTH below the 0 °C wet-bulb temperature isotherm) and trade wind cumuli (CBH below 1 km). The vertical distribution of “liquid droplets” (the combination of the target classes “cloud droplets only” and “drizzle or rain and cloud droplets”) peaks at specific altitudes corresponding to the CBH of shallow cumulus clouds during both seasons. Trade wind cumuli are more frequent in the dry season, and warm clouds show a second increase in relative frequency due to the presence of stratiform outflow clouds below the trade inversion between 1 and 3 km. A higher occurrence of “drizzle or rain” in the dry season can therefore be explained by the higher occurrence of warm clouds. In the dry season, undetected haze echoes in the standard Cloudnet target classification were found to lead to an overestimation of up to 16 % of “drizzle or rain” occurrence. In the wet season, the overestimation amounts to 4 %. Significant interannual differences as well as seasonal differences in haze echo occurrence were found. Seasonal differences in the occurrence of haze echoes over the BCO are related to changes in wind speed and wind direction. Haze echoes show an increased occurrence in the dry season when wind speeds are higher compared to the wet season. This supports existing assumptions that indicate a connection between sea salt aerosol presence and wind speed and thus underpin the hypothesis that haze echoes originate from sea salt aerosols.
To validate our method, we applied the Virga-Sniffer tool – which we extended with a haze echo class – to the measurements over the BCO. A total of 70 % of all pixels identified as haze echoes by our method are also identified as haze echoes by the Virga-Sniffer tool, which demonstrates that haze echoes are detected by two independent methods. Modifications of Virga-Sniffer settings resulted in even better comparabilities of haze echo occurrences (with 89 % overlap).
The presented method is applicable to all marine atmospheric remote sensing facilities that provide a 35 GHz cloud radar and a ceilometer. The method to identify haze echoes in the Cloudnet target classification depends on the selection of thresholds. Other atmospheric observatories with similar instrumentation close to the ocean that might detect sea salt aerosols need to select appropriate thresholds dependent on the characteristics of their instruments and individual calibration factors. The approach is flexible and allows a future integration of further variables such as radar Doppler spectra skewness. All in all, our proposed method for haze echo identification significantly improves the classification of “drizzle or rain” in the Cloudnet target classification scheme in the measurements over the BCO and was independently validated with the Virga-Sniffer tool. For the first time, long-term statistics from the Cloudnet dataset and the Virga-Sniffer were calculated at the BCO. The statistics therefore form a basis for future studies that quantify the occurrence of precipitation and the sub-cloud fate of precipitation in the trade wind regions. Haze echoes as identified here serve as a proxy for sea salt aerosol occurrence; this opens the possibility of further in-depth sea salt–cloud interaction studies, e.g., with Raman lidar, which observes relative humidity and aerosol optical properties.
The Virga-Sniffer enables the detection of precipitation and haze echoes and is used here as an independent tool that validates our haze echo detection method. Please note the following differences between the study by Kalesse-Los et al. (2023) and this present study: in Kalesse-Los et al. (2023), warm clouds are defined as clouds with a CBH below 4 km and trade wind cumuli are defined as clouds with a CBH below 1 km.
For the BCO measurements, however, we differentiate between warm clouds and trade wind cumuli using an object-based detection method described in Sect. 3.2. In addition, we define warm clouds as clouds with CTH below the height of the 0 °C isotherm. To relate the following statistics and allow a better comparison between the BCO and RV Meteor observations, the object-based detection method was also applied to the RV Meteor observations during the EUREC4A campaign. This comparison contextualizes the long-term virga statistics at the BCO by aligning them with the published results of Kalesse-Los et al. (2023). By comparing data from both platforms during the same time period, we aim to highlight differences due to instrument variations and provide a more comprehensive understanding of the statistics across different observation environments. Also, for the first time, we obtain long-term statistics from the Virga-Sniffer at the BCO.
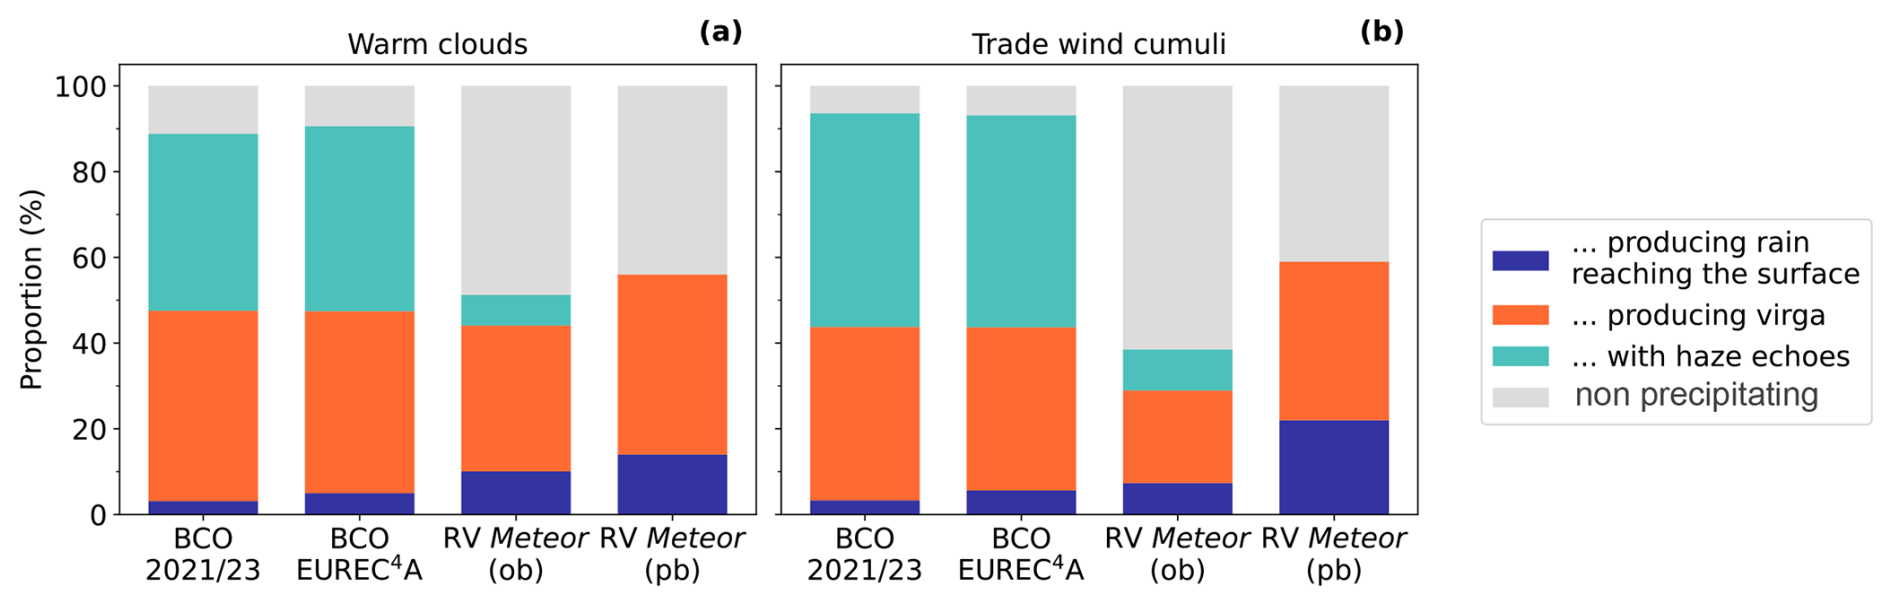
Figure A1Virga-Sniffer-based statistics of precipitation, virga, and haze echo in percent for warm clouds and trade wind cumuli for different observation periods and platforms. For the BCO, the object-based (ob) cloud classification was applied for the long-term measurements and EUREC4A. The (ob) results over RV Meteor during EUREC4A are contrasted with the profile-based (pb) statistics taken from Kalesse-Los et al. (2023). The category “non-precipitating” in this context includes all time steps where no precipitation was found below CBH.
Between July 2021 and July 2023 over the BCO, 61 % of all detected clouds are warm clouds (see Fig. A1). A total of 48 % of these warm clouds produce precipitation, 44 % of which fully evaporates before reaching the ground. A total of 68 % of warm cloud virga originates from trade wind cumuli. When not counting haze echoes while virga is detected in the same profile, the Virga-Sniffer identifies haze echoes below the CBH of warm clouds 41 % of the time. When we include non-precipitating and precipitating warm clouds (i.e., also include profiles where haze echoes and virga are detected simultaneously), haze echoes occur 64 % of the time. Consequently, the Virga-Sniffer identifies 23 % of the profiles as profiles containing drizzle drops that fall into a layer of haze echoes.
For the considered 2-year time period at BCO, 75 % of the detected warm clouds are trade wind cumuli. This result is higher than that of Nuijens et al. (2014), who estimated that the contribution of cloud cover near the LCL is about two-thirds of the total cloud cover of clouds below 4 km. The temporal cloud cover in their study refers to the proportion of time that a CBH is detected above the observation site. Consequently, cloud cover near the LCL should be similar compared to the proportion of trade wind cumuli but not compared to the warm cloud proportion as the contribution of stratiform clouds to the cloud cover is not fully reflected in the results from Nuijens et al. (2014). Furthermore, in Nuijens et al. (2014) an approximately 10 dBZ higher reflectivity threshold (of −40 dBZ) was applied to the radar reflectivity factor for cloud identification. They found that lowering the reflectivity threshold increases the number of detected optically thin clouds near the LCL. Considering these differences in approaches, our results are in a similar range as the ones of Nuijens et al. (2014).
A1 EUREC4A statistics at the BCO and for the RV Meteor
Figure A1 gives an overview of Virga-Sniffer-derived statistics of clouds, precipitation, and haze echoes for BCO and RV Meteor during EUREC4A.
Comparing BCO and RV Meteor object-based statistics, the surface rain fraction over the RV Meteor is 5 % vs. 10 % (see Fig. A1a). Comparability of these statistics is limited though because of the following: precipitation reaching the surface is classified when a reflectivity threshold of 0 dBZ is exceeded in the lowest radar range gate. The lowest radar range above RV Meteor is about 150 m higher than that over the BCO. Thus, over BCO the drizzle drops can fall a longer distance in the dry sub-cloud layer before reaching the lowest radar range gate and could thus evaporate to smaller sizes so that the surface rain reflectivity threshold is reached less frequently at the BCO.
Above the BCO, the proportion of virga is higher compared to the RV Meteor. The higher proportion of virga could again be explained by the reflectivity threshold for surface precipitation but also by the higher sensitivity of the radar at the BCO. This mainly involves radar reflectivities below −50 dBZ, which can be caused by sea salt aerosols or evaporating drizzle drops. Therefore, the virga proportion at the BCO may also be overestimated.
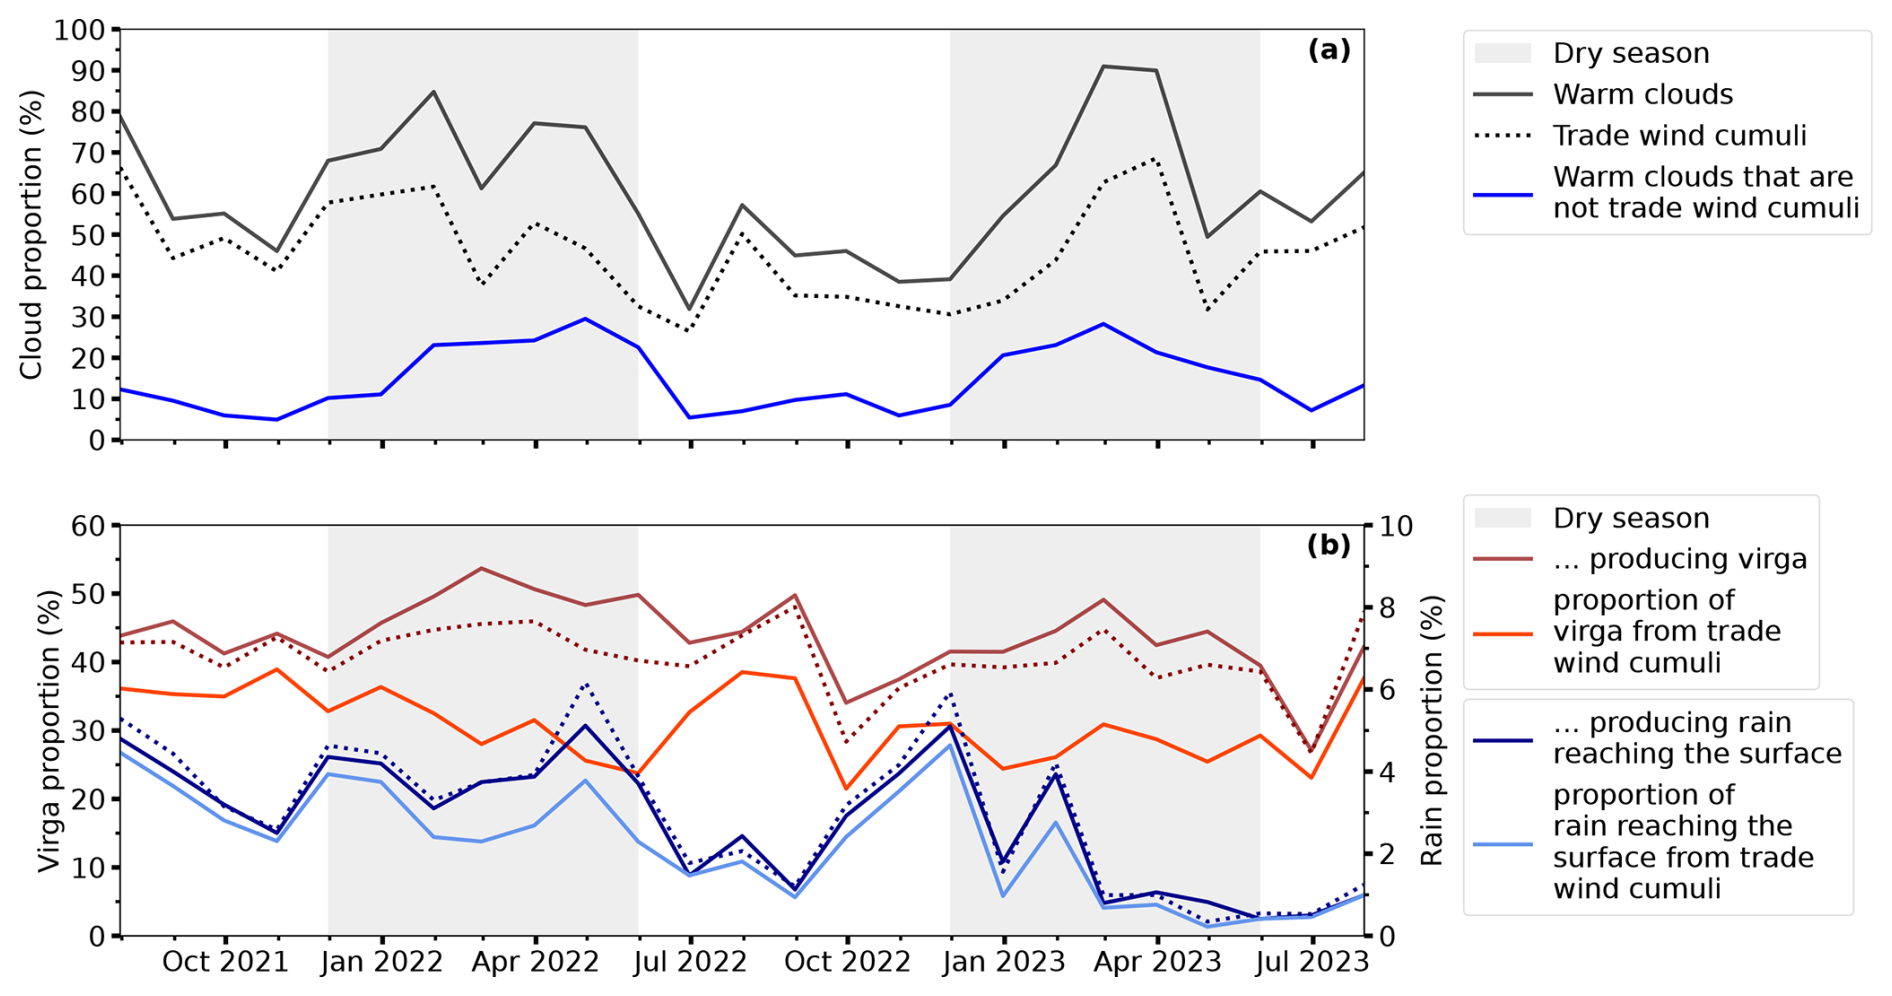
Figure A2Monthly mean proportion of warm clouds, trade wind cumuli, and warm clouds that are not trade wind cumuli in panel (a) and virga as well as rain reaching the ground for warm clouds and trade wind cumuli (dotted line) in panel (b) over the BCO from July 2021 to July 2023. The dry season is indicated by the gray-shaded area that spans December until June.
Differences between the object-based RV Meteor statistics and profile-based RV Meteor statistics are related to the differences in the Virga-Sniffer configurations and cloud classification approaches. The number of time steps identified as non-precipitating in profile-based approaches depends on the detected number of cloud-base heights (CBHs). In contrast, object-based statistics consider all time steps with warm cloud radar signals, regardless of CBH detection. This is further discussed in Roschke et al. (2024).
A2 Long-term Virga-Sniffer statistics at the BCO
Haze echo detections can be achieved when modifying the Virga-Sniffer configuration as explained in Sect. 4.4.
Intra-year variability at BCO for the 2 analyzed years is high as illustrated in Fig. A2. The proportion of rain reaching the surface, identified by the Virga-Sniffer rain flag, is reduced in the dry season of 2022/23 compared to the dry season of 2021/22. In contrast, the decrease in the proportion of virga is less pronounced. The lower proportion of rain reaching the surface could be related to a lower proportion of deep trade wind cumuli. When trade wind cumuli are deep (reach heights between 2–4 km), they rain more frequently (Nuijens et al., 2014). As surface observations indicate, relative humidities were in general higher and wind speeds lower in 2023 (see Fig. 9). Lower wind speeds could be an explanation for why CTHs of trade wind cumuli reached lower heights in the dry season of 2022/23, according to Brueck et al. (2015). The lower proportion of raining trade wind cumuli may therefore be related to the meteorological conditions in 2022/23.
The proportion of warm clouds that are trade wind cumuli is notably higher during the wet season, indicating a lower quantity of stratiform outflow cloud layers during this season. These findings support those of Nuijens et al. (2014), who found that cloud cover above 1 km is larger during the dry season due to the higher occurrence of deeper clouds with tops near the inversion and stratiform outflow, which is substantiated by Figs. 10 and A2a. Moreover, their results indicate that fewer trade wind cumuli are reaching heights of 2–4 km during the wet season. A higher proportion of stratiform outflow clouds in the dry season might be the reason for the higher proportion of virga from warm clouds in that season.
The source code of the haze echo classification (https://doi.org/10.5281/zenodo.10469906, v1.0.1, Roschke, 2024a) and cloud classification algorithm (https://doi.org/10.5281/zenodo.10471932, v1.0.1, Roschke, 2024b) is freely available and hosted on Zenodo. All datasets used in this study can be accessed on Zenodo at https://doi.org/10.5281/zenodo.14257243 (Roschke et al., 2024). The BCO data are freely available to the broader community upon request. Cloudnet processing was done using CloudnetPy (https://doi.org/10.5281/zenodo.7432587, v1.43.0, Tukiainen et al., 2022). The data measured on board RV Meteor during EUREC4A are hosted by the AERIS Portal at https://observations.ipsl.fr/aeris/eurec4a/ (last access: 23 January 2025). This includes data products from the onboard meteorological station operated by DWD, the ceilometer (https://doi.org/10.25326/53, Jansen, 2020) operated by MPI for Meteorology Hamburg, and the Doppler cloud radar LIMRAD94 (https://doi.org/10.25326/164, Kalesse-Los et al., 2021) and microwave radiometer LIMHAT (https://doi.org/10.25326/77, Kalesse-Los et al., 2020) operated by Leipzig University.
This publication is based on the Master thesis written by JR, which was supervised by HKL and MH. JR developed the haze echo classification and cloud classification algorithm, performed the CloudnetPy processing and Virga-Sniffer processing of the BCO data, used the Virga-Sniffer output for analysis of the BCO and RV Meteor EUREC4A data, derived the statistics of the Cloudnet target classification data, and contributed the most to the writing of the manuscript. HKL was in charge of the project management and operation of the instruments of Leipzig University on board RV Meteor during EUREC4A. JW performed the Virga-Sniffer processing and statistics for additional configurations of the Virga-Sniffer for the EUREC4A dataset. HKL, MH, MK, JW, AF, and AK contributed to the discussions and editing of the manuscript. AK gave valuable feedback regarding the Virga-Sniffer statistics.
The contact author has declared that none of the authors has any competing interests.
Publisher's note: Copernicus Publications remains neutral with regard to jurisdictional claims made in the text, published maps, institutional affiliations, or any other geographical representation in this paper. While Copernicus Publications makes every effort to include appropriate place names, the final responsibility lies with the authors.
The BCO data used in this publication were provided by the MPI for Meteorology Hamburg. We thank Lutz Hirsch, who provided scientific and technical support regarding the BCO data. The data are freely available to the broader community upon request. Special thanks to Johannes Bühl, Willi Schimmel, and Teresa Vogl, who gave technical support regarding the processing of the Cloudnet dataset for the BCO. The RV Meteor data used in this publication were gathered in the EUREC4A field campaign and are made available through the AERIS portal by data upload through Leipzig University, MPI for Meteorology Hamburg, and the German Weather Service (DWD). EUREC4A is funded with the support of the European Research Council (ERC), the Max Planck Society (MPG), the German Research Foundation (DFG), the German Meteorological Service (DWD), and the German Aerospace Center (DLR). We acknowledge the pan-European Aerosol, Clouds, and Trace Gases research Infrastructure (ACTRIS) for providing the Cloudnet framework used in this study, which was developed by the Finnish Meteorological Institute (FMI) and is available for download from https://cloudnet.fmi.fi/. We also acknowledge ECMWF for providing Integrated Forecasting System (IFS) model data as input for CloudnetPy. Parts of the results in this work make use of the color maps in the CMasher package (van der Velden, 2020). Special thanks to Nina Robbins and Ilya Serikov from MPI for Meteorology Hamburg for discussions about the BCO Raman lidar dataset collected during EUREC4A.
This research has been supported by the Europäischer Sozialfonds (grant no. 232101734) and the Deutsche Forschungsgemeinschaft (project no. 438108095). The paper was funded by the Open Access Publishing Fund of Leipzig University supported by the German Research Foundation within the program Open Access Publication Funding.
This paper was edited by Pavlos Kollias and reviewed by three anonymous referees.
Acquistapace, C., Löhnert, U., Maahn, M., and Kollias, P.: A new criterion to improve operational drizzle detection with ground-based remote sensing, J. Atmos. Ocean. Tech., 36, 781–801, https://doi.org/10.1175/JTECH-D-18-0158.1, 2019. a, b, c, d, e, f
Albrecht, B. A.: Effects of precipitation on the thermodynamic structure of the trade wind boundary layer, J. Geophys. Res.-Atmos., 98, 7327–7337, 1993. a
Albrecht, B. A., Bretherton, C. S., Johnson, D., Scubert, W. H., and Frisch, A. S.: The Atlantic stratocumulus transition experiment – ASTEX, B. Am. Meteorol. Soc., 76, 889–904, 1995. a
Albright, A. L., Stevens, B., Bony, S., and Vogel, R.: A New Conceptual Picture of the Trade Wind Transition Layer, J. Atmos. Sci., 80, 1547–1563, https://doi.org/10.1175/JAS-D-22-0184.1, 2023. a, b
Brueck, M., Nuijens, L., and Stevens, B.: On the seasonal and synoptic time-scale variability of the North Atlantic trade wind region and its low-level clouds, J. Atmos. Sci., 72, 1428–1446, https://doi.org/10.1175/JAS-D-14-0054.1, 2015. a, b
Cesana, G. V. and Del Genio, A. D.: Observational constraint on cloud feedbacks suggests moderate climate sensitivity, Nat. Clim. Change, 11, 213–218, 2021. a
Clarke, A., Kapustin, V., Howell, S., Moore, K., Lienert, B., Masonis, S., Anderson, T., and Covert, D.: Sea-salt size distributions from breaking waves: Implications for marine aerosol production and optical extinction measurements during SEAS, J. Atmos. Ocean. Tech., 20, 1362–1374, https://doi.org/10.1175/1520-0426(2003)020<1362:SSDFBW>2.0.CO;2, 2003. a
Emanuel, K. A., David Neelin, J., and Bretherton, C. S.: On large-scale circulations in convecting atmospheres, Q. J. Roy. Meteor. Soc., 120, 1111–1143, 1994. a
Frisch, A., Fairall, C., and Snider, J.: Measurement of stratus cloud and drizzle parameters in ASTEX with a K α-band Doppler radar and a microwave radiometer, J. Atmos. Sci., 52, 2788–2799, https://doi.org/10.1175/1520-0469(1995)052<2788:MOSCAD>2.0.CO;2, 1995. a, b
Glienke, S., Kostinski, A., Fugal, J., Shaw, R., Borrmann, S., and Stith, J.: Cloud droplets to drizzle: Contribution of transition drops to microphysical and optical properties of marine stratocumulus clouds, Geophys. Res. Lett., 44, 8002–8010, https://doi.org/10.1002/2017GL074430, 2017. a, b
Görsdorf, U., Lehmann, V., Bauer-Pfundstein, M., Peters, G., Vavriv, D., Vinogradov, V., and Volkov, V.: A 35-GHz polarimetric Doppler radar for long-term observations of cloud parameters – Description of system and data processing, J. Atmos. Ocean. Tech., 32, 675–690, https://doi.org/10.1175/JTECH-D-14-00066.1, 2015. a, b
Haarig, M., Ansmann, A., Gasteiger, J., Kandler, K., Althausen, D., Baars, H., Radenz, M., and Farrell, D. A.: Dry versus wet marine particle optical properties: RH dependence of depolarization ratio, backscatter, and extinction from multiwavelength lidar measurements during SALTRACE, Atmos. Chem. Phys., 17, 14199–14217, https://doi.org/10.5194/acp-17-14199-2017, 2017. a
Heese, B., Flentje, H., Althausen, D., Ansmann, A., and Frey, S.: Ceilometer lidar comparison: backscatter coefficient retrieval and signal-to-noise ratio determination, Atmos. Meas. Tech., 3, 1763–1770, https://doi.org/10.5194/amt-3-1763-2010, 2010. a, b
Hogan, R. J. and O'Connor, E. J.: Facilitating cloud radar and lidar algorithms: the Cloudnet Instrument Synergy/Target Categorization product, Cloudnet documentation, 14, http://www.met.reading.ac.uk/~swrhgnrj/publications/categorization.pdf (last access: 22 January 2025), 2004. a, b, c
Illingworth, A. J., Hogan, R. J., O'Connor, E. J., Bouniol, D., Brooks, M. E., Delanoé, J., Donovan, D. P., Eastment, J. D., Gaussiat, N., Goddard, J. W. F., Haeffelin, M., Baltink, H. K., Krasnov, O. A., Pelon, J., Piriou, J., Protat, A., Russchenberg, H. W. J., Seifert, A., Tompkins, A. M., van Zadelhoff, G., Vinit, F., Willén, U., Wilson, D. R., and Wrench, C. L.: Cloudnet: Continuous evaluation of cloud profiles in seven operational models using ground-based observations, B. Am. Meteorol. Soc., 88, 883–898, https://doi.org/10.1175/BAMS-88-6-883, 2007. a, b, c, d, e
Jansen, F.: Ceilometer Measurements RV Meteor, EUREC4A, medium: NetCDF, ASCII, AERIS Portal [data set], https://doi.org/10.25326/53, 2020. a
Kalesse-Los, H., Röttenbacher, J., Schäfer, M., and Emmanouilidis, A.: Microwave Radiometer Measurements RV Meteor, EUREC4A, medium: NetCDF, AERIS Portal [data set], https://doi.org/10.25326/77, 2020. a
Kalesse-Los, H., Röttenbacher, J., and Schäfer, M.: W-Band Radar Measurements RV Meteor, EUREC4A, medium: NetCDF, Version Number: 1.0, AERIS Portal [data set], https://doi.org/10.25326/164, 2021. a
Kalesse-Los, H., Kötsche, A., Foth, A., Röttenbacher, J., Vogl, T., and Witthuhn, J.: The Virga-Sniffer – a new tool to identify precipitation evaporation using ground-based remote-sensing observations, Atmos. Meas. Tech., 16, 1683–1704, https://doi.org/10.5194/amt-16-1683-2023, 2023. a, b, c, d, e, f, g, h, i, j, k
Klingebiel, M., Ghate, V. P., Naumann, A. K., Ditas, F., Pöhlker, M. L., Pöhlker, C., Kandler, K., Konow, H., and Stevens, B.: Remote sensing of sea salt aerosol below trade wind clouds, J. Atmos. Sci., 76, 1189–1202, https://doi.org/10.1175/JAS-D-18-0139.1, 2019. a, b, c, d, e, f, g, h, i, j, k, l, m, n
Kogan, Y. L., Mechem, D. B., and Choi, K.: Effects of sea-salt aerosols on precipitation in simulations of shallow cumulus, J. Atmos. Sci., 69, 463–483, https://doi.org/10.1175/JAS-D-11-031.1, 2012. a, b
Laj, P., Lund Myhre, C., Riffault, V., Amiridis, V., Fuchs, H., Eleftheriadis, K., Petäjä, T., Salameh, T., Kivekäs, N., Juurola, E., Saponaro, G., Philippin, S., Cornacchia, C., Alados Arboledas, L., Baars, H., Claude, A., De Mazière, M., Dils, B., Dufresne, M., Evangeliou, N., Favez, O., Fiebig, M., Haeffelin, M., Herrmann, H., Höhler, K., Illmann, N., Kreuter, A., Ludewig, E., Marinou, E., Möhler, O., Mona, L., Eder Murberg, L., Nicolae, D., Novelli, A., O'Connor, E., Ohneiser, K., Petracca Altieri, R. M., Picquet-Varrault, B., van Pinxteren, D., Pospichal, B., Putaud, J., Reimann, S., Siomos, N., Stachlewska, I., Tillmann, R., Voudouri, K. A., Wandinger, U., Wiedensohler, A., Apituley, A., Comerón, A., Gysel-Beer, M., Mihalopoulos, N., Nikolova, N., Pietruczuk, A., Sauvage, S., Sciare, J., Skov, H., Svendby, T., Swietlicki, E., Tonev, D., Vaughan, G., Zdimal, V., Baltensperger, U., Doussin, J., Kulmala, M., Pappalardo, G., Sorvari Sundet, S., and Vana, M.: Aerosol, clouds and trace gases research infrastructure (ACTRIS): The European research infrastructure supporting atmospheric science, B. Am. Meteorol. Soc., 105, E1098–E1136, 2024. a
Lamer, K., Kollias, P., and Nuijens, L.: Observations of the variability of shallow trade wind cumulus cloudiness and mass flux, J. Geophys. Res.-Atmos., 120, 6161–6178, https://doi.org/10.1002/2014JD022950, 2015. a, b
Langhans, W. and Romps, D. M.: The origin of water vapor rings in tropical oceanic cold pools, Geophys. Res. Lett., 42, 7825–7834, 2015. a
Lewis, E. R. and Schwartz, S. E.: Sea salt aerosol production: mechanisms, methods, measurements, and models, vol. 152, American geophysical union, ISBN 978-0-875-90417-7, 2004. a, b, c, d
Lonitz, K.: Susceptibility of trade wind cumulus clouds to precipitation, PhD thesis, University Hamburg, FB Geowiss., https://katalogplus.sub.uni-hamburg.de/vufind/Record/827593740 (last access: 25 March 2024), 2014. a
Medeiros, B., Stevens, B., and Bony, S.: Using aquaplanets to understand the robust responses of comprehensive climate models to forcing, Clim. Dynam., 44, 1957–1977, https://doi.org/10.1007/s00382-014-2138-0, 2015. a
Nuijens, L., Stevens, B., and Siebesma, A. P.: The environment of precipitating shallow cumulus convection, J. Atmos. Sci., 66, 1962–1979, https://doi.org/10.1175/2008JAS2841.1, 2009. a, b
Nuijens, L., Serikov, I., Hirsch, L., Lonitz, K., and Stevens, B.: The distribution and variability of low-level cloud in the North Atlantic trades, Q. J. Roy. Meteor. Soc., 140, 2364–2374, https://doi.org/10.1002/qj.2307, 2014. a, b, c, d, e, f, g, h, i, j, k
Nuijens, L., Medeiros, B., Sandu, I., and Ahlgrimm, M.: The behavior of trade-wind cloudiness in observations and models: The major cloud components and their variability, J. Adv. Model. Earth Sys., 7, 600–616, https://doi.org/10.1002/2014MS000390, 2015a. a, b, c
Nuijens, L., Medeiros, B., Sandu, I., and Ahlgrimm, M.: Observed and modeled patterns of covariability between low-level cloudiness and the structure of the trade-wind layer, J. Adv. Model. Earth Sys., 7, 1741–1764, 2015b. a
O'Connor, E. J., Hogan, R. J., and Illingworth, A. J.: Retrieving stratocumulus drizzle parameters using Doppler radar and lidar, J. Appl. Meteorol., 44, 14–27, https://doi.org/10.1175/JAM-2181.1, 2005. a, b
Peters, G., Fischer, B., Münster, H., Clemens, M., and Wagner, A.: Profiles of raindrop size distributions as retrieved by microrain radars, J. Appl. Meteorol., 44, 1930–1949, https://doi.org/10.1175/JAM2316.1, 2005. a, b
Roschke, J.: Cloudnet haze echoes (v1.0.1), version 1.0.1, Zenodo [code], https://doi.org/10.5281/zenodo.10469906, 2024a. a
Roschke, J.: Cloud classification (v1.0.1), version 1.0.1, Zenodo [code], https://doi.org/10.5281/zenodo.10471932, 2024b. a
Roschke, J., Witthuhn, J., Klingebiel, M., Haarig, M., Foth, A., Kötsche, A., and Kalesse-Los, H.: Virga-Sniffer configuration for the Barbados Cloud Observatory, Zenodo [data set], https://doi.org/10.5281/zenodo.14257243, 2024. a, b, c, d, e, f
Rose, T., Crewell, S., Löhnert, U., and Simmer, C.: A network suitable microwave radiometer for operational monitoring of the cloudy atmosphere, Atmos. Res., 75, 183–200, https://doi.org/10.1016/j.atmosres.2004.12.005, 2005. a
Schulz, H., Eastman, R., and Stevens, B.: Characterization and Evolution of Organized Shallow Convection in the trades, J. Geophys. Res.-Atmos., 126, e2021JD034575, https://doi.org/10.1029/2021JD034575, 2021. a, b, c
Stevens, B., Farrell, D., Hirsch, L., Jansen, F., Nuijens, L., Serikov, I., Brügmann, B., Forde, M., Linne, H., Lonitz, K., and Prospero, J. M.: The Barbados Cloud Observatory: Anchoring investigations of clouds and circulation on the edge of the ITCZ, B. Am. Meteorol. Soc., 97, 787–801, https://doi.org/10.1175/BAMS-D-14-00247.1, 2016. a, b, c, d, e, f
Stevens, B., Bony, S., Farrell, D., Ament, F., Blyth, A., Fairall, C., Karstensen, J., Quinn, P. K., Speich, S., Acquistapace, C., Aemisegger, F., Albright, A. L., Bellenger, H., Bodenschatz, E., Caesar, K.-A., Chewitt-Lucas, R., de Boer, G., Delanoë, J., Denby, L., Ewald, F., Fildier, B., Forde, M., George, G., Gross, S., Hagen, M., Hausold, A., Heywood, K. J., Hirsch, L., Jacob, M., Jansen, F., Kinne, S., Klocke, D., Kölling, T., Konow, H., Lothon, M., Mohr, W., Naumann, A. K., Nuijens, L., Olivier, L., Pincus, R., Pöhlker, M., Reverdin, G., Roberts, G., Schnitt, S., Schulz, H., Siebesma, A. P., Stephan, C. C., Sullivan, P., Touzé-Peiffer, L., Vial, J., Vogel, R., Zuidema, P., Alexander, N., Alves, L., Arixi, S., Asmath, H., Bagheri, G., Baier, K., Bailey, A., Baranowski, D., Baron, A., Barrau, S., Barrett, P. A., Batier, F., Behrendt, A., Bendinger, A., Beucher, F., Bigorre, S., Blades, E., Blossey, P., Bock, O., Böing, S., Bosser, P., Bourras, D., Bouruet-Aubertot, P., Bower, K., Branellec, P., Branger, H., Brennek, M., Brewer, A., Brilouet , P.-E., Brügmann, B., Buehler, S. A., Burke, E., Burton, R., Calmer, R., Canonici, J.-C., Carton, X., Cato Jr., G., Charles, J. A., Chazette, P., Chen, Y., Chilinski, M. T., Choularton, T., Chuang, P., Clarke, S., Coe, H., Cornet, C., Coutris, P., Couvreux, F., Crewell, S., Cronin, T., Cui, Z., Cuypers, Y., Daley, A., Damerell, G. M., Dauhut, T., Deneke, H., Desbios, J.-P., Dörner, S., Donner, S., Douet, V., Drushka, K., Dütsch, M., Ehrlich, A., Emanuel, K., Emmanouilidis, A., Etienne, J.-C., Etienne-Leblanc, S., Faure, G., Feingold, G., Ferrero, L., Fix, A., Flamant, C., Flatau, P. J., Foltz, G. R., Forster, L., Furtuna, I., Gadian, A., Galewsky, J., Gallagher, M., Gallimore, P., Gaston, C., Gentemann, C., Geyskens, N., Giez, A., Gollop, J., Gouirand, I., Gourbeyre, C., de Graaf, D., de Groot, G. E., Grosz, R., Güttler, J., Gutleben, M., Hall, K., Harris, G., Helfer, K. C., Henze, D., Herbert, C., Holanda, B., Ibanez-Landeta, A., Intrieri, J., Iyer, S., Julien, F., Kalesse, H., Kazil, J., Kellman, A., Kidane, A. T., Kirchner, U., Klingebiel, M., Körner, M., Kremper, L. A., Kretzschmar, J., Krüger, O., Kumala, W., Kurz, A., L'Hégaret, P., Labaste, M., Lachlan-Cope, T., Laing, A., Landschützer, P., Lang, T., Lange, D., Lange, I., Laplace, C., Lavik, G., Laxenaire, R., Le Bihan, C., Leandro, M., Lefevre, N., Lena, M., Lenschow, D., Li, Q., Lloyd, G., Los, S., Losi, N., Lovell, O., Luneau, C., Makuch, P., Malinowski, S., Manta, G., Marinou, E., Marsden, N., Masson, S., Maury, N., Mayer, B., Mayers-Als, M., Mazel, C., McGeary, W., McWilliams, J. C., Mech, M., Mehlmann, M., Meroni, A. N., Mieslinger, T., Minikin, A., Minnett, P., Möller, G., Morfa Avalos, Y., Muller, C., Musat, I., Napoli, A., Neuberger, A., Noisel, C., Noone, D., Nordsiek, F., Nowak, J. L., Oswald, L., Parker, D. J., Peck, C., Person, R., Philippi, M., Plueddemann, A., Pöhlker, C., Pörtge, V., Pöschl, U., Pologne, L., Posyniak, M., Prange, M., Quiñones Meléndez, E., Radtke, J., Ramage, K., Reimann, J., Renault, L., Reus, K., Reyes, A., Ribbe, J., Ringel, M., Ritschel, M., Rocha, C. B., Rochetin, N., Röttenbacher, J., Rollo, C., Royer, H., Sadoulet, P., Saffin, L., Sandiford, S., Sandu, I., Schäfer, M., Schemann, V., Schirmacher, I., Schlenczek, O., Schmidt, J., Schröder, M., Schwarzenboeck, A., Sealy, A., Senff, C. J., Serikov, I., Shohan, S., Siddle, E., Smirnov, A., Späth, F., Spooner, B., Stolla, M. K., Szkółka, W., de Szoeke, S. P., Tarot, S., Tetoni, E., Thompson, E., Thomson, J., Tomassini, L., Totems, J., Ubele, A. A., Villiger, L., von Arx, J., Wagner, T., Walther, A., Webber, B., Wendisch, M., Whitehall, S., Wiltshire, A., Wing, A. A., Wirth, M., Wiskandt, J., Wolf, K., Worbes, L., Wright, E., Wulfmeyer, V., Young, S., Zhang, C., Zhang, D., Ziemen, F., Zinner, T., and Zöger, M.: EUREC4A, Earth Syst. Sci. Data, 13, 4067–4119, https://doi.org/10.5194/essd-13-4067-2021, 2021. a
Tukiainen, S., O'connor, E., and Korpinen, A.: CloudnetPy: A Python package for processing cloud remote sensing data, Journal of Open Source Software, 5, 2123, https://doi.org/10.21105/joss.02123, 2020. a, b
Tukiainen, S., O'Connor, E., and Anniina, K.: CloudnetPy (v1.43.0), Zenodo [code], https://doi.org/10.5281/zenodo.7432587, 2022. a
Tuononen, M., O'Connor, E. J., and Sinclair, V. A.: Evaluating solar radiation forecast uncertainty, Atmos. Chem. Phys., 19, 1985–2000, https://doi.org/10.5194/acp-19-1985-2019, 2019. a, b, c
van der Velden, E.: CMasher: Scientific colormaps for making accessible, informative and “cmashing” plots, Journal of Open Source Software, 5, 2004, https://doi.org/10.21105/joss.02004, 2020. a
Van der Walt, S., Schönberger, J. L., Nunez-Iglesias, J., Boulogne, F., Warner, J. D., Yager, N., Gouillart, E., and Yu, T.: scikit-image: image processing in Python, PeerJ, 2, e453, https://doi.org/10.7717/peerj.453, 2014. a, b
Virtanen, P., Gommers, R., Oliphant, T. E., Haberland, M., Reddy, T., Cournapeau, D., Burovski, E., Peterson, P., Weckesser, W., Bright, J., van der Walt, S. J., Brett, M., Wilson, J., Millman, K. J., Mayorov, N., Nelson, A. R. J., Jones, E., Kern, R., Larson, E., Carey, C. J., Polat, İ., Feng, Y., Moore, E. W., VanderPlas, J., Laxalde, D., Perktold, J., Cimrman, R., Henriksen, I., Quintero, E. A., Harris, C. R., Archibald, A. M., Ribeiro, A. H., Pedregosa, F., van Mulbregt, P., and SciPy 1.0 Contributors: SciPy 1.0: fundamental algorithms for scientific computing in Python, Nat. Methods, 17, 261–272, https://doi.org/10.1038/s41592-019-0686-2, 2020. a
Vogel, R., Konow, H., Schulz, H., and Zuidema, P.: A climatology of trade-wind cumulus cold pools and their link to mesoscale cloud organization, Atmos. Chem. Phys., 21, 16609–16630, https://doi.org/10.5194/acp-21-16609-2021, 2021. a
Wallace, J. M. and Hobbs, P. V.: Atmospheric science: an introductory survey, Elsevier, vol. 92, https://doi.org/10.1016/C2009-0-00034-8, 2006. a
Woodcock, A. H.: Salt nuclei in marine air as a function of altitude and wind force, J. Atmos. Sci., 10, 362–371, https://doi.org/10.1175/1520-0469(1953)010<0366:SNIMAA>2.0.CO;2, 1953. a
Wu, P., Dong, X., Xi, B., Liu, Y., Thieman, M., and Minnis, P.: Effects of environment forcing on marine boundary layer cloud-drizzle processes, J. Geophys. Res.-Atmos., 122, 4463–4478, https://doi.org/10.1002/2016JD026326, 2017. a