the Creative Commons Attribution 4.0 License.
the Creative Commons Attribution 4.0 License.
 | 06 Oct 2025
Characterization of the newly designed wall-free particle evaporator (WALL-E) for online measurements of atmospheric particles
Linyu Gao
Imad Zgheib
Evangelos Stergiou
Cecilie Carstens
Félix Sari Doré
Michel Dupanloup
Frederic Bourgain
Sébastien Perrier
Matthieu Riva
Organic aerosols (OAs) play a critical role in the atmosphere by directly altering human health and the climate. Understanding the formation and evolution of OAs as well as their physicochemical properties requires a detailed characterization of their chemical composition. Despite advanced analytical techniques developed within the last decades, the real-time online measurement of atmospheric particles remains challenging and is affected by different artifacts (i.e., thermal decomposition, fragmentation, wall loss). In this work, we introduce the newly designed wall-free particle evaporator (WALL-E) coupled with a chemical ionization mass spectrometer (CIMS), using bromide (Br−) as the reagent ion. We comprehensively evaluate the performance of the WALL-E system, demonstrating its ability to evaporate particles while maintaining the integrity of the compounds composing the particles (i.e., minimal thermal decomposition). To demonstrate WALL-E's performance, the composition of aerosol particles formed from α-pinene ozonolysis in the presence of SO2 is characterized. In addition, by applying the scan declustering method, we can now provide a quantification of the different species present in the condensed phase, e.g., C10H16O4 84 ng m−3, C19H28O7 7 ng m−3 for a total secondary organic aerosol (SOA) mass of 1 µg m−3. While dimers exhibit higher sensitivities, they account for only 14 %–18 % of the total particle mass, which is considerably lower than their signal fractions (23 %–29 %). This suggests a potential overestimation of the dimer contributions when relying solely on signal fractions. In addition, a volatility analysis using thermograms reveals a clear relationship between T50 and compound saturation vapor pressure (C∗), with lower-volatility species desorbing at higher temperatures. In addition, the measured T50 (the temperature at which 50 % of a compound evaporates) for α-pinene-derived SOA products agree well with theoretical volatility estimation models (e.g., SIMPOL). Overall, this study demonstrates that the WALL-E system coupled with a CIMS is a promising technique for real-time particle characterization (i.e., composition, quantification, and volatility) of atmospheric aerosols.
- Article
(4194 KB) - Full-text XML
-
Supplement
(1979 KB) - BibTeX
- EndNote


Atmospheric organic aerosol (OA) particles play a critical role in the Earth's climate system and atmospheric processes by affecting radiative forcing, cloud formation and albedo, atmospheric chemistry, environmental sustainability, and human health (Fehsenfeld et al., 1992; Laothawornkitkul et al., 2009; Mellouki et al., 2015; Charnawskas et al., 2017). A large fraction (20 %–90 %) of fine particles are comprised of OAs (Kanakidou et al., 2005), which are estimated to have a global source of 150 Tg yr−1 (Pai et al., 2020). In the atmosphere, OAs are either directly emitted as particles from, e.g., volcanic eruptions and biomass burning, or formed through gas-to-particle conversion from the oxidation of volatile organic compounds (VOCs). Due to the complex mixture of diverse organic compounds in OA particles, the characterization of their chemical composition remains challenging, notably at a high time resolution. Such characterization is crucial for understanding particles' formation, growth, and aging, as well as their physicochemical properties in the atmosphere. Therefore, improving the online detection techniques for OA particles is essential.
Currently, online mass spectrometry (MS), such as the chemical ionization mass spectrometer (CIMS), is one of the key technologies for measuring gaseous oxygenated organic species. It takes advantage of tracking the evolution of compounds during their formation and phase partitioning. To retrieve particle-phase composition with a mass spectrometer, condensed molecules must be converted to gaseous analytes before being ionized. The key point for getting qualitative real-time particle composition information is the design of the inlet in front of the MS. The current technologies to achieve this conversion can be broadly classified into two categories: those requiring the pre-collection of particles and those that do not. A thermal desorption chemical ionization mass spectrometer (TD-CIMS) (Voisin et al., 2003; Smith et al., 2004; Li et al., 2021) uses a metal filament in an electrostatic precipitator to collect pre-charged aerosol particles and thereafter thermally evaporate them by pulsing a known current on the filament. This approach requires both particle deposition and subsequent evaporation. Another instrument involving particle collection is the filter inlet for gases and aerosols (FIGAERO), developed by Lopez-Hilfiker et al. (2014). The FIGAERO inlet collects particles onto a PTFE filter and desorbs them using a heated N2 flow. This approach enables the control of particle evaporation in a pre-set temperature-ramping program, making it an efficient technique to obtain particle volatility information (Stark et al., 2017; Bannan et al., 2019; Tikkanen et al., 2020; Thornton et al., 2020) while reaching very low detection limits (Lopez-Hilfiker et al., 2014; Thornton et al., 2020). However, since the collection and evaporation of aerosol particles take several tens of minutes, the time resolution of particle measurements remains low, especially in places with low particle loading, resulting in semi-online measurements. Because of particle collection, FIGAERO is also not free of interference from organic mixtures, especially with high concentrations of aerosol particles (Bannan et al., 2019), which may affect the retrieved volatility of single components. Finally, it has been shown that, during evaporation, chemical processes can occur, altering the chemical composition and the information retrieved (Stark et al., 2017; Schobesberger et al., 2018; Buchholz et al., 2020).
In contrast, there are inlets without the need to pre-concentrate particles. An inlet designed for the chemical analysis of aerosols online (CHARON) has been developed without the need to collect particles (Eichler et al., 2015). This consists of a carbon strip denuder for gas-phase compound removal, an aerodynamic lens for particle collimation, and a thermal desorption unit for particle evaporation. The evaporated compounds can be analyzed with a downstream low-pressure MS. However, due to the strong electric field in the ion drift tube, the protonation-induced ionic fragmentation of oxygenated organic compounds biases the real distribution of particle-phase chemical composition (Müller et al., 2017; Li et al., 2022; Peng et al., 2023). Another technique, using an atmospheric pressure chemical ionization (APCI) Orbitrap mass spectrometer, evaporates aerosol particles in a heated ceramic tube where thermal decomposition compounds can be observed (Vogel et al., 2016; Zuth et al., 2018). Finally, the most recently developed vaporization inlet for aerosols (VIA) coupled with an NO3-CIMS (VIA-NO3-CIMS) allows the continuous thermal desorption and online detection of highly oxidized particle-phase molecules without pre-concentration (Häkkinen et al., 2023), which mainly consists of sulfinert-coated stainless steel as a TD unit and a cold dilution flow unit. The evaporation tube of VIA is bonded with a silica layer inserted into the surface; a dilution flow is used to cool down the sampling flow and to minimize the recondensation of the evaporated compounds. The parameters of the dilution unit are critical factors that affect the final sensitivity of the entire system. While this new coupling allows the identification of highly oxygenated organic molecules (HOMs) at atmospherically relevant particle concentrations, the design of the VIA yields subsequent thermal fragmentation when the analytes interact with the heated walls of the TD unit (Zhao et al., 2023, 2024b). Currently, there is no technique based on thermal evaporation able to prevent thermal fragmentation and suitable for the online measurement of moderately oxygenated (e.g., molecular oxygen atoms <6) organic species.
To prevent thermal fragmentation, the extractive electrospray ionization time-of-flight mass spectrometer (EESI-TOF-MS) (Lopez-Hilfiker et al., 2019) was developed as an online method for particle analysis without the need for thermal desorption. In EESI-TOF-MS, sampled particles collide with charged electrospray droplets, and the soluble compounds are extracted and ionized through adduct formation. However, the quantification of molecules remains challenging due to the uncertainties in the dependence of instrument sensitivity on molecular identity (Lopez-Hilfiker et al., 2019; Wang et al., 2021). This method also exhibits important background interference due to the low selectivity of the reagent ions (e.g., Na+), making the identification and quantification of the compounds of interest challenging (Lee et al., 2020; Bell et al., 2023). Additionally, for highly oxygenated and multifunctional compounds, volatility determination remains particularly uncertain, as isomerism and intermolecular interactions can significantly influence evaporation behavior (Lee et al., 2014; Bannan et al., 2019).
In this work, we created a newly designed wall-free particle evaporator (WALL-E) to evaporate organic particles online while preventing ionization-induced fragmentation and minimizing thermal decomposition effects. WALL-E is coupled with a chemical ionization inlet attached to a CIMS in order to achieve real-time measurements of aerosol particles at the molecular level. An extensive characterization of the WALL-E system is presented here, where its performance is tested as a function of various parameters, e.g., flow rates and evaporation temperatures. The sensitivity of WALL-E coupled with an atmospheric pressure CIMS is determined, and the system is used to quantitatively retrieve the composition of particle-phase oxygenated molecules generated from the O3/OH-initiated oxidation of α-pinene in an aerosol flow tube reactor. Finally, by scanning the WALL-E temperature, volatility information can be extracted that can be inferred from the measured thermograms. Polyethylene glycol (PEG) is used to evaluate the volatility measurements and compare our results to the existing techniques.
2.1 WALL-E setup and simulations
The WALL-E system is designed to thermally desorb aerosol particles while minimizing the analyte–wall interactions with the system, thus limiting fragmentation (Fig. 1). The system enables the real-time mass spectrometric analysis of aerosol particles by integrating a series of carefully designed components, including a gas-phase denuder, a thermal desorber (TD) unit equipped with a sheath flow, a ceramic spacer for thermal isolation, and a dilution or cooling unit. Each component is optimized to enhance sample stability and compatibility with different types of CIMS.
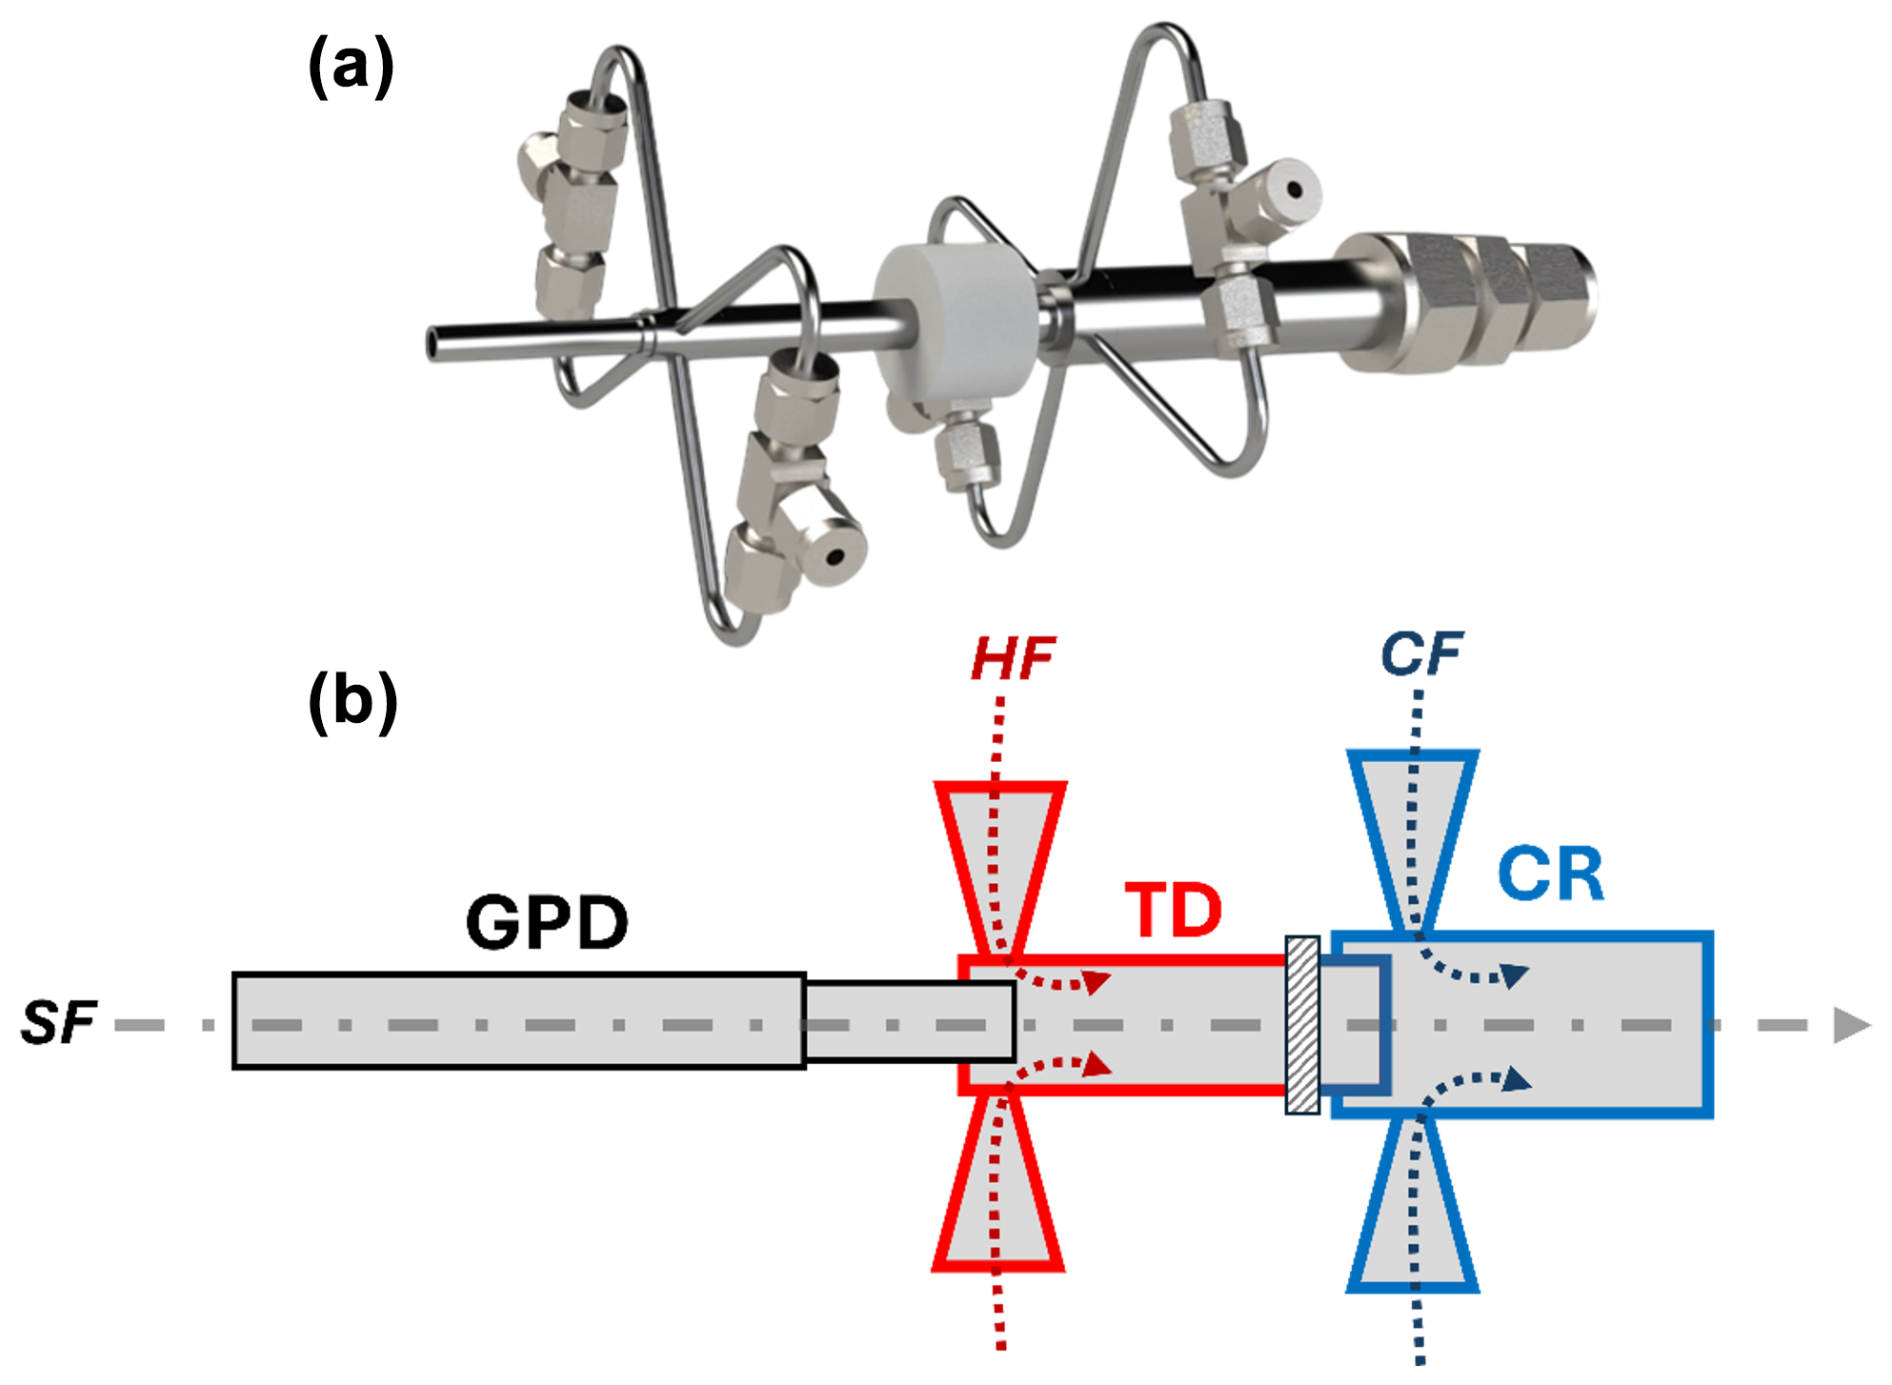
Figure 1(a) Design of the WALL-E interface of the European Research Council. (b) Schematic of WALL-E with a gas-phase denuder (GPD) connected to the inlet. The thermal desorption (TD) region is shown in red, where the hot flow (HF) is mixed with the sample flow (SF). A ceramic spacer is indicated by the dashed rectangle, between the TD and the cooling region (CR). The CR, shown in blue, is where the cooling flow (CF) is introduced.
2.1.1 Gas-phase denuder
Like the EESI or the VIA design, the gas-phase denuder (GPD) is the first stage of the WALL-E system (Fig. 1b), designed to selectively remove VOCs and other inorganic gaseous species (e.g., nitric acid) while allowing aerosol particles to pass through with minimal losses (transmission efficiency >90 %). This denuder consists of a 10 mm outer diameter; a 6 mm inner diameter; and a stainless steel tube lined with an activated charcoal honeycomb structure, which provides a high surface area for adsorption. Maintaining the laminar flow is critical for the denuder's efficiency. With a sample flow rate of 1 slpm (standard liters per minute), the flow remains laminar, with a Reynolds number of 239, ensuring optimal gas-phase diffusion to the adsorbent walls.
2.1.2 Core vaporization unit
The TD is the core of WALL-E (Fig. 1b), where aerosol particles are converted into gas-phase species through flash evaporation. It comprises a 4 cm stainless steel tube heated to up to 390 °C. As the sample flow enters the TD region, it merges with a hot nitrogen (N2, up to 390 °C) HF (Fig. 1b), introduced upstream at a flow rate ranging from 0 to 1 slpm. All heated regions are insulated to minimize heat exchange with the ambient environment. The hot sheath-flow serves multiple purposes: it maintains a laminar flow by preventing turbulence due to T differences in the sampling flow with the walls of the TD, and it protects the evaporated analytes from the heated walls. Hence, the TD's design prioritizes minimal wall interactions to reduce the potential fragmentation of the products while ensuring that particle evaporation occurs within a well-defined thermal environment. The stainless steel tube provides consistent heat transfer along its length, creating a stable thermal zone for the analytes. A limitation of the current design is the use of uncoated stainless steel, which can lead to adsorption or memory effects for more volatile compounds. Inert coatings will be considered in future iterations to further minimize wall interactions. The combination of the heated tube and the hot sheath-flow allows the aerosol particles to rapidly reach the target temperature, significantly reducing the residence time required for complete desorption. This rapid temperature ramp is essential for achieving flash evaporation, where particles are quickly vaporized without prolonged exposure to high temperatures that could lead to thermal decomposition. At a sample flow rate of 1 slpm, the residence time in the TD is estimated to be between 70 and 90 ms, depending on the added hot dilution flow (0 to 0.5 slpm).
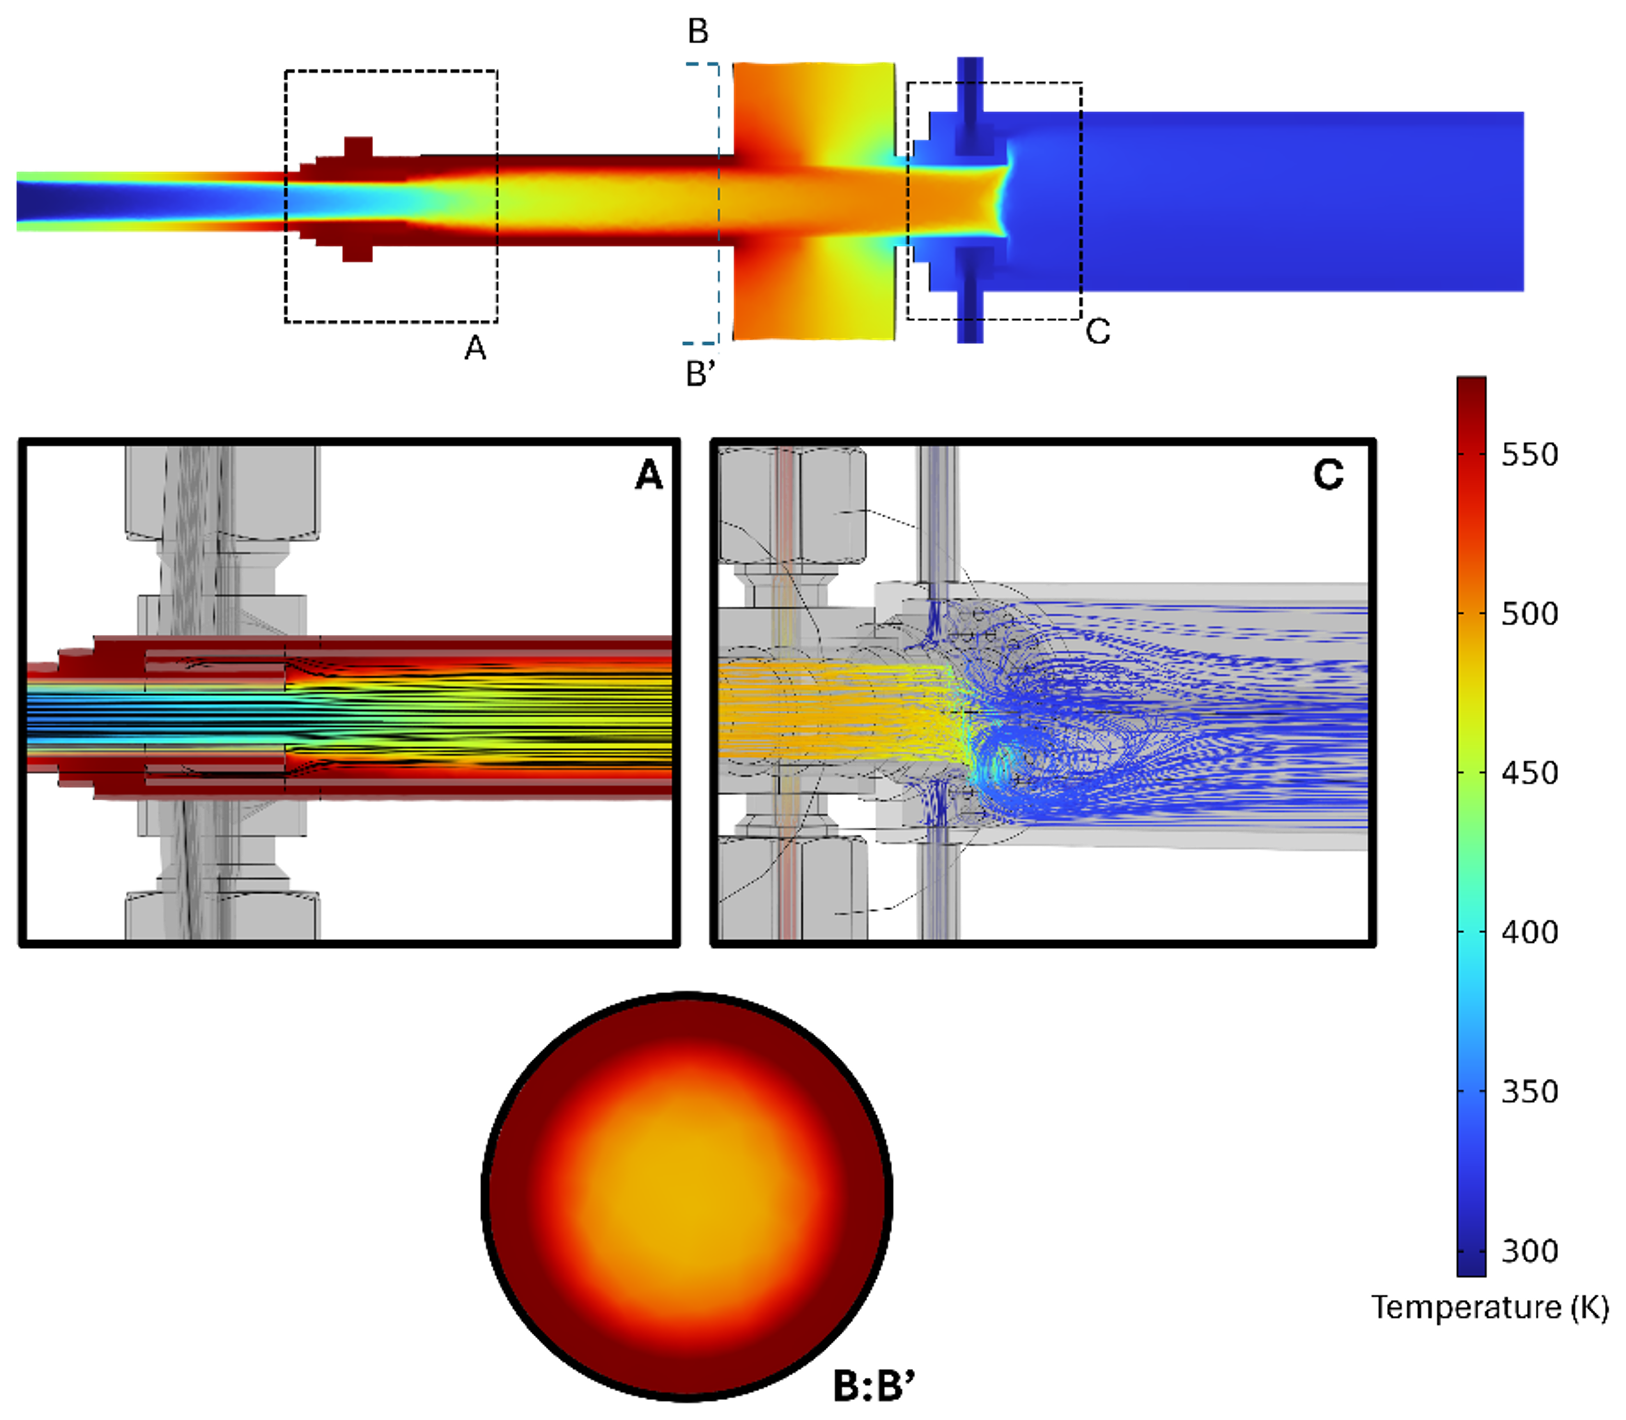
Figure 2Composite simulation results of the WALL-E system. A: temperature profile in the TD region, showing efficient heat transfer and controlled mixing as well as the laminar flow profile. B:B': radial temperature distribution at the TD exit, showing uniform heating across most of the sample flow. C: short region of turbulence which allows the mixing of the heated sample flow with the cooling dilution flow.
Numerical simulations using COMSOL Multiphysics® are used to evaluate and refine the flow and temperature dynamics within the system, employing models for turbulent flow, compressible flow, heat transfer, and chemical transport. These simulations show the system's ability to maintain laminar flow conditions across all units, which is essential to achieving uniform heating and consistent particle transport. Experimental validation is performed in conjunction with these simulations, offering valuable insights into both the operational efficiency and areas for future optimization. The numerical simulations indicate the presence of uniform heating along the tube length, with thermal stabilization achieved within the first centimeter (Fig. 2, section A). These simulations highlight a well-defined temperature gradient that optimizes the desorption processes by ensuring a uniform thermal environment throughout the TD. The combination of controlled flow rates, precise heating, and minimized wall interactions results in efficient aerosol evaporation with minimal fragmentation (Fig. 2).
2.1.3 Dilution or cooling unit
After the flash evaporation, a dilution or cooling flow (CF) is used by introducing nitrogen (room temperature) via the second dilution or cooling region (CR) to prevent the re-condensation of vaporized species (Fig. 1b). This dilution unit is also a critical step to reduce turbulence caused by temperature gradients between the TD and the downstream regions, as previously observed with the VIA-CIMS system (Zhao et al., 2024b). A ceramic spacer is positioned between the TD and the cooling unit to ensure thermal isolation (Fig. 1b). This spacer, made from alumina ceramic Al2O3 with low thermal conductivity, minimizes heat transfer between the heated TD and the cooled sample stream, maintaining distinct thermal zones, as depicted in Fig. 2. Simulations confirm the effectiveness of the ceramic spacer in preserving thermal gradients, greatly reducing unwanted heat transfer into the cooling unit. To further optimize the cooling unit, two fans are mounted right after the second dilution region to ensure that the sample reaches room temperature while preventing turbulence within the CI inlet. This separation is critical in ensuring the stability of the sample as it progresses toward the CI inlet operated at atmospheric pressure. As indicated in Fig. 2, section C, the cooling seems to be achieved within the first centimeter while minimizing turbulence along the tube.
2.2 Experiments
2.2.1 Characterization of the optimal WALL-E-setting parameters
To determine the optimum WALL-E parameters (sampling flow rate, hot sheath-flow/temperature, and TD temperature), particles are generated using an atomizer (model 3076, TSI Inc., Minnesota, USA) with an aqueous solution of citric acid (Sigma-Aldrich; ≥99.5 %), d-(+)-glucose (Alfa Aesar; ≥99 %), malonic acid (Sigma-Aldrich; 99 %), phthalic acid (Sigma-Aldrich, ≥99.5 %), and ammonium sulfate (Sigma-Aldrich; ≥99 %). The concentration of each chemical in the aqueous solution is 1 ppm. Aerosol particles are dried using a silica gel dryer, after which the sampling line is divided to provide an aerosol flow to a scanning mobility particle sizer (SMPS; TSI Inc.) and to the WALL-E CIMS. The setup is illustrated in Fig. S1 in the Supplement, and all parameters tested are summarized in Table S1 in the Supplement.
2.2.2 Sensitivity determination
The sensitivity of individual compounds is directly proportional to their clustering strength with the reagent ions (Iyer et al., 2016; Bi et al., 2021), which can be probed by performing a declustering scanning procedure (Lopez-Hilfiker et al., 2016). Using the setup shown in Fig. S1, single-component aerosol particles are generated using an atomizer containing single-component aqueous solutions of the following compounds: 1,5-dihydroxynaphthalene (Sigma-Aldrich; ≥ 97 %), 3,4,5-trihydroxybenzaldehyde (Sigma-Aldrich; ≥ 98 %), 4-hydroxyphenylacetic acid (Sigma-Aldrich; ≥ 98 %), ammonium sulfate (Sigma-Aldrich; ≥ 99 %), citric acid (Sigma-Aldrich; ≥ 99.5 %), d-(+)-glucose (Thermo Scientific Chemicals; ≥ 99 %), d-mannitol (Sigma-Aldrich; ≥ 98 %), phthalic acid (Sigma-Aldrich; ≥ 99.5 %), phthalic acid d4 (Sigma-Aldrich; ≥ 98 %), and shikimic acid (Alfa Aesar; ≥ 98 %). The sensitivity, reported in Table S2, for each type of particle is determined by the linear regression of the mass concentration measured by the SMPS and the normalized signal intensity of the analyte clustered with Br− (i.e., [M-Br−]), detected by the WALL-E CIMS (Fig. S2). To further assess the correlation between the sensitivity and the binding energy of the detected ion adducts, voltage scanning (i.e., increasing the voltage difference between two ion optics) is performed to determine the half-signal maximum intensity (Lopez-Hilfiker et al., 2016; Riva et al., 2020) for the generated single-component aerosol particles.
2.2.3 SOA particle generation
To further examine the performance of the WALL-E system, secondary organic aerosol (SOA) is generated in an 18 L Pyrex glass aerosol flow tube reactor (12 cm i.d. ×158 cm length) from the O3/OH-initiated oxidation of α-pinene in the presence of SO2 at room temperature and atmospheric pressure (Stein and Scott, 1994). Ozone (O3) is stably generated by passing a flow of 0.6 slpm of synthetic air after exposure to a UV lamp (ozone generator model 610, Jelight Company, Inc., Irvine, USA). SO2 is injected from a commercial cylinder (500 ppm, Air Products Inc., Belgium) to promote the particle formation and to generate more SOA mass. α-Pinene was introduced from a pressurized cylinder (40 ppm in nitrogen). O3, SO2, and α-pinene are continuously injected into the aerosol flow tube reactor to generate a total aerosol mass ranging from 1.0 to 15.6 µg m−3. The concentrations of reactants are summarized in Table S3. A mixture of nitrogen and oxygen (total flow of 4 slpm) is used as a carrier gas, providing a reaction time of ∼4.5 min. Before injecting α-pinene, background measurements are obtained.
2.2.4 Thermograms and Tmax determination
The volatility distribution of aerosol particles is investigated using thermograms obtained with the WALL-E system. Polyethylene glycol (PEG-400) aerosols are produced by atomizing aqueous solutions, as performed in previous studies (Ylisirniö et al., 2021; Zhao et al., 2024b), and sampled by the WALL-E system. The temperature of the WALL-E TD is gradually increased from 30 to 390 °C in 30 °C increments every 10 min. The PEG standards, ranging from PEG-6 to PEG-17, have been chosen to represent a wide range of molecular weights and volatilities (Krieger et al., 2018).
2.3 Instrumentation
Within these experiments, WALL-E is associated with an atmospheric pressure CI inlet (Riva et al., 2019a, 2020) coupled with an Orbitrap (Q Exactive, Thermo Fisher Scientific, Massachusetts, USA), utilizing bromide ions (Br−) as the reagent ion. Br− is generated from dibromomethane (Sigma-Aldrich; 99 %) continuously flushed by 2 standard cubic centimeters per minute (sccm) of pure N2 and subsequently ionized with a soft X-ray photo ionizer (Hamamatsu, L9491). The sheath and the total flows are 24 and 33.5 slpm, respectively. The Orbitrap is operated with an automatic gain control (AGC) target of 1×10⁶ charges, an S-lens radio frequency level of 50, a maximum injection time of 1000 ms, 10 microscans, and a capillary temperature set to 150 °C. The mass resolution is 140 000 (at 200). Orbitool 2.2.4 (Cai et al., 2021) is used for analyzing the data. The data are pre-averaged to 1 min. Signals are background subtracted and normalized by the signal intensity of Br− ( 79). To obtain an accurate concentration of compounds present in low abundance, a linearity correction (Riva et al., 2020) is applied to all measured signals (Fig. S3). All product ions are normalized to the Br− signals.
The mass concentration of particles is retrieved using a scanning mobility particle sizer (SMPS) utilizing a differential mobility analyzer (DMA; 3081, TSI Inc.) connected to a CPC (3772, TSI Inc.) by applying an assumed particle density (1.45 g cm−3) (Kim et al., 2010; Shilling et al., 2009) for aerosol particles generated from the O3/OH-initiated oxidation of α-pinene in the presence of SO2. An impactor (0.071 m) is used, and the sampling flow rate is 1 slpm with a sheath flow of 10 slpm.
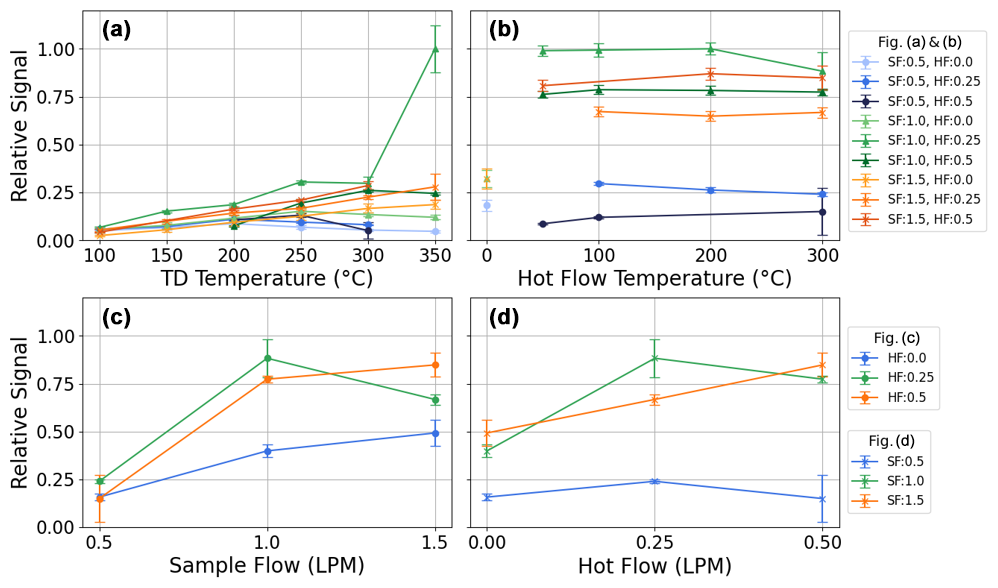
Figure 3(a) Relative signal at a fixed hot flow (HF) temperature of 300 °C versus TD temperature for various combinations of sample flow (SF) rate and HF. (b) Relative signal at a fixed TD temperature of 300 °C versus HF temperature. (c) Relative signal versus SF at different HF settings. (d) Relative signal versus HF at different SF values. Both (c) and (d) are at a fixed TD and HF temperature of 300 °C. SF is the sample flow rate delivered to the TD, while HF is the heated dilution flow added upstream of the ambient dilution stage. The second ambient dilution flow and the downstream cooling flow remain fixed to minimize turbulence in the CIMS. Error bars represent standard deviations based on repeated measurements at the same conditions, and all values are corrected for their respective dilution factors.
3.1 Optimal setting parameters of WALL-E
As described in Sect. 2.1, WALL-E involves multiple operational parameters, including the sample flow (SF) rate, the hot flow (HF) rate and its temperature upstream of the TD, the dilution flow in the cooling region, and the TD temperature region. The cooling flow is held constant at 10 slpm to minimize turbulence in the CI inlet operated at atmospheric pressure. To determine the optimized parameters, various combinations of SF and HF rates as well as HF and TD temperatures are tested on aerosol particles generated from an atomized water solution containing a mix of standards. All data are corrected for their respective dilution factors. Figure 3 shows the summed signal of all evaporated products (i.e., phthalic acid, citric acid, malonic acid, glucose, sulfuric acid) under these different conditions, normalized to the maximum value.
As depicted in Fig. 3a, it is evident that an SF of 1.0 L min−1 consistently results in higher signals than 0.5 L min−1 across all TD temperatures. An SF of 1.5 L min−1 also performs reasonably well, whereas the 0.5 L min−1 configurations exhibit significantly lower signals. A similar trend is observed in Fig. 3b, where the relative signal is plotted against the HF temperature. The results indicate that efficient evaporation occurs at a TD temperature of around 300–350 °C, while variations in the HF temperature have a less important effect. However, the presence of an HF (either 0.25 or 0.5 L min−1) at an SF of 1 or 1.5 L min−1 enhances evaporation efficiency and flow stability. This influence of flow conditions is more distinctly observed in Fig. 3c and d and further illustrates the impact of SF and HF on the relative signal. Figure 3c presents the relative signal as a function of SF for different HF settings, demonstrating that an SF of 1 L min−1 and an HF of 0.25 L min−1 yield higher signal intensities compared to other conditions. Similarly, Fig. 3d shows the relative signal plotted against HF at different SF values, reinforcing this observation.
A key consideration when selecting optimal SF and HF conditions is to keep fragmentation minimal. Excessive heating in the TD can enhance fragmentation, potentially resulting in the thermal decomposition of the analytes. To assess this, we evaluate the thermal decomposition of citric acid, which is a known analyte to decompose within TD inlets (Yang et al., 2021). As shown in Fig. S4, the thermal fragmentation of citric acid using the conditions (i.e., an SF of 1 L min−1 and an HF of 0.25 L min−1) described above remains negligible, with up to 2 ‰ of the total signal attributed to fragment ions at the hottest temperature (i.e., 390 °C). This confirms the minimal fragmentation while keeping an effective evaporation.
3.2 Characterization of SOA derived from α-pinene ozonolysis
3.2.1 Raw mass spectra
To underline the performance of WALL-E in measuring and quantifying a complex mixture of OAs, the characterization of SOA generated from the oxidation of α-pinene in the presence of SO2 is used as an example. Figures 4 and S5 present the mass spectra of α-pinene-derived SOA, with particle mass concentrations ranging from 1.0 to 15.6 µg m−3. These mass concentrations cover atmospherically relevant ranges observed in remote and rural places (Jimenez et al., 2009), which is achieved when using the optimal setting parameters determined in Sect. 3.1. A total of 146 organic monomers (C1–10HyOzS0) and 206 dimers (C11–20HyOzS0) are identified, respectively contributing 67 %–74 % and 29 %–23 % to the total signal intensity. The dominant ions identified in the monomer region are assigned to C8–10H12–18O3–7 compounds with high-resolution peak fitting in the range of at 249–343 Th, and C17–20H26–34O5–11 compounds in the dimeric range between 405 and 525 Th. Among the monomers, C10H14,16O3–7 are the most abundant ones, followed by C9H14O3–7. The product distribution measured is consistent with previous studies (Zhang et al., 2015; Kahnt et al., 2018; Zhao et al., 2023, 2024a). It should be mentioned that C8H12O4 is the most abundant individual compound, which could be norpinic acid or terpenylic acid identified by previous studies (Zhang et al., 2015; Du et al., 2022; Witkowski et al., 2023). It has an unexpected high background of ∼0.04 normalized counts per second (ncps) when there is no VOC injected. The desorption from the walls of the aerosol flow tube reactor when aerosol particles are produced can explain the presence of C8H12O4, as reported in previous laboratory studies (Riva et al., 2019b; Wong et al., 2022).
Without sensitivity correction, compounds are significantly detected at a total signal of 0.04 ncps when the particle mass is 1.0±0.1 µg m−3. As particle mass concentration increases, the normalized signals of particle-phase products also rise, reaching 0.8 ncps at 15.7±1.2 µg m−3. The detected products exhibit a strong linear response to particle mass concentration, as shown in Fig. S6, illustrating the suitability of the WALL-E system to measuring aerosol particles under atmospherically relevant conditions.
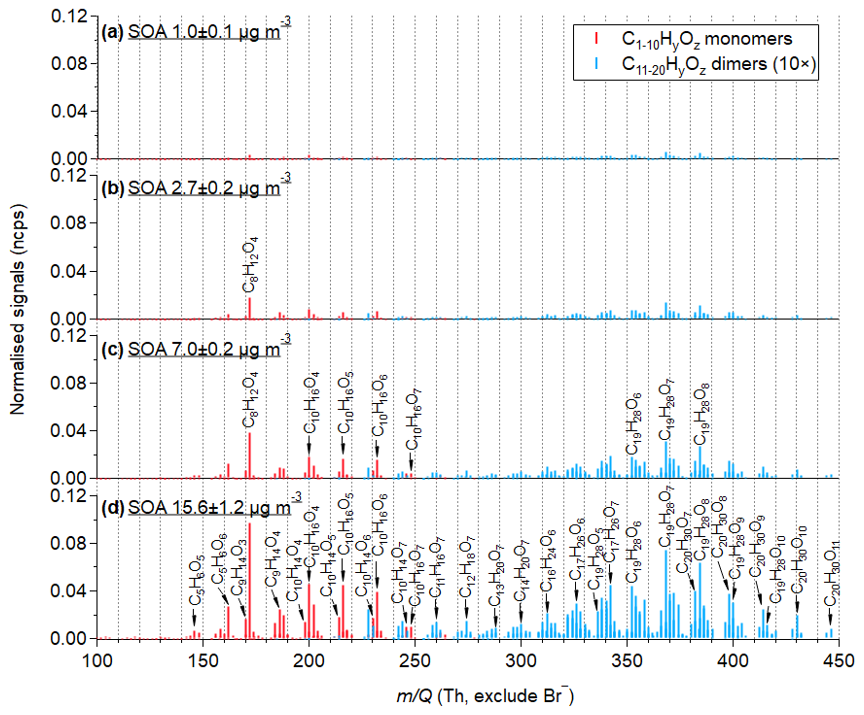
Figure 4Mass spectra of particle-phase organic compounds formed from the oxidation of α-pinene under varying mass particle concentrations (1.0–15.6 µg m−3). Compounds are evaporated and detected by the WALL-E CIMS, with HF and TD temperatures of 300 °C, SF of 1 slpm, HF of 0.25 slpm, and a cold dilution flow of 10 slpm. Signals are normalized to Br− signal intensity. Red and blue refer to monomers (C1–10HyOx) and dimers (C11–20HyOx), respectively. The normalized signals of dimeric compounds are multiplied by a factor of 10.
3.2.2 Sensitivity determination on SOA molecules
The sensitivity of standard compounds, which is determined by the linear regression between the normalized signals detected by WALL-E and the particle mass concentrations (Fig. S2), is summarized in Table S2. The r2 values of the fitting for most standard compounds are good (0.93–0.99), while 1,5-dihydroxy naphthalene has the lowest r2 value of 0.85. By utilizing the in-source collision ion dissociation feature (Riva et al., 2019a), which corresponds to an increase in the direct current (DC) offset voltages between two ion optics within the flatapole, the binding energy of the [M-Br−] adducts can be probed (Fig. S7). Their voltage difference at half-signal maximum intensity (dV50) broadly ranges from 5.1 to 20.2 V, indicating differences in binding energies and varying clustering strengths with Br−. Consequently, the correlation between the sensitivity and the dV50 values obtained from the standard compounds is fitted by a non-linear sigmoidal function (Fig. S8), which is consistent with prior studies using the same approach to quantify gaseous species (Lopez-Hilfiker et al., 2016; Iyer et al., 2016; Zaytsev et al., 2019; Xu et al., 2022). This calibration curve provides an estimation of the system sensitivity based on experimentally obtained dV50 cluster values from declustering scans with increasing energy (Lopez-Hilfiker et al., 2019). Using this method, raw MS signal intensities can be converted into quantified amounts, reducing the need for compound-specific calibration when authentic standards are not available. This method enables semi-quantification across a wide variety of molecules.
The correlation between sensitivity (Fig. S2) and dV50 (Fig. S7) is obtained based on the standard compounds, as depicted in Fig. S8. By applying this sigmoidal function and using the dV50 values determined for individual α-pinene-derived SOA products, the concentration of every oxidation compound can be estimated. As an example, Fig. S9 presents the declustering profiles of C10 monomers and C19–20 dimers from SOA. Consistent with previous studies (Riva et al., 2019a), more oxidized compounds exhibit stronger binding energies, resulting in higher dV50 values. As shown in Fig. S10, the corresponding sensitivity of α-pinene-derived SOA compounds generally increases with molecular mass and reaches a plateau corresponding to the maximum sensitivity (i.e., collision limit), with an upper limit of sensitivity of 0.08 ncps per µg m−3, providing a limit of quantification ∼5–10 pg m−3, which corresponds to uncorrected signal intensities of to 1 (Riva et al., 2020).
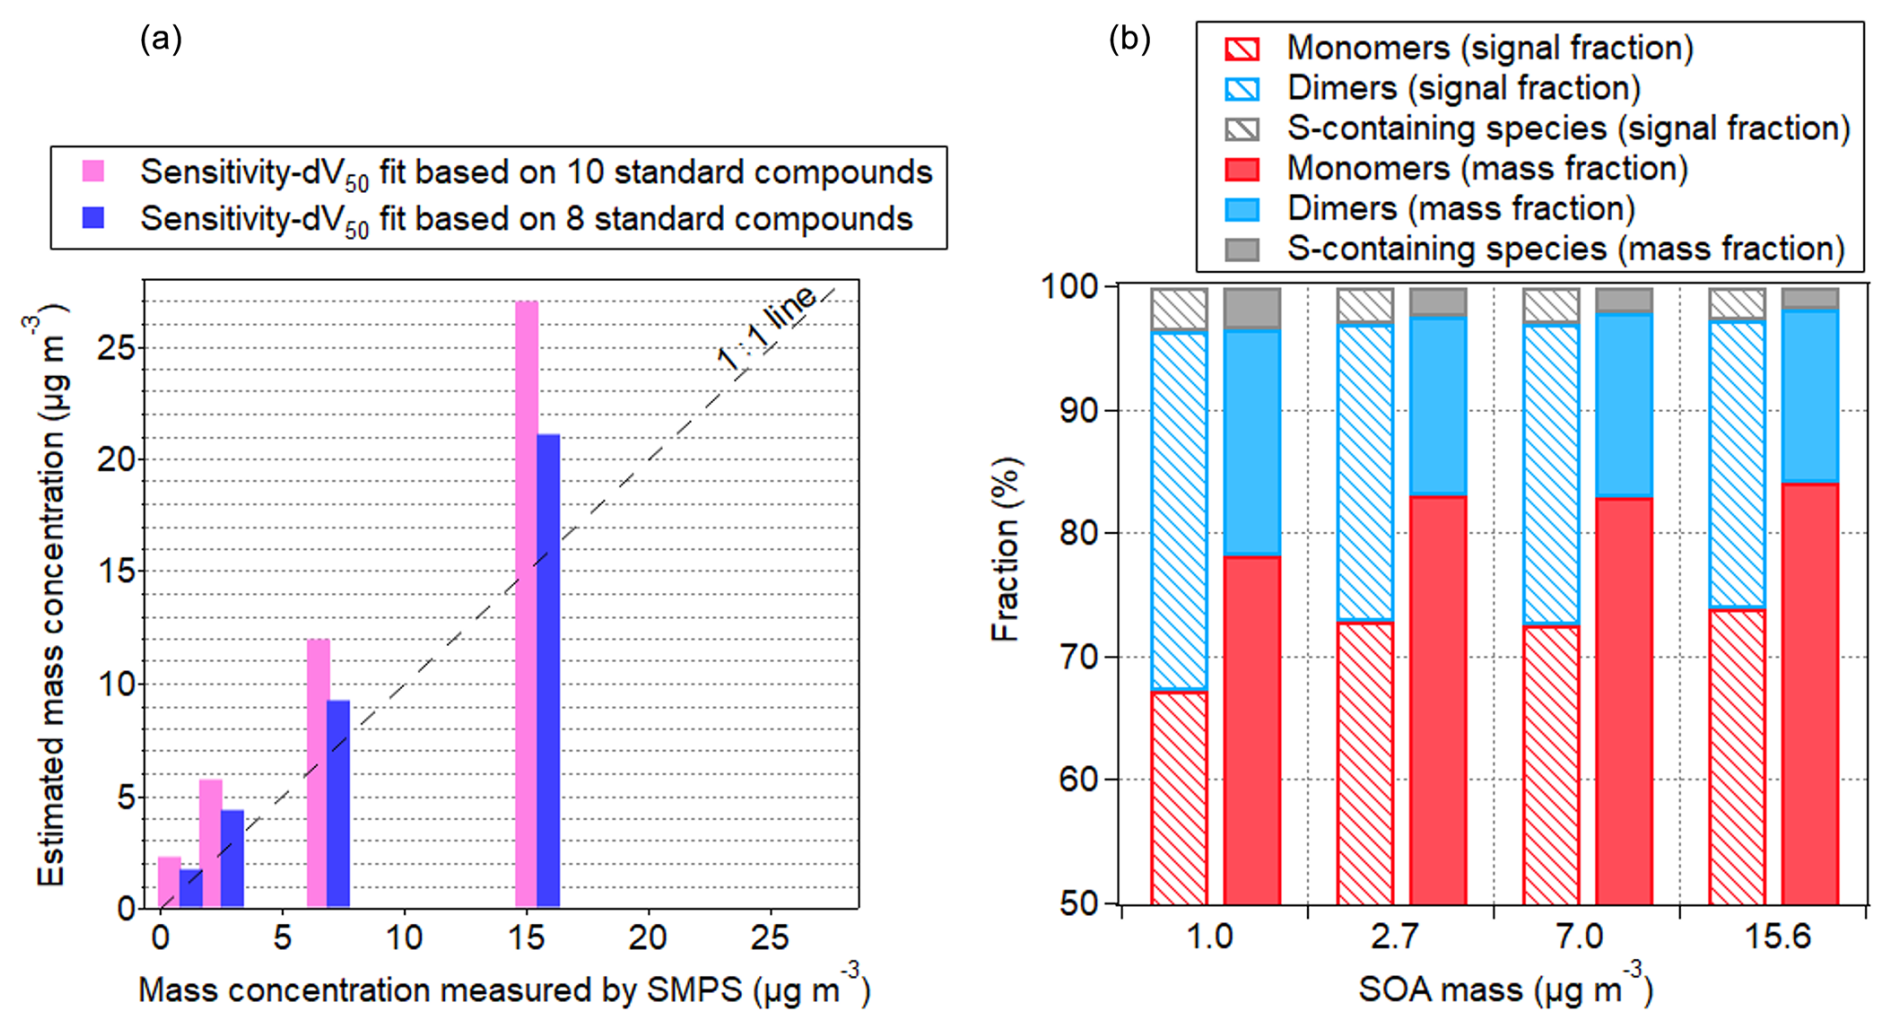
Figure 5(a) The estimated mass concentration measured by WALL-E as a function of SOA mass concentration measured by the SMPS. (b) Fractions of monomers, dimers, and sulfur-containing compounds in the SOA particles formed from O3/OH-initiated oxidation of α-pinene in the presence of SO2. The calculation of fractions is weighted by normalized signals (dashed bars) and mass concentrations (solid bars), respectively.
3.2.3 Sensitivity-corrected chemical composition of SOA particles
By assessing the sensitivity of individual α-pinene-derived SOA compounds, the mass concentrations of all identified particle-phase oxidation products can be estimated (Fig. S11). Using the correlation between sensitivity and dV50, based on 10 standard compounds, the total particle mass concentration is estimated to be 27.1 µg m−3, 74 % higher than the SMPS measurements (15.6 µg m−3), assuming spherical particles with an aerosol density of 1.45 g m−3 (Kim et al., 2010; Shilling et al., 2009). Among all calibrated compounds, two outliers exist (i.e., shikimic acid and glucose), which might be due to partial evaporation leading to an underestimation of the sensitivity. When excluding these two species, the estimate of total particle mass concentration is closer (with 36 % overestimation) to the total particle mass concentration measured by the SMPS, as depicted in Fig. 5. As discussed in previous studies, selected standard compounds might induce uncertainty in the sensitivity estimations (Zaytsev et al., 2019; Bi et al., 2021; Song et al., 2024). Notably, the presence of different isomers can yield substantial uncertainties, especially when their sensitivity may vary by an order of magnitude (e.g., Lee et al., 2014). It should also be mentioned that the total mass concentration determined by the SMPS is prone to uncertainties (Wilson et al., 2015; Bell et al., 2023). Using the dV50 method presented here and considering a total SOA mass of 15.6 µg m−3, the mass concentration of H2SO4 is estimated at 8.7 µg m−3 (using 10-compound fitting) and 6.4 µg m−3 (using 8-compound fitting). A good agreement between the direct calibration (Table S2) and the declustering scan method is retrieved (7 % overestimation and 25 % underestimation for the 10- and 8-compound fit, respectively underlining the benefit of using this approach to obtain the concentrations of organic and inorganic compounds present in the particles. Overall, a linear relationship exists, with the total SOA mass concentrations in the range of 1.0–15.6 µg m−3 (Fig. 5), exhibiting an overall good agreement between the WALL-E and SMPS measurements (i.e., 20 %–30 %). Hence, this method can provide a deeper understanding of aerosol composition and evolution. For example, due to their general higher sensitivities, dimers contribute only 14 %–18 % of the total mass (Figs. 5 and S10), much less than their fractions based on signal intensity (23 %–29 %). This suggests that the dimer contributions to particles may be overestimated when solely based on signal intensity.
3.3 Assessing particle molecular volatility
3.3.1 Thermograms and Tmax determination
The determination of volatility represents one of the greatest analytical challenges when characterizing aerosol particles, as it depends on multiple factors, including molecular composition, intermolecular interactions, and experimental conditions (Compernolle et al., 2011). Various experimental and theoretical techniques have been developed over the last decades to retrieve volatility information, each with advantages and limitations.
While FIGAERO and VIA have been widely used, their design constraints introduce inherent limitations. FIGAERO can introduce artifacts such as recondensation, analyte interactions, and fragmentation. The prolonged residence time on FIGAERO may also lead to the early desorption of volatile species or chemical reactions between co-deposited compounds, impacting the accuracy of volatility estimates (Stark et al., 2017; Schobesberger et al., 2018; Buchholz et al., 2020). VIA thermograms, on the other hand, show evidence of fragmentation and thermal decomposition at high temperatures (Zhao et al., 2024b). WALL-E introduces a new approach, optimizing the balance between thermal residence time and evaporation efficiency, allowing for precise volatility determination with reduced wall interactions.
3.3.2 T50 as a robust volatility metric
The Tmax values, which correspond to the peak desorption temperature, represent the temperature at which the maximum desorption rate occurs. Traditionally, Tmax has been used to estimate volatility from thermograms. This approach is well suited for FIGAERO and VIA, where the thermograms typically exhibit a near-Gaussian profile, with a clear peak followed by a steep signal decline due to decomposition and fragmentation. However, in the case of WALL-E, where thermograms more closely follow a sigmoidal desorption trend, Tmax determination becomes less straightforward. At high temperatures, the signal does not drop sharply but instead asymptotically reaches a plateau, making Tmax highly sensitive to noise and minor variations in the upper temperature range.
To overcome this limitation, we propose using T50, the temperature at which the signal reaches 50 % of its maximum as a more robust volatility metric. Since T50 is located in the steepest region of the sigmoid fit, it is significantly less affected by noise, baseline shifts, or small variations in signal intensity. Unlike Tmax, which depends on the choice of an arbitrary threshold (e.g., 99.5 % or 99.9 % of the signal maximum), T50 is a main feature of the sigmoid function, making it a more consistent and reproducible parameter for comparing volatility trends in the case of WALL-E. To accurately determine T50, the thermograms are smoothed and fitted using a sigmoid function. This approach minimizes the influence of temperature-ramping increments and instrumental noise. Figure 6 displays thermograms for PEG standards, illustrating that less volatile compounds require higher temperatures for complete evaporation, whereas more volatile compounds evaporate at lower temperatures.
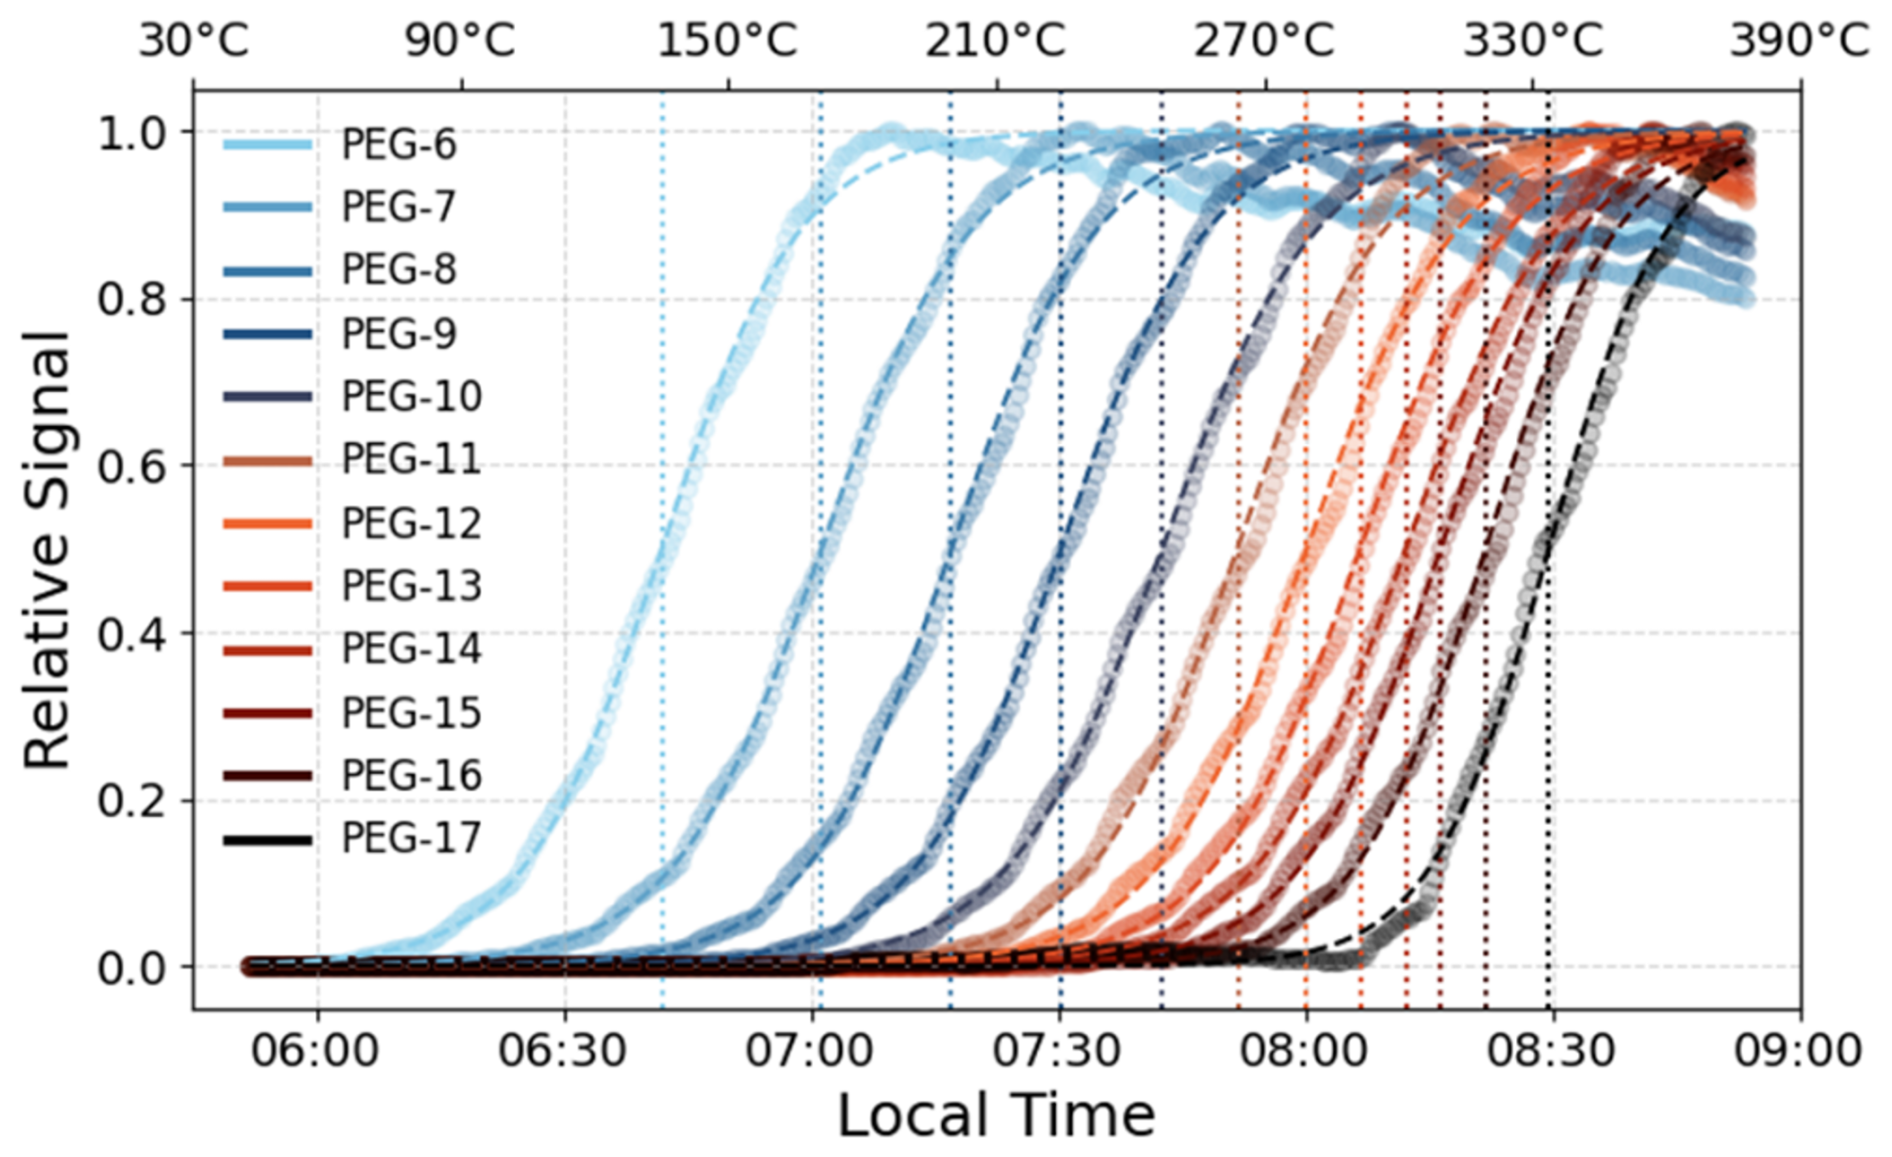
Figure 6Thermograms of PEG standards obtained using WALL-E. The desorption profiles illustrate the relative signal intensity as a function of temperature.
In contrast to earlier systems, including FIGAERO and VIA, which often produce Gaussian-shaped thermograms with clearly defined peaks, WALL-E thermograms follow a sigmoidal profile. This makes the determination of Tmax more sensitive to the selected threshold and prone to variability, especially at upper temperature ranges.
The use of a sigmoid fit for the WALL-E data is justified by the observed thermograms, which closely resemble this behavior, with only a moderate signal decrease at the highest tested temperatures. For comparison purposes with other particle evaporators, Tmax is used with a signal representation of 98 %. Figure S12 shows the effect of varying this signal percentage threshold. By varying between 99.5 % and 98 %, a difference of about 10 % in the Tmax value is observed, which makes it challenging to select an appropriate threshold. In addition, at higher temperatures, the fit for less volatile PEGs can result in more errors due to fewer data points, which mainly affect PEG-17. Taking a threshold where the signal is half always results in more accurate results, even with 10 % variation in the threshold. The signals of more volatile compounds, such as PEG-6 and PEG-7, with Tmax values of 203.6 °C and 246.3 °C, decrease by only 11.2 % and 18.9 %, respectively, even after a temperature increase of over 150 °C, which represents a significant improvement compared to other online TD techniques. At this point, PEG-16 and PEG-17 reach their Tmax (Table S4). This demonstrates WALL-E's ability to maintain signal integrity across a wide volatility range, ensuring reliable thermal desorption without excessive signal loss.
3.3.3 Temperature correction and comparison with VIA and FIGAERO
Although T50 is introduced as a more robust metric in this study, temperature correction and inter-comparison with other techniques have traditionally been performed using Tmax values. Therefore, we present the correction and comparison based on Tmax to ensure consistency with previous studies before applying the T50 approach.
The temperatures applied during thermal desorption in WALL-E do not directly reflect the actual gas-phase temperatures experienced by the desorbed compounds. Due to thermal lag and heat transfer dynamics, a correction factor was derived based on the COMSOL numerical simulations, as well as actual measurements using a thermocouple at the end of the TD. The internal gas temperature at the core of the TD was found to follow a linear relationship with the set temperature (Fig. S13). This correction ensures that the reported Tmax values accurately represent the true volatility behavior of the analytes. The corrected and uncorrected Tmax and T50 values for each PEG compound are plotted against their molecular masses in Fig. S14. The corrected values align well with those reported for VIA and FIGAERO, maintaining a consistent trend across different molecular weights (Fig. S14). In contrast, the uncorrected Tmax values are systematically higher, displaying a different slope compared to the other two systems. This highlights the necessity of applying the correction factor to ensure accurate volatility determination.
Tmax values from WALL-E and VIA are higher compared to FIGAERO, which can be attributed to the short residence time in the TD region (Zhao et al., 2024b). Additionally, WALL-E exhibits lower Tmax values than VIA, likely due to the introduction of heated dilution flow into the sample stream. This promotes flash evaporation, causing compounds to desorb before reaching full thermal equilibrium, ultimately shifting Tmax to lower values while maintaining the expected volatility trend. As illustrated in Fig. S15, the residence time in the TD region further influences T50 or Tmax values. Longer residence times allow for gradual heating and equilibration, leading to lower temperature values. In contrast, shorter residence times accelerate desorption, resulting in higher temperature values due to insufficient thermal equilibration.
3.3.4 Volatility estimation from T50
As previously explained, the use of T50 would provide a more reliable estimation of the volatility, in the case of WALL-E, which is typically inferred using the relationship between T50 and the saturation concentration (C*), as discussed in prior studies (Ylisirniö et al., 2021). The wide range of T50 values observed for PEG standards underscores the broad applicability of WALL-E for volatility characterization across diverse classes of compounds. To derive volatility estimates, we apply the parameterization method proposed previously (Krieger et al., 2018; Ylisirniö et al., 2021), which utilizes measured vapor pressures for PEG-5 to PEG-8 and extrapolates the trend for higher molecular weights. Additionally, an alternative approach using the parameterization (Li et al., 2016) is considered. While both methods produce similar trends for lower-mass PEGs, they diverge significantly at higher masses, reflecting the inherent uncertainties in extrapolating volatility predictions. Given these discrepancies, we define a volatility range (Fig. 7) that encompasses both parameterizations, providing a more robust estimation framework until additional direct vapor pressure measurements become available.
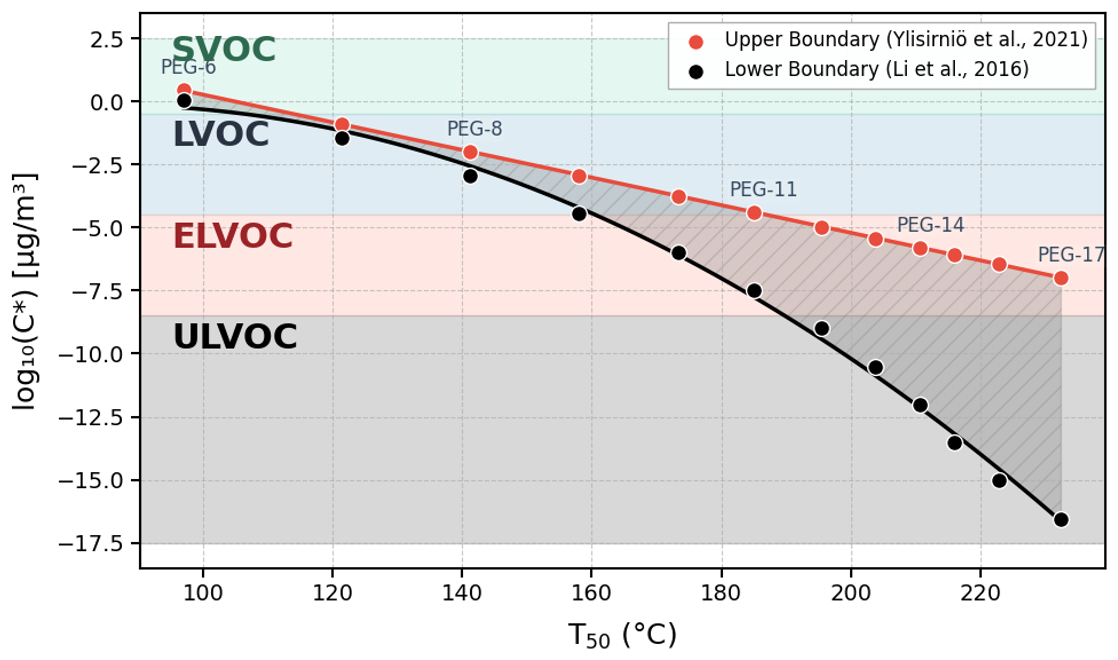
Figure 7Volatility estimation using measured T50 values, ranging from semi-volatile organic compounds (SVOC) to ultra-low-volatility organic compounds (ULVOC).
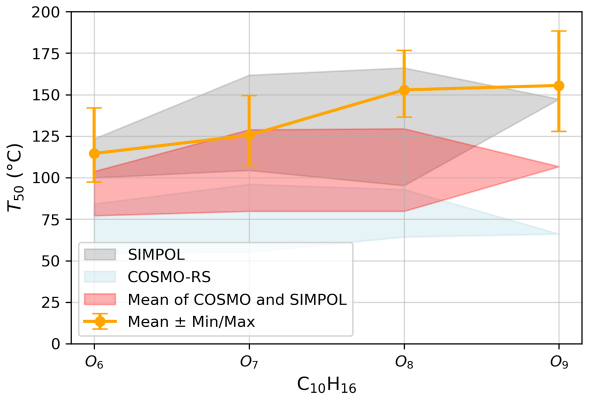
Figure 8Comparison of estimated T50 values for α-pinene-derived SOA compounds, specifically C10H16O6−9, with volatility predictions from COSMO-RS and SIMPOL models. The measured T50 values (orange) are shown with their min and max range, while the shaded regions represent model predictions taking into consideration the isomerization. We applied the sigmoid fitting method to the heating, cooling, and fast-cooling ramps, extracted the T50 values from each, and averaged them. The orange line represents this averaged T50 value.
To assess the applicability of T50-based volatility determination, we apply this approach to α-pinene-derived SOA compounds, specifically C10H16O6–9. The T50 values of these SOA species are determined using multiple ramp-up speeds, ensuring reproducibility across different heating rates. Additionally, a faster temperature ramp-down from 390 to 30 °C is used as an independent validation method. As shown in Fig. 8, the T50 estimated using WALL-E for the C10H16O6–9 from the heating and cooling phases (i.e., temperature ramping up and down, respectively) exhibit a very good agreement, confirming the robustness of the system.
Determined T50 values are further compared with theoretical volatility estimation models, specifically COSMO-RS and SIMPOL, as presented previously (Kurtén et al., 2016; Peräkylä et al., 2020). Our measured T50 values for the SOA compounds fall well within the SIMPOL-predicted region, confirming that the volatility estimates obtained using WALL-E are consistent with theoretical predictions. As mentioned earlier, without a pre-separation method, the presence of isomers can alter the quantification of the compounds of interest, which is also the case for volatility estimation. As previously discussed by Kurtén et al. (2016) and Peräkylä et al. (2020), isomeric structures can exhibit significantly different volatilities, reinforcing the need to account for molecular configurations beyond elemental composition when interpreting volatility trends.
Within this work we present a new analytical method (i.e., WALL-E) to retrieve the chemical composition of atmospheric particles in real time. Coupled with a CIMS using Br− ion chemistry as the reagent ion, WALL-E is comprehensively characterized, achieving efficient particle evaporation with maximum evaporation efficiency while exhibiting minimal thermal decomposition across a range of operational settings. The characterization of SOA produced from the O3/OH-initiated oxidation of α-pinene in the presence of SO2 further validates WALL-E's performance in resolving and quantifying complex organic aerosol mixtures. It successfully identifies a broad range of monomeric (C1–10) and dimeric (C11–20) compounds. By utilizing the in-source collision ion dissociation feature, the sensitivity of the analytical method is realized using a wide variety of authentic standards used to determine the correlation between binding energy and sensitivity. By using this function and performing declustering procedures, individual α-pinene-derived SOA compounds are quantified at concentrations as low as 10 pg m−3 (for a total SOA mass of 1 µg m−3). The total estimated SOA mass concentration is in good agreement with particle concentration measurements obtained by an SMPS, demonstrating the benefit of this approach. Notably, the mass contribution of dimeric compounds is determined, which reveals that they account for only 14 %–18 % of total particle mass, which is notably lower than their fractions (23 %–29 %) based on signal intensity. Finally, the volatility assessment using thermogram analysis demonstrates WALL-E's capability to retrieve T50 values with high precision, aligning well with predicted SIMPOL volatility. Future studies should focus on systematically characterizing SOA volatilities across a broader range of precursor compounds and oxidation conditions, leveraging complementary mass spectrometry and computational modeling techniques to refine volatility estimation approaches.
Overall, WALL-E represents a useful and promising tool for atmospheric research, bridging important gaps in real-time aerosol characterization, quantification of the chemical composition of complex particulate organic mixtures, and volatility assessment. It improves the time resolution and minimizes measurement artifacts notably due to thermal fragmentation, providing a new technique for investigating the real-time changes in the formation and growth of atmospheric particles for laboratory and field observations.
The data of all figures and tables are available on request from the corresponding author.
The supplement related to this article is available online at https://doi.org/10.5194/amt-18-5087-2025-supplement.
MR, SP, IZ, MD, and FB designed and built WALL-E. LG, IZ, ES, CC, and FSD conducted the experiments. LG, IZ, ES, and FSD analyzed the data. IZ did the simulation. LG and IZ prepared the paper, with contributions from all co-authors.
The contact author has declared that none of the authors has any competing interests.
Publisher's note: Copernicus Publications remains neutral with regard to jurisdictional claims made in the text, published maps, institutional affiliations, or any other geographical representation in this paper. While Copernicus Publications makes every effort to include appropriate place names, the final responsibility lies with the authors.
The authors thank Siegfried Schobesberger for discussing and sharing the FIGAERO measurements and Georgios Gkatzelis for discussing the declustering scan.
This research has been supported by the European Research Council's Horizon Europe (grant no. 852161) and the European Union's Horizon 2020 (grant no. 101073026).
This paper was edited by Hartmut Herrmann and reviewed by three anonymous referees.
Bannan, T. J., Le Breton, M., Priestley, M., Worrall, S. D., Bacak, A., Marsden, N. A., Mehra, A., Hammes, J., Hallquist, M., Alfarra, M. R., Krieger, U. K., Reid, J. P., Jayne, J., Robinson, W., McFiggans, G., Coe, H., Percival, C. J., and Topping, D.: A method for extracting calibrated volatility information from the FIGAERO-HR-ToF-CIMS and its experimental application, Atmos. Meas. Tech., 12, 1429–1439, https://doi.org/10.5194/amt-12-1429-2019, 2019.
Bell, D. M., Zhang, J., Top, J., Bogler, S., Surdu, M., Slowik, J. G., Prevot, A. S. H., and El Haddad, I.: Sensitivity Constraints of Extractive Electrospray for a Model System and Secondary Organic Aerosol, Anal. Chem., 95, 13788–13795, https://doi.org/10.1021/acs.analchem.3c00441, 2023.
Bi, C., Krechmer, J. E., Canagaratna, M. R., and Isaacman-VanWertz, G.: Correcting bias in log-linear instrument calibrations in the context of chemical ionization mass spectrometry, Atmos. Meas. Tech., 14, 6551–6560, https://doi.org/10.5194/amt-14-6551-2021, 2021.
Buchholz, A., Ylisirniö, A., Huang, W., Mohr, C., Canagaratna, M., Worsnop, D. R., Schobesberger, S., and Virtanen, A.: Deconvolution of FIGAERO–CIMS thermal desorption profiles using positive matrix factorisation to identify chemical and physical processes during particle evaporation, Atmos. Chem. Phys., 20, 7693–7716, https://doi.org/10.5194/acp-20-7693-2020, 2020.
Cai, R., Li, Y., Clément, Y., Li, D., Dubois, C., Fabre, M., Besson, L., Perrier, S., George, C., Ehn, M., Huang, C., Yi, P., Ma, Y., and Riva, M.: Orbitool: a software tool for analyzing online Orbitrap mass spectrometry data, Atmos. Meas. Tech., 14, 2377–2387, https://doi.org/10.5194/amt-14-2377-2021, 2021.
Charnawskas, J. C., Alpert, P. A., Lambe, A. T., Berkemeier, T., O'Brien, R. E., Massoli, P., Onasch, T. B., Shiraiwa, M., Moffet, R. C., Gilles, M. K., Davidovits, P., Worsnop, D. R., and Knopf, D. A.: Condensed-phase biogenic–anthropogenic interactions with implications for cold cloud formation, Faraday Discuss., 200, 165–194, https://doi.org/10.1039/C7FD00010C, 2017.
Compernolle, S., Ceulemans, K., and Müller, J.-F.: EVAPORATION: a new vapour pressure estimation methodfor organic molecules including non-additivity and intramolecular interactions, Atmos. Chem. Phys., 11, 9431–9450, https://doi.org/10.5194/acp-11-9431-2011, 2011.
Du, M., Voliotis, A., Shao, Y., Wang, Y., Bannan, T. J., Pereira, K. L., Hamilton, J. F., Percival, C. J., Alfarra, M. R., and McFiggans, G.: Combined application of online FIGAERO-CIMS and offline LC-Orbitrap mass spectrometry (MS) to characterize the chemical composition of secondary organic aerosol (SOA) in smog chamber studies, Atmos. Meas. Tech., 15, 4385–4406, https://doi.org/10.5194/amt-15-4385-2022, 2022.
Eichler, P., Müller, M., D'Anna, B., and Wisthaler, A.: A novel inlet system for online chemical analysis of semi-volatile submicron particulate matter, Atmos. Meas. Tech., 8, 1353–1360, https://doi.org/10.5194/amt-8-1353-2015, 2015.
Fehsenfeld, F., Calvert, J., Fall, R., Goldan, P., Guenther, A. B., Hewitt, C. N., Lamb, B., Liu, S., Trainer, M., Westberg, H., and Zimmerman, P.: Emissions of volatile organic compounds from vegetation and the implications for atmospheric chemistry, Global Biogeochem. Cy., 6, 389–430, https://doi.org/10.1029/92GB02125, 1992.
Häkkinen, E., Zhao, J., Graeffe, F., Fauré, N., Krechmer, J. E., Worsnop, D., Timonen, H., Ehn, M., and Kangasluoma, J.: Online measurement of highly oxygenated compounds from organic aerosol, Atmos. Meas. Tech., 16, 1705–1721, https://doi.org/10.5194/amt-16-1705-2023, 2023.
Iyer, S., Lopez-Hilfiker, F., Lee, B. H., Thornton, J. A., and Kurtén, T.: Modeling the Detection of Organic and Inorganic Compounds Using Iodide-Based Chemical Ionization, J. Phys. Chem. A, 120, 576–587, https://doi.org/10.1021/acs.jpca.5b09837, 2016.
Jimenez, J. L., Canagaratna, M. R., Donahue, N. M., Prevot, A. S. H., Zhang, Q., Kroll, J. H., DeCarlo, P. F., Allan, J. D., Coe, H., Ng, N. L., Aiken, A. C., Docherty, K. S., Ulbrich, I. M., Grieshop, A. P., Robinson, A. L., Duplissy, J., Smith, J. D., Wilson, K. R., Lanz, V. A., Hueglin, C., Sun, Y. L., Tian, J., Laaksonen, A., Raatikainen, T., Rautiainen, J., Vaattovaara, P., Ehn, M., Kulmala, M., Tomlinson, J. M., Collins, D. R., Cubison, M. J., E., Dunlea, J., Huffman, J. A., Onasch, T. B., Alfarra, M. R., Williams, P. I., Bower, K., Kondo, Y., Schneider, J., Drewnick, F., Borrmann, S., Weimer, S., Demerjian, K., Salcedo, D., Cottrell, L., Griffin, R., Takami, A., Miyoshi, T., Hatakeyama, S., Shimono, A., Sun, J. Y., Zhang, Y. M., Dzepina, K., Kimmel, J. R., Sueper, D., Jayne, J. T., Herndon, S. C., Trimborn, A. M., Williams, L. R., Wood, E. C., Middlebrook, A. M., Kolb, C. E., Baltensperger, U., and Worsnop, D. R.: Evolution of Organic Aerosols in the Atmosphere, Science, 326, 1525–1529, https://doi.org/10.1126/science.1180353, 2009.
Kahnt, A., Vermeylen, R., Iinuma, Y., Safi Shalamzari, M., Maenhaut, W., and Claeys, M.: High-molecular-weight esters in α-pinene ozonolysis secondary organic aerosol: structural characterization and mechanistic proposal for their formation from highly oxygenated molecules, Atmos. Chem. Phys., 18, 8453–8467, https://doi.org/10.5194/acp-18-8453-2018, 2018.
Kanakidou, M., Seinfeld, J. H., Pandis, S. N., Barnes, I., Dentener, F. J., Facchini, M. C., Van Dingenen, R., Ervens, B., Nenes, A., Nielsen, C. J., Swietlicki, E., Putaud, J. P., Balkanski, Y., Fuzzi, S., Horth, J., Moortgat, G. K., Winterhalter, R., Myhre, C. E. L., Tsigaridis, K., Vignati, E., Stephanou, E. G., and Wilson, J.: Organic aerosol and global climate modelling: a review, Atmos. Chem. Phys., 5, 1053–1123, https://doi.org/10.5194/acp-5-1053-2005, 2005.
Kim, H., Barkey, B., and Paulson, S. E.: Real refractive indices of α- and β-pinene and toluene secondary organic aerosols generated from ozonolysis and photo-oxidation, J. Geophys. Res.-Atmos., 115, D24212, https://doi.org/10.1029/2010JD014549, 2010.
Krieger, U. K., Siegrist, F., Marcolli, C., Emanuelsson, E. U., Gøbel, F. M., Bilde, M., Marsh, A., Reid, J. P., Huisman, A. J., Riipinen, I., Hyttinen, N., Myllys, N., Kurtén, T., Bannan, T., Percival, C. J., and Topping, D.: A reference data set for validating vapor pressure measurement techniques: homologous series of polyethylene glycols, Atmos. Meas. Tech., 11, 49–63, https://doi.org/10.5194/amt-11-49-2018, 2018.
Kurtén, T., Tiusanen, K., Roldin, P., Rissanen, M., Luy, J.-N., Boy, M., Ehn, M., and Donahue, N.: α-Pinene Autoxidation Products May Not Have Extremely Low Saturation Vapor Pressures Despite High O:C Ratios, J. Phys. Chem. A, 120, 2569–2582, https://doi.org/10.1021/acs.jpca.6b02196, 2016.
Laothawornkitkul, J., Taylor, J. E., Paul, N. D., and Hewitt, C. N.: Biogenic volatile organic compounds in the Earth system, New Phytol., 183, 27–51, https://doi.org/10.1111/j.1469-8137.2009.02859.x, 2009.
Lee, B. H., Lopez-Hilfiker, F. D., Mohr, C., Kurtén, T., Worsnop, D. R., and Thornton, J. A.: An Iodide-Adduct High-Resolution Time-of-Flight Chemical-Ionization Mass Spectrometer: Application to Atmospheric Inorganic and Organic Compounds, Environ. Sci. Technol., 48, 6309–6317, https://doi.org/10.1021/es500362a, 2014.
Lee, C. P., Riva, M., Wang, D., Tomaz, S., Li, D., Perrier, S., Slowik, J. G., Bourgain, F., Schmale, J., Prevot, A. S. H., Baltensperger, U., George, C., and El Haddad, I.: Online Aerosol Chemical Characterization by Extractive Electrospray Ionization–Ultrahigh-Resolution Mass Spectrometry (EESI-Orbitrap), Environ. Sci. Technol., 54, 3871–3880, https://doi.org/10.1021/acs.est.9b07090, 2020.
Li, H., Almeida, T. G., Luo, Y., Zhao, J., Palm, B. B., Daub, C. D., Huang, W., Mohr, C., Krechmer, J. E., Kurtén, T., and Ehn, M.: Fragmentation inside proton-transfer-reaction-based mass spectrometers limits the detection of ROOR and ROOH peroxides, Atmos. Meas. Tech., 15, 1811–1827, https://doi.org/10.5194/amt-15-1811-2022, 2022.
Li, X., Li, Y., Lawler, M. J., Hao, J., Smith, J. N., and Jiang, J.: Composition of Ultrafine Particles in Urban Beijing: Measurement Using a Thermal Desorption Chemical Ionization Mass Spectrometer, Environ. Sci. Technol., 55, 2859–2868, https://doi.org/10.1021/acs.est.0c06053, 2021.
Li, Y., Pöschl, U., and Shiraiwa, M.: Molecular corridors and parameterizations of volatility in the chemical evolution of organic aerosols, Atmos. Chem. Phys., 16, 3327–3344, https://doi.org/10.5194/acp-16-3327-2016, 2016.
Lopez-Hilfiker, F. D., Iyer, S., Mohr, C., Lee, B. H., D'Ambro, E. L., Kurtén, T., and Thornton, J. A.: Constraining the sensitivity of iodide adduct chemical ionization mass spectrometry to multifunctional organic molecules using the collision limit and thermodynamic stability of iodide ion adducts, Atmos. Meas. Tech., 9, 1505–1512, https://doi.org/10.5194/amt-9-1505-2016, 2016.
Lopez-Hilfiker, F. D., Pospisilova, V., Huang, W., Kalberer, M., Mohr, C., Stefenelli, G., Thornton, J. A., Baltensperger, U., Prevot, A. S. H., and Slowik, J. G.: An extractive electrospray ionization time-of-flight mass spectrometer (EESI-TOF) for online measurement of atmospheric aerosol particles, Atmos. Meas. Tech., 12, 4867–4886, https://doi.org/10.5194/amt-12-4867-2019, 2019.
Lopez-Hilfiker, F. D., Mohr, C., Ehn, M., Rubach, F., Kleist, E., Wildt, J., Mentel, Th. F., Lutz, A., Hallquist, M., Worsnop, D., and Thornton, J. A.: A novel method for online analysis of gas and particle composition: description and evaluation of a Filter Inlet for Gases and AEROsols (FIGAERO), Atmos. Meas. Tech., 7, 983–1001, https://doi.org/10.5194/amt-7-983-2014, 2014.
Mellouki, A., Wallington, T. J., and Chen, J.: Atmospheric Chemistry of Oxygenated Volatile Organic Compounds: Impacts on Air Quality and Climate, Chem. Rev., 115, 3984–4014, https://doi.org/10.1021/cr500549n, 2015.
Müller, M., Eichler, P., D'Anna, B., Tan, W., and Wisthaler, A.: Direct Sampling and Analysis of Atmospheric Particulate Organic Matter by Proton-Transfer-Reaction Mass Spectrometry, Anal. Chem., 89, 10889–10897, https://doi.org/10.1021/acs.analchem.7b02582, 2017.
Pai, S. J., Heald, C. L., Pierce, J. R., Farina, S. C., Marais, E. A., Jimenez, J. L., Campuzano-Jost, P., Nault, B. A., Middlebrook, A. M., Coe, H., Shilling, J. E., Bahreini, R., Dingle, J. H., and Vu, K.: An evaluation of global organic aerosol schemes using airborne observations, Atmos. Chem. Phys., 20, 2637–2665, https://doi.org/10.5194/acp-20-2637-2020, 2020.
Peng, Y., Wang, H., Gao, Y., Jing, S., Zhu, S., Huang, D., Hao, P., Lou, S., Cheng, T., Huang, C., and Zhang, X.: Real-time measurement of phase partitioning of organic compounds using a proton-transfer-reaction time-of-flight mass spectrometer coupled to a CHARON inlet, Atmos. Meas. Tech., 16, 15–28, https://doi.org/10.5194/amt-16-15-2023, 2023.
Peräkylä, O., Riva, M., Heikkinen, L., Quéléver, L., Roldin, P., and Ehn, M.: Experimental investigation into the volatilities of highly oxygenated organic molecules (HOMs) , Atmos. Chem. Phys., 20, 649–669, https://doi.org/10.5194/acp-20-649-2020, 2020.
Riva, M., Brüggemann, M., Li, D., Perrier, S., George, C., Herrmann, H., and Berndt, T.: Capability of CI-Orbitrap for Gas-Phase Analysis in Atmospheric Chemistry: A Comparison with the CI-APi-TOF Technique, Anal. Chem., 92, 8142–8150, https://doi.org/10.1021/acs.analchem.0c00111, 2020.
Riva, M., Ehn, M., Li, D., Tomaz, S., Bourgain, F., Perrier, S., and George, C.: CI-Orbitrap: An Analytical Instrument To Study Atmospheric Reactive Organic Species, Anal. Chem., 91, 9419–9423, https://doi.org/10.1021/acs.analchem.9b02093, 2019a.
Riva, M., Rantala, P., Krechmer, J. E., Peräkylä, O., Zhang, Y., Heikkinen, L., Garmash, O., Yan, C., Kulmala, M., Worsnop, D., and Ehn, M.: Evaluating the performance of five different chemical ionization techniques for detecting gaseous oxygenated organic species, Atmos. Meas. Tech., 12, 2403–2421, https://doi.org/10.5194/amt-12-2403-2019, 2019b.
Schobesberger, S., D'Ambro, E. L., Lopez-Hilfiker, F. D., Mohr, C., and Thornton, J. A.: A model framework to retrieve thermodynamic and kinetic properties of organic aerosol from composition-resolved thermal desorption measurements, Atmos. Chem. Phys., 18, 14757–14785, https://doi.org/10.5194/acp-18-14757-2018, 2018.
Shilling, J. E., Chen, Q., King, S. M., Rosenoern, T., Kroll, J. H., Worsnop, D. R., DeCarlo, P. F., Aiken, A. C., Sueper, D., Jimenez, J. L., and Martin, S. T.: Loading-dependent elemental composition of α-pinene SOA particles, Atmos. Chem. Phys., 9, 771–782, https://doi.org/10.5194/acp-9-771-2009, 2009.
Smith, J. N., Moore, K. F., McMurry, P. H., and Eisele, F. L.: Atmospheric Measurements of Sub-20 nm Diameter Particle Chemical Composition by Thermal Desorption Chemical Ionization Mass Spectrometry, Aerosol Sci. Technol., 38, 100–110, https://doi.org/10.1080/02786820490249036, 2004.
Song, M., He, S., Li, X., Liu, Y., Lou, S., Lu, S., Zeng, L., and Zhang, Y.: Optimizing the iodide-adduct chemical ionization mass spectrometry (CIMS) quantitative method for toluene oxidation intermediates: experimental insights into functional-group differences, Atmos. Meas. Tech., 17, 5113–5127, https://doi.org/10.5194/amt-17-5113-2024, 2024.
Stark, H., Yatavelli, R. L. N., Thompson, S. L., Kang, H., Krechmer, J. E., Kimmel, J. R., Palm, B. B., Hu, W., Hayes, P. L., Day, D. A., Campuzano-Jost, P., Canagaratna, M. R., Jayne, J. T., Worsnop, D. R., and Jimenez, J. L.: Impact of Thermal Decomposition on Thermal Desorption Instruments: Advantage of Thermogram Analysis for Quantifying Volatility Distributions of Organic Species, Environ. Sci. Technol., 51, 8491–8500, https://doi.org/10.1021/acs.est.7b00160, 2017.
Stein, S. E. and Scott, D. R.: Optimization and testing of mass spectral library search algorithms for compound identification, J. Am. Soc. Mass Spectr., 5, 859–866, https://doi.org/10.1016/1044-0305(94)87009-8, 1994.
Thornton, J. A., Mohr, C., Schobesberger, S., D'Ambro, E. L., Lee, B. H., and Lopez-Hilfiker, F. D.: Evaluating Organic Aerosol Sources and Evolution with a Combined Molecular Composition and Volatility Framework Using the Filter Inlet for Gases and Aerosols (FIGAERO), Accounts Chem. Res., 53, 1415–1426, https://doi.org/10.1021/acs.accounts.0c00259, 2020.
Tikkanen, O.-P., Buchholz, A., Ylisirniö, A., Schobesberger, S., Virtanen, A., and Yli-Juuti, T.: Comparing secondary organic aerosol (SOA) volatility distributions derived from isothermal SOA particle evaporation data and FIGAERO–CIMS measurements, Atmos. Chem. Phys., 20, 10441–10458, https://doi.org/10.5194/acp-20-10441-2020, 2020.
Vogel, A. L., Schneider, J., Müller-Tautges, C., Klimach, T., and Hoffmann, T.: Aerosol Chemistry Resolved by Mass Spectrometry: Insights into Particle Growth after Ambient New Particle Formation, Environ. Sci. Technol., 50, 10814–10822, https://doi.org/10.1021/acs.est.6b01673, 2016.
Voisin, D., Smith, J. N., Sakurai, H., McMurry, P. H., and Eisele, F. L.: Thermal Desorption Chemical Ionization Mass Spectrometer for Ultrafine Particle Chemical Composition, Aerosol Sci. Technol., 37, 471–475, https://doi.org/10.1080/02786820300959, 2003.
Wang, D. S., Lee, C. P., Krechmer, J. E., Majluf, F., Tong, Y., Canagaratna, M. R., Schmale, J., Prévôt, A. S. H., Baltensperger, U., Dommen, J., El Haddad, I., Slowik, J. G., and Bell, D. M.: Constraining the response factors of an extractive electrospray ionization mass spectrometer for near-molecular aerosol speciation, Atmos. Meas. Tech., 14, 6955–6972, https://doi.org/10.5194/amt-14-6955-2021, 2021.
Wilson, J., Imre, D., Beránek, J., Shrivastava, M., and Zelenyuk, A.: Evaporation Kinetics of Laboratory-Generated Secondary Organic Aerosols at Elevated Relative Humidity, Environ. Sci. Technol., 49, 243–249, https://doi.org/10.1021/es505331d, 2015.
Witkowski, B., al-Sharafi, M., Błaziak, K., and Gierczak, T.: Aging of α-Pinene Secondary Organic Aerosol by Hydroxyl Radicals in the Aqueous Phase: Kinetics and Products, Environ. Sci. Technol., 57, 6040–6051, https://doi.org/10.1021/acs.est.2c07630, 2023.
Wong, C., Liu, S., and Nizkorodov, S. A.: Highly Acidic Conditions Drastically Alter the Chemical Composition and Absorption Coefficient of α-Pinene Secondary Organic Aerosol, ACS Earth and Space Chemistry, 6, 2983–2994, https://doi.org/10.1021/acsearthspacechem.2c00249, 2022.
Xu, L., Coggon, M. M., Stockwell, C. E., Gilman, J. B., Robinson, M. A., Breitenlechner, M., Lamplugh, A., Crounse, J. D., Wennberg, P. O., Neuman, J. A., Novak, G. A., Veres, P. R., Brown, S. S., and Warneke, C.: Chemical ionization mass spectrometry utilizing ammonium ions (NH CIMS) for measurements of organic compounds in the atmosphere, Atmos. Meas. Tech., 15, 7353–7373, https://doi.org/10.5194/amt-15-7353-2022, 2022.
Yang, L. H., Masayuki, T., Yunle, C., and Ng, N. L.: Characterization of thermal decomposition of oxygenated organic compounds in FIGAERO-CIMS, Aerosol Sci. Technol., 55, 1321–1342, https://doi.org/10.1080/02786826.2021.1945529, 2021.
Ylisirniö, A., Barreira, L. M. F., Pullinen, I., Buchholz, A., Jayne, J., Krechmer, J. E., Worsnop, D. R., Virtanen, A., and Schobesberger, S.: On the calibration of FIGAERO-ToF-CIMS: importance and impact of calibrant delivery for the particle-phase calibration, Atmos. Meas. Tech., 14, 355–367, https://doi.org/10.5194/amt-14-355-2021, 2021.
Zaytsev, A., Breitenlechner, M., Koss, A. R., Lim, C. Y., Rowe, J. C., Kroll, J. H., and Keutsch, F. N.: Using collision-induced dissociation to constrain sensitivity of ammonia chemical ionization mass spectrometry (NH CIMS) to oxygenated volatile organic compounds, Atmos. Meas. Tech., 12, 1861–1870, https://doi.org/10.5194/amt-12-1861-2019, 2019.
Zhang, X., McVay, R. C., Huang, D. D., Dalleska, N. F., Aumont, B., Flagan, R. C., and Seinfeld, J. H.: Formation and evolution of molecular products in α-pinene secondary organic aerosol, P. Natl. Acad. Sci. USA, 112, 14168–14173, https://doi.org/10.1073/pnas.1517742112, 2015.
Zhao, J., Häkkinen, E., Graeffe, F., Krechmer, J. E., Canagaratna, M. R., Worsnop, D. R., Kangasluoma, J., and Ehn, M.: A combined gas- and particle-phase analysis of highly oxygenated organic molecules (HOMs) from α-pinene ozonolysis, Atmos. Chem. Phys., 23, 3707–3730, https://doi.org/10.5194/acp-23-3707-2023, 2023.
Zhao, J., Mickwitz, V., Zhang, J., Alton, M., Canagaratna, M., Graeffe, F., Schobesberger, S., Worsnop, D., and Ehn, M.: Comparison of Gaseous and Particulate Highly Oxygenated Organic Molecules from the Ozonolysis of Terpenes, ACS ES&T Air, 1, 1294–1303, https://doi.org/10.1021/acsestair.4c00121, 2024a.
Zhao, J., Mickwitz, V., Luo, Y., Häkkinen, E., Graeffe, F., Zhang, J., Timonen, H., Canagaratna, M., Krechmer, J. E., Zhang, Q., Kulmala, M., Kangasluoma, J., Worsnop, D., and Ehn, M.: Characterization of the Vaporization Inlet for Aerosols (VIA) for online measurements of particulate highly oxygenated organic molecules (HOMs), Atmos. Meas. Tech., 17, 1527–1543, https://doi.org/10.5194/amt-17-1527-2024, 2024b.
Zuth, C., Vogel, A. L., Ockenfeld, S., Huesmann, R., and Hoffmann, T.: Ultrahigh-Resolution Mass Spectrometry in Real Time: Atmospheric Pressure Chemical Ionization Orbitrap Mass Spectrometry of Atmospheric Organic Aerosol, Anal. Chem., 90, 8816–8823, https://doi.org/10.1021/acs.analchem.8b00671, 2018.