the Creative Commons Attribution 4.0 License.
the Creative Commons Attribution 4.0 License.
 | 22 Oct 2025
Design and performance of the Cluster Ion Counter (CIC)
Rima Balbaaki
Hanna Elina Manninen
Paap Koemets
Eva Sommer
Birte Rörup
Yusheng Wu
Joao Almeida
Sebastian Ehrhart
Stefan Karl Weber
Joschka Pfeifer
Juha Kangasluoma
Markku Kulmala
Jasper Kirkby
A dilute plasma is continuously maintained in the troposphere by ionizing particle radiation from galactic cosmic rays and radon decay. Small ions in the 1–2 nm size range play an important role in atmospheric processes such as ion-induced nucleation of aerosol particles. Consequently, there is a need for precise and robust instruments to measure small ions both for atmospheric observations and for laboratory experiments that simulate the atmosphere. Here, we describe the design and performance of the Cluster Ion Counter (CIC, Airel OÜ), which measures the number concentrations of positively and negatively charged ions and particles below 5 nm mobility diameter simultaneously, with low noise and fast time response. The CIC is primarily designed as a robust, low-maintenance instrument prioritizing ease of operation and broad applicability, including laboratory experiments; long-term unattended field measurements; and mobile, airborne, and battery-powered setups. The main application of the device is to study the temporal development of total cluster ion concentrations while also providing some information about the ion mobility distribution. The detection efficiency is above 80 % for ions and charged particles between 1.2 and 2.0 nm and above 90 % between 2.0 and 3.0 nm. The ion concentrations measured by the CIC agree well with reference instruments. The noise level (1 σ of background measurements) is typically between 20 and 30 ions cm−3 at 1 Hz sampling rate and an airflow rate of 7 L min−1 per analyzer. The noise level improves when higher flow rates and longer sampling periods are used. The CIC responds rapidly, with 1 s time resolution, to pulses of ionization produced in the CLOUD chamber by a CERN particle beam.
- Article
(4217 KB) - Full-text XML
- BibTeX
- EndNote


Atmospheric ions are ubiquitous throughout the atmosphere, with ion pair concentrations in the troposphere ranging between a few 100 cm−3 at ground level (Hirsikko et al., 2011) up to around 2000 cm−3 in the tropopause. In the troposphere, primary ions of nitrogen and oxygen are generated by galactic cosmic rays and ionizing radiation from the decay of radon or other radioactive isotopes. The charge is rapidly transferred by molecular collisions to trace vapors of higher gas-phase acidity or proton affinity to form so-called “small ions”, which comprise both charged molecules and charged molecular clusters. The ion–ion recombination lifetime of small ions in the troposphere is around 10 min, but the actual lifetime may be shorter due to additional loss mechanisms such as scavenging by pre-existing particles, i.e., diffusion charging of aerosol particles. An early classification of air ions (Hõrrak et al., 2000) defined small ions (called cluster ions here) as those with mobility diameters below 1.6 nm, intermediate ions as those with mobility diameters between 1.6 and 7.5 nm, and large ions as those with mobility diameters between 7.5 and 20 nm. However, contemporary studies would classify air ions above the size of small ions as charged aerosol particles since they contain more than around 10 molecules and are effectively stable particles.
Despite their short lifetime, small ions play a key role in atmospheric electricity, clouds, and climate. The drift of small ions in the electric field between the ionosphere and Earth's surface gives rise to a continuous fair-weather current density of 2 pA m−2 flowing through the global electrical circuit (Rycroft et al., 2012). Under certain conditions, ions can enhance 10- to 100-fold the nucleation rate of aerosol particles, which may then grow by condensation of ambient low-volatility vapors to sizes where they become cloud condensation nuclei (Kirkby et al., 2011, 2016, 2023). Ions and charged aerosol particles may also directly affect cloud microphysical processes and, in turn, climate (Carslaw et al., 2002; Harrison and Carslaw, 2003; Tinsley, 2008; Harrison and Ambaum, 2008).
Early indications that free ions existed in air were inferred from the decay of charge from gold-leaf electroscopes. By these means – and only 3 years after Joseph John Thomson discovered the electron – Charles T. R. Wilson calculated that 20 ion pairs cm−3 s−1 were being continuously produced in the air (Wilson, 1900). This remarkable precision is within a factor of 2 of the total ionization rate near the surface as a result of galactic cosmic rays and natural radioactivity, which were unknown at the time. The original electronic instrument to measure air ion concentrations (air conductivity) was an aspiration counter developed in the early 1900s by Ebert (1901) and Gerdien (1905). The same era witnessed various designs of aspiration counters, first-order differential counters, second-order differential counters, and counters with several collecting electrodes. A detailed description of these counters and the history of their development can be found in Tammet (1970) and Flagan (1998).
The principle of operation of the aspiration counter is illustrated by the aspirated coaxial cylinder condenser (Flagan, 1998). As the name suggests, this instrument consists of two concentric cylindrical electrodes, a device to draw in air (an aspirator, a fan, or a pump) and an electrometer. One of the electrodes is connected to a voltage source to create an electric field between the inner and outer electrodes. As air is drawn through the device, the ions drift towards the collecting electrode of opposite polarity and strike it. The ion number concentration is determined from the flow rate and the current passing from the collecting electrode to ground, which is measured with a sensitive electrometer. The geometric design of the device, the operational voltage, and the flow rate determine the range of electrical mobilities of the air ions that are collected and, thus, their size range.
Subsequent designs of aspiration counters have developed automatic data recorders, programmable control systems, improved flow control, better electrometer signal-to-noise ratios, and higher time resolutions (Moody, 1984; Aplin and Harrison, 2000; Grabarczyk, 2001; Harrison and Wilding, 2005; Nicoll and Harrison, 2008; Kubásek et al., 2009).
While recent air ion counters have progressed considerably beyond early designs, several limitations persist. One notable limitation of many devices is their inability to detect positive and negative ions simultaneously. Although some instruments are capable of detecting both ion polarities, these measurements are typically sequential rather than concurrent. Furthermore, there is a general lack of proper laboratory verification of the instrument's detection efficiency and the mobility ranges of the collected ions. Another challenge is the high fixed flow rate of most devices, which is a problem for laboratory experiments with restrictions on maximum flow rates. Furthermore, the simple cylindrical design of many current devices makes integration into experimental setups difficult and limits their compatibility with space constraints of typical measurement containers. Moreover, long-term air ion monitoring and atmospheric research require high-precision instruments with low noise and fast time responses, and this performance is not provided by the basic handheld devices that predominate in the commercial market.
Here, we describe the design and performance of a novel air ion counter – the Cluster Ion Counter (CIC, Airel OÜ) – that addresses the limitations outlined above. Its design builds on the earlier ion counters developed at Tartu University since the 1950s (Matisen et al., 1992). The key design requirements are improved time resolution, reduced ion losses, and higher sensitivity at low flow rates.
CICs have already been deployed for continuous long-term monitoring at several atmospheric research stations, including SMEAR II (Hyytiälä, Finland), SMEAR Estonia (Järviselja), the Ny-Ålesund Research Station (Svalbard), and Concordia Station (Dome C, Antarctica). Among the initial publications from these deployments, Kulmala et al. (2024) reported on CIC measurements at SMEAR II covering 2 and a half months.
We will first present the theoretical principles and design of the CIC. We will then describe the calibration of the CIC in the laboratory and its performance at the CERN CLOUD chamber, where it has been in operation since 2018.
2.1 Instrument design
The CIC measures the number concentrations of positive and negative air ions simultaneously. It comprises two independent cylindrical differential mobility analyzers, each with three collecting electrodes (Figs. 1 and 2). The ions in the air entering the analyzers are repelled by a central electrode, which is held at a fixed potential between −40 and 40 V. A switchable high-voltage electrical inlet filter is used to prevent ions from entering the analyzer during zero-point measurements. Charged particles deposit on the outer wall of the analyzer, which is divided into three independent collecting electrodes. The current flowing through each electrode is measured with a high-precision integrating electrometer that samples and digitizes the current at up to 30 Hz. The inlet of the analyzer has been designed to minimize ion losses from diffusion and stray electric fields. A flow meter and blower at the exit of each analyzer control the flow rate of the air drawn through the instrument.
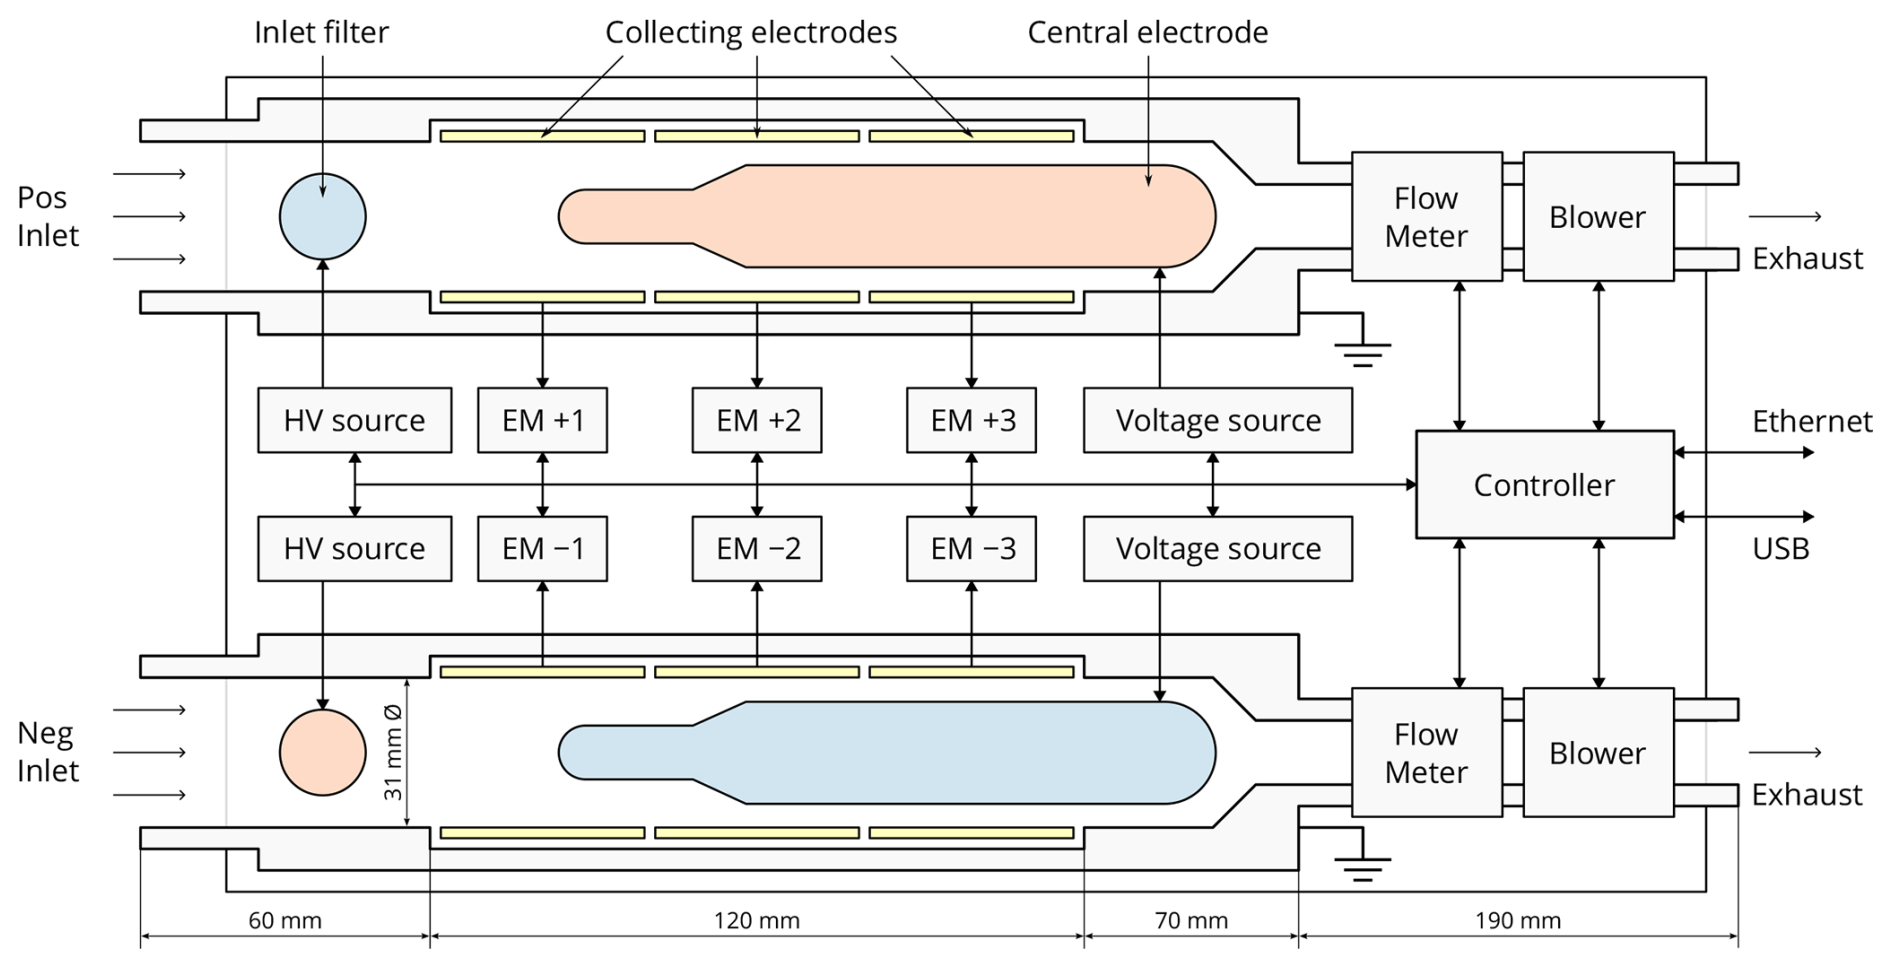
Figure 1Cross-section and schematic of the Cluster Ion Counter (CIC). The CIC has two identical analyzers to measure positive ions and negative ions simultaneously. Each analyzer has three collecting electrodes which measure different ranges of mobility diameters. Red shading indicates positive polarity, and blue indicates negative polarity. The typical central electrode voltages at 30 L min−1 sample flow are ±19.5 V. The inlet filters are switched to ±300 V during zero measurements.
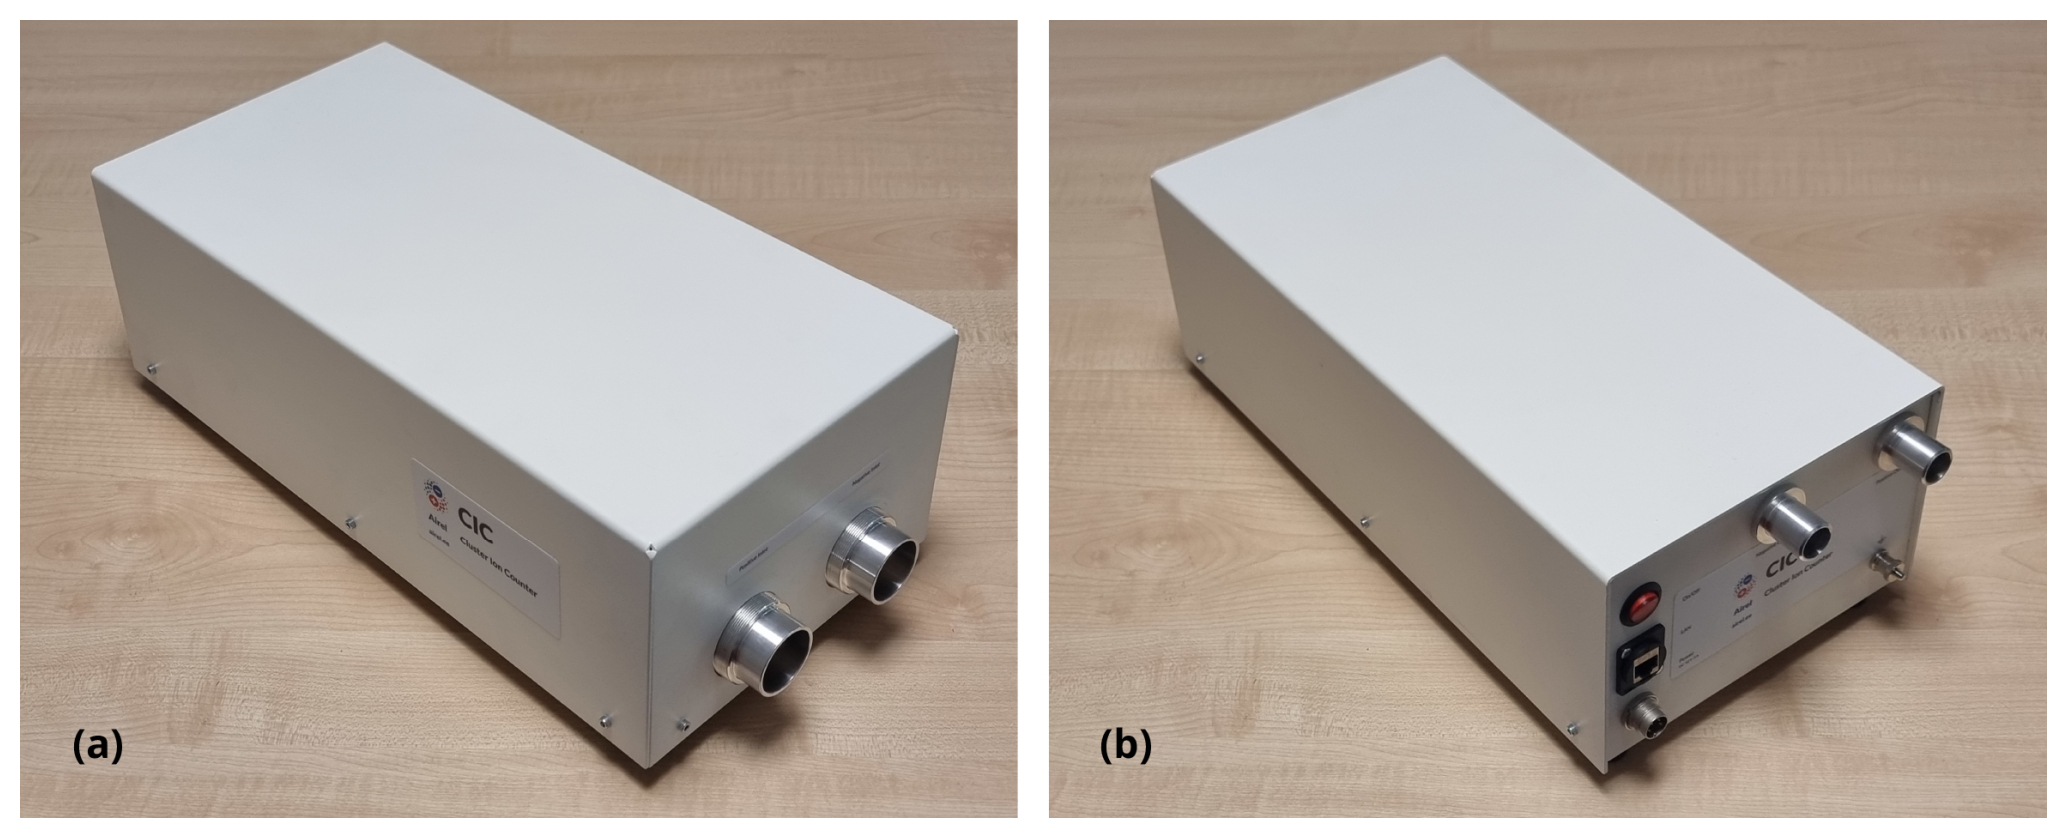
Figure 2Photos of the CIC. The front view (a) of the CIC showing the two inlets with 35 mm outer diameter and the back view (b) showing the outlets, power, and communication connections. All the components shown in the Fig. 1 schematic are located inside this housing. The dimensions of the CIC are 200 mm width, 130 mm height, and 400 mm length.
The geometry of the analyzer has been chosen so that, for 10 L min−1 flow rate and 6.5 V voltage on the central electrode, the limiting mobilities of the three collecting sections are 2.5, 0.5, and 0.25 cm2 V−1 s−1. As can be seen from numerical modeling results performed using COMSOL Multiphysics® (Fig. 3), ideally, all ions with a mobility of z > 2.5 cm2 V−1 s−1 (dp < 0.9 nm) are deposited onto the first electrode, those with a mobility of z > 0.5 cm2 V−1 s−1 (dp < 2.0 nm) are deposited onto the first and second electrodes, and those with a mobility of z > 0.25 cm2 V−1 s−1 (dp < 2.8 nm) are deposited onto the first, second, and third electrodes.
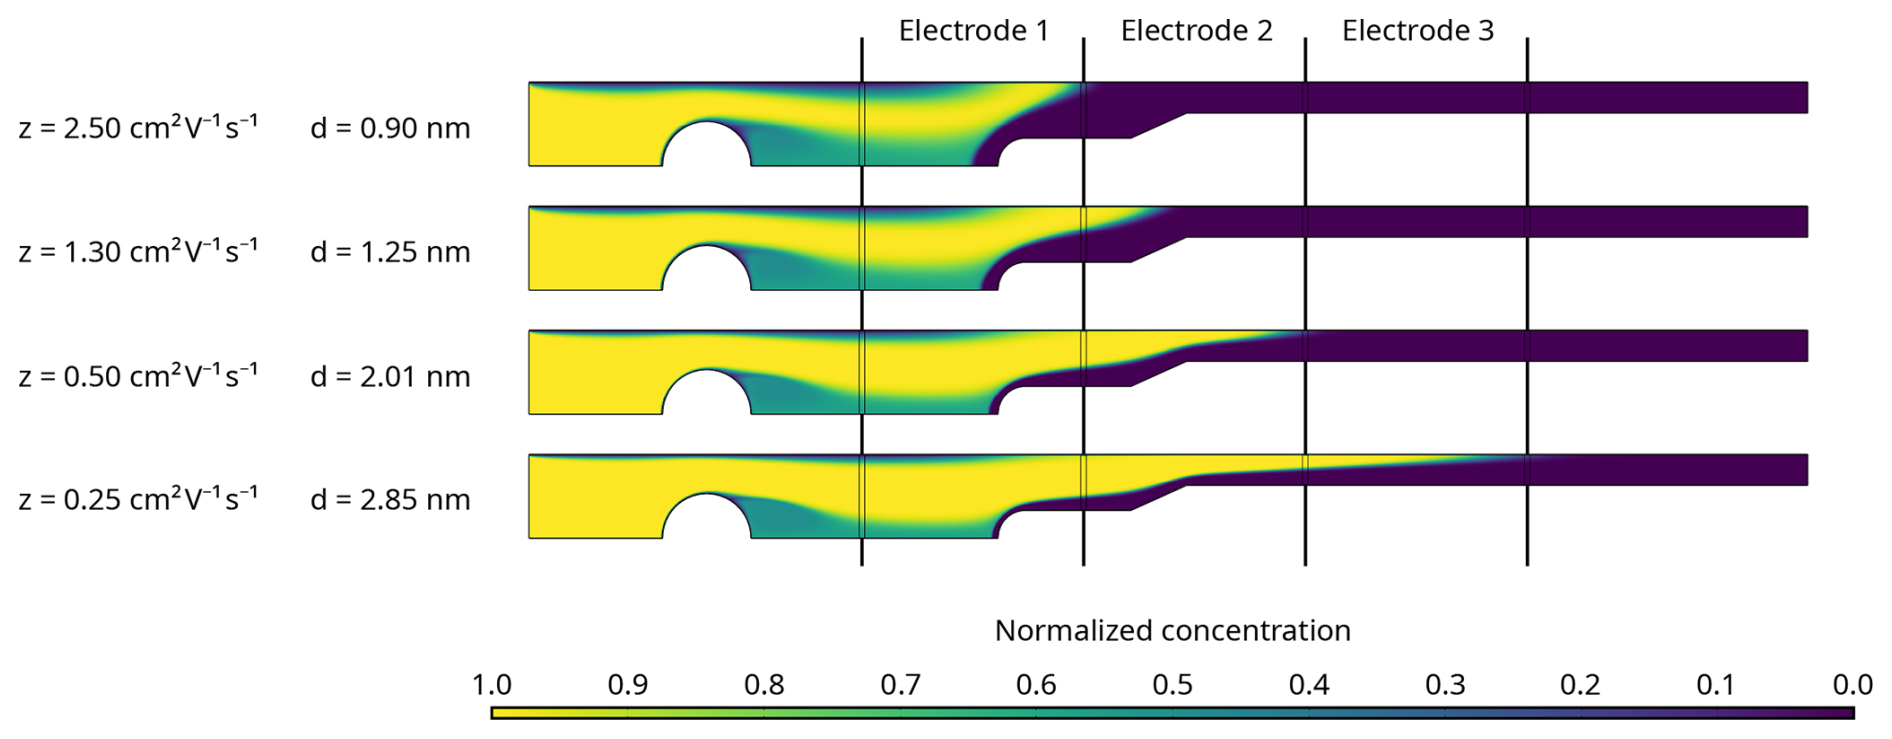
Figure 3Simulated flow patterns for singly charged ions and particles. Normalized concentration of singly charged positive ions and particles of various diameters inside the CIC according to numerical model simulations performed using COMSOL Multiphysic®. The airflow rate is 10 L min−1, the central electrode is at 6.5 V, and the inlet filter is at 0 V.
Figure 4 shows the theoretical transfer functions for the CIC analyzer based on a simple general model of a first-order differential mobility analyzer. This does not take into account diffusional and electrical losses, diffusional dispersion, and airflow characteristics caused by specific inlet configurations or mechanical imperfections. The data analysis uses experimentally determined transfer functions, which are broader and flatter than those predicted by the simple theoretical model. The electrodes do not have a sharp lower cut-off limiting mobility. Due to the absence of a sheath airflow, electrodes will always detect a small fraction of larger particles with low mobility that enter the analyzer close to the collecting electrode. The limiting mobilities are primarily determined by the geometry of the analyzer and the ratio between airflow rate and central electrode voltage. The airflow rate through the CIC can be set by software to values between 5 and 50 L min−1 per analyzer. The central electrode voltages are automatically adjusted so that the ratio (and, consequently, the limiting mobilities of the collecting electrodes) remains constant. The first two channels of the CIC are designed to capture overlapping portions of the complete typical atmospheric cluster ion mobility band. This allows for a rough estimate of the average cluster ion mobility based on the balance of the signal between the two channels. The third channel is designed to capture only larger ions beyond the cluster band, i.e., above 2 nm mobility diameter. This allows the CIC to measure the cluster ion concentrations with a sharp cut-off mobility range between 0.5 and 0.25 cm2 V−1 s−1 by estimating the signal contributed by larger particles using the signal from the third electrode and subtracting this from the summed signal of the first two electrodes.
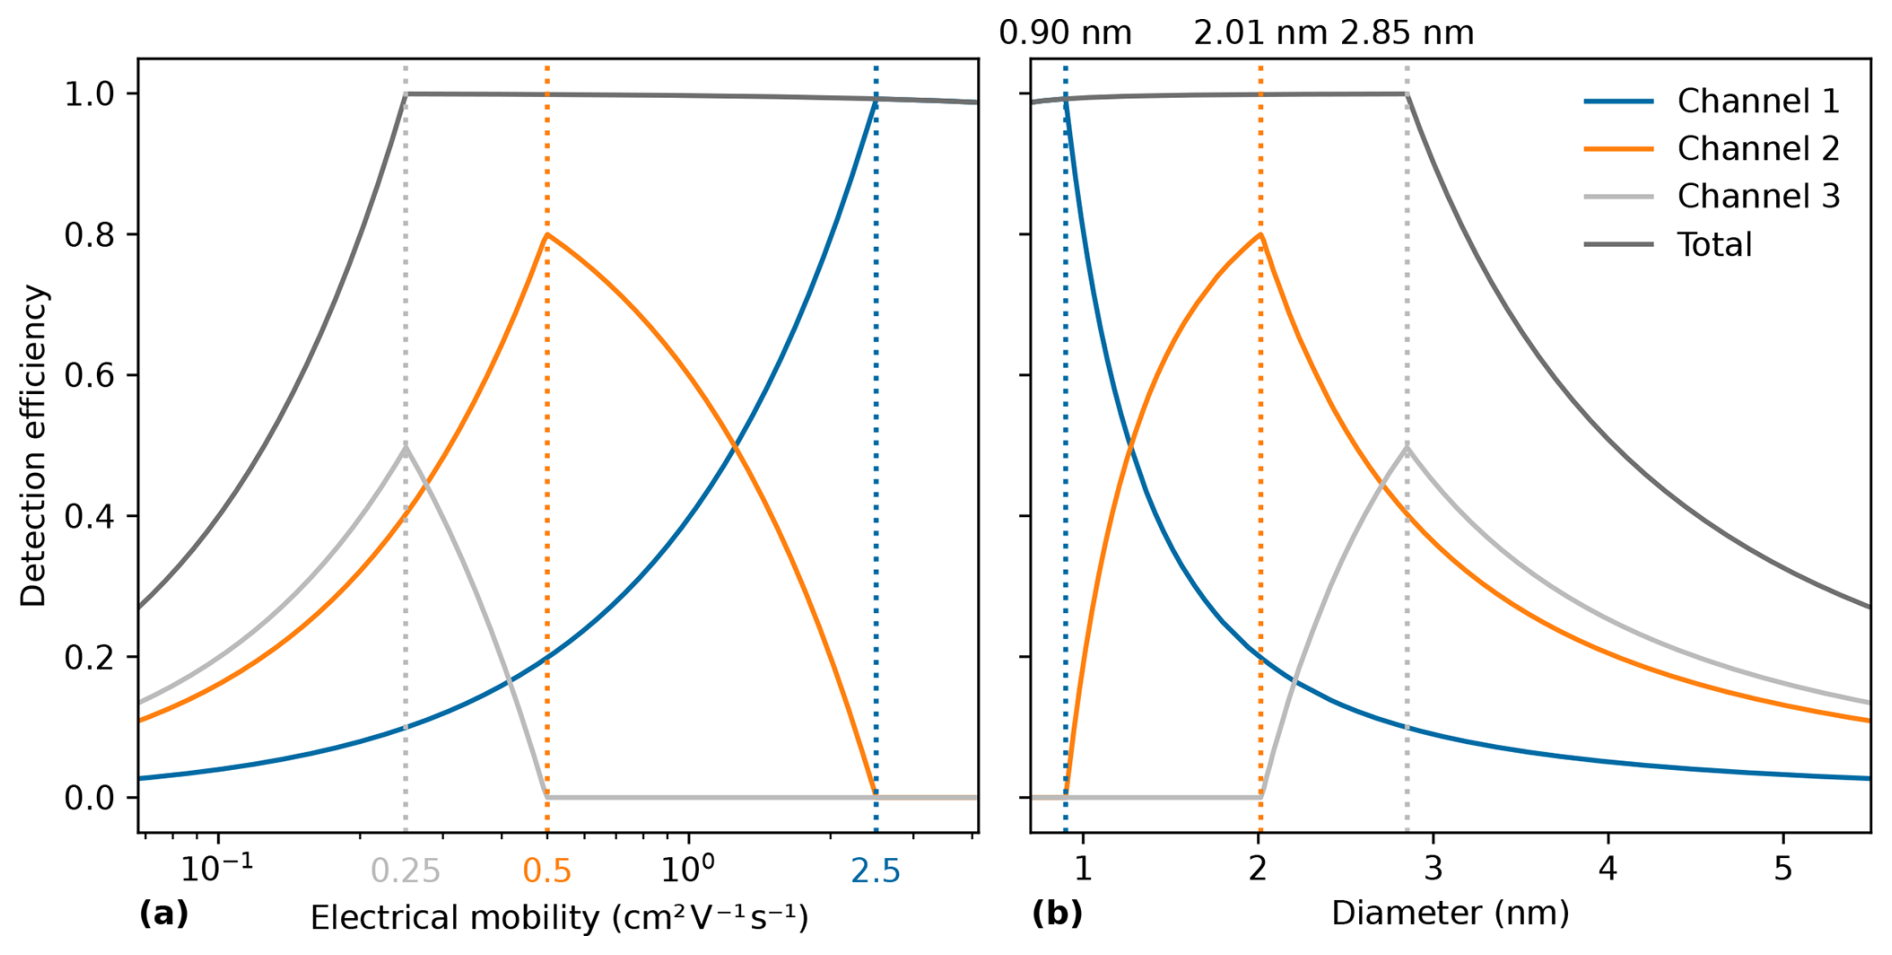
Figure 4Theoretical detection efficiencies of the three collecting electrodes versus diameter and electrical mobility. Theoretical transfer functions of the three collecting electrodes, without considering ion diffusion losses, versus (a) electrical mobility and (b) mobility diameter. The detection efficiency indicates the ion flux reaching the collecting electrodes relative to the flux that enters the CIC. The electrical mobilities of peak collection efficiency in the three sections are 2.5, 0.5, and 0.25 cm2 V−1 s−1, which correspond to mobility equivalent diameters of 0.90, 2.01, and 2.85 nm. The summed response of the three collecting electrodes (red line) is calculated to provide a high and uniform detection efficiency for mobility diameters between 0.8 and 2.8 nm. The ratio of the central electrode voltage to airflow rate in a single analyzer is 6.5 V 10 L min−1 = 0.65 V min L−1.
The measurement of small currents (typically 1–10 fA) generated by air ions is demanding and causes many problems related to changes in temperature, relative humidity, turbulence, and electromagnetic noise in ambient conditions. The design of the electrometers and the data acquisition electronics, as well as the signal processing algorithms, of the CIC are identical to those of the Neutral cluster and Air Ion Spectrometer (NAIS; Mirme, 2011; Mirme and Mirme, 2013). The design has proven its performance, robustness, and reliability in many instruments operating in a wide range of demanding environmental conditions, some continuously for over 2 decades.
Each collecting electrode of the CIC is connected to its own dedicated, low-noise, integrating electrometer. The electric current produced by the depositing ions is accumulated on a capacitor (typically 33 pF) in an integrator circuit using a low-input-current operational amplifier (LMC6042). The output voltage of the electrometer, which is proportional to the accumulated charge, is periodically measured by a 24-bit analog-to-digital converter. The average electric current is calculated from the rate of change of the voltage. Since ion current collection is continuous and independent of the analog-to-digital converter's sampling frequency, the integration time can be optimized based on the desired signal-to-noise ratio and time resolution. To prevent saturation, the capacitor is automatically discharged and reset to zero volts when the electrometer output voltage reaches a threshold, typically ±1 V. This reset causes a brief 5 to 10 s gap in the measurements, occurring usually once every hour to once every day. The low ion losses and high measurement rate of the electrometers allow the instrument to achieve a very fast time resolution, above 1 Hz.
The CIC employs a switchable high-voltage electrical inlet filter to block ions from entering the analyzer during calibrations of zero-level currents and noise levels of the electrometers. While the data acquisition electronics are designed for minimal temperature sensitivity, some thermal drift is unavoidable and needs to be corrected. An additional and significant factor influencing the zero-level currents, especially during long-term measurements, is the gradual contamination of the collecting electrodes and insulators. This contamination can lead to leakage currents, which can be exacerbated by high relative humidity. Performing frequent zero measurements compensates for these combined drift and leakage currents. This ensures the reliability of the measurements, extends the intervals between necessary physical maintenance (cleaning of the analyzer), and provides a clear diagnostic indicator when such maintenance is required. This periodic zero-level calibration, or so-called “offset” measurement, is carried out automatically by the device. The user-selectable settings are typically 1–5 min of signal measurements followed by 20–30 s of offset measurements.
The inlet filter is a brass sphere of 15 mm diameter, supported by two small, diametrically placed spokes and set to a voltage of around −300 or +300 V for the positive or negative channel, respectively. Although the spokes and the sphere itself inevitably result in flow separation and circulation behind the sphere, the computational fluid dynamics (CFD) model suggests that the effect is localized and does not extend downstream into the mobility analysis region, where the flow remains laminar. Alternative inlet filter designs, such as a mesh with an applied voltage, were evaluated, but the spherical inlet filter was selected because it demonstrated the lowest particle losses.
The CIC uses internal Venturi flow meters and blowers independently for both analyzers in a software-controlled feedback loop to maintain constant sample airflow rates. Temperature, relative humidity, and absolute air pressure are also monitored for both airflows. The central electrode voltages are supplied by a bipolar software-controlled voltage source, which allows each analyzer to operate at a freely chosen voltage and polarity. To confirm correct operation of the device, all relevant parameters from the different subsystems are monitored and logged alongside the measurement data. A graphical measurement software (Spectops) is provided for monitoring, controlling, and storing measurement and diagnostic data from the CIC. A quick-view program (Retrospect) can be used to review the stored data files.
Compared with earlier instruments developed at the University of Tartu, such as the NAIS or the Balanced Scanning Mobility Analyzer (BSMA; Tammet, 2006), the CIC features a simpler design. While it does not match the sensitivity of the BSMA or provide the detailed sizing information of the NAIS, the CIC offers several advantages over these more complex instruments. Notably, the CIC can operate at low sample flow rates that are unachievable by the BSMA. Compared with the NAIS, the CIC has a higher detection efficiency and a shorter inlet tract, allowing for more reliable measurement of small ions at a higher time resolution and with a lower mobility diameter cut-off.
The external dimensions of the CIC are 200 mm width, 130 mm height, and 400 mm length. The weight of the instrument is 5 kg. The power consumption is 4–5 W at 30 L min−1 sample flow rate per analyzer.
2.2 Parameters measured by the CIC
2.2.1 Number concentration of small ions
Ion number concentrations are calculated from the current on each of the three collecting electrodes, which is proportional to the ion deposition rate. The current I (A) measured by each electrode is related to the sampled ion concentration N± (ions cm−3) as follows:
where n is the average number of elementary charge units per ion (assumed to be unity), e = C is the elementary unit of charge, and Qs (cm3 s−1) is the volumetric sample flow rate passing the electrode. The summed signal from the three electrodes in each analyzer, together with Eq. (1), provides the total concentration of positive and negative ions below 5 nm diameter.
2.2.2 Mobility diameter of small ions
Electrical mobilities of ions and charged particles can be converted into particle diameters through the Millikan–Fuchs relation:
as described in Mäkelä et al. (1996) and also Ku and de la Mora (2009), where Zp is the electrical mobility, n is the number of elementary charges, e is the elementary charge, Cc is the Cunningham slip correction factor, η is the dynamic viscosity of gas, and dp is the particle diameter. At these small sizes, all particles can be assumed to be singly charged.
2.2.3 Air conductivity
The conductivity of air is mostly due to ions with the highest electrical mobility, i.e., small ions. However, larger charged particles also contribute. According to a long-term study in Hõrrak (2001), small ions were responsible for 96.3 % of the total conductivity of air. Thus, the small-ion concentrations N+ and N− measured by the CIC can provide a measurement of the polar conductivities of air λ+ and λ− by means of the following equations:
where Z± is the mean electric mobility measured by the CIC, and e is the elementary charge (Hirsikko et al., 2011).
2.3 Experimental methods used to evaluate the performance of the CIC
Experimental evaluations of the CIC have been carried out in several aerosol laboratories: at the Institute for Atmospheric and Earth System Research (INAR), University of Helsinki; at the CERN CLOUD chamber, Switzerland; at the Laboratory of Atmospheric and Environmental Sciences, University of Tartu; and at Airel OÜ, Tartu.
At INAR, the University of Tartu, and Airel, the calibration aerosol was generated and size-selected in fixed, ultra-dry conditions. Maintaining a dry environment during calibration experiments is crucial for stable aerosol generation. At CERN, the calibration aerosols were nucleated and grown from various atmospherically relevant vapors in the CLOUD chamber (Kirkby et al., 2023), the contents of which were continuously sampled by a suite of instruments that included the Airel CIC and the Neutral cluster and Air Ion Spectrometer. The calibrations at INAR supported ion cluster experiments performed at CLOUD. Thus, in both locations, the sampling line was the same as that used at CLOUD, which included a Y splitter for connection to the CLOUD sampling probe. On the other hand, at the University of Tartu and at Airel, the CIC was calibrated without a CLOUD-specific inlet, thereby providing measurements that are more applicable to general operation.
2.3.1 Calibration of ion number concentrations and mobility diameters
At the University of Tartu and at Airel, ions were generated using a tungsten glowing-wire source operating at nitrogen flow rates from 1.5 to 4.0 L min−1. The sample was neutralized using a soft X-ray source, and particles were size-selected using a Vienna-type DMA (Uin et al., 2006) built at the University of Tartu. Two sets of experiments were conducted. The first set measured the experimental detection efficiency of the three channels of the CIC and was carried out at a fixed flow rate of 30 L min−1. The second set investigated the influence of varying the CIC flow rate on detection efficiency, with experiments performed at sampling flow rates ranging from 10 to 50 L min−1.
Calibration experiments at INAR measured the linearity of the CIC response to small ions between 0.9 and 2.5 nm. Small ions were also generated with a tungsten-wire aerosol generator operated at 17 L min−1 nitrogen flow (Kangasluoma et al., 2015). The generated particles were size-selected with a Herrmann-type high-resolution DMA (HDMA). Prior to the mobility selection, the sample was neutralized with an 241Am radioactive source.
The CIC was operated with a constant flow rate of 7.0 L min−1 per analyzer. The reference for the number concentration was provided by a TSI Electrometer 3068B at 2.5 L min−1 sample flow rate and ±1 fA current accuracy (±150 ions cm−3). The measured concentrations were corrected for diffusional losses in the sampling lines (Gormley and Kennedy, 1948).
Due to the absence of parallel composition measurements, we cannot determine the exact chemical composition of the ions used in these experiments. However, based on the findings of Kangasluoma et al. (2015), who chemically characterized the ions produced by a tungsten glowing-wire generator, the ions detected in the negative-polarity channel are likely to be WxOy clusters associated with charge carriers from the neutralizer or some impurities from the neutralizer (Fernández de la Mora et al., 2003). In the positive-polarity mode, the ions are more likely to be organic species or organic compounds clustered with tungsten oxide. It is important to note that the glowing-wire generator was not selected to probe the CIC's sensitivity to metal clusters or specific chemical species. Rather, it was chosen for its operational robustness and proven ability to generate nanoparticles over a broad size range and at high number concentrations (Peineke et al., 2006).
2.3.2 Evaluation of instrument background and time response
Experiments at the CERN CLOUD chamber provided measurements of the CIC background and time response. The CIC background, i.e., finite electrometer signals when no ions are present in the sampled air, was measured during periods when a high voltage was applied to electrodes inside the CLOUD chamber, which sweeps out small ions in less than 1 s. The time response of the CIC was evaluated using the pion beam from the CERN Proton Synchrotron, which arrives in short pulses of 0.4 s duration separated by around 30 s.
3.1 Detection efficiency in sub-5 nm diameter range
We measured the detection efficiencies of the CIC for 1.2–5.0 nm positive and negative ions for each of the three collecting electrodes, as well as a sum of all three electrodes (Fig. 5). The total ion detection efficiency exceeds 80 % between 1.2 and 2.0 nm mobility diameter and 90 % between 2.0 and 3.0 nm mobility diameter. The detection efficiency decreases above 3.0 nm, which provides a natural cut-off for the CIC outside the range of small ions. The close agreement between the experimental transfer functions and those derived from a simple theoretical model, which neglects the specific flow field inside the instrument, indicates that the effects of flow disturbance from the inlet filter sphere and other mechanical imperfections are not critical to the device's operation.
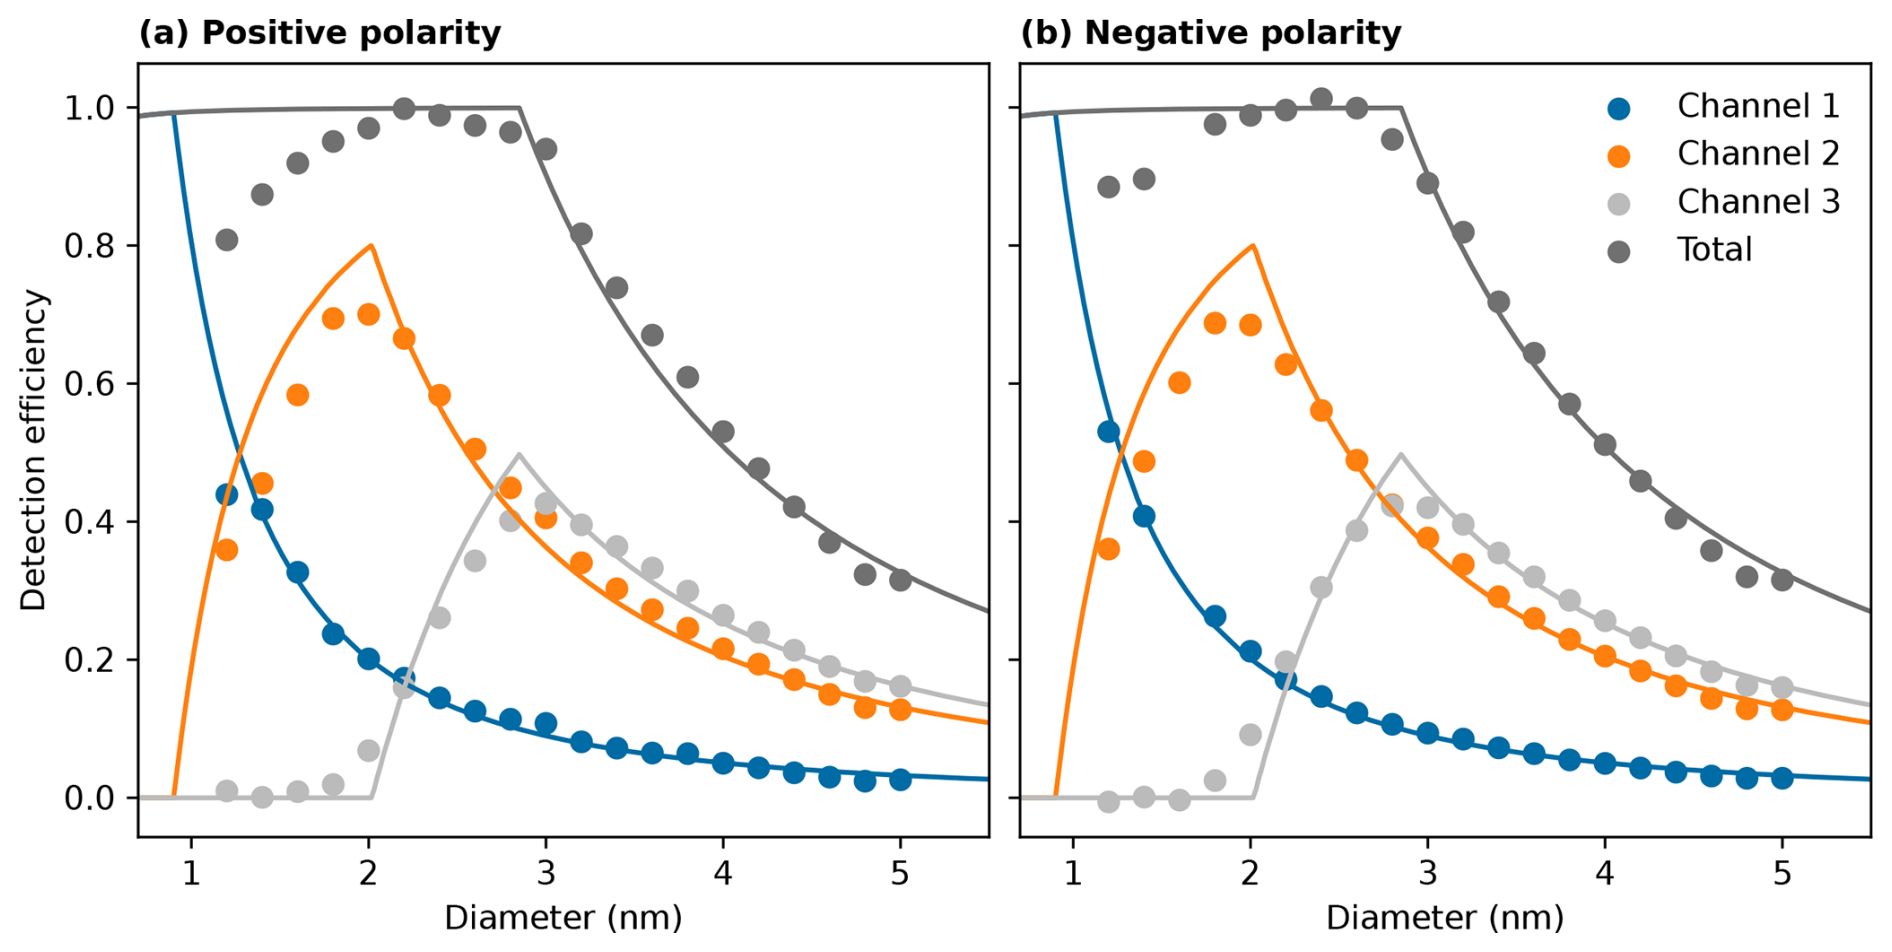
Figure 5Experimental detection efficiencies for the three collecting electrodes versus particle diameter and polarity. Experimental detection efficiencies for 1.2–5.0 nm (a) positive and (b) negative ions and charged particles for each of the three collecting electrodes and for the sum of all three electrodes. The lines correspond to the theoretical model predictions. The discrepancy at small diameters between the measurements and the model is due to diffusion losses inside the instrument, which are ignored in the simulation.
We also investigated the influence on ion detection efficiency of various CIC sample flow rates at 10, 30, and 50 L min−1 (Fig. 6). The higher sample flow rates produce mild increases in the detection efficiency below 3.0 nm and slight decreases for larger particles. Since higher flow rates provide an improved signal-to-noise ratio, it is generally preferable to use the maximum sample flow rate within the constraints of the experimental setup. If the sampling inlet includes bends or a Y splitter then the choice of optimum flow rate also needs to take into account turbulence at high flow rates, which leads to additional losses.
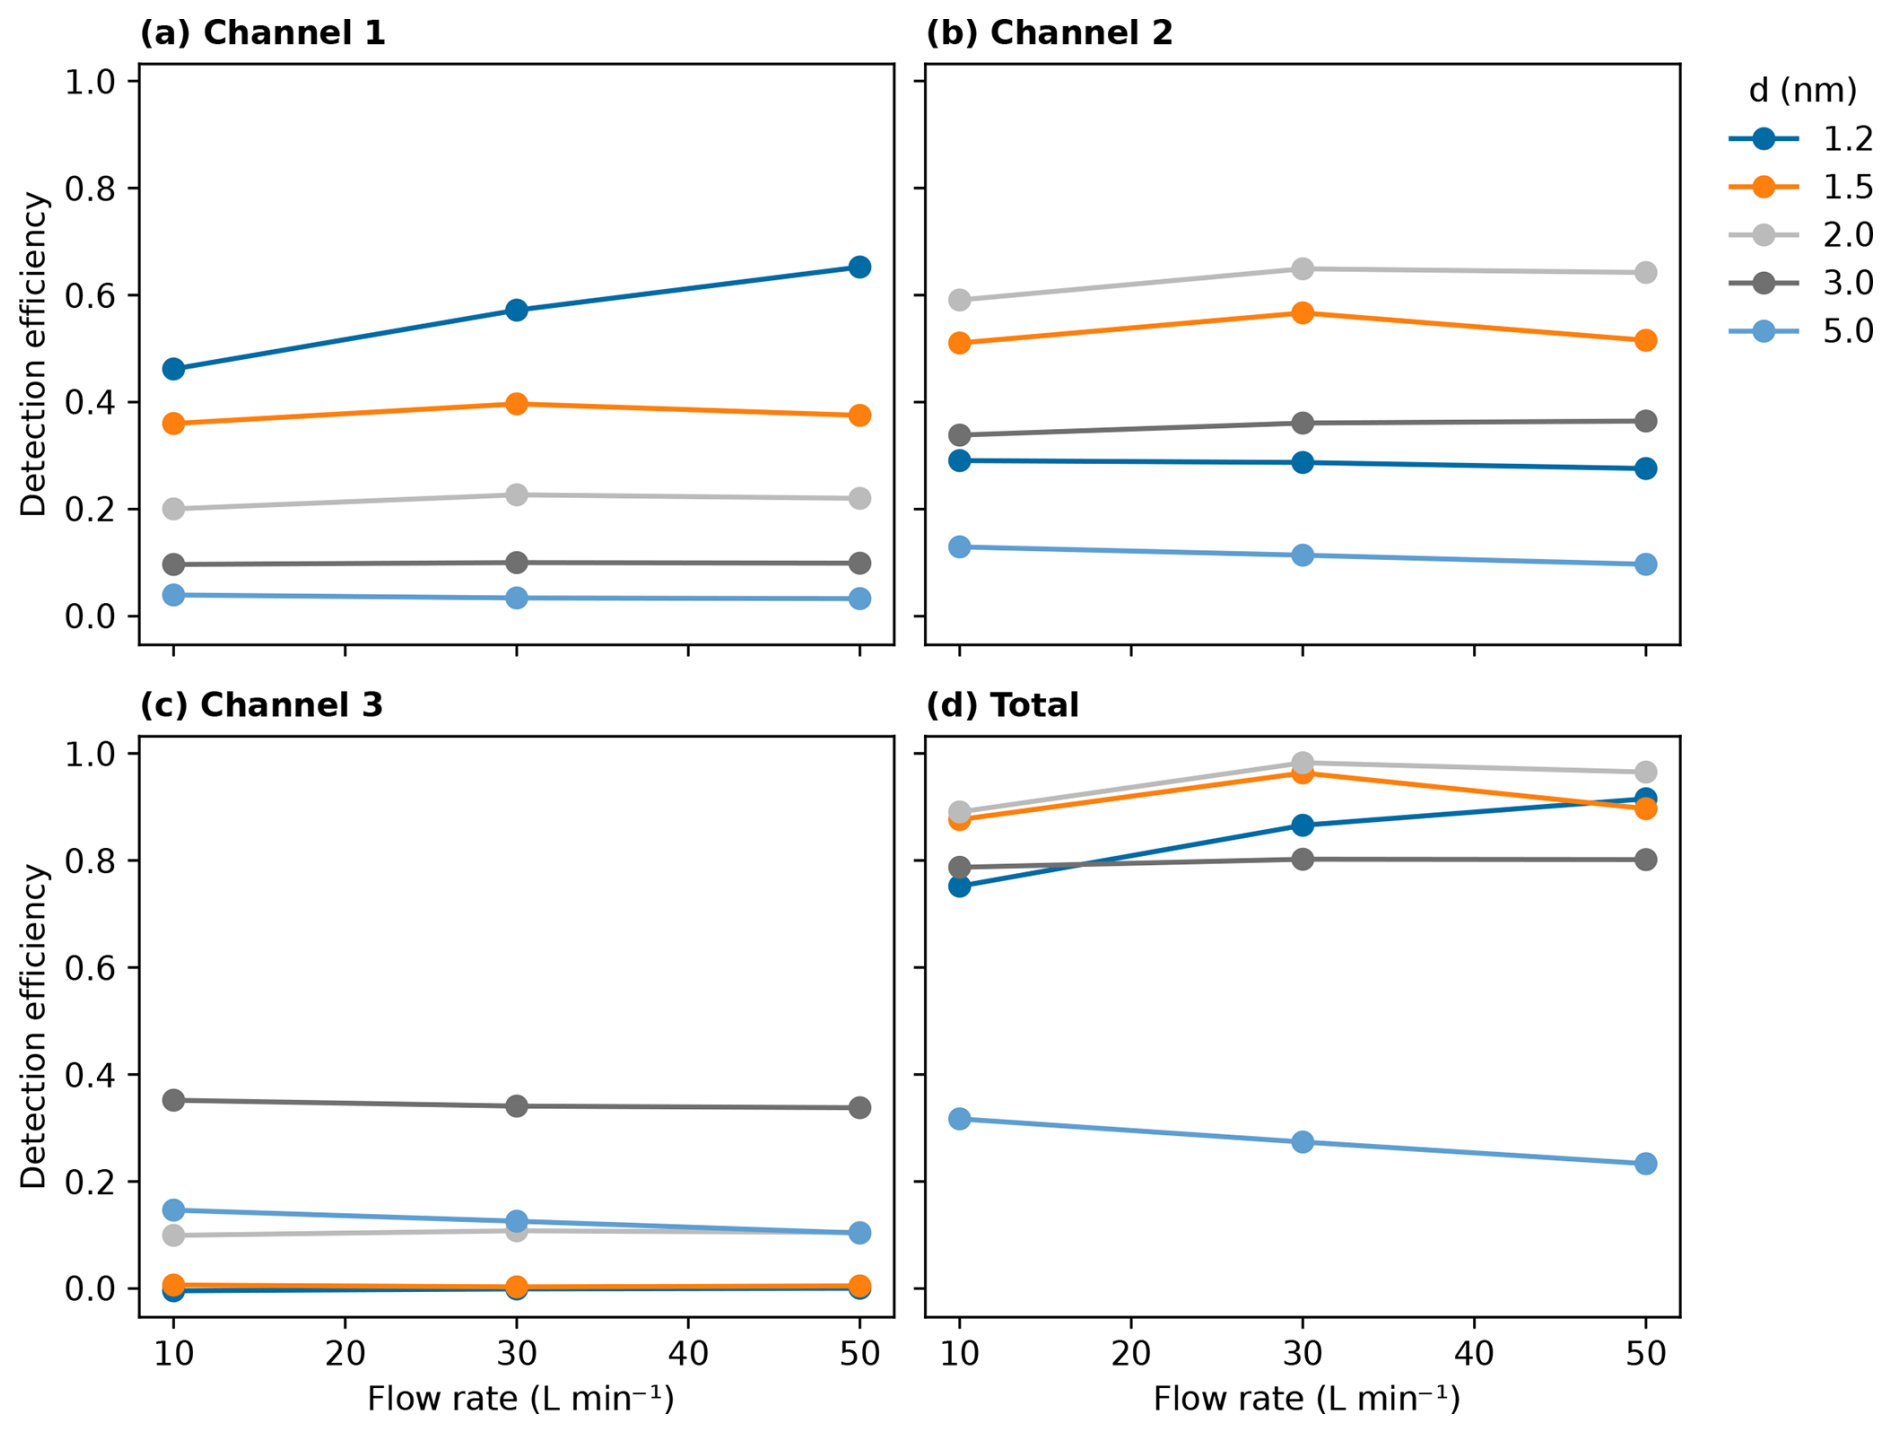
Figure 6Experimental detection efficiencies versus flow rate. Counting efficiency versus CIC sample flow rate of one analyzer (half of the total sample flow rate) for charged particles of various mobility diameters measured in (a) channel 1, (b) channel 2, and (c) channel 3 and (d) summed channels 1–3. The ratio of the central electrode voltage to airflow rate in a single analyzer is kept at 0.65 V min L−1 to maintain a constant transfer function for each channel. The CIC can operate with high detection efficiency down to 10 L min−1 flow rate.
3.2 Linearity of the CIC response
Figure 7 shows calibration measurements made with charged tungsten particles and the HDMA setup in the sub-5 nm size range. We compared the ion concentrations measured by the CIC with those of a reference electrometer. The linearity was measured for 0.9, 1.5, and 2.3 nm positive ions and for 0.9, 2.1, and 2.9 nm negative ions. In all cases, the response was linear for ion concentrations between 102 and 105 cm−3. These laboratory calibrations included the same Y splitter on the inlet as used at the CLOUD experiment, which introduces additional losses. Therefore, the CIC efficiency cannot be directly inferred from these data. In addition to demonstrating excellent linearity, these measurements show that the CIC can be operated reliably in environments ranging from pristine to highly polluted, i.e., aerosol number concentrations of up to 105 cm−3.
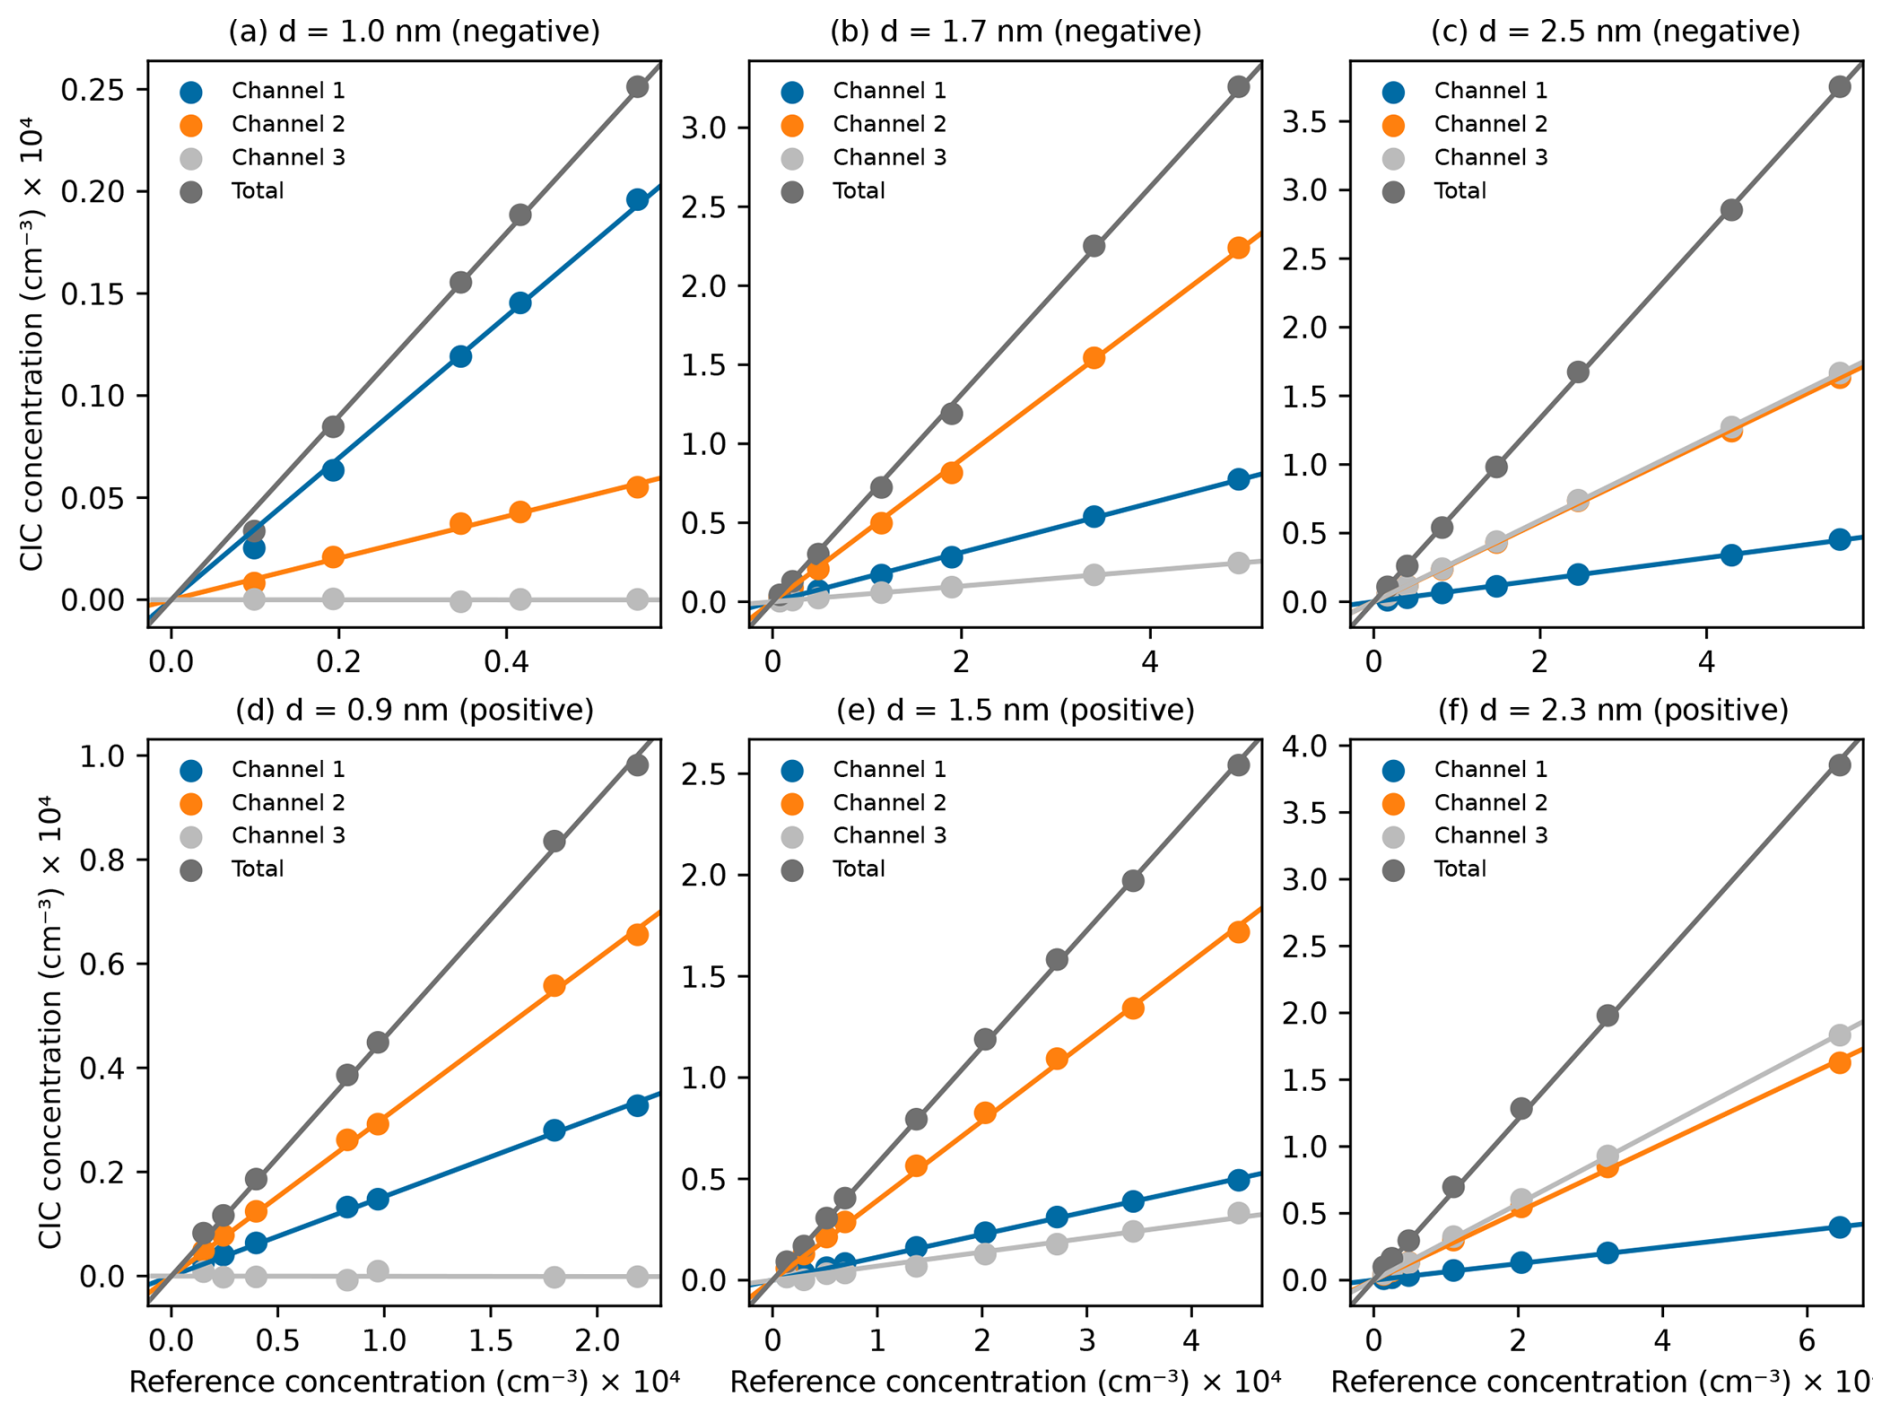
Figure 7Calibration of the CIC linearity. Concentrations of ions and charged particles measured by the CIC versus reference electrometer concentrations for negative particles of diameter (a) 1.0 nm, (b) 1.7 nm, and (c) 2.5 nm, and positive particles of diameter (d) 0.9 nm, (e) 1.5 nm, and (f) 2.3 nm. The four lines in each panel correspond to channel 1 (blue), channel 2 (orange), channel 3 (green), and summed channels 1–3 (red). The data show excellent linearity and low noise for the CIC. The efficiency of the CIC cannot be inferred from these measurements since they were performed with an additional inlet that reduced the overall detection efficiency.
3.3 CIC noise level
When the CIC measures in ion-free conditions, a small background ion concentration is always recorded due to unavoidable electronic noise in the electrometers. This sets a threshold ion concentration below which the CIC is unable to provide useful measurements. Figure 8 and Table 1 summarize CIC measurements at CLOUD when the electric clearing field is present, i.e., when all ions are swept from the chamber in less than 1 s. The CIC sampled the chamber air with a flow rate of 7.0 L min−1 per analyzer, with an uncertainty of ±5 %. Under these conditions and for 1 s integration time, the median value of the instrument background for the ion concentration is below ±5 cm−3 (±0.1 fA). The 25th and 75th percentiles are below ±20 cm−3 (±0.4 fA). The 5th and 95th percentiles are between ±20 and ±50 cm−3 (±0.4 … ±0.9 fA). The standard deviation ranges from 18 to 35 cm−3 (0.35 to 0.65 fA), with a median at 26 cm−3 (0.48 fA). Lower noise levels can be reached by averaging signals over times longer than 1 s or by using higher sample flow rates. This instrument background is excellent and substantially smaller than most previous air ion spectrometers or electrometers that are commonly used as reference instruments.
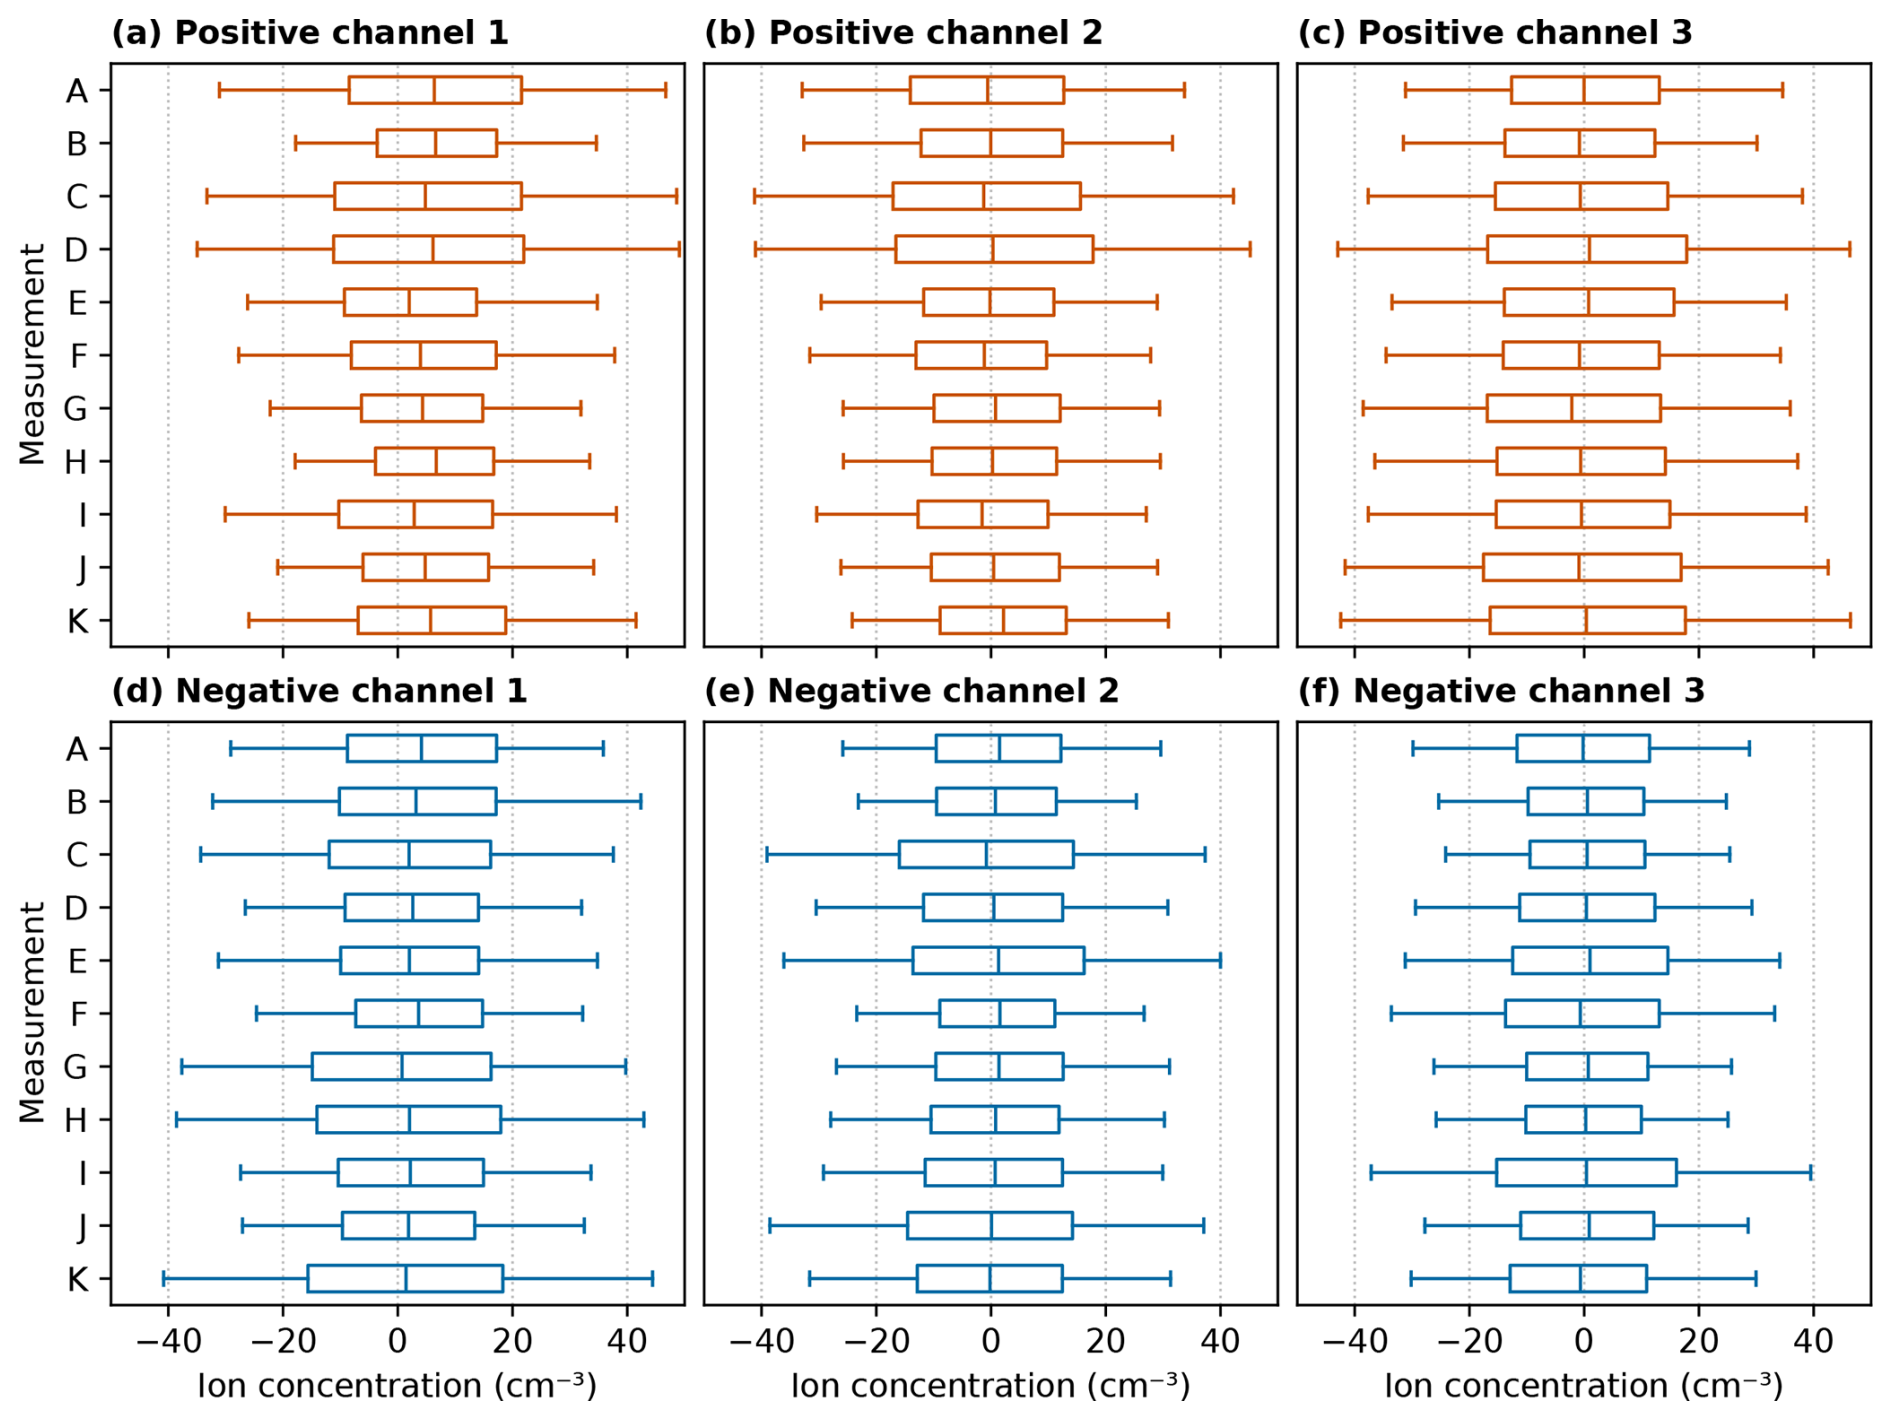
Figure 8Background measurements. CIC background measurements with varying trace gas, temperature, and relative humidity conditions in the CLOUD chamber when the high-voltage clearing field was active and no charged particles were present inside the chamber. The box-and-whisker plots indicate the 25th–75th percentile range (boxes), 5th–95th percentile range (whiskers), and median values (lines in the middle of boxes) of CIC 1 s average samples. The CIC measured at a 7 L min−1 sample flow rate per analyzer. The corresponding chamber conditions for each measurement are shown in Table 1.
Table 1Trace gas, temperature, and relative humidity conditions corresponding to the CIC background measurements shown in Fig. 8.
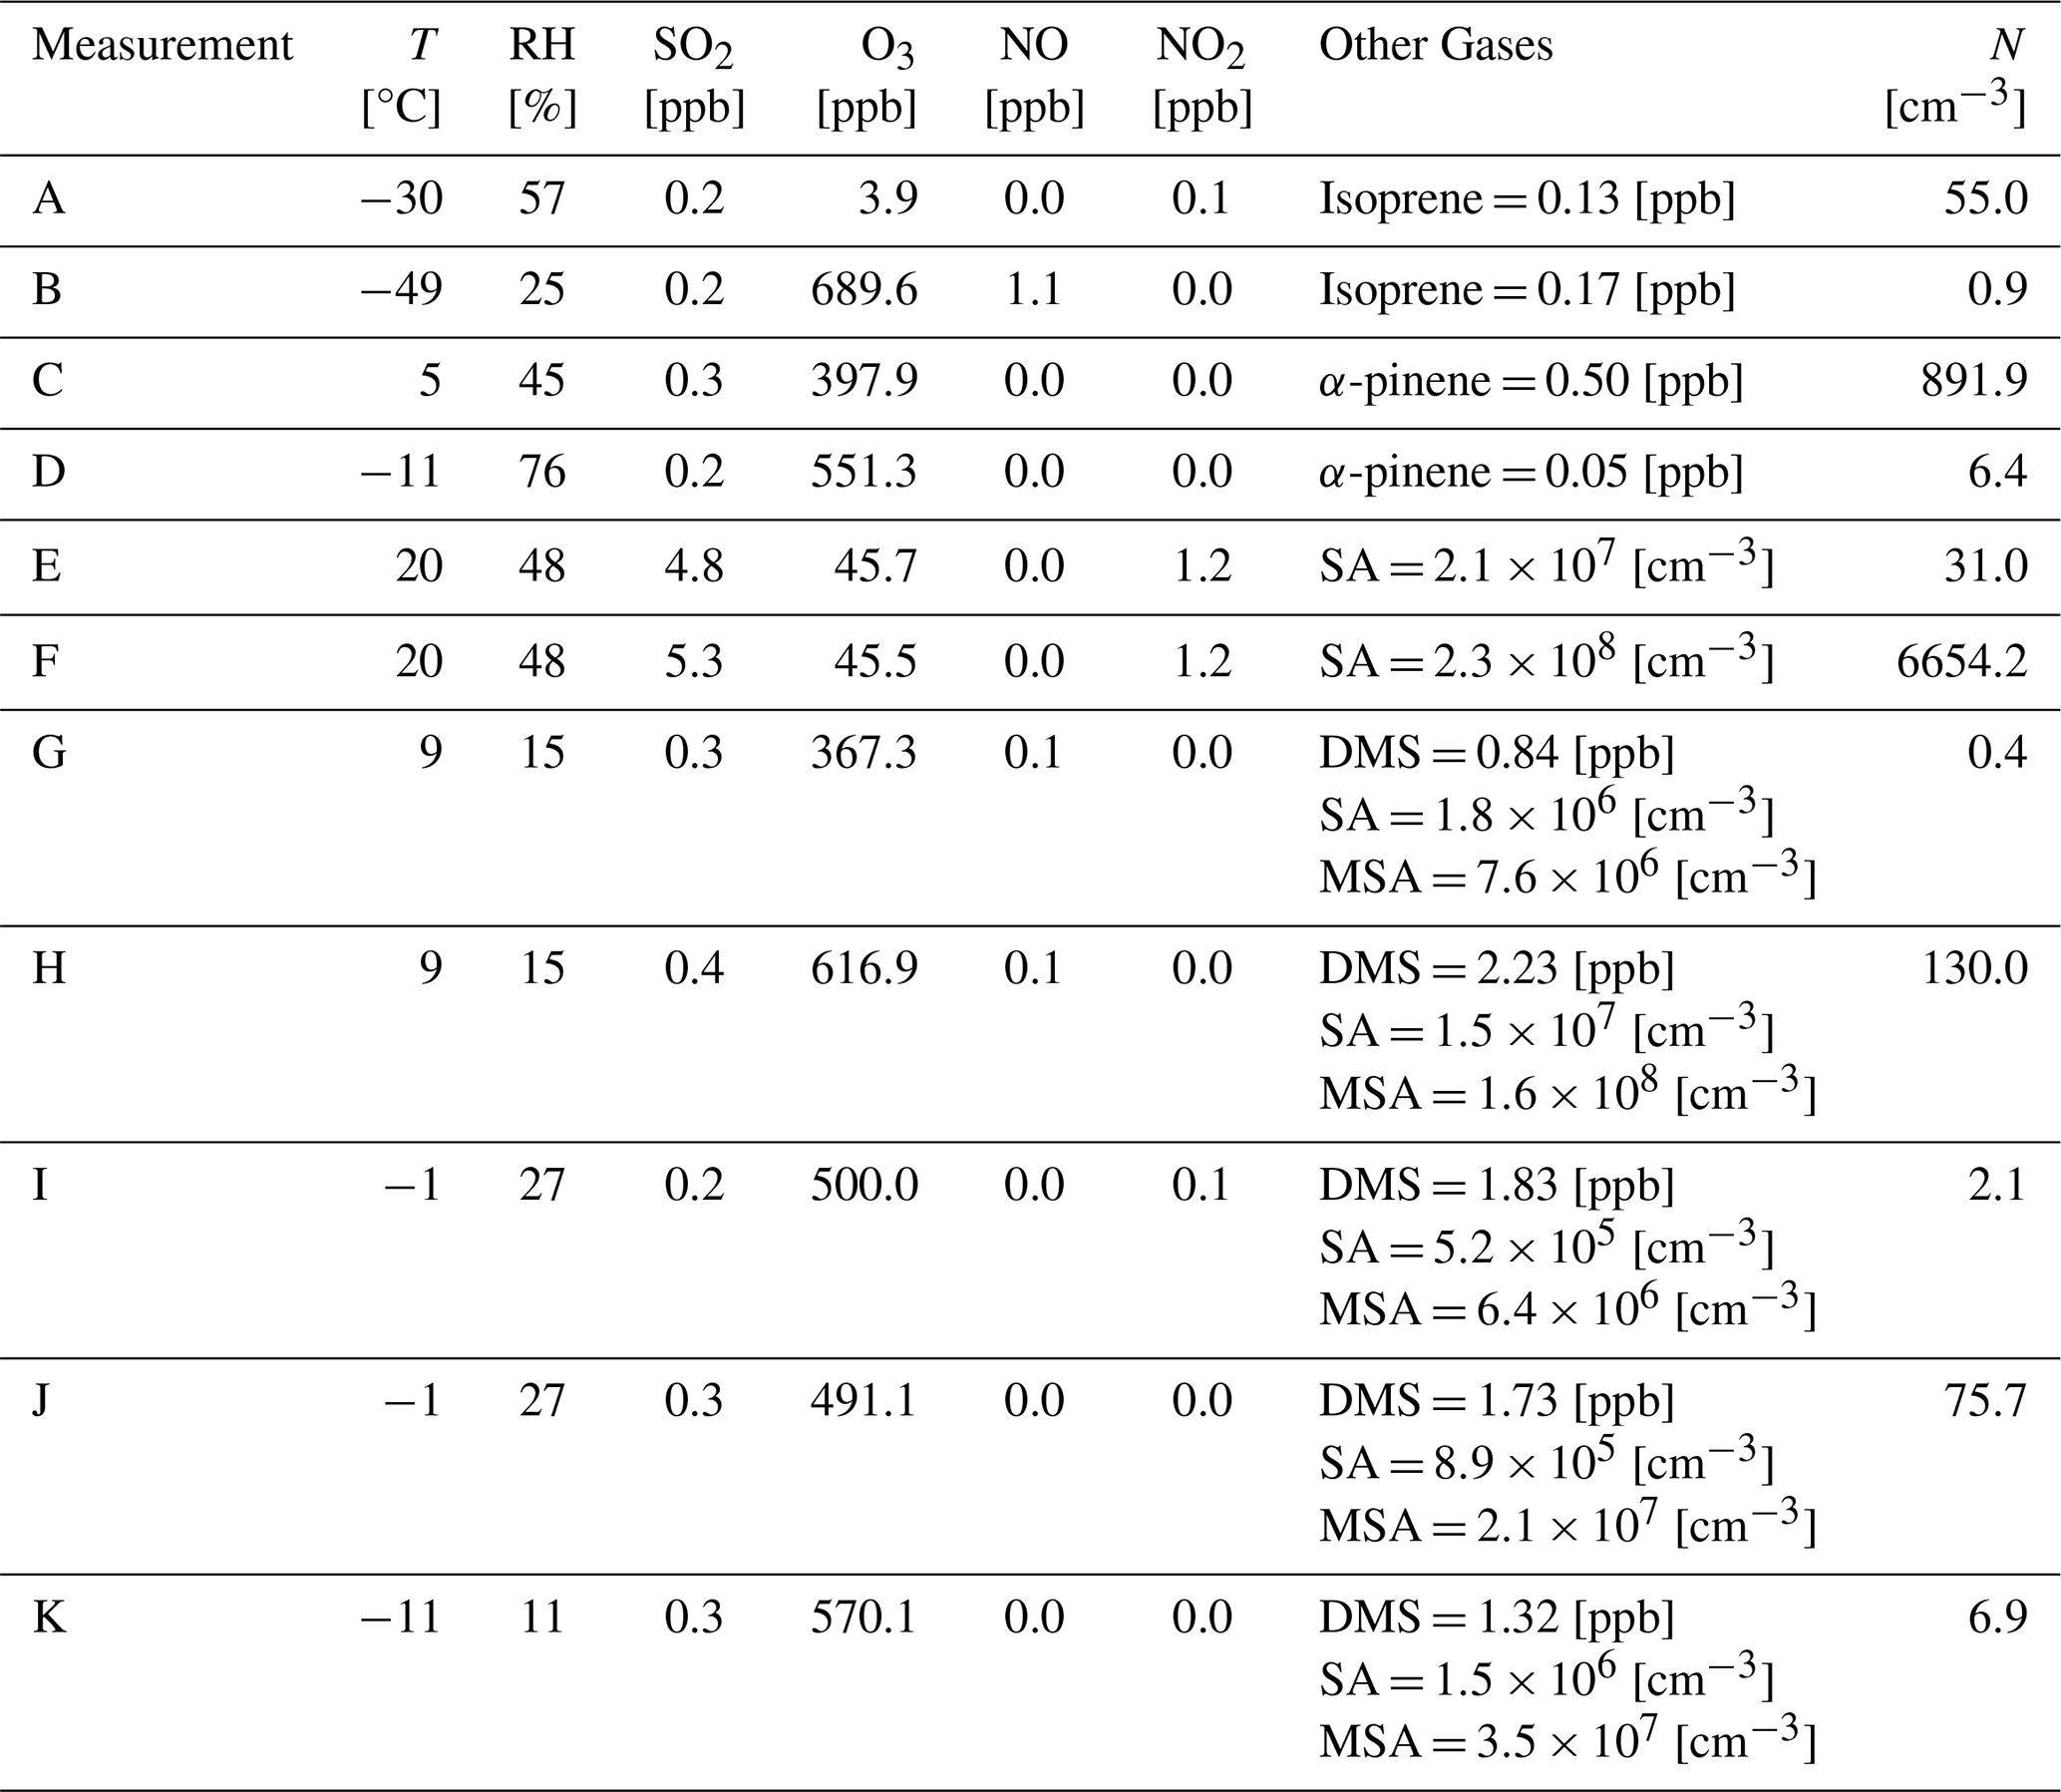
Abbreviations: DMS – dimethyl sulfide, SA – sulfuric acid, MSA – methanesulfonic acid.
3.4 CIC time response
The time response of the CIC has been measured in the CLOUD chamber using the CERN particle beam (Fig. 9). The pion beam spill from the CERN Proton Synchrotron arrives in short bursts of 0.4 s duration, which, for these data, are spaced by about 30 s and have a flux of 1.3×10⁶ particles per burst (Fig. 9b). The CIC ion number concentration responds to each beam pulse after a 5 s delay (Fig. 9a). This delay is due to the circulation time at the CLOUD experiment from the internal mixing fans for the beam-exposed air parcel to reach the tip of the CIC sampling probe. The CIC then reacts instantly (< 1 s) to the peak ionization pulse from the beam, followed by a gradual decay as the ions are mixed and diluted with non-irradiated air in the chamber. On longer timescales, ions are lost by ion–ion recombination and by collision with the walls of the CLOUD chamber. The response of the CIC to the beam bursts is mainly seen in channel 1 since only small ions are created in the chamber on these short timescales (note the absence of any signal in channel 3, which has zero response for small ions below 2 nm). The gaps in the CIC data correspond to periods when the instrument performed automatic internal zero-level measurements, with the inlet filter having been switched to 120 V. These data demonstrate an excellent response time for the CIC of around 1 s.
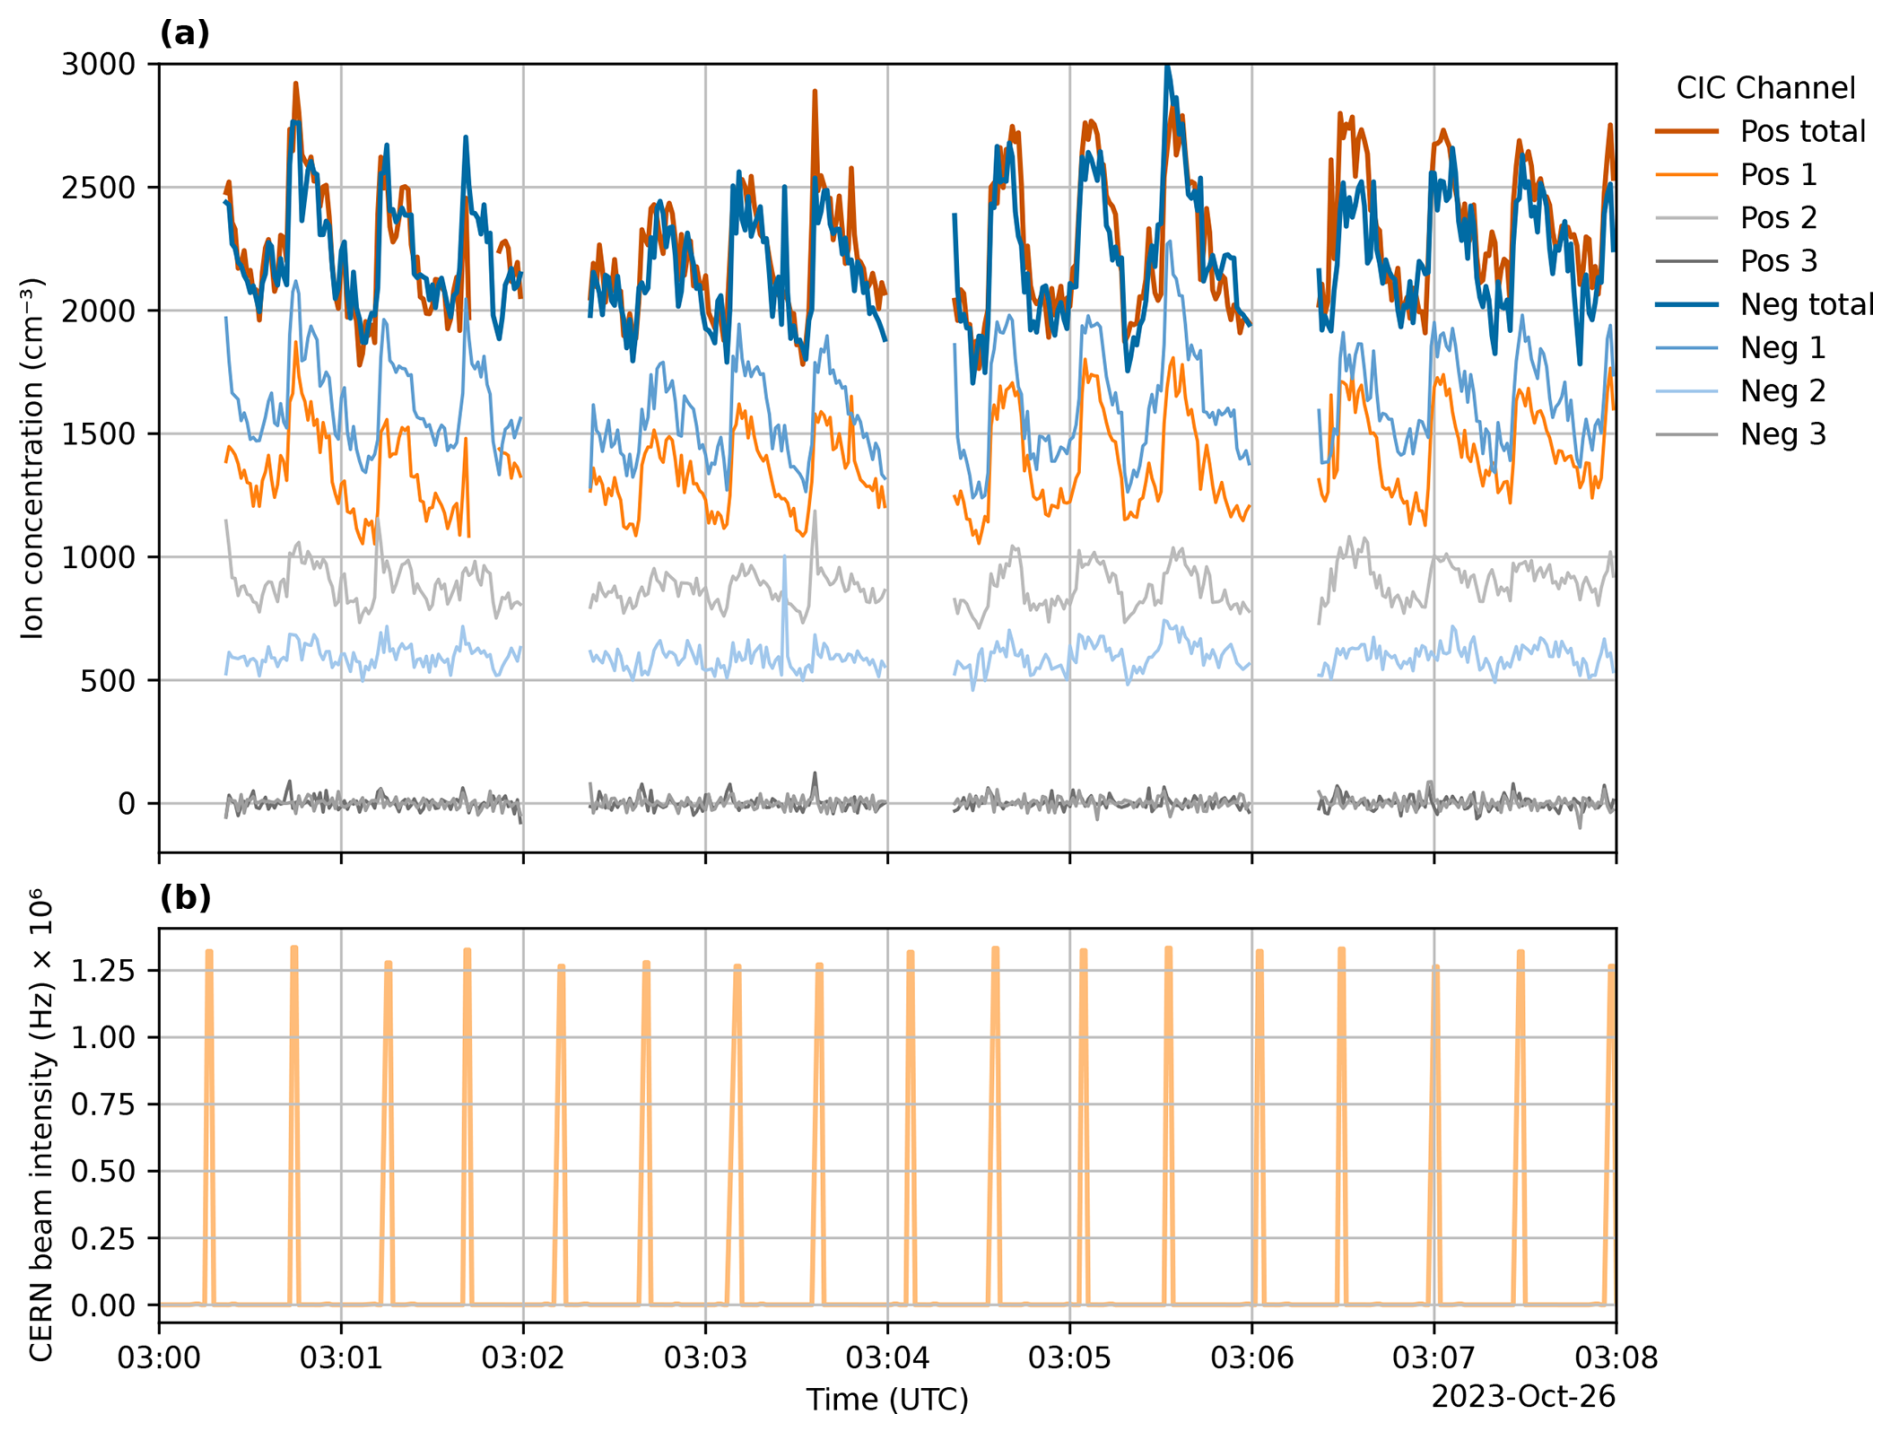
Figure 9CIC response to CERN beam pulses. Evolution over an 8 min interval of (a) ion number concentrations measured by the CIC when sampling air from the CLOUD chamber at 7 L min−1 per analyzer and (b) CERN particle beam intensity incident on the chamber. Both panels are displayed versus time at 1 s sampling rate. The CIC reacts with a 1 s time response to the pulse of beam ionization, and then the ions are diluted as they are mixed with unexposed air in the chamber by internal mixing fans (a). The gaps in the CIC data correspond to periods when the device performed automatic zero-level measurements.
The laboratory measurements described here – along with operational experience at the CERN CLOUD chamber over the last 5 years – demonstrate that the CIC provides precise and robust long-term measurements of small-ion concentrations of both polarities, with low noise, a fast time response, and excellent reliability. The instrument maintains precise small-ion measurements in all environments, ranging from pristine to highly polluted. Multiple CICs have already been deployed for long-term measurements under diverse ambient conditions across various key field locations. The combination of the low noise of the instrument – even at low flow rates – and the fast time response of 1 s opens up new applications for small-ion counters. For example, in chamber studies, the CIC can precisely measure fast ion processes such as ionization pulses, ion–ion recombination rates, diffusion charging of aerosol, ion–droplet interactions, and wall loss rates. In the atmosphere, ion concentrations can be measured in rapidly changing environments such as inhomogeneous urban conditions or in observations from aircraft. Its low weight, small dimensions, and low power consumption open up new possibilities for aerial measurements with drones. In addition, the CIC can lead to an improved understanding of the production, transport, and loss of small ions in the troposphere and their contributions to atmospheric processes such as the global electrical circuit and ion-induced nucleation of aerosol particles.
With its excellent performance in terms of small-ion measurements, the CIC will join other key instruments for studying atmospheric new particle formation such as the Neutral cluster and Air Ion Spectrometer (NAIS), the scanning Particle Size Magnifier (PSM), and the Atmospheric Pressure interface Time-of-Flight (APi-TOF) mass spectrometer.
The datasets and code used in this paper are available at https://doi.org/10.5281/zenodo.17357061 (Mirme et al., 2025).
SM and PK designed the instrument. SM, HEM, PK, RB, ES, BR, YW, SE, SKW, JP, JKa, JKi, and JA performed the measurements. SM, HEM, and RB analyzed the data. SM, HEM, and RB wrote the paper draft. RB, BR, and JKi reviewed and edited the paper. MK and JKi facilitated the access to the research infrastructure.
Sander Mirme and Paap Koemets are employees at Airel OÜ. Sander Mirme is a shareholder of Airel OÜ. The peer-review process was guided by an independent editor, and the authors also have no other competing interests to declare.
Publisher's note: Copernicus Publications remains neutral with regard to jurisdictional claims made in the text, published maps, institutional affiliations, or any other geographical representation in this paper. While Copernicus Publications makes every effort to include appropriate place names, the final responsibility lies with the authors.
This research has been, in part, supported by the Estonian Research Council (project nos. PRG714 and RVTT3) and the MSCA ITN project CLOUD-DOC (grant no. 101073026). Rima Balbaaki acknowledges funding from the EMME-CARE project, which was supported by the European Union's Horizon 2020 Research and Innovation Programme (grant agreement no. 856612) and the Cyprus Government.
This paper was edited by Christian von Savigny and reviewed by three anonymous referees.
Aplin, K. L. and Harrison, R. G.: A computer-controlled Gerdien atmospheric ion counter, Rev. Sci. Instrum., 71, 3037–3041, https://doi.org/10.1063/1.1305511, 2000. a
Carslaw, K. S., Harrison, R. G., and Kirkby, J.: Cosmic rays, clouds, and climate, Science, 298, 1732–1737, 2002. a
Ebert, H.: Aspirationsapparat zur Bestimmung des ionen gehaltes der Atmosphäre, Phys. Z., 2, 662–664, 1901. a
Fernández de la Mora, J., de Juan, L., Liedtke, K., and Schmidt-Ott, A.: Mass and size determination of nanometer particles by means of mobility analysis and focused impaction, J. Aerosol Sci., 34, 79–98, https://doi.org/10.1016/S0021-8502(02)00121-0, 2003. a
Flagan, R. C.: History of Electrical Aerosol Measurements, Aerosol Sci. Tech., 28, 301–380, 1998. a, b
Gerdien, H.: Ein neuer Apparat zur Messung der elektrischen Leitfähigkeit der Luft, Nachrichten von der Gesellschaft der Wissenschaften zu Göttingen, Mathematisch-Physikalische Klasse, 1905, 240–251, 1905. a
Gormley, P. and Kennedy, M.: Diffusion from a stream flowing through a cylindrical tube, P. Roy. Irish Acad. A, 52, 163–169, 1948. a
Grabarczyk, Z.: Frequency characteristic of an aspiration integrating small ion counter with a shielded collector, J. Electrostat., 51–52, 284–289, https://doi.org/10.1016/S0304-3886(01)00057-2, 2001. a
Harrison, R. G. and Ambaum, M. H.: Enhancement of cloud formation by droplet charging, Proceedings of the Royal Society A: Mathematical, Physical and Engineering Sciences, 464, 2561–2573, 2008. a
Harrison, R. G. and Carslaw, K. S.: Ion-aerosol-cloud processes in the lower atmosphere, Rev. Geophys., 41, 1012, https://doi.org/10.1029/2002RG000114, 2003. a
Harrison, R. G. and Wilding, R. J.: Programmable ion mobility spectrometer: Time resolution improvement and ion counter comparison, Rev. Sci. Instrum., 76, 086109, https://doi.org/10.1063/1.2010469, 2005. a
Hirsikko, A., Nieminen, T., Gagné, S., Lehtipalo, K., Manninen, H. E., Ehn, M., Hõrrak, U., Kerminen, V.-M., Laakso, L., McMurry, P. H., Mirme, A., Mirme, S., Petäjä, T., Tammet, H., Vakkari, V., Vana, M., and Kulmala, M.: Atmospheric ions and nucleation: a review of observations, Atmos. Chem. Phys., 11, 767–798, https://doi.org/10.5194/acp-11-767-2011, 2011. a, b
Hõrrak, U.: Air ion mobility spectrum at a rural area, PhD thesis, University of Tartu, ISBN 9789985566121, 2001. a
Hõrrak, U., Salm, J., and Tammet, H.: Statistical characterization of air ion mobility spectra at Tahkuse Observatory: Classification of air ions, J. Geophys. Res.-Atmos., 105, 9291–9302, 2000. a
Kangasluoma, J., Attoui, M., Junninen, H., Lehtipalo, K., Samodurov, A., Korhonen, F., Sarnela, N., Schmidt-Ott, A., Worsnop, D., Kulmala, M., and Petäjä, T.: Sizing of neutral sub 3nm tungsten oxide clusters using Airmodus Particle Size Magnifier, J. Aerosol Sci., 87, 53–62, https://doi.org/10.1016/j.jaerosci.2015.05.007, 2015. a, b
Kirkby, J., Curtius, J., Almeida, J., Dunne, E., Duplissy, J., Ehrhart, S., Franchin, A., Gagné, S., Ickes, L., Kürten, A., Kupc, A., Metzger, A., Riccobono, F., Rondo, L., Schobesberger, S., Tsagkogeorgas, G., Wimmer, D., Amorim, A., Bianchi, F., Breitenlechner, M., David, A., Dommen, J., Downard, A., Ehn, M., Flagan, R., Haider, S., Hansel, A., Hauser, D., Jud, W., Junninen, H., Kreissl, F., Kvashin, A., Laaksonen, A., Lehtipalo, K., Lima, J., Lovejoy, E., Makhmutov, V., Mathot, S., Mikkilä, J., Minginette, P., Mogo, S., Nieminen, T., Onnela, A., Pereira, P., Petäjä, T., Schnitzhofer, R., Seinfeld, J., Sipilä, M., Stozhkov, Y., Stratmann, F., Tomé, A., Vanhanen, J., Viisanen, Y., Vrtala, A., Wagner, P., Walther, H., Weingartner, E., Wex, H., Winkler, P., Carslaw, K., Worsnop, D., Baltensperger, U., and Kulmala, M.: Role of sulphuric acid, ammonia and galactic cosmic rays in atmospheric aerosol nucleation, Nature, 476, 429–433, 2011. a
Kirkby, J., Duplissy, J., Sengupta, K., Frege, C., Gordon, H., Williamson, C., Heinritzi, M., Simon, M., Yan, C., Almeida, J., Tröstl, J., Nieminen, T., Ortega, I., Wagner, R., Adamov, A., Amorim, A., Bernhammer, A., Bianchi, F., Breitenlechner, M., Brilke, S., Chen, X., Craven, J., Dias, A., Ehrhart, S., Flagan, R., Franchin, A., Fuchs, C., Guida, R., Hakala, J., Hoyle, C., Jokinen, T., Junninen, H., Kangasluoma, J., Kim, J., Krapf, M., Kürten, A., Laaksonen, A., Lehtipalo, K., Makhmutov, V., Mathot, S., Molteni, U., Onnela, A., Peräkylä, O., Piel, F., Petäjä, T., Praplan, A., Pringle, K., Rap, A., Richards, N., Riipinen, I., Rissanen, M., Rondo, L., Sarnela, N., Schobesberger, S., Scott, C., Seinfeld, J., Sipilä, M., Steiner, G., Stozhkov, Y., Stratmann, F., Tomé, A., Virtanen, A., Vogel, A., Wagner, A., Wagner, P., Weingartner, E., Wimmer, D., Winkler, P., Ye, P., Zhang, X., Hansel, A., Dommen, J., Donahue, N., Worsnop, D., Baltensperger, U., Kulmala, M., Carslaw, K., and Curtius, J.: Ion-induced nucleation of pure biogenic particles, Nature, 533, 521–526, 2016. a
Kirkby, J., Amorim, A., Baltensperger, U., Carslaw, K. S., Christoudias, T., Curtius, J., Donahue, N. M., Haddad, I. E., Flagan, R. C., and Gordon, H.: Atmospheric new particle formation from the CERN CLOUD experiment, Nat. Geosci., 16, 948–957, 2023. a, b
Ku, B. K. and de la Mora, J. F.: Relation between electrical mobility, mass, and size for nanodrops 1–6.5 nm in diameter in air, Aerosol Sci. Tech., 43, 241–249, 2009. a
Kubásek, R., Roubal, Z., Szabó, Z., and Steinbauer, M.: The measurement of air ions spectrum using the aspiration method, in: 2009 3rd International Conference on Signals, Circuits and Systems (SCS), Medenine, Tunisia, 6–8 November 2009, IEEE, 1–4, https://doi.org/10.1109/ICSCS.2009.5414176, 2009. a
Kulmala, M., Tuovinen, S., Mirme, S., Koemets, P., Ahonen, L., Liu, Y., Junninen, H., Petäjä, T., and Kerminen, V.-M.: On the potential of the Cluster Ion Counter (CIC) to observe local new particle formation, condensation sink and growth rate of newly formed particles, Aerosol Research, 2, 291–301, https://doi.org/10.5194/ar-2-291-2024, 2024. a
Matisen, R., Miller, F., Tammet, H., and Salm, J.: Air ion counters and spectrometers designed in Tartu University, Acta Comm. Univ. Tartu, 947, 60–67, https://dspace.ut.ee/server/api/core/bitstreams/114a1e18-55b2-4c21-92a2-19048558c91e/content (last access: 16 October 2025), 1992. a
Mirme, S.: Development of nanometer aerosol measurement technology, PhD thesis, University of Tartu, ISBN 9789949197385, http://hdl.handle.net/10062/18094 (last access: 16 October 2025), 2011. a
Mirme, S. and Mirme, A.: The mathematical principles and design of the NAIS – a spectrometer for the measurement of cluster ion and nanometer aerosol size distributions, Atmos. Meas. Tech., 6, 1061–1071, https://doi.org/10.5194/amt-6-1061-2013, 2013. a
Moody, N. F.: Design and construction of an improved, portable, air-ion counter, Int. J. Biometeorol., 28, 169–184, 1984. a
Mäkelä, J. M., Riihelä, M., Ukkonen, A., Jokinen, V., and Keskinen, J.: Comparison of mobility equivalent diameter with Kelvin-Thomson diameter using ion mobility data, J. Chem. Phys., 105, 1562–1571, https://doi.org/10.1063/1.472017, 1996. a
Mirme, S., Baalbaki, R., Manninen, H. E., Koemets, P., Sommer, E., Rörup, B., Wu, Y., Almeida, J., Ehrhart, S., Weber, S. K., Pfeifer, J., Kangasluoma, J., Kulmala, M., and Kirkby, J.: Datasets and code for “Design and performance of the Cluster Ion Counter (CIC)”, Zenodo [data set], https://doi.org/10.5281/zenodo.17357061, 2025. a
Nicoll, K. A. and Harrison, R. G.: A double Gerdien instrument for simultaneous bipolar air conductivity measurements on balloon platforms, Rev. Sci. Instrum., 79, 084502, https://doi.org/10.1063/1.2964927, 2008. a
Peineke, C., Attoui, M., and Schmidt-Ott, A.: Using a glowing wire generator for production of charged, uniformly sized nanoparticles at high concentrations, J. Aerosol Sci., 37, 1651–1661, https://doi.org/10.1016/j.jaerosci.2006.06.006, 2006. a
Rycroft, M. J., Nicoll, K. A., Aplin, K. L., and Harrison, R. G.: Recent advances in global electric circuit coupling between the space environment and the troposphere, J. Atmos. Sol.-Terr. Phy., 90–91, 198–211, 2012. a
Tammet, H.: The aspiration method for the Determination of Atmospheric-Ion Spectra, The Israel Program for Scientific Translations Jerusalem, National Science Foundation, Washington, D.C., http://hdl.handle.net/10062/50208 (last access: 16 October 2025), 1970. a
Tammet, H.: Continuous scanning of the mobility and size distribution of charged clusters and nanometer particles in atmospheric air and the Balanced Scanning Mobility Analyzer BSMA, Atmos. Res., 82, 523–535, 2006. a
Tinsley, B. A.: The global atmospheric electric circuit and its effects on cloud microphysics, Rep. Prog. Phys., 71, 066801, https://doi.org/10.1088/0034-4885/71/6/066801, 2008. a
Uin, J., Mirme, S., Mirme, A., and Tamm, E.: Comparison of the Performance of Modified Vienna Type DMA and TSI Nano-DMA, Chem. Eng. Trans, 10, 173–177, 2006. a
Wilson, C. T. R.: On the leakage of electricity through dust-free air, P. Camb. Philos. Soc., 11, p. 32, 1900. a