the Creative Commons Attribution 4.0 License.
the Creative Commons Attribution 4.0 License.
 | 29 Oct 2025
An improved Freezing Ice Nucleation Detection Analyzer (FINDA) for droplet immersion freezing measurement
Kaiqi Wang
Kai Bi
Shuling Chen
Markus Hartmann
Zhijun Wu
Jiyu Gao
Xiaoyu Xu
Yuhan Cheng
Mengyu Huang
Yunbo Chen
Huiwen Xue
Bingbing Wang
Yaqiong Hu
Xiongying Zhang
Xincheng Ma
Ruijie Li
Ping Tian
Ottmar Möhler
Heike Wex
Frank Stratmann
Heterogeneous ice nucleation initiated by atmospheric ice-nucleating particles (INPs) is a key microphysical process for cloud formation. Detecting the ice nucleation ability (INA) and concentration of INPs is essential for improving global climate models. Droplet freezing techniques (DFTs) are among the widely used tools for measuring the immersion freezing of INPs, which is a predominant ice nucleation process in mixed-phase clouds. To enhance the efficiency and accuracy of DFTs, we developed a Freezing Ice Nucleation Detection Analyzer at Westlake University (FINDA-WLU) with an improved hardware setup, user-friendly software, precise droplet freezing detection, and rigorous temperature calibrations. The temperature uncertainty of FINDA-WLU is about ±0.60 °C, considering both vertical heat transfer efficiency and horizontal temperature heterogeneity. The system is tested with Milli-Q ultrapure water and reference materials like Arizona Test Dust and Snomax®, and the results are consistent with previous studies. We also use the FINDA-WLU to measure INPs in precipitation samples collected in China. Overall, FINDA-WLU proved to be a reliable and precise method for measuring INA and INP concentrations.
- Article
(11499 KB) - Full-text XML
- BibTeX
- EndNote


Ice formation is one of the most important atmospheric processes to modulate cloud microphysics, thereby influencing precipitation and cloud radiative properties (Prenni et al., 2007; Bangert et al., 2012; Vergara-Temprado et al., 2018). Atmospheric ice formation can occur through homogeneous freezing of droplets or heterogeneous ice nucleation of liquid water or water vapor aided by aerosol particles, known as ice-nucleating particles (INPs). The homogeneous freezing of droplets, without the presence of INPs, usually occurs at temperatures (T) below −38 °C (Murray et al., 2012). In contrast, heterogeneous ice nucleation can occur at higher temperatures above −38 °C, because an INP provides a substrate which lowers the energy barrier required for ice embryo formation (Hoose and Möhler, 2012; Murray et al., 2012). Heterogeneous ice formation can occur through different modes, depending on environmental conditions and ice nucleation properties of INPs (Hoose and Möhler, 2012). Immersion freezing, where droplet freezing is initiated by an INP immersed within a droplet, is one of the most important pathways of heterogeneous ice nucleation in mixed-phase clouds (T > −38 °C (Ansmann et al., 2008; Hiranuma et al., 2015; Westbrook and Illingworth, 2013). The concentration, physicochemical nature, and ice nucleation mechanisms of INPs are not fully understood, due to the stochastic nature of ice nucleation, low number concentration in the atmosphere, and the inherent complexity of INPs (Kanji et al., 2017).
Various measurement techniques have been developed and continuously upgraded over the past few decades to detect the immersion-freezing abilities of aerosol particles. These techniques include in-situ methods, including ice nucleation chambers and laminar flow reactors (Rogers, 1988; Rogers et al., 2001; DeMott et al., 2015; Garimella et al., 2016; Lacher et al., 2017; Kanji et al., 2013; Möhler et al., 2021), and offline droplet freezing techniques (DFTs) (Hill et al., 2014, 2016; Budke and Koop, 2015; Chen et al., 2018a; Miller et al., 2021; Chen et al., 2018b; Harrison et al., 2018; David et al., 2019; Steinke et al., 2020; Conen et al., 2015; Knackstedt et al., 2018; Gong et al., 2020; Mahant et al., 2023; Sze et al., 2023). Ice nucleation chambers and flow reactors are used to measure the ice formation potential of airborne particles under controlled T and relative humidity (RH) conditions. In chambers, aerosol particles are kept suspended, allowing aerosol particles to be activated into supercooled droplets and ice crystals and detected in situ. To measure the immersion freezing of droplets containing INPs, ice nucleation chambers are operated under mixed-phase cloud-relevant conditions, with T above −38 °C and RH with respect to water at ∼ 100 %. The continuous flow diffusion chambers (CFDCs) (DeMott et al., 2017; Lacher et al., 2017; DeMott et al., 2018; Brunner and Kanji, 2021) and cloud expansion chambers (Möhler et al., 2021) are two types of ice nucleation chambers operating on different working principles. However, ice nucleation chambers and reactors are typically expensive and have higher detection limits compared to DFTs. This enables them to measure often only at lower temperatures (T< −20 °C), particularly for typical atmospheric INP concentrations. Background noise caused by ice residues falling from chamber walls (e.g., CFDCs) or counting statistics of low ice crystal numbers make detecting INPs with low concentrations challenging (e.g., for both CFDCs and expansion chambers).
As an alternative, offline DFTs have been developed to measure the temperature-dependent freezing abilities of droplets containing aerosol particles. While different DFTs follow similar principles, the methods may differ for sample collection, droplet preparation, and sample cooling (Hill et al., 2014; Budke and Koop, 2015; Chen et al., 2018a, b; Miller et al., 2021; Harrison et al., 2018; David et al., 2019; Steinke et al., 2020). In DFTs, individual droplets with volumes ranging from microliter to picoliter are produced from aerosol water suspensions using pipettes or microfluidic chips liquid samples, and their freezing behavior is detected as the temperature is lowered. Common cooling methods include placing droplets within a cooling bath or onto a cold stage. Typically, the sampling time, droplet volume, and aerosol suspension concentration can be adjusted, which affects the particle number within each droplet and, thereby, its freezing ability. For example, particle numbers within a droplet can be enhanced by extending the aerosol sampling time, enlarging the droplet size, or reducing the dilution ratio of aerosol suspensions with water. In this way, this approach enables the quantification of low-concentration INP species in the atmosphere, which overcomes the high detection limitations of ice nucleation chambers. Due to these advantages, DFTs are widely used in current ice nucleation studies.
In this study, we present the newly developed Freezing Ice Nucleation Detector Array at Westlake University (FINDA-WLU), building on the original version of FINDA briefly introduced in Ren et al. (2024). The FINDA-WLU offers more precise temperature measurement and calibration, and frozen droplet detection (100 % identification with an embedded automatic detection program). Details about the FINDA-WLU design, including the instrument setup and software control, are provided in Sect. 2. The temperature calibration and frozen droplet identification are explained in Sects. 3 and 4. The ice nucleation ability (INA) of Milli-Q ultrapure water, Arizona Test Dust (ATD), Snomax®, and precipitation samples are tested and compared with the results reported by previous studies using DFTs.
The FINDA-WLU instrument measures the INP number spectrum of liquid samples over a temperature range from 0.0 to about −30.0 °C with a changeable cooling rate of 0.1–1.0 °C. The measurement principle is based on the cold-stage freezing drop experiment, which ultimately yields INP number concentrations (Vali, 1971, 1994). Specifically, by monitoring the temperature-dependent frozen fraction of a large number of equally sized droplets and applying statistical analysis, the cumulative INP number spectrum of the original sample can be deduced. This method has been used in various atmospheric INP measurement instruments (Hill et al., 2014; Chen et al., 2018a).
2.1 Hardware setup
FINDA-WLU is based on the design of Hill et al. (2014), Schneider et al. (2021), and Ren et al. (2024), which was originally proposed by Vali (1971). As illustrated in Fig. 1a, FINDA-WLU comprises a custom-built aluminum block serving as a cold stage which is used to hold a 96-well Polymerase Chain Reaction (PCR) plate, a high-performance temperature-controlled refrigerated/heating circulator (HighTech FP50-HL, JULABO GmbH, Germany), four temperature sensors assembled to a data logger (NI 9217 and NI 9171, National Instruments Corporation, USA), a charge-coupled device (CCD) camera (GOX-5102-USB, JAI, Denmark), two LED lights (Luxpad23, Naguan, China), and a nitrogen gas purging system. All the components are installed into a custom-built matte black metal cabinet mounted with two LED lights, which provides a stable environment light for image detection and reduces pollution from ambient air. A computer is connected to the CCD camera, temperature data logger, and the chiller's controller, running a customized LabVIEW program to operate FINDA-WLU and record the experiment data. A CCD camera (Fig. 1a) is used to detect the reflected LED light over the water droplets placed in a 96-well PCR plate during the experiment. This information can later be used to identify the freezing of droplets depending on experimental temperatures. The camera is fixed above the region of the PCR wells using an adjustable zoom lens (12–120 mm Focal Length, Qiyun Photoelectric Co., China).
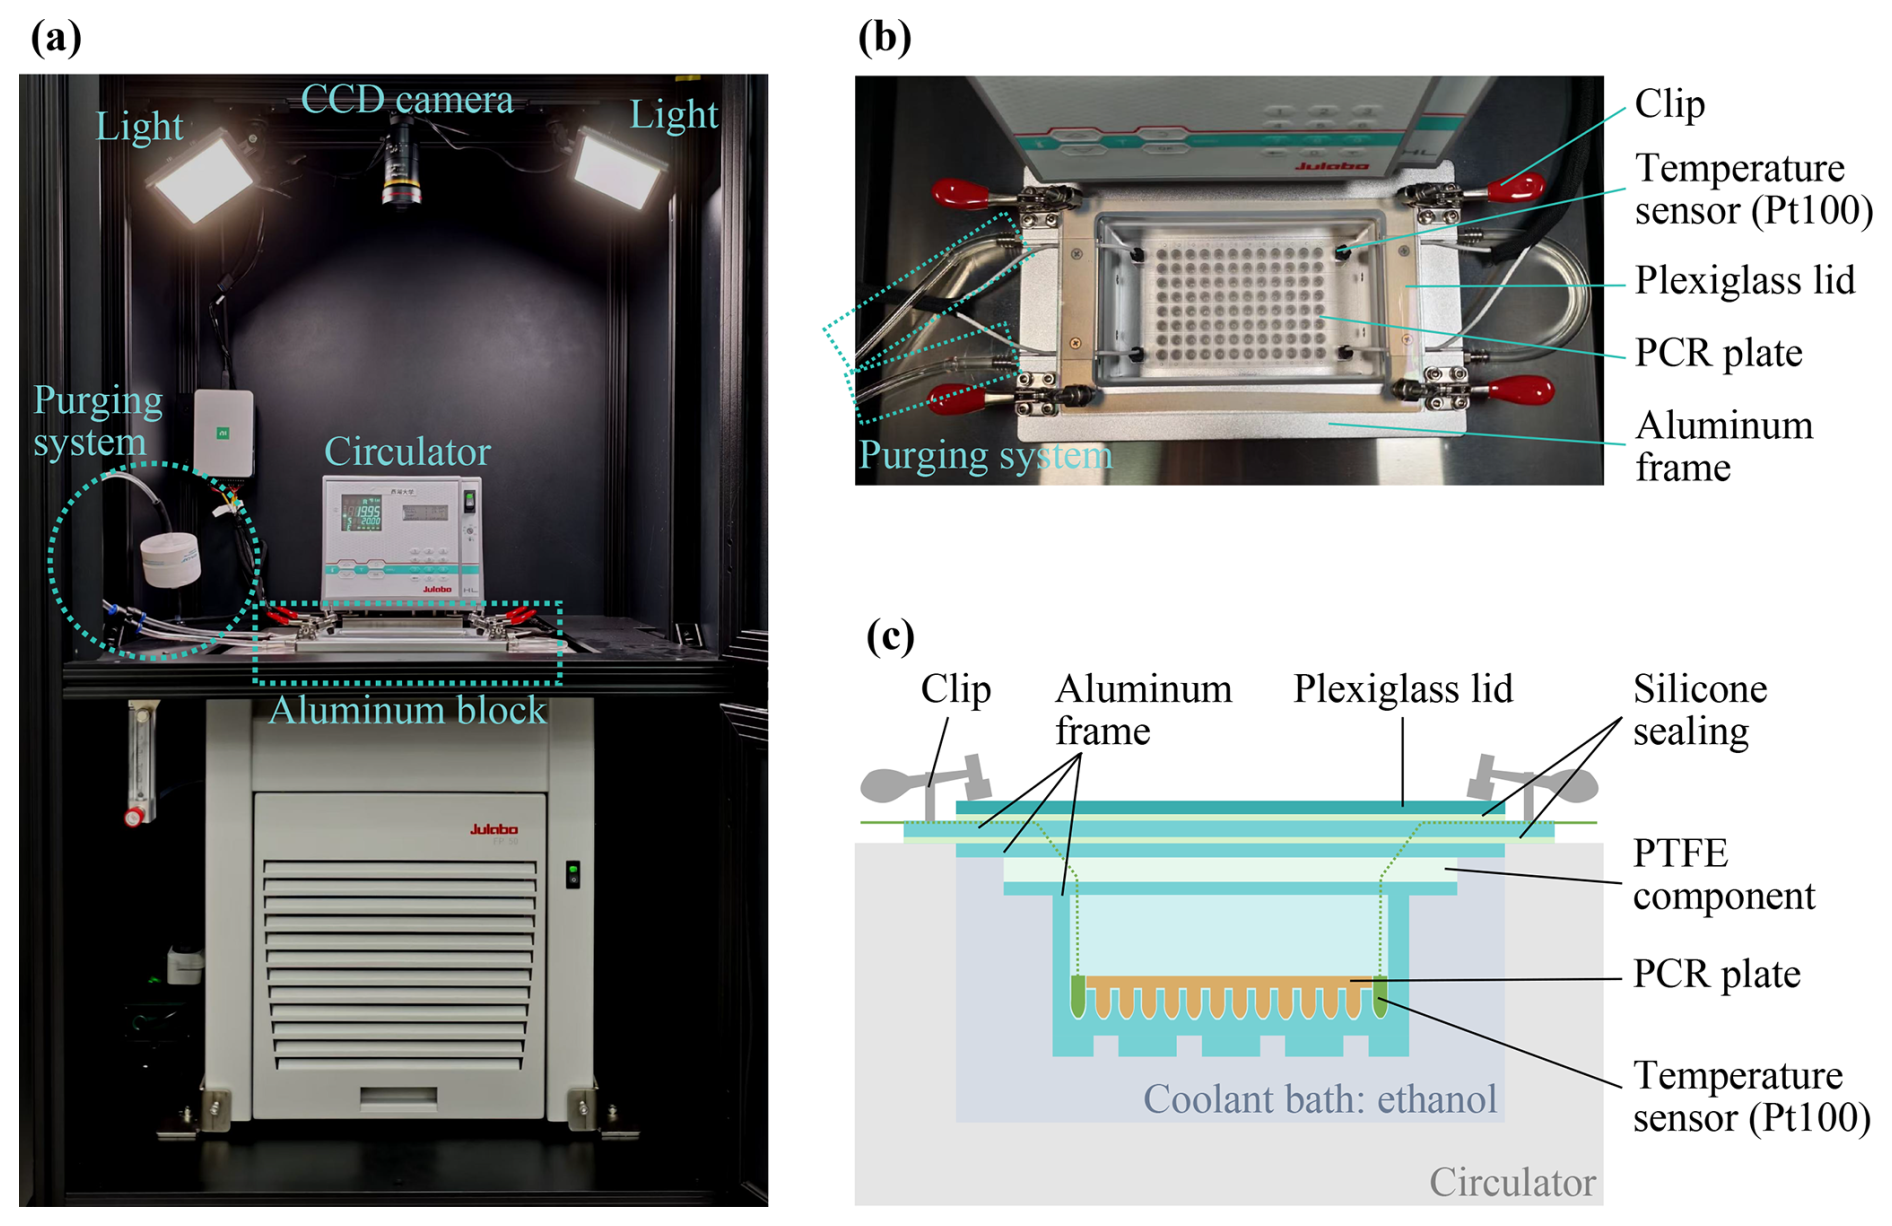
Figure 1(a) The overview of the setup of FINDA-WLU. (b) The top view of the aluminum block with a PCR plate inside. (c) Schematic of the aluminum block from the front view.
An aluminum block is positioned within the coolant bath of the circulator and fitted with a silicone sealing strip to prevent contamination of the samples inside the aluminum block from direct contact with the coolant. Figures 1b and c show an image and a schematic of the aluminum block. An acrylic glass lid covers the aluminum block, providing insulation and preventing the air above the PCR plate from mixing with the surrounding air. A polytetrafluoroethylene (PTFE) component is sealed between the acrylic glass lid and the aluminum block, to decrease the heat transfer from the cold coolant to the acrylic glass lid to avoid fog and frost during the experiment (Fig. 1c). The aluminum block features a precisely Computer Numerical Control (CNC) machined cavity, designed to accommodate the 96-well PCR plate (0.2 mL PCR plate, Boibio, China) and four temperature sensors.
The four temperature sensors are platinum resistance thermometers Pt100 (5157701, YAGEO Nexensos, Germany), hereafter referred to as the “Pt100 sensor” (Fig. 1b and c). These sensors are embedded and sealed within thermally conductive epoxy (Omegabond 200, Omega Engineering, Inc., USA) within tubes cut from a PCR plate, ensuring consistent heat transfer between the PCR plate and Pt100 sensors. The Pt100 sensors have an accuracy of ±0.15 °C at 0 °C (Class A, meets IEC 60751 standard). After calibration, the temperature of droplets was derived from the calibrated mean value of four sensors. Using the circulator, the maximum average cooling rate is −1.45 °C min−1, cooling the droplets from 0.0 to −35.0 °C. The instrument typically operates at a cooling rate of −1.0 °C min−1 for experiments. In a standard experiment, the chiller is set to 0.0 °C and maintained for 10 min, then cooled at a rate of −1.0 °C min−1 from 0.0 to −35.0 °C.
The purging system (as shown in Fig. 1a and b) blows clean and dry nitrogen at a flow rate of 6 L min−1 over the surface of the PCR plate before the experiment to keep a clean atmosphere within the aluminum block. The clean and dry nitrogen is filtered by a 0.2 µm HEPA filter (Vent filters, HEPA-CAP, Whatman™, United Kingdom) before being injected into the aluminum block. During the freezing experiment, the flow is halted to prevent heating of the air adjacent to the liquid sample in the PCR wells.
2.2 Software control
A customized National Instruments LabVIEW program was developed to control the experiment via a user interface panel shown in Fig. 2, including controlling the coolant bath circulator and monitoring the freezing status of droplets in the PCR plate with a CCD camera. The program consists of three primary interfaces: (1) sample information input (Fig. 2a), (2) droplet image acquisition and grayscale value extraction and analysis (Fig. 2b), and (3) temperature control and data logging (Fig. 2c). Before the cooling experiment starts, sample parameters that are needed to derive INP concentrations per e.g. volume of air, sample mass, etc. (see Sect. 3) can be entered in the first interface (Fig. 2a). During the experiment, the CCD camera continuously monitors the unfrozen and frozen status of the liquid in the wells of the PCR plates. To enhance the freezing recognition accuracy, the zoom lens is adjusted to magnify the image so that the 96-well PCR plate occupies the entire display area. For accurate identification of each well, mask region parameters are manually defined in the software by the user (Fig. 2b); typically, circular masks with a diameter of 65 pixels arranged in an 8 × 12 array are employed. The software subsequently extracts and stores the grayscale values within these predefined mask regions. The program can analyze the temporal resolution of grayscale values and determine the frozen temperature of each droplet (details in Sect. 2.3). The frozen fraction and INP number concentration (for both water and air filter samples) are then calculated based on input sample information (calculation methods in Sect. 4.5). The luminance data and four temperature readings are both recorded at a rate of 1 Hz. Simultaneously, temperature data from the PT100 sensors are recorded.
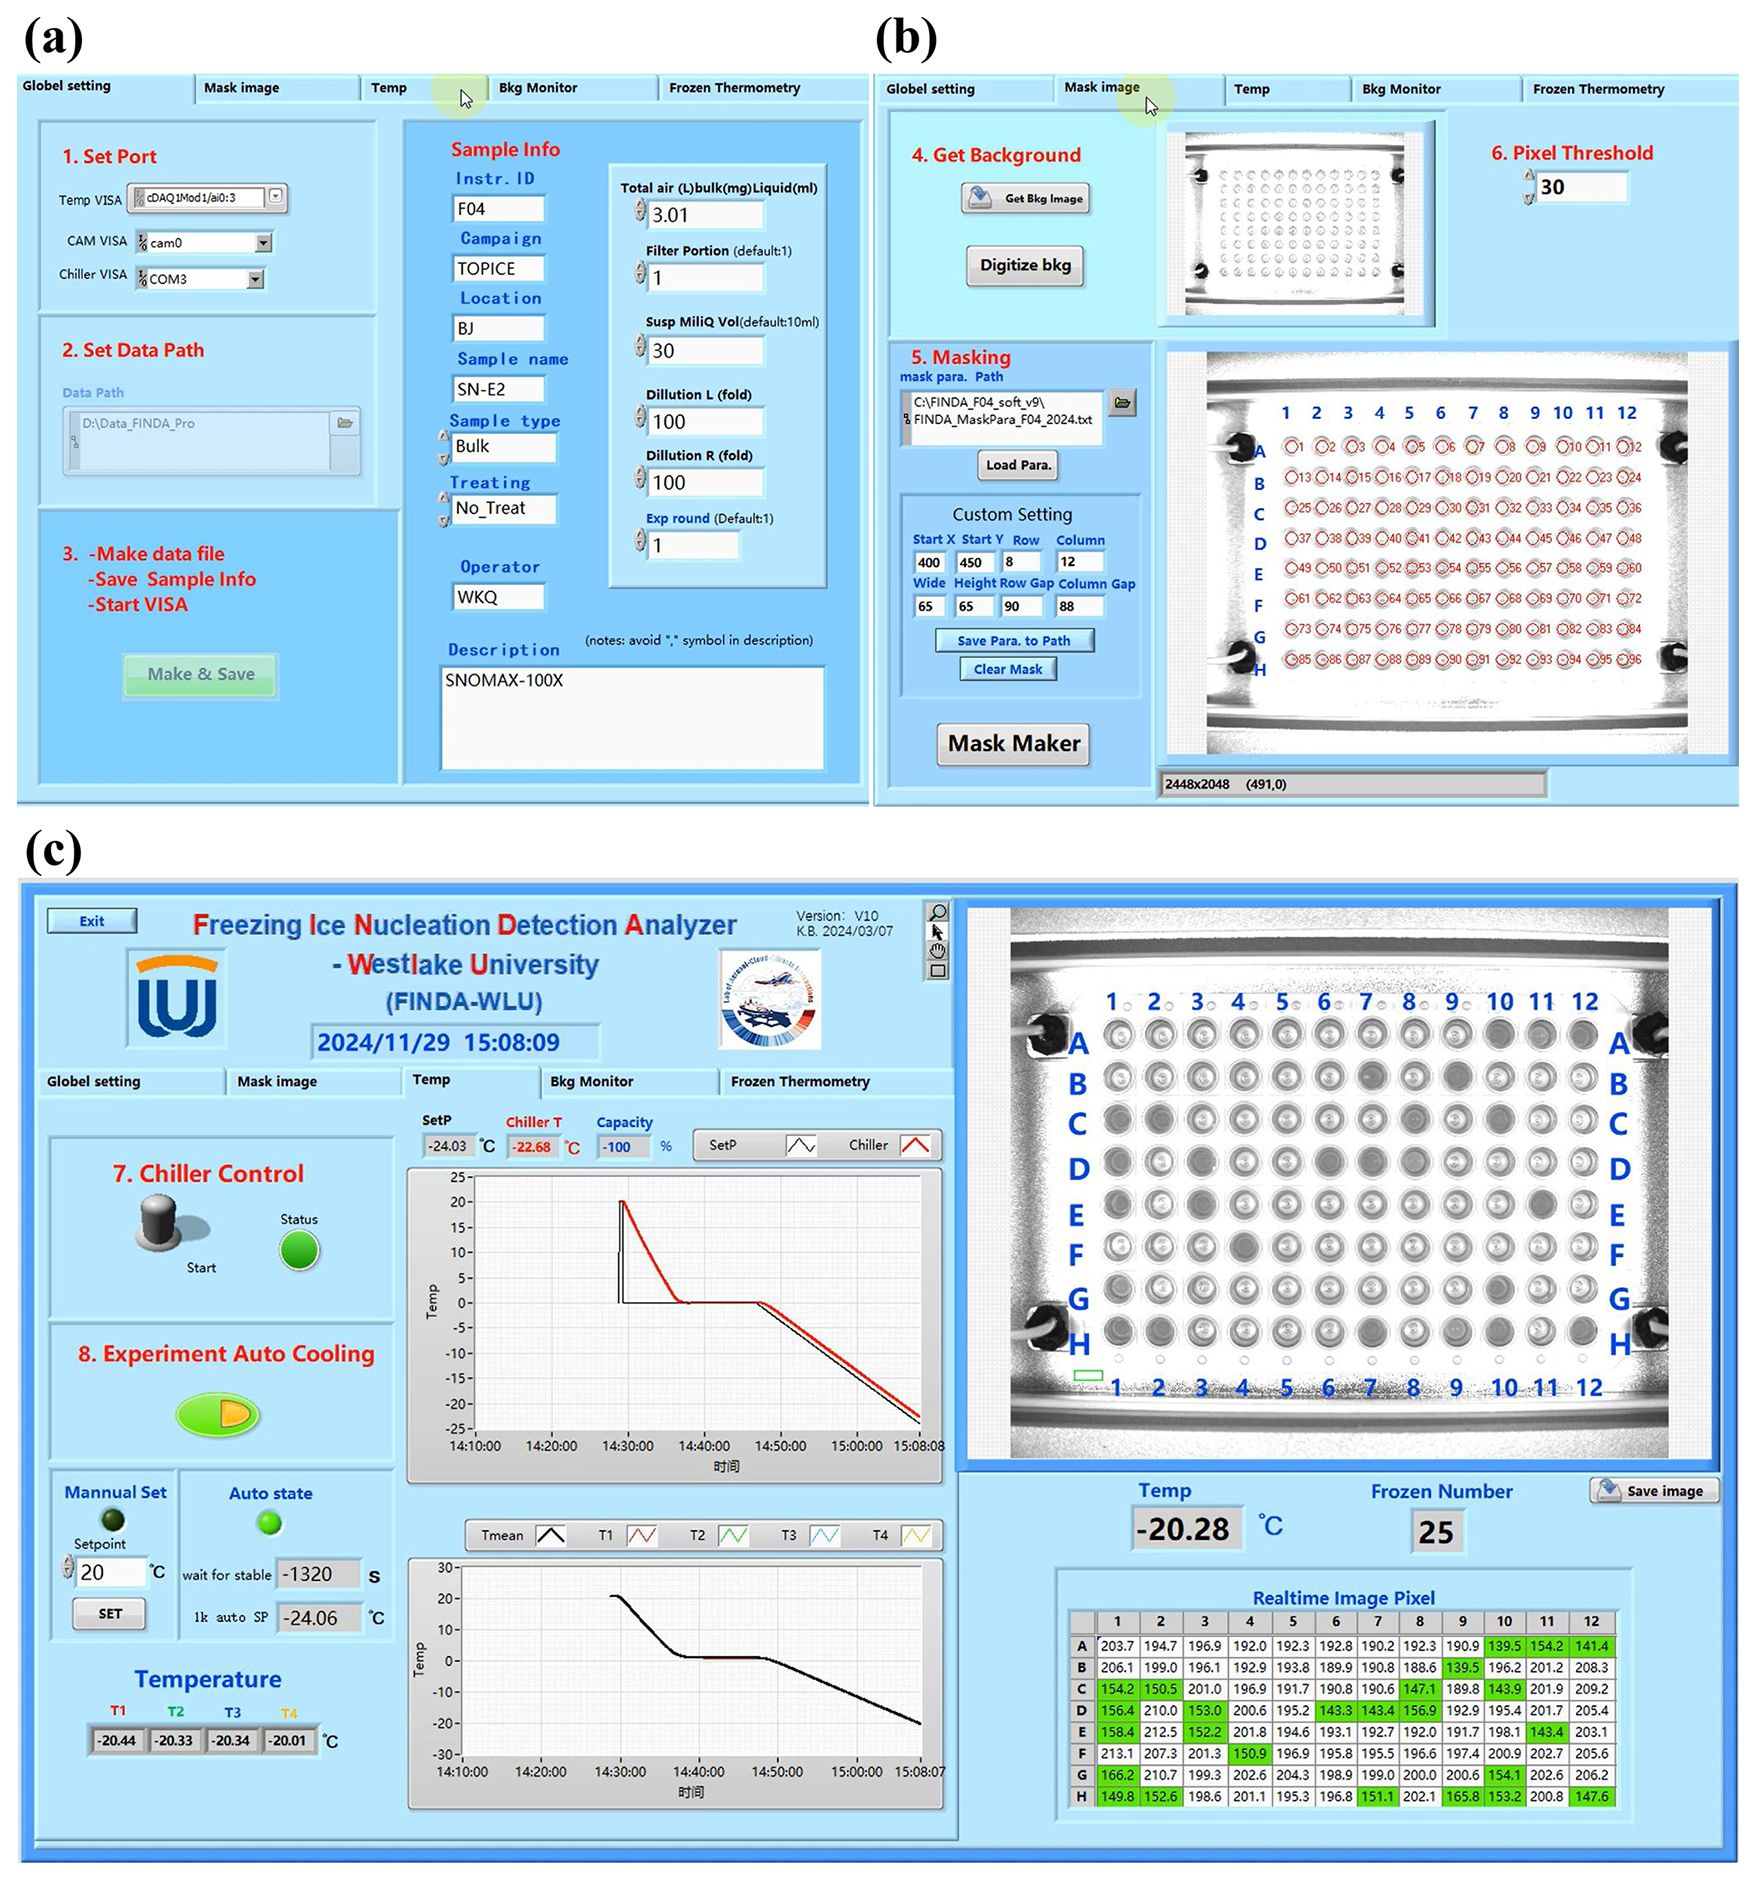
Figure 2Screenshots of the software of FINDA-WLU. (a) Sample information. (b) The setting of grayscale recognition circles. The parameters are in the “Custom Setting” rectangle. The circles are shown in the right image. (c) The third page controls the cooling process and shows the real-time temperature of all Pt100 sensors. The image shown on the right side is the real-time CCD camera image. The numbers of “Realtime Image Pixel” are the grayscale values.
2.3 Droplet freezing detection
Immediate identification of the first ice formation in a droplet is crucial for quantifying the INA of immersion mode INPs. During the experiment, a freezing event is detected if the mean grayscale intensity of a well changes markedly (see Fig. 2b and c). The CCD camera acquires images at a frequency of 74 fps and provides a mean value of 1 Hz to the computer. This acquisition rate significantly exceeds previous studies, i.e., which captured 10 pictures per minute (Chen et al., 2018b). The increased image acquisition frequency improves the accuracy of the recognition of freezing temperature. The pixel intensities of each well area are averaged and recorded at a rate of 1 Hz. Figure 3 illustrates the grayscale values against the temperature of eight wells during an experiment. The grayscale value of a well stays constant until a sudden decrease is observed during a cooling experiment, indicating the onset of freezing. From 0.0 to −35.0 °C, the maximum decrease in grayscale value was used to identify the freezing event and the temperature at which it occurs.
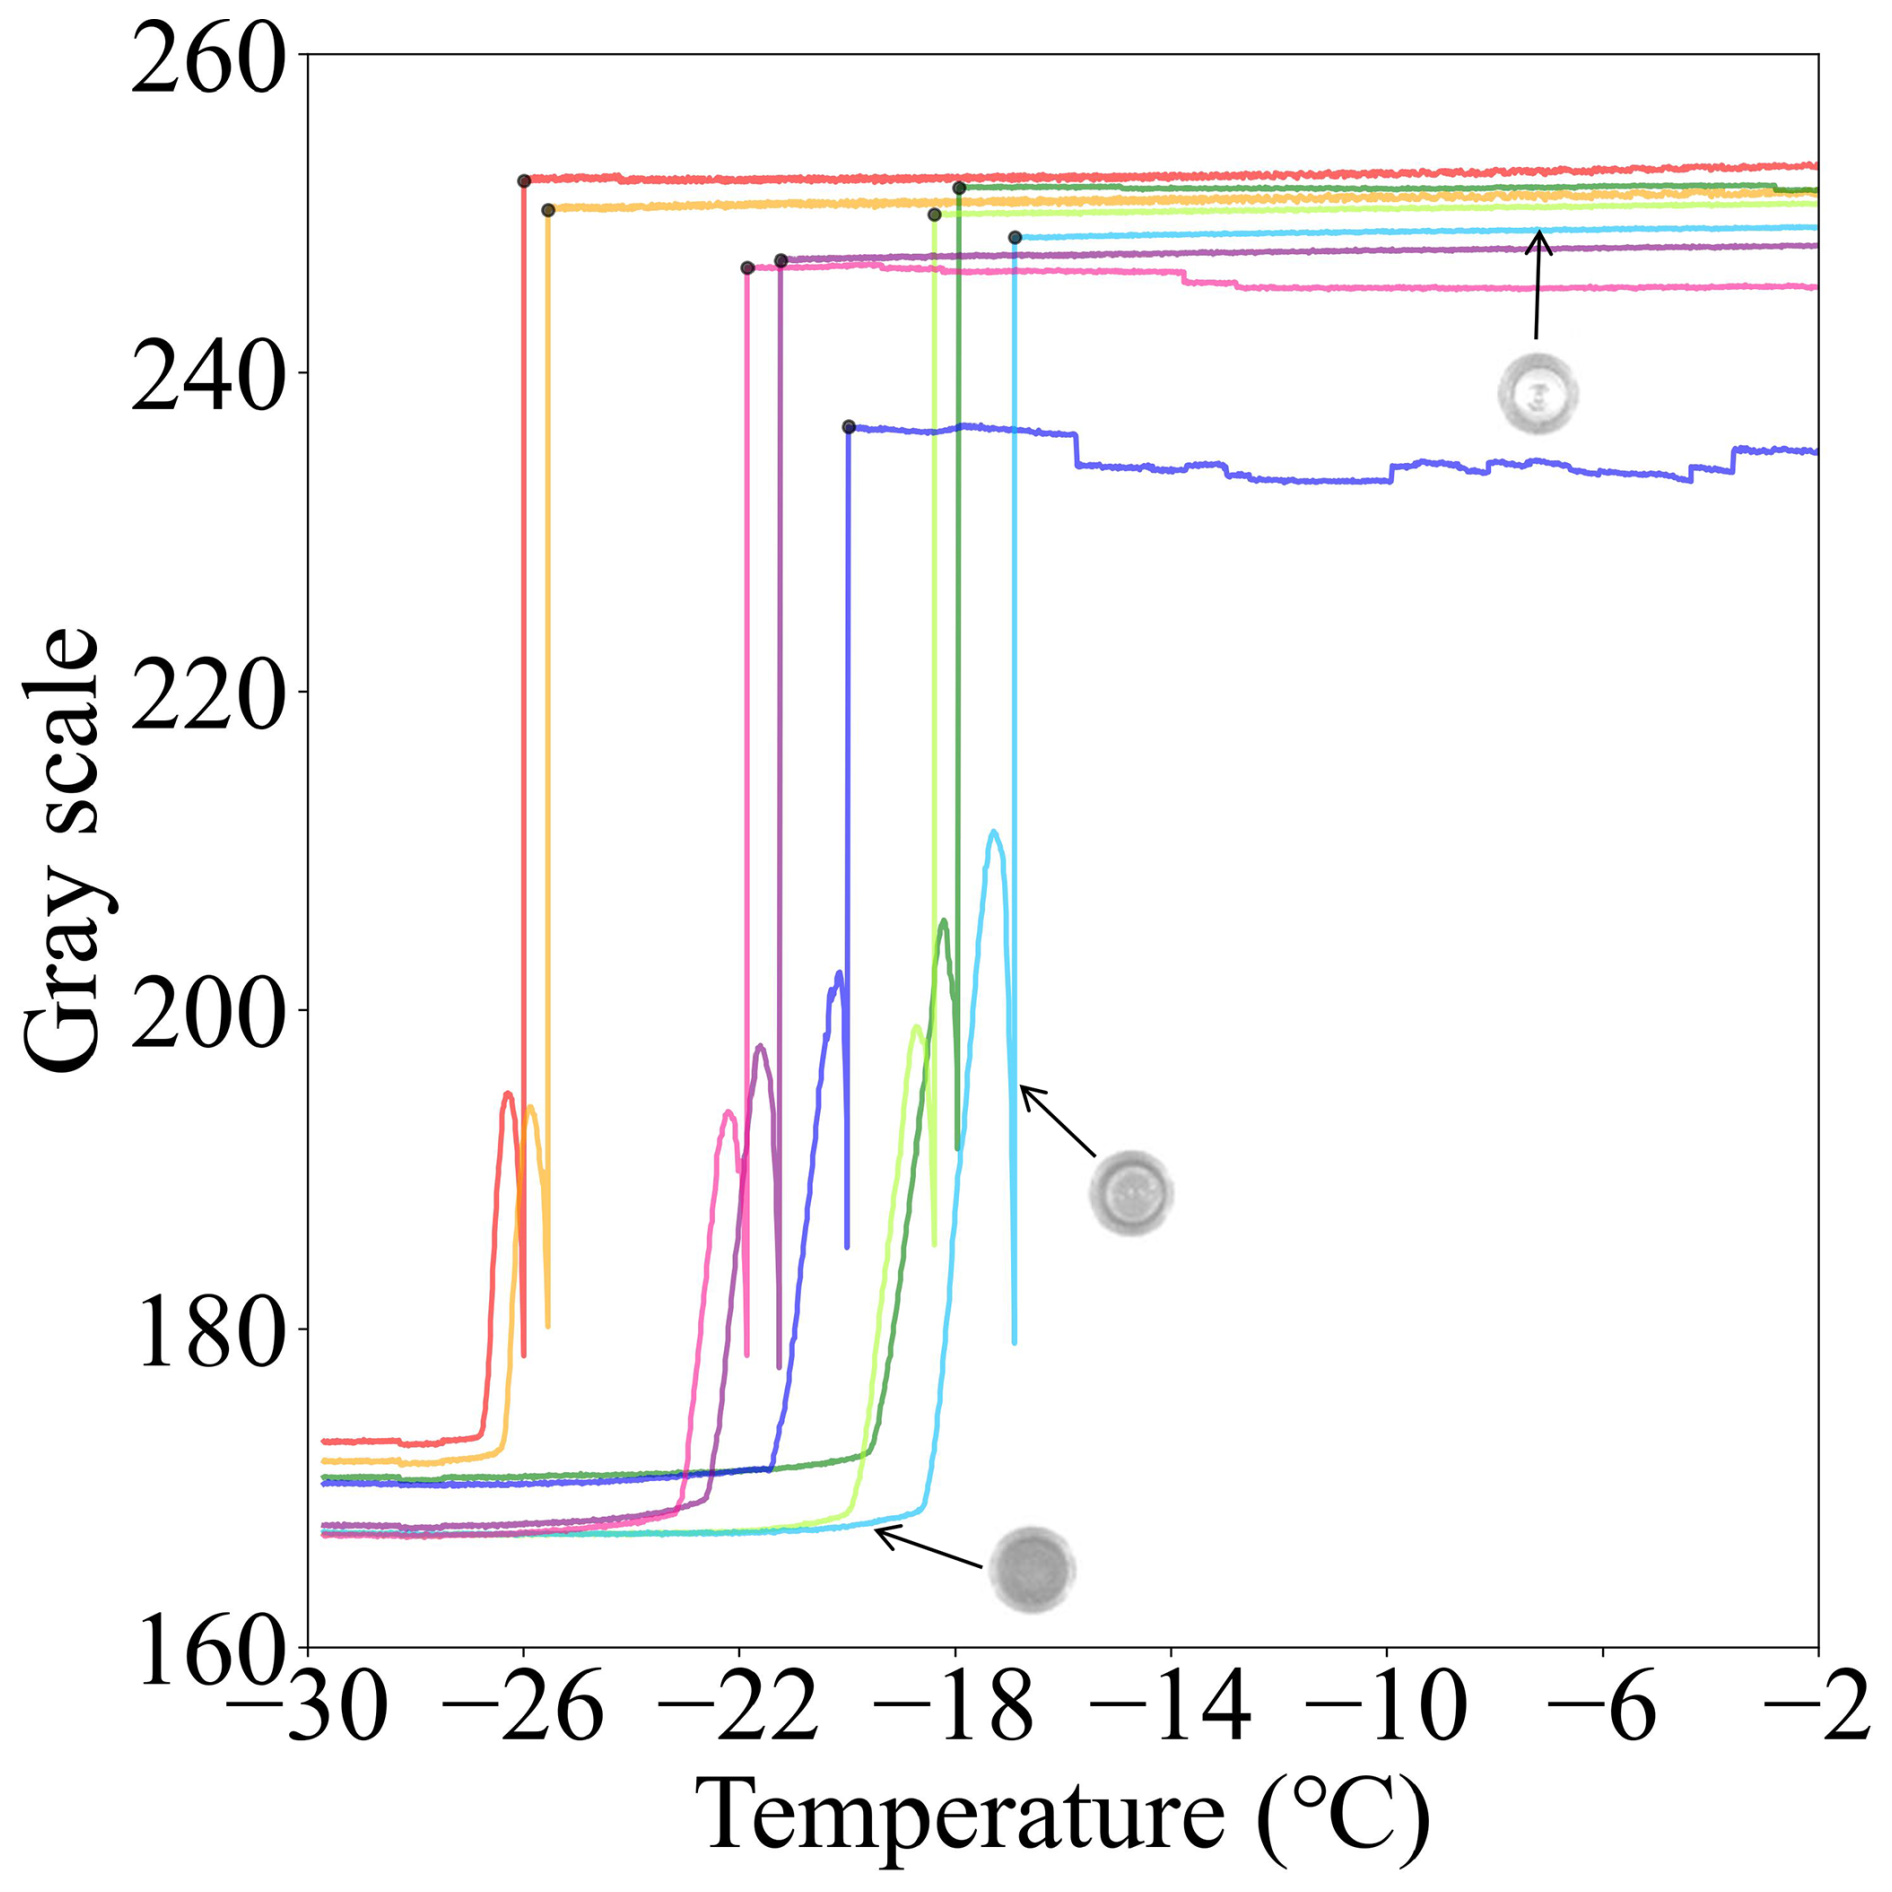
Figure 3The grayscale variation in an experiment. Black points are the recognized freezing points. The arrows refer to the grayscale image of this droplet at different phases.
2.4 Temperature validation
The temperature of FINDA-WLU has been strictly calibrated with three steps: (1) calibrating the Pt100 sensors with a standard sensor, (2) calibrating an infrared camera with Pt100 sensors, and (3) calibrating single-well temperatures by using the calibrated infrared camera.
2.4.1 Temperature sensor (Pt100) calibration
The freezing temperature reported by the instrument is based on the mean value of four customized Pt100 sensors mounted near the corners of the PCR plate. A digital thermometer (Traceable®, Fisherbrand®, Thermo Fisher Scientific, USA; 0.001 °C resolution) was calibrated in the temperature range relevant for the experiments by the National Institute of Metrology of China (the uncertainty is ±0.012 °C from 0.0 to −40.0 °C, Certificate No.: RGjc2023-04417) to serve as a reference. The calibrated digital thermometer is then used to calibrate the four Pt100 sensors. The calibrated digital thermometer and four Pt100 sensors are bound together during the calibration and immersed in the ethanol cooling bath at the same depth. The temperature within the bath is cooled down step-wise from 0.0 to −30.0 °C with an increment of −5.0 °C. To ensure uniform temperature distribution in the cooling bath, the chiller is held at each set temperature (0.0, −5.0, −10.0, −15.0, −20.0, −25.0, and −30.0 °C for 20 min, and only the recorded data during the final 20 s are averaged and used for calibration. Figure 4 illustrates the temperature differences between the reference digital thermometer and four Pt100 sensors after calibration. The temperature differences are within ±0.02 °C. A linear regression was then applied to calibrate the temperatures of the four Pt100 sensors (T1, T2, T3, and T4) using the calibrated digital thermometer's temperature as a reference. The results of the calibrated temperatures (TC1, TC2, TC3, and TC4) along with their coefficient of determination (r2) are shown in Table 1. The standard deviation of this calibration is ±0.02 °C (explained in Appendix B). The accuracy of Pt100 sensors is ±0.15 °C (mentioned in Sect. 2.1). The temperature uncertainty of Pt100 calibration is calculated as ±0.19 °C (explained in Appendix B). The mean of the four calibrated temperatures (TC_mean) is calculated in Eq. (1) and used for further calibration.
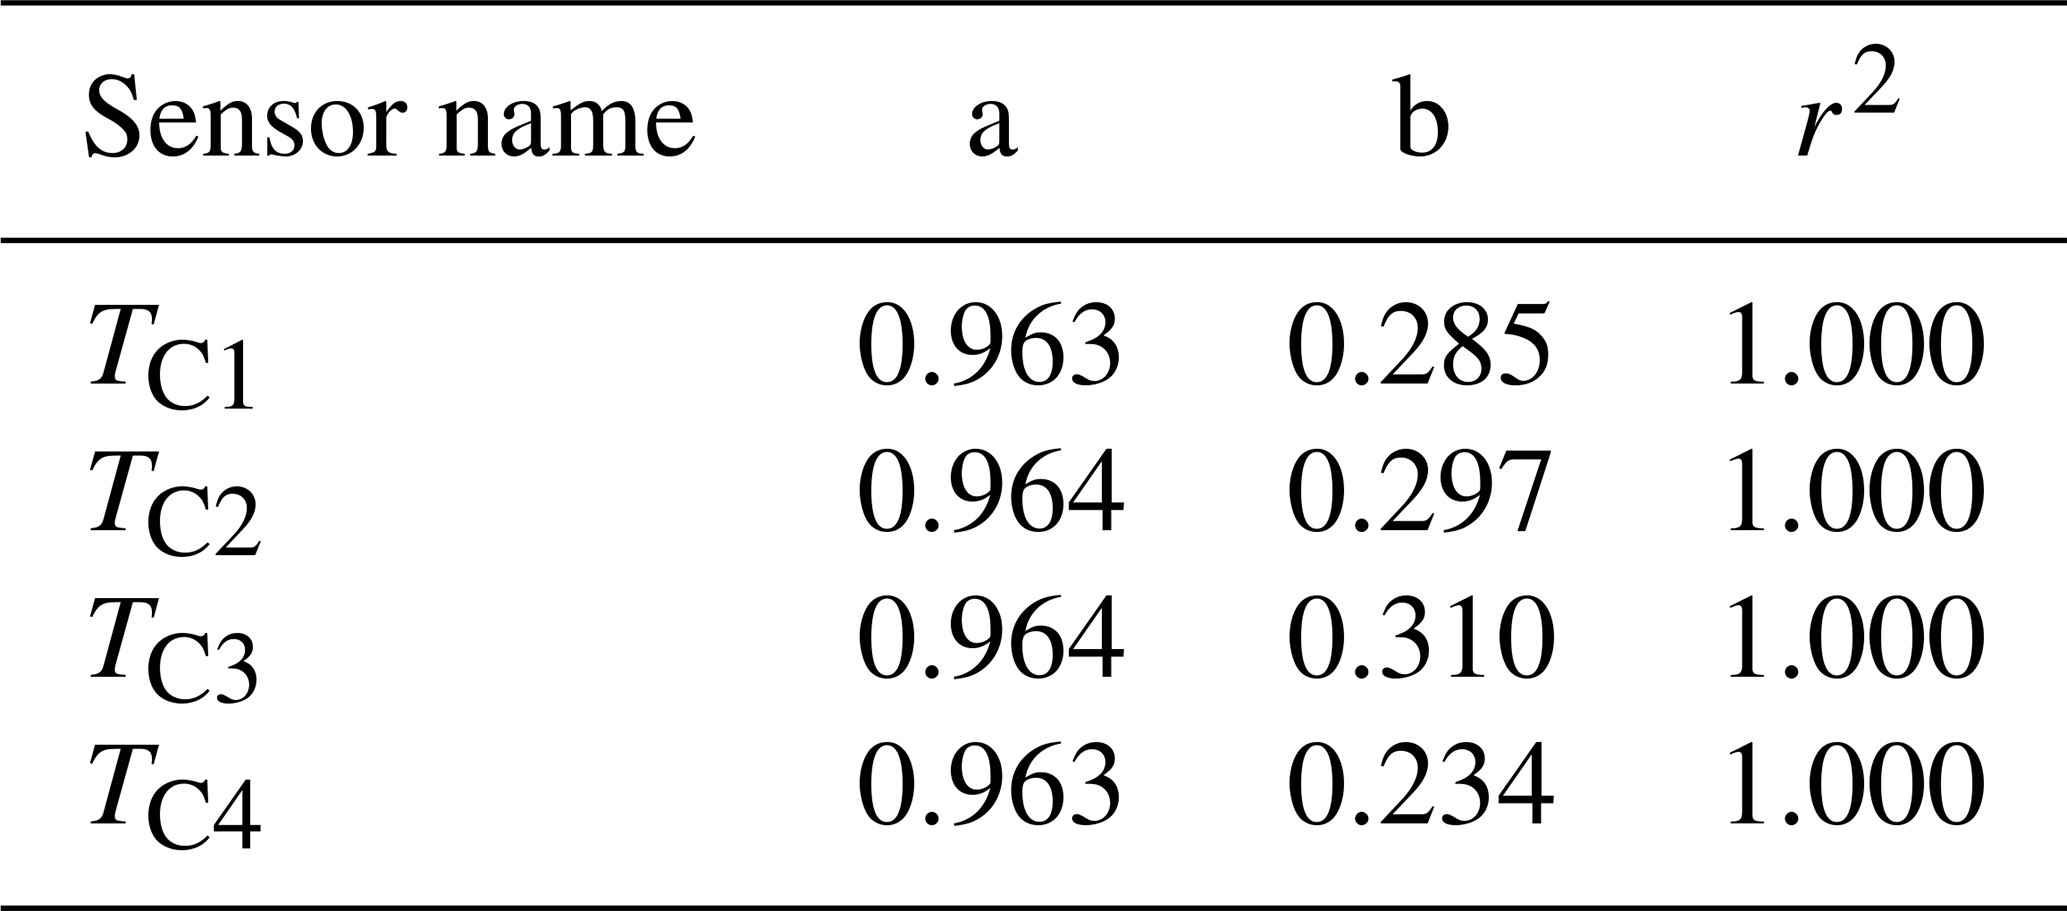
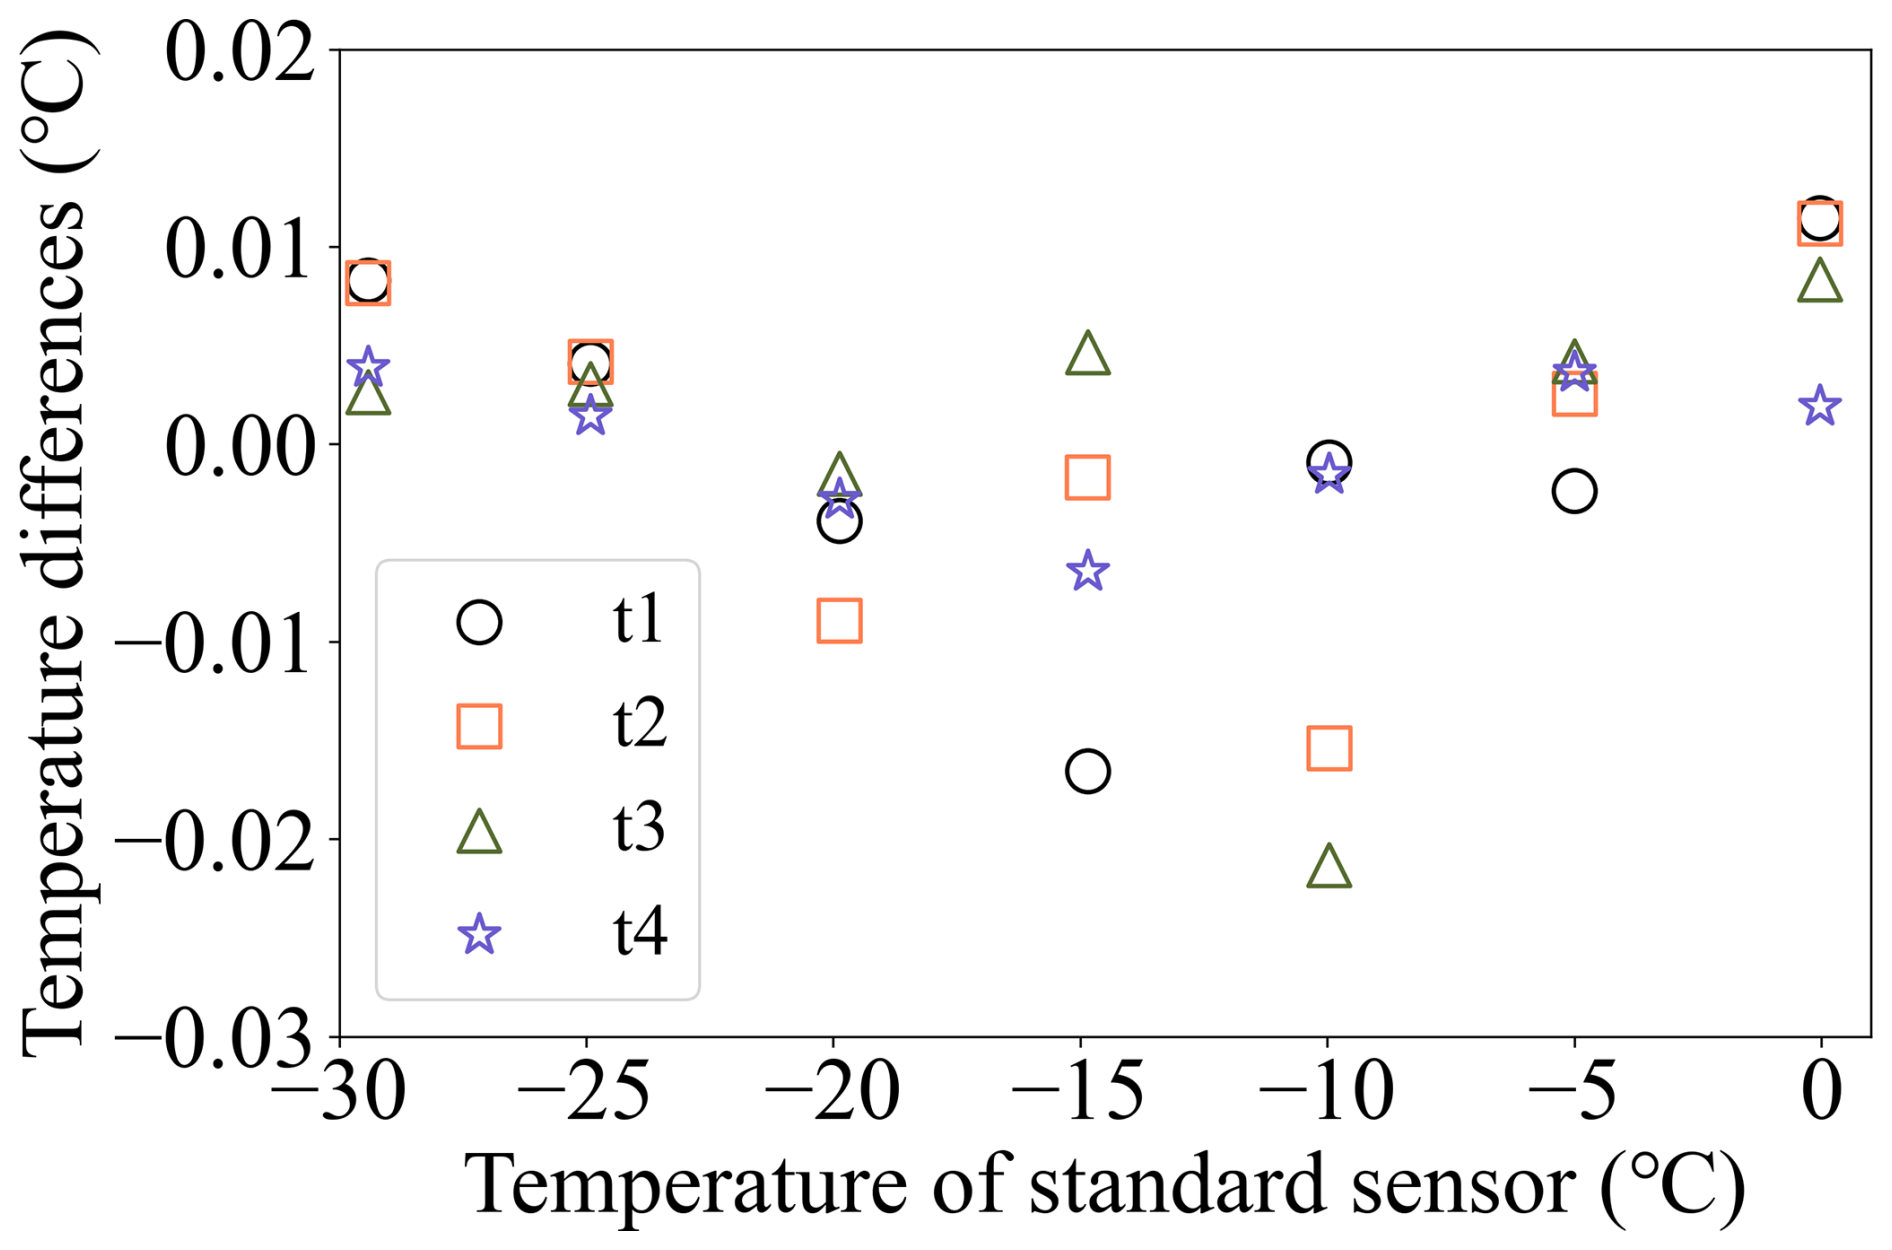
Figure 4The temperature differences between the four calibrated Pt100 sensors in FINDA-WLU and the reference digital thermometer after the calibration.
2.4.2 Infrared camera calibration
The four calibrated Pt100 sensors are then used to calibrate the temperature measured by an infrared camera (TInfrared), which is then used to measure the 96 wells' vertical and horizontal temperatures. The infrared camera has a resolution of 640 × 480 pixels and records the video thermography at 30 Hz. The infrared camera software extracts the temperature data, which is averaged to 1 Hz for analysis. The aluminum block is fixed and immersed in the ethanol of the refrigerated circulator, and a PCR plate is inserted into the aluminum block. The infrared camera is mounted above and focused on the center of an empty PCR well, and four Pt100 sensors are placed in the surrounding wells, as shown in Fig. 5a. The temperature within the bath was cooled down from 0.0 to −35.0 °C with an increment of −5.0 °C. Each temperature was held for 10 min, and the mean of TInfrared of the last 60 s was used for the calibration. As the accuracy of the infrared camera is not provided, we are using the variance during the last 60 s instead (details in Appendix B).
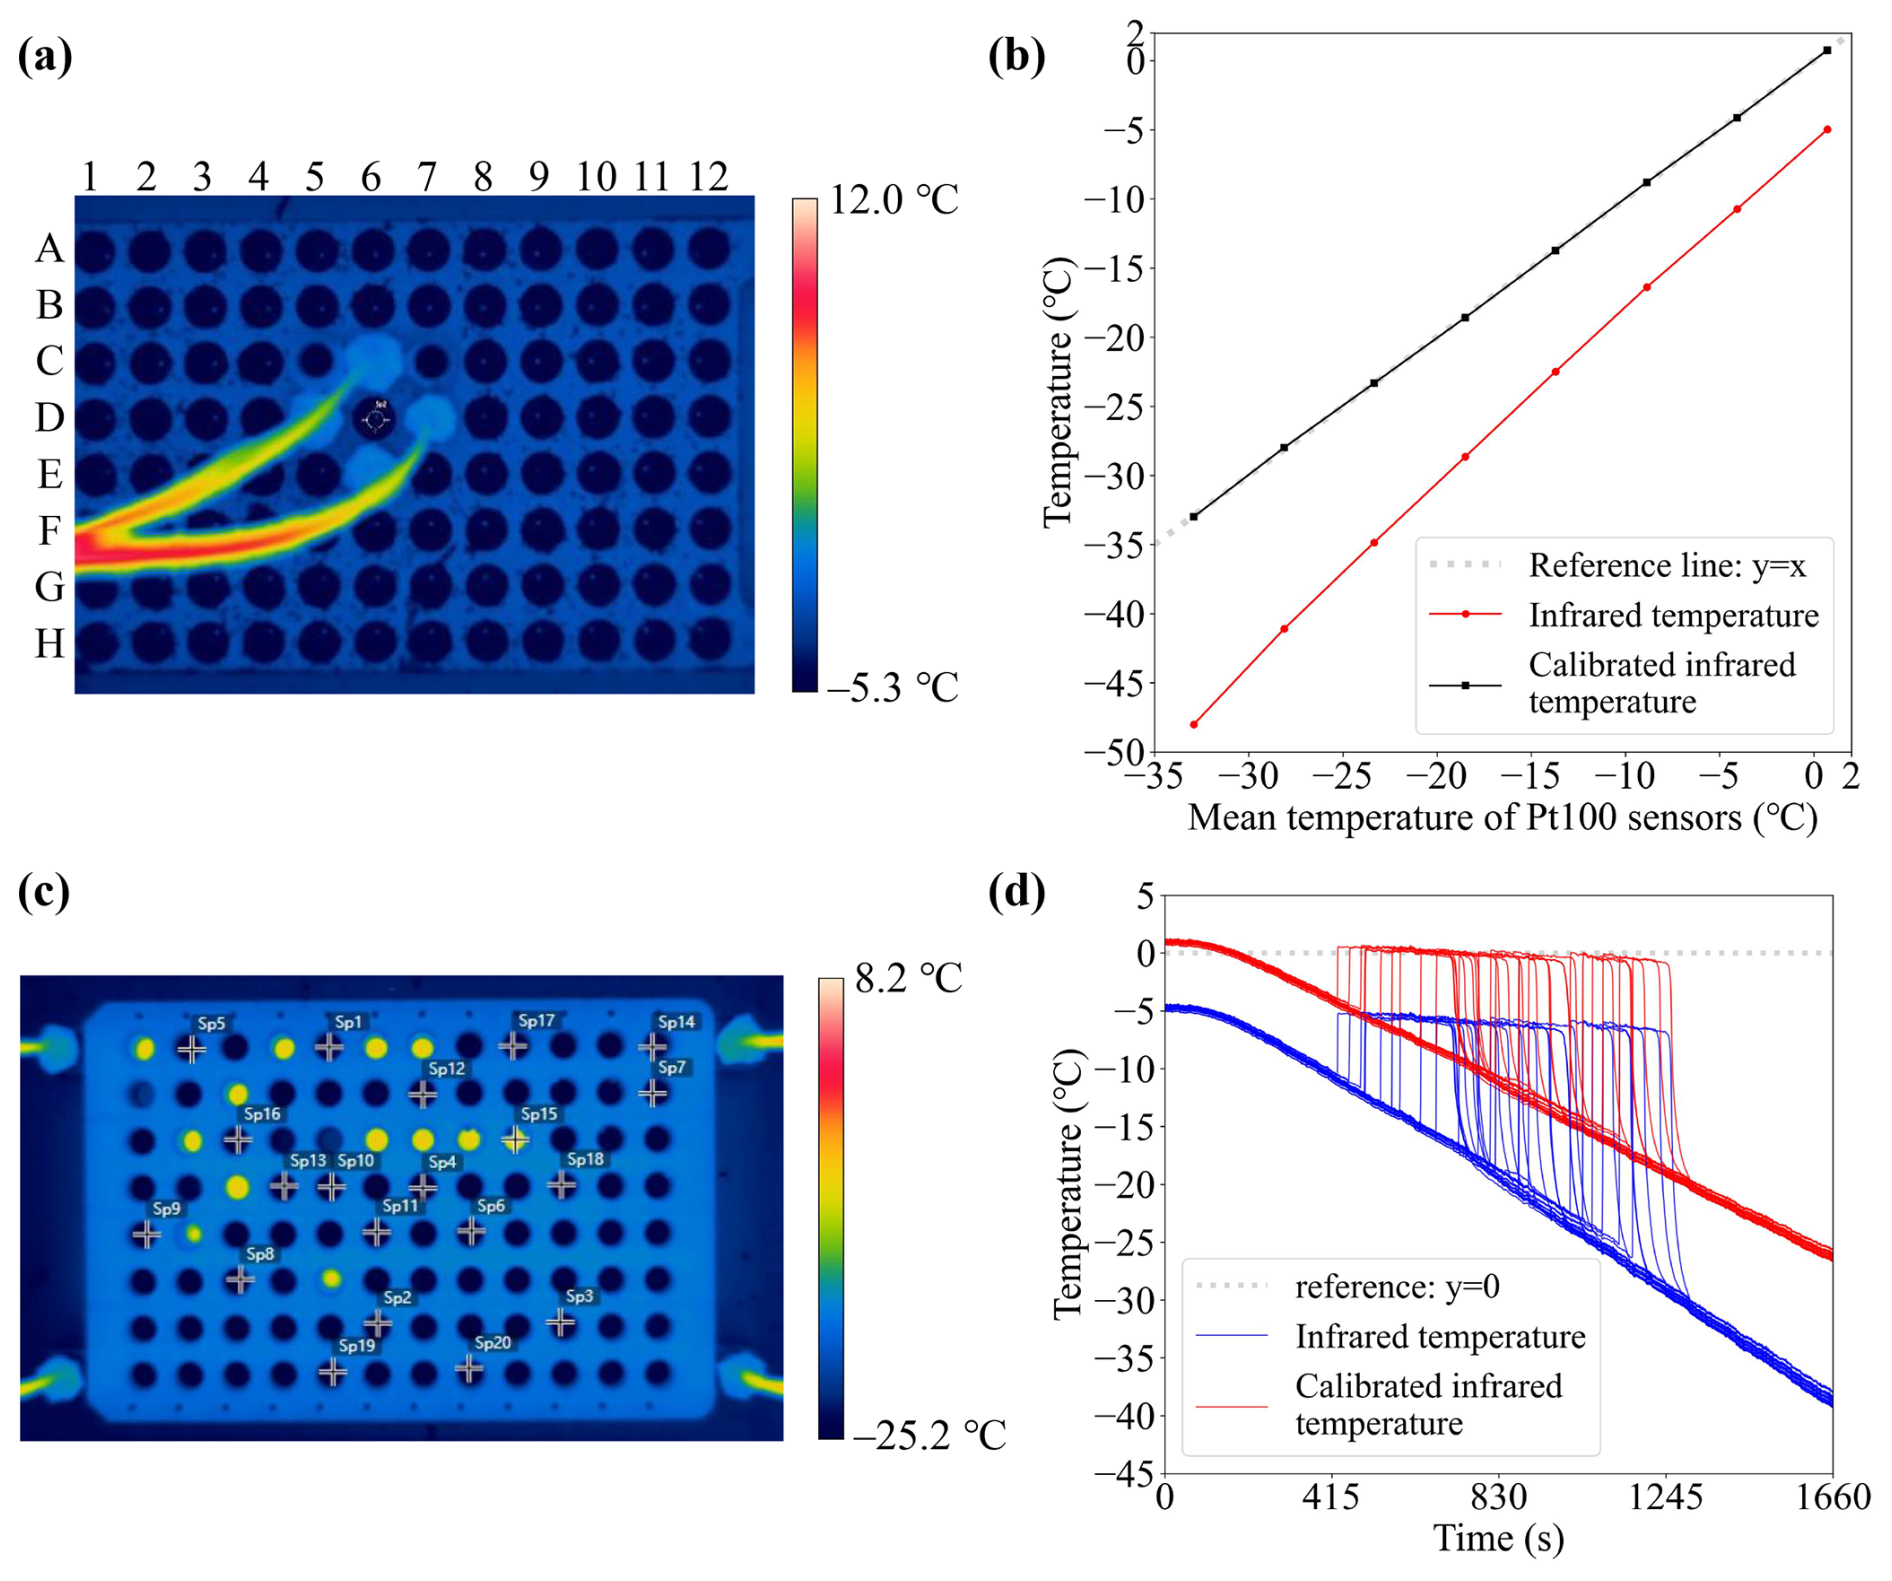
Figure 5(a) An image detected by the infrared camera during the calibration. The letters on the left and top show the labels of each well. (b) The temperature variation of the infrared camera before (red) and after (black) calibration during the freezing experiment. The x axis is the mean temperature of Pt100 sensors. The gray dashed line (mean temperature of Pt100 sensors) is a reference for the calibrated infrared temperature. (c) The infrared camera view for the validation experiment. The 20 selected PCR wells, where the temperature profile is extracted are marked with white crossings. (d) The temperature profiles of the 20 selected wells are measured by the infrared camera before (blue lines) and after (red lines) its calibration. The dashed gray line is a reference of 0.0 °C.
The mean temperature of four Pt100 sensors is considered to be equal to the temperature of the center well measured with the infrared camera and thus was used to calibrate the infrared camera. The functions of the calibrated infrared temperature (TC_Infrared) and r2 are:
Figure 5b shows the infrared and the calibrated infrared temperature as red and black lines, respectively. The dashed gray line is the mean temperature of Pt100 sensors. The standard deviation of this quadratic regression calibration is ±0.09 °C. The temperature uncertainty of infrared camera calibration is calculated as ±0.19 °C (explained in Appendix B).
The calibration result is validated by observing the temperature of droplets in the PCR plate when they are freezing. When a water droplet freezes in the PCR well, the latent heat is released during the phase change and the droplet temperature increases to 0 °C (Harrison et al., 2018). We fill the PCR wells with 50 µL Milli-Q ultrapure water, and cool them down with a cooling rate of 1.0 °C min−1 from 0.0 to −35.0 °C. During the cooling, TInfrared of 20 randomly selected wells (white crosses in Fig. 5c) is extracted with 1 Hz resolution. Figure 5d shows the temperature obtained by profiles of these 20 wells before (TInfrared; blue lines) and after calibration (TC_Infrared; red lines). The mean temperature of the calibrated values at the ice-water equilibrium point during the experiment was close to 0.0 °C (−0.018 ± 0.09 °C), indicating that the infrared camera is well-calibrated.
2.4.3 Vertical heat transfer
Simulation results indicate that the heat distribution throughout the aluminum block wells requires the precise placement of the temperature probe to ensure its readings accurately reflect the sample volume's temperature (Beall et al., 2017). We designed four freezing experiments to understand the heat transfer in the aluminum block, PCR plate, and the droplets in the FINDA-WLU. The four calibrated Pt100 sensors (see Sect. 2.4.1) were placed in their four corner positions (the same as the regular freezing experiment) and the infrared camera was mounted above the aluminum block. These temperatures were measured in four different scenarios: (1) no PCR plate, TC_Infrared measurement at the bottom of aluminum block wells; (2) with empty PCR plate, TC_Infrared measurement at the bottom the PCR plate well; (3) with PCR plate filled with 50 µL Milli-Q ultrapure water per well, TC_Infrared measurement at the liquid's surface in the well; (4) with PCR plate filled with 50 µL ethanol per well, TC_Infrared measurement at the liquid's surface in the well. The temperature was decreased from 0.0 to −35.0 °C with a cooling rate of −1.0 °C min−1 during these freezing experiments.
The differences between TC_Infrared and the average temperature of four calibrated Pt100 sensors (TC_mean) as a function of chiller temperature is shown in Fig. 6. The similar temperature variation between the bottom of the aluminum block (red line) and the bottom of the empty PCR plate (cyan line) indicates a good heat transfer from the aluminum block to the PCR plate. A sudden increase in the surface temperature of water droplets (yellow line) indicates the release of latent heat upon freezing. After freezing, the temperature profile aligns closely with that observed at the bottom of the empty PCR plate, suggesting that heat conduction is efficient among the aluminum block, PCR plate, and water droplet at a cooling rate of −1.0 °C min−1. Importantly, the temperature between the surface of the water droplet and the bottom of the empty PCR plate shows a large difference before the water droplet freezing, indicating that the heat transfer is delayed from the bottom of the PCR plate to the surface of the water droplet. Therefore, the infrared camera calibration should be performed in the empty PCR plate, as we have done in Sect. 2.4.2. A temperature discrepancy between water and anhydrous ethanol was also observed, which is likely attributable to differences in their heat capacities.
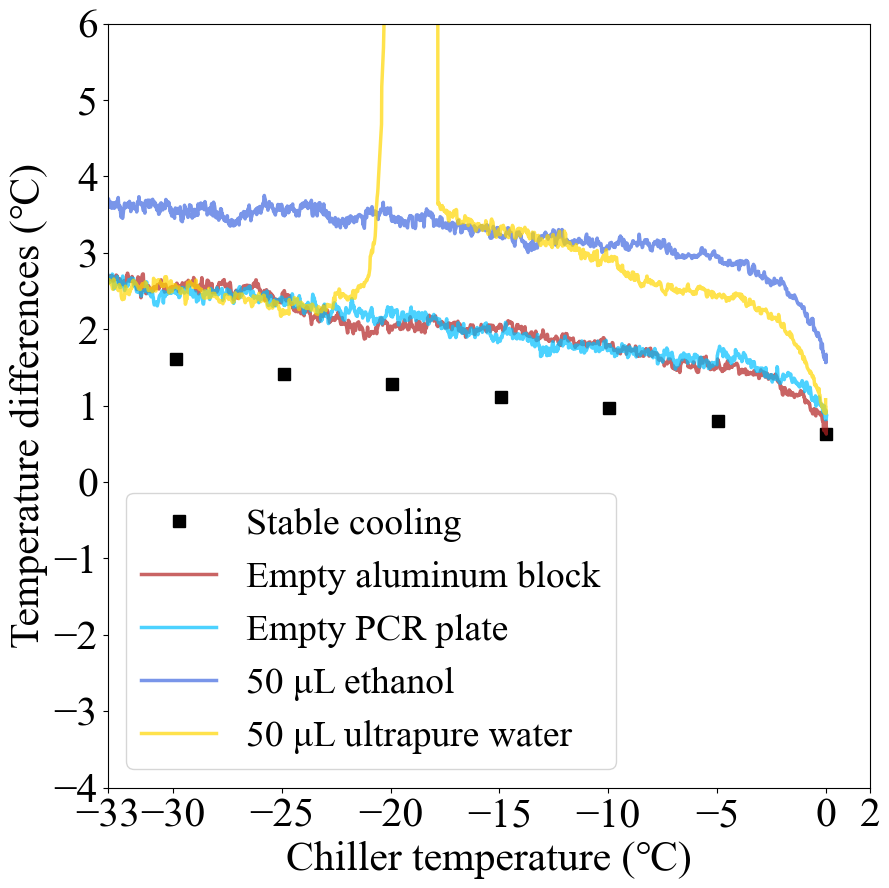
Figure 6Temperature differences between the infrared camera and the mean temperature of the four calibrated Pt100 sensors as a function of the chiller temperature.
An additional experiment was performed to evaluate the temperature difference between the Pt100 sensors and the bottom of the aluminum block wells with a much lower cooling rate. We use a −5.0 °C temperature step from 0.0 to −35.0 °C, with each temperature maintained for 30 min to allow for sufficient heat transfer. The different temperature variation between this experiment (black squares in Fig. 6) and the empty PCR plate indicates that the cooling rate affects the heat transfer, as well as the temperature calibration.
2.4.4 Horizontal temperature calibration
The temperature bias across 96-well PCR plates has been discussed for aluminum block-based instruments with simulations (Beall et al., 2017), calibration substance freezing experiments (Kunert et al., 2018), and by comparison of temperature differences between corner and center wells (David et al., 2019). The horizontal temperature distribution at the bottom of an empty 96-well PCR plate is measured by the calibrated infrared camera (TC_Infrared), together with four Pt100 sensors placed in the corners. The infrared camera recorded the temperature at 30 Hz and averaged the data to 1 Hz to fit the Pt100 data frequency. The freezing experiment was conducted from 0.0 to −35.0 °C at the rate of −1.0 °C min−1. Figure 7 shows the results of the temperature of each empty PCR well at 0.0, −10.0, −20.0, and −30.0 °C (refer to TC_mean). A clear heterogeneous temperature distribution existed. The PCR wells near the side boundary are warmer than those near the center, which was also observed in a previous study (David et al., 2019).
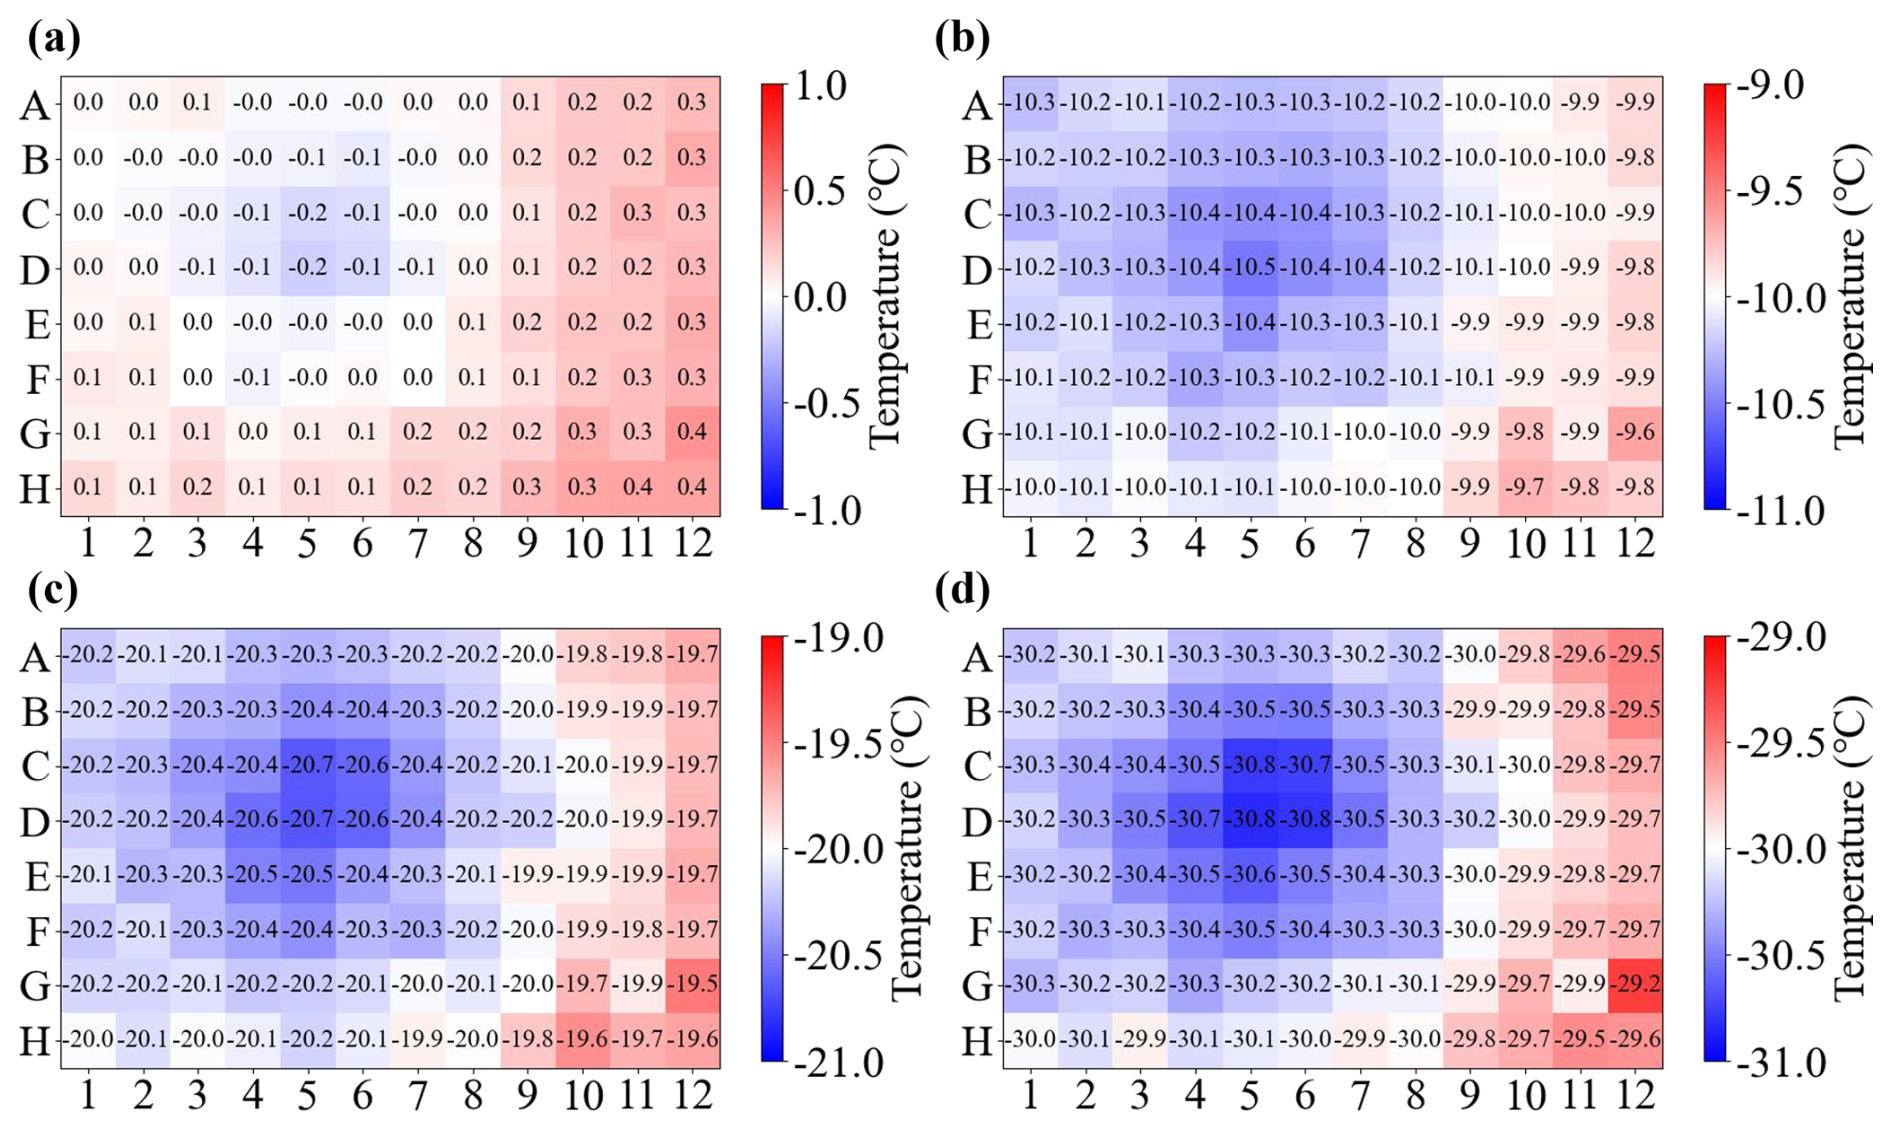
Figure 7The infrared temperature of each empty PCR well at (a) 0.0 °C, (b) −10.0 °C, (c) −20.0 °C, and (d) −30.0 °C.
To address the horizontal temperature heterogeneity of the PCR plate, an individual-well calibration approach was conducted. The mean temperature of the four calibrated Pt100 sensors (TC_mean) was used to calibrate the temperature of each PCR well:
where is the calibrated temperature of the ith well, and ai and bi are the slope and intercept of the regression, respectively. For each PCR well, a standard deviation of Eq. (3) is calculated, and two times the largest standard deviation (±0.22 °C is treated as the uncertainty for this step. Overall, the temperature uncertainty of FINDA-WLU is ±0.60 °C (explained in Appendix B).
The frozen fraction (FF) of droplets can be calculated based on Eq. (4), which assumes that droplet freezing is only temperature-dependent:
where N(T) denotes the number of droplets that have frozen at temperature T, and N0 represents the total number of droplets.
Following Vali (1971), the cumulative number concentration of INPs (CINP(T)) per droplet, can be obtained based on Eq. (5):
where Vdroplet represents the volume of the droplet, which is 50 µL in our measurements.
For suspensions for which a certain mass of ice active material was added to a certain volume of water, the mass concentration is Cm. With that, CINP(T) can be further normalized to estimate the INP numbers per unit mass of ice active material based on Eq. (6):
CINP(T) is calculated from statistical analysis; therefore, it is necessary to assess the reliability of the results. According to the binomial distribution method proposed by Agresti and Coull (1998), the 95 % confidence interval of the FF at temperature T, CI95 %(T), is calculated as:
The performance of FINDA-WLU was validated by testing the freezing behavior of Milli-Q ultrapure water, ATD, Snomax®, and precipitation samples and comparing them with previous studies.
4.1 Sample preparation
Ultrapure water (resistivity > 18 MΩ cm and TOC < 10 ppb) produced by the Milli-Q® IQ 7000 system was used in our experiments. Suspensions of Arizona Test Dust (ATD, Powder Technology, Inc.; ISO 12103-1, A4 Coarse) and Snomax® were prepared by dispersing the respective solid particles in ultrapure water. Both materials are widely used to evaluate the performance of DFT. The ATD suspension with a mass concentration of 1.04 × 10⁻¹ g L−1 was prepared by mixing 3.11 mg ATD with 30 mL ultrapure water. The ATD solid sample was weighted using a high-precision balance (Cubis MSA6.6S-0CE-DF, Sartorius, Germany), and the ultrapure water was then added into a 50 mL conical tube (Eppendorf, Germany). The suspension was then shaken on a shaking platform (NMSG-12, NuoMi®, China) for 20 min at its maximum rate to ensure homogeneity. The suspension was diluted to different concentrations to investigate the INA of ATD over a broader and lower temperature range (David et al., 2019). Suspensions with other concentrations, including 1.04 × 10⁻⁴, 1.04 × 10⁻³, and 1.04 × 10⁻² g L−1, were prepared by diluting the original 1.04 × 10⁻¹ g L−1 ATD suspension with ultrapure water. Similarly, a Snomax® suspension with a concentration of 1.00 × 10⁻¹ g L−1 was initially prepared by mixing 3.01 mg Snomax® with 30 mL ultrapure water. Since Snomax® shows INA at temperatures above −3.0 °C (Wex et al., 2015; Wieber et al., 2024), it must be diluted to a much lower concentration than ATD to observe its INA at low temperatures. The dilutions ranged from 10 to 108 fold, yielding concentrations of 1.00 × 10⁻⁸, 10−7, 10−6, 10−5, 10−4, 10−3, and 10−2 g L−1.
In a cooling experiment, the suspension of ATD or Snomax® with one concentration was pipetted into a PCR plate using an electric pipette (Eppendorf Xplorer® plus, Variable 50–1000 µL) to form 96 droplets, each with a volume of 50 µL. Note that the suspension was re-shaken after pipetting every 32-drops to reduce the sedimentation of solid particles and reduce the difference in concentration of droplets.
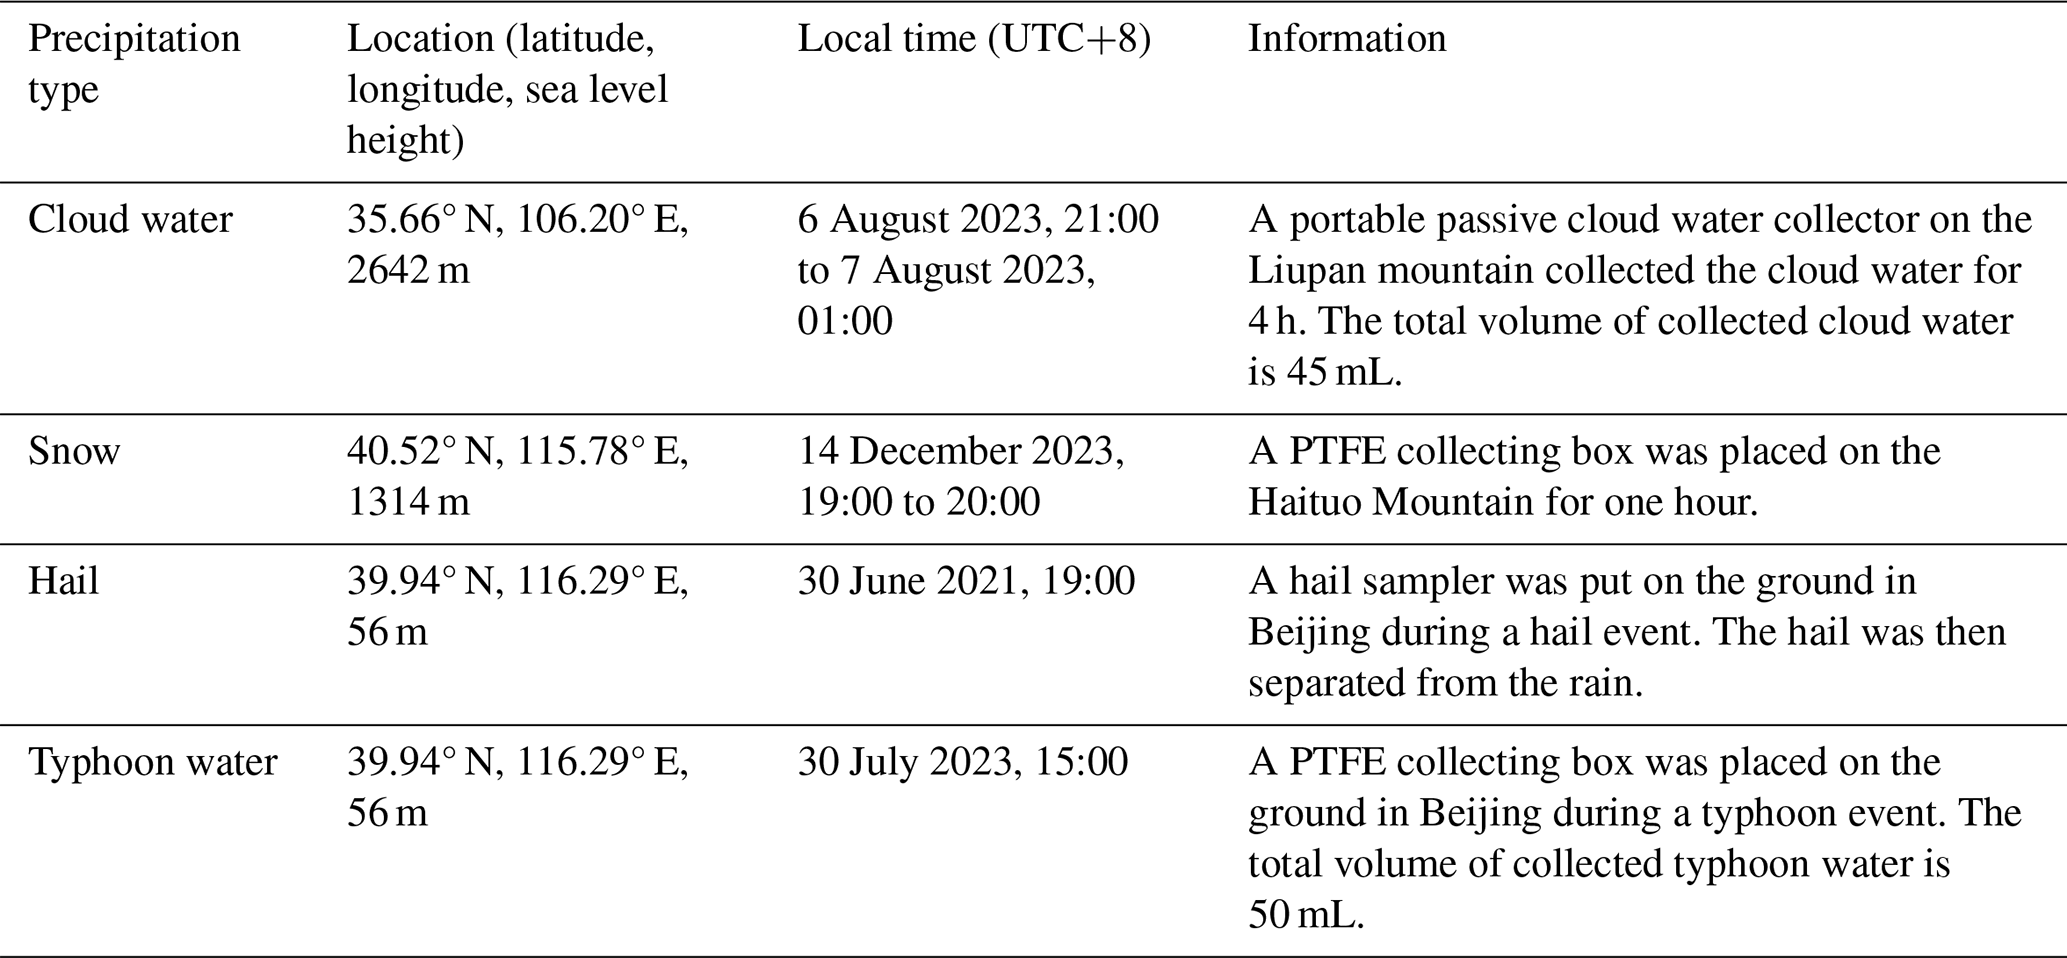
Precipitation samples were collected in situ, with details on location, time duration, sample methods, and other relevant information provided in Table A1. All samples were stored in a freezer at −20 °C before analysis. The dilution was prepared by first diluting 1 mL of the original sample with 14 mL of ultrapure water, creating a 15-fold dilution. It was then further diluted by mixing 1 mL with 14 mL of ultrapure water, producing a 225-fold dilution. The 3375-fold dilution was made similarly by mixing 1 mL of 225-fold dilution with 14 mL ultrapure water. Each dilution was mixed thoroughly before the next diluting operation.
4.2 Freezing of droplets from Milli-Q water
The freezing behavior of ultrapure water used to prepare sample suspensions was first measured to quantify background INPs present in the ultrapure water. The measurement also serves as a quality control for the immersion freezing of sample droplets. Milli-Q water is tested and the FF as a function of temperature is shown in Fig. 8. The median freezing temperature (T50) of droplets, where 50 % of droplets are frozen (FF = 50 %), is −26.5 ± 0.04 °C. The temperatures obtained by repeating experiments are similar, demonstrating the stable quality of the ultrapure water and the reproducibility of the freezing measurements.
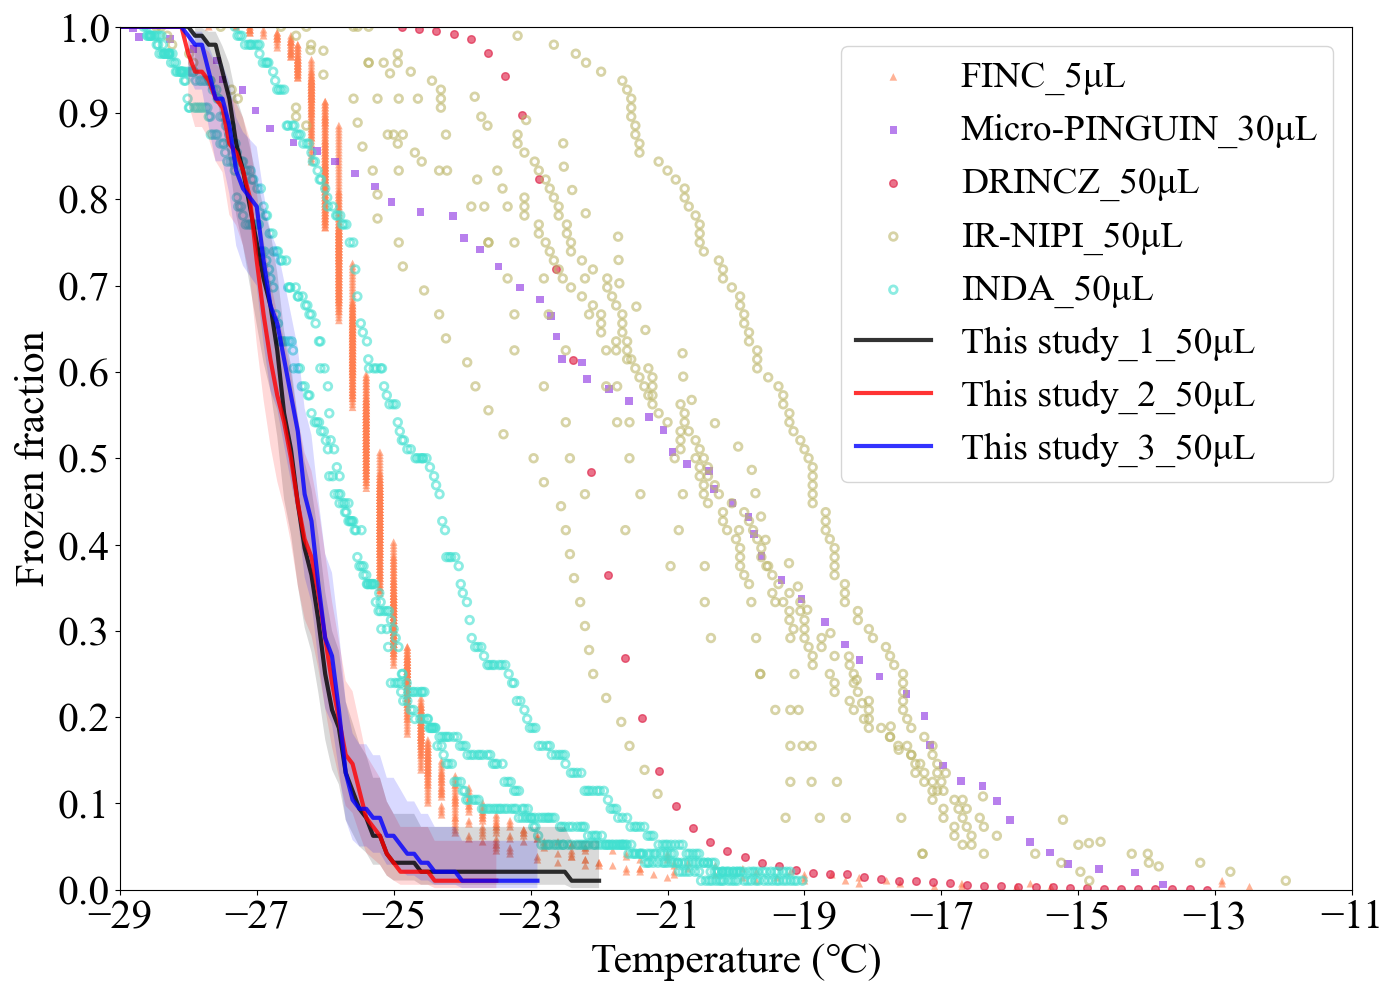
Figure 8Frozen fraction of Milli-Q water. The results of FINDA-WLU are shown as triangles, dots, and stars. The shaded area indicates the measurement uncertainties. Results for other droplet freezing techniques (micro-PINGUIN and DRINCZ) are shown as purple and green lines, respectively.
The FF of Milli-Q water droplets using DFTs with different volumes, including Freezing Ice Nuclei Counter (FINC) (Miller et al., 2021), microtiter plate-based ice nucleation detection results in gallium (Micro-PINGUIN) (Wieber et al., 2024), Droplet Ice Nuclei Counter Zurich (DRINCZ) (David et al., 2019), InfraRed-Nucleation by Immersed Particles Instrument (IR-NIPI) (Harrison et al., 2018), and Ice Nucleation Droplet Array (INDA) (Chen et al., 2018b), are shown in Fig. 8 for comparison. In general, FINDA-WLU (T50= −26.5 ± 0.04 °C) shows a considerably lower T50 compared to those measured by INDA (T50= −25.5 °C, FINC (T50= −25.4 °C), DRINCZ (T50= −22.2 °C, IR-NIPI (T50= −21.0 °C, and Micro-PINGUIN (T50= −20.8 °C. It is worth noting that the droplet sizes examined by FINC (5 µL) and Micro-PINGUIN (30 µL) are smaller than in FINDA-WLU, while the droplet size used in other DFTs, such as DRINCZ, is equal to the one in FINDA-WLU. The smaller droplets typically tend to freeze at lower temperatures than larger droplets due to the lower likelihood of forming an ice embryo in smaller droplet volumes. Therefore, the even lower T50 of larger droplets obtained in our measurements compared to other studies, indicating a comparably low water background and less contamination introduced during our measurement.
4.3 Ice nucleation of Arizona Test Dust
ATD has been widely used as a mineral dust proxy by ice nucleation communities (Bundke et al., 2008; Welti et al., 2009; Perkins et al., 2020; Mahant et al., 2023). The FF of ATD-containing droplets is shown in Fig. A1. The INP number per unit mass (nm) of ATD is derived based on Eq. (3) and the results are shown in Fig. 9. The uncertainties associated with nm are indicated by the shaded area, which is derived according to the method suggested by Agresti and Coull (1998). nm of ATD increases with decreasing temperatures, as expected, with more INPs becoming ice-active at lower temperatures. nm obtained from droplets featuring different ATD concentrations (1.04 × 10⁻⁴ to 1.04 × 10⁻¹ g L−1) align well with each other in the overlapping temperature ranges. This indicates that the nm of ATD scales with particle mass, which is also observed by many other studies using ATD (Murray et al., 2011; Niedermeier et al., 2011; Boose et al., 2016).
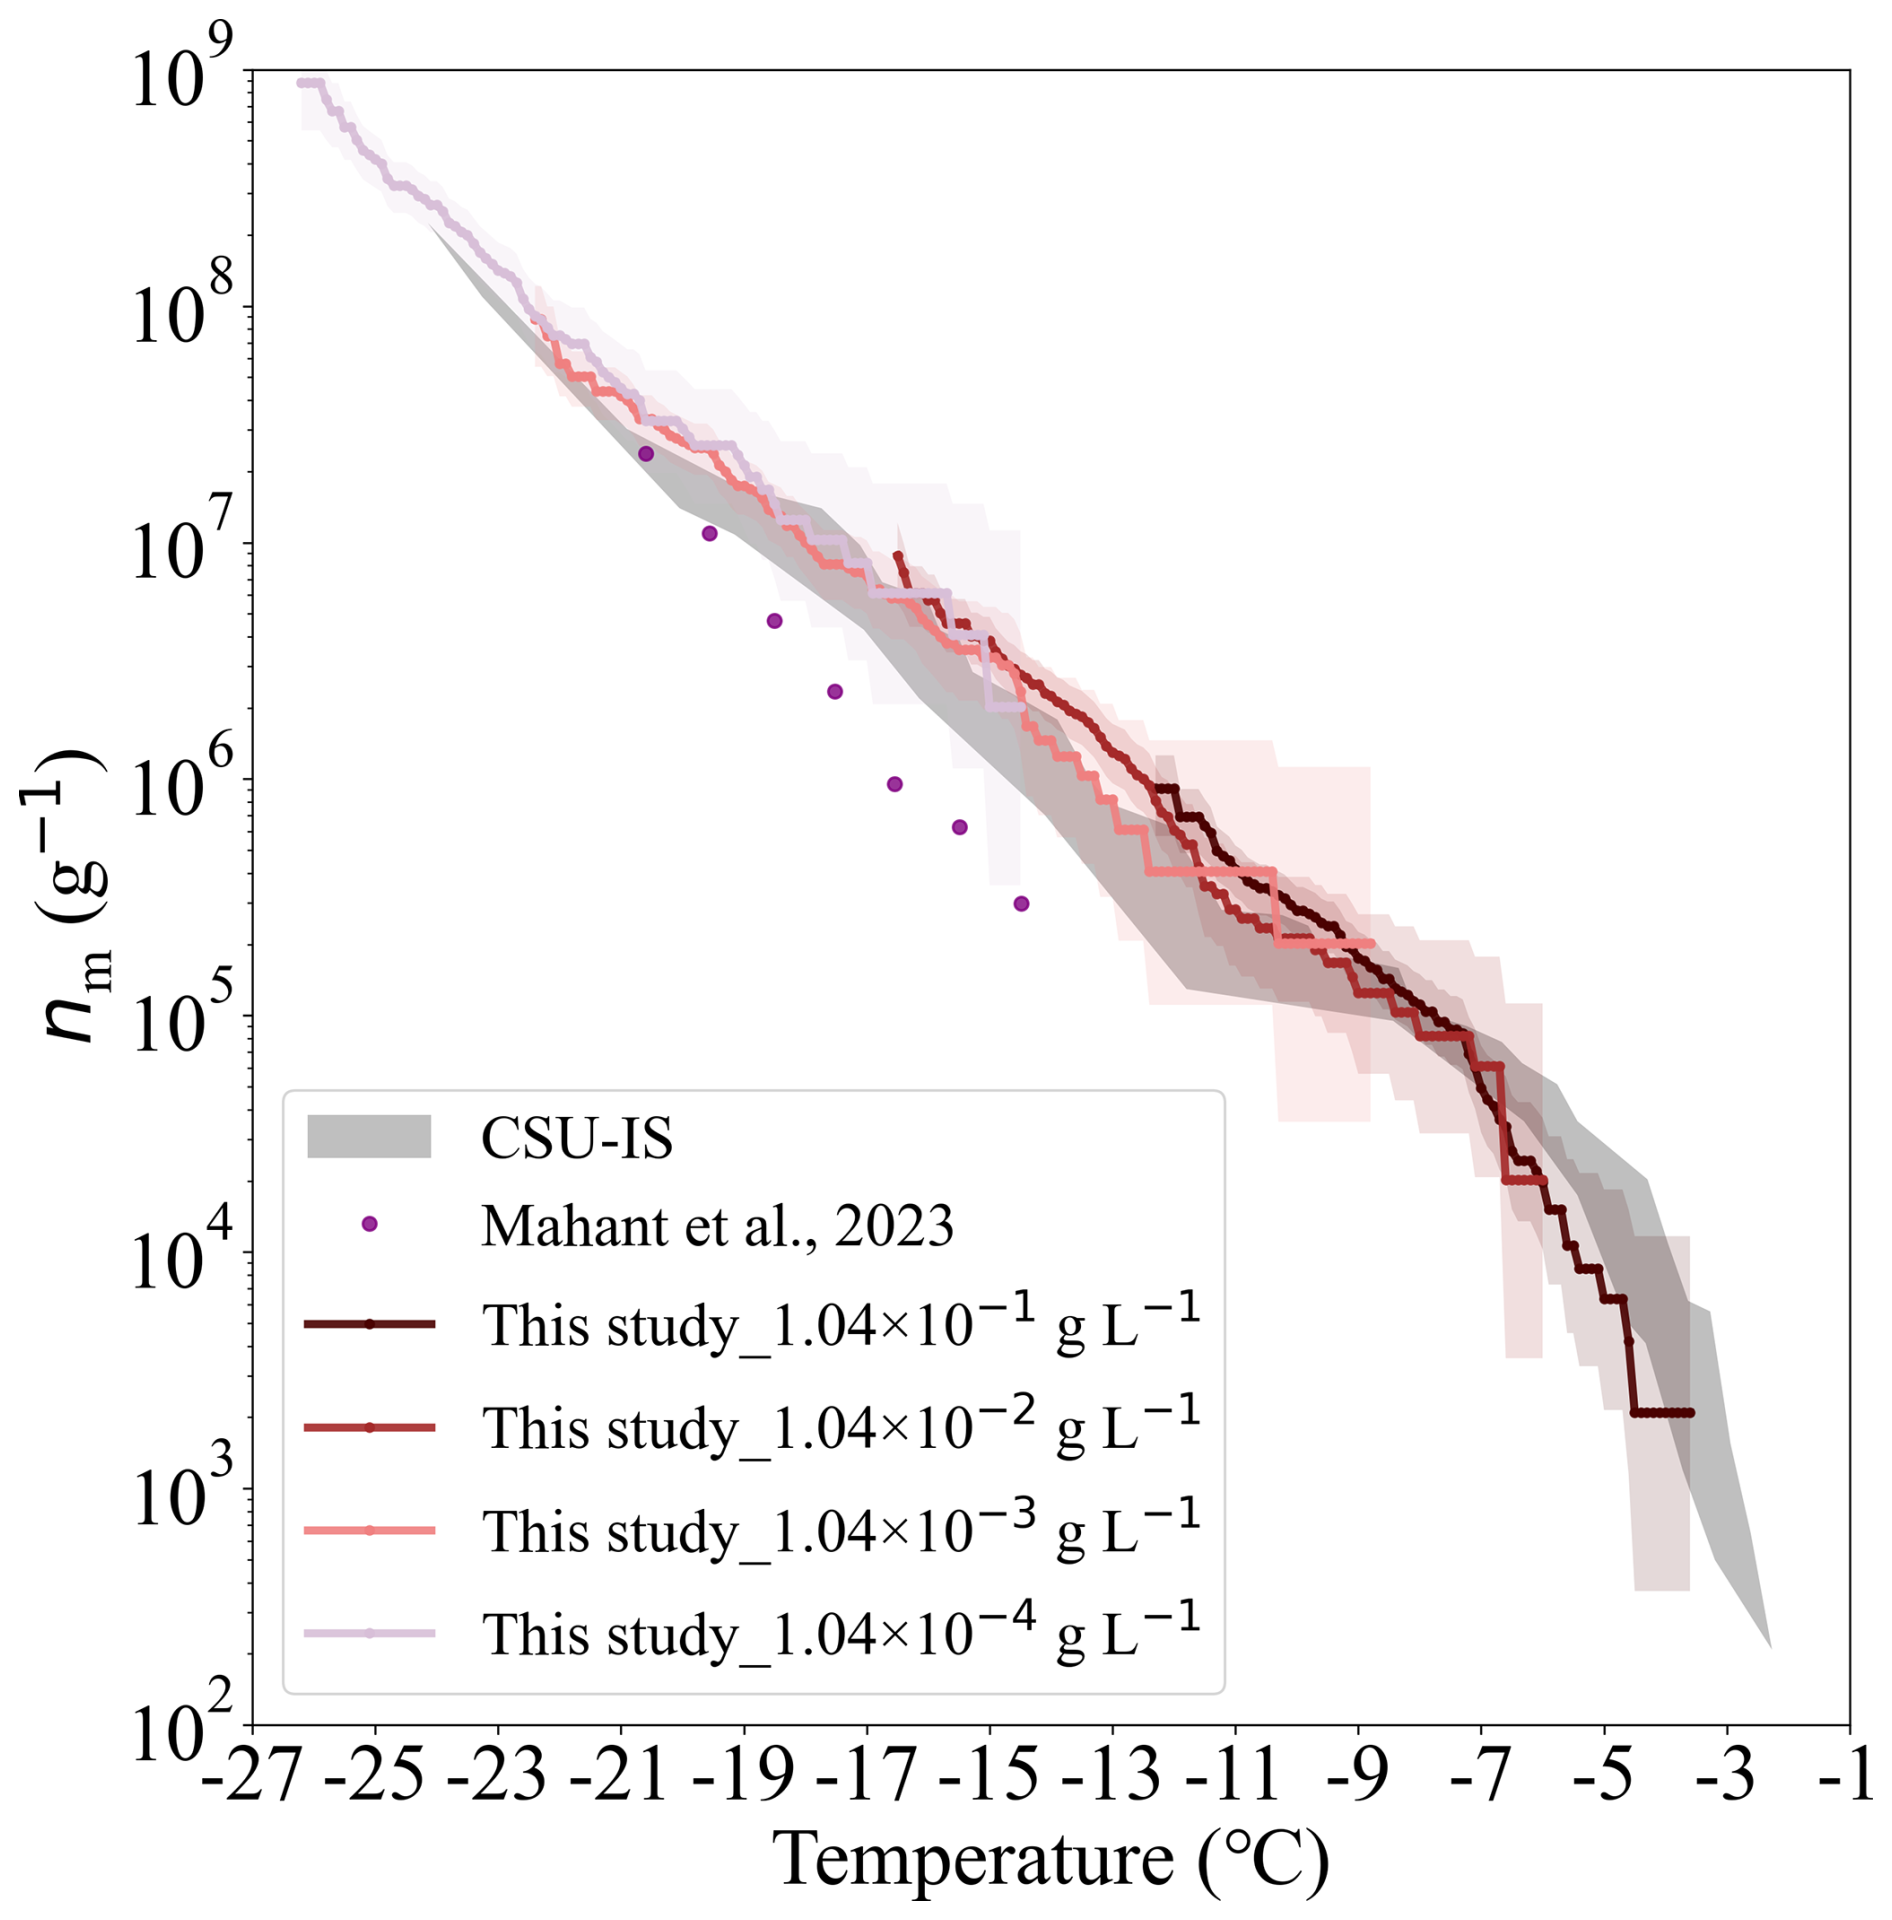
Figure 9The nm of ATD depending on temperature. The data obtained from our study are shown by colourful lines, and the corresponding shaded areas indicate the uncertainties of nm, derived by Agresti and Coull (1998). The results reported by CSU-IS measurements and by Mahant et al. (2023) are shown as gray strips and purple dots, respectively.
The nm of ATD measured by the Colorado State University ice spectrometer (CSU-IS) (Perkins et al., 2020) and a cold-stage developed by Mahant et al. (2023) is also shown in Fig. 9 for comparison. CSU-IS detected the freezing of 32 droplets with a volume of 50 µL at a cooling rate of 0.3 °C min−1. The cold stage measured the freezing of 100 droplets with a volume of 1 µL at a cooling rate of 4.0 °C min−1 (Mahant et al., 2023). In general, the nm values of ATD measured in this study agree well with those reported by CSU-IS (Perkins et al., 2020); the difference is within one order of magnitude. At a given temperature, our nm results are 2 to 13 times higher than those reported by Mahant et al. (2023). This difference could be attributed to the faster cooling rate employed by Mahant et al. (2023), which brings out the slight time dependence of the ice nucleation of ATD (Wright et al., 2013; Jakobsson et al., 2022).
4.4 Ice nucleation of Snomax®
Snomax® is suggested as a reference ice-active material for immersion freezing experiments (Wex et al., 2015). Snomax® is the fragment of Pseudomonas syringae bacteria, which is widely used in generating artificial snow (Hiranuma et al., 2015; Whale et al., 2015). FINDA-WLU measured the temperature-dependent nm of Snomax®. The results in this study, together with those reported by previous studies (Budke and Koop, 2015; Wex et al., 2015; Tobo, 2016; Kunert et al., 2018; Steinke et al., 2020; Wieber et al., 2024) are shown in Fig. 10. Similar to ATD measurements, nm obtained from Snomax® droplets with different mass concentrations (1.04 × 10⁻⁹ to 1.04 × 10⁻¹ g L−1) align well with each other in the overlapping temperature range, indicating that INP numbers provided by Snomax® scale with its mass. In general, nm of Snomax® increases with decreasing temperature and reaches its maximum at −9.0 °C. A plateau appears in the nm spectra below −9.0 °C, indicating that a stronger supercooling will not further promote INP numbers per mass of Snomax below this temperature. This plateau is also observed by ice nucleation studies of Snomax® using other DFTs (Budke and Koop, 2015; Wex et al., 2015; Tobo, 2016; Kunert et al., 2018; Steinke et al., 2020; Wieber et al., 2024). At temperatures below −7.0 °C, nm of Snomax® measured by FINDA-WLU is comparable to those reported by other DFTs; the difference is within one order of magnitude. However, at temperatures warmer than −7.0 °C, nm measured by FINDA-WLU are about two orders of magnitude lower than those detected using the Twin-plate Ice Nucleation Assay (TINA) (Kunert et al., 2018) and the Bielefeld Ice Nucleation Array (BINARY) (Budke and Koop, 2015). The steep increase of nm detected by TINA and BINARY at −4.0 to −7.0 °C indicates there is another type of INP in the respective Snomax® that can nucleate ice in this temperature range, which, however, was not detected in our study. Our results are consistent with those detected by the Ice Nucleation Spectrometer of the Karlsruhe Institute of Technology (INSEKT) (Steinke et al., 2020) and micro-PINGUIN, as they also did not observe such an INP type above −7.0 °C. The variation of Snomax® nm reported by different studies at temperatures warmer than −7.0 °C can be attributed to several reasons, as suggested by previous studies (Wieber et al., 2024; Tarn et al., 2018; Polen et al., 2016). For example, the ice nucleation abilities of Snomax® can be influenced by its storage time in the fridge and by aqueous aging when it is suspended in water (Wieber et al., 2024; Polen et al., 2016). Caution should be given when using Snomax® as a reference material to test and compare the performance of different instruments, as its INA is unstable, particularly at warm temperatures (> −7.0 °C).
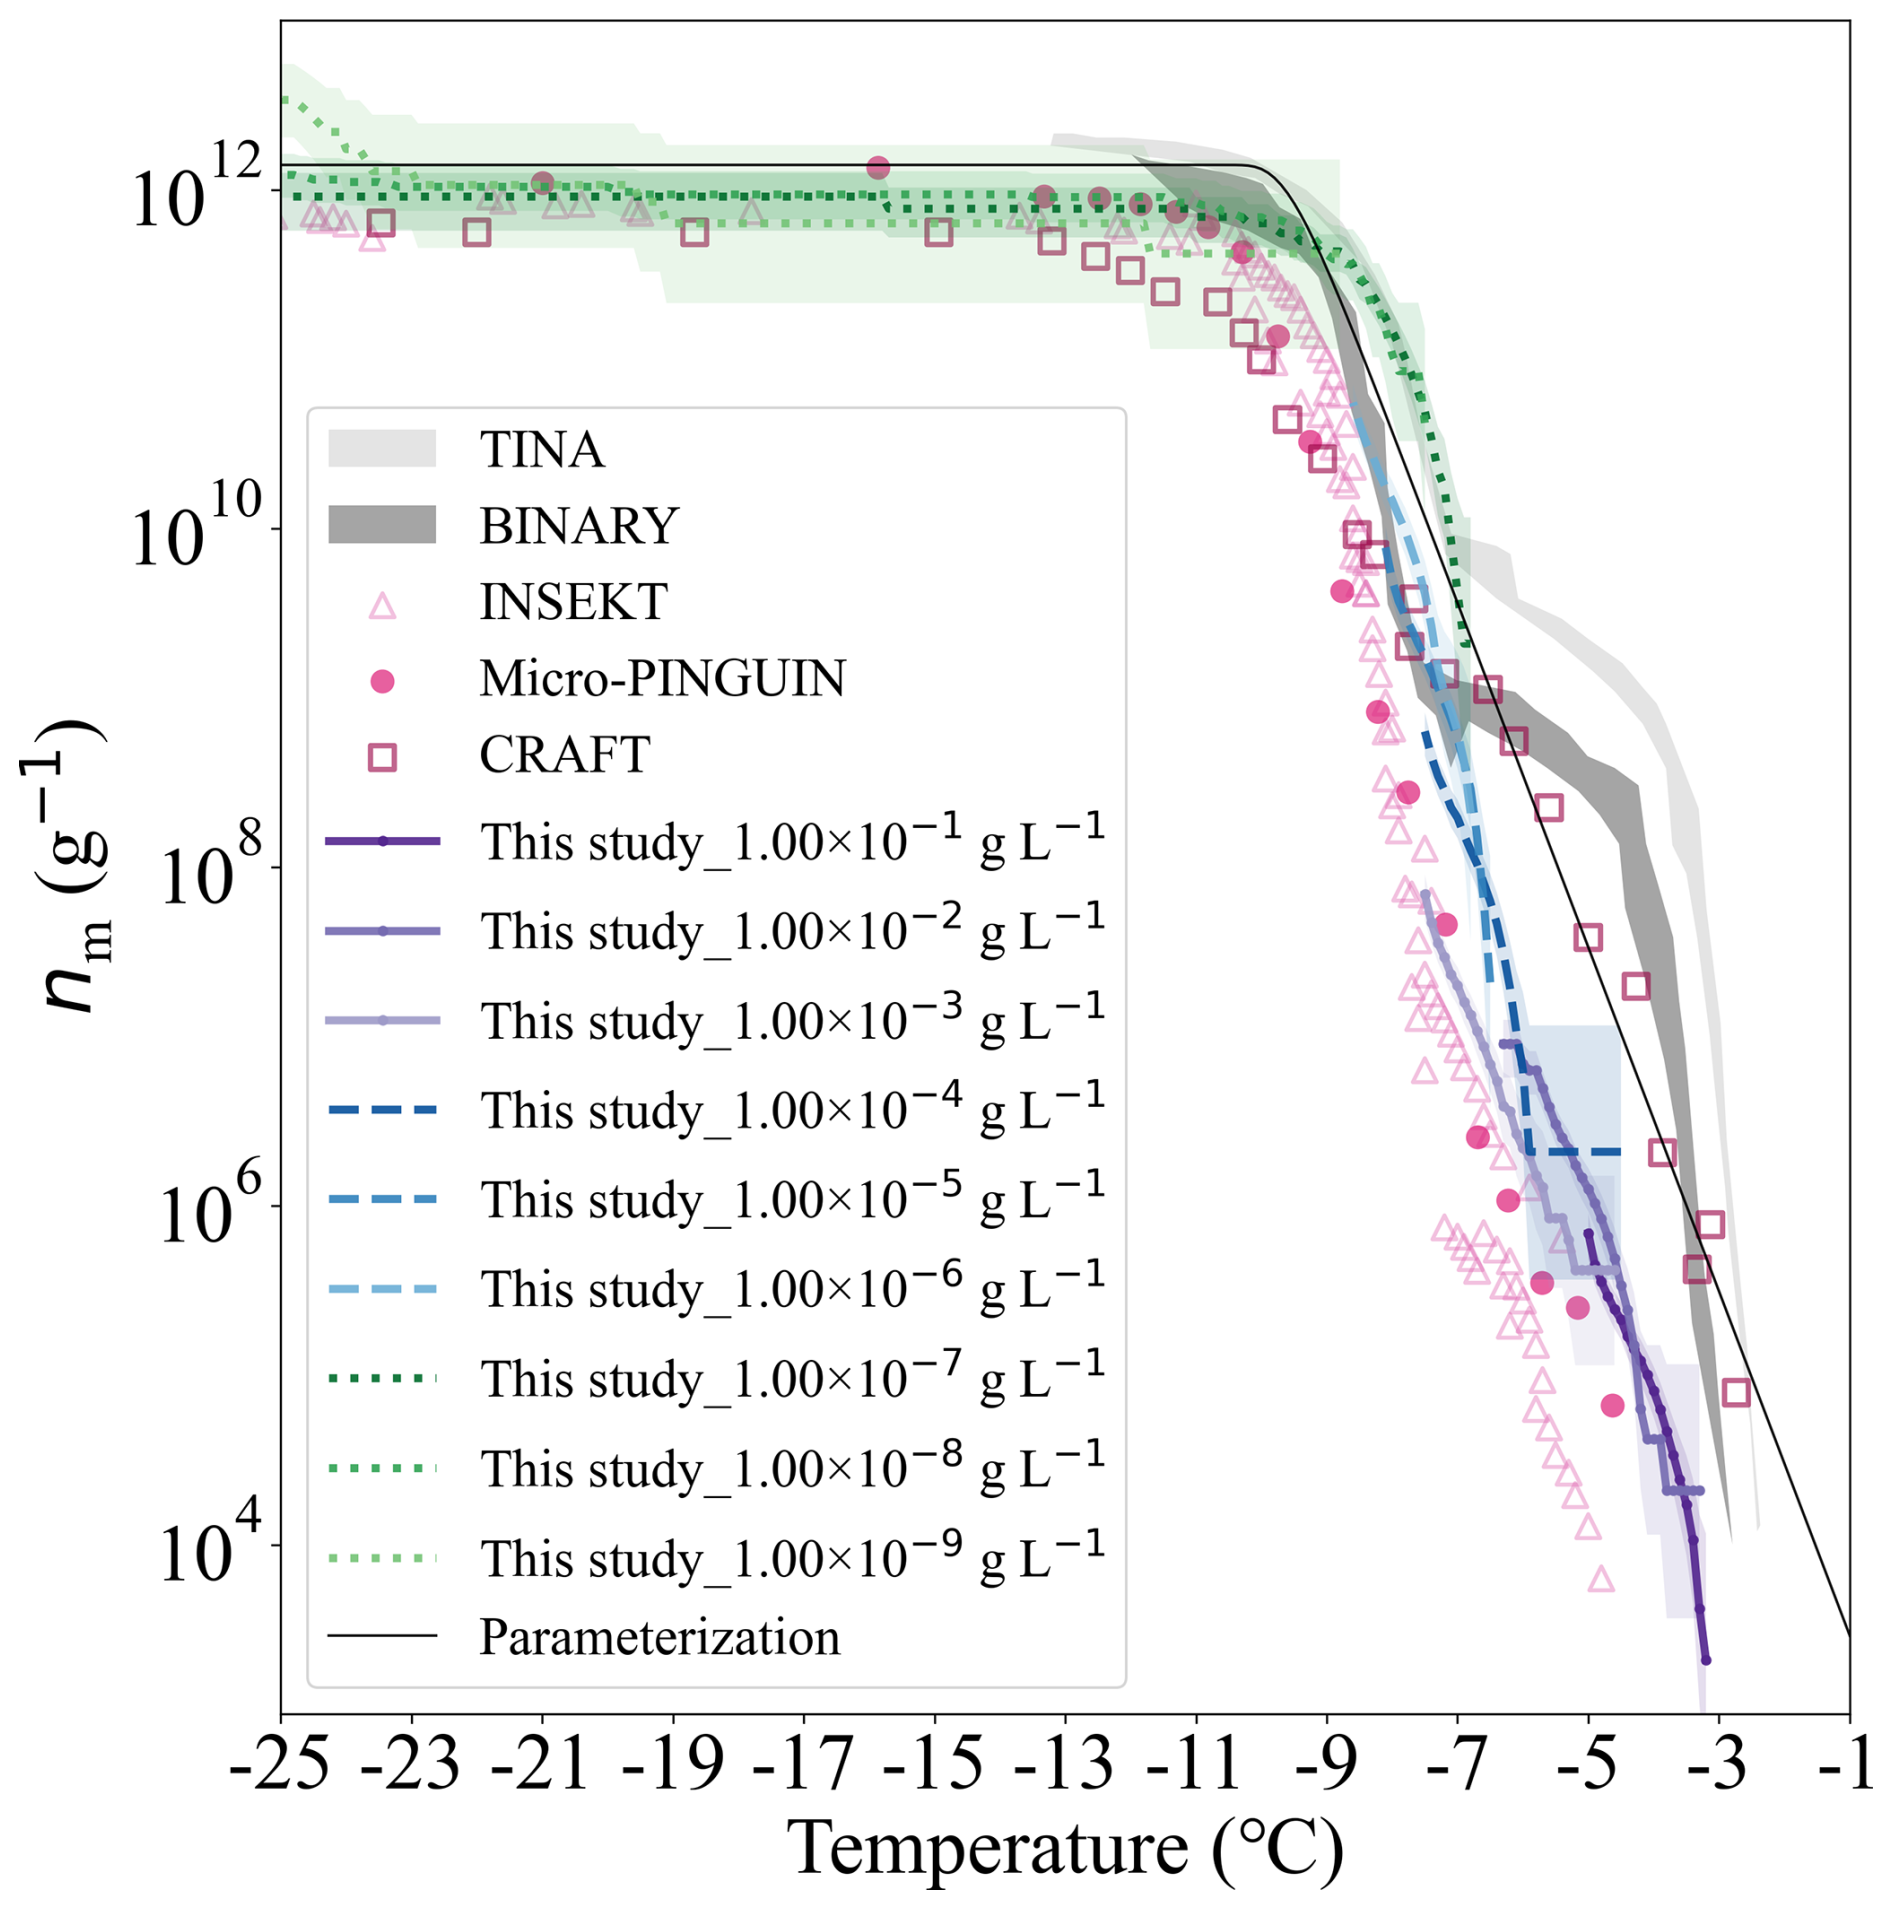
Figure 10nm of Snomax®. The colourful lines with shaded areas are nm and uncertainties are obtained by our measurements. The nm data reported by other studies (Wex et al., 2015) using different DFTs are shown for comparison.
4.5 INP numbers in precipitation samples
In addition to reference samples, we also tested atmospherically relevant samples to validate the FINDA-WLU performance. Four precipitation samples, including cloud water, snow water, hail, and typhoon water, are measured. The detailed sampling information is summarized in Table A1. Figure 11 shows CINP(T) of the original suspensions of precipitations and three diluted suspensions (15-times, 225-times, 3375-times). As expected, CINP(T) values of different dilution suspensions align well with the original suspensions in the overlapping temperature range. The CINP(T) values of precipitation samples in this study are compared to those reported by Petters and Wright (2015), who summarized INP measurements from precipitation samples collected mostly over Europe and North America. The CINP(T) values measured for our precipitation samples in general fall within the range reported by Petters and Wright (2015), except that the cloud water sample shows extremely high concentrations at −15.0 °C.
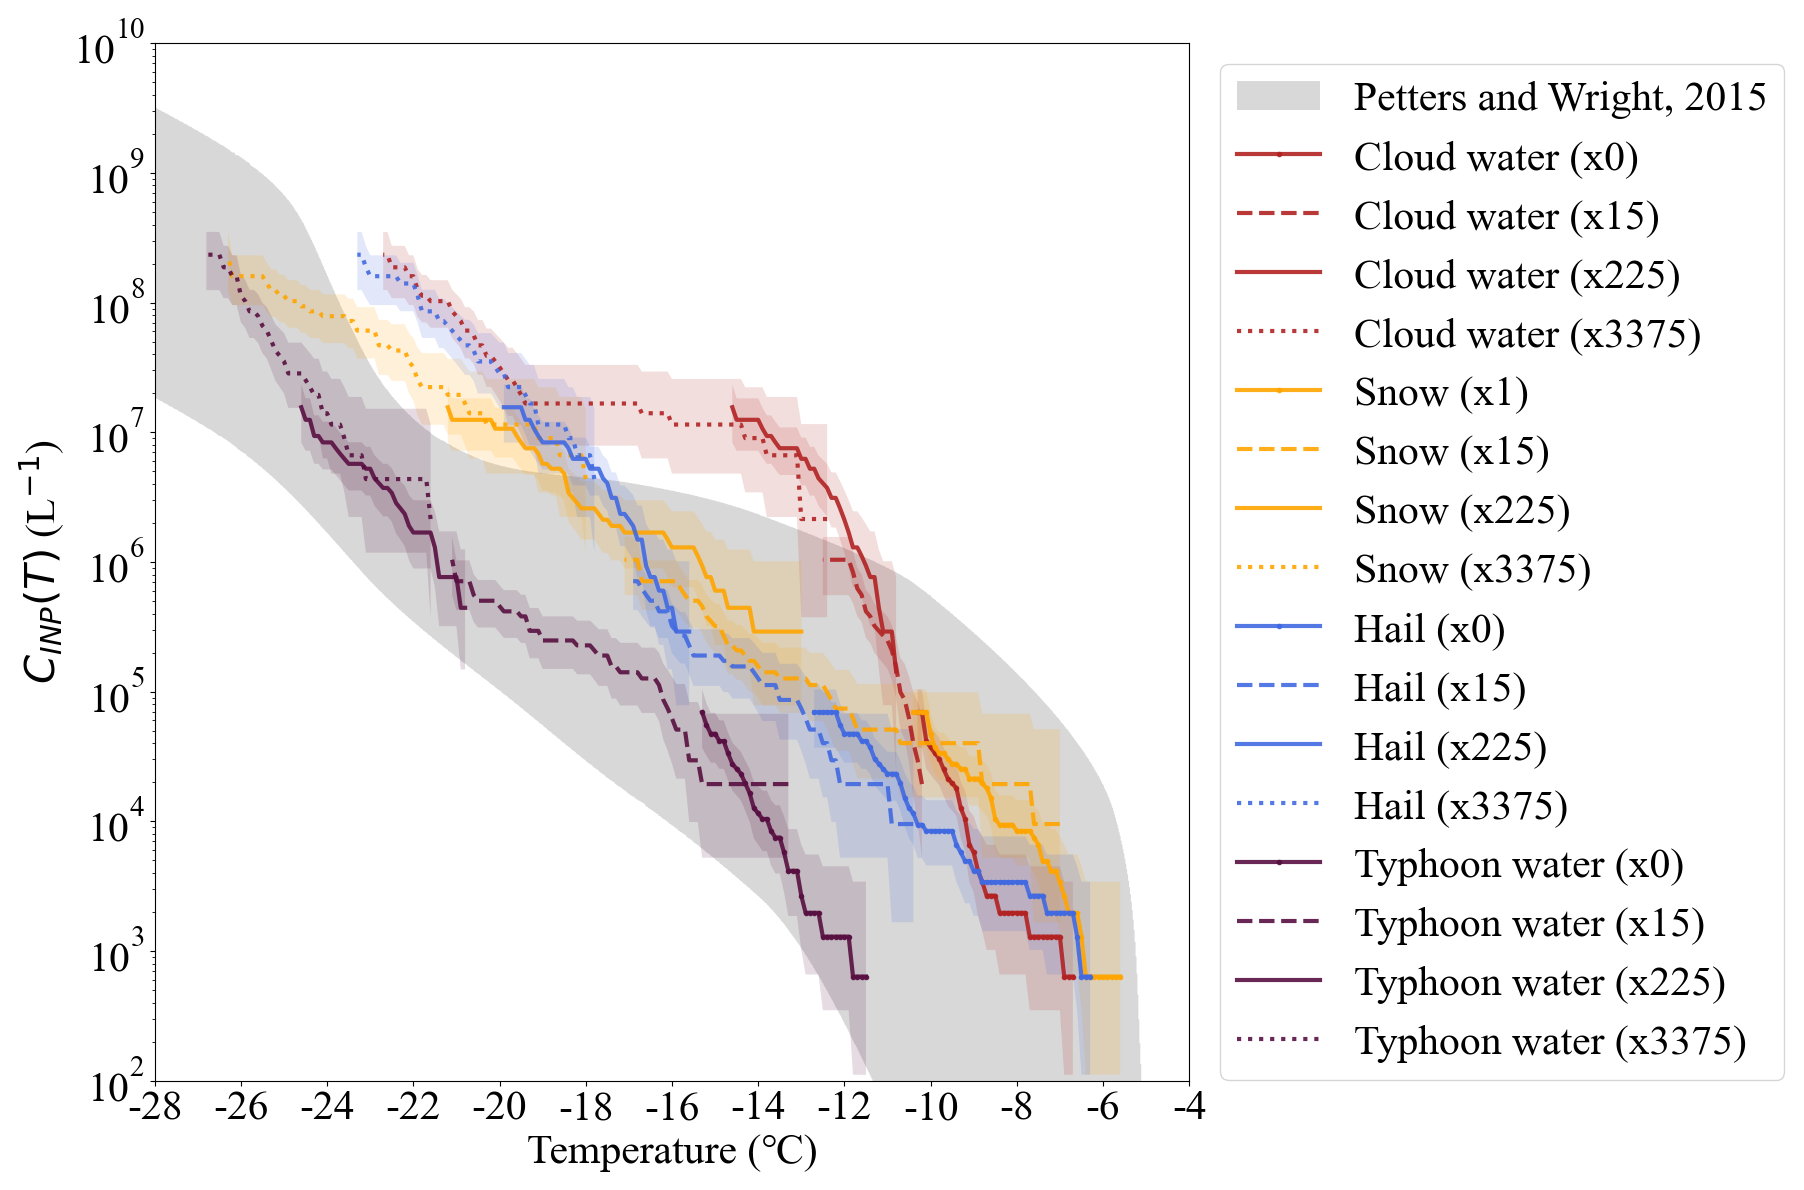
Figure 11The INP number concentration (CINP(T)) of four precipitations sample in different colourful lines. The gray dashed area indicates the INP results of precipitation samples collected globally, as reported by Petters and Wright (2015). The numbers in the brackets refer to the dilution factor of the samples. “1” means the original liquid of the samples. “15”, “225”, and “3375” means the 15-time, 225-time, and 3375-time fold dilutions.
CINP(T) of different samples shows a large variability. For example, CINP(T) varies about three orders of magnitude, ranging from 104 to 107 L−1 at −14.0 °C among different samples. The cloud water shows the highest INP concentration, while the typhoon water has the lowest INP concentration. The large variation of INP concentration among different precipitation samples indicates that aerosol sources might be different or the aerosols underwent different aging and cloud processes. The high INP concentrations in cloud water, snow, and hail at warm temperatures (> −18.0 °C suggest that biological aerosols might make a great contribution to INPs. Further chemical analysis and heating treatments of samples will help in the future to confirm the nature and sources of INPs.
In this study, we present an improved Freezing Ice Nucleation Detection Analyzer developed at Westlake University (FINDA-WLU) for immersion mode INP measurements. We designed a robust hardware setup and user-friendly software working together seamlessly, ensuring that the instrument operates smoothly and efficiently. We take into account the vertical heat transfer from the cooling bath to the aluminum block and the PCR plate, as well as the temperature heterogeneity across the PCR wells, for temperature calibration. The temperature calibration includes three steps: (1) calibrating the Pt100 sensors with a standard sensor, (2) calibrating an infrared camera with Pt100 sensors, and (3) calibrating single-well temperatures using an infrared camera. For the freezing experiment at the temperature range from 0.0 to −30.0 °C with a cooling rate of −1.0 °C min−1, the temperature uncertainty is ±0.60 °C.
INP concentrations of ultrapure water detected by FINDA-WLU are lower than reported in one previous study and consistent with another. Two ice active substances often used in laboratory studies, ATD and Snomax®, are also tested and showed similar results to previous studies. Both tests prove the good performance of FINDA-WLU. The precipitation samples collected in China show a large variation of INP concentrations, which are, however, within the range reported by previous studies. In conclusion, the FINDA-WLU has a very thorough temperature calibration among INP offline immersion freezing instruments. It has an enhanced temperature accuracy, and it also has an increased measurement efficiency with its user-friendly software.
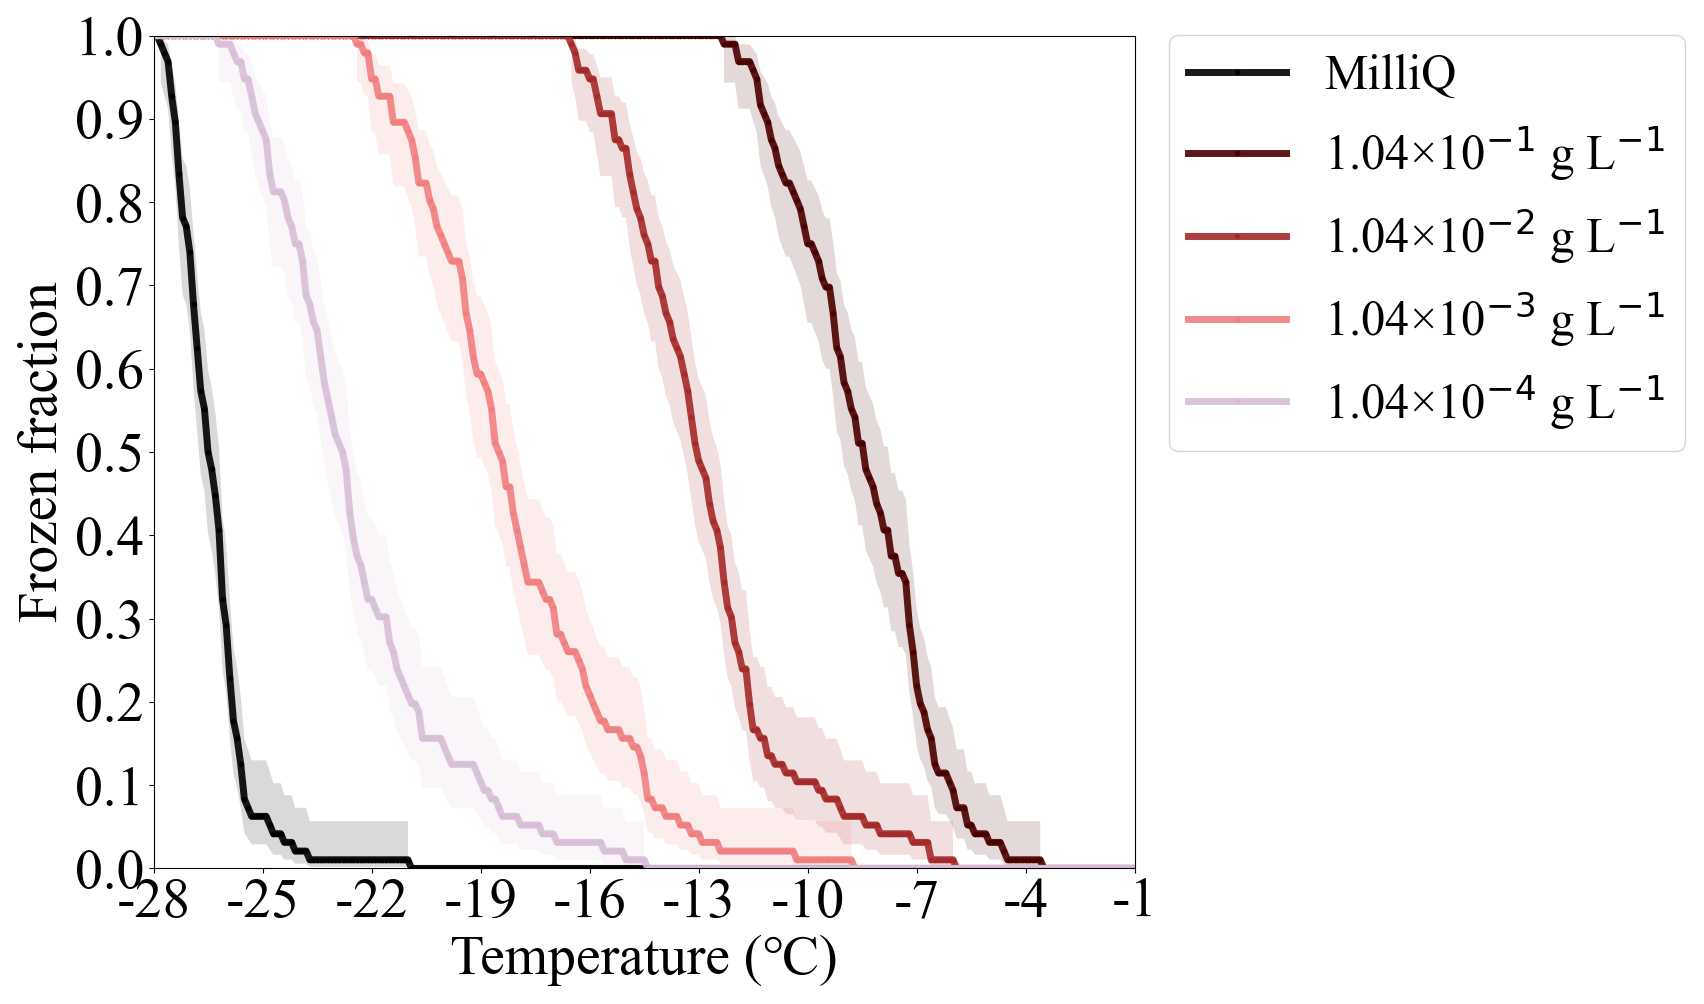
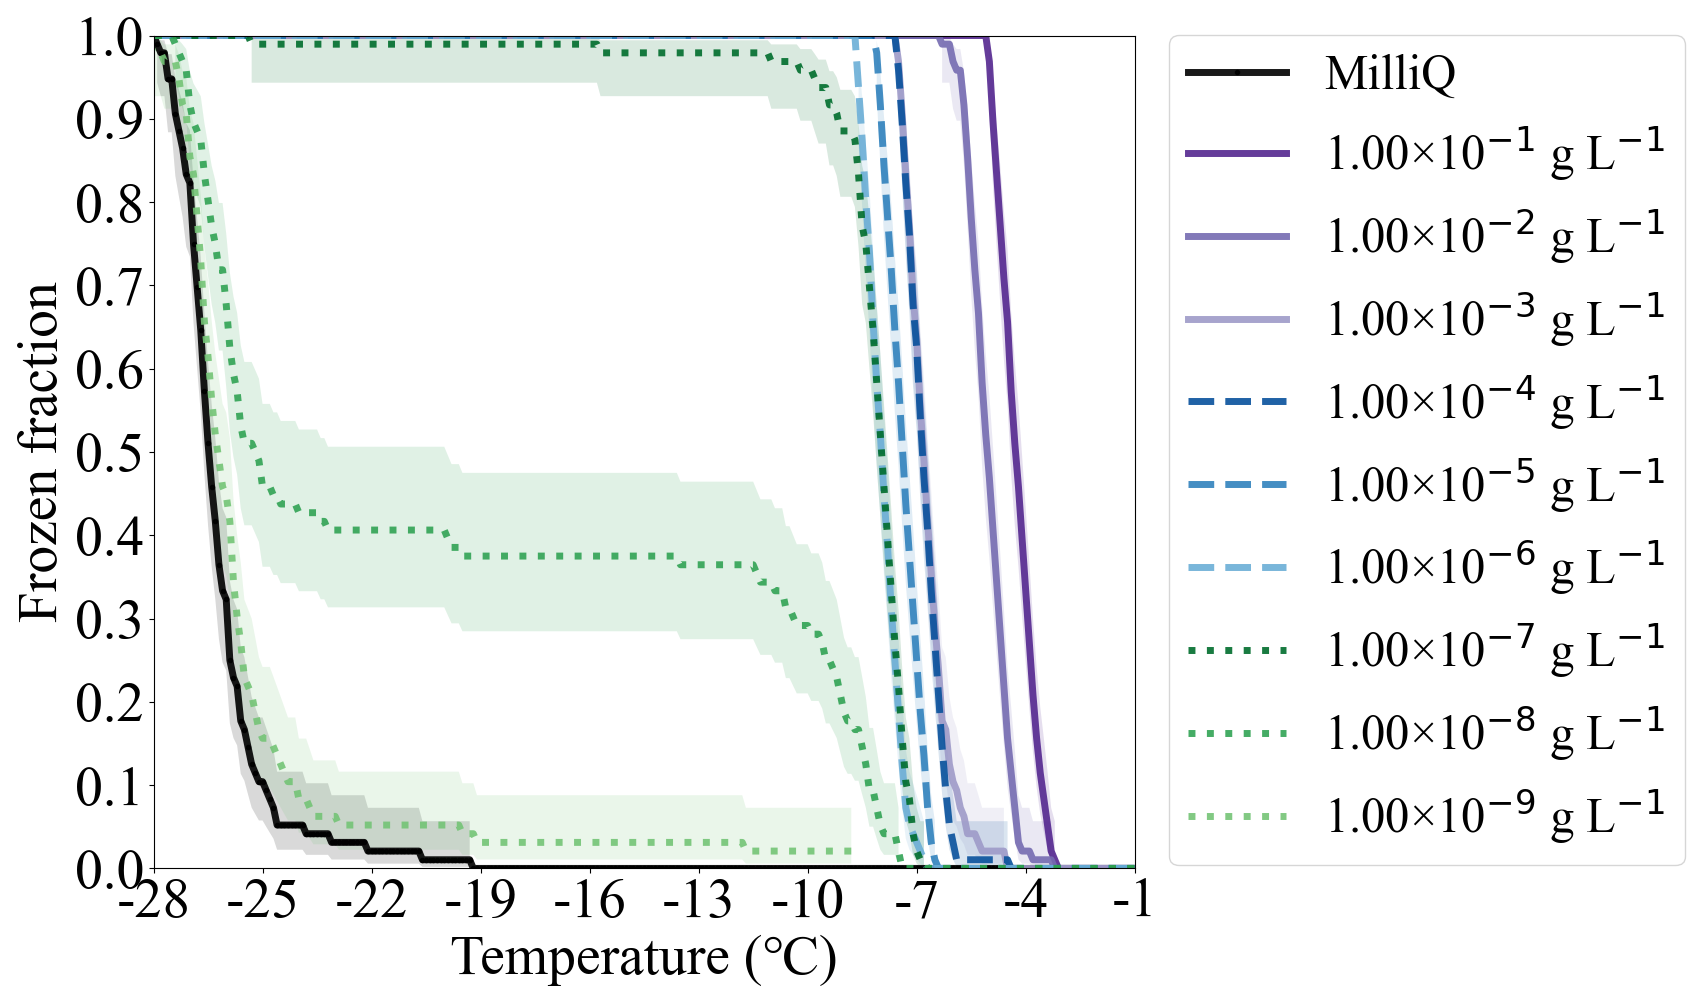
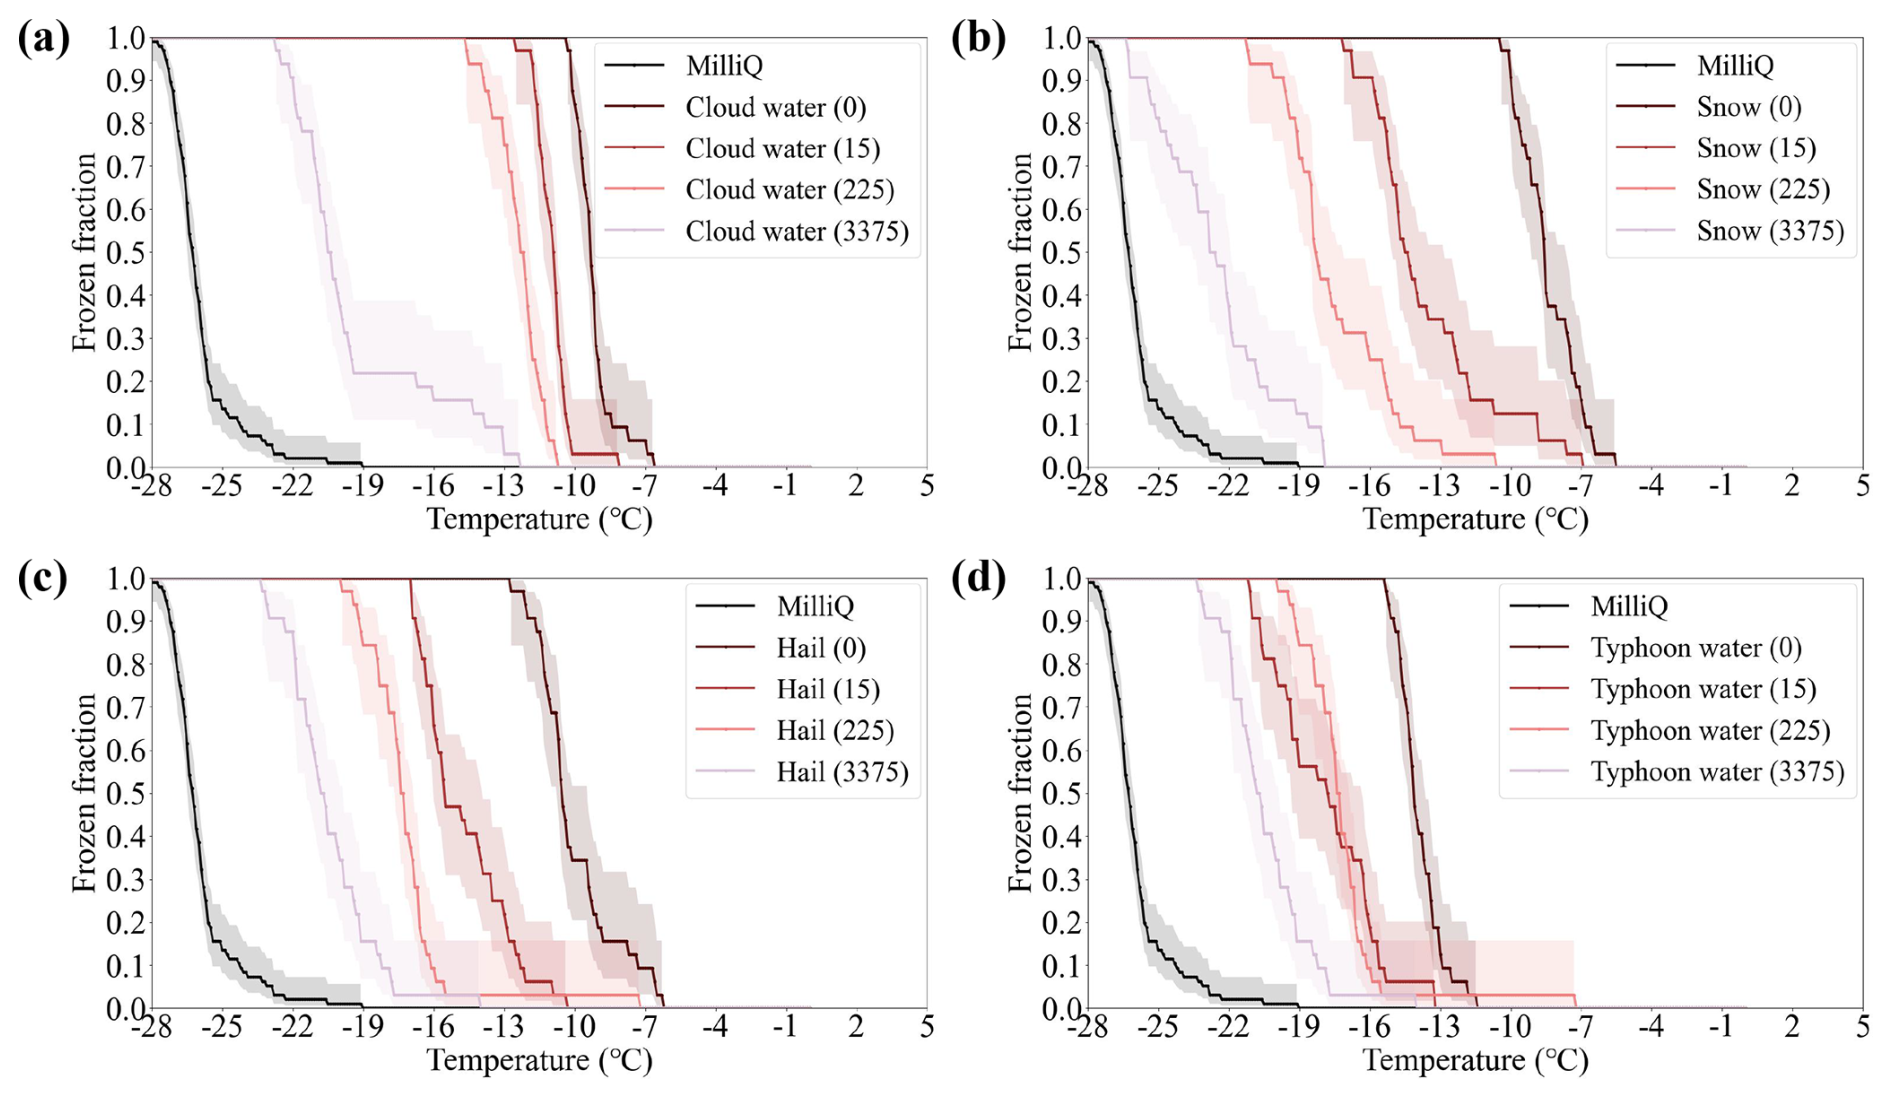
Figure A3The FF of the Milli-Q water and precipitation. The dashed areas are the uncertainties of FF. The numbers in the brackets refer to the dilution factor of the samples. “1” means the original sample. “15”, “225”, and “3375” means the 15-time, 225-time, and 3375-time fold dilutions.
Table A1Information on four precipitation samples, including cloud water, snow, hail, and typhoon water. All samples preserved at −20 °C in a fridge.
B1 The uncertainties of simple linear and quadratic regressions
For a pair of data lists x and y, x are used to calibrate y by linear regression. a is the slope of the calibration function, and b is the intercept. For each known xi, the calibrated value is:
In the quadratic regression, for each known xi, the calibrated value is:
where a and b are the coefficients, and c is the constant.
According to Sharaf et al. (1986), Miller (1991), and Hibbert (2006), the standard deviation of the regression sdr (a.k.a. the uncertainty of the calibration) is calculated as:
where n is the total number of the x or y, i represents the sequence number of x or y, and k is the number of coefficients in the regression model.
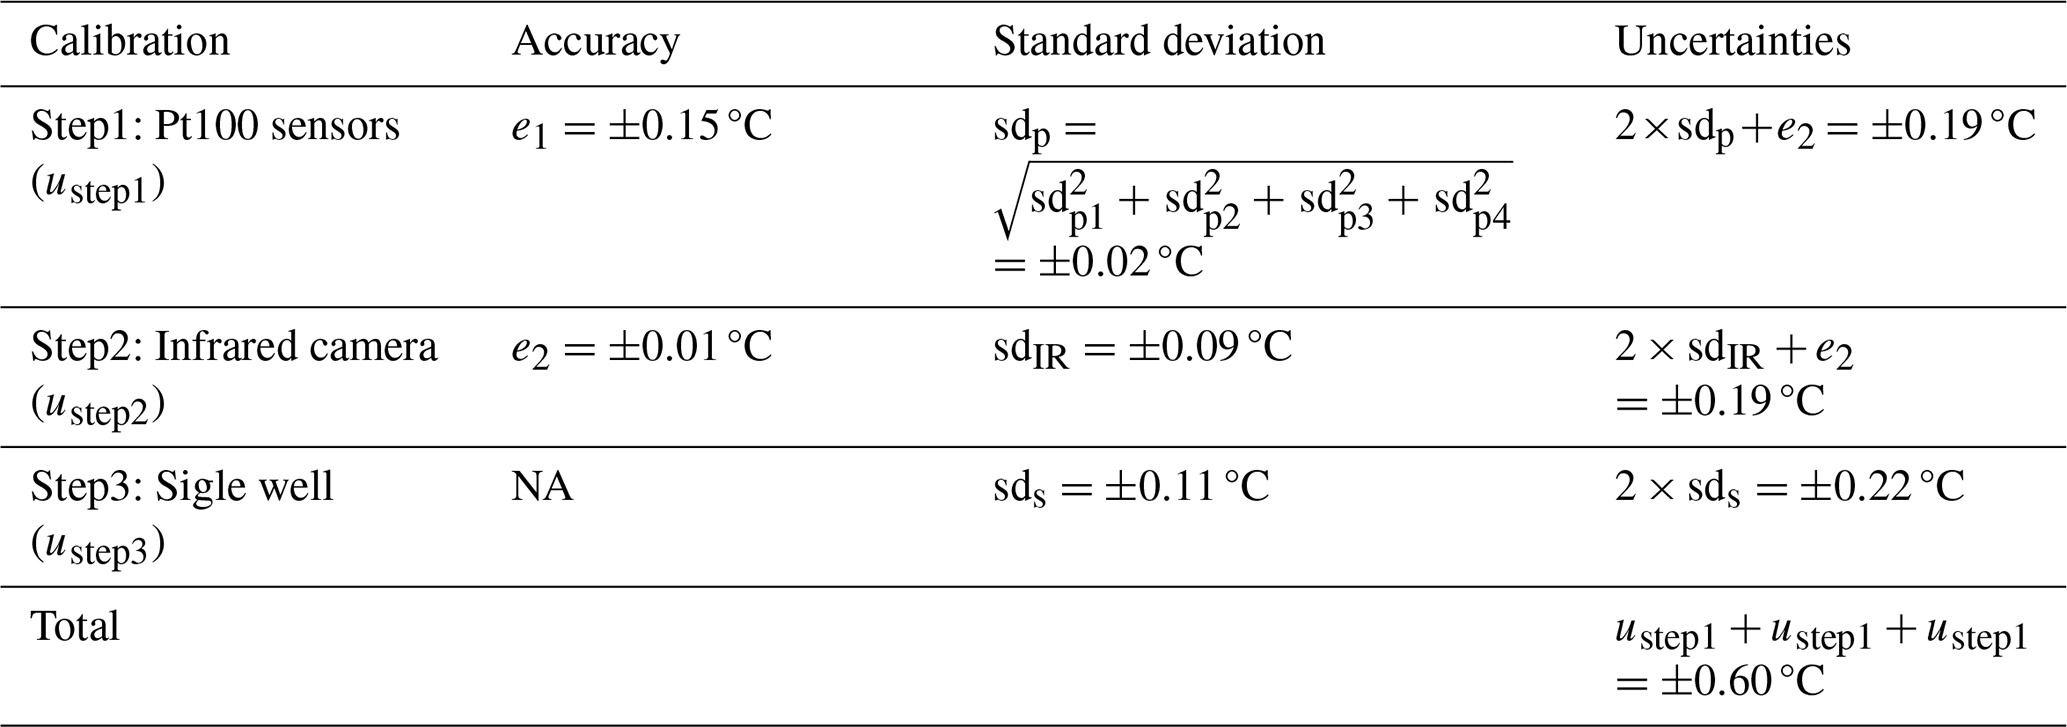
B2 The uncertainty of FINDA-WLU
We have three calibration steps for FINDA-WLU. According to Eq. (B3), the standard deviations of four Pt100 sensors are sdp1, sdp2, sdp3, and sdp4, respectively (Sect. 3.1). The accuracy of the Pt100 sensor is ±0.15 °C (written as e1). According to Ku (1966) and Neuhauser and Roper (2004), the uncertainty of the Pt100 sensor (the first step) can be written as
where the e1 is the accuracy of the Pt100 sensors. Here we consider the two standard deviations, which cover > 95 % of data points (assuming normal distribution).
In the second step, we first measured the accuracy of an infrared camera. The bath temperature was cooled down from 0.0 to −35.0 °C, with an increment of −5.0 °C. Each temperature was held for 10 min, and the last 60 s were used for the accuracy calculation. There are 8 (k=8) groups of temperature, and 60 (n=60) data in each group. Therefore, the accuracy (e2) of the infrared camera is calculated as:
The standard deviation of the quadratic regression Eq. (2) is sdIR. The uncertainty of the infrared camera calibration ustep2 is:
In the third step, we considered the uncertainties of the horizontal temperature calibration. Each well has a standard deviation (sds,i) and the maximum standard deviation value of the single-well is selected, as:
Therefore, when considering the two standard deviations, the uncertainty of the third calibration is:
The total uncertainty of FINDA-WLU is calculated as:
The uncertainties are summarized in Table B1.
All data are available upon request from the corresponding authors.
XG, KB, and JC conceived and designed the study, with input from all other authors.
The contact author has declared that none of the authors has any competing interests.
Publisher's note: Copernicus Publications remains neutral with regard to jurisdictional claims made in the text, published maps, institutional affiliations, or any other geographical representation in this paper. While Copernicus Publications makes every effort to include appropriate place names, the final responsibility lies with the authors. Views expressed in the text are those of the authors and do not necessarily reflect the views of the publisher.
We thank Zhiliang Shu and Lei Tian from Liupan Mountains Atmospheric Science Field Observation and Research Station in Ningxia Hui Autonomous Region for their help in collecting cloud water samples.
KB and YC are supported by the Beijing National Science Foundation (8244065). KB, PT, and XG are supported by the National Natural Science Foundation of China (grant nos. 42275087, 42105091, 41930968, 22576164, and 42505070). XG, XX, YC, and SC are supported by the Opening Project of Shanghai Key Laboratory of Atmospheric Particle Pollution and Prevention 20 (LAP3) (grant no. FDLAP24018), the Research Center for Industries of the Future (RCIF) at Westlake University (grant nos. 103110746022301 and 210000006022303), and Westlake Education Foundation. JC acknowledges support from the Swiss National Science Foundation (SNSF) postdoctoral fellowship (grant no. TMPFP2_209830). MH and RL are supported by the Beijing Municipal Science and Technology Commission (grant no. Z251100004525005) and the Innovation Project of the China Meteorological Administration (grant no. CXFZ2025J151). The financial support by the China Scholarship Council (CSC) for KB and YH is also gratefully acknowledged. JG and BW are supported by the National Natural Science Foundation of China (42375069).
This paper was edited by Bin Yuan and reviewed by two anonymous referees.
Agresti, A. and Coull, B. A.: Approximate is Better than “Exact” for Interval Estimation of Binomial Proportions, The American Statistician, 52, 119–126, https://doi.org/10.1080/00031305.1998.10480550, 1998.
Ansmann, A., Tesche, M., Althausen, D., Müller, D., Seifert, P., Freudenthaler, V., Heese, B., Wiegner, M., Pisani, G., Knippertz, P., and Dubovik, O.: Influence of Saharan dust on cloud glaciation in southern Morocco during the Saharan Mineral Dust Experiment, Journal of Geophysical Research: Atmospheres, 113, 2007JD008785, https://doi.org/10.1029/2007JD008785, 2008.
Bangert, M., Nenes, A., Vogel, B., Vogel, H., Barahona, D., Karydis, V. A., Kumar, P., Kottmeier, C., and Blahak, U.: Saharan dust event impacts on cloud formation and radiation over Western Europe, Atmos. Chem. Phys., 12, 4045–4063, https://doi.org/10.5194/acp-12-4045-2012, 2012.
Beall, C. M., Stokes, M. D., Hill, T. C., DeMott, P. J., DeWald, J. T., and Prather, K. A.: Automation and heat transfer characterization of immersion mode spectroscopy for analysis of ice nucleating particles, Atmos. Meas. Tech., 10, 2613–2626, https://doi.org/10.5194/amt-10-2613-2017, 2017.
Boose, Y., Welti, A., Atkinson, J., Ramelli, F., Danielczok, A., Bingemer, H. G., Plötze, M., Sierau, B., Kanji, Z. A., and Lohmann, U.: Heterogeneous ice nucleation on dust particles sourced from nine deserts worldwide – Part 1: Immersion freezing, Atmos. Chem. Phys., 16, 15075–15095, https://doi.org/10.5194/acp-16-15075-2016, 2016.
Brunner, C. and Kanji, Z. A.: Continuous online monitoring of ice-nucleating particles: development of the automated Horizontal Ice Nucleation Chamber (HINC-Auto), Atmos. Meas. Tech., 14, 269–293, https://doi.org/10.5194/amt-14-269-2021, 2021.
Budke, C. and Koop, T.: BINARY: an optical freezing array for assessing temperature and time dependence of heterogeneous ice nucleation, Atmos. Meas. Tech., 8, 689–703, https://doi.org/10.5194/amt-8-689-2015, 2015.
Bundke, U., Nillius, B., Jaenicke, R., Wetter, T., Klein, H., and Bingemer, H.: The fast Ice Nucleus chamber FINCH, Atmospheric Research, 90, 180–186, https://doi.org/10.1016/j.atmosres.2008.02.008, 2008.
Chen, J., Pei, X., Wang, H., Chen, J., Zhu, Y., Tang, M., and Wu, Z.: Development, Characterization, and Validation of a Cold Stage-Based Ice Nucleation Array (PKU-INA), Atmosphere, 9, 357, https://doi.org/10.3390/atmos9090357, 2018a.
Chen, J., Wu, Z., Augustin-Bauditz, S., Grawe, S., Hartmann, M., Pei, X., Liu, Z., Ji, D., and Wex, H.: Ice-nucleating particle concentrations unaffected by urban air pollution in Beijing, China, Atmos. Chem. Phys., 18, 3523–3539, https://doi.org/10.5194/acp-18-3523-2018, 2018b.
Conen, F., Rodríguez, S., Glin, C. H., Henne, S., Herrmann, E., Bukowiecki, N., and Alewell, C.: Atmospheric ice nuclei at the high-altitude observatory Jungfraujoch, Switzerland, Tellus B: Chemical and Physical Meteorology, 67, 25014, https://doi.org/10.3402/tellusb.v67.25014, 2015.
David, R. O., Cascajo-Castresana, M., Brennan, K. P., Rösch, M., Els, N., Werz, J., Weichlinger, V., Boynton, L. S., Bogler, S., Borduas-Dedekind, N., Marcolli, C., and Kanji, Z. A.: Development of the DRoplet Ice Nuclei Counter Zurich (DRINCZ): validation and application to field-collected snow samples, Atmos. Meas. Tech., 12, 6865–6888, https://doi.org/10.5194/amt-12-6865-2019, 2019.
DeMott, P. J., Prenni, A. J., McMeeking, G. R., Sullivan, R. C., Petters, M. D., Tobo, Y., Niemand, M., Möhler, O., Snider, J. R., Wang, Z., and Kreidenweis, S. M.: Integrating laboratory and field data to quantify the immersion freezing ice nucleation activity of mineral dust particles, Atmos. Chem. Phys., 15, 393–409, https://doi.org/10.5194/acp-15-393-2015, 2015.
DeMott, P. J., Hill, T. C. J., Petters, M. D., Bertram, A. K., Tobo, Y., Mason, R. H., Suski, K. J., McCluskey, C. S., Levin, E. J. T., Schill, G. P., Boose, Y., Rauker, A. M., Miller, A. J., Zaragoza, J., Rocci, K., Rothfuss, N. E., Taylor, H. P., Hader, J. D., Chou, C., Huffman, J. A., Pöschl, U., Prenni, A. J., and Kreidenweis, S. M.: Comparative measurements of ambient atmospheric concentrations of ice nucleating particles using multiple immersion freezing methods and a continuous flow diffusion chamber, Atmos. Chem. Phys., 17, 11227–11245, https://doi.org/10.5194/acp-17-11227-2017, 2017.
DeMott, P. J., Möhler, O., Cziczo, D. J., Hiranuma, N., Petters, M. D., Petters, S. S., Belosi, F., Bingemer, H. G., Brooks, S. D., Budke, C., Burkert-Kohn, M., Collier, K. N., Danielczok, A., Eppers, O., Felgitsch, L., Garimella, S., Grothe, H., Herenz, P., Hill, T. C. J., Höhler, K., Kanji, Z. A., Kiselev, A., Koop, T., Kristensen, T. B., Krüger, K., Kulkarni, G., Levin, E. J. T., Murray, B. J., Nicosia, A., O'Sullivan, D., Peckhaus, A., Polen, M. J., Price, H. C., Reicher, N., Rothenberg, D. A., Rudich, Y., Santachiara, G., Schiebel, T., Schrod, J., Seifried, T. M., Stratmann, F., Sullivan, R. C., Suski, K. J., Szakáll, M., Taylor, H. P., Ullrich, R., Vergara-Temprado, J., Wagner, R., Whale, T. F., Weber, D., Welti, A., Wilson, T. W., Wolf, M. J., and Zenker, J.: The Fifth International Workshop on Ice Nucleation phase 2 (FIN-02): laboratory intercomparison of ice nucleation measurements, Atmos. Meas. Tech., 11, 6231–6257, https://doi.org/10.5194/amt-11-6231-2018, 2018.
Garimella, S., Kristensen, T. B., Ignatius, K., Welti, A., Voigtländer, J., Kulkarni, G. R., Sagan, F., Kok, G. L., Dorsey, J., Nichman, L., Rothenberg, D. A., Rösch, M., Kirchgäßner, A. C. R., Ladkin, R., Wex, H., Wilson, T. W., Ladino, L. A., Abbatt, J. P. D., Stetzer, O., Lohmann, U., Stratmann, F., and Cziczo, D. J.: The SPectrometer for Ice Nuclei (SPIN): an instrument to investigate ice nucleation, Atmos. Meas. Tech., 9, 2781–2795, https://doi.org/10.5194/amt-9-2781-2016, 2016.
Gong, X., Wex, H., van Pinxteren, M., Triesch, N., Fomba, K. W., Lubitz, J., Stolle, C., Robinson, T.-B., Müller, T., Herrmann, H., and Stratmann, F.: Characterization of aerosol particles at Cabo Verde close to sea level and at the cloud level – Part 2: Ice-nucleating particles in air, cloud and seawater, Atmos. Chem. Phys., 20, 1451–1468, https://doi.org/10.5194/acp-20-1451-2020, 2020.
Harrison, A. D., Whale, T. F., Rutledge, R., Lamb, S., Tarn, M. D., Porter, G. C. E., Adams, M. P., McQuaid, J. B., Morris, G. J., and Murray, B. J.: An instrument for quantifying heterogeneous ice nucleation in multiwell plates using infrared emissions to detect freezing, Atmos. Meas. Tech., 11, 5629–5641, https://doi.org/10.5194/amt-11-5629-2018, 2018.
Hibbert, D. B.: The uncertainty of a result from a linear calibration, Analyst, 131, 1273–1278, https://doi.org/10.1039/B615398D, 2006.
Hill, T. C. J., Moffett, B. F., DeMott, P. J., Georgakopoulos, D. G., Stump, W. L., and Franc, G. D.: Measurement of Ice Nucleation-Active Bacteria on Plants and in Precipitation by Quantitative PCR, Applied and Environmental Microbiology, 80, 1256, https://doi.org/10.1128/AEM.02967-13, 2014.
Hill, T. C. J., DeMott, P. J., Tobo, Y., Fröhlich-Nowoisky, J., Moffett, B. F., Franc, G. D., and Kreidenweis, S. M.: Sources of organic ice nucleating particles in soils, Atmos. Chem. Phys., 16, 7195–7211, https://doi.org/10.5194/acp-16-7195-2016, 2016.
Hiranuma, N., Augustin-Bauditz, S., Bingemer, H., Budke, C., Curtius, J., Danielczok, A., Diehl, K., Dreischmeier, K., Ebert, M., Frank, F., Hoffmann, N., Kandler, K., Kiselev, A., Koop, T., Leisner, T., Möhler, O., Nillius, B., Peckhaus, A., Rose, D., Weinbruch, S., Wex, H., Boose, Y., DeMott, P. J., Hader, J. D., Hill, T. C. J., Kanji, Z. A., Kulkarni, G., Levin, E. J. T., McCluskey, C. S., Murakami, M., Murray, B. J., Niedermeier, D., Petters, M. D., O'Sullivan, D., Saito, A., Schill, G. P., Tajiri, T., Tolbert, M. A., Welti, A., Whale, T. F., Wright, T. P., and Yamashita, K.: A comprehensive laboratory study on the immersion freezing behavior of illite NX particles: a comparison of 17 ice nucleation measurement techniques, Atmos. Chem. Phys., 15, 2489–2518, https://doi.org/10.5194/acp-15-2489-2015, 2015.
Hoose, C. and Möhler, O.: Heterogeneous ice nucleation on atmospheric aerosols: a review of results from laboratory experiments, Atmos. Chem. Phys., 12, 9817–9854, https://doi.org/10.5194/acp-12-9817-2012, 2012.
Jakobsson, J. K. F., Waman, D. B., Phillips, V. T. J., and Bjerring Kristensen, T.: Time dependence of heterogeneous ice nucleation by ambient aerosols: laboratory observations and a formulation for models, Atmos. Chem. Phys., 22, 6717–6748, https://doi.org/10.5194/acp-22-6717-2022, 2022.
Kanji, Z. A., Welti, A., Chou, C., Stetzer, O., and Lohmann, U.: Laboratory studies of immersion and deposition mode ice nucleation of ozone aged mineral dust particles, Atmos. Chem. Phys., 13, 9097–9118, https://doi.org/10.5194/acp-13-9097-2013, 2013.
Kanji, Z. A., Ladino, L. A., Wex, H., Boose, Y., Burkert-Kohn, M., Cziczo, D. J., and Krämer, M.: Overview of Ice Nucleating Particles, Meteorological Monographs, 58, 1.1–1.33, https://doi.org/10.1175/AMSMONOGRAPHS-D-16-0006.1, 2017.
Knackstedt, K. A., Moffett, B. F., Hartmann, S., Wex, H., Hill, T. C. J., Glasgo, E. D., Reitz, L. A., Augustin-Bauditz, S., Beall, B. F. N., Bullerjahn, G. S., Fröhlich-Nowoisky, J., Grawe, S., Lubitz, J., Stratmann, F., and McKay, R. M. L.: Terrestrial Origin for Abundant Riverine Nanoscale Ice-Nucleating Particles, Environ. Sci. Technol., 52, 12358–12367, https://doi.org/10.1021/acs.est.8b03881, 2018.
Ku, H.: Notes on the Use of Propagation of Error Formulas, J. Research of National Bureau of Standards-C. Engineering and Instrumentation, 70C, 263–273, https://doi.org/10.6028/jres.070c.025, 1966.
Kunert, A. T., Lamneck, M., Helleis, F., Pöschl, U., Pöhlker, M. L., and Fröhlich-Nowoisky, J.: Twin-plate Ice Nucleation Assay (TINA) with infrared detection for high-throughput droplet freezing experiments with biological ice nuclei in laboratory and field samples, Atmos. Meas. Tech., 11, 6327–6337, https://doi.org/10.5194/amt-11-6327-2018, 2018.
Lacher, L., Lohmann, U., Boose, Y., Zipori, A., Herrmann, E., Bukowiecki, N., Steinbacher, M., and Kanji, Z. A.: The Horizontal Ice Nucleation Chamber (HINC): INP measurements at conditions relevant for mixed-phase clouds at the High Altitude Research Station Jungfraujoch, Atmos. Chem. Phys., 17, 15199–15224, https://doi.org/10.5194/acp-17-15199-2017, 2017.
Mahant, S., Yadav, S., Gilbert, C., Kjærgaard, E. R., Jensen, M. M., Kessler, T., Bilde, M., and Petters, M. D.: An open-hardware community ice nucleation cold stage for research and teaching, HardwareX, 16, e00491, https://doi.org/10.1016/j.ohx.2023.e00491, 2023.
Miller, A. J., Brennan, K. P., Mignani, C., Wieder, J., David, R. O., and Borduas-Dedekind, N.: Development of the drop Freezing Ice Nuclei Counter (FINC), intercomparison of droplet freezing techniques, and use of soluble lignin as an atmospheric ice nucleation standard, Atmos. Meas. Tech., 14, 3131–3151, https://doi.org/10.5194/amt-14-3131-2021, 2021.
Miller, J. N.: Basic statistical methods for Analytical Chemistry. Part 2. Calibration and regression methods. A review, Analyst, 116, 3–14, https://doi.org/10.1039/AN9911600003, 1991.
Möhler, O., Adams, M., Lacher, L., Vogel, F., Nadolny, J., Ullrich, R., Boffo, C., Pfeuffer, T., Hobl, A., Weiß, M., Vepuri, H. S. K., Hiranuma, N., and Murray, B. J.: The Portable Ice Nucleation Experiment (PINE): a new online instrument for laboratory studies and automated long-term field observations of ice-nucleating particles, Atmos. Meas. Tech., 14, 1143–1166, https://doi.org/10.5194/amt-14-1143-2021, 2021.
Murray, B., O'Sullivan, D., Atkinson, D. J., and Webb, E. M.: Ice nucleation by particles immersed in supercooled cloud droplets, Chemical Society Reviews, 41, 6519–6554, https://doi.org/10.1039/C2CS35200A, 2012.
Murray, B. J., Broadley, S. L., Wilson, T. W., Atkinson, J. D., and Wills, R. H.: Heterogeneous freezing of water droplets containing kaolinite particles, Atmos. Chem. Phys., 11, 4191–4207, https://doi.org/10.5194/acp-11-4191-2011, 2011.
Neuhauser, C. and Roper, M. L.: Calculus for biology and medicine, Pearson/Prentice Hall Upper Saddle River, 4 edn., NJ, Pearson, ISBN 10 0134070046, ISBN 13 978-0134070049, 2004.
Niedermeier, D., Shaw, R. A., Hartmann, S., Wex, H., Clauss, T., Voigtländer, J., and Stratmann, F.: Heterogeneous ice nucleation: exploring the transition from stochastic to singular freezing behavior, Atmos. Chem. Phys., 11, 8767–8775, https://doi.org/10.5194/acp-11-8767-2011, 2011.
Perkins, R. J., Gillette, S. M., Hill, T. C. J., and DeMott, P. J.: The Labile Nature of Ice Nucleation by Arizona Test Dust, ACS Earth Space Chem., 4, 133–141, https://doi.org/10.1021/acsearthspacechem.9b00304, 2020.
Petters, M. D. and Wright, T. P.: Revisiting ice nucleation from precipitation samples, Geophys. Res. Lett., 42, 8758–8766, https://doi.org/10.1002/2015GL065733, 2015.
Polen, M., Lawlis, E., and Sullivan, R. C.: The unstable ice nucleation properties of Snomax® bacterial particles, Journal of Geophysical Research: Atmospheres, 121, 11666–11678, https://doi.org/10.1002/2016JD025251, 2016.
Prenni, A. J., Harrington, J. Y., Tjernström, M., DeMott, P. J., Avramov, A., Long, C. N., Kreidenweis, S. M., Olsson, P. Q., and Verlinde, J.: Can Ice-Nucleating Aerosols Affect Arctic Seasonal Climate?, Bulletin of the American Meteorological Society, 88, 541–550, https://doi.org/10.1175/BAMS-88-4-541, 2007.
Ren, Y., Fu, S., Bi, K., Zhang, H., Lin, X., Cao, K., Zhang, Q., and Xue, H.: Freezing Nucleus Spectra for Hailstone Samples in China From Droplet Freezing Experiments, Journal of Geophysical Research: Atmospheres, 129, e2023JD040505, https://doi.org/10.1029/2023JD040505, 2024.
Rogers, D. C.: Development of a continuous flow thermal gradient diffusion chamber for ice nucleation studies, Atmospheric Research, 22, 149–181, https://doi.org/10.1016/0169-8095(88)90005-1, 1988.
Rogers, D. C., DeMott, P. J., Kreidenweis, S. M., and Chen, Y.: A Continuous-Flow Diffusion Chamber for Airborne Measurements of Ice Nuclei, J. Atmos. Oceanic Technol., 18, 725–741, https://doi.org/10.1175/1520-0426(2001)018<0725:ACFDCF>2.0.CO;2, 2001.
Schneider, J., Höhler, K., Heikkilä, P., Keskinen, J., Bertozzi, B., Bogert, P., Schorr, T., Umo, N. S., Vogel, F., Brasseur, Z., Wu, Y., Hakala, S., Duplissy, J., Moisseev, D., Kulmala, M., Adams, M. P., Murray, B. J., Korhonen, K., Hao, L., Thomson, E. S., Castarède, D., Leisner, T., Petäjä, T., and Möhler, O.: The seasonal cycle of ice-nucleating particles linked to the abundance of biogenic aerosol in boreal forests, Atmos. Chem. Phys., 21, 3899–3918, https://doi.org/10.5194/acp-21-3899-2021, 2021.
Sharaf, M. A., Illman, D. L., and Kowalski, B. R.: Chemometrics, John Wiley & Sons, ISBN 10 0471831069, ISBN 13 978-0471831068, 1986.
Steinke, I., Hiranuma, N., Funk, R., Höhler, K., Tüllmann, N., Umo, N. S., Weidler, P. G., Möhler, O., and Leisner, T.: Complex plant-derived organic aerosol as ice-nucleating particles – more than the sums of their parts?, Atmos. Chem. Phys., 20, 11387–11397, https://doi.org/10.5194/acp-20-11387-2020, 2020.
Sze, K. C. H., Wex, H., Hartmann, M., Skov, H., Massling, A., Villanueva, D., and Stratmann, F.: Ice-nucleating particles in northern Greenland: annual cycles, biological contribution and parameterizations, Atmos. Chem. Phys., 23, 4741–4761, https://doi.org/10.5194/acp-23-4741-2023, 2023.
Tarn, M. D., Sikora, S. N. F., Porter, G. C. E., O'Sullivan, D., Adams, M., Whale, T. F., Harrison, A. D., Vergara-Temprado, J., Wilson, T. W., Shim, J.-U., and Murray, B. J.: The study of atmospheric ice-nucleating particles via microfluidically generated droplets, Microfluidics and Nanofluidics, 22, 52, https://doi.org/10.1007/s10404-018-2069-x, 2018.
Tobo, Y.: An improved approach for measuring immersion freezing in large droplets over a wide temperature range, Sci. Rep., 6, 32930, https://doi.org/10.1038/srep32930, 2016.
Vali, G.: Quantitative evaluation of experimental results an the heterogeneous freezing nucleation of supercooled liquids, Journal of Atmospheric Sciences, 28, 402–409, 1971.
Vali, G.: Freezing Rate Due to Heterogeneous Nucleation, Journal of the Atmospheric Sciences, https://doi.org/10.1175/1520-0469(1994)051<1843:FRDTHN>2.0.CO;2, 1994.
Vergara-Temprado, J., Miltenberger, A. K., Furtado, K., Grosvenor, D. P., Shipway, B. J., Hill, A. A., Wilkinson, J. M., Field, P. R., Murray, B. J., and Carslaw, K. S.: Strong control of Southern Ocean cloud reflectivity by ice-nucleating particles, P. Natl. Acad. Sci. USA, 115, 2687–2692, https://doi.org/10.1073/pnas.1721627115, 2018.
Welti, A., Lüönd, F., Stetzer, O., and Lohmann, U.: Influence of particle size on the ice nucleating ability of mineral dusts, Atmos. Chem. Phys., 9, 6705–6715, https://doi.org/10.5194/acp-9-6705-2009, 2009.
Westbrook, C. D. and Illingworth, A. J.: The formation of ice in a long-lived supercooled layer cloud, Q. J. Roy. Meteor. Soc., 139, 2209–2221, https://doi.org/10.1002/qj.2096, 2013.
Wex, H., Augustin-Bauditz, S., Boose, Y., Budke, C., Curtius, J., Diehl, K., Dreyer, A., Frank, F., Hartmann, S., Hiranuma, N., Jantsch, E., Kanji, Z. A., Kiselev, A., Koop, T., Möhler, O., Niedermeier, D., Nillius, B., Rösch, M., Rose, D., Schmidt, C., Steinke, I., and Stratmann, F.: Intercomparing different devices for the investigation of ice nucleating particles using Snomax® as test substance, Atmos. Chem. Phys., 15, 1463–1485, https://doi.org/10.5194/acp-15-1463-2015, 2015.
Whale, T. F., Murray, B. J., O'Sullivan, D., Wilson, T. W., Umo, N. S., Baustian, K. J., Atkinson, J. D., Workneh, D. A., and Morris, G. J.: A technique for quantifying heterogeneous ice nucleation in microlitre supercooled water droplets, Atmos. Meas. Tech., 8, 2437–2447, https://doi.org/10.5194/amt-8-2437-2015, 2015.
Wieber, C., Rosenhøj Jeppesen, M., Finster, K., Melvad, C., and Šantl-Temkiv, T.: Micro-PINGUIN: microtiter-plate-based instrument for ice nucleation detection in gallium with an infrared camera, Atmos. Meas. Tech., 17, 2707–2719, https://doi.org/10.5194/amt-17-2707-2024, 2024.
Wright, T. P., Petters, M. D., Hader, J. D., Morton, T., and Holder, A. L.: Minimal cooling rate dependence of ice nuclei activity in the immersion mode, Journal of Geophysical Research: Atmospheres, 118, 10535–10543, https://doi.org/10.1002/jgrd.50810, 2013.
- Abstract
- Introduction
- Instrument development
- INP concentration calculation
- Freezing experiments
- Summary
- Appendix A: Frozen fraction (FF) results and information about different samples
- Appendix B: Calculation of uncertainty
- Data availability
- Author contributions
- Competing interests
- Disclaimer
- Acknowledgements
- Financial support
- Review statement
- References