the Creative Commons Attribution 4.0 License.
the Creative Commons Attribution 4.0 License.
 | 03 Feb 2025
A novel methodology for assessing the hygroscopicity of aerosol filter samples
Nagendra Raparthi
Anthony S. Wexler
Ann M. Dillner
Due to US regulations, concentrations of hygroscopic inorganic sulfate and nitrate have declined in recent years, leading to an increased importance of the hygroscopic nature of organic matter (OM). The hygroscopicity of OM is poorly characterized because only a fraction of the multitude of organic compounds in the atmosphere is readily measured, and there is limited information on their hygroscopic behaviors. Hygroscopicity of aerosol is traditionally measured using a humidified tandem differential mobility analyzer (HTDMA) or electrodynamic balance (EDB). EDB measures water uptake by a single particle. For ambient and chamber studies, HTDMA measurements provide water uptake and particle size information but not chemical composition. To fill this information gap, we developed a novel methodology to assess the water uptake by particles collected on Teflon filters. This method uses the same filter sample for both hygroscopicity measurements and chemical characterization, thereby providing an opportunity to link the measured hygroscopicity with ambient particle composition. To test the method, hygroscopic measurements were conducted in the laboratory for ammonium sulfate, sodium chloride, glucose, and malonic acid, which were collected on 25 mm Teflon filters using an aerosol generator and sampler. Constant-humidity solutions (CHSs), including potassium chloride, barium chloride dihydrate, and potassium sulfate, were employed in a saturated form to maintain the relative humidity (RH) at approximately 84 %, 90 %, and 97 % in small chambers. Our preliminary experiments revealed that, without the pouch, water uptake measurements were not feasible due to rapid water loss during weighing. Additionally, we observed some absorption by the aluminum pouch itself. To account for this, concurrent measurements were conducted for both the loaded and the blank filters at each RH level. Thus, the dry loaded and blank Teflon filters were placed in aluminum pouches with one side open and in RH-controlled chambers for more than 24 h. The wet loaded samples and wet blanks were then weighed using an ultramicrobalance to determine the water uptake by the respective compound and the blank Teflon filter. The net amount of water absorbed by each compound was calculated by subtracting the water uptake of the blank filter from that of the wet loaded filter. Hygroscopic parameters, including the water-to-solute (W S) ratio, molality, mass fraction solute (mfs), and growth factors (GFs), were calculated from the measurements. The results obtained are consistent with those reported by the Extended Aerosol Inorganics Model (E-AIM) and previous studies utilizing HTDMA and EDB for these compounds, highlighting the accuracy of this new methodology. This new approach enables the hygroscopicity and chemical composition of individual filter samples to be assessed so that in complex mixtures, such as chamber and ambient samples, the total water uptake can be parsed between the inorganic and organic components of the aerosol.
- Article
(1445 KB) - Full-text XML
-
Supplement
(623 KB) - BibTeX
- EndNote


This is the first study to assess the hygroscopicity of particles collected on Teflon filters at near-saturation levels using constant-humidity solutions.
This study's methodology can evaluate water uptake at RH levels as high as ∼ 97 %.
This methodology enables the investigation of composition-dependent hygroscopicity of particles.
Atmospheric particles significantly degrade air quality by reducing visibility and posing health risks to humans (Gupta et al., 2022; Kaur Kohli et al., 2023; Qu et al., 2020). Additionally, they function as cloud condensation nuclei (CCN) or ice-nucleating particles (INPs), profoundly influencing cloud properties and consequently exerting a significant effect on Earth's radiation budget (Haseeb et al., 2024; Lee et al., 2008; Li et al., 2022; Mikhailov et al., 2021; Nadler et al., 2019; Reich et al., 2023; Sjogren et al., 2007; Wang et al., 2021; Zieger et al., 2017). Atmospheric aerosol consists of both organic and inorganic compounds with varying physicochemical properties, which further determine the CCN activity, reactivity, deposition, and optical properties (Padró et al., 2012; Wang et al., 2010). Historically, the hygroscopic (water-attracting) characteristics of CCN were primarily influenced by inorganic compounds such as nitrates, sulfates, and chlorides. However, with the implementation of emissions controls that have successfully reduced nitrogen and sulfur oxide emissions, the organic fraction of aerosol assumes a more prominent role. Additionally, the organic fraction is considerably more complex than its inorganic counterpart, comprising thousands of individual compounds originating from diverse sources and reaction pathways, each possessing distinct physical and chemical properties (Boris et al., 2019; Jathar et al., 2016). This complexity often poses challenges to establishing a clear correlation between the organic fraction and hygroscopicity (Han et al., 2022).
The hygroscopicity of particles, which refers to their ability to absorb water, depends on both size and chemical composition (Luo et al., 2020; Zieger et al., 2017). The water activity of atmospheric particles, particularly the affinity of various solutes for water, plays a crucial role in governing several important factors. These include the “total mass concentration of airborne particles, their acidity, the extent of light scattering, their rates of aqueous phase chemical reactions, and their ability to act as cloud condensation nuclei (CCN)” (Saxena et al., 1995). To characterize these attributes of airborne particles, it is necessary to know the amount of water uptake as a function of particle composition and relative humidity (RH) (Saxena et al., 1995).
Various thermodynamic models are available for estimating hygroscopicity, including ISORROPIA (Nenes et al., 1998), the Aerosol Inorganic–Organic Mixtures Functional groups Activity Coefficients (AIOMFAC) (Zuend et al., 2010), the Extended Aerosol Inorganics Model (E-AIM) (Clegg et al., 1998), the Universal Quasi-Chemical Functional group Activity Coefficients (UNIFAC) model (Fredenslund et al., 1975), and the University of Manchester System Properties (UManSysProp) (Topping et al., 2016). For the organics, they utilize group contribution methods to estimate the water activity of ambient species relevant to the atmosphere (Han et al., 2022). However, these models require further experimental data to validate them and refine their predictions (Han et al., 2022).
Various techniques exist to measure the hygroscopic growth of aerosol particles. These include methods such as a humidifier tandem differential mobility analyzer (HTDMA), electrodynamic balance (EDB), a differential aerosol sizing and hygroscopicity probe (DASH-SP), and direct mass measurements of water uptake by particles collected on aerosol filters. These techniques have been extensively reviewed in previous studies by Kreidenweis and Asa-Awuku (2014) and Tang et al. (2019). Among these, the most employed methods are the HTDMA (Boreddy et al., 2014; Laskina et al., 2015; Mikhailov et al., 2021) and EDB (Chan et al., 1992, 2000; Cohen et al., 1987; Kaur Kohli et al., 2023; Peng et al., 2001; Steimer et al., 2015; Tang and Munkelwitz, 1991). EDB measures the change in mass of individual charged particles of known composition, which are levitated in a gaseous atmosphere by means of an electric field created by imposing voltages on the electrodes (Cohen et al., 1987; Kaur Kohli et al., 2023). When the mass of a levitating particle undergoes evaporation or condensation due to a change in RH, it becomes proportional to the DC voltage required to balance the particle in a stationary position. The particle's mass fraction of the solute (mfs) can then be determined by measuring the particle's balancing voltage with that of a reference state of known composition (Peng et al., 2001). However, EDB is limited to analyzing single particles and is not suitable for studying the water uptake of ambient samples. HTDMA measures the change in particle size distribution in response to varying humidity levels and can be used to measure ambient aerosol. By exposing aerosol particles to controlled humidity levels and measuring their sizes before and after exposure, HTDMA assesses the extent of hygroscopic growth as a function of particle size. This method measures the change in the diameter of the particles, from which parameters such as mfs and solute molality are estimated. However, this method faces challenges in measuring RH conditions exceeding 90 % (Marsh et al., 2019), an RH regime that can lead to very high water uptake and that is not applicable for measuring the hygroscopicity of particles collected on aerosol filters. An alternative to HTDMA is DASH-SP, which can measure hygroscopic growth at RH levels as high as 95 % and perform rapid, size-resolved measurements of subsaturated particle hygroscopicity (Shingler et al., 2016; Sorooshian et al., 2008). However, DASH-SP is impractical for measuring the hygroscopicity of particles collected on filters.
Quartz crystal microbalances (QCMs) offer a direct method for measuring water uptake by aerosol particles collected on filters. These instruments utilize the Sauerbrey equation to quantify mass-based hygroscopic behavior of particulate matter (Tang et al., 2019, and reference therein). Jose et al. (2024) demonstrated the application of QCM technology to measure the hygroscopic growth of size-resolved aerosol particles on Teflon filters at RH levels up to 93 %. The experimental protocol involved transferring collected particles to the QCM sensor via direct contact by placing the filter onto the sensor and gently pressing it with a cotton piece. However, the Sauerbrey equation's accuracy may be compromised when the deposited film lacks rigidity or exhibits poor surface coupling, potentially introducing systematic errors in hygroscopic property estimations (Tang et al., 2019). Alternative methodologies, including physisorption and katharometer analyzers, have been employed to quantify water vapor concentration changes resulting from particle–water interactions on aerosol filters (Ma et al., 2010; Mikhailov et al., 2011). However, physisorption analyzers typically necessitate substantial sample masses (≥ 1 mg), which limits their applicability in atmospheric aerosol studies (Gu et al., 2017). Moreover, both physisorption and katharometer techniques are characterized by extended experimental durations, often spanning several days (Gu et al., 2017; Mikhailov and Vlasenko, 2020). The precision of katharometer methods in quantifying water adsorption within nanoscale layers remains a subject of ongoing investigation (Tang et al., 2019), highlighting the need for further refinement of these analytical techniques.
Analytical balances have been employed to measure the mass change of particles collected on aerosol filters due to water uptake under controlled conditions. For instance, McInnes et al. (1996) used a semi-dynamic method to measure the water uptake of particles collected on Millipore Fluoropore filters, with the microbalance housed in a chamber controlled for humidity and temperature. They maintained a 33 % RH using a saturated solution of MgCl2• 6H2O, with the lowest RH achieved via nitrogen cylinders. The aerosol water uptake at 33 % RH was calculated as the difference in mass between higher- and lower-RH conditions. However, most organic and inorganic compounds do not take up significant water at 33 % RH. Similarly, Hitzenberger et al. (1997) employed a semi-dynamic method to measure aerosol particles collected on aluminum foils, maintaining RH levels between 45 % and 95 % using varying concentrations of CaCl2 solutions in a housed chamber. Nevertheless, actual humidities inside the chamber were lower than the water activities of the CaCl2 solution due to a narrow chamber opening, resulting in differing growth patterns for two samples collected at the same location and time of the year (Hitzenberger et al., 1997). Housing microbalances in chambers with high humidity (> 80 % RH) is also problematic, as the high moisture can corrode electronic components, affecting measurement accuracy and stability. However, many atmospheric aerosols, especially those with deliquescence relative humidities (DRHs) greater than 80 %, undergo rapid water uptake at RH > 95 % (Kreidenweis and Asa-Awuku, 2014). Therefore, there is a need to develop robust laboratory techniques capable of measuring composition-dependent water uptake of aerosols collected on Teflon filters under near-saturated conditions.
This study's objective is to devise a methodology for assessing the water uptake of organic and inorganic aerosol in samples with known chemical composition. Samples collected on Teflon filters are commonly used for gravimetric and chemical analyses, and we developed a method to measure water uptake on the same filter, enabling correlation of chemical composition with hygroscopicity. Our aim is to accurately estimate water adsorption by solute molecules that commonly act as cloud condensation nuclei (CCN), which include atmospheric-relevant inorganics such as ammonium sulfate and sodium chloride, as well as organics such as glucose, a sugar, and malonic acid, a dicarboxylic acid. We compare the results obtained to data from the literature to gain insights into the accuracy of the methodology developed. The novelty of this research lies in the development of a method to determine the hygroscopicity of aerosol filter samples so that the chemical composition can be measured and to measure at high relative humidity, exceeding 90 %, which is relevant to CCN and where most organic and inorganic compounds absorb considerable amounts of water. In addition, unlike HTDMA measurements, there is no need to account for the shape factor of a compound, as this method directly measures the mass of water uptake by the particles collected on the Teflon filters.
2.1 Relative-humidity-controlled chamber
The initial step in developing this methodology involves maintaining RH throughout the entire water uptake measurement process. Constant-humidity solutions (CHSs) (Lide, 2004) offer a means to sustain specified RH levels within sealed chambers. In this study, our aim was to measure the water uptake of both organic and inorganic compounds across a range of high RH levels above 80 %. Potassium chloride, barium chloride dihydrate, and potassium sulfate were selected for their capacity to maintain RH levels of approximately 84 %, 90 %, and 97 %, respectively, in their saturated form. Prior to conducting the actual water uptake measurements, we placed these saturated solutions in 10 in. plastic and glass chambers for 24 h to assess their practical efficacy. In addition, a real-time RH and temperature sensor (Rotronic HL-1D, with an accuracy of ±3.0 % RH and ±0.3 °C) was placed inside the chambers. The RH reached the desired RH levels in the glass chambers but not in the plastic chambers, likely due to the absorption by the plastic itself (Fig. 1). Wexler and Hasegawa (1954) specifically noted that chambers should be made of non-hygroscopic materials, preferably metal or glass, as otherwise the time required to achieve RH equilibrium could be substantial, sometimes spanning days or weeks. Similar observations were made in our study.
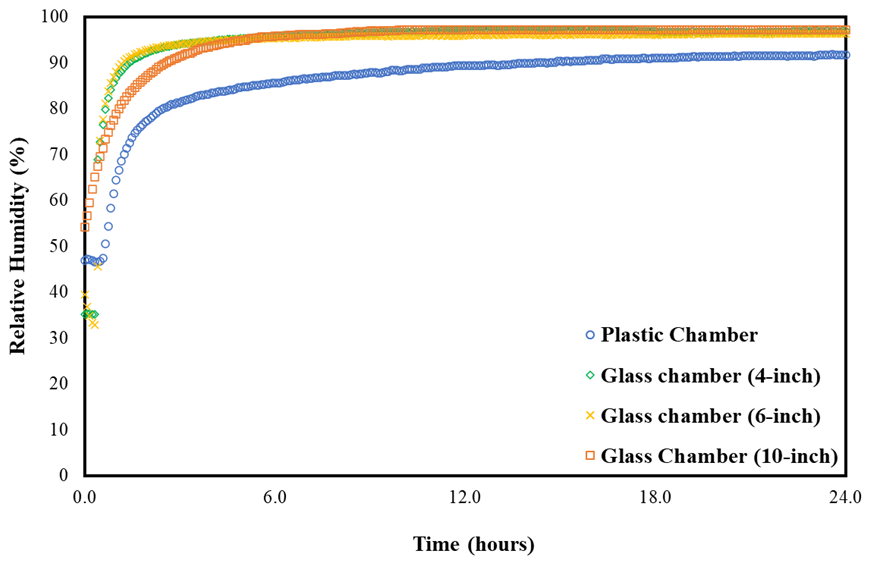
Figure 1RH over 24 h in the plastic (10-inch) and glass (4, 6, and 10-inch) chambers with saturated K2SO4 solution.
Next, we used 4, 6, and 10 in. diameter glass chambers to examine the consistency of RH levels across different chamber sizes. As expected, all these chambers reached their optimal RH depending on the saturated solutions used, but there was a difference in time to equilibration. For instance, the initial time taken to reach the desired RH of ∼ 97 % (saturated K2SO4) for a 10 in. chamber was slightly longer compared to 4 and 6 in. chambers (Fig. 1). Based on these observations, it is evident that RH equilibrium is influenced by the presence of hygroscopic materials and the ratio of the solution's free surface area to the chamber volume. These findings affirm the appropriateness of CHS for conducting water uptake measurements using glass chambers of any size and demonstrate that smaller sizes equilibrate more quickly.
Determining the RH (aw) for the CHS
In the CRC Handbook (Vol. 85), Lide (2004) provided integer RH values for CHS at 25 °C. However, even a small variation in RH could substantially affect water uptake, particularly at higher RH levels, where the water uptake change per change in RH is very steep. The average temperature during these experiments ranged from 17.9 to 21.6 °C. To evaluate the effect of temperature variation on RH, the water activity over this range was calculated for each compound used to create CHS. The water activity is ∼ 0.843 for saturated KCl and ∼ 0.975 for saturated K2SO4, with no significant variation within the temperature range according to Eq. (1) provided by Wexler and Seinfeld (1991),
where aw(T) is the water activity at temperature T, aw(T0) is the water activity at temperature T0 (298.15 K), Mw is the molecular weight of water (18.01528 g mol−1), ms is the saturated molality of the compound used as CHS, R is the universal gas constant (8.314 kJ kmol K−1), and Ls is the latent heat of fusion for the salt from a saturated solution; it equals the difference between the standard heat of formation of the crystalline solid phase (ΔHf,c) and the standard heat of formation of the species in the aqueous solution at saturation molality (ΔHf,aq). For aw(T0), the values are 0.8426 for KCl and 0.975097 for K2SO4 (Kim and Seinfeld, 1995). The average saturated molality (ms, in mol kg−1) is 4.604 for KCl (Shearman and Menzis, 1937) and 0.636 for K2SO4 (Krumgalz, 2018). The latent heat of fusion (Ls, in kJ mol−1) is −15.287 for KCl and −23.77 for K2SO4 (Kim and Seinfeld, 1995).
The water activity for saturated BaCl2• 2H2O was determined by extrapolating the water activities provided by Wang et al. (2013) at temperatures of 5, 15, 25, and 35 °C (see Fig. S1 in the Supplement). The average aw for saturated BaCl2• 2H2O during these experiments was ∼ 0.908, ranging from 0.906 to 0.911, and for each experiment the variability in RH due to temperature fluctuations in the lab was negligible (less than 0.25 %).
2.2 Laboratory sample collection
The laboratory particulate samples were produced utilizing a home-built aerosol generator and sampler, which consist of an atomizer (aerosol generator 3076, TSI Inc., USA), a custom-built diffusion dryer, and an Interagency Monitoring of Protected Visual Environments (IMPROVE; https://vista.cira.colostate.edu/Improve/improve-program/, last access: 16 May 2024) aerosol sampler operated at 22.8 L min−1 (Ruthenburg et al., 2014; Solomon et al., 2014). The aerosol generator and sampler were used to generate and collect the known mass of each target compound onto 25 mm Teflon filters (MTL, USA). Deionized water (∼ 18.2 MΩ purity) was used to make solutions of each compound to collect blank filter samples in the aerosol generator and sampler system and to flush the system. Pure filtered air and chemical solutions were delivered to the atomizer to generate aerosol particles. Before collecting each compound, a 30 min pre-flush with water was conducted to eliminate any residual material from the previous sample collection run. Subsequently, a water blank was collected onto the Teflon filter to identify any remaining contamination from prior samples. If contamination was identified, further cleaning was performed. Following this, each compound was collected on a Teflon filter using an IMPROVE aerosol sampler with sufficient mass (more than 50 µg, based on observations of sodium chloride's water uptake, as discussed in Sect. 3.3) to produce measurable water uptake in the sample above its deliquescence RH (Table 1). After completing these steps, the aerosol generator and sampler underwent a 30 min water flush to remove any deposited compounds, ensuring they were contamination-free for subsequent runs. Following sample collection on the aerosol generator and sampler and prior to post-weighing, the collected samples were placed in a dry desiccator for a minimum of 24 h to remove any residual water. Pre-weights and post-weights of filters were recorded at least thrice on 3 separate days using a high-precision ultra-microbalance with a readability of 0.1 µg (model XP2U, Mettler Toledo, USA) before and after sample collection. The difference in the post-weight and pre-weight gives the amount of compound collected on the filter.
Table 1List of compounds collected using the aerosol generator and sampler for water uptake measurements.

a Peng et al. (2022). b Mochida and Kawamura (2004).
2.3 Water uptake measurements
After post-weighing, the dry particle-loaded filters (dry samples (DSs), post-weighed filters with dry particles) were placed in sealed chambers at RHs of 84.3 %, 90.8 %, and 97.5 % and were allowed to equilibrate for more than 24 h. Subsequently, they were weighed to measure the water uptake by the solutes present on the filters. However, the weighing process did not proceed as expected; the filter weights were unstable on the balance, gradually decreasing until they reached their initial dry particle load weight (Fig. 2a). This indicated that the water taken up by the compounds on the filter evaporated during the weighing process, making it impossible to measure the water uptake at the chamber RH. Thus, there was a need for containment to prevent water loss during weighing.
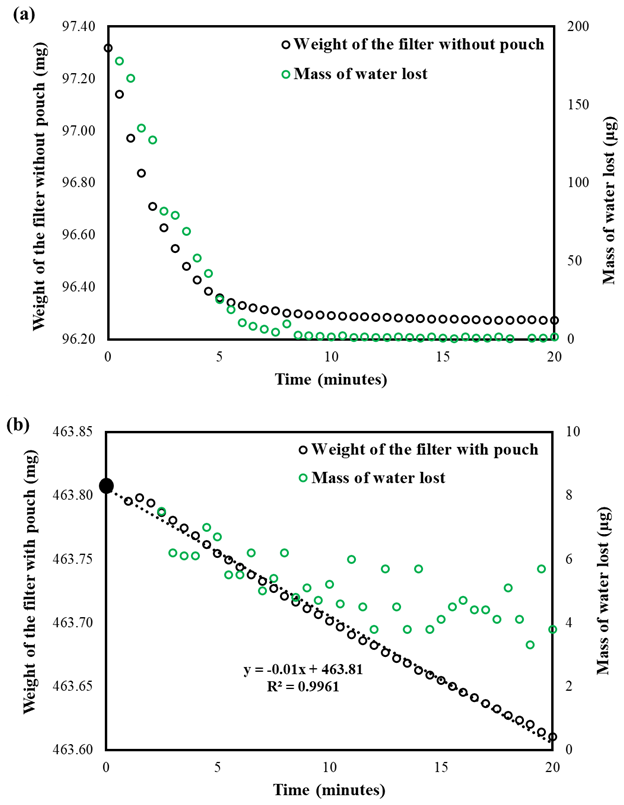
Figure 2Weight of the filter and mass of water lost while weighing glucose at 97.5 % RH (a) without a pouch and (b) with a pouch. The dashed line represents the linear extrapolation of the observed filter weights to determine the actual wet-filter weight (solid black circle) at the time the sample was taken from the chamber.
2.3.1 How can we minimize water loss?
To limit water loss during the wet weighing of the filter, different types of pouches were used to contain the filter and lock in the humidity, including plastic and antistatic ziplock bags. However, these proved to be ineffective due to electrostatic interference during weighing and hygroscopicity of the pouch material. Consequently, aluminum foil pouches were tested. Pouches (approximately 5 cm × 3 cm × 1 cm) were fabricated from these foils, with three sides sealed. The weights of these pouches were quite stable; therefore, they were tested further for possible use in the water uptake measurements.
A dry particle-loaded filter was placed in a pouch and then placed in the chambers at the specified RH for more than 24 h, with the fourth side open to allow water vapor in the air to interact with the particles on the filter. After equilibration and upon opening the chamber lid, the pouches were sealed immediately, and the time was recorded. Subsequently, the samples were transferred to the balance, and gravimetric readings were taken. The weight of the wet loaded sample (WSP, mass of the pouch with solute sample at measured RH) was recorded every 30 s for 20 min (Fig. 2b) to investigate how the wet weight of the filter with the pouch varied compared to that of the wet loaded filter without a pouch. The time taken for the sample transfer from the chamber to the first weight was also recorded.
Using a pouch to contain water loss while weighing proved to be effective. We observed a small, slow decrease that achieved a steady state (noisy due to being close to the uncertainty of the balance) after about 10 min in the wet weight of the particulate filter with the pouch (Fig. 2b) compared to the large, rapid decrease without the pouch (Fig. 2a). The initial increase in mass followed by a linear decline required that the data be extrapolated from the linear region back to time zero to accurately determine the net water uptake by the solute on the filter (Fig. 2b, dotted line). These observations clearly suggest that the water loss from the filter can be nearly contained by using the pouch. Gold-coated aluminum foils were also tested and functioned similarly to regular aluminum foil (Fig. S2). Gold-coated foils were used in subsequent experiments because they come in separate sheets, making them easier to handle than rolled aluminum foil.
2.3.2 Why does the pouch weight initially increase and then decrease?
The initial weight gain of the pouch was perplexing, so we investigated by collecting the wet weight of a pouch with a filter and a pouch without a filter (Fig. 3) every 30 s for over 20 min. The same interval and duration of weighing were applied for all filters and tests unless stated otherwise. This procedure was repeated for 5 d. The weight increase in the initial minutes of weighing was calculated using the measured data shown in Fig. 3, and we compared it to the calculated change in air mass between wet and dry air using the psychometric data to determine if dry-air intrusion into the pouch was the cause of the weight gain.
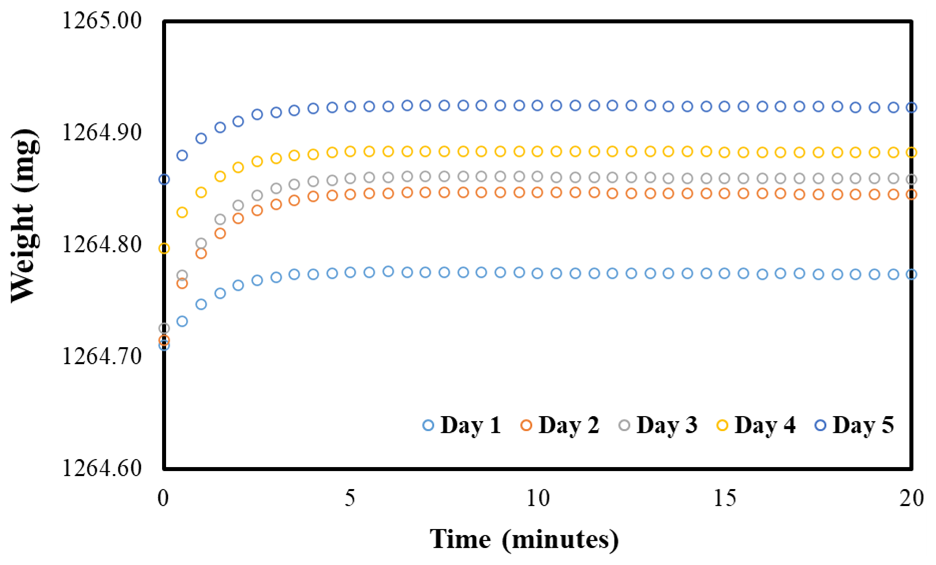
Figure 3Variation in the weight of the pouch with a Teflon filter over time starting when the pouch is removed from the chamber (RH = 97.5 %) and placed on the balance.
Measurements
The observed variation in the weight of the pouch (with a filter) over time during the transition from measured RHs to the weighing balance, set at room RH, is depicted in Fig. 3. Across all days and with or without a filter, the weight variation followed a similar pattern, increasing for the first few minutes and then stabilizing.
The change in air mass for each day was determined by calculating the weight difference between the initial time and the point at which the weighing reached a near constant, as illustrated in Eq. (2):
where mz is the weight of pouch at time z where it becomes constant, and m0 is the weight of the pouch at zero time.
The average (±SD) increases in mass from zero time to the point where the pouch weight (with a filter) became relatively constant for 84.3 %, 90.8 %, and 97.5 % RHs was 95 (±9) µg, 98 (±56) µg, and 97 (±34) µg, respectively.
Theoretical calculations using the psychometric chart
The measured mass change was then compared to the calculated change in the mass of air from the chamber RHs to room RH from the specific volume (SV) using the psychometric chart (PC) (source: https://daytonashrae.org/psychrometrics/psychrometrics_si.html#start, last access: 29 May 2024) at the known values of temperature and RHs. The assumption was made that the air inside the pouch was exchanged for room air within a few minutes. During this time, an increase in weight would be observed due to the displacement of less dense air (i.e., 97.5 % RH) with denser air (∼ 45 % RH). The obtained SV from the PC was then inverted to determine the density (þ) of air at the respective RHs, as shown in Eqs. (3) and (4),
where þi represents the air density at different RHs (i: 84.3 %, 90.8 %, and 97.5 %), and SVi is the specific volume at these RHs. þr and SVr represent the density and specific volume at room conditions (r).
The net change in air density (Δþ) from the measured relative humidities to room conditions is calculated using Eq. (5):
The variation in the mass of air (mi) is calculated using Eq. (6):
where mi is the change in the mass of air from the measured RHs (84.3 %, 90.8 %, and 97.5 %) to the room RH, and VP is the volume of the aluminum pouch.
The calculated air density and mass obtained at high and room RHs using PC are presented in Table S1 in the Supplement. At higher RHs, the density of air in the pouch was lower due to the increased concentration of water molecules at higher RHs, which have a lower molecular weight (18 g mol−1) compared to that of air (29 g mol−1). The calculated average net mass gain (±SD) from high RHs of 84.3 %, 90.8 %, and 97.5 % to room RHs was 197 (±58) µg, 200 (±52) µg, and 255 (±54) µg, respectively.
The theoretical increase in the mass of air was higher than the measured values. This is attributed to the air in the pouch being at a lower RH than the chamber RH at the initial weight due to the time it takes to move the pouch from the glass chambers to the balance and an incomplete exchange of high RH to room RH air.
2.3.3 Increasing weights of filter with pouch during repeated measurements over multiple days
While conducting water uptake measurements, we observed that the weight of the pouch with the sampled filter increased from measurement to measurement even though the RH did not change, leading to uncertainty in our water uptake measurements (Fig. 3). There was a consistent increase in the wet weight of the pouch with a filter for each consecutive day across all RHs (84.3 %, 90.8 %, and 97.5 %), with average (±SD) increases of 13 (±10) µg, 17 (±9) µg, and 37 (±25) µg, respectively, as shown in Fig. 3 for 97.5 % RH; results for 84.3 % and 90.8 % RH are shown in Fig. S3. Similarly, for the pouch without a filter, there was increases in weight of 14 (±4) µg, 25 (±11) µg, and 44 (±7) µg, respectively (see Fig. S4).
To determine the cause of the mass increase, the following experiment was performed. After conducting water uptake measurements for 5 d, the pouches with blank filters were subsequently placed in a dry desiccator for a minimum of 24 h and then weighed. This process was repeated for the next 4 d. The observed variations in the weights of the dried pouches are presented in Fig. 4 for 97.5 % RH and in Fig. S3 for 84.3 % and 90.8 % RH. The weights of these pouches, measured across all RHs, remained fairly consistent, only varying by a few micrograms throughout the 4 d of measurement, and did not exhibit a consistent trend in either increasing or decreasing weight. This suggests that after water adsorption onto the pouch, aluminum oxides are formed and remain stable at low RH. Considering these observations, it is prudent to account for water adsorption onto pouches when making water uptake measurements.
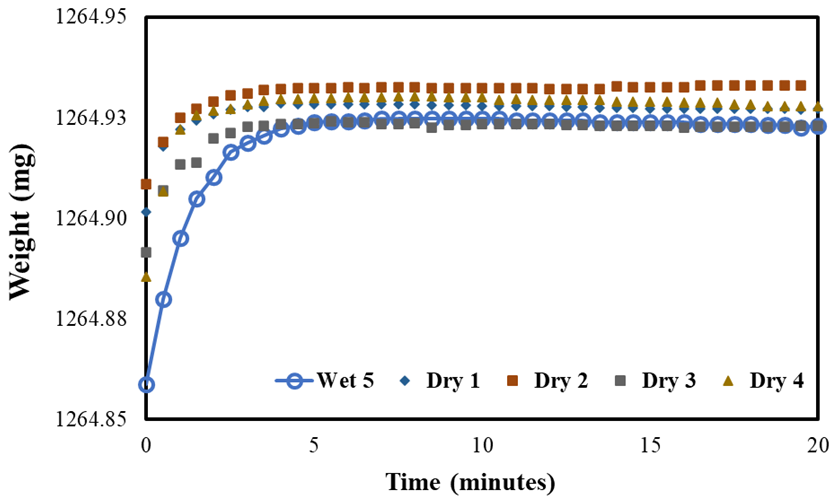
Figure 4Variation in the dry weight of the pouch (with a filter) over time compared to the fifth day wet measurement (97.5 % RH).
By including a measurement blank, consisting of a pouch with a blank filter, alongside the water uptake measurements using a pouch with a loaded filter, two issues are addressed: (i) water absorption on the pouch itself and (ii) small day-to-day fluctuations in the balance due to changes in meteorological and room conditions. The benefits of using the measurement blank to account for water absorption on the pouch are illustrated with a filter loaded with sodium chloride and exposed to 84.3 % RH for 5 d. Figure 5 illustrates the water uptake of sodium chloride with the pouch, the pouch with a blank filter, and the net water uptake by sodium chloride, calculated as the difference between the water uptake of the pouch with sodium chloride and the pouch with the blank filter. The water uptake of the pouch with the sodium chloride filter increased day to day. However, by subtracting the water uptake from the pouch with the blank filter, the water uptake by sodium chloride remained consistent day to day. Hence, to address pouch absorption, measurements were conducted simultaneously on pouches with blank filters at the specified RHs and on pouches with loaded filters; thus, for each compound, there were a total of six filters – three pouches with blanks, one at 84.3 %, 90.8 %, and 97.5 %, and, similarly, three loaded filters in pouches at the same RH.
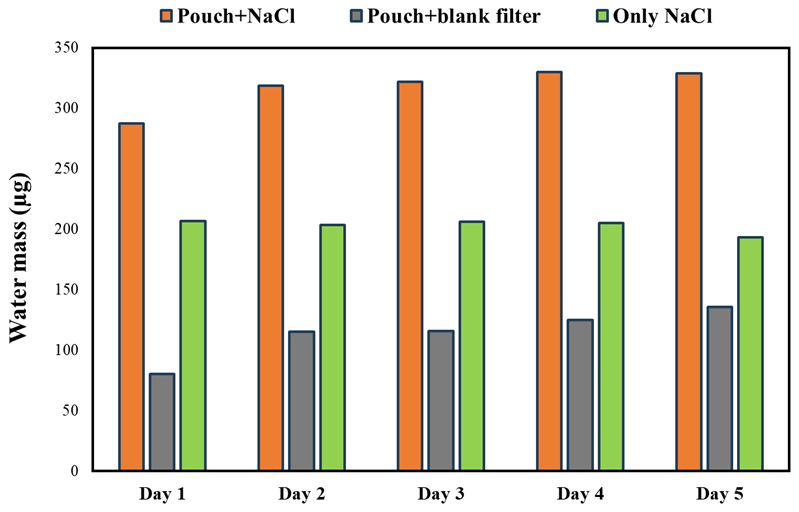
Figure 5Water uptake by the pouch with sodium chloride, the pouch with the blank filter, and only sodium chloride at 84.3 % RH.
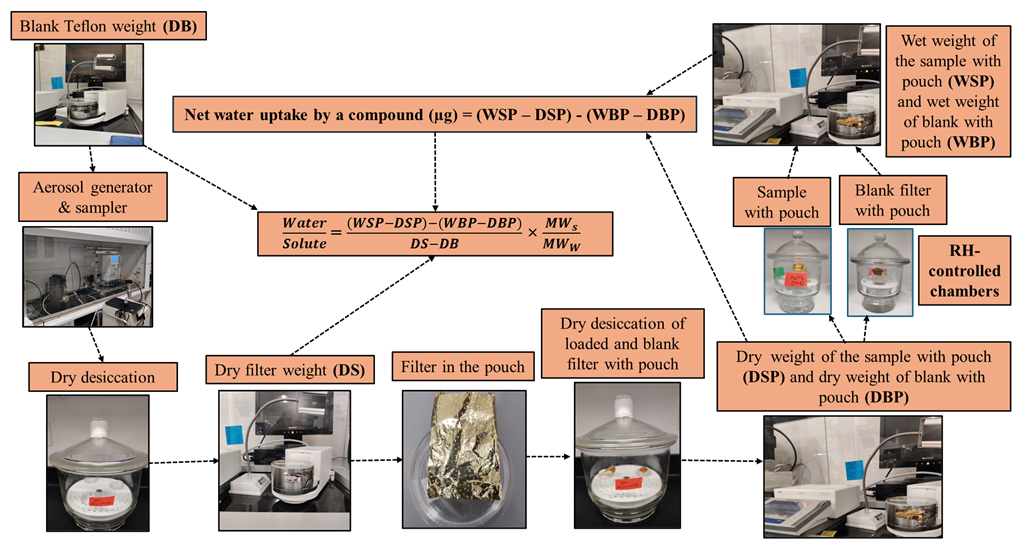
Figure 6 illustrates the finalized water uptake methodology derived from the laboratory experiments conducted in this study.
2.4 Hygroscopic parameter estimation
Four parameters related to hygroscopicity are reported here: the mass fraction of solute (mfs), molality, the growth factor (GF), and the water-to-solute ratio, which is the number of moles of water absorbed per mole of solute (compound). The calculations for these parameters are explained in the following sections.
2.4.1 Mass fraction of solute (mfs)
The solute mass fraction is the fraction of solute relative to the total mass of the solution. The mass of the solution in the case of hygroscopic particles is the sum of the solute's mass and the mass of water absorbed by the solute at a given RH, as illustrated in Eq. (7):
2.4.2 Molality (m)
Molality is the moles of solute dissolved in a certain mass of water, as illustrated in Eq. (8):
2.4.3 Growth factor
The growth factor (GF) of the dry particles at the measured RHs is estimated from the ratio of the wet-particle diameter to the dry-particle diameter, as shown in Eq. (9):
where Dw, j is the diameter of the wet particle at RH (j) and Ddry is the diameter of the dry particle. Detailed calculations of the GF at the respective RH are explained in Eqs. (10) to (14):
The measurement uncertainties associated with the estimated growth factor were calculated using uncertainty propagation, as detailed in Sect. S1 of the Supplement.
2.4.4 Water-to-solute ratio
Equation (15) gives the water solute (W S) ratio of the sample on the filter in terms of the measured quantities:
where the wet sample with a pouch (WSP) is the mass of the pouch and sampled filter at high RH, the dry sample with a pouch (DSP) is the mass of the pouch with particles on the filter in dry conditions, the wet blank with a pouch (WBP) is the mass of the pouch with the blank filter at high RH, the dry blank with a pouch (DBP) is the mass of the pouch with the blank filter in dry conditions, the dry sample (DS) is the mass of the filter with particles on the filter in dry conditions, and the dry blank (DB) is the mass of the blank filter. MWS and MWW are the molecular weight of solute and water, respectively. All are in units of milligrams (mg), except MW, which is in g mol−1.
2.5 Uncertainty in the measured water-to-solute (W S) ratio
The uncertainty in the measured water-to-solute ratio was determined using the partial derivatives of the input parameters employed in calculating the W S ratio.
From Eq. (15), the W S ratio can be written as
The sensitivity of the W S ratio to the input variables (X) was calculated using partial derivatives , as illustrated in Eqs. (17) to (22):
The uncertainty contribution δX of each input variable (X) to the measured W S ratio was estimated using Eq. (23):
where σ(X) is the standard deviation of each input parameter (X).
The overall uncertainty in the measured W S was calculated using Eq. (24):
The percentage uncertainty contribution by each input variable to the total uncertainty in the W S ratio was calculated using Eq. (25):
3.1 Derived hygroscopic parameters
Table 2 shows the hygroscopic parameters derived from the measurements, including the water-to-solute (W S) ratio, mfs, molality, and GF at the measured RHs for ammonium sulfate, sodium chloride, glucose, and malonic acid. The observed water uptake increased from 84.3 % to 97.5 % RH for all compounds. For example, the observed W S ratio of sodium chloride, i.e., moles of water absorbed per mole of sodium chloride, was 14.62 at 84.3 % RH, 19.8 at 90.8 % RH, and 86 at 97.5 % RH. Similarly, for ammonium sulfate, glucose, and malonic acid, the W S increased from an RH of 84.3 % to 97.5 % by factors of 5.0, 4.8, and 6.9, respectively. Conversely, the mfs and molality decreased with increasing RH for all the measured compounds. For example, the mfs of malonic acid was 0.47 at 84.3 % RH but only 0.11 at 97.5 % RH. Similarly, the observed molality for malonic acid was 8.63 at 84.3 % RH, which reduced to 1.25 at 97.5 % RH.
Table 2Derived hygroscopic parameters from this study's developed methodology (n = 5).
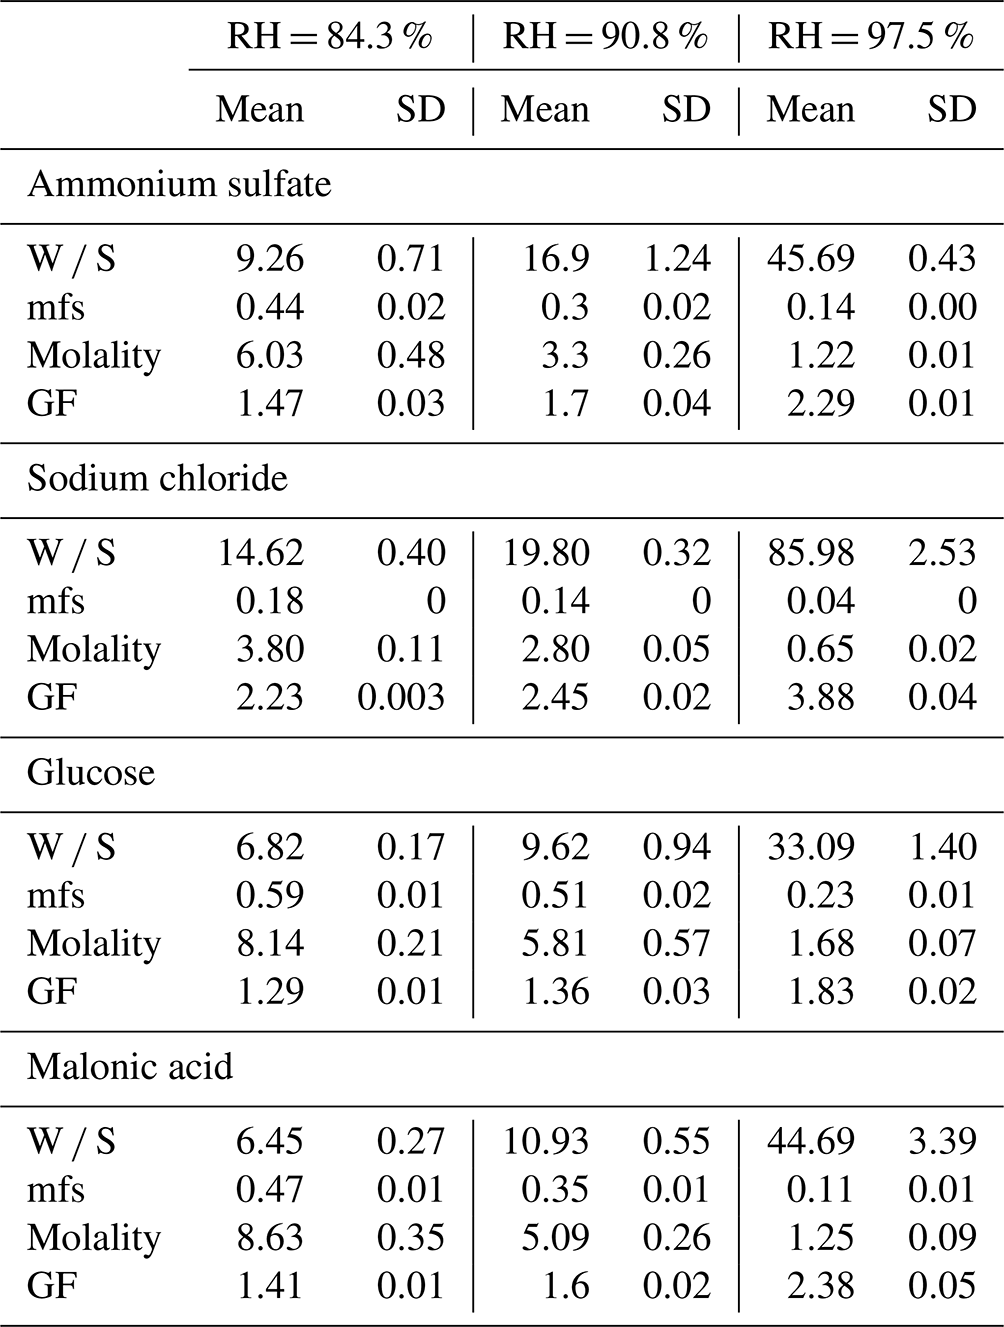
In this study, the water uptake measurements for each compound at each specific RH were repeated over 5 different days to investigate the repeatability of the determined hygroscopic parameters. The variability (standard deviation) in the observed hygroscopic parameters, as shown in Table 2, is small. For instance, the relative standard deviation (RSD, SD ÷ mean) of the growth factor for malonic acid at all RHs was less than 0.5 %. This observation clearly indicates that the variability of the measured hygroscopic parameters at the same RH for each compound between different experiment days is minimal, highlighting the repeatability of this methodology. In addition, to examine the reproducibility of this methodology, we repeated the water uptake measurement for the malonic acid compound at 97.5 % RH with different masses (48.8 and 130.4 µg) and estimated the hygroscopic parameters. We observed insignificant differences (∼ 0.4 %) in the water uptake parameters of malonic acid at 97.5 % RH between the two experiments. These observations indicate that the developed methodology can reproducibly assess the hygroscopicity of particles collected on Teflon filters.
In our study, we recorded the wet weight every 30 s over 20 min to estimate the hygroscopic parameters. However, we evaluated if this length of time was necessary by calculating the GFs for each compound at the measured RHs in 5, 10, and 15 min intervals and compared them with the GFs using the 20 min interval, shown in Fig. S5. There was no significant difference between the GFs estimated using the 5, 10, 15, and 20 min intervals. For future studies, it is unnecessary to take wet weighing for 20 min; taking wet weights every 30 s over a 5 min period is sufficient to determine hygroscopic parameters.
3.2 Comparison of estimated hygroscopic parameters with previous studies
Most prior studies have reported the water uptake in terms of GFs, with few studies reporting in terms of mfs and molality, so we focus our comparisons on GF measurements. The estimated average GFs and the measurement uncertainties for each compound at the measured RHs were compared with previous studies, depicted in Fig. 7. These studies used techniques such as HTDMA and EDB to derive GF. These studies typically examined RH levels of 90 % or lower, except for Mikhailov et al. (2024), who estimated GFs for ammonium sulfate and glucose at RH levels up to 99.9 %. Additionally, the estimated GFs for compounds were compared with values provided by the thermodynamic model, E-AIM (http://www.aim.env.uea.ac.uk/aim/aim.php, last access: 6 May 2024), which has been widely used to assess the water uptake of inorganic compounds for over 3 decades. The estimated GF for sodium chloride of 2.23 at 84.3 % RH was similar to values reported in previous studies (Cheng and Kuwata, 2023; Hu et al., 2010; Peng et al., 2016), which ranged from 2–2.22. Similarly, at 90.8 % RH, the observed GF for sodium chloride of 2.45 was close to that of previous findings (Cheng and Kuwata, 2023; Peng et al., 2016; Zieger et al., 2017), which ranged from 2.20–2.40. For ammonium sulfate, the observed GFs at 84.3 %, 90.8 %, and 97.5 % RH were 1.47, 1.7, and 2.29, respectively, which are similar to those of previous studies (Bouzidi et al., 2020; Cheng and Kuwata, 2023; Choi and Chan, 2002; Cruz and Pandis, 2000; Denjean et al., 2014; Hämeri et al., 2002; Hu et al., 2010; Koehler et al., 2006; Liu et al., 2016; Mikhailov et al., 2024; Prenni et al., 2001; Sjogren et al., 2007), which were 1.49–1.60, 1.70–1.79, and 2.3, respectively. Likewise, for glucose, at 84.3 %, 90.8 %, and 97.5 % RH, the observed GFs fell within the ranges reported in earlier studies (Lei et al., 2023; Mikhailov et al., 2024; Mochida and Kawamura, 2004), which were 1.2–1.5, 1.3–1.65, and 1.8, respectively. For malonic acid, the observed GFs at 84.3 % and 90.8 % RH were consistent with the ranges found in previous studies (Bouzidi et al., 2020; Peng et al., 2001; Pope et al., 2010; Prenni et al., 2001). The measured GF for ammonium sulfate and sodium chloride at all RH levels agreed well with the E-AIM model values, except at 97.5 % RH. The observed GF for ammonium sulfate at 97.5 % in this study was slightly lower than the value reported by E-AIM, differing by a factor of 1.11. For sodium chloride, it was higher by a factor of 1.12. Additionally, for all other compounds, the GFs fell within the measurement uncertainty range, except for ammonium sulfate and sodium chloride at 97.5 % RH. A plausible reason is that changes in water uptake near saturation RH are steep, and even slight variations in RH can significantly affect the GF. This likely explains the slight differences between this study and the E-AIM at 97.5 % RH.
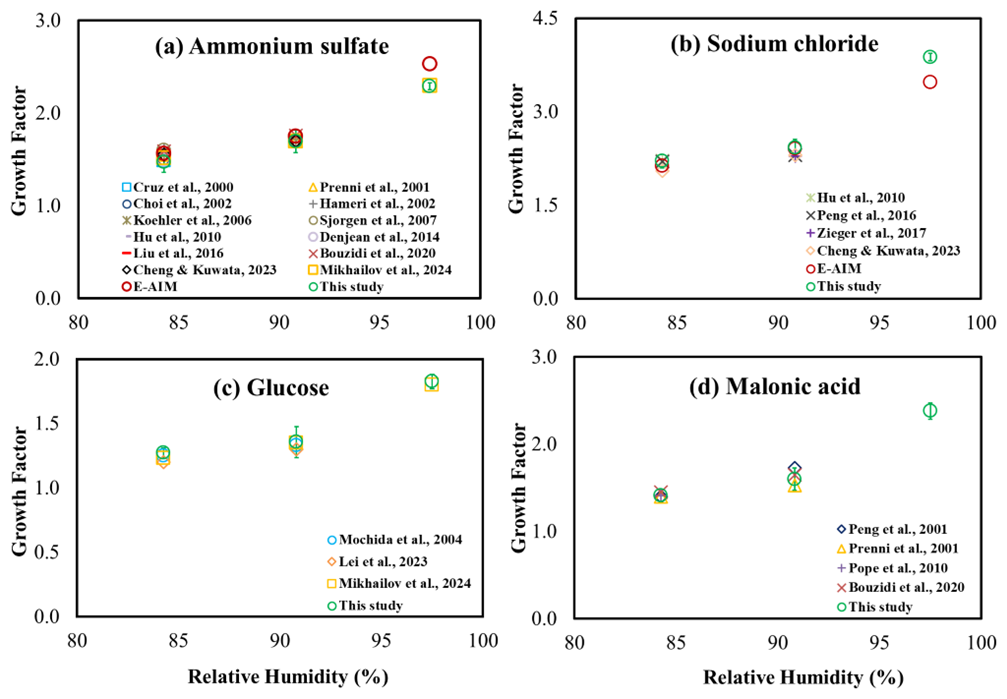
Figure 7Comparison of estimated growth factor for (a) ammonium sulfate, (b) sodium chloride, (c) glucose, and (d) malonic acid with previous studies. The error bar represents the measurement uncertainty in the growth factors from this study.
This study's observed average mfs of malonic acid for 84.3 %, 90.8 %, and 97.5 % RH was 0.47, 0.35, and 0.11, respectively, which is similar to that of previous studies (0.475, 0.37–0.38, and 0.11, respectively) as reported by Koehler et al. (2006) and Maffia and Meirelles (2001). In the same way, for other compounds, the observed mfs is closely matched with that of previous studies (ammonium sulfate: 0.37–0.42, 0.3–0.32, and 0.1–0.12 (Chan et al., 1992; Kim et al., 1994; Kreidenweis et al., 2005; Mikhailov et al., 2024); glucose: 0.60, 0.44–0.46, 0.25 (Mikhailov et al., 2024; Peng et al., 2001); sodium chloride: 0.175, 0.04 (Kreidenweis et al., 2005)). Few studies have reported water uptake in terms of molality, and the observed molality for all the compounds in this study was close to the range of that reported in previous studies (ammonium sulfate: ∼ 4–6.5, 3–3.2, and 1 (Cheng et al., 2015; Mikhailov et al., 2024; Zamora and Jacobson, 2013); glucose: ∼ 5.25–8, 4.7, and 1 (Lei et al., 2023; Mikhailov et al., 2024; Zamora et al., 2011); malonic acid: ∼ 8.5, 5.7, and 1.25 (Lee and Hildemann, 2013); and sodium chloride: ∼ 4.25, 2.2, and 0.75 (Zamora and Jacobson, 2013)).
The above comparisons validate the accuracy and reliability of the methodology used in this study. Therefore, the water uptake of particles collected on Teflon filters can be effectively assessed using the developed methodology.
3.3 Estimated uncertainties in the W S ratio
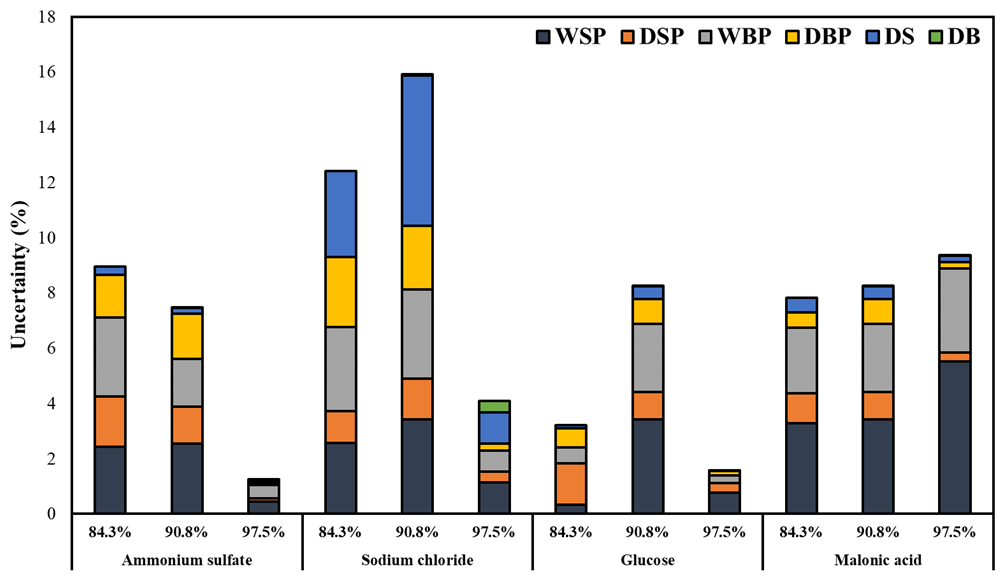
The estimated uncertainties in the W S ratio using this study's methodology are depicted in Fig. 8. Overall, the uncertainty for almost all the measured compounds at measured RHs was below 10 %, except for sodium chloride at 84.3 % and 90.8 %, which had uncertainties of 12 % and 15 %, respectively. WSP and WBP contributed the most to the overall W S uncertainty, followed by DSP and DBP, with DS and DB contributing the least for all the measured compounds, except sodium chloride. For sodium chloride, consistent water uptake was observed across all 5 measured days, as exemplified by the net water uptake at 84 % RH, shown in Fig. 5. However, for sodium chloride, the major uncertainty was associated with DS, unlike other compounds. A plausible reason for this discrepancy is the smaller mass of sodium chloride (45, 39.5, and 27.8 µg for 84.3 %, 90.8 %, and 97.5 % RHs, respectively) compared to other compounds, which averaged 122, 274, and 88 µg for ammonium sulfate, glucose, and malonic acid, respectively, for all three RHs. For sodium chloride at 97.5 %, water uptake was more than 3 times higher than at 84.3 % and 90.8 % RH, resulting in lower uncertainty at 97.5 %. This discrepancy is inherent in the W S ratio calculation, as the mass of solute is in the denominator. Nevertheless, it is important to note that this uncertainty is not inherent in the developed methodology but rather caused by the lower mass used for sodium chloride in the water uptake measurements. To reduce this uncertainty, based on our observations, we recommend using a larger mass: at least 50 µg for hygroscopic compounds like sodium chloride, 100 µg for medium hygroscopic compounds like glucose, and more than 200 µg for less hygroscopic compounds.
In this study, we developed a novel methodology to assess the water uptake of particulate samples collected on Teflon filters. By using filter samples, the chemical composition of ambient or chamber samples can be measured, as well as water uptake, something neither HTDMA nor EDB can do for complex mixtures. The advantage of this method is that it enables hygroscopicity to be related to chemical composition. Additionally, this method can be used to measure water uptake above 90 % RH, which is typically not done with HTDMA measurements.
Laboratory hygroscopic measurements were conducted for ammonium sulfate, sodium chloride, glucose, and malonic acid. Constant-humidity solutions were employed to maintain specific RH and enable measurements as high as ∼ 97 %. While conducting water uptake measurements, we encountered problems, including water loss from the filter when moving from high RH to room RH for weighing and absorption by the pouch used to contain the water loss from the filter sample. These problems were successfully addressed by placing the sample filter in an aluminum pouch and accounting for water absorption by the pouch itself. Hygroscopic parameters, including the W S ratio, GF, molality, and the mfs, were estimated from water uptake measurements for ammonium sulfate, sodium chloride, glucose, and malonic acid at RH levels of 84.3 %, 90.8 %, and 97.5 %. As expected, the water uptake increased with higher RH for all compounds. The observed GFs in this study were consistent with those reported in previous studies for all the measured compounds at the examined RH levels and were similar to modeled values for the inorganics, highlighting the accuracy of this method. The overall uncertainty in the observed W S ratio was less than 10 % for most of the compound–RH combinations measured, further highlighting the robustness and precision of this new method.
The method developed in this study can be used to measure water uptake on the same samples used to measure chemical composition for ambient, indoor, and chamber studies. For organic aerosol composition, Fourier-transform infrared spectroscopy (FT-IR), which is not destructive to the filter sample, can be used to quantify the organic carbon and organic functional groups present in the particles collected on Teflon filters (Anunciado et al., 2023; Boris et al., 2019; Debus et al., 2022; Li et al., 2024; Yazdani et al., 2021). Other non-destructive methods, such as gravimetry for total mass, light absorption measurements to estimate elemental carbon (White et al., 2016), and X-ray fluorescence (XRF) to measure elements (Gorham et al., 2021; Hyslop et al., 2015), provide additional composition information. After the water uptake measurements are performed, the filter sample can be extracted to measure inorganic ions, sulfate, nitrate, and ammonium to complete the compositional measurements on the filter. Alternatively, simultaneous sampling of multiple filters, including a Teflon filter, as done for the IMPROVE and the Chemical Speciation Network (Solomon et al., 2014), provides high-quality speciation data. This integrated approach ensures that the chemical analysis corresponds to the air sample from which water uptake data are obtained. Furthermore, using modeled estimates of inorganic water uptake, the measured water uptake can be apportioned between organic and inorganic components.
Data are available at https://doi.org/10.5061/dryad.dfn2z35c7 (Raparthi et al., 2025).
The supplement related to this article is available online at: https://doi.org/10.5194/amt-18-603-2025-supplement.
ASW and AMD conceived the project. NR developed the water uptake methodology, performed the laboratory work and data analysis, created the figures and tables, and wrote and edited the paper. ASW and AMD provided leadership for the project, including mentoring and supervising NR in the laboratory work, methodology development, and data analysis, and reviewed and edited the paper.
The contact author has declared that none of the authors has any competing interests.
Publisher’s note: Copernicus Publications remains neutral with regard to jurisdictional claims made in the text, published maps, institutional affiliations, or any other geographical representation in this paper. While Copernicus Publications makes every effort to include appropriate place names, the final responsibility lies with the authors.
We would like to thank the Department of Energy (DOE), USA, for funding this project (grant no. DE-SC0023087). We also acknowledge the support of undergraduate students Lucas Wang and Alexander Velasco in the laboratory measurements.
This research has been supported by the US Department of Energy (grant no. DE-SC0023087).
This paper was edited by Charles Brock and reviewed by Han Huynh and one anonymous referee.
Anunciado, M. B., De Boskey, M., Haines, L., Lindskog, K., Dombek, T., Takahama, S., and Dillner, A. M.: Stability assessment of organic sulfur and organosulfate compounds in filter samples for quantification by Fourier-transform infrared spectroscopy, Atmos. Meas. Tech., 16, 3515–3529, https://doi.org/10.5194/amt-16-3515-2023, 2023.
Boreddy, S. K. R., Kawamura, K., and Jung, J.: Hygroscopic properties of particles nebulized from water extracts of aerosols collected at Chichijima Island in the western North Pacific: An outflow region of Asian dust, J. Geophys. Res.-Atmos., 119, 167–178, https://doi.org/10.1002/2013JD020626, 2014.
Boris, A. J., Takahama, S., Weakley, A. T., Debus, B. M., Fredrickson, C. D., Esparza-Sanchez, M., Burki, C., Reggente, M., Shaw, S. L., Edgerton, E. S., and Dillner, A. M.: Quantifying organic matter and functional groups in particulate matter filter samples from the southeastern United States – Part 1: Methods, Atmos. Meas. Tech., 12, 5391–5415, https://doi.org/10.5194/amt-12-5391-2019, 2019.
Bouzidi, H., Zuend, A., Ondráček, J., Schwarz, J., and Ždímal, V.: Hygroscopic behavior of inorganic–organic aerosol systems including ammonium sulfate, dicarboxylic acids, and oligomer, Atmos. Environ., 229, 117481, https://doi.org/10.1016/j.atmosenv.2020.117481, 2020.
Chan, C. K., Flagan, R. C., and Seinfeld, J. H.: Water activities of solutions, Atmos. Environ. A-Gen., 26, 1661–1673, https://doi.org/10.1016/0960-1686(92)90065-S, 1992.
Chan, C. K., Ha, Z., and Choi, M. Y.: Study of water activities of aerosols of mixtures of sodium and magnesium salts, Atmos. Environ., 34, 4795–4803, https://doi.org/10.1016/S1352-2310(00)00252-1, 2000.
Cheng, M. and Kuwata, M.: Development of the low-temperature hygroscopicity tandem differential mobility analyzer (Low-T HTDMA) and its application to (NH4)2SO4 and NaCl particles, J. Aerosol Sci., 168, 106111, https://doi.org/10.1016/j.jaerosci.2022.106111, 2023.
Cheng, Y., Su, H., Koop, T., Mikhailov, E., and Pöschl, U.: Size dependence of phase transitions in aerosol nanoparticles, Nat. Commun., 6, 5923, https://doi.org/10.1038/ncomms6923, 2015.
Choi, M. Y. and Chan, C. K.: The Effects of Organic Species on the Hygroscopic Behaviors of Inorganic Aerosols, Environ. Sci. Technol., 36, 2422–2428, https://doi.org/10.1021/es0113293, 2002.
Clegg, S. L., Brimblecombe, P., and Wexler, A. S.: Thermodynamic Model of the System at Tropospheric Temperatures, J. Phys. Chem. A, 102, 2137–2154, https://doi.org/10.1021/jp973042r, 1998.
Cohen, M. D., Flagan, R. C., and Seinfeld, J. H.: Studies of concentrated electrolyte solutions using the electrodynamic balance. 1. Water activities for single-electrolyte solutions, J. Phys. Chem., 91, 4563–4574, https://doi.org/10.1021/j100301a029, 1987.
Cruz, C. N. and Pandis, S. N.: Deliquescence and Hygroscopic Growth of Mixed Inorganic-Organic Atmospheric Aerosol, Environ. Sci. Technol., 34, 4313–4319, https://doi.org/10.1021/es9907109, 2000.
Debus, B., Weakley, A. T., Takahama, S., George, K. M., Amiri-Farahani, A., Schichtel, B., Copeland, S., Wexler, A. S., and Dillner, A. M.: Quantification of major particulate matter species from a single filter type using infrared spectroscopy – application to a large-scale monitoring network, Atmos. Meas. Tech., 15, 2685–2702, https://doi.org/10.5194/amt-15-2685-2022, 2022.
Denjean, C., Formenti, P., Picquet-Varrault, B., Katrib, Y., Pangui, E., Zapf, P., and Doussin, J. F.: A new experimental approach to study the hygroscopic and optical properties of aerosols: application to ammonium sulfate particles, Atmos. Meas. Tech., 7, 183–197, https://doi.org/10.5194/amt-7-183-2014, 2014.
Fredenslund, A., Jones, R. L., and Prausnitz, J. M.: Group-contribution estimation of activity coefficients in nonideal liquid mixtures, AIChE J., 21, 1086–1099, https://doi.org/10.1002/aic.690210607, 1975.
Gorham, K. A., Raffuse, S. M., Hyslop, N. P., and White, W. H.: Comparison of recent speciated PM2.5 data from collocated CSN and IMPROVE measurements, Atmos. Environ., 244, 117977, https://doi.org/10.1016/j.atmosenv.2020.117977, 2021.
Gu, W., Li, Y., Zhu, J., Jia, X., Lin, Q., Zhang, G., Ding, X., Song, W., Bi, X., Wang, X., and Tang, M.: Investigation of water adsorption and hygroscopicity of atmospherically relevant particles using a commercial vapor sorption analyzer, Atmos. Meas. Tech., 10, 3821–3832, https://doi.org/10.5194/amt-10-3821-2017, 2017.
Gupta, T., Rajeev, P., and Rajput, R.: Emerging Major Role of Organic Aerosols in Explaining the Occurrence, Frequency, and Magnitude of Haze and Fog Episodes during Wintertime in the Indo Gangetic Plain, ACS Omega, 7, 1575–1584, https://doi.org/10.1021/acsomega.1c05467, 2022.
Hämeri, K., Charlson, R., and Hansson, H.: Hygroscopic properties of mixed ammonium sulfate and carboxylic acids particles, AIChE J., 48, 1309–1316, https://doi.org/10.1002/aic.690480617, 2002.
Han, S., Hong, J., Luo, Q., Xu, H., Tan, H., Wang, Q., Tao, J., Zhou, Y., Peng, L., He, Y., Shi, J., Ma, N., Cheng, Y., and Su, H.: Hygroscopicity of organic compounds as a function of organic functionality, water solubility, molecular weight, and oxidation level, Atmos. Chem. Phys., 22, 3985–4004, https://doi.org/10.5194/acp-22-3985-2022, 2022.
Haseeb, M., Tahir, Z., Mahmood, S. A., Batool, S., Tariq, A., Lu, L., and Soufan, W.: Spatio-temporal assessment of aerosol and cloud properties using MODIS satellite data and a HYSPLIT model: Implications for climate and agricultural systems, Atmospheric Environment: X, 21, 100242, https://doi.org/10.1016/j.aeaoa.2024.100242, 2024.
Hitzenberger, R., Berner, A., Dusek, U., and Alabashi, R.: Humidity-Dependent Growth of Size-Segregated Aerosol Samples, Aerosol Sci. Tech., 27, 116–130, https://doi.org/10.1080/02786829708965461, 1997.
Hu, D., Qiao, L., Chen, J., Ye, X., Yang, X., Cheng, T., and Fang, W.: Hygroscopicity of Inorganic Aerosols: Size and Relative Humidity Effects on the Growth Factor, Aerosol Air Qual. Res., 10, 255–264, https://doi.org/10.4209/aaqr.2009.12.0076, 2010.
Hyslop, N. P., Trzepla, K., and White, W. H.: Assessing the Suitability of Historical PM2.5 Element Measurements for Trend Analysis, Environ. Sci. Technol., 49, 9247–9255, https://doi.org/10.1021/acs.est.5b01572, 2015.
Jathar, S. H., Mahmud, A., Barsanti, K. C., Asher, W. E., Pankow, J. F., and Kleeman, M. J.: Water uptake by organic aerosol and its influence on gas/particle partitioning of secondary organic aerosol in the United States, Atmos. Environ., 129, 142–154, https://doi.org/10.1016/j.atmosenv.2016.01.001, 2016.
Jose, C., Singh, A., Kalkura, K. N., Jose, G. V., Srivastava, S., Ammini, R. K., Yadav, S., Ravikrishna, R., Andreae, M. O., Martin, S. T., Liu, P., and Gunthe, S. S.: Complex Hygroscopic Behavior of Ambient Aerosol Particles Revealed by a Piezoelectric Technique, ACS Earth Space Chem., 8, 983–991, https://doi.org/10.1021/acsearthspacechem.3c00347, 2024.
Kaur Kohli, R., Davis, R. D., and Davies, J. F.: Tutorial: Electrodynamic balance methods for single particle levitation and the physicochemical analysis of aerosol, J. Aerosol Sci., 174, 106255, https://doi.org/10.1016/j.jaerosci.2023.106255, 2023.
Kim, Y. P. and Seinfeld, J. H.: Atmospheric Gas–Aerosol Equilibrium: III. Thermodynamics of Crustal Elements Ca2+, K+, and Mg2+, Aerosol Sci. Tech., 22, 93–110, https://doi.org/10.1080/02786829408959730, 1995.
Kim, Y. P., Pun, B. K.-L., Chan, C. K., Flagan, R. C., and Seinfeld, J. H.: Determination of Water Activity in Ammonium Sulfate and Sulfuric Acid Mixtures Using Levitated Single Particles, Aerosol Sci. Tech., 20, 275–284, https://doi.org/10.1080/02786829408959683, 1994.
Koehler, K. A., Kreidenweis, S. M., DeMott, P. J., Prenni, A. J., Carrico, C. M., Ervens, B., and Feingold, G.: Water activity and activation diameters from hygroscopicity data - Part II: Application to organic species, Atmos. Chem. Phys., 6, 795–809, https://doi.org/10.5194/acp-6-795-2006, 2006.
Kreidenweis, S. M. and Asa-Awuku, A.: 5.13 – Aerosol Hygroscopicity: Particle Water Content and Its Role in Atmospheric Processes, in: Treatise on Geochemistry, 2nd edn., edited by: Turekian, K. K., Elsevier, Oxford, 331–361, https://doi.org/10.1016/B978-0-08-095975-7.00418-6, 2014.
Kreidenweis, S. M., Koehler, K., DeMott, P. J., Prenni, A. J., Carrico, C., and Ervens, B.: Water activity and activation diameters from hygroscopicity data - Part I: Theory and application to inorganic salts, Atmos. Chem. Phys., 5, 1357–1370, https://doi.org/10.5194/acp-5-1357-2005, 2005.
Krumgalz, B. S.: Temperature Dependence of Mineral Solubility in Water. Part 3. Alkaline and Alkaline Earth Sulfates, J. Phys. Chem. Ref. Data, 47, 023101, https://doi.org/10.1063/1.5031951, 2018.
Laskina, O., Morris, H. S., Grandquist, J. R., Qin, Z., Stone, E. A., Tivanski, A. V., and Grassian, V. H.: Size Matters in the Water Uptake and Hygroscopic Growth of Atmospherically Relevant Multicomponent Aerosol Particles, J. Phys. Chem. A, 119, 4489–4497, https://doi.org/10.1021/jp510268p, 2015.
Lee, A. K. Y., Ling, T. Y., and Chan, C. K.: Understanding hygroscopic growth and phase transformation of aerosols using single particle Raman spectroscopy in an electrodynamic balance, Faraday Discuss., 137, 245–263, https://doi.org/10.1039/B704580H, 2008.
Lee, J. Y. and Hildemann, L. M.: Comparisons between Hygroscopic Measurements and UNIFAC Model Predictions for Dicarboxylic Organic Aerosol Mixtures, Adv. Meteorol., 2013, 1–9, https://doi.org/10.1155/2013/897170, 2013.
Lei, T., Su, H., Ma, N., Pöschl, U., Wiedensohler, A., and Cheng, Y.: Size-dependent hygroscopicity of levoglucosan and D-glucose aerosol nanoparticles, Atmos. Chem. Phys., 23, 4763–4774, https://doi.org/10.5194/acp-23-4763-2023, 2023.
Li, E. Y., Yazdani, A., Dillner, A. M., Shen, G., Champion, W. M., Jetter, J. J., Preston, W. T., Russell, L. M., Hays, M. D., and Takahama, S.: Quantifying functional group compositions of household fuel-burning emissions, Atmos. Meas. Tech., 17, 2401–2413, https://doi.org/10.5194/amt-17-2401-2024, 2024.
Li, J., Carlson, B. E., Yung, Y. L., Lv, D., Hansen, J., Penner, J. E., Liao, H., Ramaswamy, V., Kahn, R. A., Zhang, P., Dubovik, O., Ding, A., Lacis, A. A., Zhang, L., and Dong, Y.: Scattering and absorbing aerosols in the climate system, Nat. Rev. Earth Environ., 3, 363–379, https://doi.org/10.1038/s43017-022-00296-7, 2022.
Lide, D. R.: CRC Handbook of Chemistry and Physics, CRC Press, Vol. 85, 2004.
Liu, Q., Jing, B., Peng, C., Tong, S., Wang, W., and Ge, M.: Hygroscopicity of internally mixed multi-component aerosol particles of atmospheric relevance, Atmos. Environ., 125, 69–77, https://doi.org/10.1016/j.atmosenv.2015.11.003, 2016.
Luo, Q., Hong, J., Xu, H., Han, S., Tan, H., Wang, Q., Tao, J., Ma, N., Cheng, Y., and Su, H.: Hygroscopicity of amino acids and their effect on the water uptake of ammonium sulfate in the mixed aerosol particles, Sci. Total Environ., 734, 139318, https://doi.org/10.1016/j.scitotenv.2020.139318, 2020.
Ma, Q., Liu, Y., and He, H.: The Utilization of Physisorption Analyzer for Studying the Hygroscopic Properties of Atmospheric Relevant Particles, J. Phys. Chem. A, 114, 4232–4237, https://doi.org/10.1021/jp909340v, 2010.
Maffia, M. C. and Meirelles, A. J. A.: Water Activity and pH in Aqueous Polycarboxylic Acid Systems, J. Chem. Eng. Data, 46, 582–587, https://doi.org/10.1021/je0002890, 2001.
Marsh, A., Rovelli, G., Miles, R. E. H., and Reid, J. P.: Complexity of Measuring and Representing the Hygroscopicity of Mixed Component Aerosol, J. Phys. Chem. A, 123, 1648–1660, https://doi.org/10.1021/acs.jpca.8b11623, 2019.
McInnes, L. M., Quinn, P. K., Covert, D. S., and Anderson, T. L.: Gravimetric analysis, ionic composition, and associated water mass of the marine aerosol, Atmos. Environ., 30, 869–884, https://doi.org/10.1016/1352-2310(95)00354-1, 1996.
Mikhailov, E. F. and Vlasenko, S. S.: High-humidity tandem differential mobility analyzer for accurate determination of aerosol hygroscopic growth, microstructure, and activity coefficients over a wide range of relative humidity, Atmos. Meas. Tech., 13, 2035–2056, https://doi.org/10.5194/amt-13-2035-2020, 2020.
Mikhailov, E. F., Merkulov, V. V., Vlasenko, S. S., Ryshkevich, T. I., and Pöschl, U. J.: Filter-based differential hygroscopicity analyzer of aerosol particles, Izv. Atmos. Ocean. Phy.+, 47, 747–759, https://doi.org/10.1134/S0001433811060107, 2011.
Mikhailov, E. F., Pöhlker, M. L., Reinmuth-Selzle, K., Vlasenko, S. S., Krüger, O. O., Fröhlich-Nowoisky, J., Pöhlker, C., Ivanova, O. A., Kiselev, A. A., Kremper, L. A., and Pöschl, U.: Water uptake of subpollen aerosol particles: hygroscopic growth, cloud condensation nuclei activation, and liquid–liquid phase separation, Atmos. Chem. Phys., 21, 6999–7022, https://doi.org/10.5194/acp-21-6999-2021, 2021.
Mikhailov, E. F., Vlasenko, S. S., and Kiselev, A. A.: Water activity and surface tension of aqueous ammonium sulfate and D-glucose aerosol nanoparticles, Atmos. Chem. Phys., 24, 2971–2984, https://doi.org/10.5194/acp-24-2971-2024, 2024.
Mochida, M. and Kawamura, K.: Hygroscopic properties of levoglucosan and related organic compounds characteristic to biomass burning aerosol particles, J. Geophys. Res.-Atmos., 109, D21202, https://doi.org/10.1029/2004JD004962, 2004.
Nadler, K. A., Kim, P., Huang, D.-L., Xiong, W., and Continetti, R. E.: Water diffusion measurements of single charged aerosols using H2O/D2 O isotope exchange and Raman spectroscopy in an electrodynamic balance, Phys. Chem. Chem. Phys., 21, 15062–15071, https://doi.org/10.1039/C8CP07052K, 2019.
Nenes, A., Pandis, S. N., and Pilinis, C.: ISORROPIA: A New Thermodynamic Equilibrium Model for Multiphase Multicomponent Inorganic Aerosols, Aquatic Geochemicals, 4, 123–152, 1998.
Padró, L. T., Moore, R. H., Zhang, X., Rastogi, N., Weber, R. J., and Nenes, A.: Mixing state and compositional effects on CCN activity and droplet growth kinetics of size-resolved CCN in an urban environment, Atmos. Chem. Phys., 12, 10239–10255, https://doi.org/10.5194/acp-12-10239-2012, 2012.
Peng, C., Jing, B., Guo, Y.-C., Zhang, Y.-H., and Ge, M.-F.: Hygroscopic Behavior of Multicomponent Aerosols Involving NaCl and Dicarboxylic Acids, J. Phys. Chem. A, 120, 1029–1038, https://doi.org/10.1021/acs.jpca.5b09373, 2016.
Peng, C., Chow, A. H. L., and Chan, C. K.: Hygroscopic Study of Glucose, Citric Acid, and Sorbitol Using an Electrodynamic Balance: Comparison with UNIFAC Predictions, Aerosol Sci. Tech., 35, 753–758, https://doi.org/10.1080/02786820152546798, 2001.
Peng, C., Chen, L., and Tang, M.: A database for deliquescence and efflorescence relative humidities of compounds with atmospheric relevance, Fundamental Research, 2, 578–587, https://doi.org/10.1016/j.fmre.2021.11.021, 2022.
Pope, F. D., Dennis-Smither, B. J., Griffiths, P. T., Clegg, S. L., and Cox, R. A.: Studies of Single Aerosol Particles Containing Malonic Acid, Glutaric Acid, and Their Mixtures with Sodium Chloride. I. Hygroscopic Growth, J. Phys. Chem. A, 114, 5335–5341, https://doi.org/10.1021/jp100059k, 2010.
Prenni, A. J., DeMott, P. J., Kreidenweis, S. M., Sherman, D. E., Russell, L. M., and Ming, Y.: The Effects of Low Molecular Weight Dicarboxylic Acids on Cloud Formation, J. Phys. Chem. A, 105, 11240–11248, https://doi.org/10.1021/jp012427d, 2001.
Qu, W., Zhang, X., Wang, Y., and Fu, G.: Atmospheric visibility variation over global land surface during 1973–2012: Influence of meteorological factors and effect of aerosol, cloud on ABL evolution, Atmos. Pollut. Res., 11, 730–743, https://doi.org/10.1016/j.apr.2020.01.002, 2020.
Raparthi, N., Wexler, A., and Dillner, A.: Methodology Development for Assessing Hygroscopicity of Particles Collected on PTFE Filters, Dryad [data set], https://doi.org/10.5061/dryad.dfn2z35c7, 2025.
Reich, O., Gleichweit, M. J., David, G., Leemann, N., and Signorell, R.: Hygroscopic growth of single atmospheric sea salt aerosol particles from mass measurement in an optical trap, Environmental Science: Atmospheres, 3, 695–707, https://doi.org/10.1039/D2EA00129B, 2023.
Ruthenburg, T. C., Perlin, P. C., Liu, V., McDade, C. E., and Dillner, A. M.: Determination of organic matter and organic matter to organic carbon ratios by infrared spectroscopy with application to selected sites in the IMPROVE network, Atmos. Environ., 86, 47–57, https://doi.org/10.1016/j.atmosenv.2013.12.034, 2014.
Saxena, P., Hildemann, L. M., McMurry, P. H., and Seinfeld, J. H.: Organics alter hygroscopic behavior of atmospheric particles, J. Geophys. Res., 100, 18755–18770, 1995.
Shearman, R. W. and Menzies, A. W. C.: The Solubilities of Potassium Chloride in Deuterium Water and in Ordinary Water from 0 to 180°, J. Am. Chem. Soc., 59, 185–186, 1937.
Shingler, T., Crosbie, E., Ortega, A., Shiraiwa, M., Zuend, A., Beyersdorf, A., Ziemba, L., Anderson, B., Thornhill, L., Perring, A. E., Schwarz, J. P., Campazano-Jost, P., Day, D. A., Jimenez, J. L., Hair, J. W., Mikoviny, T., Wisthaler, A., and Sorooshian, A.: Airborne characterization of subsaturated aerosol hygroscopicity and dry refractive index from the surface to 6.5 km during the SEAC4RS campaign, J. Geophys. Res.-Atmos., 121, 4188–4210, https://doi.org/10.1002/2015JD024498, 2016.
Sjogren, S., Gysel, M., Weingartner, E., Baltensperger, U., Cubison, M. J., Coe, H., Zardini, A. A., Marcolli, C., Krieger, U. K., and Peter, T.: Hygroscopic growth and water uptake kinetics of two-phase aerosol particles consisting of ammonium sulfate, adipic and humic acid mixtures, J. Aerosol Sci., 38, 157–171, https://doi.org/10.1016/j.jaerosci.2006.11.005, 2007.
Solomon, P. A., Crumpler, D., Flanagan, J. B., Jayanty, R. K. M., Rickman, E. E., and McDade, C. E.: U.S. National PM2.5 Chemical Speciation Monitoring Networks–CSN and IMPROVE: Description of networks, J. Air Waste Manage., 64, 1410–1438, https://doi.org/10.1080/10962247.2014.956904, 2014.
Sorooshian, A., Hersey, S., Brechtel, F. J., Corless, A., Flagan, R. C., and Seinfeld, J. H.: Rapid, Size-Resolved Aerosol Hygroscopic Growth Measurements: Differential Aerosol Sizing and Hygroscopicity Spectrometer Probe (DASH-SP), Aerosol Sci. Tech., 42, 445–464, https://doi.org/10.1080/02786820802178506, 2008.
Steimer, S. S., Krieger, U. K., Te, Y.-F., Lienhard, D. M., Huisman, A. J., Luo, B. P., Ammann, M., and Peter, T.: Electrodynamic balance measurements of thermodynamic, kinetic, and optical aerosol properties inaccessible to bulk methods, Atmos. Meas. Tech., 8, 2397–2408, https://doi.org/10.5194/amt-8-2397-2015, 2015.
Tang, I. N. and Munkelwitz, H. R.: Simultaneous Determination of Refractive Index and Density of an Evaporating Aqueous Solution Droplet, Aerosol Sci. Tech., 15, 201–207, https://doi.org/10.1080/02786829108959527, 1991.
Tang, M., Chan, C. K., Li, Y. J., Su, H., Ma, Q., Wu, Z., Zhang, G., Wang, Z., Ge, M., Hu, M., He, H., and Wang, X.: A review of experimental techniques for aerosol hygroscopicity studies, Atmos. Chem. Phys., 19, 12631–12686, https://doi.org/10.5194/acp-19-12631-2019, 2019.
Topping, D., Barley, M., Bane, M. K., Higham, N., Aumont, B., Dingle, N., and McFiggans, G.: UManSysProp v1.0: an online and open-source facility for molecular property prediction and atmospheric aerosol calculations, Geosci. Model Dev., 9, 899–914, https://doi.org/10.5194/gmd-9-899-2016, 2016.
Wang, J., Cubison, M. J., Aiken, A. C., Jimenez, J. L., and Collins, D. R.: The importance of aerosol mixing state and size-resolved composition on CCN concentration and the variation of the importance with atmospheric aging of aerosols, Atmos. Chem. Phys., 10, 7267–7283, https://doi.org/10.5194/acp-10-7267-2010, 2010.
Wang, K., Huang, R.-J., Brüggemann, M., Zhang, Y., Yang, L., Ni, H., Guo, J., Wang, M., Han, J., Bilde, M., Glasius, M., and Hoffmann, T.: Urban organic aerosol composition in eastern China differs from north to south: molecular insight from a liquid chromatography–mass spectrometry (Orbitrap) study, Atmos. Chem. Phys., 21, 9089–9104, https://doi.org/10.5194/acp-21-9089-2021, 2021.
Wang, X., Shi, Q., Zhao, Y., Wang, X., and Zheng, Y.: Moisture adsorption isotherms and heat of sorption of agaricus bisporus, J. Food Process. Pres., 37, 299–305, https://doi.org/10.1111/j.1745-4549.2011.00649.x, 2013.
White, W. H., Trzepla, K., Hyslop, N. P., and Schichtel, B. A.: A critical review of filter transmittance measurements for aerosol light absorption, and de novo calibration for a decade of monitoring on PTFE membranes, Aerosol Sci. Tech., 50, 984–1002, https://doi.org/10.1080/02786826.2016.1211615, 2016.
Wexler, A. and Hasegawa, S.: Relative Humidity-Temperature Relationships of Some Saturated Salt Solutions in the Temperature Range 0 ° to 50°C, J. Res. Nat. Bur. Stand., 53, 19–26, https://doi.org/10.6028/jres.053.003, 1954.
Wexler, A. S. and Seinfeld, J. H.: Second-generation inorganic aerosol model, Atmos. Environ. A-Gen., 25, 2731–2748, https://doi.org/10.1016/0960-1686(91)90203-J, 1991.
Yazdani, A., Dillner, A. M., and Takahama, S.: Estimating mean molecular weight, carbon number, and OM∕OC with mid-infrared spectroscopy in organic particulate matter samples from a monitoring network, Atmos. Meas. Tech., 14, 4805–4827, https://doi.org/10.5194/amt-14-4805-2021, 2021.
Zamora, I. R. and Jacobson, M. Z.: Measuring and modeling the hygroscopic growth of two humic substances in mixed aerosol particles of atmospheric relevance, Atmos. Chem. Phys., 13, 8973–8989, https://doi.org/10.5194/acp-13-8973-2013, 2013.
Zamora, I. R., Tabazadeh, A., Golden, D. M., and Jacobson, M. Z.: Hygroscopic growth of common organic aerosol solutes, including humic substances, as derived from water activity measurements, J. Geophys. Res.-Atmos., 116, D23207, https://doi.org/10.1029/2011JD016067, 2011.
Zieger, P., Väisänen, O., Corbin, J. C., Partridge, D. G., Bastelberger, S., Mousavi-Fard, M., Rosati, B., Gysel, M., Krieger, U. K., Leck, C., Nenes, A., Riipinen, I., Virtanen, A., and Salter, M. E.: Revising the hygroscopicity of inorganic sea salt particles, Nat. Commun., 8, 15883, https://doi.org/10.1038/ncomms15883, 2017.
Zuend, A., Marcolli, C., Peter, T., and Seinfeld, J. H.: Computation of liquid-liquid equilibria and phase stabilities: implications for RH-dependent gas/particle partitioning of organic-inorganic aerosols, Atmos. Chem. Phys., 10, 7795–7820, https://doi.org/10.5194/acp-10-7795-2010, 2010.