the Creative Commons Attribution 4.0 License.
the Creative Commons Attribution 4.0 License.
 | 03 Feb 2025
Quantitative error analysis of polarimetric phased-array radar weather measurements to reveal radar performance and configuration potential
Zhe Li
Guifu Zhang
The initial weather measurements from two polarimetric phased-array radars (PPARs) with cylindrical and planar configurations, both developed by the Advanced Radar Research Center (ARRC) at the University of Oklahoma (OU), were compared with those from the dish antenna systems, the operational KTLX Weather Surveillance Radar 1988 Doppler (WSR-88D) located in Oklahoma City, Oklahoma (∼ 23 km northeast of OU). Both the cylindrical PPAR (CPPAR) and the planar PPAR (PPPAR) Horus are S-band two-dimensional (2D) electronic scan PPARs. This comparison investigates the error statistics of the polarimetric measurements in one-dimensional (1D) electronic scans from each radar during two convective rain events. The first event occurred on 30 August 2019, when the CPPAR performed a 3.3° elevation plan-position indicator (PPI) scan at 25 azimuth angles. The second event took place on 4 October 2023, when Horus conducted range–height indicator (RHI) scans at 64 elevations. For both events, KTLX provided volumetric polarimetric radar data and served as the reference. To ensure temporal and spatial alignment between the radars, reconstructed RHI scans and PPI sectors from KTLX were matched to the corresponding Horus rays and CPPAR domain, respectively. The standard deviations and mean biases of the PPAR weather measurements were calculated and analyzed. The standard deviations of the two PPARs were similar and met the Radar Functional Requirements (RFR) set by the National Oceanic and Atmospheric Administration National Weather Service. However, as noted in previous studies, the standard deviation and biases of polarimetric variables from Horus exhibited varying error characteristics depending on the electronic steering angle from broadside. The present results suggest that PPPARs may have difficulties in producing high-quality polarimetric data at large steering angles, and further investigation on CPPARs is required to find the optimal design for future weather applications.
- Article
(13354 KB) - Full-text XML
- BibTeX
- EndNote


Phased-array radars (PARs) are an emerging technology in the meteorological community. They offer the advantage of providing rapid and timely information that greatly enhances the understanding of severe weather phenomena as they unfold (Kuster et al., 2016; Wilson et al., 2017). PARs are also versatile and can effectively serve multiple purposes (Weber et al., 2007; Zrnic et al., 2007; Zhang and Doviak, 2007; Heinselman et al., 2008; Stailey and Hondl, 2016; Kollias et al., 2022). Many countries are actively involved in the development of PAR systems to replace or complement existing parabolic dish antenna operational radars (e.g., Wu et al., 2018; Kikuchi et al., 2020; Kollias et al., 2022; Palmer et al., 2022). Among PAR designs, the most common are 1D planar PARs, which have been investigated in the X-band polarimetric PAR (PPAR) in Japan (Kikuchi et al., 2020; Ushio et al., 2022), China (Wu et al., 2018; Yu et al., 2020), and the United States of America (USA; Wurman and Randall, 2001; Bluestein et al., 2010; Orzel and Frasier, 2018). The 1D planar PPARs (PPPARs) – those with electronic scanning in elevation and mechanical steering in azimuth – can provide high-quality polarimetric data and represent a compromise between a costly but fully electronic multi-face PPAR system and a less costly but slower traditional rotating dish system. Preliminary error analysis and meteorological applications to improve weather forecasting using these 1D PPPARs have been performed (e.g., Orzel and Frasier, 2018; Kim et al., 2021; Baron et al., 2023).
In recent years, the most flexible and useful design of 2D PPARs for meteorological applications has remained a subject of ongoing discussion since the formulation presented in Zhang et al. (2009). This is primarily due to the complexity and difficulty of providing high-quality polarimetric measurements when the beam steers off the broadside. Two main design approaches – the cylindrical design (Fulton et al., 2017; Golbon-Haghighi et al., 2021; Zhang, 2022; Zhang et al., 2011) and planar configurations (Heberling and Frasier, 2021; Palmer et al., 2022, 2023) – have garnered the most attention for 2D electronic scanning, each with its own advantages and disadvantages.
An S-band fully digital PPPAR named Horus (Fig. 1a) was developed by the Advanced Radar Research Center (ARRC) at the University of Oklahoma (OU) with funding from the National Severe Storms Laboratory (NSSL) and the Office of Naval Research (ONR) (Palmer et al., 2023). The fully digital design, with element-level analog-to-digital converters (ADCs), can provide advantageous characteristics in multi-functionality, including high flexibility in spatio-temporal resolution and sampling; beam agility; interference mitigation; and, in theory, software configurability. However, as a 2D PPPAR, Horus faces major challenges in calibrating polarimetric variables to meet weather observation requirements (Zhang et al., 2009, 2011; Lei et al., 2013, 2015; Palmer et al., 2023). Fundamental issues affecting data quality include geometrically induced copolar biases, cross-polarization coupling, and sensitivity loss as well as performance degradation as the beam steers off broadside (Zhang et al., 2009, 2011; Zhang, 2016; Zrnic et al., 2011). PPPARs utilize hundreds of beams with different characteristics, which necessitates beam-steering-dependent calibration (Ivić et al., 2019; Weber et al., 2021). The most critical issue is the sensitivity loss and performance degradation when steering at wide angles off broadside, while the bias can be corrected, addressing the sensitivity loss is difficult and may require increased antenna size and higher transmit power to meet the sensitivity requirements at large off-broadside angles (Zhang et al., 2011). Also, the polarization purity loss is difficult to compensate for or calibrate effectively (e.g., Zhang et al., 2009; Dorsey et al., 2022; Fulton et al., 2022), despite the existence of proposed calibration methods (e.g., Ivić, 2023) aimed at mitigating cross-polar biases. High-quality polarimetric weather measurements have not been achieved with error quantification yet when a PPPAR steers at wide angles.
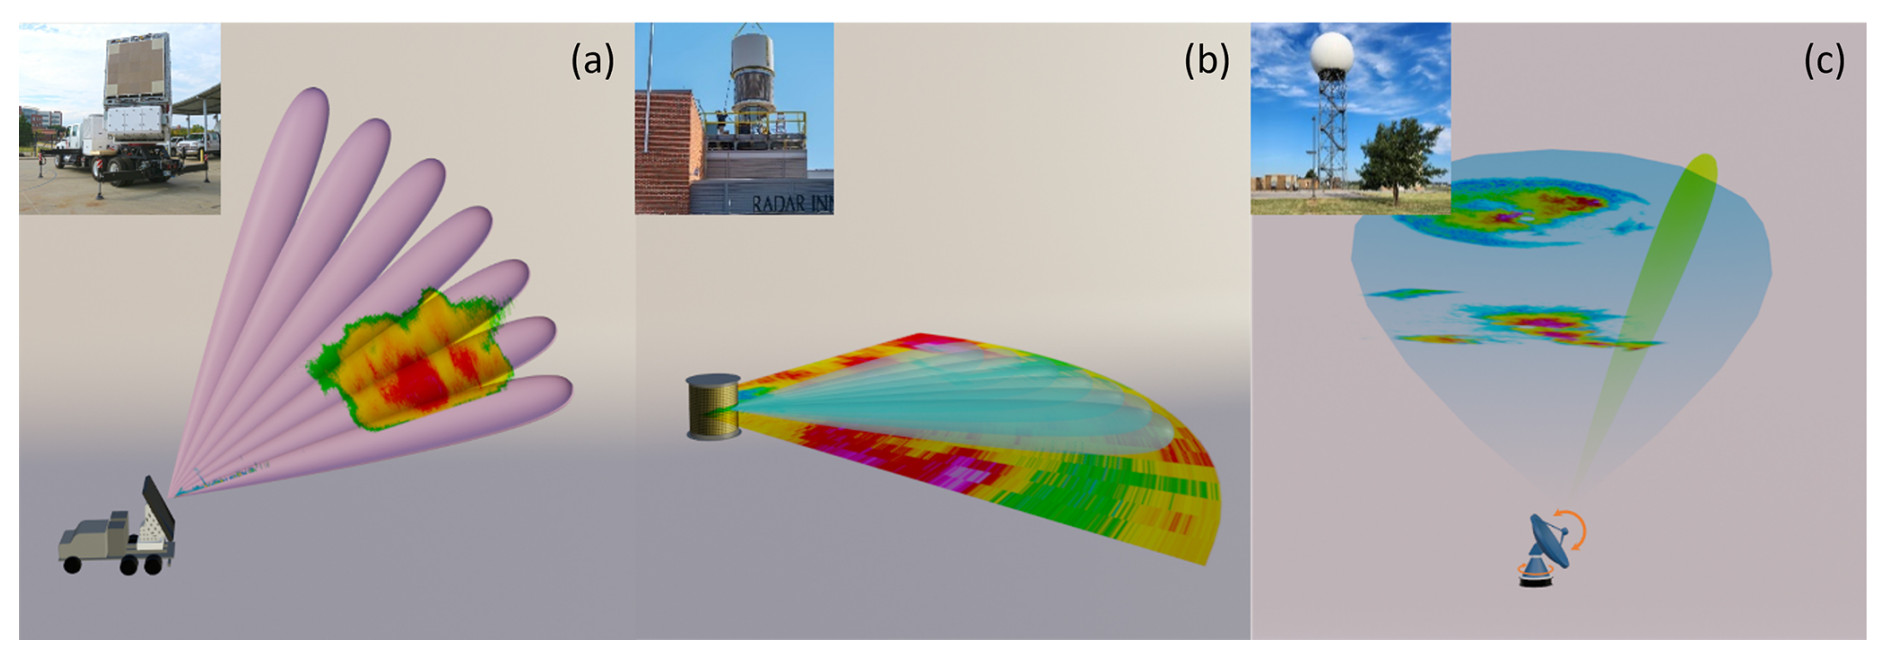
Figure 1Depictions of (a) Horus, (b) CPPAR, and (c) WSR-88D (KTLX) scanning strategies based on the current configuration for weather measurements. The Horus image is taken from Palmer et al. (2023).
Alternatively, the cylindrical PPAR (CPPAR) design has been proposed and demonstrated, and a prototype was developed by the ARRC (Fig. 1b) due to its advantageous properties of scan-invariant azimuthal beams and polarization orthogonality in all directions (Zhang et al., 2011; Karimkashi and Zhang, 2013, 2015; Fulton et al., 2017; Golbon-Haghighi et al., 2021). CPPARs provide more efficient radiating power and spectrum utilization without the need for face-to-face matching. These features make CPPARs capable of delivering effective and efficient polarimetric weather observations compared to the planar design (Zhang et al., 2011; Li et al., 2021a, b; Dorsey et al., 2022; Logan et al., 2022). Nevertheless, several challenges of the CPPAR have also been mentioned such as its relatively new design and development, the all-in-one system, whereas the PPPAR would operate four faces independently for different directions. The potential influence of creeping waves and interferences is also a challenge (NSSL Publications, 2014). These challenges have been studied and addressed through the design and development of high-performance radiating elements and optimized beamforming with active element patterns, in which the creeping wave effects have been taken into account (Golbon-Haghighi et al., 2021; Li et al., 2021b; Mirmozafari et al., 2019; Zhang, 2022).
As mentioned above, many of the properties and characteristics of the two 2D electronic scan (E-scan) PPAR systems have been explored based on the physical understanding of the electromagnetic (EM) theory, simulations, and experiments. In addition, the hardware requirements and specific calibration procedures for Horus and the CPPAR have been discussed in previous studies (e.g., Li et al., 2021b; Palmer et al., 2023). The primary objective of this study is to compare the error statistics of weather observations collected by the CPPAR and Horus. This comparison aims to assess the quality of the polarimetric data in their current states, investigate the potential issues, and clarify any misunderstandings about the two configurations. This study will incorporate findings from previous research conducted over the last 10 years on 2D PPAR development. It should be noted that the two radars are at different stages of development and with different levels of investment, and the weather observations are not from the same weather event. However, the comparison results presented in this study represent the first observation-based comparison of the two radar configurations. This result will be valuable in guiding the selection of the optimal configuration of PPARs for meteorological applications.
The current specifications of Horus (Fig. 1a) and the CPPAR (Fig. 1b), along with the reference measurement – KTLX, a nearby operational WSR-88D radar (Fig. 1c) – are presented in Sect. 2. Section 3 illustrates calculations of the standard deviations of the Horus and CPPAR observations and comparisons between the Horus and KTLX data, as well as between the CPPAR and KTLX data, with the mean bias and related statistics quantified. In Sect. 4, the off-broadside impact of planar design is explored and discussed. Section 5 discusses advantages and disadvantages of CPPAR and 2D PPPAR configurations as well as their potential. Finally, Sect. 6 summarizes the results and discusses possible development directions and improvements of the PPARs for weather measurements.
2.1 Horus and CPPAR experiment configuration
The Horus radar system has a planar design with 5 × 5 panels, each panel consisting of 8 × 8 dual-polarization antenna elements. Its full aperture size is 2.03 m × 2.03 m, and it operates at the S band at approximately 3.07 GHz (Table 1), as documented in Palmer et al. (2023). For this study, two sets of measurements are examined when the radar was configured with 13 out of 25 panels, with a transmit power of 8.32 kW and an antenna gain of approximately 31.5 dB. The half-power beamwidth is 3.3° in both azimuth and elevation. Currently, only range–height indicator (RHI) scans have been performed with 64 elevation angles at 1° intervals (Fig. 1a). A total of eight cases have been measured by Horus, with six cases occurring prior to August 2023 using 5 panels and two subsequent cases using 13 panels. The bandwidth was approximately 7.8 MHz, resulting in a range resolution of 19.2 m, with pulse compression. The progressive pulse compression technique (Salazar Aquino et al., 2021) was utilized to remove the blind range, which used to be about 4.8 km. The temporal resolution was approximately 4 s, with a pulse repetition time (PRT) of 1 ms and 64 samples per dwell. The scanning strategy consists of a mechanical inclination of 31.5°, with scans ranging from −31.5 to 31.5° in elevation (i.e., ∼ 0 to 63° ground-relative elevation angles) at 1° increments. While it is true that most weather radars scan up to ∼ 20° for weather applications, Horus in its current state only performs a 1D electronic scan along the elevation between −31.5 and 31.5°. This should reveal similar problems to those encountered when scanning in azimuth under similar weather conditions.
Table 1Specifications relevant to the sensitivity of each PAR configuration.
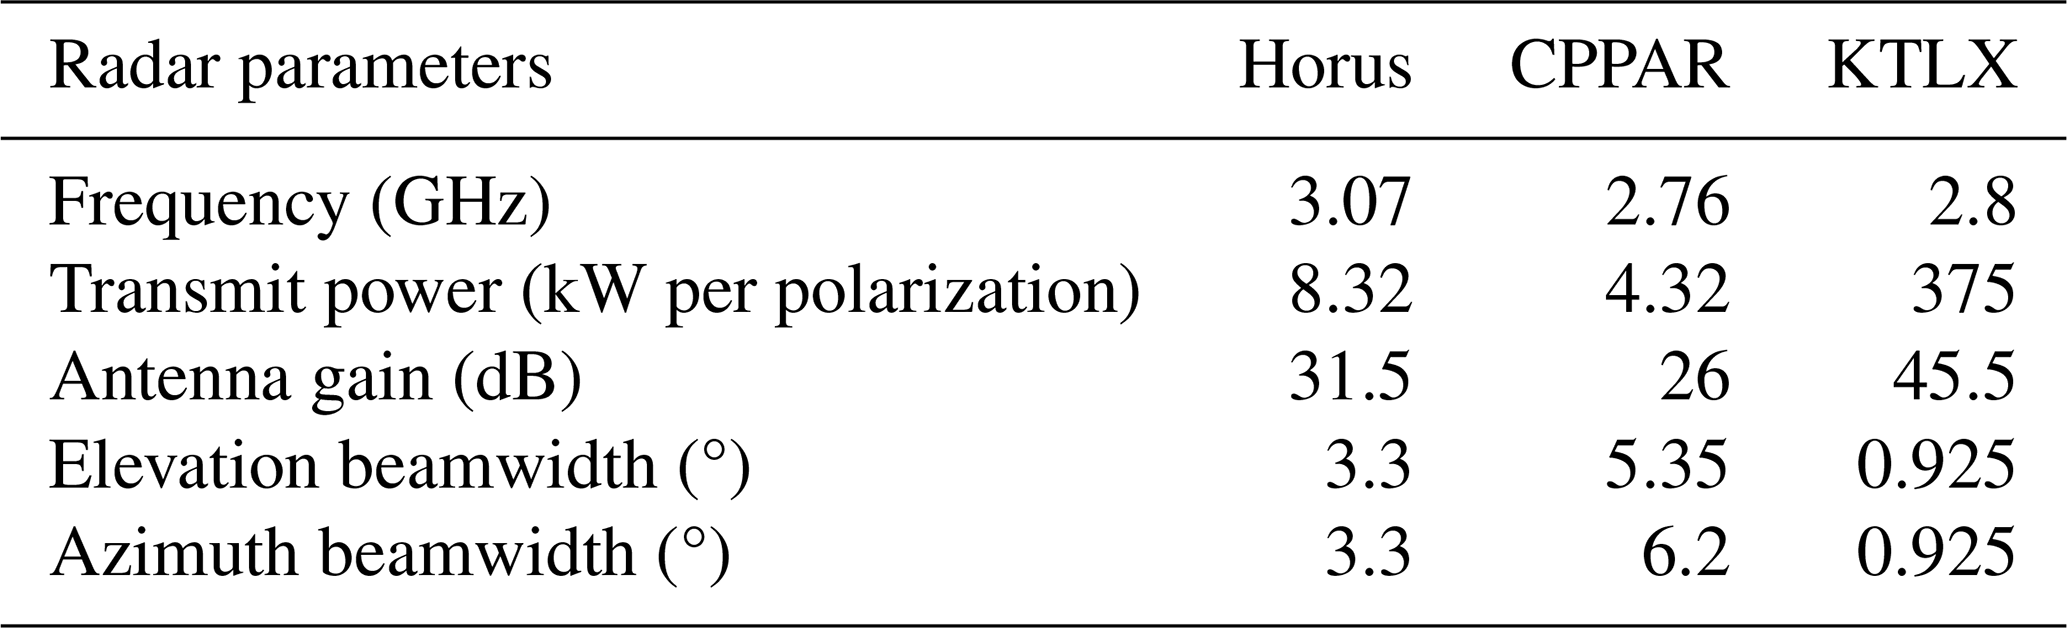
The 2 m prototype of the CPPAR, installed on the roof of the ARRC, also operates at the S band at a frequency of 2.76 GHz (Table 1). An illustration of the CPPAR is shown in Fig. 1b. The CPPAR allows a single beam for mechanical scans and 25 commutating beams for electronic scans, with a PRT of 1 ms for 64 pulses per dwell. The range sampling interval is approximately 30 m, with the first 170 gates representing a blind range of about 5.1 km. The CPPAR consists of a total of 96 subarrays/columns (although only half of them, 48 columns, are active due to the budget constraint), each with an azimuthal spacing of 3.75° consisting of 19-element linear arrays. Of these 48 columns, 24 columns are used to form an electronic beam, yielding a total of 25 beams for the electronic scan, and among them the central beam sector (no. 13–36 columns) is used for the mechanical scan in the study. The azimuthal beamwidth is approximately 6.2° after tapering, and the elevation beamwidth is 5.35° (Table 1). The transmit–receive antenna gain is 26 dB, and the peak transmit power is 4.32 kW (Fig. 1b). However, the development of the CPPAR has been halted in its current state, and only single-time-step plan-position indicator (PPI) scans have been performed. Further specifications of the CPPAR can be found in Li et al. (2021b).
The radar parameters of the two PPARs listed in Table 1 exhibit large differences in transmit power, beamwidth, and antenna gain compared to KTLX (Fig. 1c vs. Fig. 1a, b). The sensitivity difference derived from these parameters can be further discerned from the minimum detectable reflectivity plot (Fig. 2). The plot illustrates the calculated values from the lag-0 estimates of weather measurements (solid) from Horus (red), the CPPAR (blue), and KTLX (black), compared to those from their radar parameters (dashed), as a function of range. Note that the system calibration factor of each radar was slightly adjusted to better align the two lines. As expected from the parameters of the three radars, the two 2D PPARs have a much lower sensitivity of 25 dBZ for the CPPAR and 10 dBZ for Horus, compared to −10 dBZ for the operational KTLX at 45 km from the radar. Even between the two PPARs, the difference is considerable, with Horus ∼ 15 dB better than the CPPAR. However, these lower sensitivities of the two PPARs are not expected to introduce substantial biases in the error analysis. The errors are categorized by signal-to-noise ratio (SNR) levels, and their standard deviation (SD) depends on the spectrum width and the copolar correlation coefficient for the same dwell time.

Figure 2Plot of the minimum detectable reflectivity of Horus (red lines), the CPPAR (blue lines), and KTLX (black lines). The solid lines are estimated from the weather measurements and the dashed lines radar parameters.
2.2 Reference measurements
The three radar variables (ZH, ZDR, ρhv) from the operational KTLX radar located at Oklahoma City (34.33° N, 97.21° W) were used as a reference to calculate the mean biases and standard deviation of the differences between the radar measurements. Figure 3 depicts the relative positions of Horus (panel a) and the CPPAR (panel b), represented by blue dots, respectively, in relation to KTLX (black dot), as well as the direction/sector of interest on the KTLX PPI for each case. The KTLX beams do not exactly coincide with the Horus RHI and the CPPAR PPI scans because the systems are not co-located and the beamwidths of the two radars are very different; therefore, other variables (vr, σv, ΦDP) were excluded from the comparison due to their radial dependency.
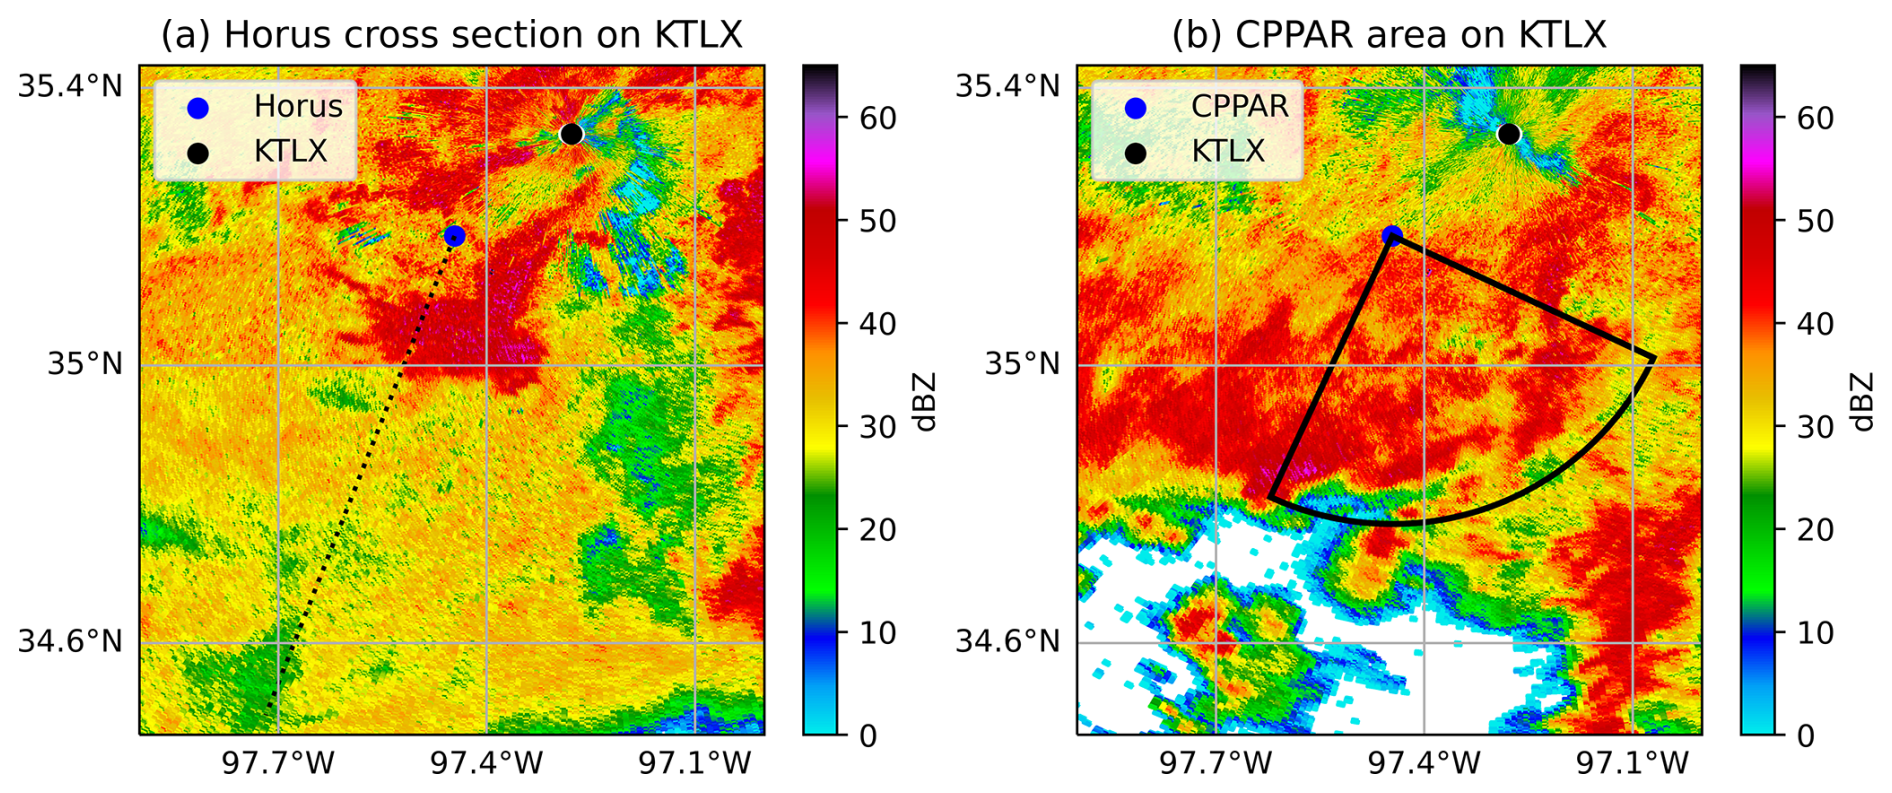
Figure 3Plot of the observed reflectivity (ZH) from KTLX for regions of the Horus (a) at 22:39 UTC on 4 October 2023 and the CPPAR (b) at 15:05 UTC on 30 August 2019. The blue dot denotes Horus and the CPPAR and the black dot KTLX. The dashed line represents the azimuth of the Horus RHI scan and the solid black lines the edges of the CPPAR PPI scan.
In order to minimize the influence in the difference in the positions of the radars, each elevation and time were carefully matched by selecting the Horus rays from the best-matching KTLX observation time for each elevation angle. The time can be well matched in the case of Horus and KTLX because Horus provides 4 s updates. In addition, three different types of interpolation grids were used to fit the KTLX-reconstructed RHI to the Horus observations: (1) both KTLX and Horus were interpolated to the same grid with grid spacings of 10 m horizontally and 125 m vertically, (2) KTLX data were interpolated to the Horus range and elevation angles, and (3) both Horus and KTLX were objectively analyzed to a common grid of 500 m horizontally and 125 m vertically, respectively. Note that nearest-neighbor interpolation was used for both the KTLX-reconstructed RHI and the gridded Horus data. Although not shown in subsequent figures, all interpolated grids showed similar results and had little effect on the error statistics. Therefore, the KTLX-reconstructed RHI data were converted to match the Horus RHI scans for easier error quantification in the subsequent analyses.
For the CPPAR, it is not possible to match the beams perfectly in elevation and time because only one PPI data point was collected for this case. The beam height of the 3.3° scan from the roof of the RIL building to approximately 45 km in range is about 2.8 km a.g.l.; the closest elevation from the KTLX data was used for the same spatial coverage of the CPPAR. Similar to the matching method with Horus, the KTLX data were extracted by interpolating the nearest points to the cross section between the CPPAR and the calculated location of 40 km in range for each azimuth angle. It should be noted that, even beyond the aforementioned matching in time and space, inherent mismatches persist between the interpolated RHIs or PPIs due to differences in radar resolution, beam width, and location.
2.3 Error statistics calculations
The standard deviation calculation for polarimetric radar measurements has traditionally been performed using spatial sampling, assuming a locally homogeneous precipitation field. This typically employs samples from a number of range gates, as demonstrated in an earlier CPPAR data analysis using N = 17 range gates (Li et al., 2021b) and shown in Eq. (1),
where n is the gate number at which the standard deviation is estimated; Xl is the polarimetric data at gate l; and Xl+m is the value at l+m gates, with m as the spatial step after employing spatial samples. Various values of m have been tested for spatial samples, with a slight increase in standard deviations as m increases. The value m = 2 has been selected to avoid potential overlap in range samples, Considering the small sample spacing, the local homogeneity should be a valid assumption. To maintain statistical significance, only gates with no missing data (i.e., all 15 samples from 17 range gates) were used to calculate the standard deviation.
In addition to spatial sampling, given the assumptions of ergodicity and local stationarity that apply to the Horus data due to its rapid updates every 4 s, it is possible to compute the standard deviation of the radar data from temporal samples. This approach involves examining the differences between successive time steps (i.e., m = 1) across the entire dataset. Since different range gates observe distinct parts of the precipitation field, and the movement of storms within 4 s generally falls within the resolution volume while signals become decorrelated, using temporal samples can provide more accurate estimates in many cases without the assumption of spatial homogeneity. The standard deviation is calculated for various polarimetric variables, including ZH, velocity (vr), spectrum width (σv), ZDR, ρhv, and differential phase shift (ΦDP), for both spatial and temporal sampling. In the spatial sampling approach, 17 range gates were used based on the middle time step to calculate the standard deviation. Experimenting with different time steps or increasing the number of samples did not significantly change or improve the standard deviations. The computed values for both spatial and temporal samples are compared to theoretical values and the radar functional requirements set by the National Oceanic and Atmospheric Administration National Weather Service Radar Functional Requirements (NOAA/NWS RFR). The theoretical values were derived using lag-0 estimate equations from Doviak and Zrnic (2006).
To assess the data quality and system performance of the weather measurements, the error characteristics of the polarimetric data are calculated and quantified. Horus started its first weather observations in December 2022 and continues to observe cases of shallow and deep convective precipitation. This study specifically examines a recent convective precipitation event on 4 October 2023 from 22:19 to 22:45 UTC, focusing mainly between 22:36 and 22:45 UTC. As illustrated in Fig. 3a, the Horus beam was directed at an azimuth of 198° from the north, penetrating the convective region of the storm. The 18:00 UTC Norman sounding of 4 October 2023 reveals favorable environmental conditions for deep convective storms, with a convective available potential energy (CAPE) of ∼ 3078 J kg−1. The combination of abundant low-level moisture and diurnal boundary layer heating with an approaching mid-level shortwave trough provided favorable conditions for thunderstorm development. The group of isolated convective cells of interest originated near the western Oklahoma–northwestern Texas border around 17:50 UTC, and a band of supercells in a loosely organized mesoscale convective system (MCS) moved across Oklahoma. According to the NWS, several reports of strong winds and hail were documented throughout central and northeastern Oklahoma (https://www.spc.noaa.gov/exper/archive/event.php?date=20231004, last access: 7 July 2024).
Until the summer of 2020, the CPPAR underwent development/testing and conducted weather measurements. This study focuses on weather observations that took place on 30 August 2019 at 15:04 UTC. Figure 3b depicts the measurement area of the CPPAR as observed from KTLX at 19:14 UTC. Like the convective case for Horus, the atmospheric conditions were conducive to severe storms. Around 10:00 UTC, the preexisting MCS from Kansas continued to move southeastward to produce thunderstorms in central Oklahoma. CAPE of up to 4000 J kg−1 and steep lapse rates of 2–6 °C km−1 have been reported, maintaining moderate instability ahead of the MCS. The NWS recorded strong gusts of up to 71 mph (∼31.7 m s−1) in northern to central Oklahoma (https://www.spc.noaa.gov/exper/archive/event.php?date=20190830, last access: 7 July 2024).
In addition to the storm events, some radar parameters, waveforms, and calibration techniques differ between the two 2D PPARs. For example, Horus employed progressive pulse compression (Salazar Aquino et al., 2021) to eliminate the blind range and used mutual-coupling-based calibration (e.g., Fulton et al., 2022; Palmer et al., 2023). On the other hand, the CPPAR used a simpler calibration method by mounting a calibration horn on top of a nearby building to optimize the beams. This method aimed to match copolar patterns, maximize gain, and minimize sidelobe levels and cross-polar biases (Li et al., 2021b). Also, a pulse compression waveform was used with a pulse width of 34 µs, resulting in a short-range blind range of approximately 5.1 km for the CPPAR. The time series data from the two PPARs were processed in the same way using lag-0 correlation estimators for regions with SNRs greater than 20 dB and lag-1 for the rest. It should be noted that both the software and hardware of KTLX did not undergo any significant changes between 2019 and 2023 (https://training.weather.gov/wdtd/buildTraining/RPG-RDA.php, last access: 7 July 2024).
The initial comparison is conducted between the radar measurements from the operational radar, KTLX, and the two PPARs to compute the mean bias and the standard deviation of the differences. Subsequently, a comparative analysis of the standard deviation is derived from both spatial and temporal samples for Horus and solely spatial sampling for the CPPAR.
3.1 Bias calculation of Horus and CPPAR data
The spatial distribution of the polarimetric variables from the two radars shown in Fig. 4 provides valuable information for identifying potential system deficiencies and understanding the error characteristics of Horus. KTLX, which benefits from higher antenna gain and transmit power, exhibits significantly higher SNR and sensitivity compared to Horus (Fig. 4a vs. Fig. 4b). The convective core located between 10 and 20 km demonstrates good agreement between the radars (Fig. 4c vs. Fig. 4d). However, there are still some clear differences in the magnitude of the measurements. For example, the maximum ZH near the ground, at about 15 km, exhibits a difference of more than 5 dB, and a lack of sensitivity in the Horus data remains apparent at further distances. Despite the bias, the ability of Horus to capture true RHIs provides much more detailed microphysical and dynamical process information due to the improved spatial and temporal resolution, demonstrating the potential of PARs to improve meteorological applications.
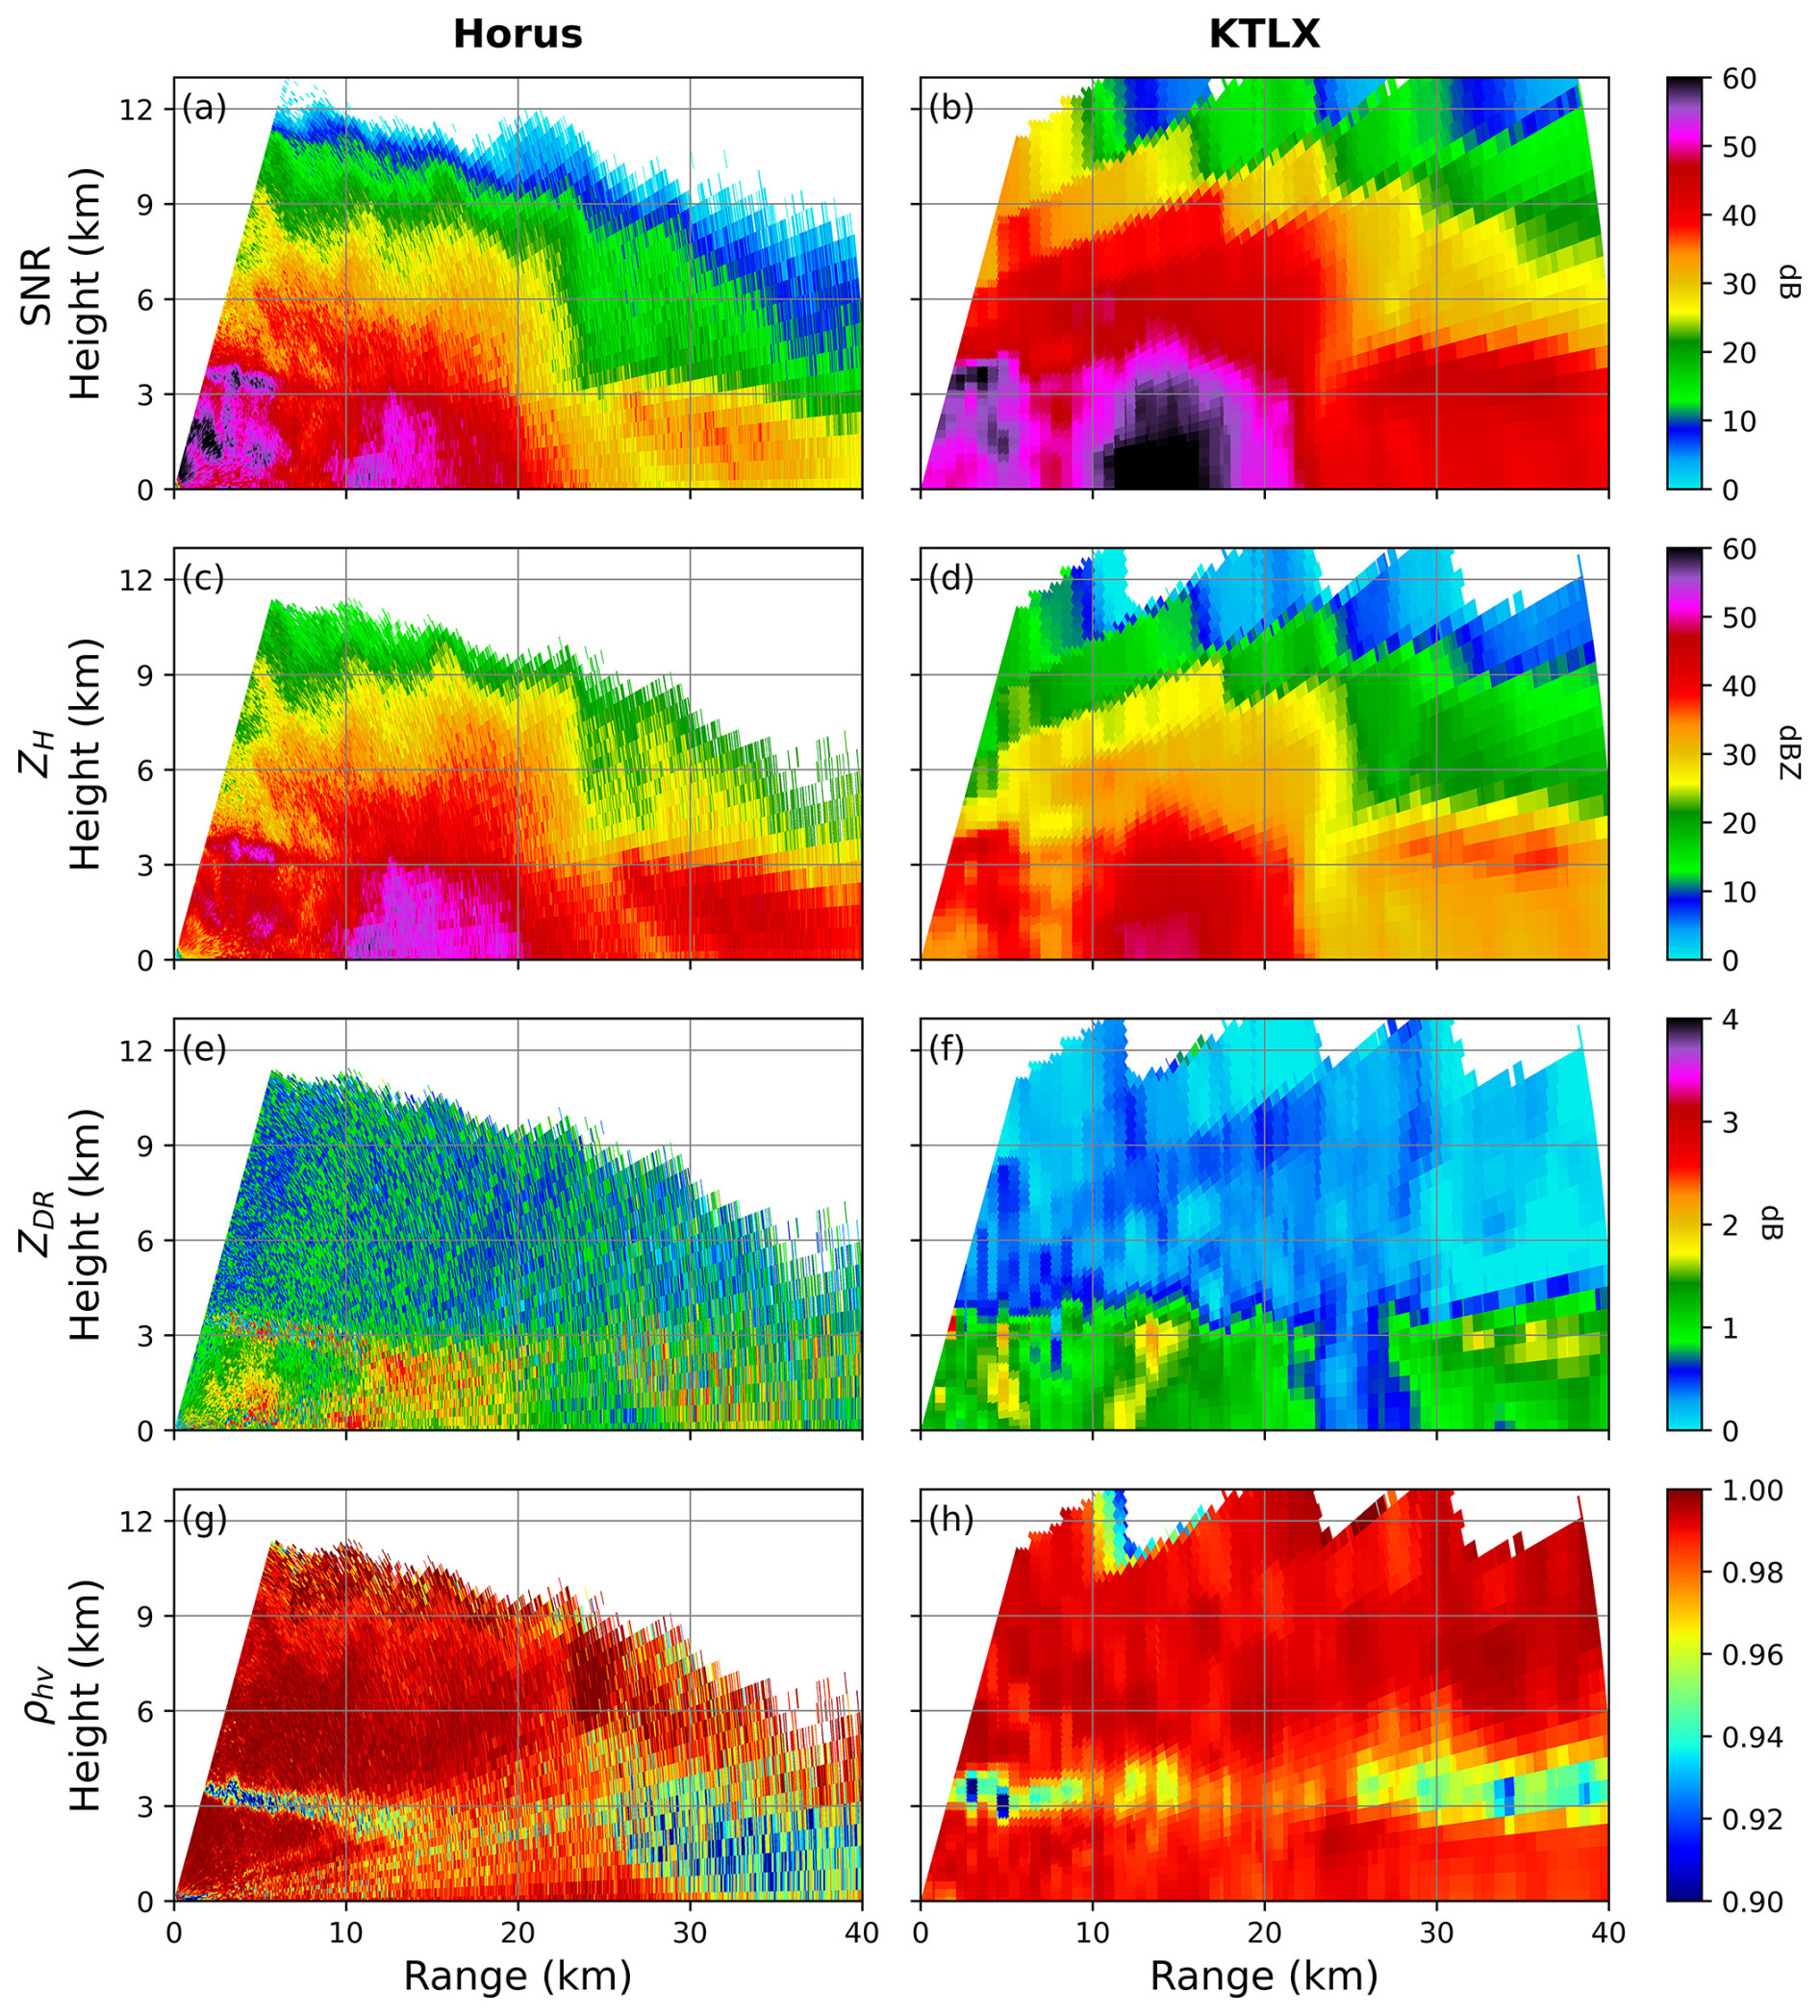
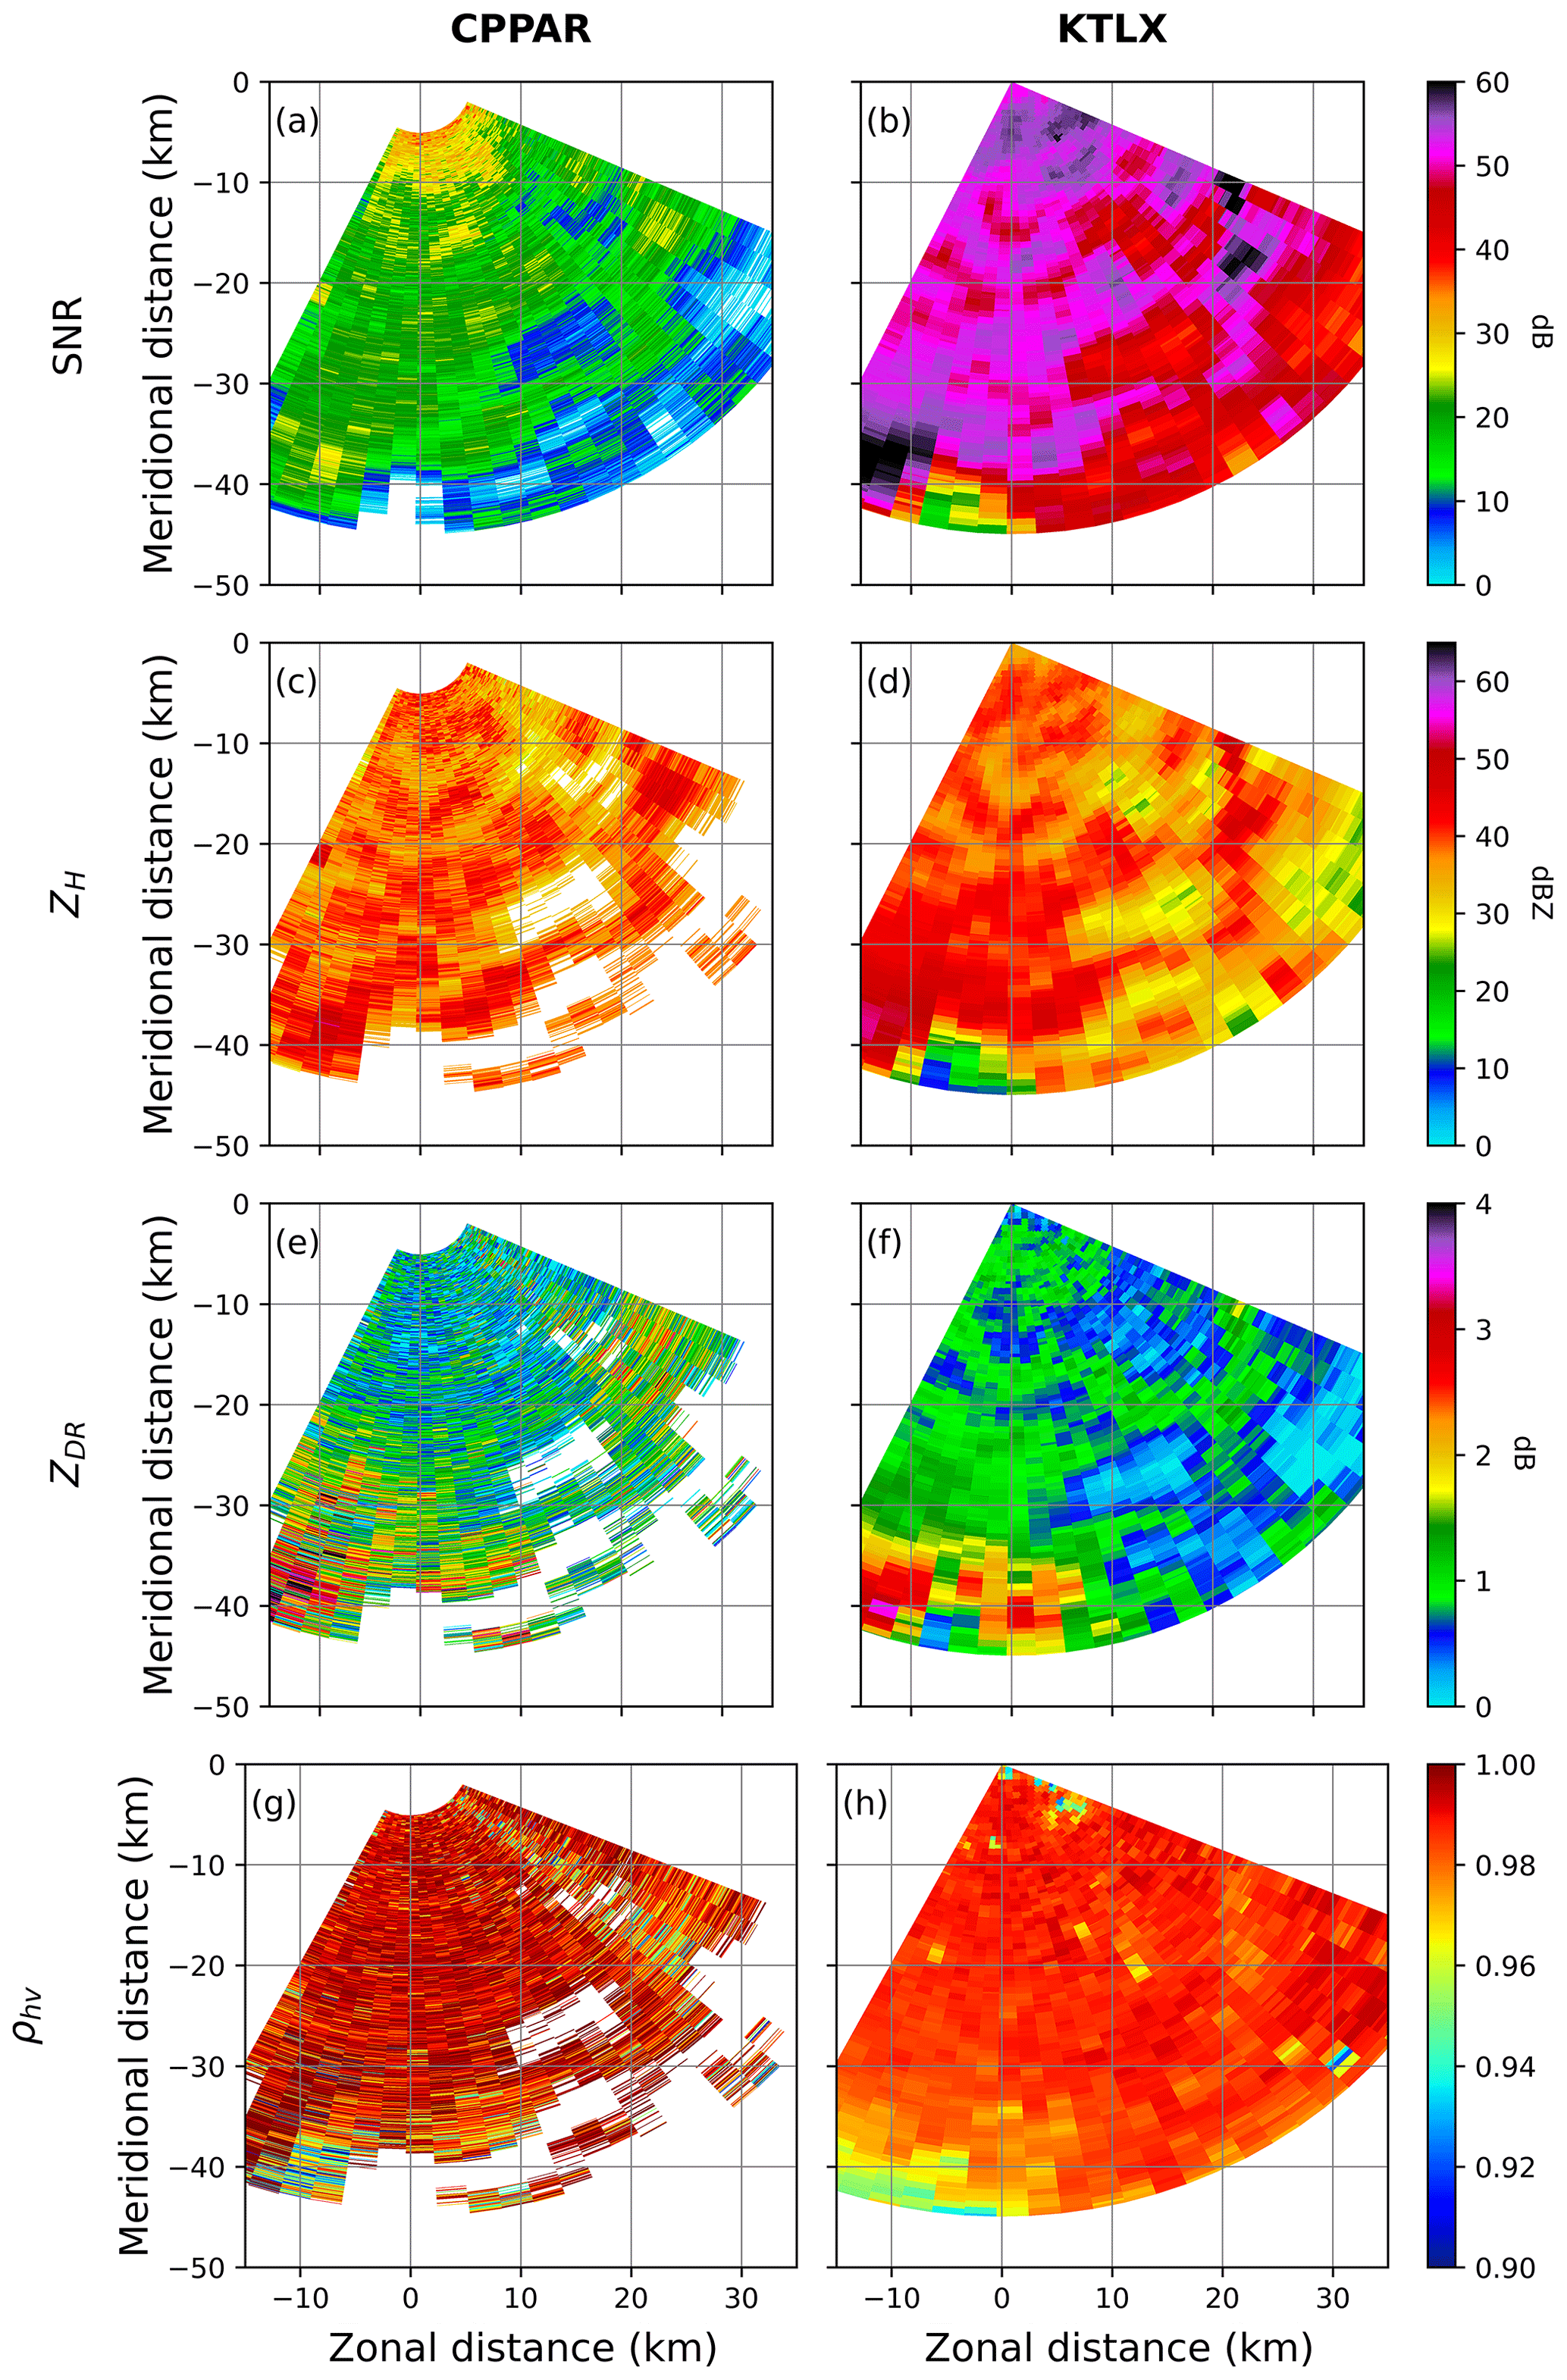
Figure 4Spatial distribution of SNR, ZH, ZDR, and ρhv from Horus (a, c, e, g) and KTLX (b, d, f, h) measurements on 4 October 2023. All variables for both radars are plotted for SNRs greater than 10 dB.
The polarimetric variables from Horus show more notable differences with those from KTLX. Slight ZDR bias exists, with ∼ 1.0 dB difference near the convective core (Fig. 4e vs. Fig. 4f). Additionally, the low ZDR region between ∼ 25 and 30 km for KTLX does not appear clearly for Horus and noisy values of up to 1 dB above the melting layer. Overall, the ZDR values from Horus agree well with KTLX, with positive biases of less than 0.5 dB throughout the entire domain. Note that KTLX has limited observations in the lower elevations due to its distance from the storm, and the near-ground data are interpolated from higher altitudes, leading to relatively larger differences in the lowest elevations. In addition, since the error characteristics of the polarimetric variables depend on ρhv, the lower to middle elevations of ZDR may also be affected by the degraded ρhv in these regions (Fig. 4g). The high ρhv in Horus is notable in the lower and upper elevations, and the melting level agrees well with KTLX (Fig. 4g vs. Fig. 4h). However, Horus shows reduced ρhv values of less than 0.94 in the mid-altitude regions from 1.5 to 6 km, and these are more pronounced from about 20 km. While the reduction can be partly explained by snow melting, a low SNR, and the propagation effect, the reduced ρhv along the entire radials is a concerning feature. This ρhv reduction can imply error associated with electronic steering at large angles away from the broadside. Future improvements in PPAR signal processing for weather applications are planned in light of the observed biases in the ZDR and ρhv and the need to minimize the influence of clutter and contamination by addressing sidelobes, beam width, and steering loss issues.
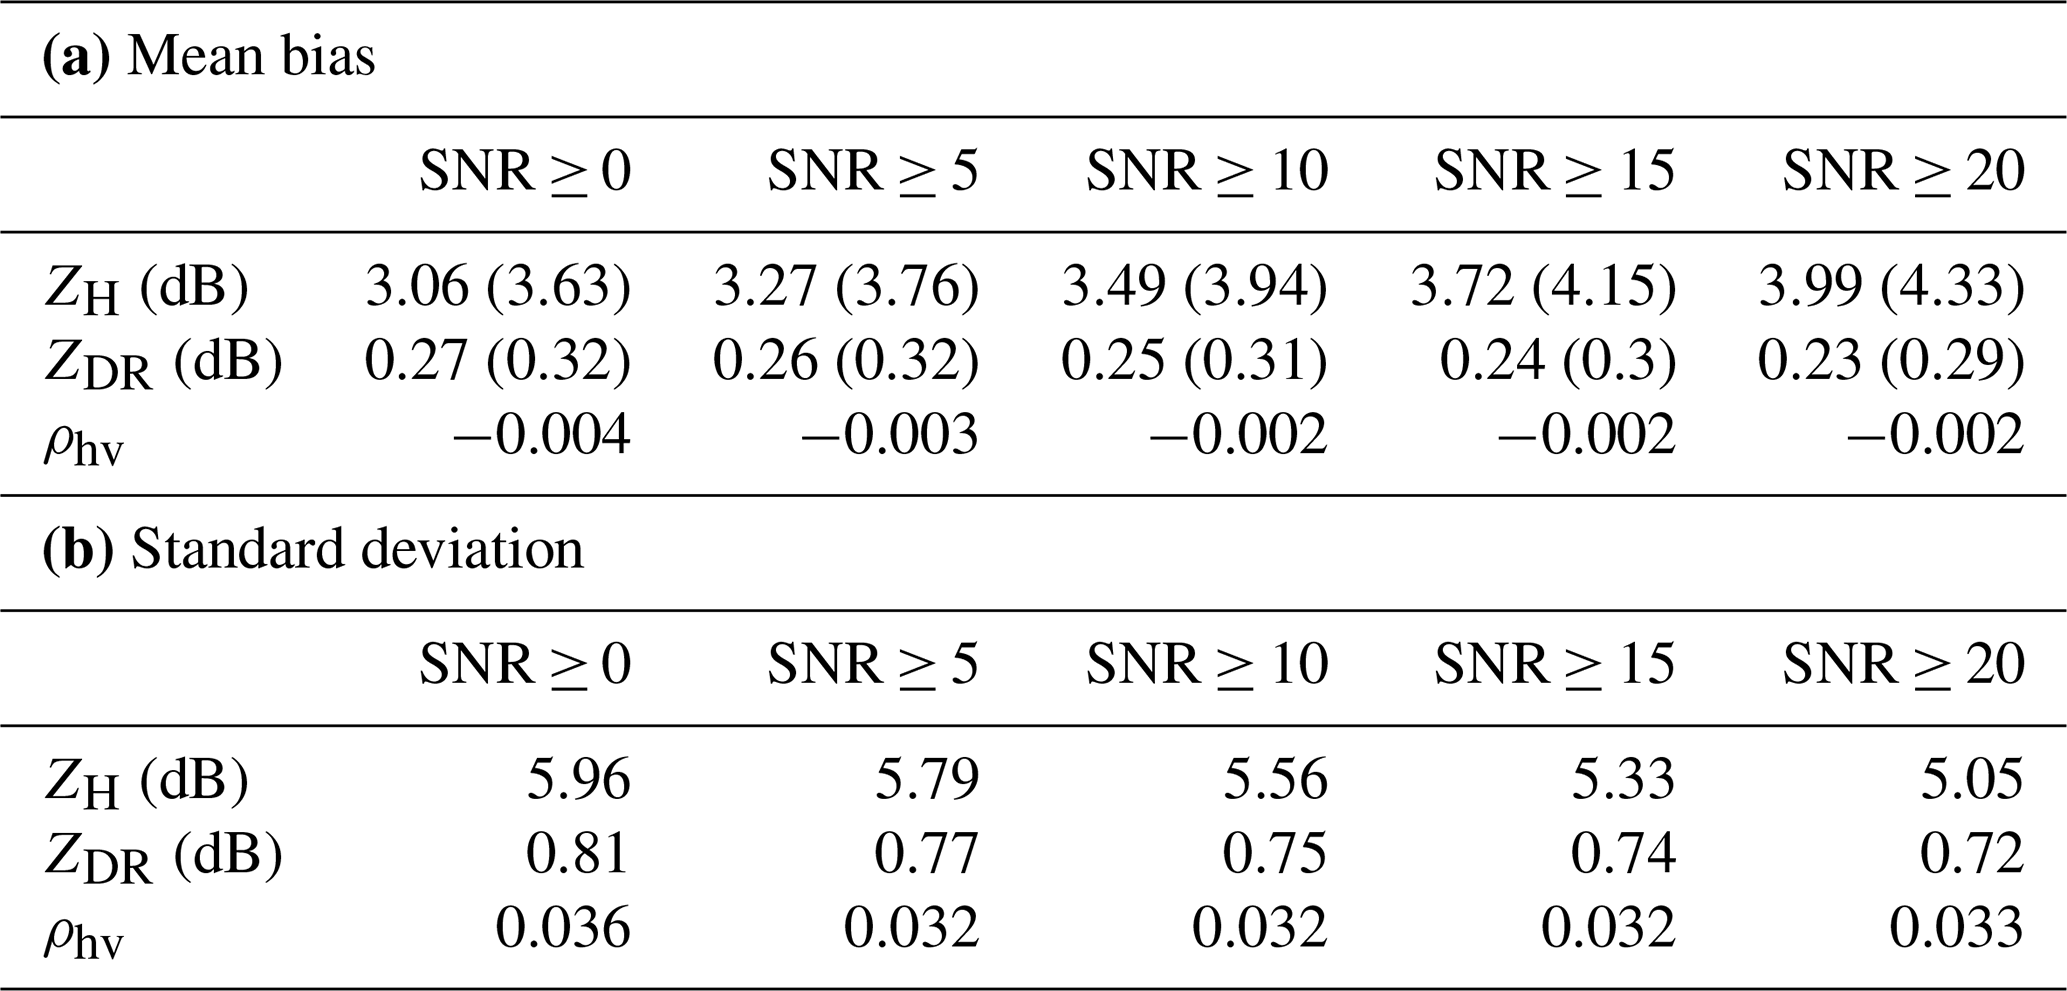
The mean bias and standard deviation of the differences from the KTLX comparison for the case shown in Fig. 4 are organized in Table 2. The values remain relatively stable and consistent across different SNR ranges. The mean bias and standard deviations for ZH remain around 3–4 and 5–6 dB, respectively (Table 2a and b). ZDR shows slight improvements, with the SNR decreasing to 0.23 dB bias and 0.72 dB standard deviation. The standard deviation values are typically similar to or greater than the corresponding mean bias values, with limited influence of beam broadening or mismatch on these statistics. There is minimal improvement in the accuracy of ρhv measurements with increasing SNR, suggesting that such a reduction is not due to lower SNR values. The consistently low ρhv bias is of concern, especially for the significant ρhv reduction between 20 and 40 km, as shown in Fig. 4. Further analysis of the potential causes of this degradation is discussed in Sect. 4.
Table 2Mean bias and standard deviation of the differences between Horus and KTLX for each SNR range. The values in parentheses denote the median values.
The comparisons between the CPPAR and KTLX are depicted in Fig. 5, which show a generally similar spatial distribution to that between Horus and KTLX. The magnitude and distribution of ZH from the CPPAR agree well with those from KTLX except for a low-SNR region in the far ranges and a few radials influenced by a water tower close to the radar (Fig. 5a vs. Fig. 5b). Note that the CPPAR SNR is much lower than that of Horus and KTLX, as expected from the radar parameters. In the far ranges, CPPAR data are absent or have much smaller values, while KTLX shows values close to 20 dBZ (Fig. 5c vs. Fig. 5d). This discrepancy can be attributed to the distinct transmit power and sensitivity of the two systems. The ZDR comparisons display similar trends, with a common location of ZDR values up to 3.5 dB at around 40 km in range (Fig. 5e vs. Fig. 5f). ZDR values from the CPPAR closely align with those from KTLX, showing no notable bias. In the lower SNR region, large ρhv values appear at the far edge of the CPPAR measurements, with reduced ρhv along radials with a low SNR and/or the presence of the water tower in directions at azimuth of ∼ 133° from the north (Fig. 5g vs. Fig. 5h). It is important to note that some differences in elevation and time between the CPPAR and KTLX are unavoidable given that KTLX scans only every 6 min, and the CPPAR did not perform additional scans at different times. There has been a misconception that cylindrical configuration may be prone to interferences or creeping waves (e.g., NSSL Publications, 2014). However, as demonstrated from previous studies based on physical formulations (e.g., Golbon-Haghighi et al., 2021; Li et al., 2021b), such creeping wave effects are not noticeable in the CPPAR measurements. These results highlight the potential differences and biases between the two systems and provide valuable insights into the performance and error characteristics of the emerging CPPAR in comparison to the more established KTLX radar.
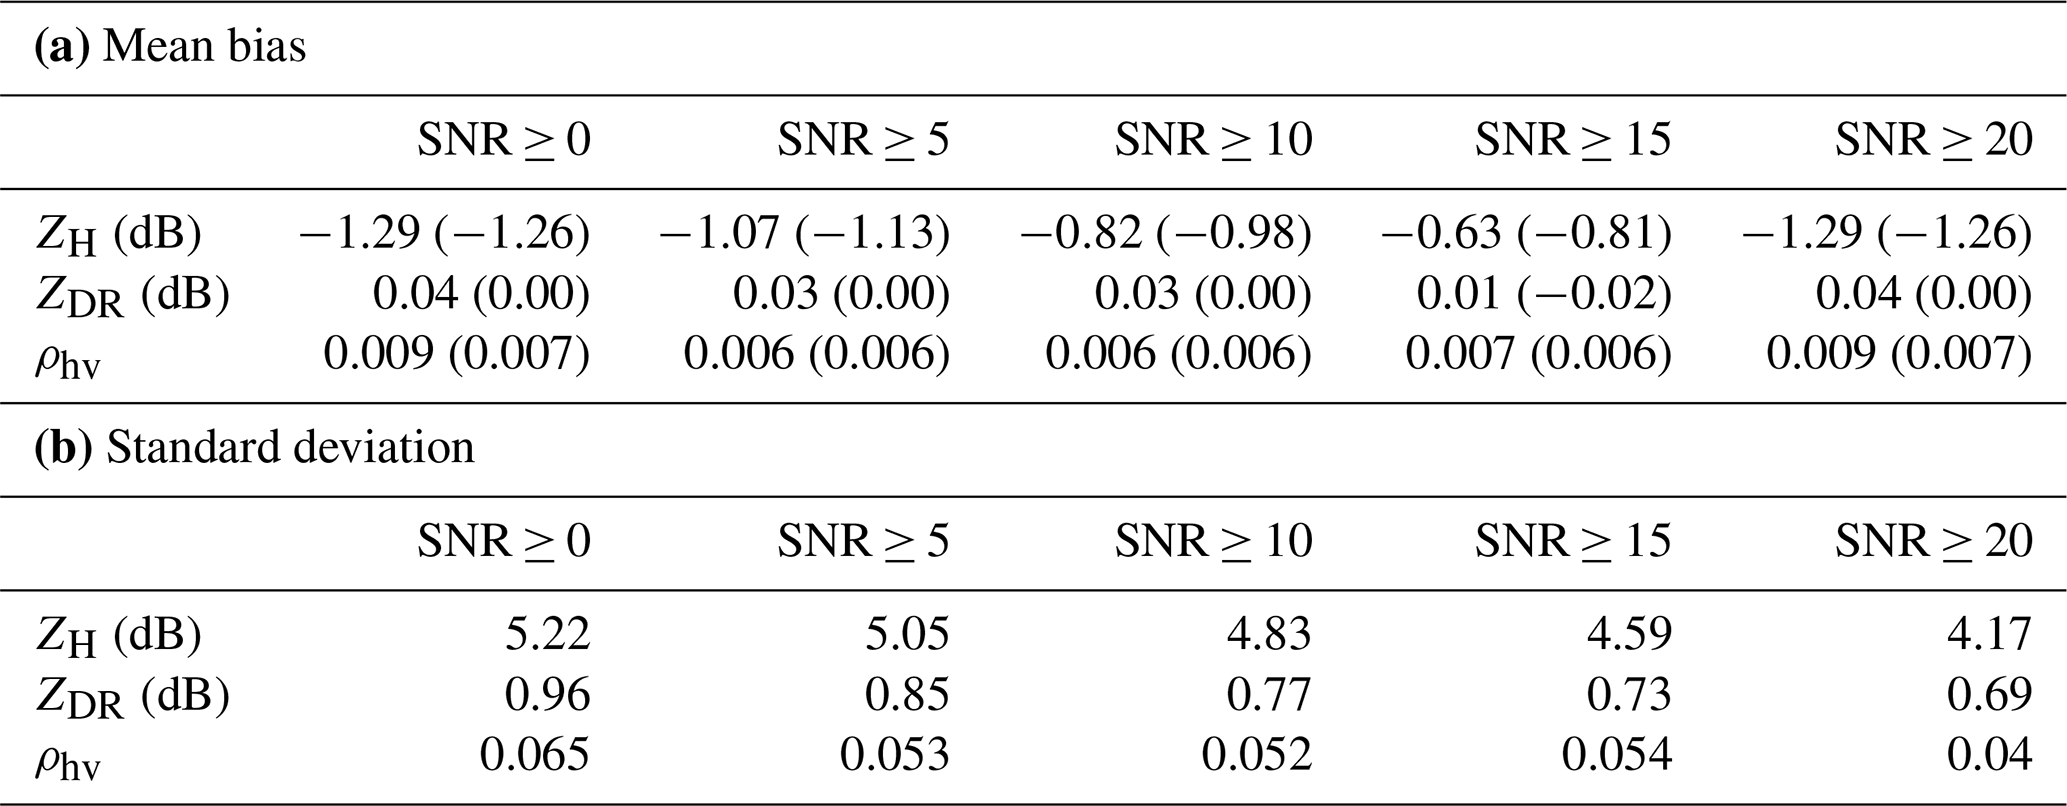
The calculated mean bias and the standard deviation of the differences between the CPPAR and KTLX are organized in Table 3. The magnitude of the mean bias in all radar variables remains relatively stable, with SNRs ≥ 20 dB of approximately −1.29 dB, 0.04 dB, and 0.009 for ZH, ZDR, and ρhv, respectively. The small polarimetric biases compared to those of Horus are a promising feature. Especially, the consistently low and positive bias of ρhv is an encouraging feature and implies that the CPPAR is making progress towards achieving more accurate and reliable weather measurements (Table 3a). The standard deviation of the differences for the CPPAR is generally similar to that of Horus for ZH, ZDR, and ρhv (Table 3b). The relatively larger overall biases in the Horus data may be attributed to errors in polarimetric calibration methods used as well as inherent design issues.
Table 3Same as Table 2 except for the difference between the CPPAR and KTLX.
3.2 Standard deviation estimates of Horus and CPPAR data
Based on the Horus and CPPAR measurements (Figs. 4a, c, e, g and 5a, c, e, g), the standard deviations of the two measurements using spatial and temporal samples are depicted in Figs. 6 and 7 to further investigate the error characteristics. Note that the standard deviation of the differences between the PPARs and KTLX in the previous section are different from the standard deviation estimates of the PPARs' measurements in this section. There are differences between the two PPARs; Horus has a beamwidth of 3.3°, but the elevation angles are sampled at 1° intervals. On the other hand, the CPPAR used only 25 beams for the 90° sector with a beamwidth of 5.35°, which limits the influence of azimuthal oversampling. Therefore, the standard deviations were calculated along the ranges to avoid the influence of oversampling in the standard deviation estimates. In addition, the number of samples for Horus is ∼ 3.6 times larger than the CPPAR and is even larger for higher SNR ranges.
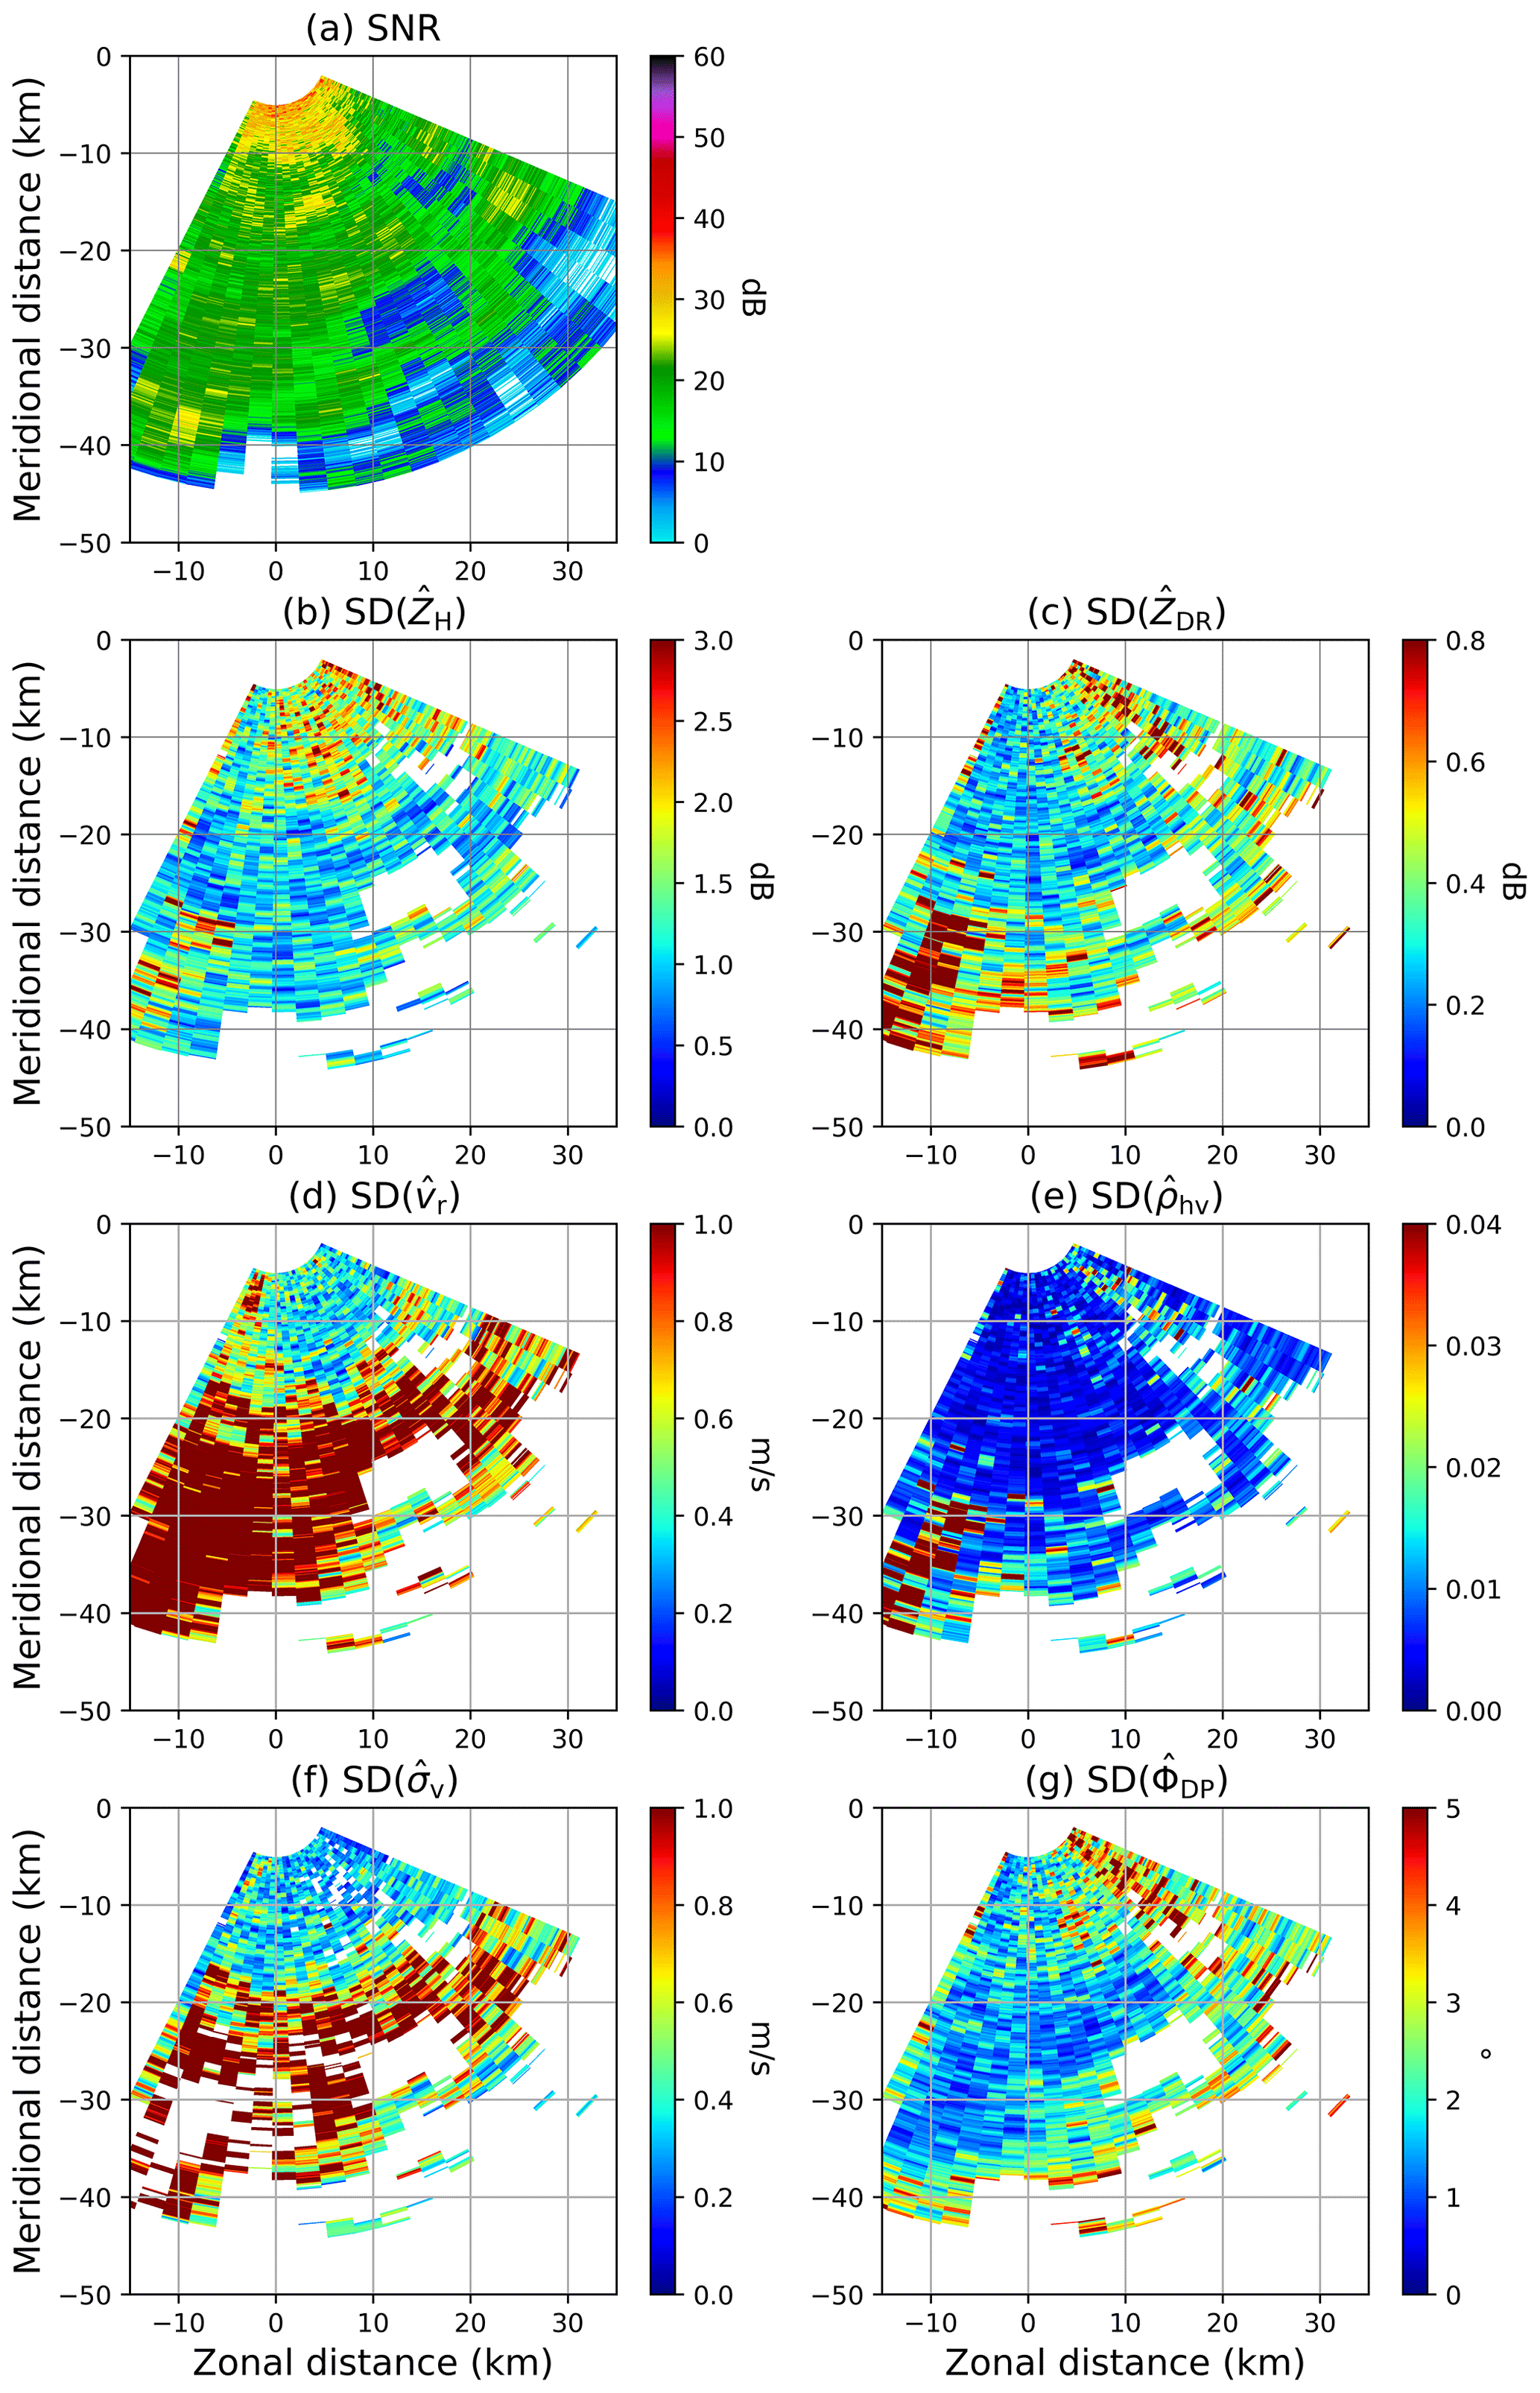
Figure 6 illustrates the standard deviation estimates of six radar variables based on spatial and temporal samples for SNRs larger than 10 dB. The SNR plots are shown in Fig. 6a and b as a reference. While the magnitudes between the spatial and temporal differ, the pattern of high standard deviation matches well (e.g., Fig. 6c and e). For ZH, higher standard deviation values up to 2.5 dB are observed based on temporal samples, with ∼ 1.5 to 2 dB throughout the majority of the RHI scan (Fig. 6c and e). The standard deviation values from both spatial and temporal samples are relatively consistent. However, a few larger values are observed at lowest elevations due to ground clutter effects and the influence of the melting layer, while additional larger values are seen in low-SNR regions. Note that the very near ranges (i.e., < 5 km) in the original blind range may have higher standard deviation values due to the influence of progressive pulse compression (Salazar Aquino et al., 2021). The vr and σv also show similar features (Fig. 6g, i, k, and m). The most concerning features, however, are the strips of increased standard deviation of ZDR, ρhv, and ΦDP observed at low elevations to mid-elevations, which may be related to the performance degradation as the electronic beam is steered away from the broadside, in addition to the physics of melting that can affect multiple beams due to the relatively large beamwidth (Fig. 6d, f, h, j, l, and n). These strips of high standard deviation are consistent with the reduced ρhv from the Horus measurements (Fig. 4). The strips of increased standard deviation along the radials are also noticeable at higher elevation angles. These features, which are only noticeable from the polarimetric variables, reinforce the possibility that these strips are contributed by the inherent limitation of 2D PPARs when electronically scanning off broadside. Overall, the standard deviation values in Fig. 6 exhibit reasonable distributions, consistent with the results in Table 4.
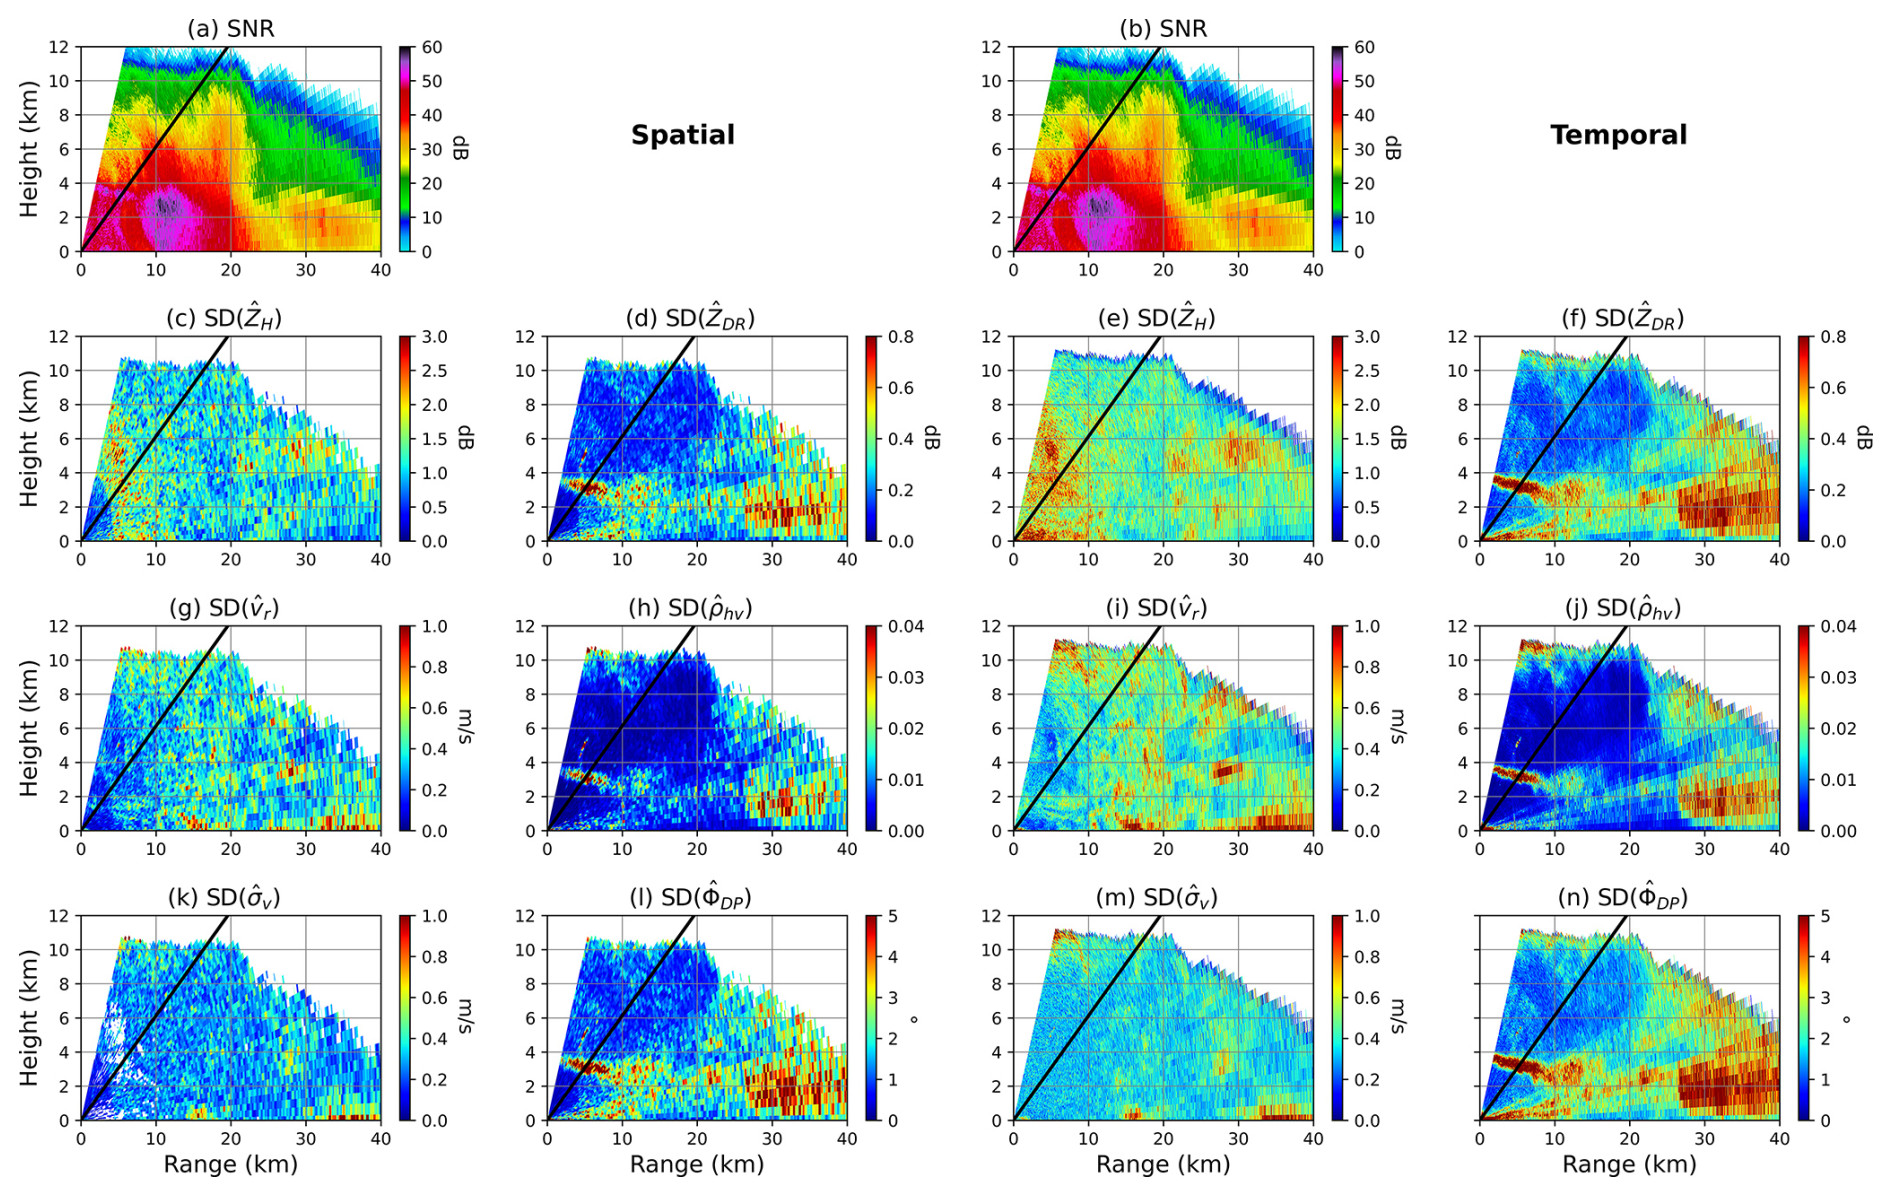
Figure 6Spatial distribution of SNR and standard deviations of reflectivity (ZH), radial velocity (vr), spectrum width (σv), differential reflectivity (ZDR), correlation coefficient (ρhv), and differential phase shift (ΦDP) for SNRs greater than 10 dB from Horus weather observations based on 146 time steps on 4 October 2023. The first two column use 17 spatial gates and the latter two only temporal samples. The black lines denote the broadside direction.
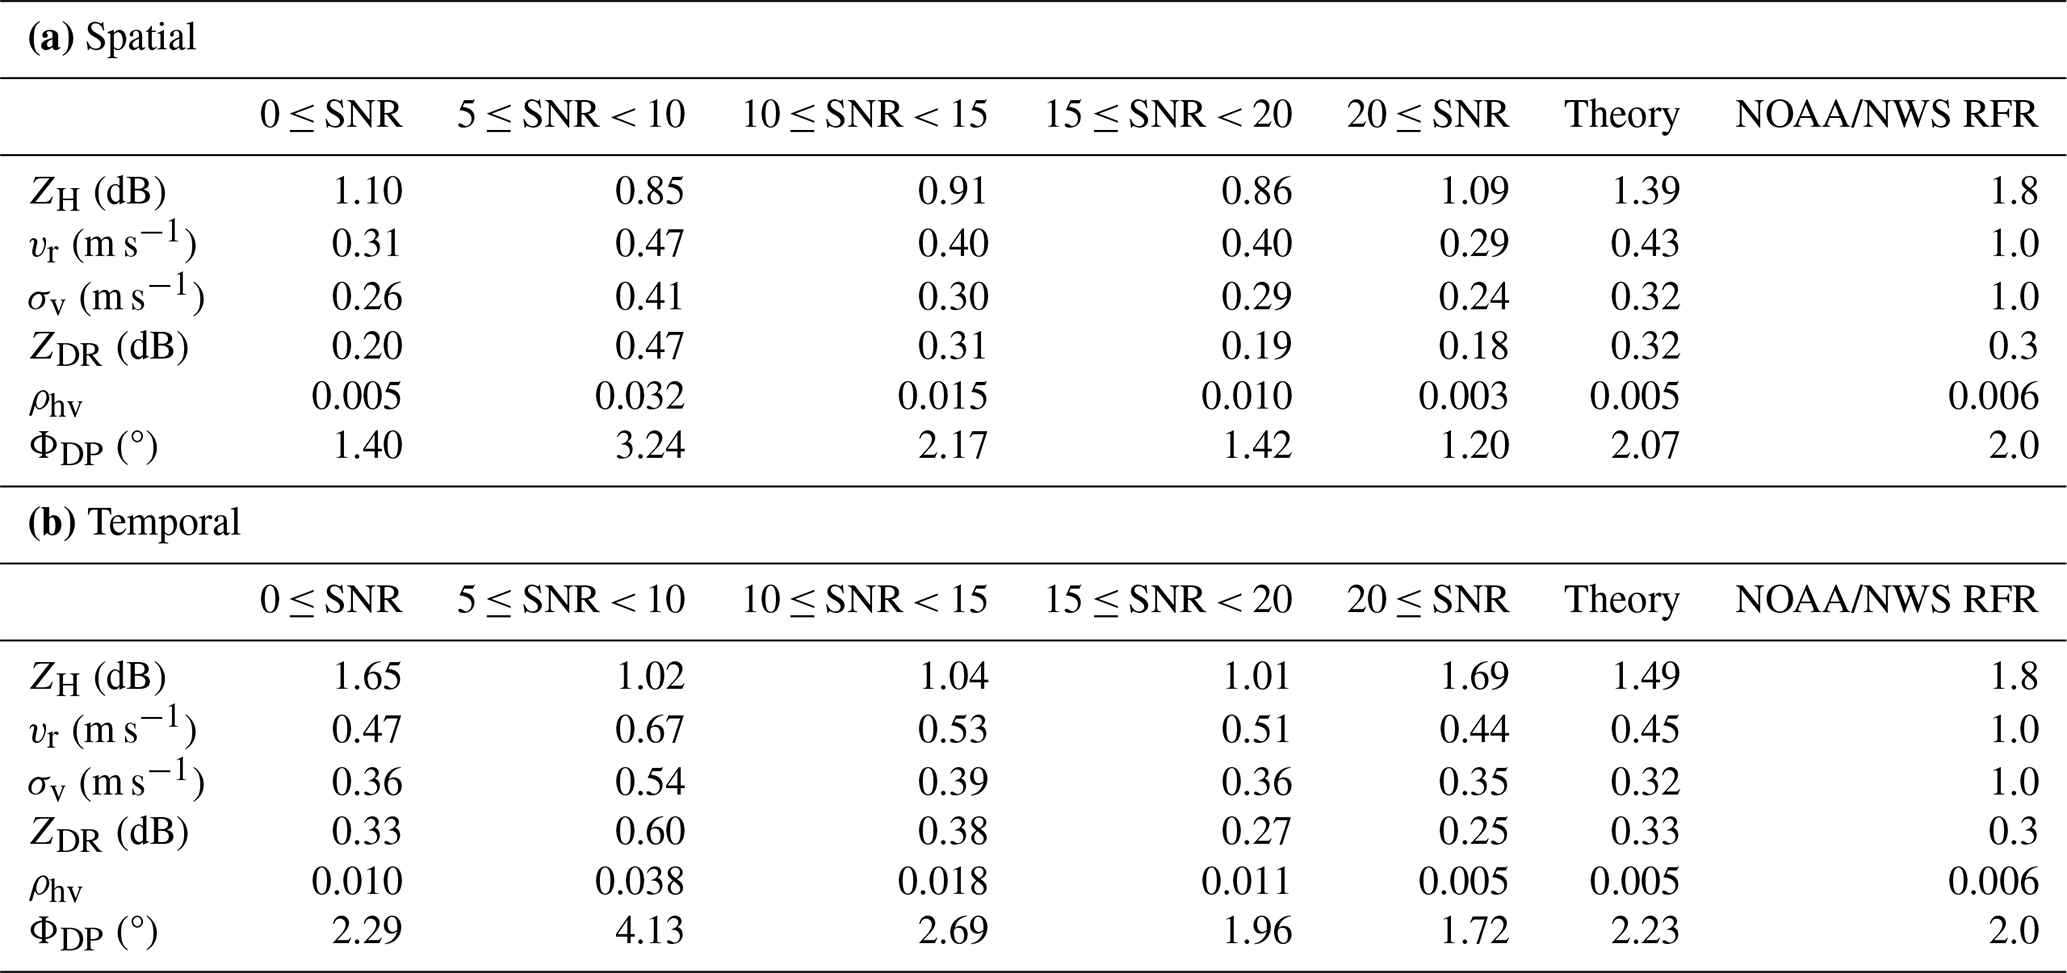
The calculated values for both the spatial and temporal samples are compared with theoretical values and the radar functional requirements set by the National Oceanic and Atmospheric Administration National Weather Service (NOAA/NWS RFR). The theoretical values are derived using equations from Doviak and Zrnic (2006). The values of σv and ρhv, which influence the theoretical values of other variables, have been selected using the median value of the middle time step for spatial samples and all time steps for temporal. The median values of calculated standard deviations for each signal-to-noise ratio (SNR) range, the theoretical values, and the NOAA/NWS RFR are organized in Table 4, based on spatial (Table 4a) and temporal (Table 4b) sampling using Horus data. As expected, the standard deviation of the polarimetric variables generally exhibits a decreasing trend with increasing SNR. However, for larger SNR ranges, slight variations are expected due to the smaller number of data points available. For SNR values exceeding 20 dB, the standard deviations are even smaller than the theoretical calculations, especially for vr and ZDR. In addition, there are considerable differences (∼ 1.4 times larger for temporal) in the standard deviations between the spatial and temporal samples for all SNR regions. For instance, the standard deviations of ZH, ZDR, and ΦDP of the temporal samples within the SNR range of 5 to less than 20 dB are about 1.4 times larger for the spatial samples. This could be attributed to the influence of various filters applied to the Horus data (Palmer et al., 2023), including a clutter filter (Siggia and Passarelli, 2004) and a radio frequency interference filter (Cho, 2017). It emphasizes the need to account for these filters in subsequent analyses. Nevertheless, the standard deviation for SNR values greater than 20 dB agrees well with the theoretical calculations and is less than the NOAA/NWS RFR limits for the examined case.
Table 4The median value for the standard deviation of six radar variables based on both (a) the spatial and (b) the temporal domain of the Horus data for five different signal-to-noise ratio (SNR) ranges. The theoretical values are estimated based on the middle time step. The NOAA/NWS RFR column represents the radar functional requirements of the NOAA and National Weather Service.
The standard deviation estimates for the CPPAR measurements are shown in Fig. 7. As expected from the weaker power and lower sensitivity, wider beamwidth, less angular oversampling, and no spatial filtering, the CPPAR exhibits larger standard deviation estimates, especially in the low-SNR regions (Fig. 7a). ZH shows consistent values of ∼ 1.2 dB (Fig. 7b) except in the low-SNR regions. For vr and σv, the values are ∼ 0.6 and 0.3 m s−1, respectively (Fig. 7d and f). For ZDR, ρhv, and ΦDP, the values fall below 0.3 dB (Fig. 7c), 0.005 (Fig. 7e), and 2° (Fig. 7g) except for a few strips in the low-SNR region, which may also be affected by the nearby water tower. Most of the CPPAR data points have consistent values throughout the PPI scans for all six radar variables, which is a promising feature. There are also no clear variations with scanning angle and/or interference-like structures that could indicate interferences/creeping wave effects.
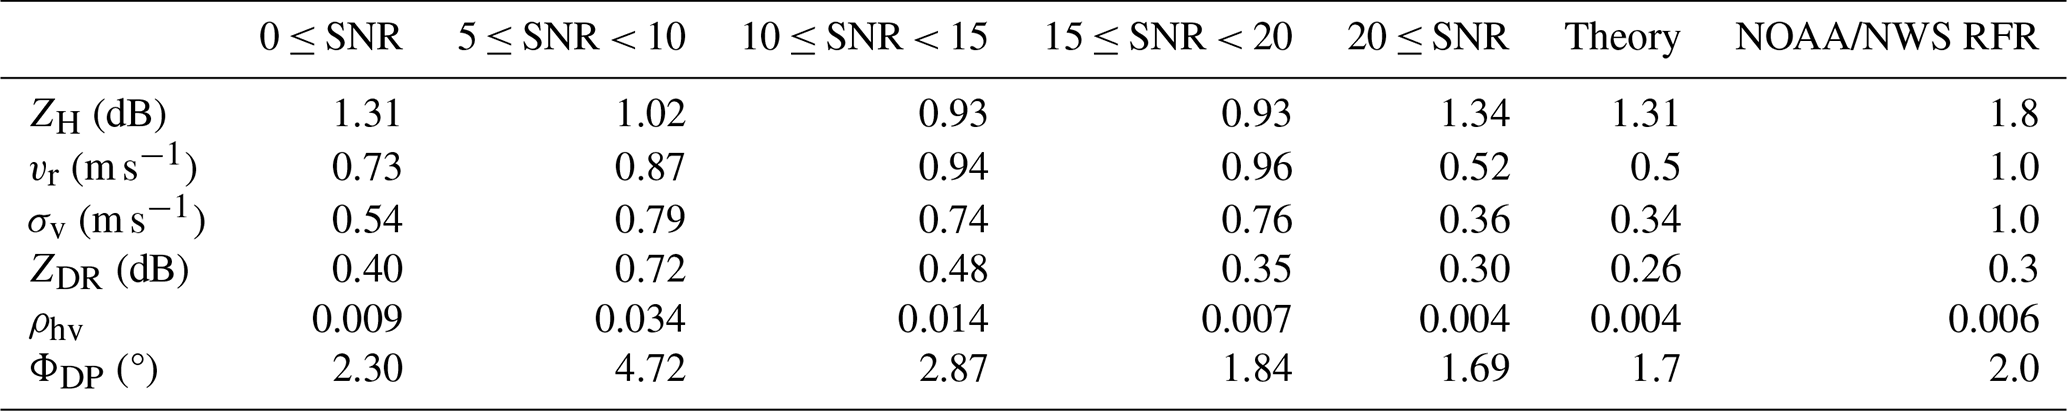
Initially presented in Table 3 of Li et al. (2021b), the standard deviation estimates have been extended to cover additional SNR ranges (Table 5). The results in Table 5 are very similar to those in Table 4a, showing a decreasing trend in the standard deviation with increasing SNR. Furthermore, the standard deviation values for the CPPAR are comparable to those of Horus within the same SNR ranges. In general, Horus displays slightly smaller standard deviations compared to the CPPAR. This difference can be attributed to the use of oversampling with elevation for Horus. It should also be noted that the CPPAR conducted electronic scans between full −45 and 45° whereas Horus only between −31.5 and 31.5°. For SNR values greater than 20 dB, the standard deviations observed in the CPPAR are either less than or comparable to the theoretical values and are in compliance with the NOAA/NWS RFR for the examined case. Overall, the standard deviation values in Figs. 6 and 7 exhibit reasonable distributions, consistent with the results in Tables 4 and 5. This indicates that the results are consistent across different analyses, providing a comprehensive assessment of the data quality for both radar systems.
Table 5Same as Table 4a except the SDs are based on electronic scans of the CPPAR.
The primary concern with the planar antenna design of 2D electronic PPARs lies in the weather data quality off broadside due to the scan-dependent beam properties of the PPPAR, unless an accurate beam-to-beam calibration is performed, which is difficult to do. While the planar configuration is relatively easy to implement and has been chosen by many fields for their applications (Brookner, 2008), including Horus, the 2D PPPAR has inherent off-broadside problems that cause sensitivity loss in ZH and ZDR bias. It requires a larger antenna size, higher transmit power, complicated beamforming, and polarimetric calibration when the beam is off the principal plane or far away from the broadside. Previous studies (e.g., Zhang et al., 2011; Golbon-Haghighi et al., 2021; Zhang, 2022) have warned of such fundamental challenges of electronically scanning PPPARs based on theoretical analysis and simulations. These limitations have been observed by the NSSL Advanced Technology Demonstrator (ATD), where data quality degradation occurs at wide scanning angles (Ivić et al., 2019). This study reveals a glimpse of such limitations based on the 13-panel observations from Horus. Horus only performs RHI scans in the vertical principal plane in its current development state, but the effect of off-broadside scanning can be inferred by comparing the quality of the polarimetric variables. As discussed in relation to Fig. 6, the large area of reduced ρhv could be caused by a combination of physical causes from the low intrinsic values in the melting layer, the low SNR, or the wide-angle steering off the broadside. The standard deviation of ZDR, ρhv, and ΦDP increased at the location of the reduced ρhv as strips, strengthening the possibility of an issue in electronic scanning off broadside.
To further investigate the potential cause of the large ρhv reduction and strips of higher standard deviations, the bias calculated from the KTLX comparison and the standard deviations estimated from the spatial samples were averaged for each elevation angle. In order to isolate the problem, regions with SNRs less than 20 dB and KTLX ρhv less than 0.95 were excluded from the analysis to minimize the effect of other causes such as ground clutter, melting level, and low SNRs. The removal of the SNR and ρhv threshold would increase the errors in polarimetric measurements, leading to further degradation in electronically scanning PPPARs. In this study, as the first analysis of its kind, we focus on the high-SNR case for simplicity and demonstration purposes. Also, only rays with more than 300 valid values were considered for statistical significance. Note that the CPPAR is not plotted as it does not have an angular dependence issue, and the data are insufficient for statistical significance after applying those filters. Figure 8 depicts the averaged bias for each ray with respect to the broadside angle. For ZH, there is a high bias in the lowest few elevations, probably from the remaining effect of ground clutter. Also, the reconstructed KTLX measurements in the lowest elevations are partially interpolated from the upper elevations, increasing the potential for beam mismatch. Overall, the bias remains relatively stable around 3.5 dB. However, the polarimetric variables, ZDR and ρhv, reveal different error characteristics with respect to the broadside angle. While there are slight fluctuations, ZDR shows a negative trend, with much higher biases in the lower elevations (i.e., 0 to −31.5°) and lower biases in the higher elevations (i.e., 0 to 31.5°) compared to the broadside. While the ZDR calibration factor can reduce biases in the broadside, the varying error characteristics (i.e., positive bias in the lower elevations and negative bias in the higher elevations) remain as the beams are steered away from the broadside. In fact, such biases start to be noticeable after ∼ 20°, which is consistent with previous studies (e.g., Figs. 6 and 7 of Ivić, 2023; Figs. 2–5 of Zhang et al., 2009; Fig. 2 of Zrnic et al., 2011). Similar trends can be observed for ρhv, where large negative biases are evident from ∼ 20°. The reduction in higher elevations is minor, but the decreasing trend can be seen with a reduction of ∼ 0.002 compared to the broadside.
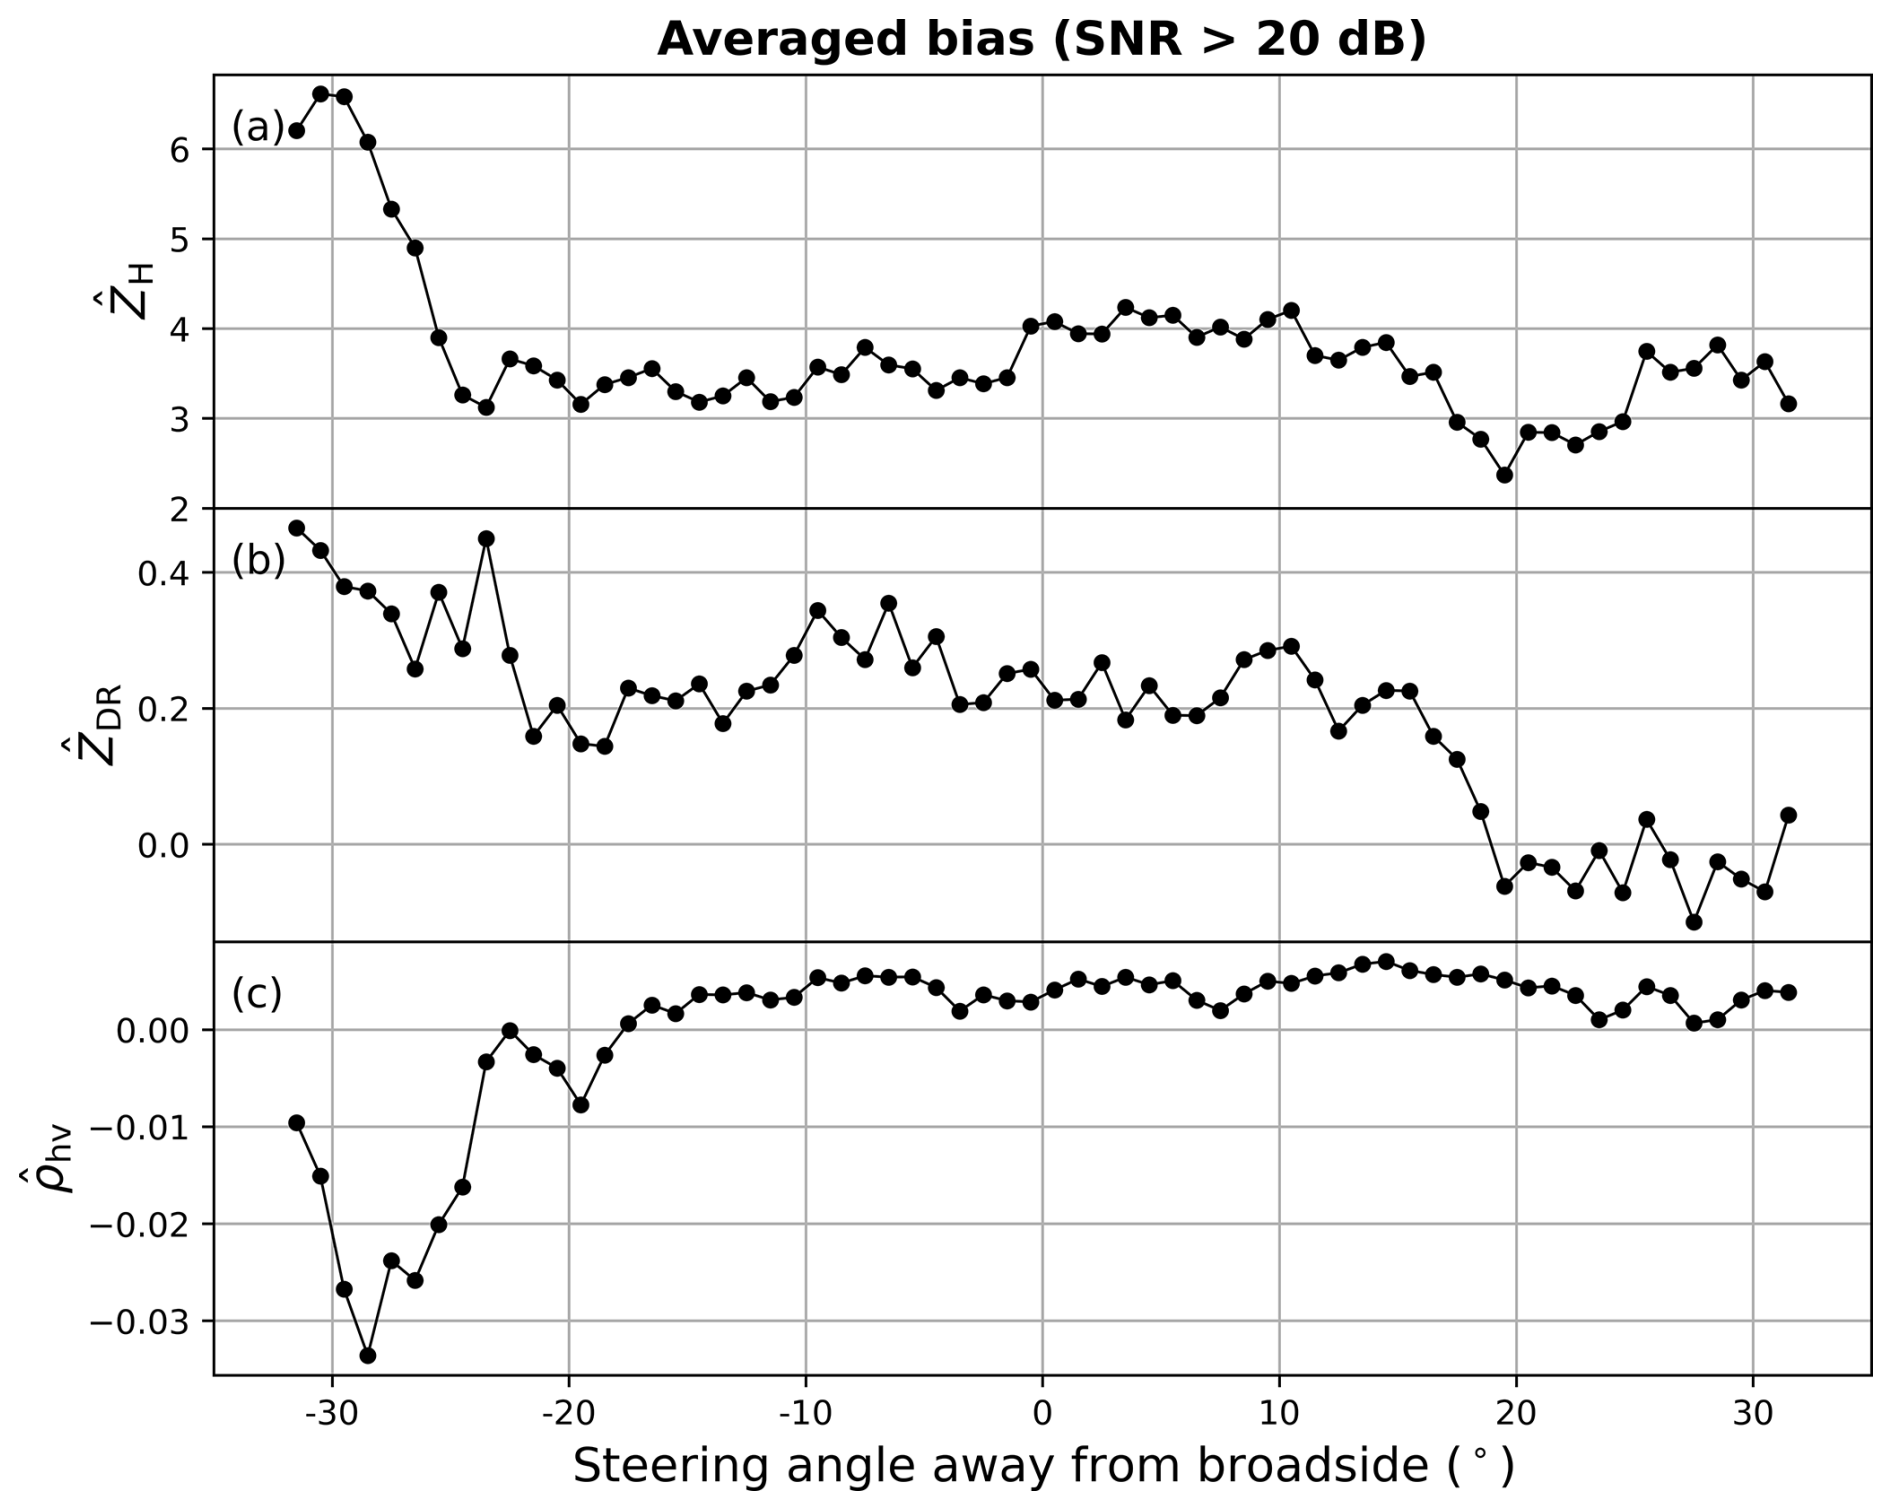
Figure 8Plot of the averaged bias of ZH, ZDR, and ρhv for each steering angle away from the broadside. Only SNRs greater than 20 dB and KTLX ρhv greater than 0.95 were considered. Note that the angles range from −31.5 to 31.5°.
The averaged standard deviation plots also reveal similar features (Fig. 9). All polarimetric variables depict a nearly parabolic shape with a minimum near the broadside (Fig. 9b, d, and f). The single polarization variables (Fig. 9a, c, and e) show random fluctuations for ZH and a decreasing trend with elevation for vr and σv, as can be expected for severe storms. As the propagation path is ∼ 4 times different for lower and upper elevations, the magnitudes of the standard deviations between upper and lower elevations are not expected to be similar. For ZDR, much larger standard deviation estimates up to 0.5 dB are noticeable, even after removing the low-SNR and ρhv regions, with a decreasing trend closer to the broadside (Fig. 9b). For the higher elevations, an increasing trend is noticeable away from the broadside. ρhv shows a clearer parabolic shape, with values up to 0.023 at lower elevations and ∼ 0.027 at higher elevation compared to less than 0.005 near the broadside (Fig. 9d). Standard deviation of ΦDP also show an increasing trend away from the broadside, even after neglecting the high peak at the lowest elevation (Fig. 9f). As shown for the polarimetric biases in Figs. 8 and 9, there is an increase in the error characteristics after electronically scanning away from the broadside. Thus, such a large ρhv reduction in Horus measurements may be caused by issues associated with copolar beam mismatch and polarization purity loss at wide-angle steering off broadside or interference from sidelobes. It can be expected that such performance degradation will be even worse when the beam steers in a wide angle range from −45 to 45°.
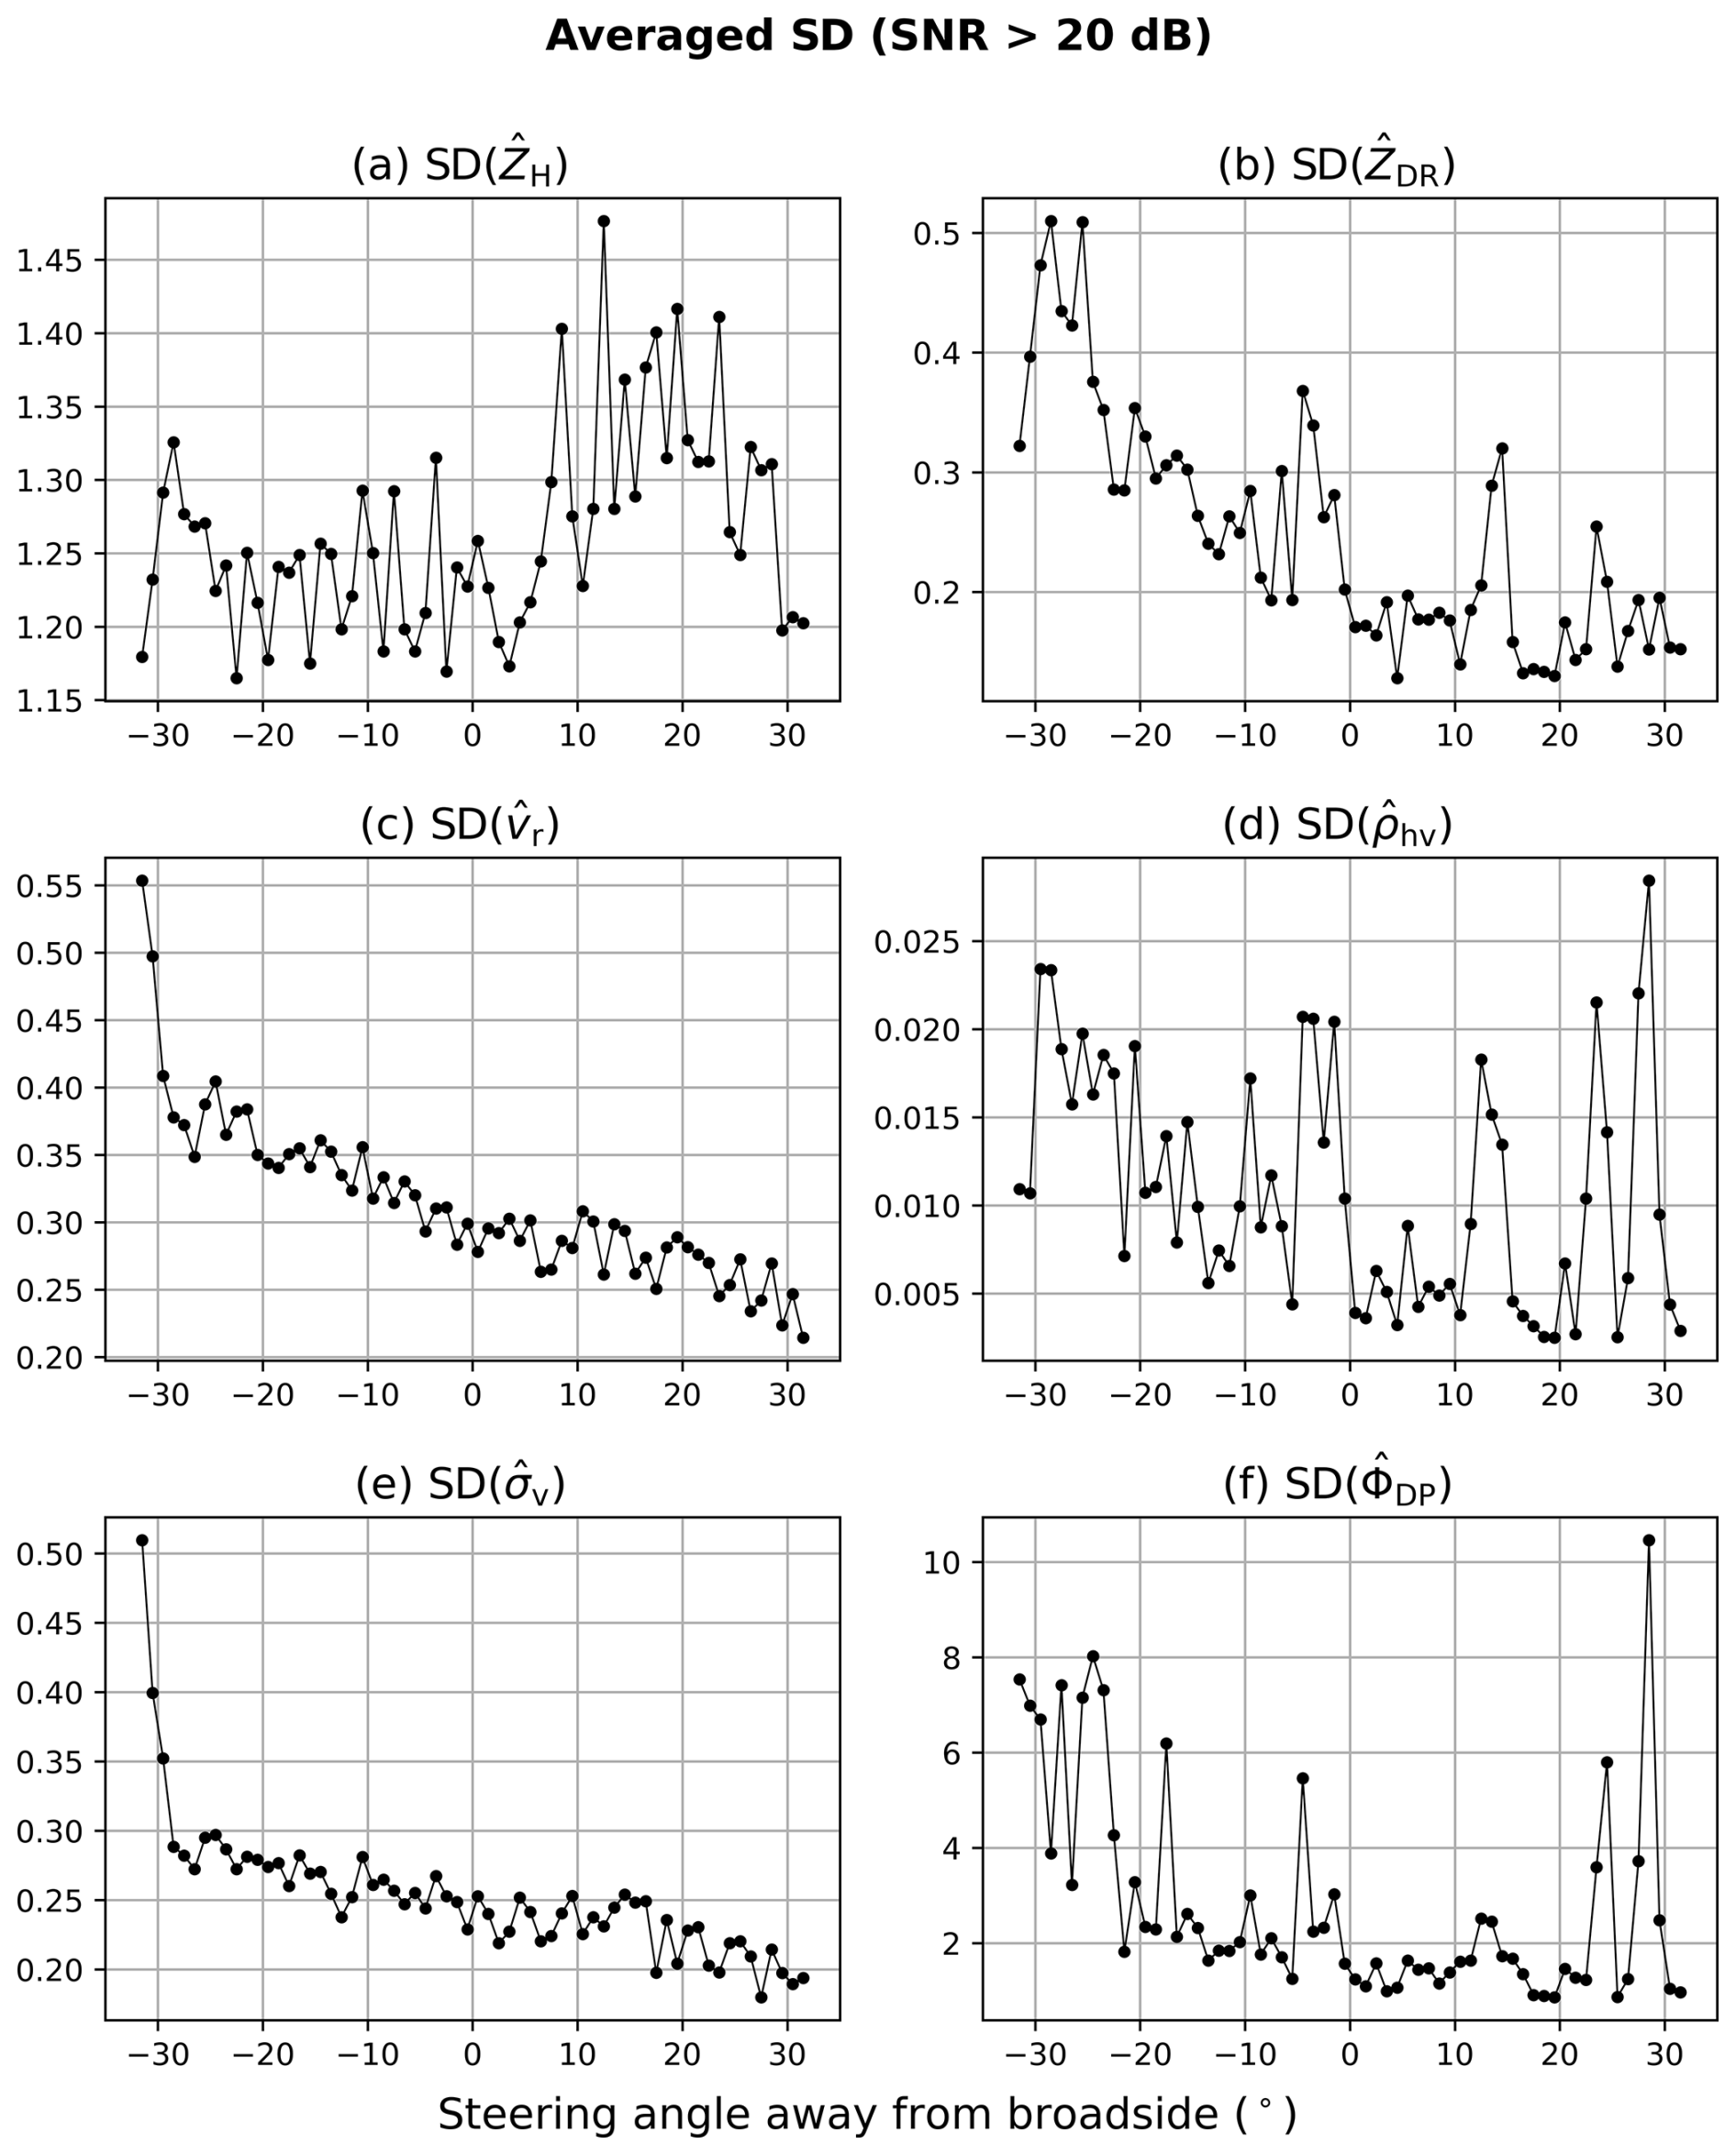
Figure 9Same as Fig. 8 except for averaged standard deviation of ZH, ZDR, vr, ρhv, σv, and ΦDP.
These results are consistent with previous studies, which have found that polarimetric calibration for each element and direction of the PPPAR is more tedious and difficult compared to the cylindrical configuration. This is because the active element patterns in the PPPAR are different and difficult to characterize and form high-performance beams in all directions, while the active element/column patterns in the CPPAR are all the same, yielding all formed beams the same with low sidelobes (e.g., Dorsey et al., 2022; Golbon-Haghighi et al., 2021; Logan et al., 2022; Zhang et al., 2011). Such limitations may reduce the usefulness of the 2D PPPAR for accurate weather measurements, particularly as the antenna size increases and more elements are employed.
On the other hand, the CPPAR provides all beam measurements in principal planes and with small angles from broadside, making it more immune to the degradation problems of electronic steering at wide angles. Nevertheless, the development of the CPPAR in the full scale of the WSR-88D has been stopped, even though the main issues have been solved with satisfactory results. For a better understanding of such limitations of the PPPAR and other possible deficiencies of the CPPAR, observations of the same case with various scanning strategies of the 2D electronic PPARs should be conducted in the future.
The two of the most promising configurations, planar and cylindrical, of 2D PPARs have received considerable attention over the past decade to explore future applications. The timeline and goals depicted in Fig. 10 are based on Fig. 1 of the NSSL MPAR report (2014), with a few modifications reflected to align with the actual timeline. Initially, the NSSL Publications (2014) report planned to analyze both configurations (i.e., four-faced PPPAR and CPPAR) without any moving parts to select the most optimal design for accurate meteorological measurements and potential multifunctionality. Both configurations have been developed as in the 10-panel demonstrator (TPD) and CPPAR-I, and further efforts have been planned and invested for ATD and CPPAR-II. Many of the problems and lessons learned from CPPAR-I have been addressed and resolved over the years. Several improvements include (i) redesigning the column antenna with matched dual-polarization patterns (Saeidi-Manesh et al., 2017b), (ii) switching from digital to analog beamforming to improve system stability, and (iii) optimized beamforming to achieve the nearly identical high-performance beams using multi-objective optimization techniques (e.g., Karimkashi and Zhang, 2015; Golbon-Haghighi et al., 2018; Li et al., 2021b; Zhang, 2022). However, the plan has evolved over the years to focus specifically on weather measurements, with these 2D PPARs now designed to provide efficient and high-quality polarimetric radar data (PRD) in all directions, especially at angles far off broadside (NSSL Publications, 2017, 2023). Another notable deviation from the original plan concerns the two 2D PPPARs, Horus and ATD, while CPPAR development has stopped since 2020. As a rough estimation, much more investment was allocated to each of the planar designs over the CPPAR, as evidenced by the much narrower beamwidth and transmit power of Horus compared to the CPPAR and the number of transmit–receive modules. However, as shown in this study, the quality of weather measurements from these 2D PPPARs at wide angles is questionable.
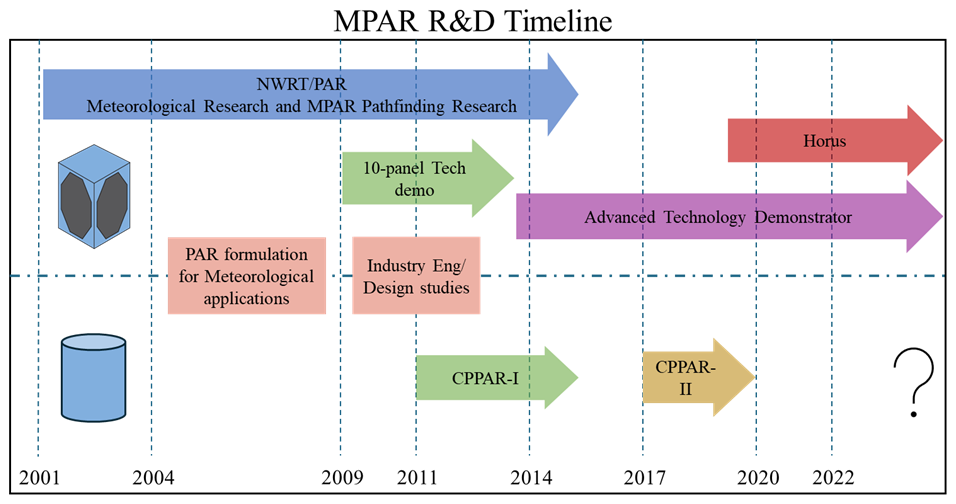
Figure 10Reconstructed MPAR research and development timeline based on Fig. 1 of NSSL Publications (2014).
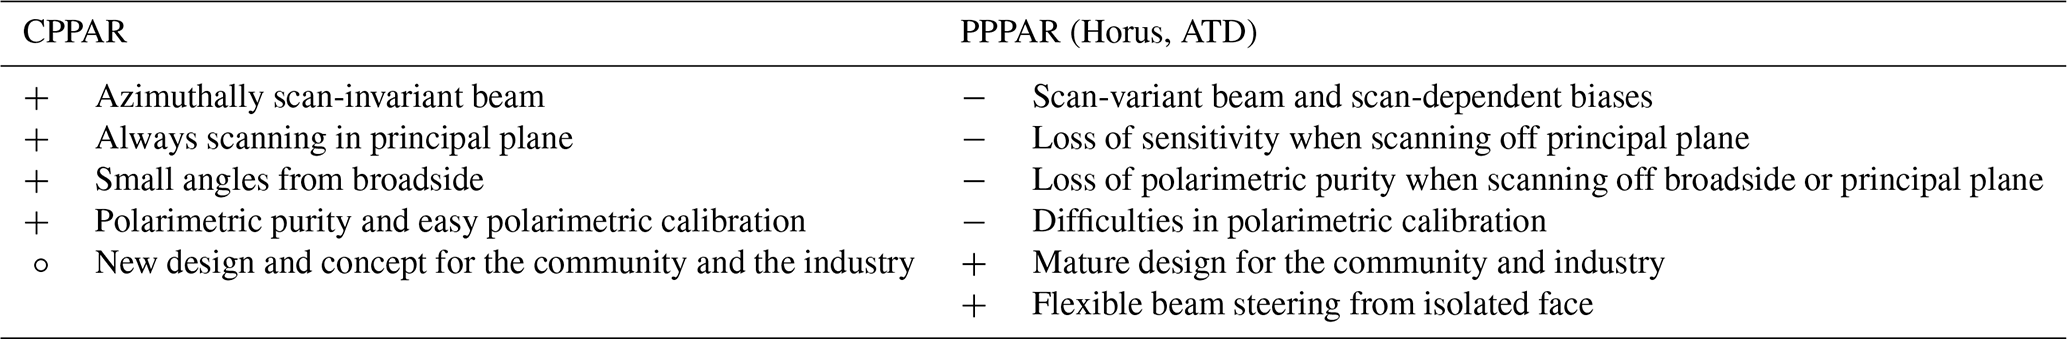
The discussions on the optimal configuration (e.g., planar vs. cylindrical) and/or limitations of 2D PPPARs have been well documented and presented over the years (Doviak et al., 2011; Ivić, 2023; Karimkashi and Zhang, 2015; Lei et al., 2013, 2015; NSSL Publications, 2014, 2020a, b, 2021; Zhang et al., 2009, 2011; Zrnic et al., 2011). The advantages and disadvantages of each configuration, based on those previous studies and the quantitative error analysis of weather measurements conducted in this study, are organized in Table 6. As analyzed in several previous studies and confirmed in Sect. 4, 2D PPPARs have inherent problems with (i) beam broadening, (ii) sensitivity loss, (iii) loss of polarization purity, and (iv) higher risk of beam mismatch when steering off broadside. These problems arise because the patterns of the elements embedded in the PPPAR vary from one to another, and their patterns are not the same, making it difficult to achieve high-performance PPPAR beams (e.g., polarization purity, matched dual-polar beams, low side lobes). Although all elements are designed identically in both configurations, resulting in the same isolated element patterns, the array antenna configuration causes active/embedded element patterns to be different due to the presence of surrounding elements. These active element patterns vary depending on the location of the element within the array (i.e., its electromagnetic environment). For example, the central element may have a symmetric pattern if appropriately designed, while elements at the sides or corners may have asymmetric patterns due to edge or corner effects. This variation occurs in the PPPAR but not in the CPPAR, which maintains symmetry – ensuring that all columns have the same electromagnetic environment and therefore the same embedded column patterns. These issues can be further assessed by beam-to-beam pattern characterization and weather measurements with multi-beams. Some of these problems can be corrected by calibration, such as phase coding or appropriate antenna tilt (Ivić, 2022, 2023), but the others can only be avoided/resolved through configuration considerations, antenna design, and optimal beamforming. For example, the performance degradation away from the broadside can only be mitigated by (i) avoiding steering at large angles away from the broadside; (ii) accurately characterizing embedded element patterns and optimally forming beams at each steering direction; (iii) performing beam-to-beam calibration for PPPARs; and (iv) using a 1D electronic scan PPPAR, where the main beam always remains in the principal plane, minimizing cross-coupling. While this study's analysis emphasized the off-broadside problem, as Horus only conducted RHI scans and CPPAR PPI, scanning off the principal plane can present an even greater challenge. Planar design is often chosen for many other applications because most do not require wide-angle scans or only require qualitative data, such as aircraft detection. However, this is not the case for meteorological applications, which require high-quality quantitative polarimetric measurements. Specifically, ρhv requires an error of less than ∼ 0.006.
Table 6The table lists the advantages (+), disadvantages (−), and neutral (∘) of each 2D PPAR configuration.
The CPPAR was chosen for the 2D PPAR to mitigate issues such as beam broadening, sensitivity loss, and polarization purity loss. The CPPAR always scans in the principal plane in azimuth with small angles in elevation, using the same physical principles as the 1D PPPAR and producing polarimetric data of comparable quality (as demonstrated in Li et al., 2021b). In addition, high-performance radiating elements have been designed, ideal arrangements were proposed, and beams were optimally formed for the CPPAR so that the mentioned creeping wave effect is not an issue (Golbon-Haghighi et al., 2021; Mirmozafari et al., 2017, 2019; Saeidi-Manesh et al., 2017a). There is still confusion and misunderstanding about interferences caused by surface/creeping waves in the CPPAR within the meteorological community (e.g., NSSL 2014, 2023). However, surface waves can exist in any configuration and should be considered and minimized. Additionally, it is easier to control the surface wave effects in the CPPAR due to its symmetry than in the PPPAR (e.g., Mirmozafari et al., 2017, 2019; Saeidi-Manesh et al., 2017a; Golbon-Haghighi et al., 2021). The CPPAR has produced high-quality polarimetric weather data, which have been quantitatively evaluated (Li et al., 2021b and this study). Although there were concerns regarding limitations of the CPPAR, such as interference or creeping waves, the analysis and demonstration of CPPAR measurements do not show these issues due to their minimal effect. This is because CPPAR beams were optimally formed from the active (embedded) element/column patterns using the multi-objective optimization so that the dual-polarization beams are well-matched and sidelobes are low. Although the creeping/surface effects appear in the active element patterns as ripples, the CPPAR beams formed from the active patterns have already taken these effects into account and therefore are almost the same for all the beams with high performance (see Figs. 4 and 5 of Zhang, 2022). The beam characteristics can be further improved using dipole antennas and/or larger sizes (Mirmozafari et al., 2019; Golbon-Haghighi et al., 2021).
Aperture efficiency is another aspect that has been computed and clarified. The same number of elements is required for both cylindrical and planar configurations to achieve the same pencil beam at 45° from the broadside (Zhang et al., 2011). In fact, power efficiency is generally better for cylindrical configurations because it forms beams in the principal plane and close to the broadside, avoiding significant scanning loss at wide angles that the PPPAR has to steer. The CPPAR does have limitations in commutating scans for maintaining the polarization purity and can have limited freedom compared to that of the planar, but this is the approach worth taking in the case of weather applications. Also, the CPPAR is relatively new to the community and industry. However, its feasibility is evidenced by CPPAR data and this study, making it a promising research project aimed at advancing future weather measurements.
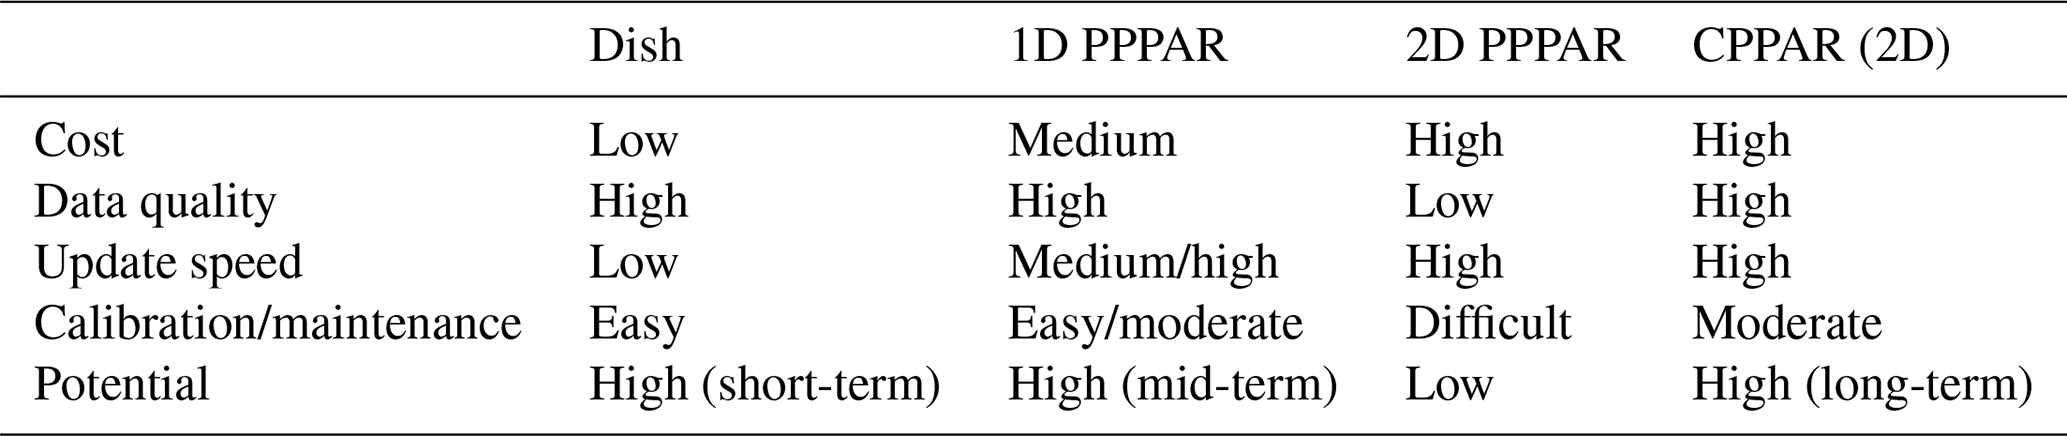
The cost-performance trade-offs among the current operational dish radars, 1D and 2D PPARs, are summarized in Table 7, taking into account previous studies and the results of this research. The potential of each system is assessed based on a combination of criteria including cost, data quality, update speed, and calibration. Dish-based operational radars provide relatively low-cost and high-quality weather measurements; however, they have a much slower update speed, which limits their potential, as the meteorological community is seeking faster update radars for the future. 1D PPPARs and CPPARs share the same physical principles (i.e., electronic scanning in the principal plane with small steering angles), with differences in cost and update speed/flexibility. It is generally agreed that 1D PPPARs are feasible and cost-effective for weather observation and 1D X-band PPPARs have already been deployed for operational use in the USA, Japan, and China. Considering that a four-faced 2D PPPAR is more expensive than a CPPAR and 1D PPPAR, and given the known shortcomings and beamforming and calibration difficulties in providing high-quality data in all directions, a rigorous quantification of its performance is necessary before pursuing the 2D PPPAR for weather measurement.
Table 7The advantageous and disadvantageous properties of dish radar, 1D PPPAR, 2D PPPAR, and CPPAR configurations for cost, data quality, update speed, calibration/maintenance methods, and potential criteria.
This study presents the first quantitative error analysis and comparison of 2D PPPAR and CPPAR data. It is shown that both PPPARs and CPPARs can provide accurate polarimetric weather measurements when their beams are close to the broadside. The PPPAR performance degrades as the beam steers away from the broadside. It is worth noting that there are several limitations of the study, including differences in range resolution between dish-based radars and PPARs, and problems with the absolute calibration of the polarimetric variables of the KTLX radar. In addition, the analysis and results presented in this paper may not fully capture all the challenges of 2D electronically scanning (E-Scan) PPPARs due to the limited data. Despite these limitations, and the unavailability of observations of the same event from co-located radars with identical scanning strategies, the study provides valuable insights by comparing weather measurements from two promising PPAR configurations: planar and cylindrical. The standard deviations and mean biases of the Horus and CPPAR measurements were calculated and compared with those of an operational WSR-88D radar. The standard deviations for both PPARs agree well with theoretical expectations and are within the NOAA/NWS RFR for the cases studied. The standard deviation from spatial samples shows smaller values compared to that from temporal samples, which may be attributed to post-processing filters used in Horus. Bias calculations relative to KTLX show 3.99 dB for ZH, 0.23 dB for ZDR, and −0.002 for ρhv for Horus and −1.29 dB for ZH, 0.04 dB for ZDR, and 0.009 for ρhv for the CPPAR.
The study highlights the inherent limitations and challenges of polarimetric calibration for 2D PPPARs, particularly due to the scanning loss, the loss of polarization purity, the mismatch of dual-polarimetric beams, and the difficulty in controlling the sidelobes when steering away from the broadside. It should be noted that 2D PPPARs will need to steer away from the principal planes and perform even wider angle scans. This study has only demonstrated the effect of limited off-broadside scans but has already revealed potential deficiencies. Accurate weather measurements with 2D PPPARs require an understanding of scanning loss issues and system performance in each beam steering direction in order to apply appropriate calibrations. Dual-scan comparisons and multi-pattern measurements have been effective in analyzing this aspect.
To avoid the inherent limitations of 2D PPPARs, the cylindrical configuration is another option, which has the greatest potential to enhance current operational radars by providing high-quality polarimetric data and rapid data updates. These advances are likely to improve weather forecasting and the understanding of rapidly changing weather phenomena, particularly severe storms.
CPPAR and Horus data used in this study are available upon request at data@arrc.ou.edu. The KTLX data were obtained from the National Centers for Environmental Information (https://www.ncdc.noaa.gov/nexradinv/displaygraphs.jsp?mm=08&dd=08&yyyy=2023&product=AAL2&filter=&id=KTLX, NOAA National Centers for Environmental Information, 2023).
All authors contributed to the conceptualization and refinement of the study. JH did the data processing and analysis and wrote the initial draft, while GZ and ZL helped revise it. ZL collected and processed the CPPAR data, and JH performed the error calculations and analysis.
The contact author has declared that none of the authors has any competing interests.
Any opinions, findings, conclusions, or recommendations expressed in this material are those of the authors and do not necessarily reflect the views of the U.S. Government.
Publisher's note: Copernicus Publications remains neutral with regard to jurisdictional claims made in the text, published maps, institutional affiliations, or any other geographical representation in this paper. While Copernicus Publications makes every effort to include appropriate place names, the final responsibility lies with the authors.
The authors would like to thank Berrien Moore III and the Horus engineering team for their assistance in providing the data. The authors also extend their gratitude to Jothiram Vivekanandan and an anonymous reviewer and the editor for their valuable comments that helped improve this paper.
This research has been supported by the National Oceanic and Atmospheric Administration (grant no. NA21OAR4320204) and the National Science Foundation (grant no. AGS-2136161).
This paper was edited by Gianfranco Vulpiani and reviewed by Jothiram Vivekanandan and one anonymous referee.
Baron, P., Kawashima, K., Kim, D.-K., Hanado, H., Kawamura, S., Maesaka, T., Nakagawa, K., Satoh, S., and Ushio, T.: Nowcasting multiparameter phased-array weather radar (MP-pawr) echoes of localized heavy precipitation using a 3D recurrent neural network trained with an adversarial technique, J. Atmos. Ocean. Tech., 40, 803–821, https://doi.org/10.1175/jtech-d-22-0109.1, 2023.
Bluestein, H. B., French, M. M., PopStefanija, I., Bluth, R. T., and Knorr, J. B.: A Mobile, phased-array Doppler radar for the study of severe convective storms, B. Am. Meteorol. Soc., 91, 579–600, https://doi.org/10.1175/2009bams2914.1, 2010.
Brookner, E.: Phased-array and radar astounding breakthroughs – An update, in: 2008 IEEE Radar Conference, Rome, Italy, 26–30 May 2008, IEEE, https://doi.org/10.1109/radar.2008.4720771, 2008.
Cho, J. Y.: A new radio frequency interference filter for weather radars, J. Atmos. Ocean. Tech., 34, 1393–1406, https://doi.org/10.1175/jtech-d-17-0028.1, 2017.
Dorsey, W. M., Scholnik, D. P., and Stumme, A.: Performance comparison of planar, cylindrical, and polygonalized phased arrays for surveillance and ubiquitous radar, IEEE T. Aero. Elec. Sys., 58, 596–602, https://doi.org/10.1109/taes.2021.3111789, 2022.
Doviak, R. J. and Zrnicì, D. S.: Doppler radar and weather observations, 2nd edn., Dover Publications, Mineola, NY, 592 pp., ISBN 0486450600, 2006.
Doviak, R. J., Lei, L., Zhang, G., Meier, J., and Curtis, C.: Comparing theory and measurements of cross-polar fields of a phased-array weather radar, IEEE Geosci. Remote S., 8, 1002–1006, https://doi.org/10.1109/lgrs.2011.2146753, 2011.
Fulton, C., Salazar, J. L., Zhang, Y., Zhang, G., Kelly, R., Meier, J., McCord, M., Schmidt, D., Byrd, A. D., Bhowmik, L. M., Karimkashi, S., Zrnic, D. S., Doviak, R. J., Zahrai, A., Yeary, M., and Palmer, R. D.: Cylindrical polarimetric phased array radar: Beamforming and calibration for weather applications, IEEE T. Geosci. Remote, 55, 2827–2841, https://doi.org/10.1109/tgrs.2017.2655023, 2017.
Fulton, C., Kenworthy, P., Lujan, J., Herndon, M., Garner, S., Thompson, D., and Yeary, M.: Mutual coupling-based calibration for the Horus Digital Phased Array Radar, in: 2022 IEEE International Symposium on Phased Array Systems & Technology (PAST), Waltham, MA, USA, 11–14 October 2022, IEEE, https://doi.org/10.1109/past49659.2022.9974962, 2022.
Golbon-Haghighi, M.-H., Saeidi-Manesh, H., Zhang, G., and Zhang, Y.: Pattern synthesis for the cylindrical polarimetric phased array radar (CPPAR), Progress In Electromagnetics Research M, 66, 87–98, https://doi.org/10.2528/pierm18011016, 2018.
Golbon-Haghighi, M.-H., Mirmozafari, M., Saeidi-Manesh, H., and Zhang, G.: Design of a cylindrical crossed dipole phased array antenna for weather surveillance radars, IEEE Open Journal of Antennas and Propagation, 2, 402–411, https://doi.org/10.1109/ojap.2021.3059471, 2021.
Heberling, W. and Frasier, S. J.: On the projection of polarimetric variables observed by a planar phased-array radar at X-band, IEEE T. Geosci. Remote, 59, 3891–3903, https://doi.org/10.1109/tgrs.2020.3023640, 2021.
Heinselman, P. L., Priegnitz, D. L., Manross, K. L., Smith, T. M., and Adams, R. W.: Rapid sampling of severe storms by the National Weather Radar Testbed Phased Array Radar, Weather Forecast., 23, 808–824, https://doi.org/10.1175/2008waf2007071.1, 2008.
Ivić, I., Curtis, C., Forren, E., Mendoza, R., Schvartzman, D., Torres, S., Wasielewski, D. J., and Zahrai, F. A.: An overview of weather calibration for the advanced technology demonstrator, in: 2019 IEEE International Symposium on Phased Array System & Technology (PAST), Waltham, MA, USA, 15–18 October 2019, IEEE, https://doi.org/10.1109/past43306.2019.9021053, 2019.
Ivić, I. R.: Quantification of polarimetric par effects on weather observables in the phase coded STSR Mode, IEEE T. Geosci. Remote, 60, 1–22, https://doi.org/10.1109/tgrs.2022.3146358, 2022.
Ivić, I. R.: Cross-coupling mitigation in polarimetric par via antenna tilt, J. Atmos. Ocean. Tech., 40, 587–604, https://doi.org/10.1175/jtech-d-22-0059.1, 2023.
Karimkashi, S. and Zhang, G.: A dual-polarized series-fed microstrip antenna array with very high polarization purity for weather measurements, IEEE T. Antenn. Propag., 61, 5315–5319, https://doi.org/10.1109/tap.2013.2273813, 2013.
Karimkashi, S. and Zhang, G.: Optimizing radiation patterns of a cylindrical polarimetric phased-array radar for multimissions, IEEE T. Geosci. Remote, 53, 2810–2818, https://doi.org/10.1109/tgrs.2014.2365362, 2015.
Kikuchi, H., Suezawa, T., Ushio, T., Takahashi, N., Hanado, H., Nakagawa, K., Osada, M., Maesaka, T., Iwanami, K., Yoshimi, K., Mizutani, F., Wada, M., and Hobara, Y.: Initial observations for precipitation cores with X-band dual Polarized phased array weather radar, IEEE T. Geosci. Remote, 58, 3657–3666, https://doi.org/10.1109/tgrs.2019.2959628, 2020.
Kim, D.-K., Suezawa, T., Mega, T., Kikuchi, H., Yoshikawa, E., Baron, P., and Ushio, T.: Improving precipitation nowcasting using a three-dimensional convolutional neural network model from multi parameter phased array weather radar observations, Atmos. Res., 262, 105774, https://doi.org/10.1016/j.atmosres.2021.105774, 2021.
Kollias, P., Palmer, R., Bodine, D., Adachi, T., Bluestein, H., Cho, J. Y., Griffin, C., Houser, J., Kirstetter, Pierre. E., Kumjian, M. R., Kurdzo, J. M., Lee, W. C., Luke, E. P., Nesbitt, S., Oue, M., Shapiro, A., Rowe, A., Salazar, J., Tanamachi, R., Tuftedal, K. S., Wang, X., Zrnić, D., and Treserras, B. P.: Science applications of phased array radars, B. Am. Meteorol. Soc., 103, E2370–E2390, https://doi.org/10.1175/bams-d-21-0173.1, 2022.
Kuster, C. M., Heinselman, P. L., and Schuur, T. J.: Rapid-update radar observations of downbursts occurring within an intense multicell thunderstorm on 14 June 2011, Weather Forecast., 31, 827–851, https://doi.org/10.1175/waf-d-15-0081.1, 2016.
Lei, L., Zhang, G., and Doviak, R. J.: Bias correction for polarimetric phased-array radar with idealized aperture and patch antenna elements, IEEE T. Geosci. Remote, 51, 473–486, https://doi.org/10.1109/tgrs.2012.2198070, 2013.
Lei, L., Zhang, G., Doviak, R. J., and Karimkashi, S.: Comparison of theoretical biases in estimating polarimetric properties of precipitation with weather radar using parabolic reflector, or planar and cylindrical arrays, IEEE T. Geosci. Remote, 53, 4313–4327, https://doi.org/10.1109/tgrs.2015.2395714, 2015.
Li, Z., Zhang, Y., Borowska, L., Ivić, I. R., Mirković, D., Perera, S., Zhang, G., and Zrnić, D. S.: Polarimetric Phased Array Weather Radar Data Quality Evaluation Through Combined Analysis, Simulation, and Measurements, IEEE Geosci. Remote S., 18, 1029–1033, https://doi.org/10.1109/LGRS.2020.2990334, 2021a.
Li, Z., Zhang, G., Golbon-Haghighi, M.-H., Saeidi-Manesh, H., Herndon, M., and Pan, H.: Initial observations with electronic and mechanical scans using a cylindrical polarimetric phased array radar, IEEE Geosci. Remote S., 18, 271–275, https://doi.org/10.1109/lgrs.2020.2971471, 2021b.
Logan, J. T., Dorsey, W. M., and Valenzi, J. A.: Modular all-metal Ultrawideband cylindrical array for multifunction operation, IEEE T. Antenn. Propag., 70, 9175–9183, https://doi.org/10.1109/tap.2022.3177504, 2022.
Mirmozafari, M., Zhang, G., Saeedi, S., and Doviak, R. J.: A dual linear polarization highly isolated crossed dipole antenna for MPAR application, IEEE Antenn. Wirel. Pr., 16, 1879–1882, https://doi.org/10.1109/lawp.2017.2684538, 2017.
Mirmozafari, M., Zhang, G., Fulton, C., and Doviak, R. J.: Dual-polarization antennas with high isolation and polarization purity: A review and comparison of cross-coupling mechanisms, IEEE Antenn. Prop. M., 61, 50–63, https://doi.org/10.1109/map.2018.2883032, 2019.
NOAA National Centers for Environmental Information: NEXRAD Level-II Radar Data, KTLX (Oklahoma City, OK), 8 August 2023, https://www.ncdc.noaa.gov/nexradinv/displaygraphs.jsp?mm=08&dd=08&yyyy=2023&product=AAL2&filter=&id=KTLX, last access: 7 July 2023.
NSSL Publications: Multi-function Phased Array Radar and Cylindrical Polarized Phased Array Radar Report to Congress, https://www.nssl.noaa.gov/publications/par_reports/FY14_MPAR_CPPAR_Congressional_Report.pdf (last access: 6 June 2024), 2014.
NSSL Publications: National Oceanic and Atmospheric Administration Multi-function Phased Array Radar Program: Dual Polarization Technology and Inter-agency Coordination Activities, https://www.nssl.noaa.gov/publications/par_reports/FY16_MPAR_Program_Report_to_Congress.pdf (last access: 6 June 2024), 2017.
NSSL Publications: Spectrum Efficient National Surveillance Radar (SENSR): OAR Feasibility Study Final Report, https://www.nssl.noaa.gov/publications/par_reports/SENSR Final Report v2.1.pdf (last access: 6 June 2024), 2020a.
NSSL Publications: Preliminary report on polarimetric calibration for the Advanced Technology Demonstrator, https://www.nssl.noaa.gov/publications/par_reports/Preliminary Report on Polarimetric Calibration for the Advanced Technology Demonstrator.pdf (last access: 6 June 2024), 2020b.
NSSL Publications: Advanced Technology Demonstrator System Testing Summary, https://www.nssl.noaa.gov/publications/par_reports/ATD-System-Testing-Summary-Report.pdf (last access: 6 June 2024), 2021.
NSSL Publications: Feasibility and Capability of a rotating Phased Array Radar, https://www.nssl.noaa.gov/publications/par_reports/ (last access: 6 June 2024), 2023.
Orzel, K. A. and Frasier, S. J.: Weather observation by an electronically scanned dual-polarization phase-Tilt Radar, IEEE T. Geosci. Remote, 56, 2722–2734, https://doi.org/10.1109/tgrs.2017.2782480, 2018.
Palmer, R., Bodine, D., Kollias, P., Schvartzman, D., Zrnić, D., Kirstetter, P., Zhang, G., Yu, T.-Y., Kumjian, M., Cheong, B., Collis, S., Frasier, S., Fulton, C., Hondl, K., Kurdzo, J., Ushio, T., Rowe, A., Salazar-CerrenŻo, J., Torres, S., Weber, M., and Yeary, M.: A Primer on Phased Array Radar Technology for the Atmospheric Sciences, B. Am. Meteorol. Soc., 103, E2391–E2416, https://doi.org/10.1175/BAMS-D-21-0172.1, 2022.
Palmer, R. D., Yeary, M. B., Schvartzman, D., Salazar-Cerreno, J. L., Fulton, C., McCord, M., Cheong, B., Bodine, D., Kirstetter, P., Sigmarsson, H. H., Yu, T.-Y., Zrnić, D., Kelley, R., Meier, J., and Herndon, M.: Horus–a fully digital polarimetric phased array radar for next-generation weather observations, IEEE Transactions on Radar Systems, 1, 96–117, https://doi.org/10.1109/trs.2023.3280033, 2023.
Saeidi-Manesh, H., Karimkashi, S., Zhang, G., and Doviak, R. J.: High-isolation low cross-polarization phased-array antenna for MPAR application, Radio Sci., 52, 1544–1557, https://doi.org/10.1002/2017rs006304, 2017a.
Saeidi-Manesh, H., Mirmozafari, M., and Zhang, G.: Low cross-polarisation high-isolation frequency scanning aperture coupled microstrip patch antenna array with matched dual-polarisation radiation patterns, Electron. Lett., 53, 901–902, https://doi.org/10.1049/el.2017.1282, 2017b.
Salazar Aquino, C. M., Cheong, B., and Palmer, R. D.: Progressive Pulse Compression: A novel technique for blind range recovery for solid-state radars, J. Atmos. Ocean. Tech., 38, 1599–1611, https://doi.org/10.1175/jtech-d-20-0164.1, 2021.
Siggia, A. D. and Passarelli Jr., R. E.: Gaussian model adaptive processing (GMAP) for improved ground clutter cancellation and moment calculation, Proceedings of ERAD, 67–73, 2004.
Stailey, J. E. and Hondl, K. D.: Multifunction phased array radar for aircraft and weather surveillance, P. IEEE, 104, 649–659, https://doi.org/10.1109/jproc.2015.2491179, 2016.
Ushio, T., Kim, D.-K., Baron, P., Wada, Y., Mega, T., Mizutani, F., Wada, M., Yoshikawa, E., Satoh, S., and Hanado, H.: Recent progress on the phased array weather radar at X Band, 2022 IEEE Radar Conference (RadarConf22), New York City, NY, USA, 21–25 March 2022, IEEE, https://doi.org/10.1109/radarconf2248738.2022.9764164, 2022.
Weber, M. E., Cho, J. Y. N., Herd, J. S., Flavin, J. M., Benner, W. E., and Torok, G. S.: The next-generation multimission U.S. Surveillance Radar Network, B. Am. Meteorol. Soc., 88, 1739–1751, 2007.
Weber, M., Hondl, K., Yussouf, N., Jung, Y., Stratman, D., Putnam, B., Wang, X., Schuur, T., Kuster, C., Wen, Y., Sun, J., Keeler, J., Ying, Z., Cho, J., Kurdzo, J., Torres, S., Curtis, C., Schvartzman, D., Boettcher, J., Nai, F., Thomas, H., Zrnić, D., Ivić, I., Mirković, D., Fulton, C., Salazar, J., Zhang, G., Palmer, R., Yeary, M., Cooley, K., Istok, M., and Vincent, M.: Towards the next generation operational meteorological radar, B. Am. Meteorol. Soc., 102, E1357–E1383, https://doi.org/10.1175/bams-d-20-0067.1, 2021.
Wilson, K. A., Heinselman, P. L., and Kuster, C. M.: Considerations for phased-array radar data use within the National Weather Service, Weather Forecast., 32, 1959–1965, https://doi.org/10.1175/waf-d-17-0084.1, 2017.
Wu, C., Liu, L., Liu, X., Li, G., and Chen, C.: Advances in Chinese dual-polarization and phased-array weather radars: Observational analysis of a supercell in southern China, J. Atmos. Ocean. Tech., 35, 1785–1806, https://doi.org/10.1175/jtech-d-17-0078.1, 2018.
Wurman, J. and Randall, M.: An inexpensive, mobile, rapid-scan radar, in: 30th Conference on Radar Meteorology, Munich, Germany, 19–24 July 2001, https://ams.confex.com/ams/30radar/techprogram/paper_21577.html (last access: 7 July 2024), 2001.
Yu, Z., Lan-qiang, B., Zhi-yong, M., Bing-hong, C., Cong-cong, T., and Pei-ling, F.: Rapid-scan and Polarimetric phased-array radar observations of a tornado in the Pearl River Estuary, J. Trop. Meteorol., 26, 81–86, https://doi.org/10.46267/j.1006-8775.2021.008, 2020.
Zhang, G.: Weather Radar Polarimetry, CRC Press, Boca Raton, FL., 304 pp., ISBN 1439869588, 2016.
Zhang, G.: Cylindrical polarimetric phased array radar for weather observations: A Review, in: 2022 IEEE Radar Conference (RadarConf22), New York City, NY, USA, 21–25 March 2022, IEEE, https://doi.org/10.1109/radarconf2248738.2022.9764328, 2022.
Zhang, G. and Doviak, R. J.: Spaced-antenna interferometry to measure crossbeam wind, shear, and turbulence: Theory and formulation, J. Atmos. Ocean. Tech., 24, 791–805, https://doi.org/10.1175/jtech2004.1, 2007.
Zhang, G., Doviak, R. J., Zrnic, D. S., Crain, J., Staiman, D., and Al-Rashid, Y.: Phased array radar polarimetry for weather sensing: A theoretical formulation for bias corrections, IEEE T. Geosc. Remote, 47, 3679–3689, https://doi.org/10.1109/tgrs.2009.2029332, 2009.
Zhang, G., Doviak, R. J., Zrnić, D. S., Palmer, R., Lei, L., and Al-Rashid, Y.: Polarimetric phased-array radar for weather measurement: A planar or cylindrical configuration?, J. Atmos. Ocean. Tech., 28, 63–73, https://doi.org/10.1175/2010jtecha1470.1, 2011.
Zrnic, D. S., Kimpel, J. F., Forsyth, D. E., Shapiro, A., Crain, G., Ferek, R., Heimmer, J., Benner, W., McNellis, F. T., and Vogt, R. J.: Agile-beam phased array radar for weather observations, B. Am. Meteorol. Soc., 88, 1753–1766, https://doi.org/10.1175/bams-88-11-1753, 2007.
Zrnic, D. S., Zhang, G., and Doviak, R. J.: Bias correction and Doppler measurement for Polarimetric phased-array radar, IEEE T. Geosci. Remote, 49, 843–853, https://doi.org/10.1109/tgrs.2010.2057436, 2011.
- Abstract
- Introduction
- Data and methods
- Comparison and validation of Horus and CPPAR data
- Analysis of the off-broadside dilemma of planar configuration
- Assessing advantages and disadvantages of planar and cylindrical configurations
- Summary
- Data availability
- Author contributions
- Competing interests
- Disclaimer
- Acknowledgements
- Financial support
- Review statement
- References