the Creative Commons Attribution 4.0 License.
the Creative Commons Attribution 4.0 License.
 | 20 Nov 2025
Assessment of ACE-MAESTRO v3.13 multi-wavelength stratospheric aerosol extinction measurements
Matthew Toohey
Adam Bourassa
C. Thomas McElroy
Christopher Sioris
Kaley A. Walker
The Measurement of Aerosol Extinction in the Stratosphere and Troposphere Retrieved by Occultation (MAESTRO) instrument on the SCISAT satellite provides aerosol extinction measurements in multiple solar wavelength bands. In this study, we evaluate the quality and utility of MAESTRO version 3.13 stratospheric aerosol extinction retrievals, from February 2004–February 2021, through comparison with measurements from other satellite instruments. Despite significant scatter in the MAESTRO data, we find that gridded median MAESTRO aerosol extinctions and stratospheric aerosol optical depth (SAOD) values are generally in good agreement with those from other instruments during volcanically quiescent periods. After volcanic eruptions and wildfire injections, gridded median MAESTRO extinction and SAOD are well correlated with other measurement sets but generally biased low by 40 %–80 %. The Ångström exponent (AE), which can provide information on aerosol particle size, is derived from the MAESTRO spectral extinction measurements in the lowermost stratosphere, showing perturbations after volcanic eruptions qualitatively similar to those from the Stratospheric Aerosol and Gas Experiment on the International Space Station (SAGE III/ISS) for the eruptions of Ambae (2018) and Ulawun (2019). Differences in AE anomalies after the 2019 extratropical Raikoke eruption may be due to the different spatiotemporal sampling of the two instruments. Furthermore, we introduce a method to adjust MAESTRO extinction data based on comparison with extinction measurements from SAGE III/ISS during the period from June 2017–February 2021, resulting in improved comparison during volcanically active periods. Our work suggests that empirical bias correction may enhance the utility of MAESTRO aerosol extinction data, which can make it a useful complement to existing satellite records, especially when multi-wavelength solar occultation data from other instruments are unavailable.
- Article
(7011 KB) - Full-text XML
-
Supplement
(993 KB) - BibTeX
- EndNote


Stratospheric aerosols play an important role in Earth's atmosphere and climate by modulating the Earth's radiation budget (Kremser et al., 2016, and references therein) and by influencing ozone depletion (Hofmann and Solomon, 1989; Solomon et al., 2022). Satellite measurements provide key information to characterize stratospheric aerosol properties and quantify their sources, which include volcanic eruptions (Bourassa et al., 2012; Vernier et al., 2011) and wildfires (Bourassa et al., 2019; Khaykin et al., 2020; Hirsch and Koren, 2021). Satellite observations are essential in quantifying stratospheric aerosol variability, its radiative forcing, and its impact on climate (Solomon et al., 2011; Friberg et al., 2018; McCormick et al., 1995; Stenchikov et al., 1998; Santer et al., 2014; Kloss et al., 2021).
Different techniques have been used to probe stratospheric aerosols from satellite observations. They include occultation (solar, stellar, or lunar), limb scattering, limb emission, and lidar backscatter measurements. Satellite instruments that use the occultation method primarily use the Sun as the source of light and measure the transmission of sunlight as the Sun is observed to rise and set from orbit (McCormick et al., 1979; Chu et al., 1989). They have provided an invaluable record of vertically resolved, high-quality, stable, long-term aerosol optical properties, primarily extinction coefficient in narrow spectral bands. This is possible because occultation measurements are self-calibrating and have negligible bias due to long-term instrument deterioration (Lumpe et al., 1997). The use of a bright light source also makes it possible to achieve high signal-to-noise ratios in a relatively small instrument field of view, allowing measurements with a high vertical resolution. This has made solar occultation measurements, particularly measurements from the Stratospheric Aerosol and Gas Experiment (SAGE) (McCormick, 1987; McCormick et al., 2020) series of instruments, the standard reference against which other measurements are compared for validation (Vernier et al., 2009; Rieger et al., 2019). Further, solar occultation measurements at different wavelengths can be used to estimate properties related to the aerosol particle size distribution (von Savigny and Hoffmann, 2020; Wrana et al., 2021, 2023). While there are significant challenges involved in retrieving particle size information (Knepp et al., 2024), it is an important observational target since it plays a key role in controlling the radiative (Lacis et al., 1992; Murphy et al., 2021) and chemical (e.g., Solomon et al., 1996) impacts of stratospheric aerosol.
Stratospheric aerosols have been observed from orbit since 1979 by different instruments using different techniques, each with its own spatiotemporal sampling pattern. Merged data products combine different data sets, with the aim of producing a coherent description of the temporal and spatial evolution of aerosol physical and optical properties. For example, Rieger et al. (2015) produced a merged aerosol data set based on SAGE II and OSIRIS aerosol extinction and applied a scaling to OSIRIS data in order to ensure consistency with the SAGE II record. The Global Space-based Stratospheric Aerosol Climatology (GloSSAC, Kovilakam et al., 2020; Thomason et al., 2018) provides climatologies of stratospheric aerosol properties spanning nearly 40 years. GloSSAC has been used in the construction of aerosol forcing fields for the Coupled Model Intercomparison Project (CMIP, Kovilakam et al., 2020; Rieger et al., 2020). Extinction coefficient measurements from the SAGE instruments are central to the construction of GloSSAC, including SAGE II and SAGE III on the International Space Station (SAGE III/ISS, SAGE III hereafter). In the September 2005–May 2017 gap between SAGE II and SAGE III measurements, the GloSSAC climatology is constructed primarily based on single wavelength aerosol extinction measurements from the Optical Spectrograph and InfraRed Imaging System (OSIRIS) (Rieger et al., 2019) and the Cloud-Aerosol Lidar and Infrared Pathfinder Satellite Observation (CALIPSO) (Kar et al., 2019) instruments. More recently, the Climate data Record of Stratospheric aerosols (CREST, Sofieva et al., 2024a) reconstruction merges aerosol data from six satellite instruments: SAGE II, GOMOS and SCIAMACHY on Envisat, OSIRIS, OMPS on Suomi-NPP, and SAGE III/ISS.
The Measurement of Aerosol Extinction in the Stratosphere and Troposphere Retrieved by Occultation (MAESTRO) is a multi-wavelength solar occultation instrument that was launched into orbit in 2003 (McElroy et al., 2007) and remains operational at present. While some instruments (POAM III, Randall et al., 2001; SAGE III-Meteor, Thomason et al., 2007; GOMOS, Robert et al., 2016; Sofieva et al., 2024b; SCIAMACHY, Malinina et al., 2018) have provided multi-spectral stratospheric aerosol measurements for portions of the period between SAGE II and SAGE III/ISS, MAESTRO is the only such instrument in orbit that provides continuous data during the gap, overlapping with both instruments. Aside from some specific cases related to volcanic eruptions (Sioris et al., 2010, 2016), aerosol data from MAESTRO have so far not been widely used in scientific studies or multi-instrument merged data products. This is due in large part to instrumental issues: MAESTRO has been affected by the gradual build-up of contamination of unknown origin (McElroy et al., 2007; Bernath, 2017), particularly affecting the measurements at the shorter end of the wavelength spectrum. Additionally, MAESTRO retrievals are complicated by uncertainty in measurement time stamps which impacts the estimation of tangent altitudes (McElroy et al., 2013). Nonetheless, considerable work has led to publicly available aerosol extinction retrievals from MAESTRO, which have the potential for important contribution to the long-term stratospheric aerosol record, especially during the gap between SAGE II and SAGE III. Since it overlaps with both SAGE II and SAGE III observations, comparisons with those data sets can reveal key features in MAESTRO data.
In this study, the aim is to evaluate the quality and utility of MAESTRO measurements of stratospheric aerosol extinction through comparison with measurements from other satellite instruments. Comparison with SAGE III is particularly important to assess biases in the MAESTRO data, given the high reliability of SAGE III observations. The overlap period from June 2017–February 2021 includes a number of significant aerosol events which have been well characterized in previous studies, including the 2017 Canadian wildfires (Torres et al., 2020), the 2018 Ambae eruption (Kloss et al., 2020), the 2019 Ulawun and Raikoke eruptions (Kloss et al., 2021), and the 2020 Australian wildfires (Khaykin et al., 2020). We also explore methods to reduce observed biases and scatter in MAESTRO aerosol extinction data, aiming to enhance their utility for scientific analysis and potential data merging.
2.1 Data
2.1.1 MAESTRO
MAESTRO (Bernath et al., 2005; McElroy et al., 2007) is a dual optical spectrophotometer that is part of the Atmospheric Chemistry Experiment (ACE) on the SCISAT satellite. It is a Canadian-led mission mainly supported by the Canadian Space Agency. It was launched into a low Earth circular orbit in August 2003 at an altitude of 650 km and an inclination of 74°. MAESTRO makes measurements primarily in the solar occultation mode within the latitude range 85° S–85° N. High vertical resolution (1–2 km) is achieved due to the large geometric weighting of the absorption in the tangent layer (the layer of the solar ray's closest approach to the Earth's surface) relative to that of the layers above (McElroy, 2007). MAESTRO makes up to 15 sunrise and 15 sunset measurements each day. SCISAT also carries another instrument which is a high-spectral-resolution Fourier transform spectrometer (FTS) operating in the infrared region from 2.2–13.3 µm. ACE-FTS measurements provide vertical profiles of temperature and many trace gases with a nominal vertical resolution of 3–4 km (Bernath, 2017). MAESTRO and ACE-FTS share a Sun-tracking mirror and thus make collocated observations.
The nominal MAESTRO wavelength range is 515–1015 nm for the visible spectrometer. There are absorption features in the MAESTRO spectral measurements due to ozone, nitrogen dioxide, water vapour, and oxygen, as well as contribution due to scattering by molecules and aerosols (McElroy et al., 2007). Profiles of ozone, nitrogen dioxide, and optical depth are retrieved from the MAESTRO transmission spectra as a function of altitude, using a modified differential optical absorption technique followed by an interactive Chahine relaxation inversion algorithm (McElroy et al., 2007, and references therein). Aerosol extinction is retrieved at wavelengths where interference from trace gas species is minimal, often at wavelengths that are approximately consistent across instruments. Pressure and temperature data used in the retrieval method are obtained from the ACE-FTS measurement from the same occultation, as the two instruments measure simultaneously. The MAESTRO version 3.13 retrieval algorithm uses ACE-FTS version 3.5/3.6 pressure and temperature profiles (Boone et al., 2013), which ends in February 2021. MAESTRO v4.5 retrievals of ozone and nitrogen dioxide have recently been compared to other data sets, showing mean differences of less than 10 % for ozone retrieved from visible radiation and a low bias for nitrogen dioxide, with the relative differences ranging from 8.5 %–43.4 % on average (Jeffery et al., 2025). Versions 4.0 and 4.5 of MAESTRO retrievals do not include aerosol extinction, making version 3.13 currently the latest extinction product available.
Aerosol extinction can be retrieved after accounting for molecular absorption and scattering. In this study, we use the MAESTRO version 3.13 aerosol extinction coefficients (525, 530, 560, 603, 675, 779, 875, 922, 995, and 1012 nm), which are reported every 0.32 km, from February 2004–February 2021. MAESTRO version 3.12 aerosol extinction was compared to AerGOM retrievals from the GOMOS instrument, suggesting that MAESTRO had a high bias through the stratosphere (Robert et al., 2016). We use the temperature profile information from the ACE-FTS to get the lapse rate tropopause height based on the World Meteorological Organization criteria (WMO, 1992). This allows the stratospheric component of the MAESTRO aerosol extinction coefficient profile to be separated for further analysis. Cirrus cloud screening is not performed as part of the MAESTRO data product.
2.1.2 SAGE II
The SAGE II (McCormick, 1987) instrument was launched in October 1984 on the Earth Radiation Budget Satellite (ERBS) and was operational until 2005. ERBS orbited the Earth at an altitude of 610 km and had an inclination of 57°, which caused its orbital plane to precess with respect to the Sun. SAGE II was a solar occultation instrument with seven channels centred at 385, 448, 453, 525, 600, 935, and 1020 nm. About 32 occultations were made per day until mid-2000, after which only 16 measurements were made per day. Depending on the season, it made measurements between approximately 80° N and 80° S. In this study, we use version 7 of the SAGE II data product (Damadeo et al., 2013), which includes cloud-screened aerosol extinctions at 385, 453, 525, and 1020 nm with vertical resolution of 1 km that are reported at every 0.5 km height interval.
2.1.3 OSIRIS
OSIRIS (Llewellyn et al., 2004) is a limb scatter instrument launched in 2001 on board the Odin satellite. Odin was placed in a Sun-synchronous orbit at an altitude of 600 km and an inclination of 98°. This orbit allows OSIRIS to sample latitude ranging from 82° S–82° N around the equinoxes while sampling is restricted to the summer hemisphere around the solstices. The OSIRIS spectrograph measures wavelengths between 284 and 810 nm with approximately 1.0 nm resolution, scanning at different tangent altitudes. These measurements provide vertical sampling every 2 km with a vertical resolution of approximately 1 km. Compared to occultation measurements, limb scattering provides a greater sampling frequency, which can reach up to 400 observations per day, depending on the time of the year and location. In this study, the latest version 7.2 of the OSIRIS aerosol is used, which provides cloud-screened vertical profiles of aerosol extinction coefficients at 750 nm (Rieger et al., 2019). OSIRIS aerosol extinction values generally show good agreement with SAGE III over most latitudes and altitudes; however, OSIRIS shows a high bias compared to SAGE III in the lowermost stratosphere of up to 50 % and a low bias of similar magnitude at high altitudes (Rieger et al., 2019).
2.1.4 SAGE III
SAGE III on ISS began its mission in June 2017 (McCormick et al., 2020). The ISS orbit's inclination is 51.6° and maintains an average altitude of around 400 km. SAGE III makes observations of stratospheric aerosol extinction coefficient at wavelengths ranging from 385–1550 nm with latitude coverage between roughly 70° S and 70° N. Similar to SAGE II, it uses the solar occultation technique to retrieve vertical profiles of multi-wavelength aerosol extinction coefficient (384, 449, 521, 602, 676, 756, 869, 1022, and 1544 nm). Here, we use version 5.2 of the SAGE III aerosol extinction vertical profile data (Kovilakam et al., 2023), which have a vertical resolution of about 1 km and are reported every 0.5 km. No cloud screening is included in the released SAGE III data. Validation of the SAGE III aerosol data through comparison with in situ optical particle counter measurements has shown generally good agreement with the in situ data, with some evidence for a low bias in SAGE III retrievals at wavelengths ≤1020 nm (Kalnajs and Deshler, 2022). A reported low bias in the 500–600 nm region that results in a 20 %–30 % underestimation in extinction has been reported previously (Solomon et al., 1996); correction methods (Knepp et al., 2024) to account for these biases have not been employed here.
2.2 Sampling coverage
Figure 1 depicts the frequency of observations as a function of latitude and time for MAESTRO, SAGE II, SAGE III, and OSIRIS measurements over a 2-year period. MAESTRO and SAGE III observations are from 2018 and 2019, whereas SAGE II and OSIRIS observations are from 2002 and 2003. The observations are binned monthly in 10° latitude intervals. It shows that MAESTRO samples the high latitudes well, with more than 100 occultation events in some bins poleward of 50°. However, its sampling over the tropics is quite sparse. On the other hand, SAGE III has denser coverage in the tropics, whereas high latitudes are not sampled regularly. This indicates that MAESTRO is particularly well suited to study high-latitude volcanic eruptions and wildfires, thus providing complementary information to SAGE II and SAGE III. OSIRIS, which makes limb scattering measurements, offers higher number of observations by nearly an order of magnitude, but due to the requirement of scattered sunlight and the pointing of the instrument, there are significant gaps over the extratropics around winter months.
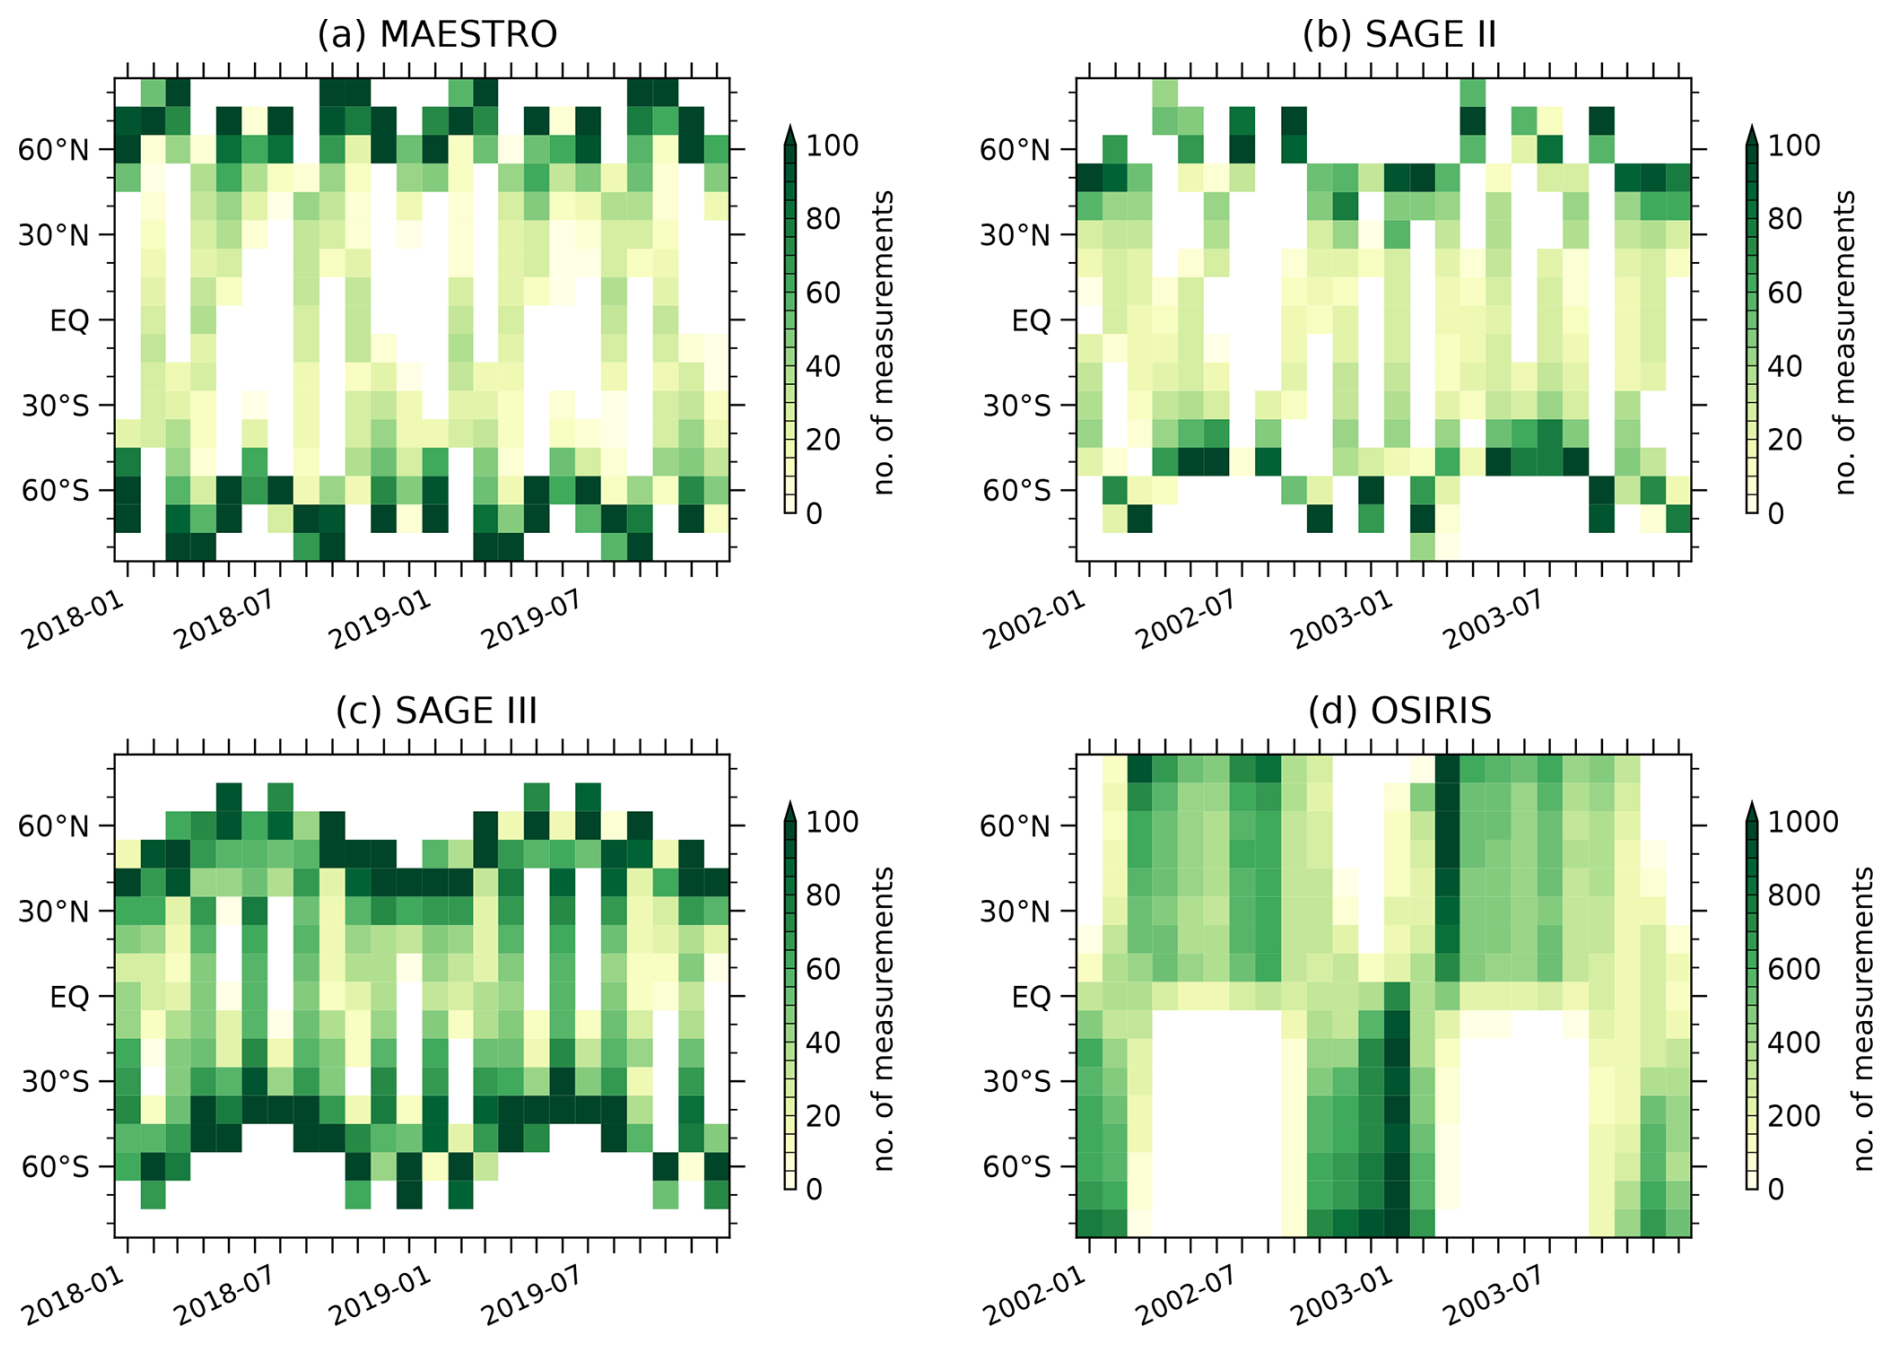
Figure 1Number of measurements per month and 10° latitude bin by the MAESTRO (a), SAGE II (b), SAGE III (c), and OSIRIS (d) instruments for a 2-year period. Note the different scale for the OSIRIS observations.
2.3 Methods
Data from each of the four instruments include profiles of geolocated aerosol extinction coefficient. For each profile, only measurements above the tropopause are considered. Apart from MAESTRO profiles, for which the tropopause information is determined from the collocated ACE-FTS measurements, tropopause information for other instruments is provided as part of the scientific data product. For SAGE II analysis, measurements from two wavelengths at 525 and 1020 nm are used. For MAESTRO and SAGE III analysis, six pairs of approximately matched wavelengths were selected, with wavelengths of 525, 603, 675, 779, 875, and 1012 nm for MAESTRO and 521, 602, 676, 756, 869, and 1022 nm for SAGE III. The small differences in wavelength values between the two instruments for each pair are not expected to produce significant differences in the extinction values: during background stratospheric conditions (relatively undisturbed by volcanic eruptions or wildfires), the difference in extinction is expected to be less than 6 % for the pair having the largest separation in wavelengths (779 and 756 nm) and less than 3 % for all other wavelength pairs. MAESTRO extinction is linearly interpolated to 0.5 km height intervals to match the vertical grid spacing of SAGE II and SAGE III data.
Stratospheric aerosol optical depth (SAOD) at each wavelength is calculated by vertically integrating the respective extinction profile from the tropopause upward to the top of the measured profile. Multi-wavelength measurements from the occultation instruments also allow for the calculation of the Ångström exponent (AE) at each altitude level. AE is a measure of the wavelength dependence of extinction and is related to the aerosol particle size distribution (Ångström, 1964; Eck et al., 1999; Malinina et al., 2019). It can be calculated by determining the slope of a linear fit between the logarithm of extinction coefficients (β) and the logarithm of wavelengths (λ) (Mironova et al., 2012), as shown in Eq. (1), where AE is denoted by α,
Extinction measurements at five wavelengths (e.g., 603, 675, 779, 875, and 1012 nm for MAESTRO) are used to calculate AE for MAESTRO and SAGE III, respectively, at each altitude of each profile, by performing an ordinary least squares regression of ln (β) on ln (λ): the slope of this regression is the Ångström exponent (e.g., Eck et al., 1999). Extinction at 525 nm is excluded from the MAESTRO AE calculation due to a non-monotonic bias structure with respect to SAGE III, and a notably weaker correlation with SAGE III compares to other wavelengths (see Sect. 3.1). For SAGE II, extinction coefficient measurements at only the two wavelengths are used.
Gridded products for aerosol extinction coefficient, SAOD, and AE are produced by binning measurements in regular temporal (monthly) and spatial (10° latitude) grids for each data set. This produces a product for each instrument as a function of time, altitude, latitude, and wavelength. To minimize the impact of outliers (see Sect. 3.1), we use the median of the measurements within each bin as an estimate of the distribution centre. Since some of the outlier values could be due to the presence of clouds in MAESTRO and SAGE III data sets (which are not screened for cloud contamination), this step also ensures that the impact of outliers arising from stratospheric clouds is minimized.
3.1 Extinction
Aerosol extinction from MAESTRO is compared to that from SAGE III over the June 2017–February 2021 period of overlap. A sample of coincident measurements are selected, with measured profiles considered to be coincident if they are within ±2° latitude, ±10° longitude, and ±24 h, following Rieger et al. (2019), resulting in 872 coincident profiles. The mean and median values of MAESTRO 779 nm and SAGE III 756 nm aerosol extinction are shown in Fig. 2a as an example. The mean values from the two instruments have qualitatively similar structure through the lower stratosphere, with MAESTRO showing a low bias compared to SAGE III below 27 km. The median values for both instruments are also relatively similar, with MAESTRO showing a low bias. Median values are generally smaller than the mean values, indicating the underlying distribution is right skewed. The standard deviation (SD) and a scaled median absolute deviation (MAD) are shown in Fig. 2b. The MAESTRO SD is generally smaller than the SAGE III SD, except between 13 and 15 km where the two are similar, and at 18 km where there is a spike in the MAESTRO SD. The MAD is scaled by the constant value 1.4826: in the case that the distribution is normal, this scaled MAD is quantitatively equivalent to the standard deviation. The MAESTRO MAD is smaller than the SAGE III MAD, with a smoother vertical structure. The significant difference between the SD and the scaled MAD shows that the distributions are not normal, which is not surprising given the sporadic cases of large values resulting from eruptions and wildfires. A similar analysis is performed for collocated measurements between June 2017 and July 2018 at latitudes equatorward of 40° in both hemispheres, representing “background” conditions when there was minimal perturbation of the stratospheric aerosol layer from eruptions or wildfires. This subset includes 135 collocated measurements. Here, we see that the MAESTRO mean extinction is biased high in the lower stratosphere (z<17 km) compared to SAGE III, by a factor of about 2–3, while the median is also biased low but by a much smaller amount. The sizeable difference between the MAESTRO mean and median is indicative of a strongly skewed distribution. During the background period, the SAGE III SD (Fig. 2d) is significantly smaller than over the full period (Fig. 2b). The MAESTRO SD during the background period is comparable to that of SAGE III for z>16 km but significantly larger in the lower stratosphere (z<16 km). This is indicative of a high level of scatter in the lower-stratosphere MAESTRO measurements, of a magnitude that is comparable to the natural variability of the aerosol field over the full overlap period. The MAESTRO MAD is very similar to the SAGE III values, suggesting that the large SD is largely reflective of outliers in the underlying MAESTRO data set.
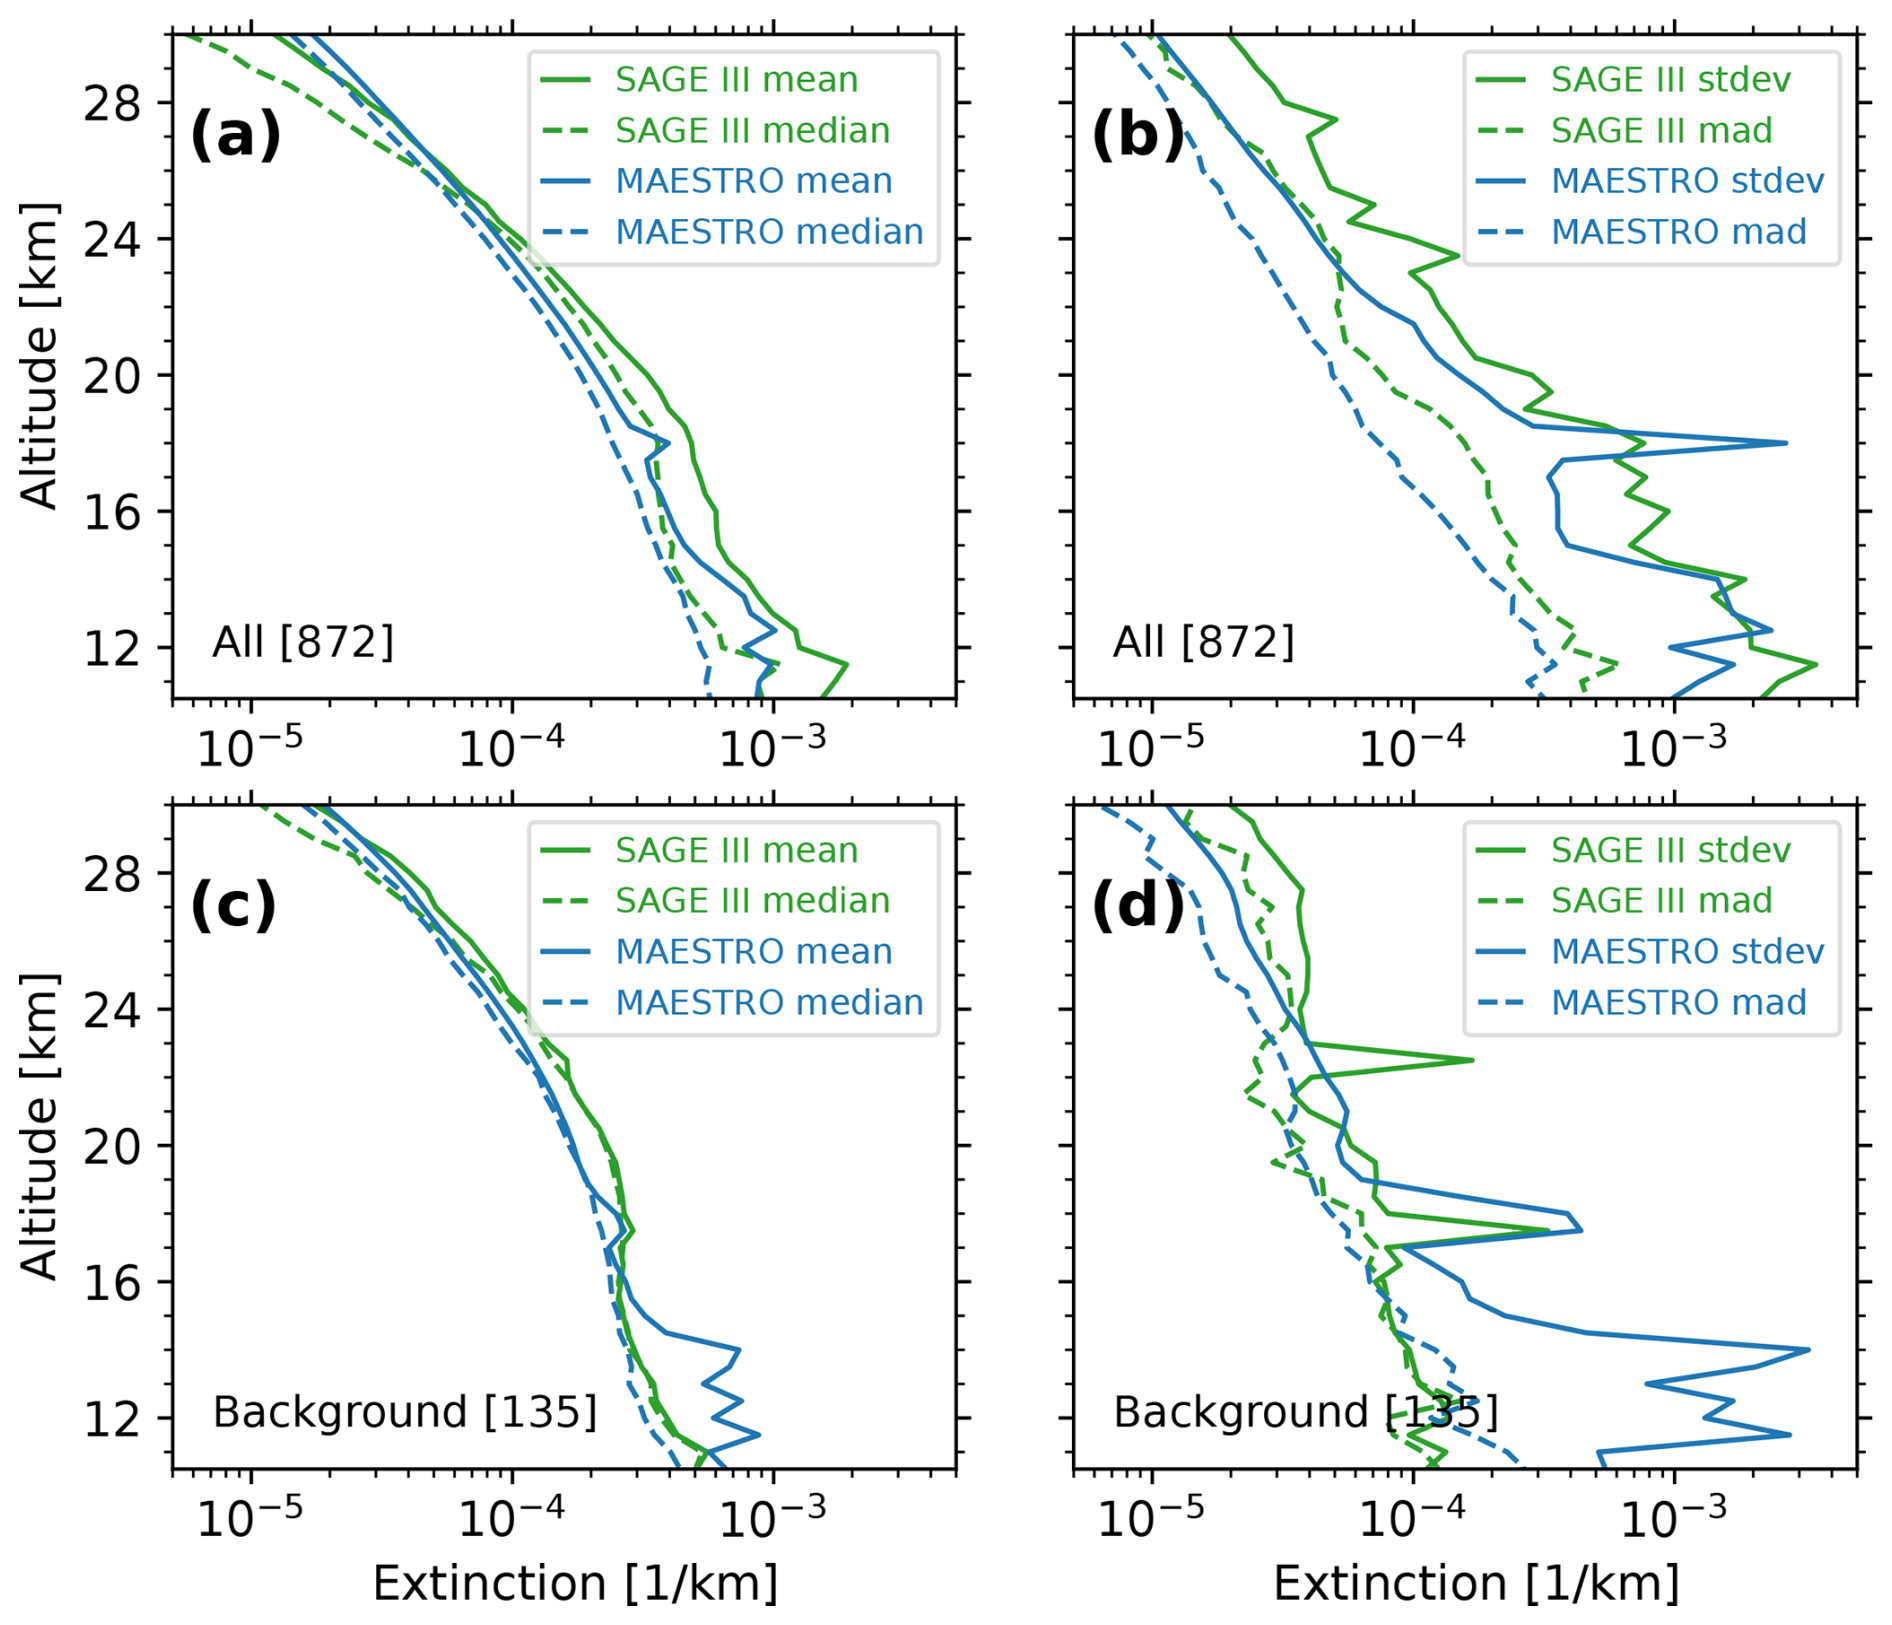
Figure 2Comparison of collocated MAESTRO 779 nm and SAGE III 756 nm aerosol extinction measurements. Panels (a) and (b) show mean, median, standard deviation, and a scaled median absolute deviation for the 872 collocated profiles between June 2017 and February 2021. Panels (c) and (d) show the same but for background conditions, with collocations from June 2017–July 2018 at latitudes southward of 40° N.
To reduce the impact of scatter in the MAESTRO raw extinction measurements, we focus hereafter mainly on the median of monthly and zonally binned values. Figure 3 shows the median and standard deviation of extinction coefficients from the SAGE II, OSIRIS, MAESTRO, and SAGE III gridded data at an altitude of 15.5 km in the midlatitudes of the Southern Hemisphere (SH) and Northern Hemisphere (NH). Although SAGE II measurements are available from 1985, only data starting from 1998 are shown when the impact of the 1991 Pinatubo eruption had mostly subsided. SAGE II extinction at 750 nm is derived by linearly interpolating 525 and 1020 nm extinction coefficients in a log extinction–log wavelength space. MAESTRO and SAGE III extinction coefficient values are shown at native 779 and 756 nm, respectively. Volcanic eruptions and wildfires are noticeable in the extinction coefficient time series in both hemispheres. There is a good degree of similarity between SAGE II, OSIRIS, and SAGE III measurements during data overlap periods. Even though the MAESTRO extinction coefficient time series exhibits more scatter, it shows variations qualitatively consistent with other measurements, including clear increases in extinction following major volcanic eruptions and wildfires. During quiescent periods, the magnitude of MAESTRO extinction coefficients matches well with that of the SAGE instruments and OSIRIS. However, MAESTRO underestimates peak extinction values after major volcanic eruptions and wildfires by a factor of 2 or more. For example, extinction from SAGE and OSIRIS is larger than MAESTRO following the 2019 Raikoke and 2019–2020 Australian wildfires even after accounting for the data variability as indicated by the standard deviation in Fig. 3. Despite that, the MAESTRO aerosol extinction coefficient measurements are correlated with that from the other instruments.
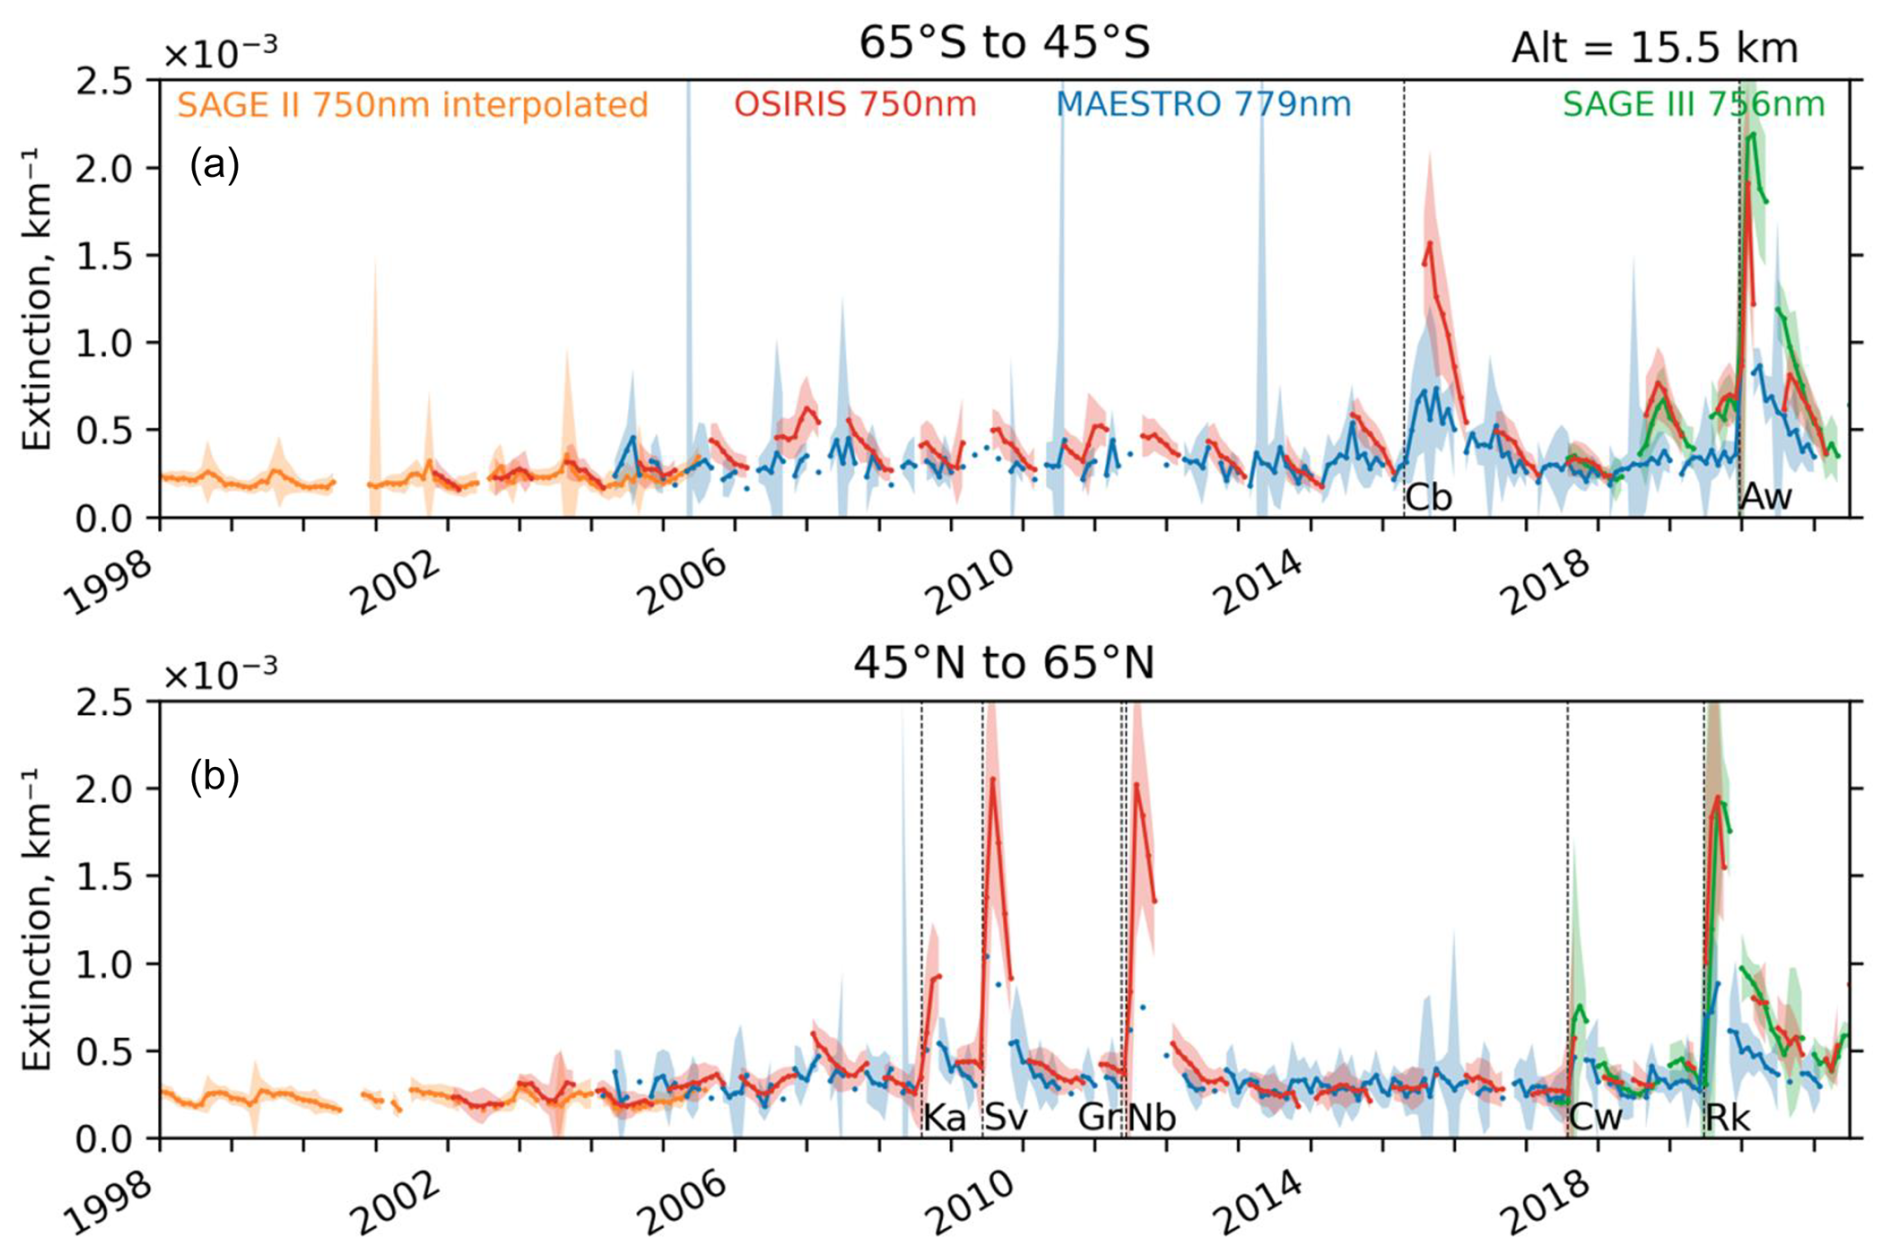
Figure 3Comparison of monthly zonal median extinction coefficients measured by SAGE II, OSIRIS, MAESTRO, and SAGE III at an altitude of 15.5 km in the midlatitudes of the (a) SH and (b) NH. Shaded area represents ±1 standard deviation. Data in two 10° latitude bins are combined to show the time series by calculating the average of the medians. Dotted vertical lines correspond to the time when notable volcanic eruptions or wildfires occurred within or near respective latitude ranges. They represent Calbuco (Cb, 41° S) and the Australian wildfires (Aw) in the SH and Kasatochi (Ka, 52° N), Sarychev (Sv, 48° N), Grímsvötn (Gr, 64° N), Nabro (Nb, 13° N), the Canadian wildfires (Cw), and Raikoke (Rk, 48° N) in the NH. Although Nabro was a tropical eruption, it is shown here because it impacted the high latitudes in the NH. Note the multiplicative factor of 10−3 (shown above y axis) used to get the extinction coefficients in units of km−1.
Figure 4 depicts the median of all extinction measurements made by MAESTRO and SAGE III averaged over their overlap period from June 2017–February 2021, plotted as a function of latitude and height. The start of this overlap period represents relatively clean background conditions, with the 2017 Canadian wildfires being the only major event that impacted stratospheric aerosol levels in the NH. But after mid-2018, a number of events such as Ambae, Ulawun, Raikoke, and the Australian wildfires of 2019/20 caused significant perturbations in the stratospheric aerosol levels. Figure 4 compares extinctions for four out of six common wavelength pairs between the two instruments. Results from both instruments show similar qualitative features of the time-averaged stratospheric aerosol distribution, with maximum values in the lower stratosphere of each hemisphere and decreasing extinction above ∼20 km. MAESTRO extinction at 525 nm shows a pronounced peak between altitudes of 10–13 km in the extratropics of both hemispheres. For other wavelengths, the peak values occur at lower altitudes and decrease gradually with height. For SAGE III, however, the peak extinction values in tropics and midlatitudes occur a few kilometres above the tropopause before they start to decrease with height. The percentage difference plot (Fig. 4, third column) highlights the high bias in MAESTRO extinction at 525 nm around 12 km, and the resulting vertical profile of MAESTRO bias at 525 nm is non-monotonic compared to other wavelengths. Currently, it is not known what causes this unique feature at this wavelength, but it is absent at the other five wavelengths. The figure also shows that MAESTRO extinction at shorter wavelengths has a low bias of 40 %–80 % compared to SAGE III nearly everywhere in the lower stratosphere except right above the tropical tropopause region. The correlation between the two measurement sets (Fig. 4, fourth column) is mostly greater than 0.6 in this broad region but is notably weaker for 525 nm than for the other wavelengths.
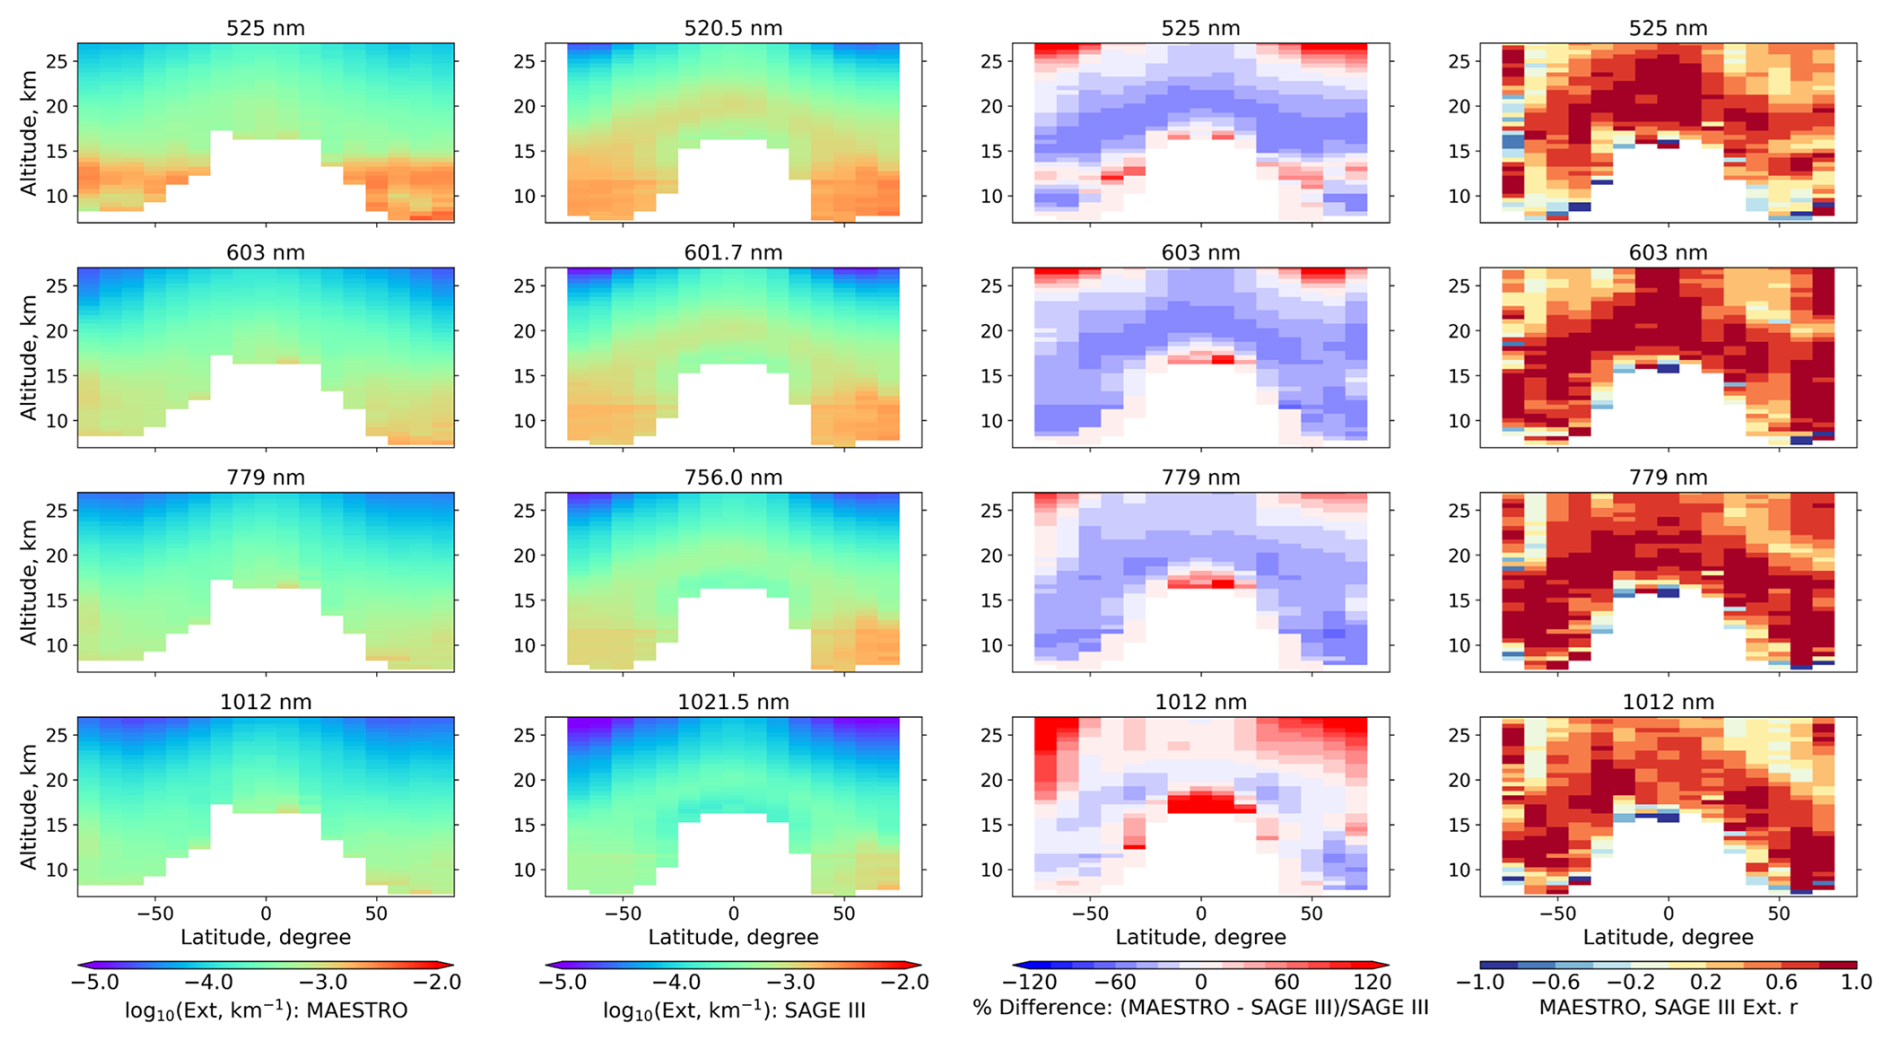
Figure 4Median extinction coefficient from the full MAESTRO (first column) and SAGE III (second column) data sets at four different wavelengths during their overlap period from June 2017–February 2021, shown as a function of altitude and latitude. The data are binned in 10° latitude bins. The third column shows the percentage difference (MAESTRO – SAGE III)SAGE III in extinction coefficients compiled from the two instrument data sets. The fourth column shows Pearson's correlation coefficients between MAESTRO and SAGE III extinction coefficients.
3.2 SAOD
Figure 5 shows monthly median SAOD derived from the MAESTRO and SAGE III extinctions as a function of latitude and time at three wavelengths. Due to its orbital characteristics, as was also seen in Fig. 1, MAESTRO has large data gaps in the tropics and is better suited for investigating extratropical aerosol perturbations. Figure 5 shows the temporal evolution of zonal mean SAOD during MAESTRO's overlap period with SAGE III – a period that includes the 2017 Canadian wildfires, the 2019 Raikoke eruption, and the 2020 Australian wildfires as the three largest extratropical events. Signals from these three events and the two tropical eruptions of Ambae and Ulawun are evident in SAGE III SAOD data. The three extratropical events are also evident in MAESTRO SAOD, which shows strong and persistent enhancements for Raikoke and the Australian wildfires poleward of 50°, a region which is not well sampled by SAGE III. It is also evident that the peak in SAOD values from MAESTRO for all wavelengths is lower than those from SAGE III at corresponding wavelengths. However, there is a general agreement in SAOD magnitude between the two sets of measurements during quiescent periods, despite the larger scatter in MAESTRO data. Pearson's correlation coefficient between 779 nm MAESTRO and 756 SAGE III SAOD over the set of months and latitude bins where both instruments have measurements is 0.83, and the root mean square difference is 0.00367, which corresponds to a relative underestimation of 32 % by MAESTRO.
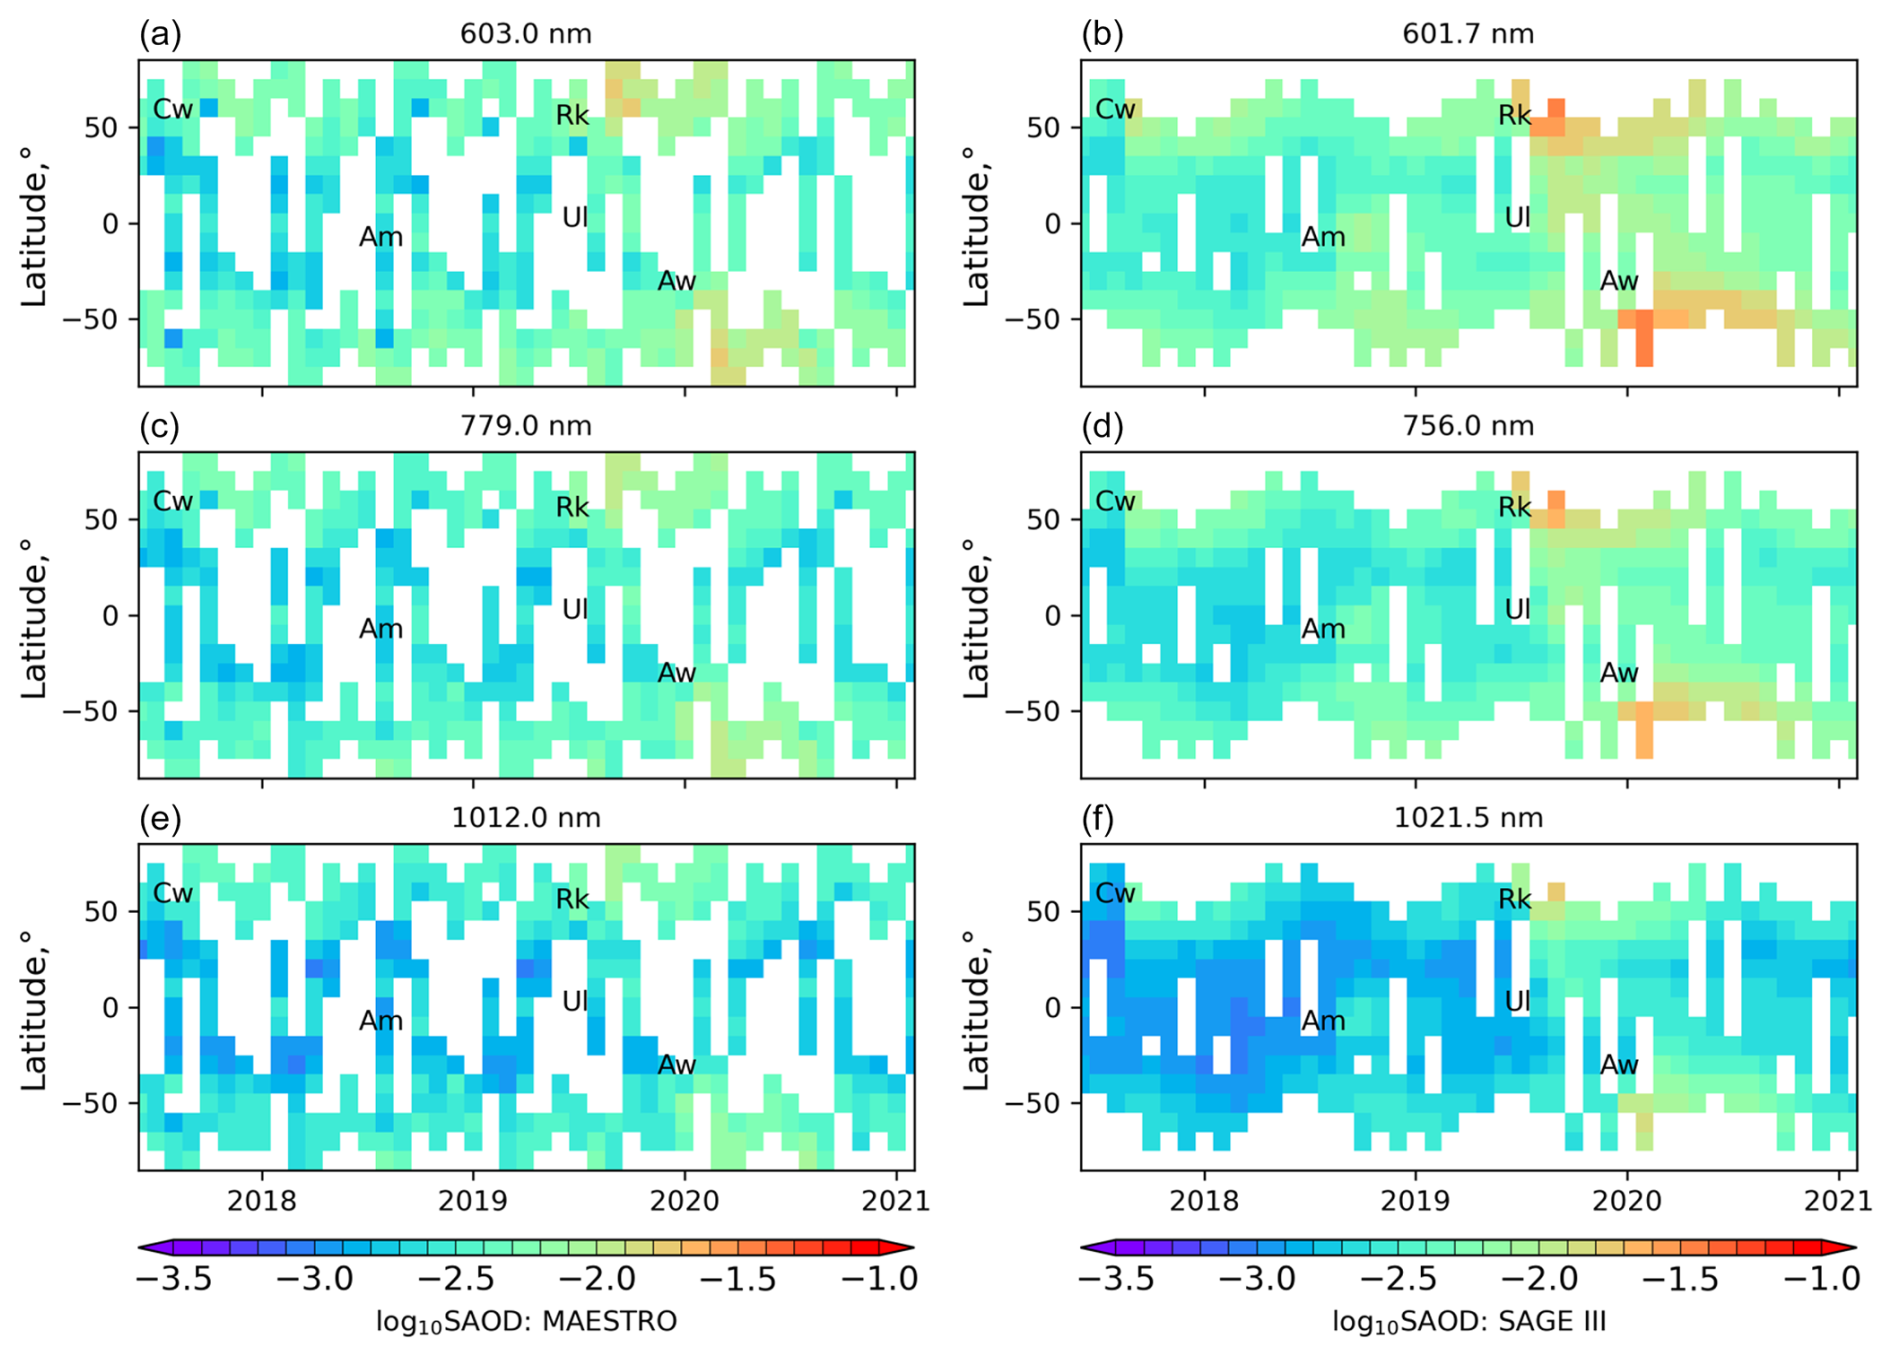
Figure 5Monthly median SAOD derived from MAESTRO (a, c, e) and SAGE III (b, d, f) extinctions at three different wavelengths as a function of latitude and time. Labels Cw, Am, Rk, Ul, and Aw mark the latitude and dates of the Canadian wildfires; the Ambae, Raikoke, and Ulawun eruptions; and the Australian wildfires, respectively.
3.3 Ångström exponent
One of the major advantages of satellite-based solar occultation instruments is that they can provide measurement of aerosol extinction at multiple wavelengths. The AE, which characterizes the spectral variation of aerosol extinction, reflects valuable information about aerosols including the particle size distribution and particle composition (Malinina et al., 2019; Schuster et al., 2006). The AE or related metrics based on ratios of extinction at different wavelengths are often used to estimate parameters of the underlying size distribution. This typically assumes a fixed aerosol composition: changes in the sulfate and water content of aerosols appear to have little impact on such estimates, while the presence of wildfire smoke particles will lead to larger errors (Knepp et al., 2024). As aerosol content of the stratosphere varies with time or location, we expect the aerosol extinction to vary simultaneously for all wavelengths, by different amounts corresponding to the aerosol properties. As a result, measurements with a high signal-to-noise ratio should show strong correlation between wavelengths: for example, the correlation of SAGE III extinction measurements is greater than 0.9 for all wavelength pairs in the stratosphere (Fig. S2 in the Supplement). Figure 6 illustrates the spectral correlation of the MAESTRO gridded median extinctions over the full time range. It shows Spearman's correlation coefficient (ρ) between 603 nm and four other wavelengths as a function of altitude and latitude. The correlation is above 0.7 for all latitudes and heights between extinctions at 603 and 675 nm. The correlation usually decreases as the wavelength separation gets larger. All four wavelength pairs shown in Fig. 6 have higher correlation in a region 3–10 km from the tropopause and lower correlation above this region. This suggests that the confidence in calculated AE values will be higher in this region of the lower stratosphere. Furthermore, even though spectral correlation between wavelengths that are close to each other is reasonably high, they span a relatively small range in the wavelength space such that even minor uncertainty in the measurement of extinction at any wavelength can lead to large uncertainty in AE values.
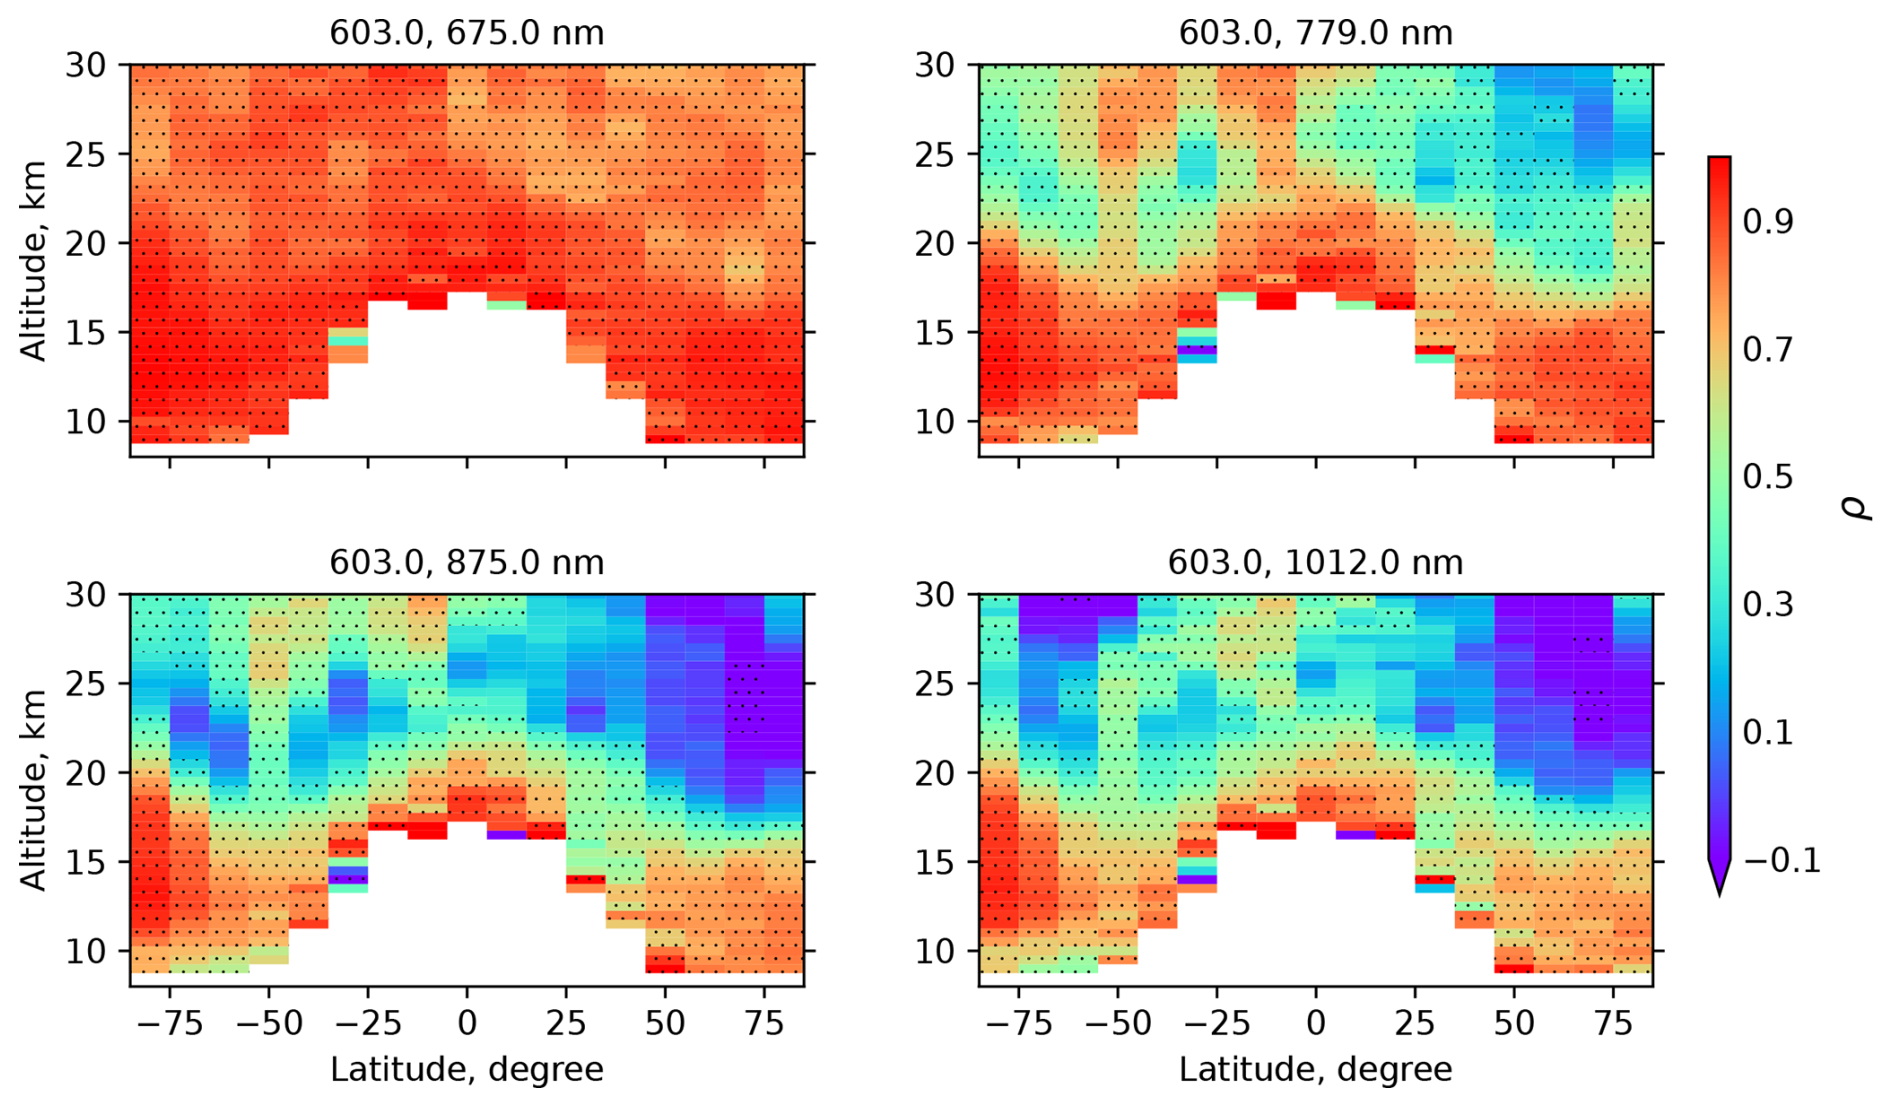
Figure 6Spearman's correlation coefficient of MAESTRO extinction coefficients between 603 nm and four other wavelengths. The four panels represent different wavelength pairs as indicated by the values on the top of each panel. Dots represent regions where the correlation is significant at 99 % confidence level.
Time series of AE in the lower stratosphere based on extinction measurements from MAESTRO and SAGE III are shown in Fig. 7. We show the AE at 12 km in the lowermost stratosphere, where correlations are typically strongest between MAESTRO wavelengths (Fig. 6) and where aerosol perturbations from the moderate eruptions and wildfires are most pronounced. On average, MAESTRO AE has a low bias of magnitude around 1 compared to SAGE III. Despite large variability, MAESTRO shows positive perturbations in AE values in the SH middle-to-high latitudes following the tropical Ambae and Ulawun eruptions, in agreement with the SAGE III results. In the NH, MAESTRO AE also shows increases in the high latitudes after the Canadian wildfires and the Raikoke eruption – in both cases in apparent contrast to the SAGE III results, which show apparent decreases in AE immediately after these aerosol events. The SAGE III AE decrease after Raikoke has been interpreted as signalling an increase in the particle size after this eruption, setting it in contrast to other recent eruptions which produce positive AE anomalies suggesting particle size decreases (Wrana et al., 2023; Thomason et al., 2021). We note that in the first ∼6 months after the Raikoke eruption, SAGE III measurements are almost entirely equatorward of 50° N, while MAESTRO observations are mostly limited to poleward of 50° N, which may explain the apparent inconsistency in AE results from the two instruments.
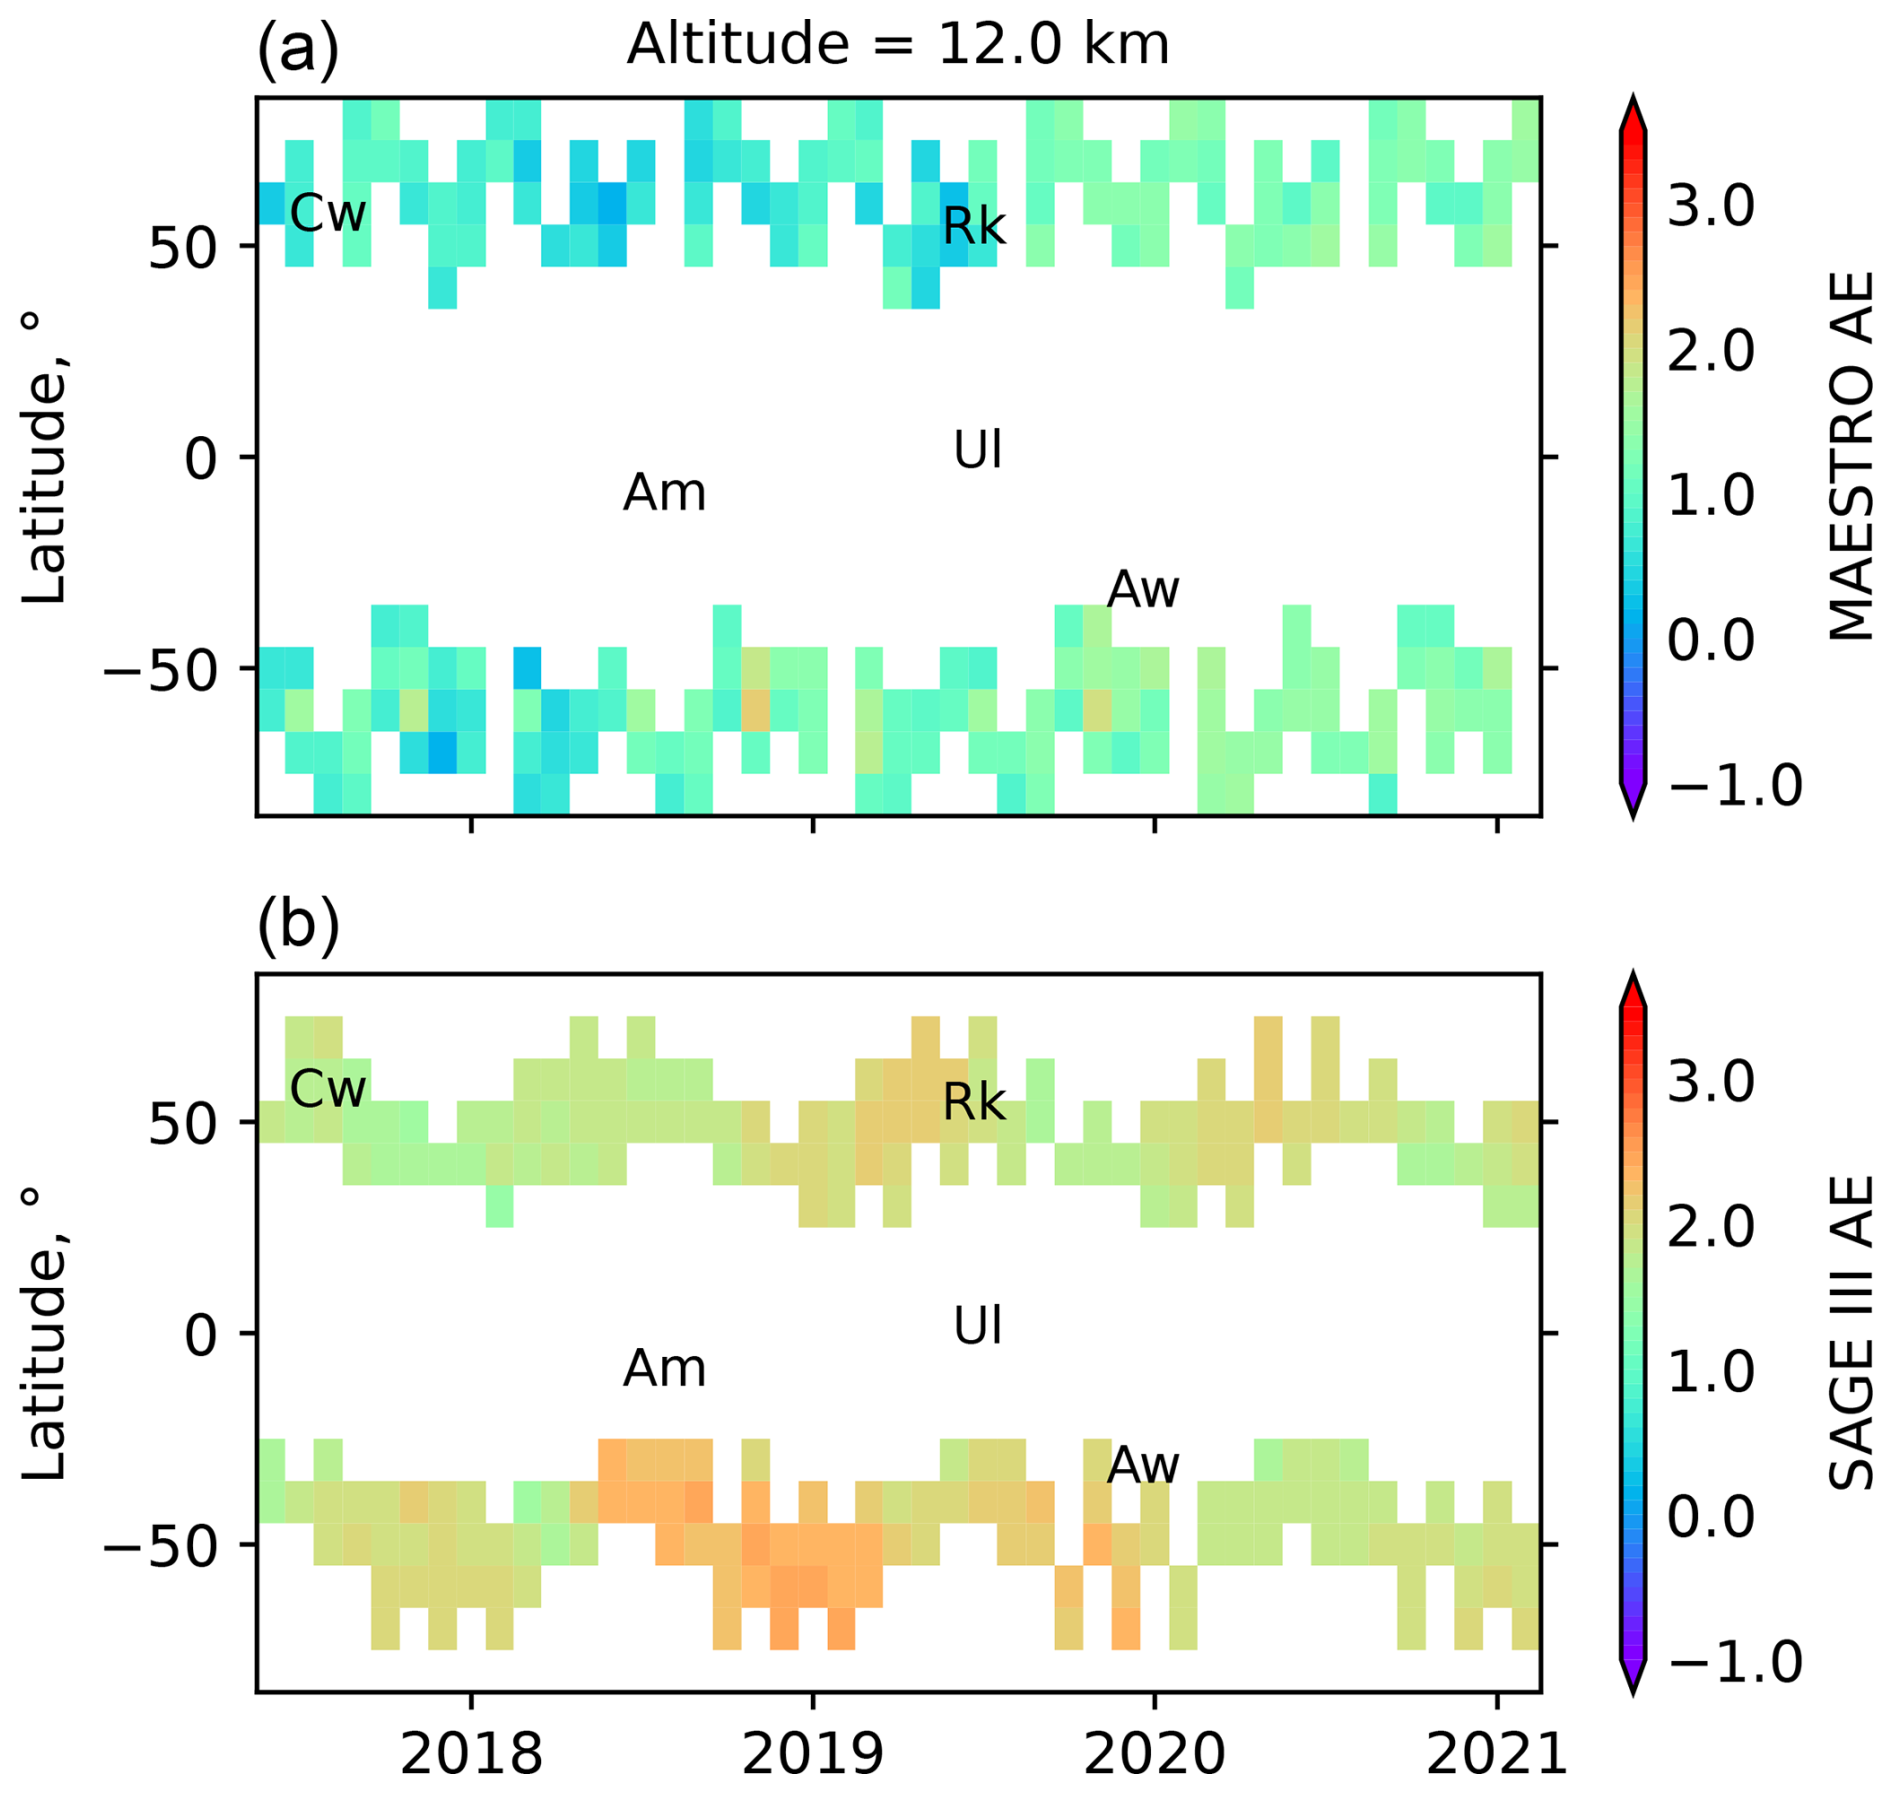
Figure 7Monthly median AE at an altitude of 12 km derived from MAESTRO (a) and SAGE III (b) extinctions plotted as a function of latitude and time. Labels Cw, Am, Rk, Ul, and Aw represent the Canadian wildfires; the Ambae, Raikoke, and Ulawun eruptions; and the Australian wildfires, respectively.
While the MAESTRO aerosol extinction data contain significant variability, results from the previous section suggest that with sufficient sampling and use of robust statistics like median values, the data are reasonably correlated with the highly reliable measurements from SAGE III, which suggests that MAESTRO data contain useful information. In this section, we explore two potential methods that can lower the observed biases and noise in MAESTRO extinction measurements. Details about these two approaches are provided in the following discussion.
4.1 MAESTRO extinction tuning
To account for the wavelength-dependent bias in MAESTRO extinction measurements (Sect. 3.1), a “tuning” approach based on comparisons with the SAGE III measurements is implemented. Empirical correction factors are constructed to remove observed biases from MAESTRO measurements based on the observed relationship between MAESTRO and SAGE III binned median extinction data. Similar scaling procedures have been used to improve agreement between OSIRIS and SAGE extinction values (Rieger et al., 2015). For each wavelength and at every altitude bin, the MAESTRO and SAGE III data are related using a power-law function of the form y=axb, using a non-linear least squares approach, where a and b represent the scaling and exponent parameters, and x and y represent SAGE III and MAESTRO aerosol extinctions, respectively. Since extinction measurements can span orders of magnitude, using a power-law fit (or equivalently a linear fit in log space) helps ensure a fit that works for the full range of data – a linear fit tends to be heavily weighted by the largest extinction values. Tuned MAESTRO extinction coefficients are then computed by inverting the power-law relation. This correction method is applied for the entire MAESTRO extinction measurements, and SAOD and AE values are re-calculated using adjusted values.
SAGE III instead of SAGE II was picked as the benchmark because the overlap between SAGE III and MAESTRO covers nearly 4 years that include both volcanically quiescent and active periods, and therefore the extinction values span a relatively large range. Extinction coefficients from the entire overlap period between MAESTRO and SAGE III are compared using a scatterplot in log scale for each altitude and at each of the six common wavelength pairs. For each month and 10° latitude bin where both instruments have at least 10 measured values, we compare the median value of each instrument's measurements. The two panels in Fig. 8 show example scatterplots of median extinction coefficients at two different wavelengths and at two different altitude levels. The comparison seen in Fig. 8a has high correlation (0.87), and the majority of data points lie close to the regression line. This indicates that the two parameters from the power-law fit can correct the bias in MAESTRO extinctions reasonably well. On the other hand, the Fig. 8b represents an example (correlation 0.45) that is challenging for the correction approach. For this particular latitude and altitude, the overall scatter is larger, most likely a result of larger random error in the MAESTRO extinction data at this wavelength and altitude. There is also a subset of data with small SAGE III values and relatively large MAESTRO values, which notably affects the best fit line away from the slope of the majority population of points. A similar analysis was performed for each of the six common wavelengths and at every altitude bin. This results in two power-law fit parameters and the correlation coefficient as a function of altitude for each wavelength, which is shown in Fig. 9. Correlations are greater than 0.7, except for an altitude range of 16–19 km at longer wavelengths, where they are on the order of 0.5–0.6. The parameters are relatively uniform with altitude and have close similarity for adjacent wavelengths.
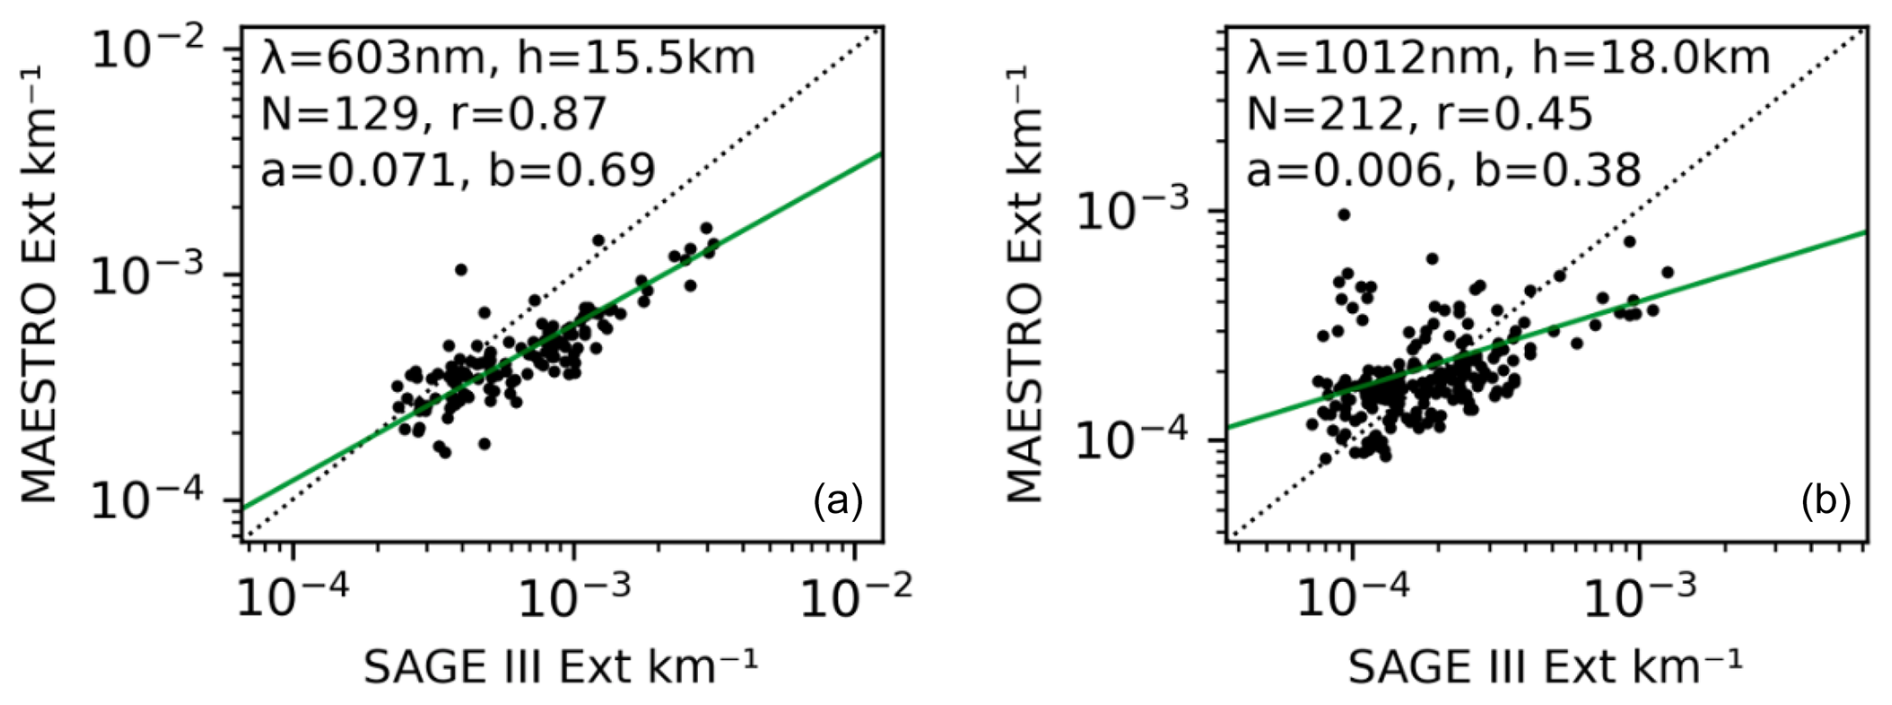
Figure 8Scatterplot in log scale showing the MAESTRO and SAGE III extinction coefficients at 603 nm and an altitude of 15.5 km (a) and at 1012 nm and an altitude of 18.0 km (b). Each point represents the median extinction value for each instrument within a 10° latitude bin and for a single month, where and when both instruments have measurements. Number of data points and Pearson's correlation coefficient are also shown. Green line represents the power-law regression line whose scaling and exponent parameters are given by “a” and “b”, respectively. The dotted black line is the one-to-one line.
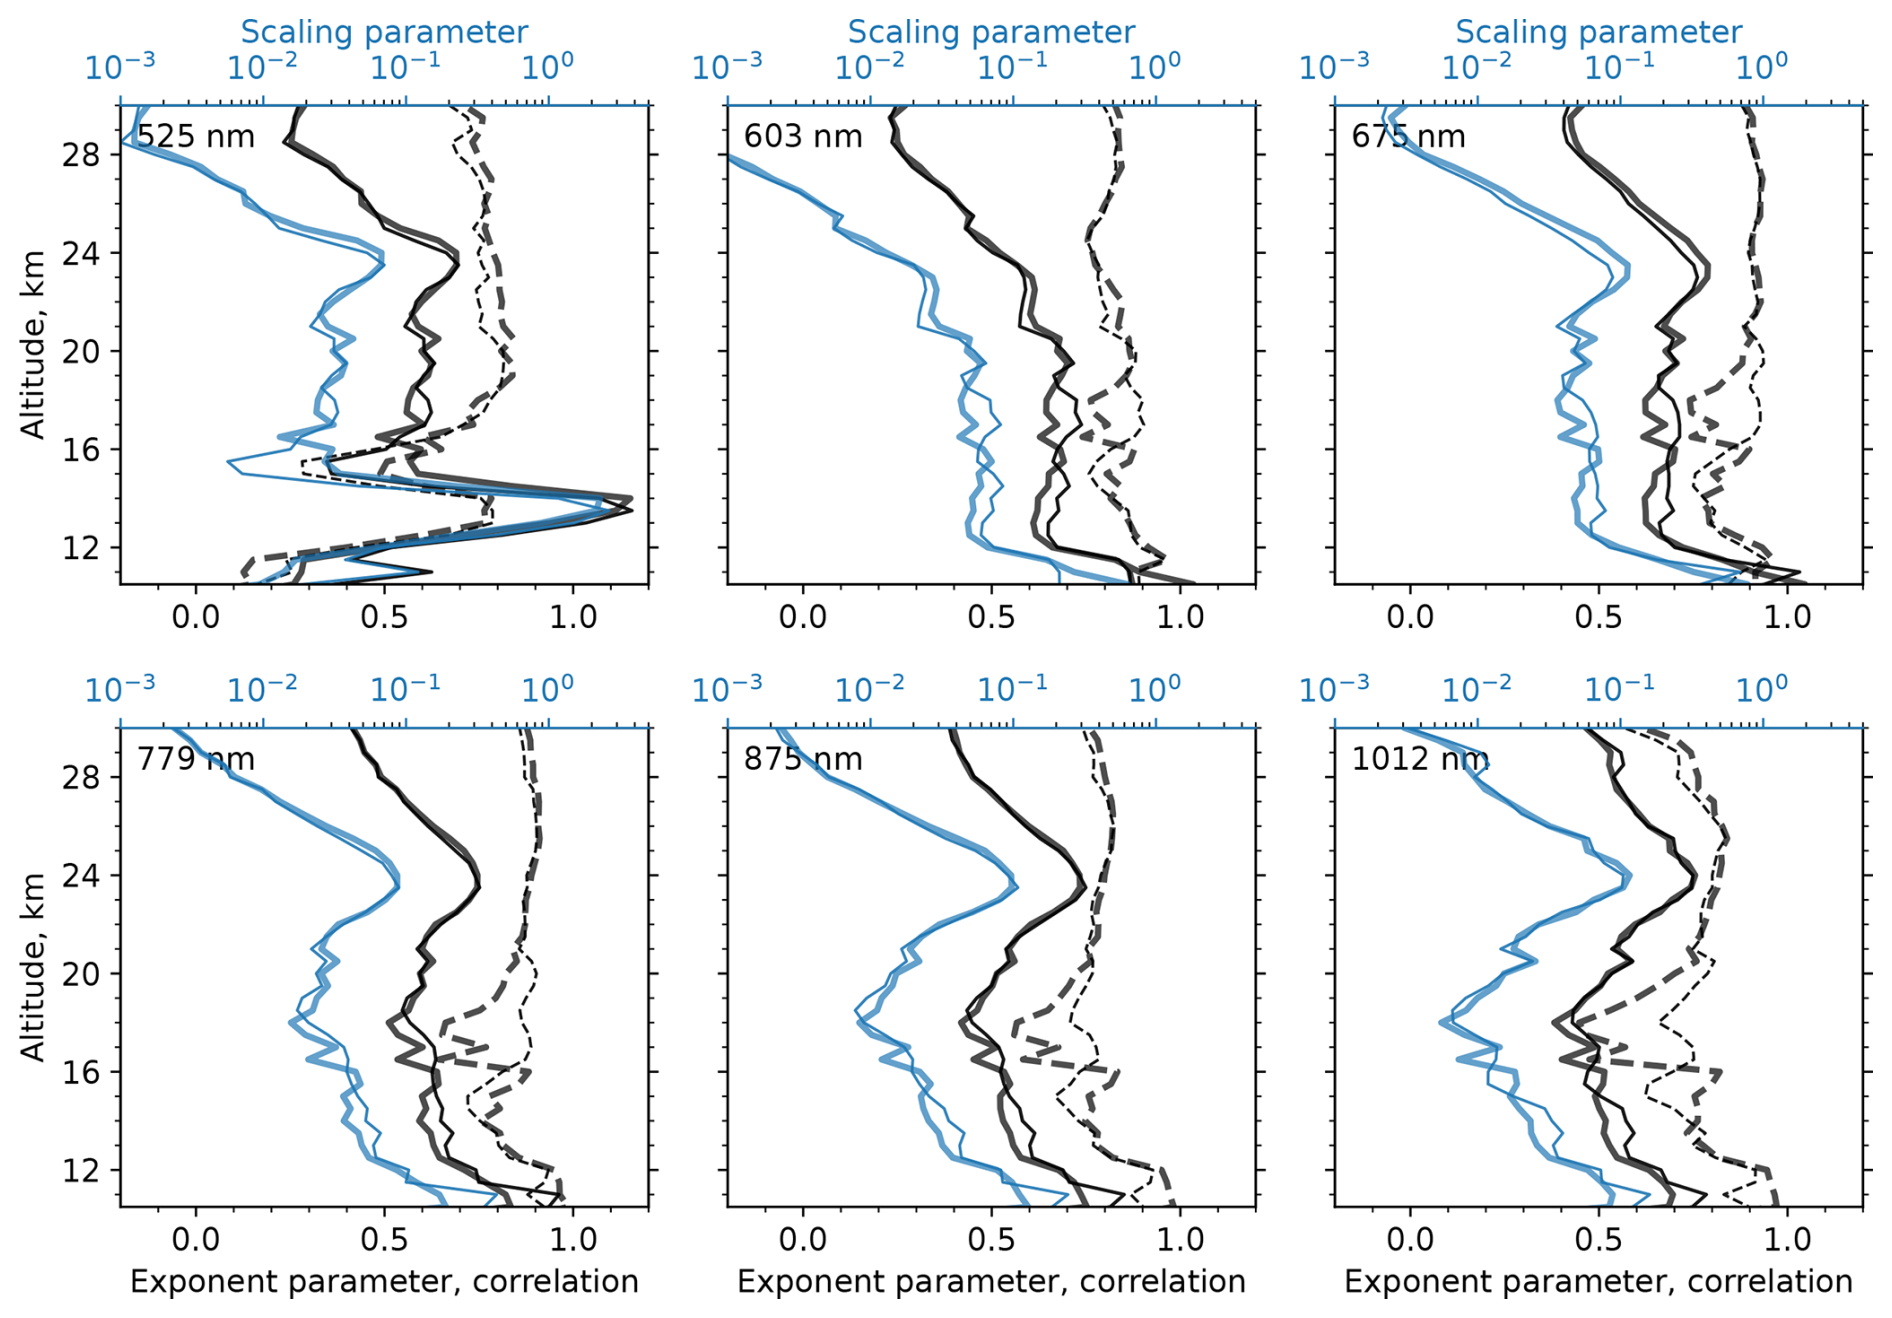
Figure 9Comparison metrics as a function of altitude for the six common wavelength pairs between MAESTRO and SAGE III. Correlation coefficient (thick dashed black line) and exponent parameter (thick solid black line) from the power-law fit are plotted using the bottom horizontal axis, and the scaling parameter (thick solid blue line) from the power-law fit is plotted along the top horizontal axis in log scale. Thin lines represent corresponding metrics but with trimmed MAESTRO data in relation to Rayleigh scattering correction (see Sect. 4.2).
The impact of the correction is shown in Fig. 10, in terms of the median percent differences between the collocated MAESTRO and SAGE III measurements introduced in Sect. 3.1, for each of the six wavelength pairs as a function of altitude. Before the correction, MAESTRO shows biases of up to approximately 50 %: for 603, 675, and 779 nm, these biases are strongest in the lowermost altitudes (z<12 km) and around 18 km. The correction method clearly improves the median biases, reducing the peak biases down to less than approximately 30 %, and median differences centred broadly on zero. At 875 nm, the median differences are fairly unchanged by the correction below 20 km. At 1012 nm, a consistent high bias in MAESTRO is substantially reduced by the correction method.
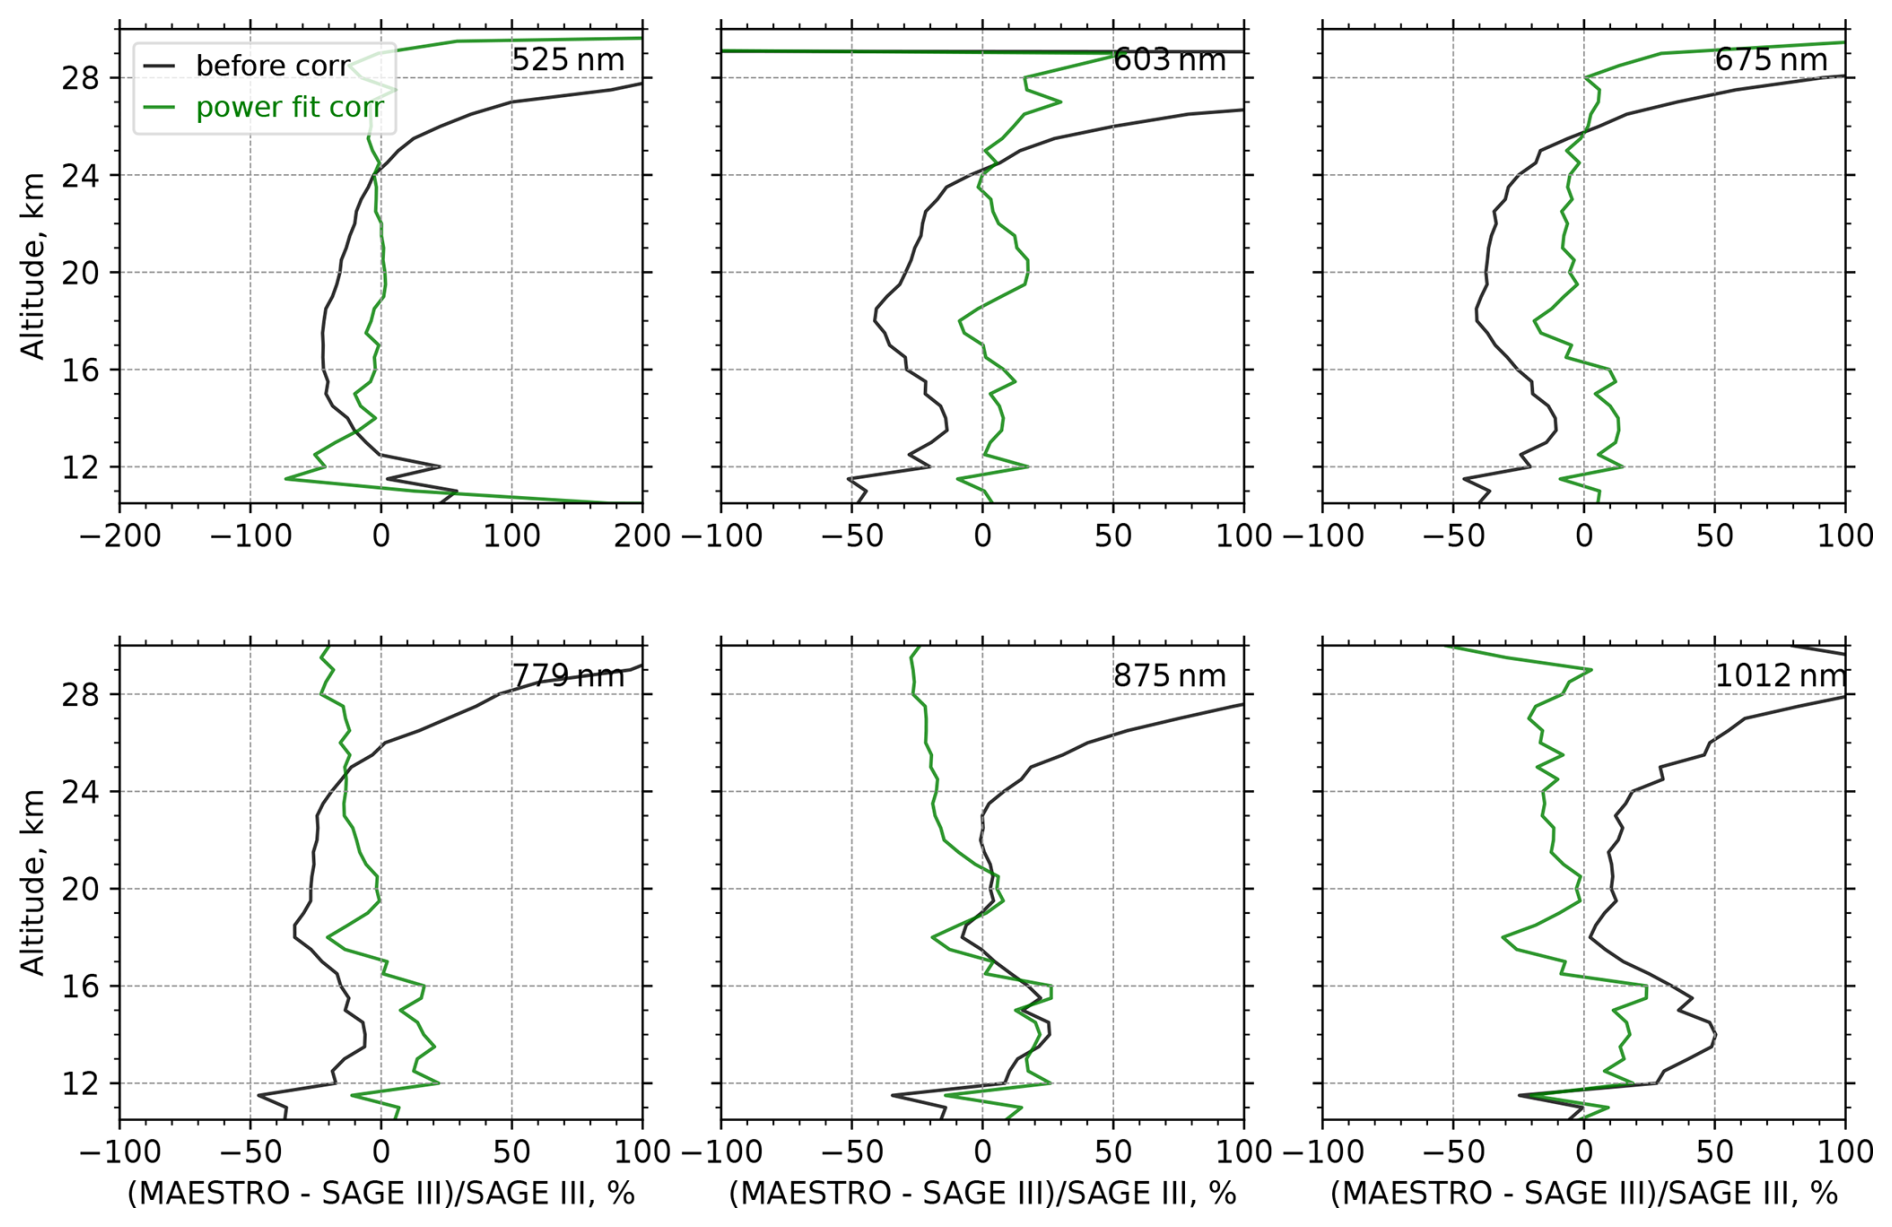
Figure 10Coincident comparison of MAESTRO aerosol extinction measurements with SAGE III. Lines show the median of differences computed as (MAESTRO – SAGE III)SAGE III. Black lines show the median of differences for the raw data, while green lines show the same for the data after the correction of Sect. 4.1 is applied to the MAESTRO data.
The impact of correcting MAESTRO extinction values is shown in Fig. 11 with an example from the lower stratosphere in the northern midlatitude region. Figure 11a reveals that the correction makes the peak in MAESTRO extinctions align better with SAGE III following major volcanic eruptions and wildfires during the period of overlap, and furthermore with OSIRIS within the SAGE gap period. The comparison during quiescent conditions remains roughly similar. Clear signals from the Kasatochi, Sarychev, Grímsvötn, and Nabro eruptions, which occurred after SAGE II and before SAGE III operations, are seen in the monthly time-series data. Even though there are only a few data points, the peak in adjusted extinction values matches those from the OSIRIS quite well. Mid-to-high-latitude SAOD values derived from adjusted MAESTRO extinctions in Fig. 11b show improved comparison with OSIRIS and SAGE III following volcanic eruptions and wildfires.
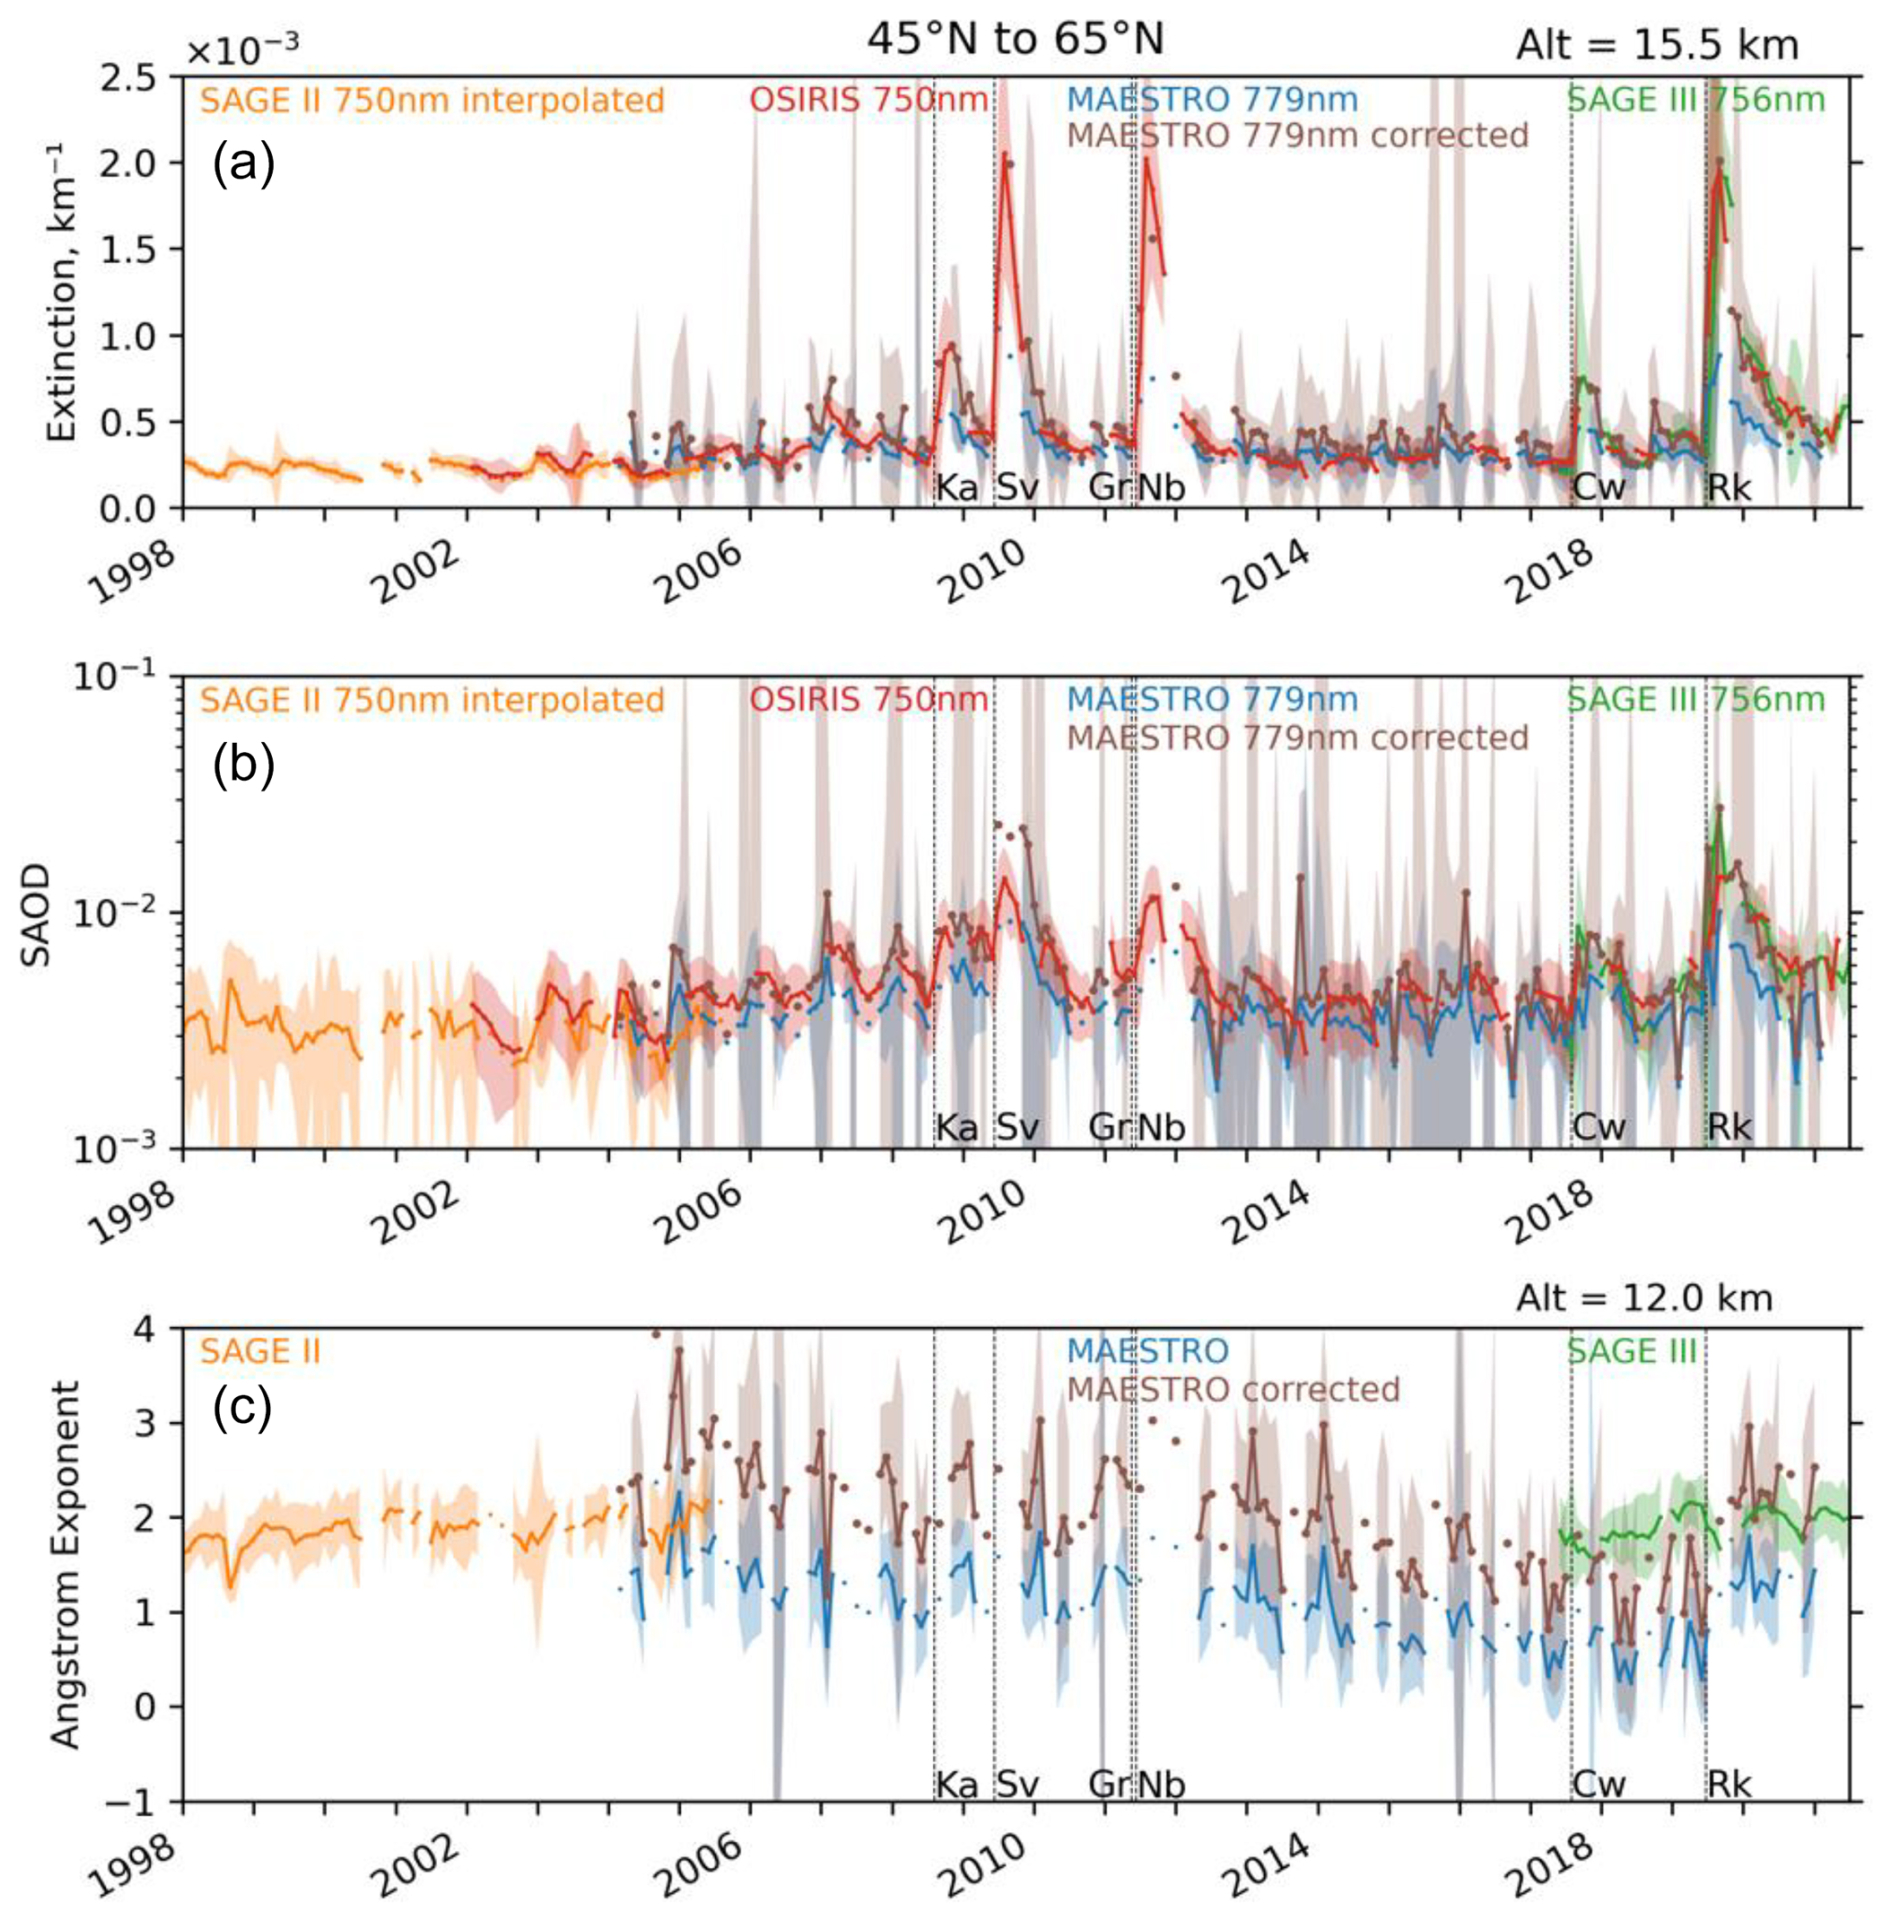
Figure 11Comparison of median stratospheric aerosol extinction coefficients (a), SAOD (b), and AE (c) between measurements from different instruments in northern midlatitudes. Shaded area represents ±1 standard deviation. Data in two 10° latitude bins are combined to show the time series by calculating the average of the medians. There are no AE data from OSIRIS because it is based on single 750 nm measurements. Selected wavelengths for each instrument are labelled. Selected altitude for extinction and AE plots is also labelled on the top right of each plot. For MAESTRO, values before and after correction are shown.
Figure 11c shows the comparison of AE values in the NH mid latitudes and 12.0 km altitude calculated from measurements by different instruments including AE calculated from the tuned MAESTRO extinctions. AE values using corrected extinctions from MAESTRO show slightly reduced discrepancies with SAGE III compared to the same from the uncorrected data. However, the AE from MAESTRO exhibits large scatter, and it is difficult to clearly identify disturbances from the background values. Figure 11 shows the increase in AE suggested by MAESTRO after the Raikoke eruption is in contrast to the SAGE III results as discussed above, which may be due to the different latitudinal sampling of the two instruments. Moreover, a gradual decreasing trend in AE values between its start in 2005 and about 2019 is also noticeable in the MAESTRO time series. Further investigation suggests this trend is mostly due to the decreasing trend in MAESTRO extinctions at shorter wavelengths, mainly 603 and 675 nm (Fig. S3). AE values from the end of the SAGE II record and the beginning of the SAGE III record show a small difference, suggesting the MAESTRO AE trend may be an artefact. On the other hand, noting the large scatter in the MAESTRO AE values and the different sampling pattern compared to the SAGE instruments, further analysis would be needed to determine if the apparent differences between MAESTRO and SAGE AE have a geophysical or instrumental origin. Latitude–time plots of the tuned MAESTRO SAOD and AE are shown in Figs. S4 and S5, respectively.
4.2 Impact of Rayleigh scattering correction
A potential reason for the scatter in MAESTRO data is due to the treatment of Rayleigh scattering. Tangent altitudes for each measurement are a retrieved quantity incorporating measurements made by the ACE-FTS instrument, which shares the same line of sight as MAESTRO, and the altitude of the lowest retrieved tangent altitude varies from profile to profile. The frequency distribution of that FTS lowest tangent altitude (or cutoff altitude) is shown in Fig. 12. If the cutoff altitude is above 10 or 15 km, then the calculated air column that is used to remove Rayleigh scattering may be inaccurate, negatively affecting the accuracy of MAESTRO retrievals. However, if the cutoff altitude is lower, then this is not an issue. SCISAT loses its lock on the Sun for tangent heights below ∼5 km, which is the lower limit of the ACE-FTS data.
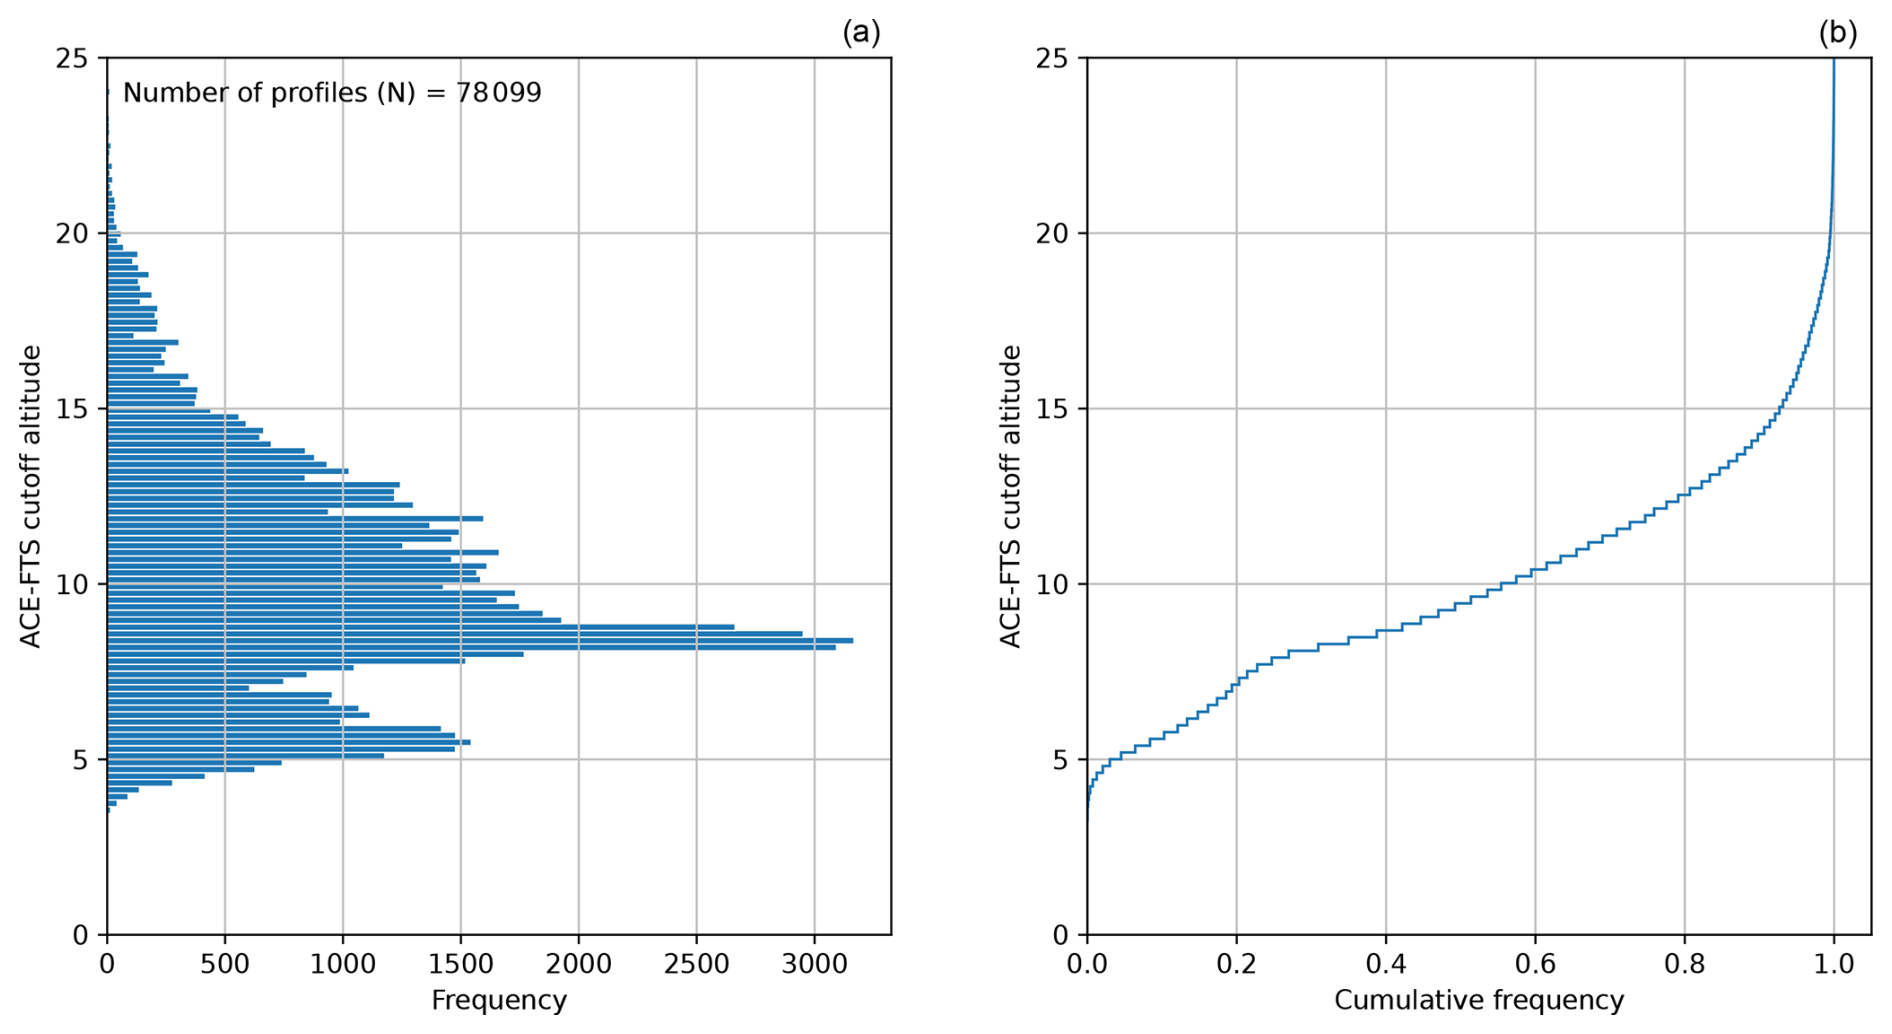
Figure 12Frequency distribution of the number of MAESTRO profiles with the corresponding ACE-FTS cutoff altitude (a) and corresponding cumulative frequency distribution (b).
We tested the potential impact of Rayleigh scattering correction by removing all the MAESTRO profiles that have FTS cutoff altitudes higher than 10 km. Cumulative frequency shows that this removes nearly 45 % of the MAESTRO profiles. We re-gridded this trimmed data set and repeated the analysis. The new comparison metrics are plotted in Fig. 9. Correlations between the trimmed MAESTRO data set and SAGE III improve considerably between 17 and 20 km for most wavelengths. For example, in the case of comparing MAESTRO to SAGE III extinction at 18 km and 1012 nm shown in Fig. 8, trimming the MAESTRO data based on the ACE-FTS cutoff altitude increases the correlation coefficient from 0.45 to 0.66. In general, we find that applying the altitude cutoff threshold decreases the standard deviations of the gridded MAESTRO data. This analysis leads us to the conclusion that accounting for the Rayleigh scattering contribution can lead to reduced variability in MAESTRO data, at the cost of a significant reduction in sample size.
Observations from MAESTRO offer a potentially important data set that fills the data gap in continuous multi-wavelength solar occultation measurements of stratospheric aerosol extinction coefficients between the end of the SAGE II mission in 2005 and the start of the SAGE III mission in 2017. In this study, the quality of MAESTRO version 3.13 aerosol extinction measurements was investigated through comparison with measurements from SAGE II, SAGE III, and OSIRIS. We find that, despite significant scatter in MAESTRO extinction and SAOD, gridded median MAESTRO aerosol extinction is in good agreement with SAGE III during background periods. After volcanic eruptions and wildfire injections of stratospheric aerosol, MAESTRO aerosol extinction enhancements are well correlated with SAGE III but biased low. This bias depends on the wavelength, and it decreases with increasing wavelength in general. An improved comparison during periods of enhanced aerosol extinction is obtained by tuning MAESTRO extinctions with SAGE III data during their overlap period using a power-law fit at different altitudes and wavelengths. This “tuned” MAESTRO extinction product is seen to show good agreement with OSIRIS and SAGE III products in all seasons for both background and perturbed conditions.
The causes of the MAESTRO scatter and bias are presently unknown but are likely to be due, at least in part, to the instrument contamination which has affected MAESTRO measurements (Jeffery et al., 2025; Bernath, 2017) and to issues affecting determination of the tangent heights of measurements (McElroy et al., 2013). We found that some of the anomalous variability in MAESTRO aerosol retrievals is related to the Rayleigh scattering calculations, and we suggest that further investigation into this issue may improve the MAESTRO aerosol data in future data releases. Sampling differences between instruments can lead to differences in binned data compilations (e.g., Toohey et al., 2013; Sofieva et al., 2014); however, we found no significant correlation between MAESTRO anomalies and variation in observing latitude, or aspects of the observation geometry, suggesting sampling was not a major contributor to the inter-instrument differences. Other issues that may deserve further study are the impact of strong inhomogeneity in the aerosol fields immediately following aerosol injection events on retrievals (e.g., Bourassa et al., 2023) and the potential impact of high-altitude clouds on retrievals in the lower stratosphere. We suggest that while these issues are potential contributors to the MAESTRO scatter, they are unlikely to be a major source of the strong bias seen in MAESTRO aerosol extinction after eruptions and wildfires.
We calculated Ångström exponent values from MAESTRO observations, which showed changes after aerosol events which appear to be physically plausible. This suggests that there may be useful information regarding aerosol properties contained in the MAESTRO data, but estimates of particle size parameters are likely to have significant uncertainties due to the large scatter in the extinction retrievals. We find a long-term trend in the AE derived from multi-spectral MAESTRO aerosol extinction measurements in the NH, linked to changes in extinction measurements at shorter wavelengths over the MAESTRO measurement period. Since this result is not consistent with AE derived from SAGE II and SAGE III, we suggest it is possibly related to MAESTRO instrumental artefacts, likely to the contamination that has predominantly affected the instrument's ability to accurately measure radiances at lower wavelengths (i.e., 500 nm and lower, Bernath, 2017). While this finding limits the use of MAESTRO AE to study long-term changes in aerosol size distribution, the MAESTRO data are potentially useful in the investigation of short-term impacts of individual eruptions on particle size. For example, MAESTRO AE results suggest a decrease in aerosol size after the Raikoke eruption, which is consistent with many other eruptions but inconsistent with interpretation of data from SAGE III for this particular eruption (Thomason et al., 2021; Wrana et al., 2023), which may be due to the different spatial sampling of the two instruments, with MAESTRO potentially sampling the stronger aerosol perturbations poleward of the eruption location.
This study shows that information from MAESTRO may be useful to complement other satellite records after carefully accounting for its uncertainties, especially at higher latitudes and during the data gap in SAGE records. Our analysis shows that when MAESTRO extinctions are binned into monthly 10° latitude bins and robust statistics (e.g., the median) are applied, the resulting fields show good correlation with SAGE III, suggesting the MAESTRO data contain signal representative of actual aerosol variability, particularly the enhancements due to eruptions and wildfire events. The 603 nm channel showed the highest correlation with SAGE III measurements, suggesting this could be the most useful wavelength to potentially incorporate into aerosol merged data products, perhaps after applying a bias correction scheme as introduced here.
All data used in this study are freely available. MAESTRO and ACE-FTS data are available after registration from https://databace.scisat.ca/level2/ (last access: 15 September 2022). OSIRIS data can be accessed from the University of Saskatchewan server at https://research-groups.usask.ca/osiris/data-products.php (last access: 21 September 2022). SAGE II and SAGE III/ISS data are available after registration from the NASA Atmospheric Science Data Center at https://asdc.larc.nasa.gov/project/SAGE%20II (last access: 21 September 2022) and https://asdc.larc.nasa.gov/project/SAGE%20III-ISS (last access: 8 November 2022), respectively.
The supplement related to this article is available online at https://doi.org/10.5194/amt-18-6835-2025-supplement.
SK performed the analysis, with supervision from MT and AB. CS, CTM, and KAW provided expert guidance on the use of MAESTRO data and the overall mission. SK wrote the original manuscript with input from all coauthors. All coauthors contributed to the review and editing of the manuscript.
The contact author has declared that none of the authors has any competing interests.
Publisher's note: Copernicus Publications remains neutral with regard to jurisdictional claims made in the text, published maps, institutional affiliations, or any other geographical representation in this paper. While Copernicus Publications makes every effort to include appropriate place names, the final responsibility lies with the authors.
This research has been supported by the Canadian Space Agency (grant no. 21SUASOCSA).
This paper was edited by Sandip Dhomse and reviewed by three anonymous referees.
Ångström, A.: The parameters of atmospheric turbidity, Tellus, 16, https://doi.org/10.3402/tellusa.v16i1.8885, 1964.
Bernath, P. F.: The Atmospheric Chemistry Experiment (ACE), J. Quant. Spectrosc. Ra., 186, https://doi.org/10.1016/j.jqsrt.2016.04.006, 2017.
Bernath, P. F., McElroy, C. T., Abrams, M. C., Boone, C. D., Butler, M., Camy-Peyret, C., Carleer, M., Clerbaux, C., Coheur, P.-F., Colin, R., DeCola, P., DeMazière, M., Drummond, J. R., Dufour, D., Evans, W. F. J., Fast, H., Fussen, D., Gilbert, K., Jennings, D. E., Llewellyn, E. J., Lowe, R. P., Mahieu, E., McConnell, J. C., McHugh, M., McLeod, S. D., Michaud, R., Midwinter, C., Nassar, R., Nichitiu, F., Nowlan, C., Rinsland, C. P., Rochon, Y. J., Rowlands, N., Semeniuk, K., Simon, P., Skelton, R., Sloan, J. J., Soucy, M.-A., Strong, K., Tremblay, P., Turnbull, D., Walker, K. A., Walkty, I., Wardle, D. A., Wehrle, V., Zander, R., and Zou, J.: Atmospheric Chemistry Experiment (ACE): Mission overview, Geophys. Res. Lett., 32, L15S01, https://doi.org/10.1029/2005GL022386, 2005.
Boone, C. D., Walker, K. A., and Bernath, P. F.: Version 3 retrievals for the Atmospheric Chemistry Experiment Fourier Transform Spectrometer (ACE-FTS), in: The Atmospheric Chemistry Experiment ACE at 10: A Solar Occultation Anthology, A. Deepak Publishing, Hampton, Virginia, USA, 103–127, ISBN 978-0-937194-54-9, 2013.
Bourassa, A. E., Robock, A., Randel, W. J., Deshler, T., Rieger, L. A., Lloyd, N. D., Llewellyn, E. J., and Degenstein, D. A.: Large volcanic aerosol load in the stratosphere linked to Asian monsoon transport, Science, 336, https://doi.org/10.1126/science.1219371, 2012.
Bourassa, A. E., Rieger, L. A., Zawada, D. J., Khaykin, S., Thomason, L. W., and Degenstein, D. A.: Satellite Limb Observations of Unprecedented Forest Fire Aerosol in the Stratosphere, J. Geophys. Res.-Atmos., 124, https://doi.org/10.1029/2019JD030607, 2019.
Bourassa, A. E., Zawada, D. J., Rieger, L. A., Warnock, T. W., Toohey, M., and Degenstein, D. A.: Tomographic Retrievals of Hunga Tonga-Hunga Ha'apai Volcanic Aerosol, Geophys. Res. Lett., 50, e2022GL101978, https://doi.org/10.1029/2022GL101978, 2023.
Chu, W. P., McCormick, M. P., Lenoble, J., Brogniez, C., and Pruvost, P.: SAGE II inversion algorithm, J. Geophys. Res., 94, https://doi.org/10.1029/JD094iD06p08339, 1989.
Damadeo, R. P., Zawodny, J. M., Thomason, L. W., and Iyer, N.: SAGE version 7.0 algorithm: application to SAGE II, Atmos. Meas. Tech., 6, 3539–3561, https://doi.org/10.5194/amt-6-3539-2013, 2013.
Eck, T. F., Holben, B. N., Reid, J. S., Dubovik, O., Smirnov, A., O'Neill, N. T., Slutsker, I., and Kinne, S.: Wavelength dependence of the optical depth of biomass burning, urban, and desert dust aerosols, J. Geophys. Res.-Atmos., 104, https://doi.org/10.1029/1999JD900923, 1999.
Friberg, J., Martinsson, B. G., Andersson, S. M., and Sandvik, O. S.: Volcanic impact on the climate – the stratospheric aerosol load in the period 2006–2015, Atmos. Chem. Phys., 18, 11149–11169, https://doi.org/10.5194/acp-18-11149-2018, 2018.
Hirsch, E. and Koren, I.: Record-breaking aerosol levels explained by smoke injection into the stratosphere, Science, 371, 1269–1274, https://doi.org/10.1126/science.abe1415, 2021.
Hofmann, D. J. and Solomon, S.: Ozone destruction through heterogeneous chemistry following the eruption of El Chichón, J. Geophys. Res.-Atmos., 94, 5029–5041, https://doi.org/10.1029/JD094iD04p05029, 1989.
Jeffery, P. S., Drummond, J. R., McElroy, C. T., Walker, K. A., and Zou, J.: Validation of the version 4.5 MAESTRO ozone and NO2 measurements, Atmos. Meas. Tech., 18, 569–602, https://doi.org/10.5194/amt-18-569-2025, 2025.
Kalnajs, L. E. and Deshler, T.: A New Instrument for Balloon-Borne In Situ Aerosol Size Distribution Measurements, the Continuation of a 50 Year Record of Stratospheric Aerosols Measurements, J. Geophys. Res.-Atmos., 127, e2022JD037485, https://doi.org/10.1029/2022JD037485, 2022.
Kar, J., Lee, K.-P., Vaughan, M. A., Tackett, J. L., Trepte, C. R., Winker, D. M., Lucker, P. L., and Getzewich, B. J.: CALIPSO level 3 stratospheric aerosol profile product: version 1.00 algorithm description and initial assessment, Atmos. Meas. Tech., 12, 6173–6191, https://doi.org/10.5194/amt-12-6173-2019, 2019.
Khaykin, S., Legras, B., Bucci, S., Sellitto, P., Isaksen, L., Tencé, F., Bekki, S., Bourassa, A., Rieger, L., Zawada, D., Jumelet, J., and Godin-Beekmann, S.: The 2019/20 Australian wildfires generated a persistent smoke-charged vortex rising up to 35 km altitude, Commun Earth Environ, 1, https://doi.org/10.1038/s43247-020-00022-5, 2020.
Kloss, C., Sellitto, P., Legras, B., Vernier, J. P., Jégou, F., Venkat Ratnam, M., Suneel Kumar, B., Lakshmi Madhavan, B., and Berthet, G.: Impact of the 2018 Ambae Eruption on the Global Stratospheric Aerosol Layer and Climate, J. Geophys. Res.-Atmos., 125, e2020JD032410, https://doi.org/10.1029/2020JD032410, 2020.
Kloss, C., Berthet, G., Sellitto, P., Ploeger, F., Taha, G., Tidiga, M., Eremenko, M., Bossolasco, A., Jégou, F., Renard, J.-B., and Legras, B.: Stratospheric aerosol layer perturbation caused by the 2019 Raikoke and Ulawun eruptions and their radiative forcing, Atmos. Chem. Phys., 21, 535–560, https://doi.org/10.5194/acp-21-535-2021, 2021.
Knepp, T. N., Kovilakam, M., Thomason, L., and Miller, S. J.: Characterization of stratospheric particle size distribution uncertainties using SAGE II and SAGE III/ISS extinction spectra, Atmos. Meas. Tech., 17, 2025–2054, https://doi.org/10.5194/amt-17-2025-2024, 2024.
Kovilakam, M., Thomason, L. W., Ernest, N., Rieger, L., Bourassa, A., and Millán, L.: The Global Space-based Stratospheric Aerosol Climatology (version 2.0): 1979–2018, Earth Syst. Sci. Data, 12, 2607–2634, https://doi.org/10.5194/essd-12-2607-2020, 2020.
Kovilakam, M., Thomason, L., and Knepp, T.: SAGE III/ISS aerosol/cloud categorization and its impact on GloSSAC, Atmos. Meas. Tech., 16, 2709–2731, https://doi.org/10.5194/amt-16-2709-2023, 2023.
Kremser, S., Thomason, L. W., von Hobe, M., Hermann, M., Deshler, T., Timmreck, C., Toohey, M., Stenke, A., Schwarz, J. P., Weigel, R., Fueglistaler, S., Prata, F. J., Vernier, J. P., Schlager, H., Barnes, J. E., Antuña-Marrero, J. C., Fairlie, D., Palm, M., Mahieu, E., Notholt, J., Rex, M., Bingen, C., Vanhellemont, F., Bourassa, A., Plane, J. M. C., Klocke, D., Carn, S. A., Clarisse, L., Trickl, T., Neely, R., James, A. D., Rieger, L., Wilson, J. C., and Meland, B.: Stratospheric aerosol – Observations, processes, and impact on climate, Rev. Geophys., 54, 278–335, https://doi.org/10.1002/2015RG000511, 2016.
Lacis, A., Hansen, J., and Sato, M.: Climate forcing by stratospheric aerosols, Geophys. Res. Lett., 19, 1607, https://doi.org/10.1029/92GL01620, 1992.
Llewellyn, E. J., Lloyd, N. D., Degenstein, D. A., Gattinger, R. L., Petelina, S. V., Bourassa, A. E., Wiensz, J. T., Ivanov, E. V., McDade, I. C., Solheim, B. H., McConnell, J. C., Haley, C. S., von Savigny, C., Sioris, C. E., McLinden, C. A., Griffioen, E., Kaminski, J., Evans, W. F. J., Puckrin, E., Strong, K., Wehrle, V., Hum, R. H., Kendall, D. J. W., Matsushita, J., Murtagh, D. P., Brohede, S., Stegman, J., Witt, G., Barnes, G., Payne, W. F., Piché, L., Smith, K., Warshaw, G., Deslauniers, D.-L., Marchand, P., Richardson, E. H., King, R. A., Wevers, I., McCreath, W., Kyrölä, E., Oikarinen, L., Leppelmeier, G. W., Auvinen, H., Mégie, G., Hauchecorne, A., Lefèvre, F., de La Nöe, J., Ricaud, P., Frisk, U., Sjoberg, F., von Schéele, F., and Nordh, L.: The OSIRIS instrument on the Odin spacecraft, Can. J. Phys., 82, 411–422, https://doi.org/10.1139/p04-005, 2004.
Lumpe, J. D., Bevilacqua, R. M., Hoppel, K. W., Krigman, S. S., Kriebel, D. L., Debrestian, D. J., Randall, C. E., Rusch, D. W., Brogniez, C., Ramananahérisoa, R., Shettle, E. P., Olivero, J. J., Lenoble, J., and Pruvost, P.: POAM II retrieval algorithm and error analysis, J. Geophys. Res.-Atmos., 102, https://doi.org/10.1029/97jd00906, 1997.
Malinina, E., Rozanov, A., Rozanov, V., Liebing, P., Bovensmann, H., and Burrows, J. P.: Aerosol particle size distribution in the stratosphere retrieved from SCIAMACHY limb measurements, Atmos. Meas. Tech., 11, 2085–2100, https://doi.org/10.5194/amt-11-2085-2018, 2018.
Malinina, E., Rozanov, A., Rieger, L., Bourassa, A., Bovensmann, H., Burrows, J. P., and Degenstein, D.: Stratospheric aerosol characteristics from space-borne observations: extinction coefficient and Ångström exponent, Atmos. Meas. Tech., 12, 3485–3502, https://doi.org/10.5194/amt-12-3485-2019, 2019.
McCormick, M. P.: Sage II: An overview, Adv. Space Res., 7, 219–226, https://doi.org/10.1016/0273-1177(87)90151-7, 1987.
McCormick, M. P., Hamill, P., Pepin, T. J., Chu, W. P., Swissler, T. J., and McMaster, L. R.: Satellite Studies of the Stratospheric Aerosol, B. Am. Meteorol. Soc., 60, 1038–1047, https://doi.org/10.1175/1520-0477(1979)060<1038:SSOTSA>2.0.CO;2, 1979.
McCormick, M. P., Thomason, L. W., and Trepte, C. R.: Atmospheric effects of the Mt Pinatubo eruption, Nature, 373, 399–404, https://doi.org/10.1038/373399a0, 1995.
McCormick, M. P., Lei, L., Hill, M. T., Anderson, J., Querel, R., and Steinbrecht, W.: Early results and validation of SAGE III-ISS ozone profile measurements from onboard the International Space Station, Atmos. Meas. Tech., 13, 1287–1297, https://doi.org/10.5194/amt-13-1287-2020, 2020.
McElroy, C. T., Nowlan, C. R., Drummond, J. R., Bernath, P. F., Barton, D. V., Dufour, D. G., Midwinter, C., Hall, R. B., Ogyu, A., Ullberg, A., Wardle, D. I., Kar, J., Zou, J., Nichitiu, F., Boone, C. D., Walker, K. A., and Rowlands, N.: The ACE-MAESTRO instrument on SCISAT: Description, performance, and preliminary results, Appl. Optics, 46, https://doi.org/10.1364/AO.46.004341, 2007.
McElroy, C. T., Barton, D. V., Nowlan, C. R., and Drummond, J. R.: MAESTRO: The SCISAT UV-Visible-Near IR Instrument, in: The Atmospheric Chemistry Experiment ACE at 10: A Solar Occultation Anthology, A. Deepak Publishing, Hampton, Virginia, USA, ISBN 978-0-937194-54-9, 2013.
Mironova, I. A., Usoskin, I. G., Kovaltsov, G. A., and Petelina, S. V.: Possible effect of extreme solar energetic particle event of 20 January 2005 on polar stratospheric aerosols: direct observational evidence, Atmos. Chem. Phys., 12, 769–778, https://doi.org/10.5194/acp-12-769-2012, 2012.
Murphy, D. M., Froyd, K. D., Bourgeois, I., Brock, C. A., Kupc, A., Peischl, J., Schill, G. P., Thompson, C. R., Williamson, C. J., and Yu, P.: Radiative and chemical implications of the size and composition of aerosol particles in the existing or modified global stratosphere, Atmos. Chem. Phys., 21, 8915–8932, https://doi.org/10.5194/acp-21-8915-2021, 2021.
Randall, C. E., Bevilacqua, R. M., Lumpe, J. D., and Hoppel, K. W.: Validation of POAM III aerosols: Comparison to SAGE II and HALOE, J. Geophys. Res.-Atmos., 106, 27525–27536, https://doi.org/10.1029/2001JD000528, 2001.
Rieger, L. A., Bourassa, A. E. and Degenstein, D. A.: Merging the OSIRIS and SAGE II stratospheric aerosol records, J. Geophys. Res. Atmos., 120, 8890–8904, https://doi.org/10.1002/2015JD023133, 2015.
Rieger, L. A., Zawada, D. J., Bourassa, A. E., and Degenstein, D. A.: A Multiwavelength Retrieval Approach for Improved OSIRIS Aerosol Extinction Retrievals, J. Geophys. Res.-Atmos., 124, 2018JD029897, https://doi.org/10.1029/2018JD029897, 2019.
Rieger, L. A., Cole, J. N. S., Fyfe, J. C., Po-Chedley, S., Cameron-Smith, P. J., Durack, P. J., Gillett, N. P. and Tang, Q.: Quantifying CanESM5 and EAMv1 sensitivities to Mt. Pinatubo volcanic forcing for the CMIP6 historical experiment, Geosci. Model Dev., 13, 4831–4843, https://doi.org/10.5194/gmd-13-4831-2020, 2020.
Robert, C. É., Bingen, C., Vanhellemont, F., Mateshvili, N., Dekemper, E., Tétard, C., Fussen, D., Bourassa, A., and Zehner, C.: AerGOM, an improved algorithm for stratospheric aerosol extinction retrieval from GOMOS observations – Part 2: Intercomparisons, Atmos. Meas. Tech., 9, 4701–4718, https://doi.org/10.5194/amt-9-4701-2016, 2016.
Santer, B. D., Bonfils, C., Painter, J. F., Zelinka, M. D., Mears, C., Solomon, S., Schmidt, G. A., Fyfe, J. C., Cole, J. N. S., Nazarenko, L., Taylor, K. E., and Wentz, F. J.: Volcanic contribution to decadal changes in tropospheric temperature, Nat. Geosci., 7, 185–189, https://doi.org/10.1038/ngeo2098, 2014.
Schuster, G. L., Dubovik, O., and Holben, B. N.: Angstrom exponent and bimodal aerosol size distributions, J. Geophys. Res.-Atmos., 111, 7207, https://doi.org/10.1029/2005JD006328, 2006.
Sioris, C. E., Zou, J., McElroy, C. T., McLinden, C. A., and Vömel, H.: High vertical resolution water vapour profiles in the upper troposphere and lower stratosphere retrieved from MAESTRO solar occultation spectra, Adv. Space Res., 46, 642–650, https://doi.org/10.1016/J.ASR.2010.04.040, 2010.
Sioris, C. E., Zou, J., McElroy, C. T., Boone, C. D., Sheese, P. E., and Bernath, P. F.: Water vapour variability in the high-latitude upper troposphere – Part 2: Impact of volcanic eruptions, Atmos. Chem. Phys., 16, 2207–2219, https://doi.org/10.5194/acp-16-2207-2016, 2016.
Sofieva, V. F., Kalakoski, N., Päivärinta, S.-M., Tamminen, J., Laine, M., and Froidevaux, L.: On sampling uncertainty of satellite ozone profile measurements, Atmos. Meas. Tech., 7, 1891–1900, https://doi.org/10.5194/amt-7-1891-2014, 2014.
Sofieva, V. F., Rozanov, A., Szelag, M., Burrows, J. P., Retscher, C., Damadeo, R., Degenstein, D., Rieger, L. A., and Bourassa, A.: CREST: a Climate Data Record of Stratospheric Aerosols, Earth Syst. Sci. Data, 16, 5227–5241, https://doi.org/10.5194/essd-16-5227-2024, 2024a.
Sofieva, V. F., Szelag, M., Tamminen, J., Fussen, D., Bingen, C., Vanhellemont, F., Mateshvili, N., Rozanov, A., and Pohl, C.: Multi-wavelength dataset of aerosol extinction profiles retrieved from GOMOS stellar occultation measurements, Atmos. Meas. Tech., 17, 3085–3101, https://doi.org/10.5194/amt-17-3085-2024, 2024b.
Solomon, S., Portmann, R. W., Garcia, R. R., Thomason, L. W., Poole, L. R. and McCormick, M. P.: The role of aerosol variations in anthropogenic ozone depletion at northern midlatitudes, J. Geophys. Res. Atmos., 101, 6713–6727, https://doi.org/10.1029/95JD03353, 1996.
Solomon, S., Daniel, J. S., Neely, R. R., Vernier, J.-P., Dutton, E. G., and Thomason, L. W.: The Persistently Variable “Background” Stratospheric Aerosol Layer and Global Climate Change, Science, 333, 866–870, https://doi.org/10.1126/science.1206027, 2011.
Solomon, S., Dube, K., Stone, K., Yu, P., Kinnison, D., Toon, O. B., Strahan, S. E., Rosenlof, K. H., Portmann, R., Davis, S., Randel, W., Bernath, P., Boone, C., Bardeen, C. G., Bourassa, A., Zawada, D., and Degenstein, D.: On the stratospheric chemistry of midlatitude wildfire smoke, P. Natl. Acad. Sci. USA, 119, e2117325119, https://doi.org/10.1073/pnas.2117325119, 2022.
Stenchikov, G. L., Kirchner, I., Robock, A., Graf, H.-F., Antu na, J. C., Grainger, R. G., Lambert, A., and Thomason, L.: Radiative forcing from the 1991 Mount Pinatubo volcanic eruption, J. Geophys. Res., 103, 13837–13857, https://doi.org/10.1029/98JD00693, 1998.
Thomason, L. W., Poole, L. R., and Randall, C. E.: SAGE III aerosol extinction validation in the Arctic winter: comparisons with SAGE II and POAM III, Atmos. Chem. Phys., 7, 1423–1433, https://doi.org/10.5194/acp-7-1423-2007, 2007.
Thomason, L. W., Ernest, N., Millán, L., Rieger, L., Bourassa, A., Vernier, J.-P., Manney, G., Luo, B., Arfeuille, F., and Peter, T.: A global space-based stratospheric aerosol climatology: 1979–2016, Earth Syst. Sci. Data, 10, 469–492, https://doi.org/10.5194/essd-10-469-2018, 2018.
Thomason, L. W., Kovilakam, M., Schmidt, A., von Savigny, C., Knepp, T., and Rieger, L.: Evidence for the predictability of changes in the stratospheric aerosol size following volcanic eruptions of diverse magnitudes using space-based instruments, Atmos. Chem. Phys., 21, 1143–1158, https://doi.org/10.5194/acp-21-1143-2021, 2021.
Toohey, M., Hegglin, M. I., Tegtmeier, S., Anderson, J., Añel, J. A., Bourassa, A., Brohede, S., Degenstein, D., Froidevaux, L., Fuller, R., Funke, B., Gille, J., Jones, A., Kasai, Y., Krüger, K., Kyrölä, E., Neu, J. L., Rozanov, A., Smith, L., Urban, J., von Clarmann, T., Walker, K. A., and Wang, R. H. J.: Characterizing sampling biases in the trace gas climatologies of the SPARC Data Initiative, J. Geophys. Res.-Atmos., 118, 11847–11862, https://doi.org/10.1002/jgrd.50874, 2013.
Torres, O., Bhartia, P. K., Taha, G., Jethva, H., Das, S., Colarco, P., Krotkov, N., Omar, A., and Ahn, C.: Stratospheric Injection of Massive Smoke Plume From Canadian Boreal Fires in 2017 as Seen by DSCOVR-EPIC, CALIOP, and OMPS-LP Observations, J. Geophys. Res.-Atmos., 125, e2020JD032579, https://doi.org/10.1029/2020JD032579, 2020.
Vernier, J.-P., Pommereau, J.-P., Garnier, A., Pelon, J., Larsen, N., Nielsen, J., Christensen, T., Cairo, F., Thomason, L. W., and Leblanc, T.: Tropical stratospheric aerosol layer from CALIPSO lidar observations, J. Geophys. Res.-Atmos., 114, https://doi.org/10.1029/2009JD011946, 2009.
Vernier, J.-P., Thomason, L. W., Pommereau, J.-P., Bourassa, A., Pelon, J., Garnier, A., Hauchecorne, A., Blanot, L., Trepte, C., Degenstein, D., and Vargas, F.: Major influence of tropical volcanic eruptions on the stratospheric aerosol layer during the last decade, Geophys. Res. Lett., 38, https://doi.org/10.1029/2011GL047563, 2011.
von Savigny, C. and Hoffmann, C. G.: Issues related to the retrieval of stratospheric-aerosol particle size information based on optical measurements, Atmos. Meas. Tech., 13, 1909–1920, https://doi.org/10.5194/amt-13-1909-2020, 2020.
World Meteorological Organization: International Meteorological Vocabulary, Secretariat of the World Meteorological Organization, Geneve, 2nd edn., 1992.
Wrana, F., von Savigny, C., Zalach, J. and Thomason, L. W.: Retrieval of stratospheric aerosol size distribution parameters using satellite solar occultation measurements at three wavelengths, Atmos. Meas. Tech., 14, 2345–2357, https://doi.org/10.5194/amt-14-2345-2021, 2021.
Wrana, F., Niemeier, U., Thomason, L. W., Wallis, S. and von Savigny, C.: Stratospheric aerosol size reduction after volcanic eruptions, Atmos. Chem. Phys., 23, 9725–9743, https://doi.org/10.5194/acp-23-9725-2023, 2023.