the Creative Commons Attribution 4.0 License.
the Creative Commons Attribution 4.0 License.
 | 19 Feb 2025
Study of NO2 and HCHO vertical profile measurement based on fast synchronous multi-axis differential optical absorption spectroscopy (FS MAX-DOAS)
Jiangman Xu
Ang Li
Zhaokun Hu
Hairong Zhang
Min Qin
This study investigates a multi-elevation fast synchronous multi-axis differential optical absorption spectroscopy (FS MAX-DOAS) observation system that can rapidly acquire trace gas profiles. It modifies the conventional MAX-DOAS method by sequentially scanning at elevation angles using motors. The new system incorporates a two-dimensional area array charge-coupled device (CCD) grating spectrometer, telescopes with a small field of view (< 1°), a high-speed shutter switching module, and a multi-mode multi-core fiber to enable multi-channel spectroscopy and significantly enhance the time resolution of the collected spectra (one elevation cycle within 2 min). When selecting the spectrometer grating, the impact of the spectral resolution on the detection of nitrogen dioxide (NO2) and formaldehyde (HCHO) by FS MAX-DOAS was simulated and analyzed. The optimal resolution range was determined to be 0.3–0.6 nm. The selection of the number of binning rows in the acquisition settings considers the signal-to-noise ratio of the pixels in each row to enhance the quality of the spectral data. Two-step acquisition is used for low elevation angles within one cycle to overcome the influence of variations in light intensity. A comparative test was conducted on outfield NO2 and HCHO measurements using differential optical absorption spectroscopy. Compared with the differential slant column densities (dSCDs) at each elevation angle measured by the MAX-DOAS system, the Pearson correlation coefficient of NO2 reached 0.9, while for HCHO it ranged mostly between 0.76 and 0.85. The results of the slant column concentration inversion indicate that the root mean square (rms) of the FS MAX-DOAS spectrum inversion can consistently be lower than that of MAX-DOAS over an extended period. The profile results show that the diurnal variation trend of the two systems was consistent, and because of the enhanced time resolution, the gas profile obtained by the former system can provide more detailed information. Compared with the near-ground NO2 concentration measured by the long-path DOAS (LP-DOAS) system, the daily variation trend shows a characteristic of being high in the morning and starting to decrease at noon, and the correlation coefficient between FS MAX-DOAS and LP-DOAS is higher (R = 0.901). The FS MAX-DOAS system can quickly and simultaneously obtain the vertical distribution profiles of NO2 and HCHO with high accuracy, providing a basis for mobile MAX-DOAS to achieve gas profile inversion.
- Article
(5348 KB) - Full-text XML
- BibTeX
- EndNote


Nitrogen dioxide (NO2) is a toxic gas with a pungent odor and is a key pollutant that affects ambient air quality and human health (Jion et al., 2023). NO2 can be generated from ozone, and in recent years, its surface concentration in urban areas has increased, leading to an elevated risk of respiratory diseases and other serious health conditions (Kuerban et al., 2020). Emissions from industrial activities have exacerbated NO2 pollution. The main sources of NO2 are fossil fuel combustion, vehicle exhaust, and power generation. Formaldehyde (HCHO) is a carbonyl compound that triggers photochemical reactions in air pollutants. The lifespan of HCHO is very short in the troposphere, and its photolysis produces hydroxyl radicals (OH), which drive the photooxidation process and ultimately lead to the formation of ozone (Lui, 2017). These pollution gases have had numerous adverse effects in the ambient atmosphere.
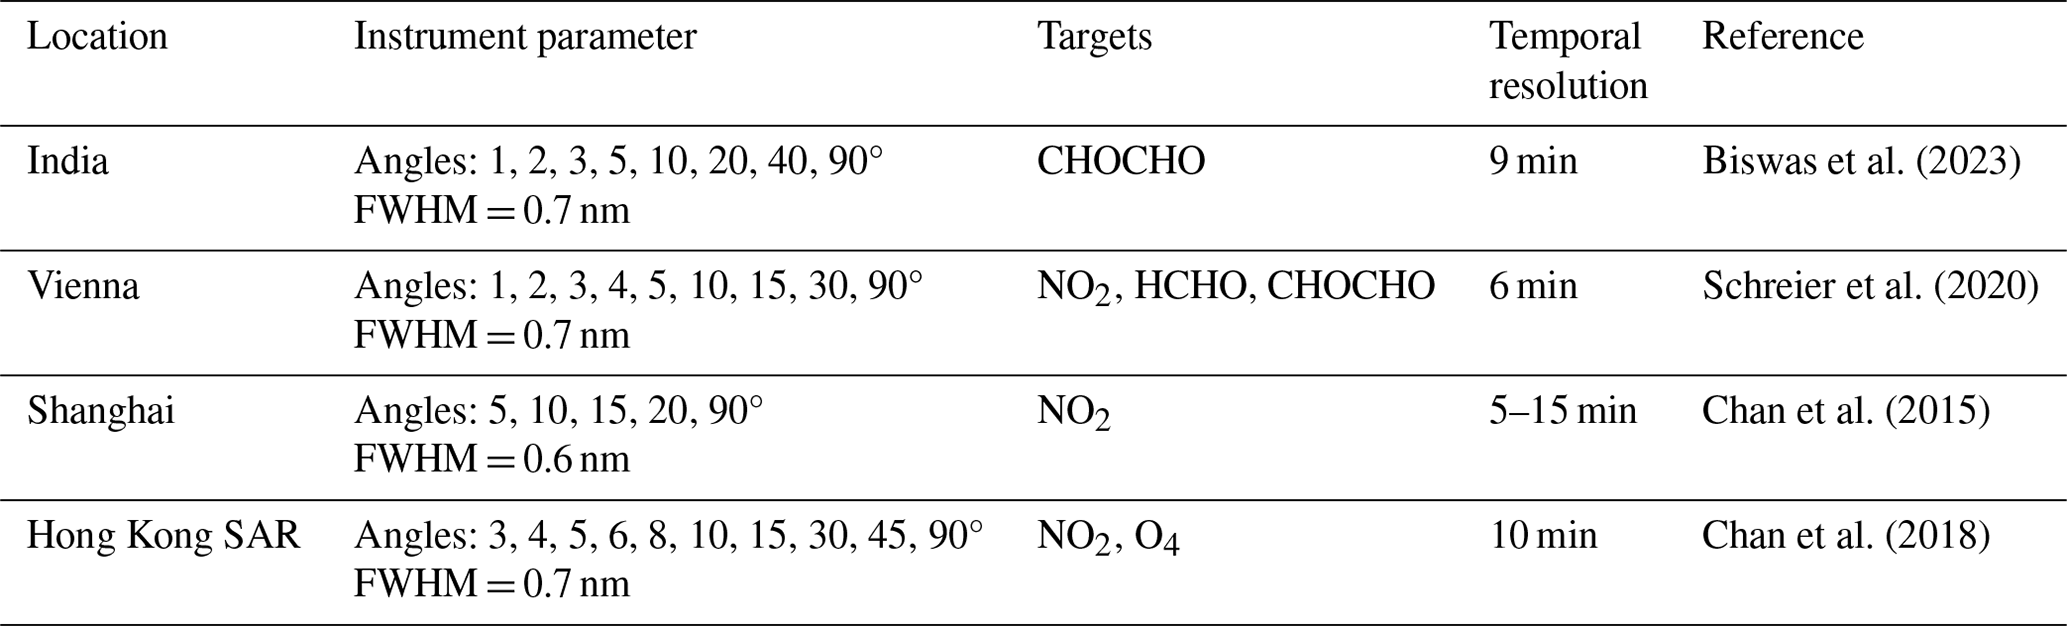
At present, detection methods for NO2 and HCHO mainly include electrochemical sensors, Fourier transform infrared spectroscopy (FTIR), laser-induced fluorescence (LIF) spectroscopy, differential absorption lidar (DIAL) technology, and differential optical absorption spectroscopy (DOAS). Traditional chemical methods can be traced back to the 1950s; however, these methods are currently not widely used due to certain deficiencies in data quality. Researchers at the University of Liège in Belgium (Franco et al., 2015) used ground-based FTIR and multi-axis DOAS (MAX-DOAS) to obtain the HCHO profile at a station in the Swiss Alps. They also employed a chemical transport model to simulate the total column volume and compared it with the data from the two instruments. Researchers at the University of L'Aquila (Di Carlo et al., 2013) developed a thermal-dissociation laser-induced fluorescence instrument to measure NO2 and compared it with a chemiluminescence system to evaluate the instrument's performance. The DOAS technology is a non-contact measurement method with a broad measurement range and an extensive monitoring range, capable of simultaneously measuring multiple gases. Researchers at the Korea Advanced Institute of Science and Technology (Lee et al., 2005) verified the feasibility of the long-path DOAS (LP-DOAS) system for the simultaneous measurement of NO2, SO2, and HCHO in Asian urban areas, with a detection limit at the parts-per-billion level. As a passive DOAS technology, MAX-DOAS uses sunlight as the light source, which makes it easy to operate and detect the vertical profiles of multiple gases simultaneously. Researchers at Heidelberg University in Germany (Hönninger and Platt, 2002) took the lead in using MAX-DOAS for the first time in Canada's ALERT2000 polar sunrise experiment. In this experiment, the observation mode of each off-axis angle was introduced based on the zenith angle to obtain the vertical profile of BrO, and it was found that differential slant column densities (dSCDs) decreased with the increase in elevation angle, which can be traced back to an earlier study by Sanders et al. (1993), who used off-axis geometry to observe stratospheric OClO in Antarctica. Leigh et al. (2006) from the University of Leicester in the UK developed a device for synchronous observation at off-axis angles to monitor rapidly changing urban NO2 concentration, which improved the time resolution and proved the potential of the synchronous observation method to gather information on rapidly changing NO2 concentrations and spatial distribution in the environment. However, they did not investigate the vertical profile distribution of NO2 any further. In recent years, research on MAX-DOAS gas profile inversion has matured. Ojeda Lerma et al. (2021) used four MAX-DOAS instruments to collect scattered solar radiation with a telescope that performs multi-angle scans, and they compared the NO2 data with those of the Ozone Monitoring Instrument (OMI). However, the configuration of the MAX-DOAS system, which depends on stepper motors to adjust the telescope angle, has hardly changed (Heckel et al., 2005; Tian et al., 2019; Wang et al., 2017). The efficiency of spectral collection in MAX-DOAS needs improvement, and enhancing the temporal resolution of MAX-DOAS is crucial for studying the gas profile distribution using mobile MAX-DOAS. Table 1 presents the time resolutions, which are generally low, of various MAX-DOAS systems that have been used worldwide in recent years.
Table 1The time resolution of some MAX-DOAS systems in the world. FWHM denotes full width at half maximum.
In this study, we introduce a fast synchronous MAX-DOAS system capable of swiftly acquiring trace gas profiles. Combined with the concept of multi-channel spectroscopy, simultaneous observations at multiple elevation angles are conducted, significantly enhancing the temporal resolution of spectrum acquisition. The selection of the number of binning rows in the charge-coupled device (CCD) takes into account the signal-to-noise ratio of each row of pixels to improve spectral quality. A two-step acquisition strategy is adopted in the acquisition program to mitigate the differences in light intensity between high and low elevation angles. The performance of the established FS MAX-DOAS system was verified through comparative experiments with ground-based MAX-DOAS and LP-DOAS for NO2 and HCHO detection. The root mean square (rms) of the new system's spectral inversion was consistently lower than that of MAX-DOAS for an extended period. The gas profile of the FS MAX-DOAS system can also provide more information, and the FS MAX-DOAS system can quickly and accurately obtain the vertical distribution profiles of NO2 and HCHO simultaneously.
2.1 Dispersive spectrometer with binning technology
In this study, an IsoPlane series spectrometer (Princeton Instruments) was used. The core spectroscopic element is a grooved grating with high diffraction efficiency (Zhu et al., 2017). It features a patented astigmatism-free Schmidt–Czerny–Turner design spectroscopic structure. Compared with the typical Czerny–Turner optical path structure (You et al., 2004), the astigmatism on the focal plane is eliminated and the optical aberration is significantly reduced. The part that receives the spectral signal consists of a two-dimensional area array CCD. The CCD pixel binning technology (Westra et al., 2009) can greatly reduce the spectrum collection time. Binning occurs in the charge domain, making it essentially a noise-free operation. This leads to lower readout noise and an increased signal in the register due to the sum of multiple pixel signals. Consequently, this leads to a higher spectral signal-to-noise ratio and faster signal output rate. However, the disadvantage is that a certain spectral resolution is sacrificed.
2.2 MAX-DOAS retrieval
MAX-DOAS technology combines multiple observation elevation angles to measure the atmospheric spectrum. It is different from active DOAS technology, which uses scattered solar light as the light source. This technology considers multiple-scattering radiation transfer models and aerosol conditions and is often used to study tropospheric trace gases such as NO2, BrO, SO2, HCHO, and H2O. The principle basis of this technology for quantitative gas analysis is the Lambert–Beer law (Platt and Stutz, 2008).
In the formula, I(λ), I0(λ), σj(λ), and cj represent the measured spectrum after atmospheric absorption and extinction, the zenith spectrum without extinction, the gas absorption cross section, and the column density, respectively, and L represents the optical path of light as it travels through the absorbing gas.
According to the initial step of spectral analysis in the MAX-DOAS method inversion process, this study used QDOAS software to calculate the differential slant column concentrations of trace gases (http://uv-vis.aeronomie.be/software/QDOAS/, last access: 26 May 2024). This process uses the least-squares fitting algorithm to solve the differential slant column concentrations of gases. It employs low-order polynomials to represent Rayleigh scattering, Mie scattering, and other broadband attenuation, with the primary focus being on analyzing the contribution of narrowband spectral structure characteristic absorption to optical thickness. Since dSCDs depend on the geometry of the observation, sun position, cloud interference, aerosol load, surface reflectivity, etc., they cannot intuitively represent the spatial information of the gas and usually need to be converted into vertical column density (VCD) (Rozanov and Rozanov, 2010).
where AMF is the atmospheric mass factor, usually determined through the atmospheric radiative transfer model (RTM). This study uses the PriAM algorithm (Wang et al., 2018; Y. Wang et al., 2013), jointly developed by the Anhui Institute of Optics and Fine Mechanics and the Max Planck Institute for Chemistry, to invert the column concentration and vertical profile of the gases. This algorithm is based on the optimal estimation algorithm and combined with the SCIATRAN model. It considers the sensitivity of the gas slant column concentration at different viewing angles to the atmosphere at various altitudes, enabling the inversion of the vertical profile of the aerosol extinction coefficient and gas volume mixing ratio (VMR). Since aerosols have a significant impact on the transmission path of light in the atmosphere, the first step of the algorithm involves calculating the weight function that corresponds to the measurement state through the RTM. This function is then used as input for the optimization method, along with the dSCDs from multiple altitude angles and gas priori profiles, to calculate the vertical profile of the aerosol extinction coefficient and aerosol optical depth (AOD). The second step is to input the aerosol profile, aerosol single-scattering albedo, and asymmetry factor into the RTM. The gas concentration vertical distribution inversion algorithm is used to obtain the gas tropospheric (0–4 km) VMR vertical distribution profile and VCD (Ren et al., 2021; Wang et al., 2017).
In the study of the MAX-DOAS detection of trace gases, the spectral resolution is directly related to the accuracy of the DOAS inversion. The FS MAX-DOAS system we constructed aims to simultaneously obtain high-temporal-resolution profiles of NO2 and HCHO. This section analyzes the optimal resolution for detecting the two gases simultaneously. The characteristic absorption bands of the gases under study are located in different spectral bands. Combined with the spectral band of the FS MAX-DOAS system, the optimal UV inversion bands for the two gases were determined based on the recommended configuration of the international CINDI campaign: HCHO, 336.5–359 nm, (Pinardi et al., 2013) and NO2, 338–370 nm (Roscoe et al., 2010). The high-resolution standard absorption cross sections for trace gas analysis were obtained from the MPI-Mainz UV/VIS database. The QDOAS software can automatically identify the resolution of the entire detection spectrum band and convolved it with the standard absorption cross section σ(λ) (units: cm2 molec.−1) to achieve the same resolution level as the spectrum being analyzed. The differential absorption cross section σ′(λ) (units: cm2 molec.−1) can be expressed as
In the formula, G(x) is a Gaussian instrument function (unit: nm).
3.1 Effects of resolution on absorption characteristics
σ′(λ) is obtained by convolving the high-resolution gas standard absorption cross section with the instrument function of different spectral resolutions, as shown in Fig. 1. As the σ′(λ) values of NO2 and HCHO continue to increase with Γ0, the shapes of their characteristic absorption structures change. The main manifestations are as follows: there is a shift in the position where the strongest absorption structure appears; the characteristic absorption of the gas molecules becomes flat at lower resolutions, and the fine feature absorption at high resolutions gradually disappears; simultaneously, a decrease in resolution also reduces the differential absorption cross-section value, and the overall height of the characteristic absorption bands decreases.
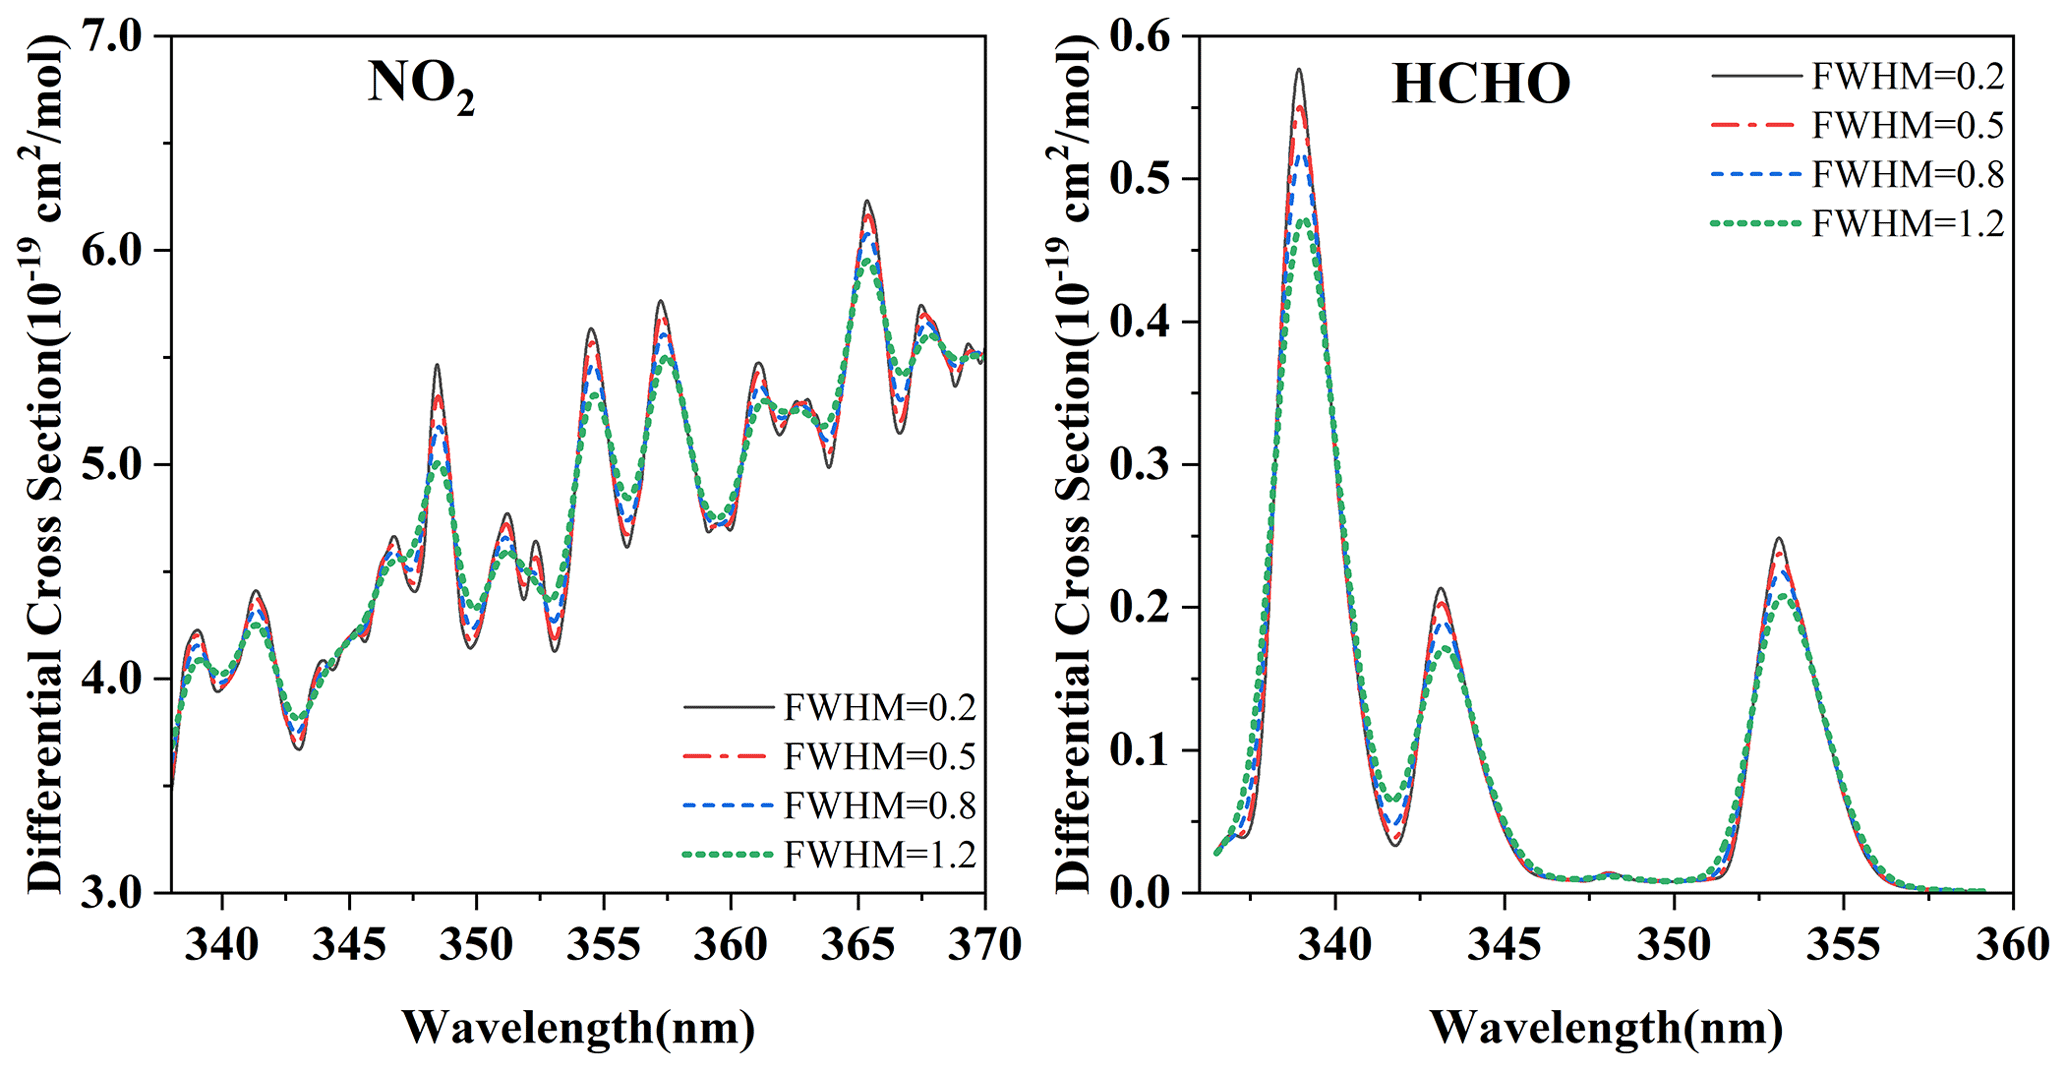
Figure 1Differential absorption cross sections of NO2 and HCHO at different spectral resolutions.
3.2 Effects of resolution on the differential absorption cross section
DOAS technology mainly measures the differential optical thickness (D′) of the gas. The D′ of gas as a function of resolution Γ0 (unit: nm) is proportional to its differential absorption cross section σ′(λ). As Γ0 increases, the value of σ′(λ) continuously decreases, and due to the differences in the characteristic absorption of different gases across different bands, their trend changes with Γ0 differ. Two wavelengths with strong absorption for the two gases being measured are selected, and the relative changes in the differential absorption cross sections at different resolutions are calculated. Figure 2 shows the changing trend of the maximum σ′(λ) of the gas with Γ0 at the selected wavelengths.
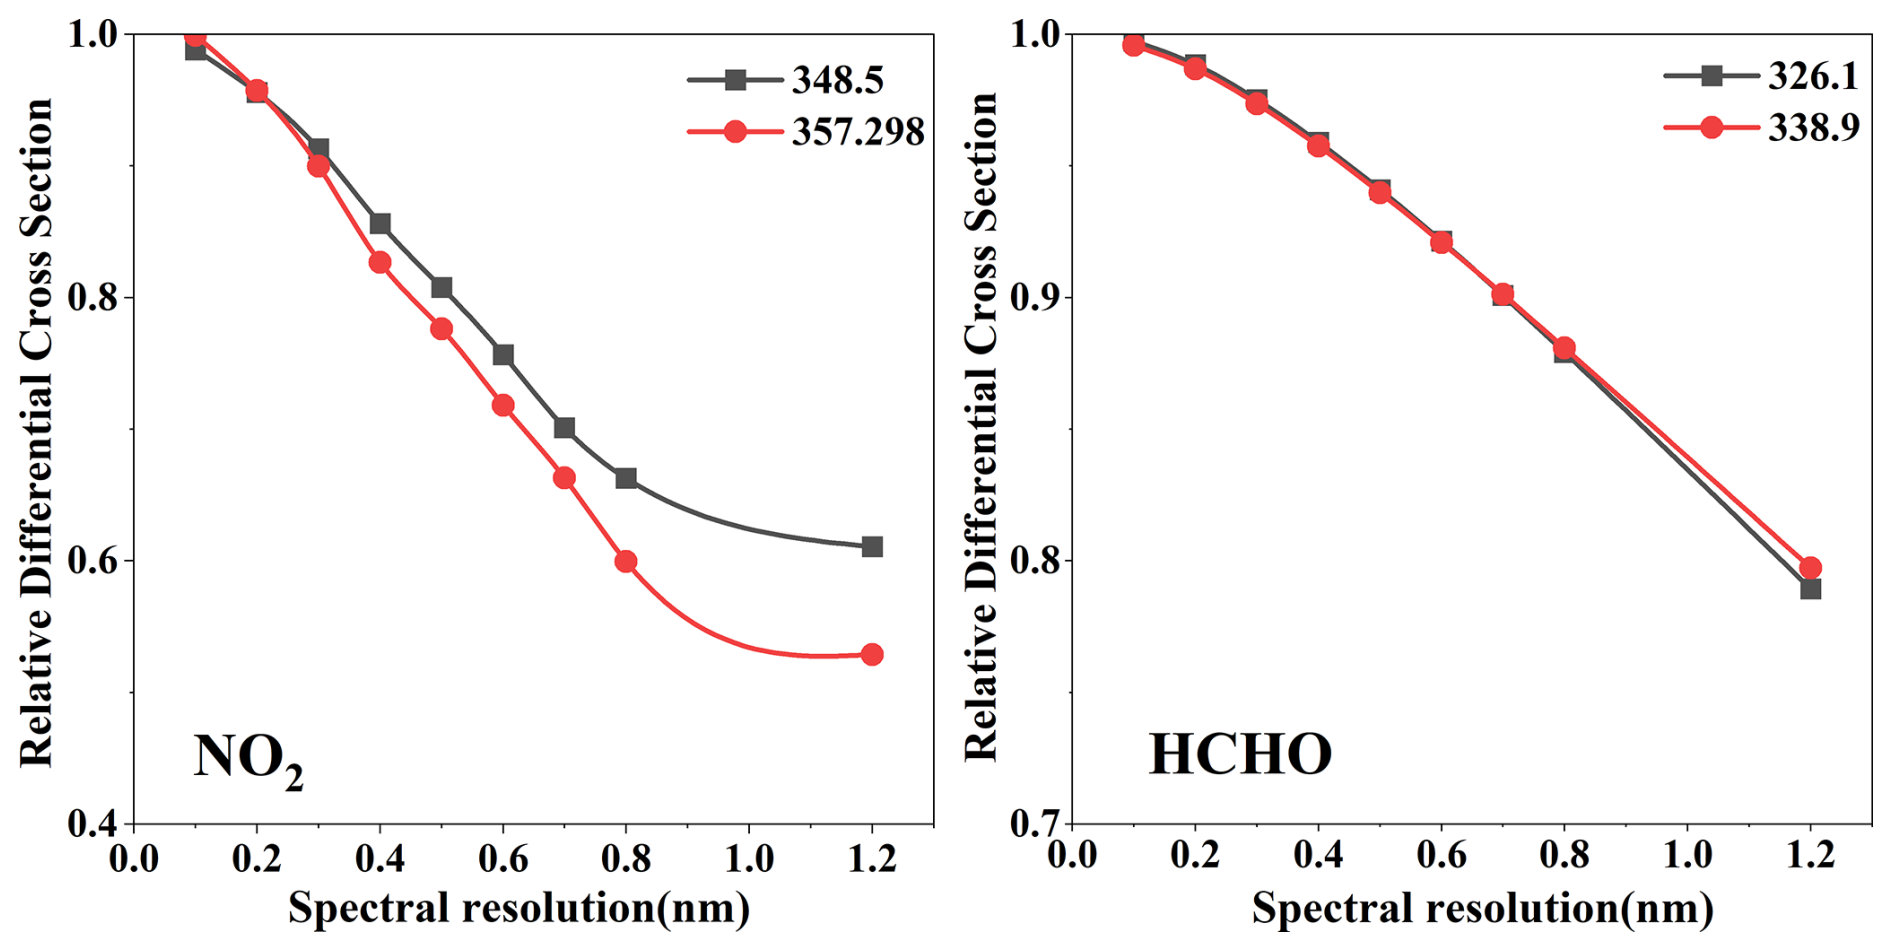
Figure 2The changing trend of the differential absorption cross section of NO2 and HCHO with resolution.
It can be seen from the figure that the slope changes in the two curves of HCHO are basically the same, indicating that the influence of Γ0 on the differential absorption cross-section value σ′(λ) of HCHO is consistent at different wavelengths. The slope change in the NO2 curve is significantly larger. The influences of Γ0 on σ′(λ) vary significantly at different wavelengths. For NO2, when Γ0 is greater than 1 nm, the decreasing trend of σ′(λ) slows down. Therefore, even the same gas is affected differently by the resolution at different absorption wavelengths. Although the change in σ′(λ) with Γ0 is more complicated, in general, the differential absorption cross-section value decreases as the resolution value increases. Ignoring the influence of other factors, the minimum detection limit of the gas concentration is
where cmin (units: molec. cm−3) is the minimum detectable concentration of the gas, D0 (dimensionless) is the minimum detectable optical thickness, and is the differential absorption cross section of the gas at a certain wavelength and resolution. σ′(λ) decreases as Γ0 increases. Considering Eq. (4), the detection limit of gas decreases as Γ0 increases. Therefore, in order to reduce the detection limit, the system should ensure a smaller Γ0, that is, a higher spectral resolution.
3.3 Effects of resolution on the signal-to-noise ratio
Theoretically, as long as σ′(Γ0) is any function of Γ0 (it decreases as Γ0 increases), σ′(Γ0) can be approximated as a linear function of Γ0:
where b (dimensionless) is a constant. The relationship between the signal-to-noise ratio and Γ0 can be obtained:
Among the variables in Eq. (6), N = D0 (dimensionless) and the signal-to-noise ratio (SNR) has a quadratic-function relationship with Γ0. In order to obtain the best SNR, the derivative of the quadratic function can be set to 0, and the optimal resolution Γ0 opt is
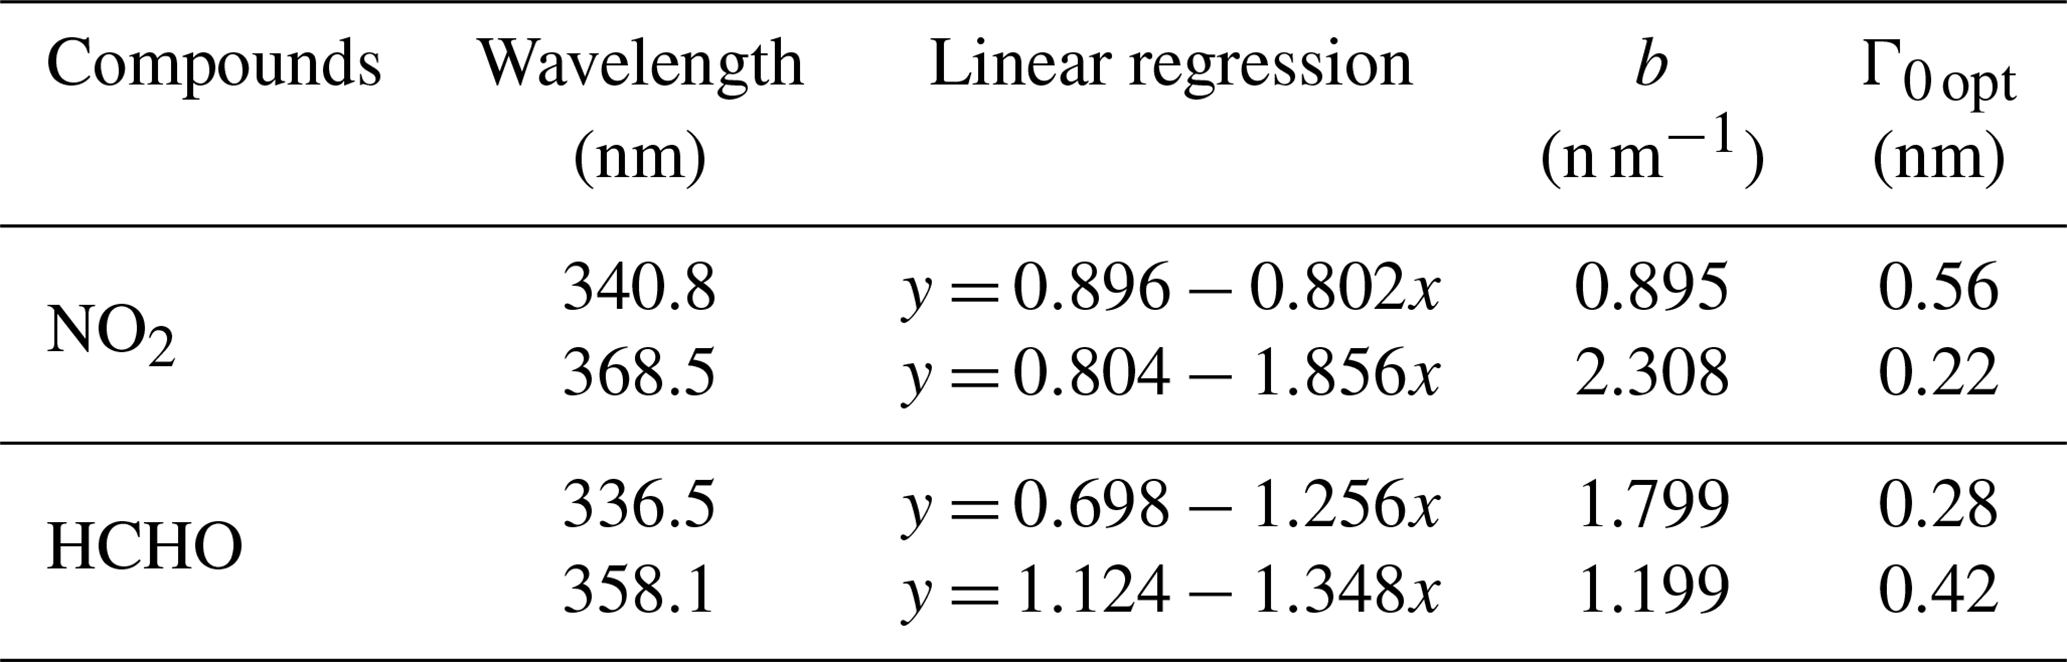
The values of b of the measured gas at different wavelengths were obtained through linear fitting. The fitting process is explained using 348.6 nm of NO2 as an example in Fig. 3. The calculation of the optimal resolution for the other gases is similar. The b values of NO2 and HCHO in different wavebands and their corresponding Γ0 opt values obtained by fitting are listed in Table 2. If two gases are detected simultaneously, the system should ensure that the spectral resolution is optimally between 0.3 and 0.6 nm.
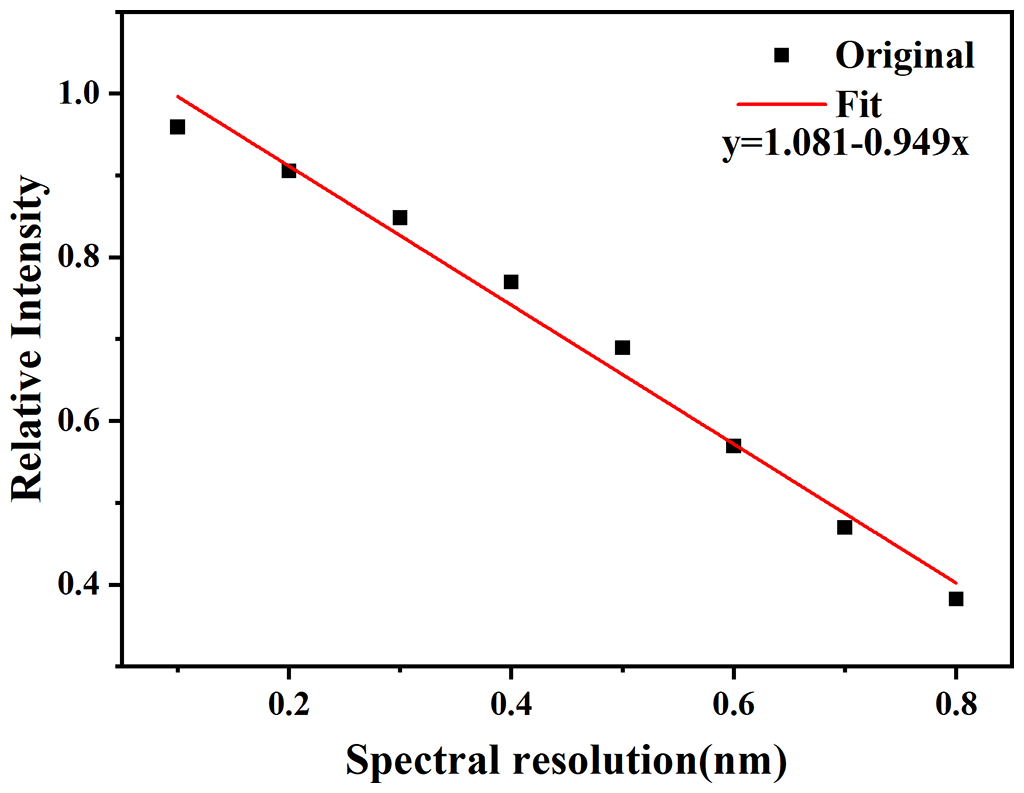
Table 2Linear relationship between the differential absorption cross section and spectral resolution.
4.1 Experimental system and parameter configuration
4.1.1 Experimental device
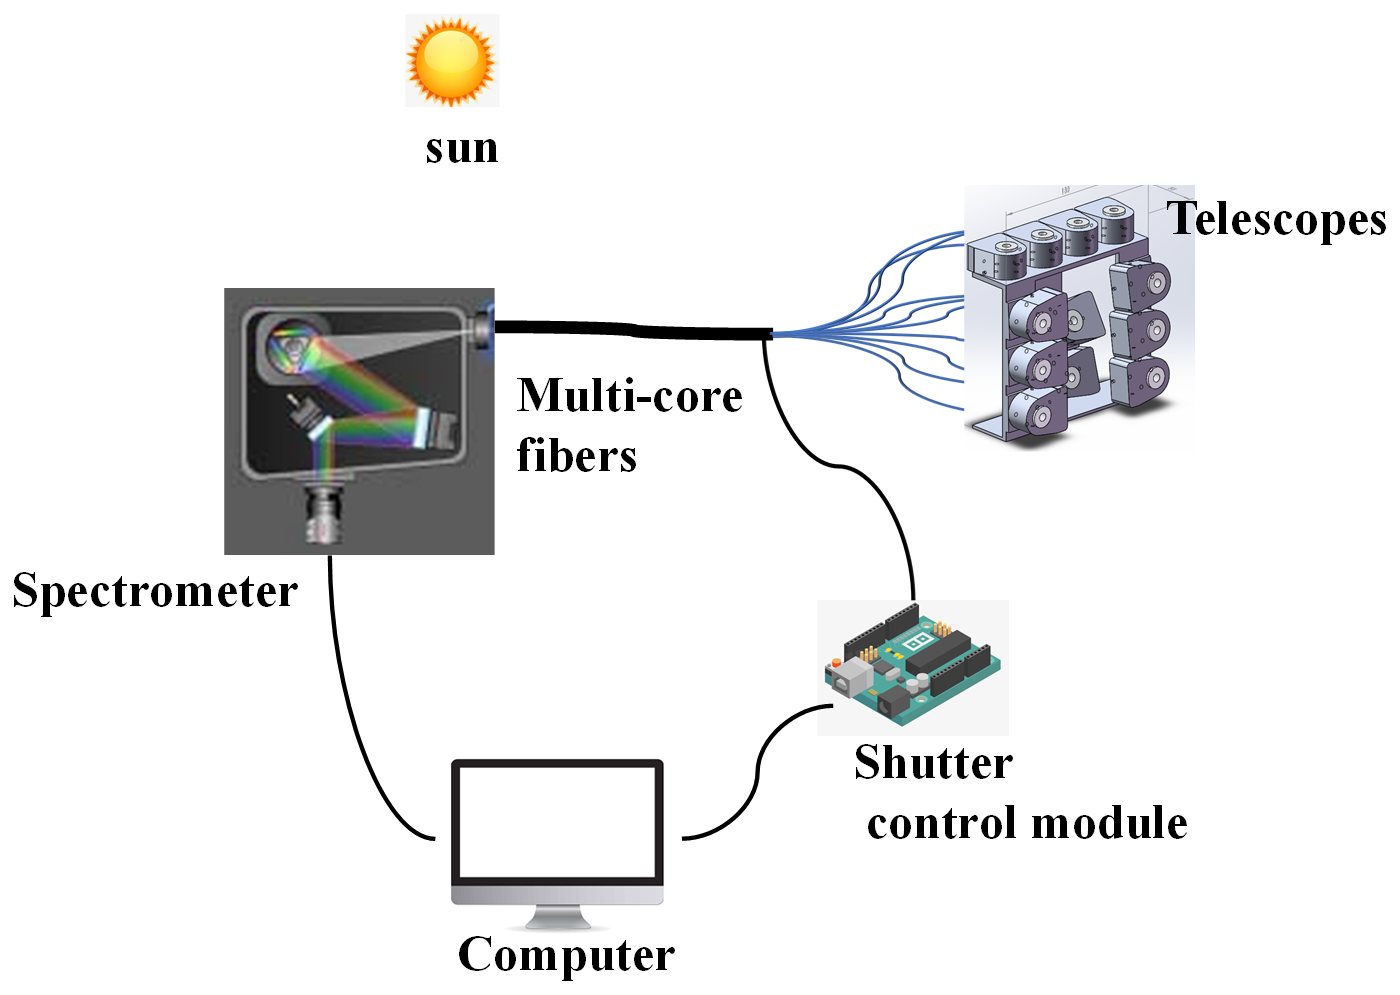
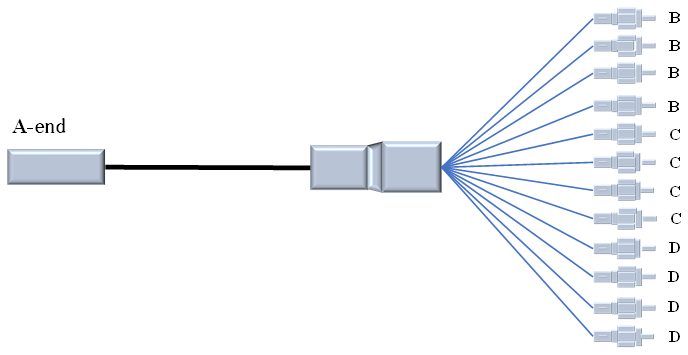
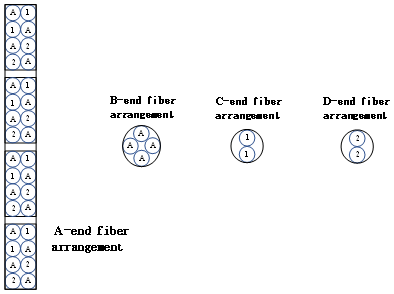
The fast synchronous MAX-DOAS (FS MAX-DOAS) instrument we built is illustrated in Fig. 4. The spectrometer used was the IsoPlane series from Princeton Instruments. We acquired a diffraction grating that fulfills the specifications for wavelength range and resolution. We used Princeton Instrument's fully integrated low-noise PIXIS camera series, which features thermoelectric cooling to −75 °C to effectively minimize dark-current noise. It has a built-in area array CCD with pixel specifications of 512 × 2048 px. The ultraviolet anti-attenuation fiber used was also especially designed, as shown in Fig. 5. The overall structure features a multi-mode multi-core design (Takenaga et al., 2011). The front end of the spectrometer's slit was connected to form a bundle, while the other end connected to the telescope was divided into 12 bundles. The 12 split beams were divided into three groups: B, C, and D; one group includes four beams, as shown in the fiber end face in Fig. 6. Each split bundle of class C and D integrates two cores hat correspond to a viewing angle. In other words, each viewing angle can illuminate two binning areas in the CCD; in order to ensure that each viewing angle spectrum has its corresponding 90° spectrum, four cores were integrated into each class B beam, corresponding to two viewing angles. The A end connected to the spectrometer was combined and divided into four small areas to maximize the use of the CCD imaging surface. The eight inner cores in each area were arranged in a crossed Y-shaped structure. The fiber design meets the requirement that the spectra of low angles and their corresponding 90° responses originate from the same CCD region. This design helps suppress the differences in the spectral structure caused by variations in CCD performance. To achieve simultaneous multi-angle collection, telescopes that receive scattered light must be redesigned. We designed a compact and lightweight achromatic triplet lens optimized for the UV band (290–400 nm) (Tang et al., 2020). In order to avoid crosstalk between signals at various angles, the field-of-view angle needs to be within 1°, and the actual field-of-view angle range of the designed lens is 0.52–0.72°, which satisfies the experimental requirements. We have also developed a multi-channel electromagnet mechanical shutter control system to switch between the low-angle and 90° angle telescopes. The computer sent instructions to the microcontroller following the established serial communication protocol. A shutter corresponds to a byte address and is controlled independently. The control byte has only two states: on and off. In this way, the shutter was controlled to open at the required angle to receive the optical signal. This allowed for obtaining spectra from both low angles and 90° angles without interference between them.
4.1.2 Optical parameters of each channel
We use the idea of multi-channel spectroscopy to partition the entire area array CCD into multiple sections, creating independent spectral detection systems with a spectrometer and telescopes. Therefore, it is necessary to evaluate the optical parameters of each channel, and according to the analysis in Sect. 3.3, the optimal resolution ranges for NO2 and HCHO inversions are different. When selecting the grating specification and slit width for the experiments, comprehensive consideration must be given to select a configuration that can simultaneously satisfy the inversion of both gases. The spectral resolution of a fiber spectrometer system is determined by the fiber core diameter, the number of grating lines, and the slit width. In theory, when the fiber core diameter is determined, the greater the number of grating lines and the narrower the slit, the higher the resolution (Li et al., 2020). The system used an 1800 g m−1 grating and a slit width of 300 µm. The optical parameters of each channel, as listed in Table 3, were tested. Combined with the analysis of the optimal resolution for detecting two gases in Sect. 3, the resolution of each channel of this system covers a range of 0.3–0.6 nm, meeting the requirements for the simultaneous detection of the two gases.
Table 3Optical parameters of each optical fiber core. FOV denotes field of view.
4.2 Collection control method
4.2.1 Number selection of binning rows
An excessively large binning area can easily lead to the inclusion of spectra from other neighboring angles, thereby impacting the quality of the spectrum within that area. It was necessary to select the number of qualified rows according to the SNR for binning.
For the receiving-module CCD camera in the FS MAX-DOAS system, the SNR is an indicator of the imaging quality (Cota et al., 2009). During the CCD imaging process, in addition to the real signal, a series of uncertain noises are also introduced (uncertainty in the optical signal itself, thermal motion of electrons, electronic noise, etc.). The first part is the shot noise generated by the uncertainty in the optical signal, the second part is the dark current due to the thermal motion of the electrons, and the third part is the readout noise caused by the signal interference from the on-chip amplifier (D. Wang et al., 2013). In the experiment, the CCD was cooled to −70 °C to reduce the dark-current noise.
According to the theoretical SNR analysis, quantitative analysis is still necessary to enhance the spectral quality and improve the SNR of CCD cameras. Experimental analysis, calculations, and specific tools were used in order to facilitate signal collection. The signal value output from the fiber spectrometer system is a value mixed with noise. Therefore, an approximate calculation method was used to determine the corrected average value of the output signal, which represents the signal effective value (unit: counts) and the average value of the signal jitter corresponding to the noise value (unit: counts), and the SNR (dimensionless) is then also calculated.
The (unit: counts) of a single pixel is obtained from Eq. (9), (unit: counts) is the average value of multiple measurements of the ath pixel under lighting conditions with a certain integration time, and (unit: counts) is the average value of the dark background measured without light under the same conditions. The average value of signal jitter is represented by the rms of the jitter values measured multiple times by a single pixel, which satisfies
N (dimensionless) is the number of measurements used to calculate the average, and Uai (unit: counts) is the ith measurement value of the ath pixel. Substituting Eqs. (5) and (6) into Eq. (7), the signal-to-noise ratio of a single pixel SNRa is
From the above analysis, it is known that the SNR of the fiber spectrometer is related to the degree of pixel exposure. Therefore, the SNR calculation is based on the degree of exposure achieved during the actual data collection process. The pixels were analyzed according to the level of exposure attained during the actual collection process. A broadband light source was used to scan multiple times in both clear and dark conditions to obtain the pixel data for exposed and non-exposed areas, respectively. Equation (8) is used to calculate the SNR of the pixels in the illuminated area of each binning area. The SNR of the 2–3 lines at the upper and lower edges of 15 lines in each area is lower, ranging between 64.1 and 82.2, while the more concentrated part of the spectrum signal in the middle lines mostly falls between 97.5 and 123.1. In practical measurements, it should be noted that reducing the number of rows necessitates increasing the integration time to achieve a certain light intensity, which will compromise the time resolution. Taking comprehensive considerations into account, the binning area in the experiment mostly consists of 10–12 rows. The SNR of each row was higher than 100 to ensure the quality of the collected spectra.
4.2.2 Optimized collection of scattered light at pitch angles
The conventional MAX-DOAS system typically employs a motor to rotate the lens to adjust the angle of spectrum collection. Since only one angle of light enters the spectrometer at a time, each angle does not interfere with the other. It is easier to control the integration time to achieve the same spectral intensity level for all angles (Pinardi et al., 2013). The angles of the lens in this experiment were based on the MAX-DOAS setting (Zhang et al., 2023). The multi-channel combined optical fiber was used to collect spectra of all pitch angles (1, 2, 3, 5, 8, 10, 15, and 30°) simultaneously, However, there was a significant disparity in light intensity at each angle, making it impossible to ensure uniform light intensity levels at each angle with the same integration time. In DOAS inversion, accurate results are only achieved when the spectrum reaches sufficient light intensity, and in order to minimize the cycle time of low angles, it is not suitable to divide low angles into multiple groups. A high-speed electronic shutter controller was also designed in the experiment. The control program divides the pitch angles into two parts (1, 2, 3, and 5° form one group, and 8, 10, 15, and 30° form another), ensuring that the light intensity of the collected spectrum meets the inversion requirements.
5.1 Spectral retrieval
The FS MAX-DOAS system achieves continuous operation through the automatic acquisition program. The basic strategy is to first control the integration time to achieve the desired light intensity conditions and then adjust the averaging time to ensure a constant total acquisition time for each spectrum. The integration time is affected by weather and lighting conditions. Spectra with a long integration time and poor quality must be excluded during the actual spectrum processing. All measured spectra were subjected to bias and dark-current correction (Chan et al., 2019) and analyzed using the QDOAS software (http://uv-vis.aeronomie.be/software/QDOAS/, last access: 26 May 2024). The fitting wavebands of NO2 and HCHO were 338–370 and 336.5–359 nm, respectively. This study used the zenith spectrum (α = 90°) at noon local time each day as the reference spectrum for analyzing dSCDs. A low-order polynomial was added to the fitting to eliminate broadband structures caused by Rayleigh and Mie scattering. The settings for the DOAS inversion of these gases are listed in Table 4. Figure 7 shows an example of the DOAS fitting of NO2 and HCHO in the spectrum at a 15° observation angle on 24 October 2023. The dSCD of NO2 is 6.78×10¹⁶ molec. cm−2, with rms = , while the dSCD of HCHO is 1.89×10¹⁶ molec. cm−2, with rms = .
Table 4Parameter configurations of QDOAS inversion for NO2 and HCHO; “√” means the parameters were used in the inversion.
5.2 Comparison of NO2 and HCHO MAX-DOAS dSCDs
The FS MAX-DOAS system is located on the seventh floor of the laboratory building at the Hefei Institutes of Physical Science, Chinese Academy of Sciences. A comparative test was carried out on 16–18 May 2024, using the motor-scanned ground-based MAX-DOAS system. Both sets of equipment were oriented to the south, and NO2 and HCHO were measured simultaneously. The specific positions are shown in Fig. 8. The weather was good and cloudless during the experiment, typical of early summer, and the lighting conditions varied greatly throughout the day. Before the actual inversion, the low-quality spectra with excessively long integration times were first removed. Subsequently, the QDOAS results with high rms values and abnormal concentration fluctuation values were deleted. The data were mostly concentrated between 09:00 and 16:00 Beijing time (BJT, known as China standard time internationally, UTC+8) during the day.
Figure 8The specific location of the FS MAX-DOAS and MAX-DOAS systems (from © Google Maps).
Figures 9 and 10 show the rms, dSCD errors, dSCD trends, and correlation of NO2 and HCHO retrieved from spectra collected at several angles by FS MAX-DOAS and MAX-DOAS during the observation period. The FS MAX-DOAS system collected the data at each angle simultaneously. Although two-step processing was performed at low angles, one cycle was essentially completed in approximately 1.5 min. In contrast, the MAX-DOAS system uses a motor to scan a single scope, with one cycle lasting for 8 min (the exact time may vary slightly depending on the lighting conditions). For the sake of comparison convenience, the two sets of concentration data were averaged over a 20 min period. Generally, the correlation coefficient of NO2 is higher than that of HCHO, and R exceeds 0.9. The correlation coefficient of the two sets of data at a 3° elevation angle on 17 May reached 0.978. The concentration differences in NO2 between the two devices were also smaller. The data correlation coefficient of HCHO was mostly between 0.76 and 0.85, but the correlation coefficient of the concentration data at 8° on 17 May reached 0.887. The rms and dSCD errors can be used as indices to measure the accuracy of the inversion of the DOAS dSCD. It can also be seen from the boxplot comparison of the two results that the overall rms and dSCD errors in the FS MAX-DOAS inversion of NO2 and HCHO are lower than those of MAX-DOAS. It also demonstrates that the inversion results of FS MAX-DOAS are more stable and accurate. In general, the HCHO dSCDs detected by the FS MAX-DOAS system were lower than those detected by the MAX-DOAS system. From the perspective of the concentration change trend, both NO2 and HCHO showed that the dSCD values inverted by the FS MAX-DOAS system changed more smoothly compared to the MAX-DOAS data, which exhibited more fluctuations. The difference can be attributed to the lower temporal resolution of MAX-DOAS and the increased data fluctuations after time-average processing.
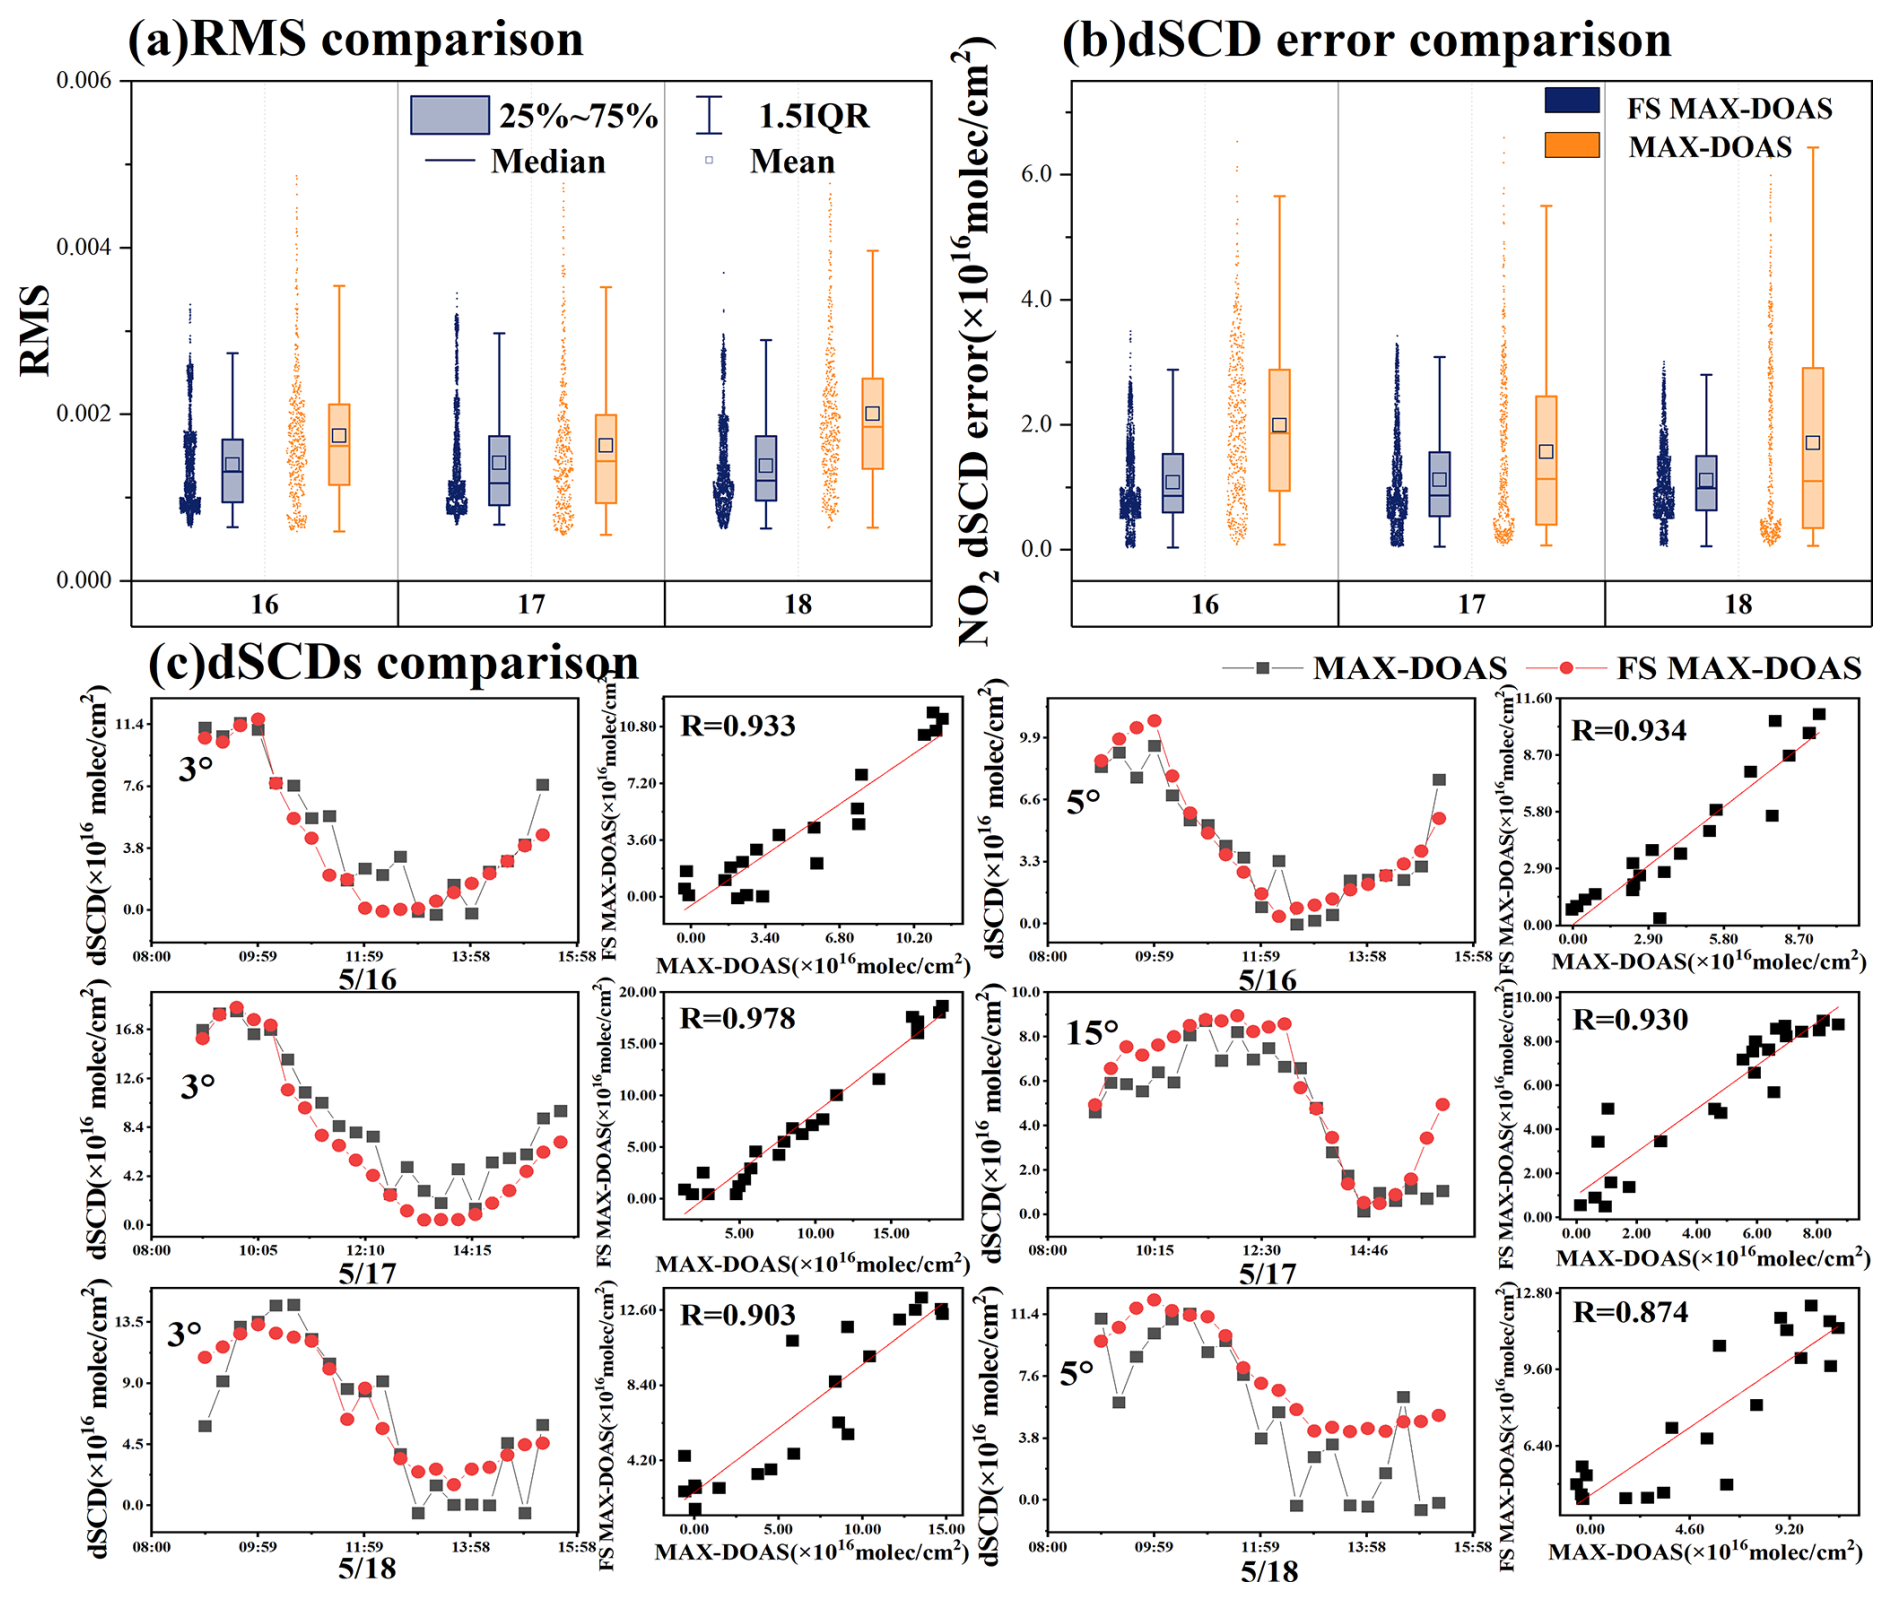
Figure 9Comparison of NO2 results between FS MAX-DOAS and MAX-DOAS (20 min average processing): (a) rms results, (b) dSCD error results, and (c) dSCD results. Panels (a) and (b) give the day, and the date format for panel (c) is month/day.
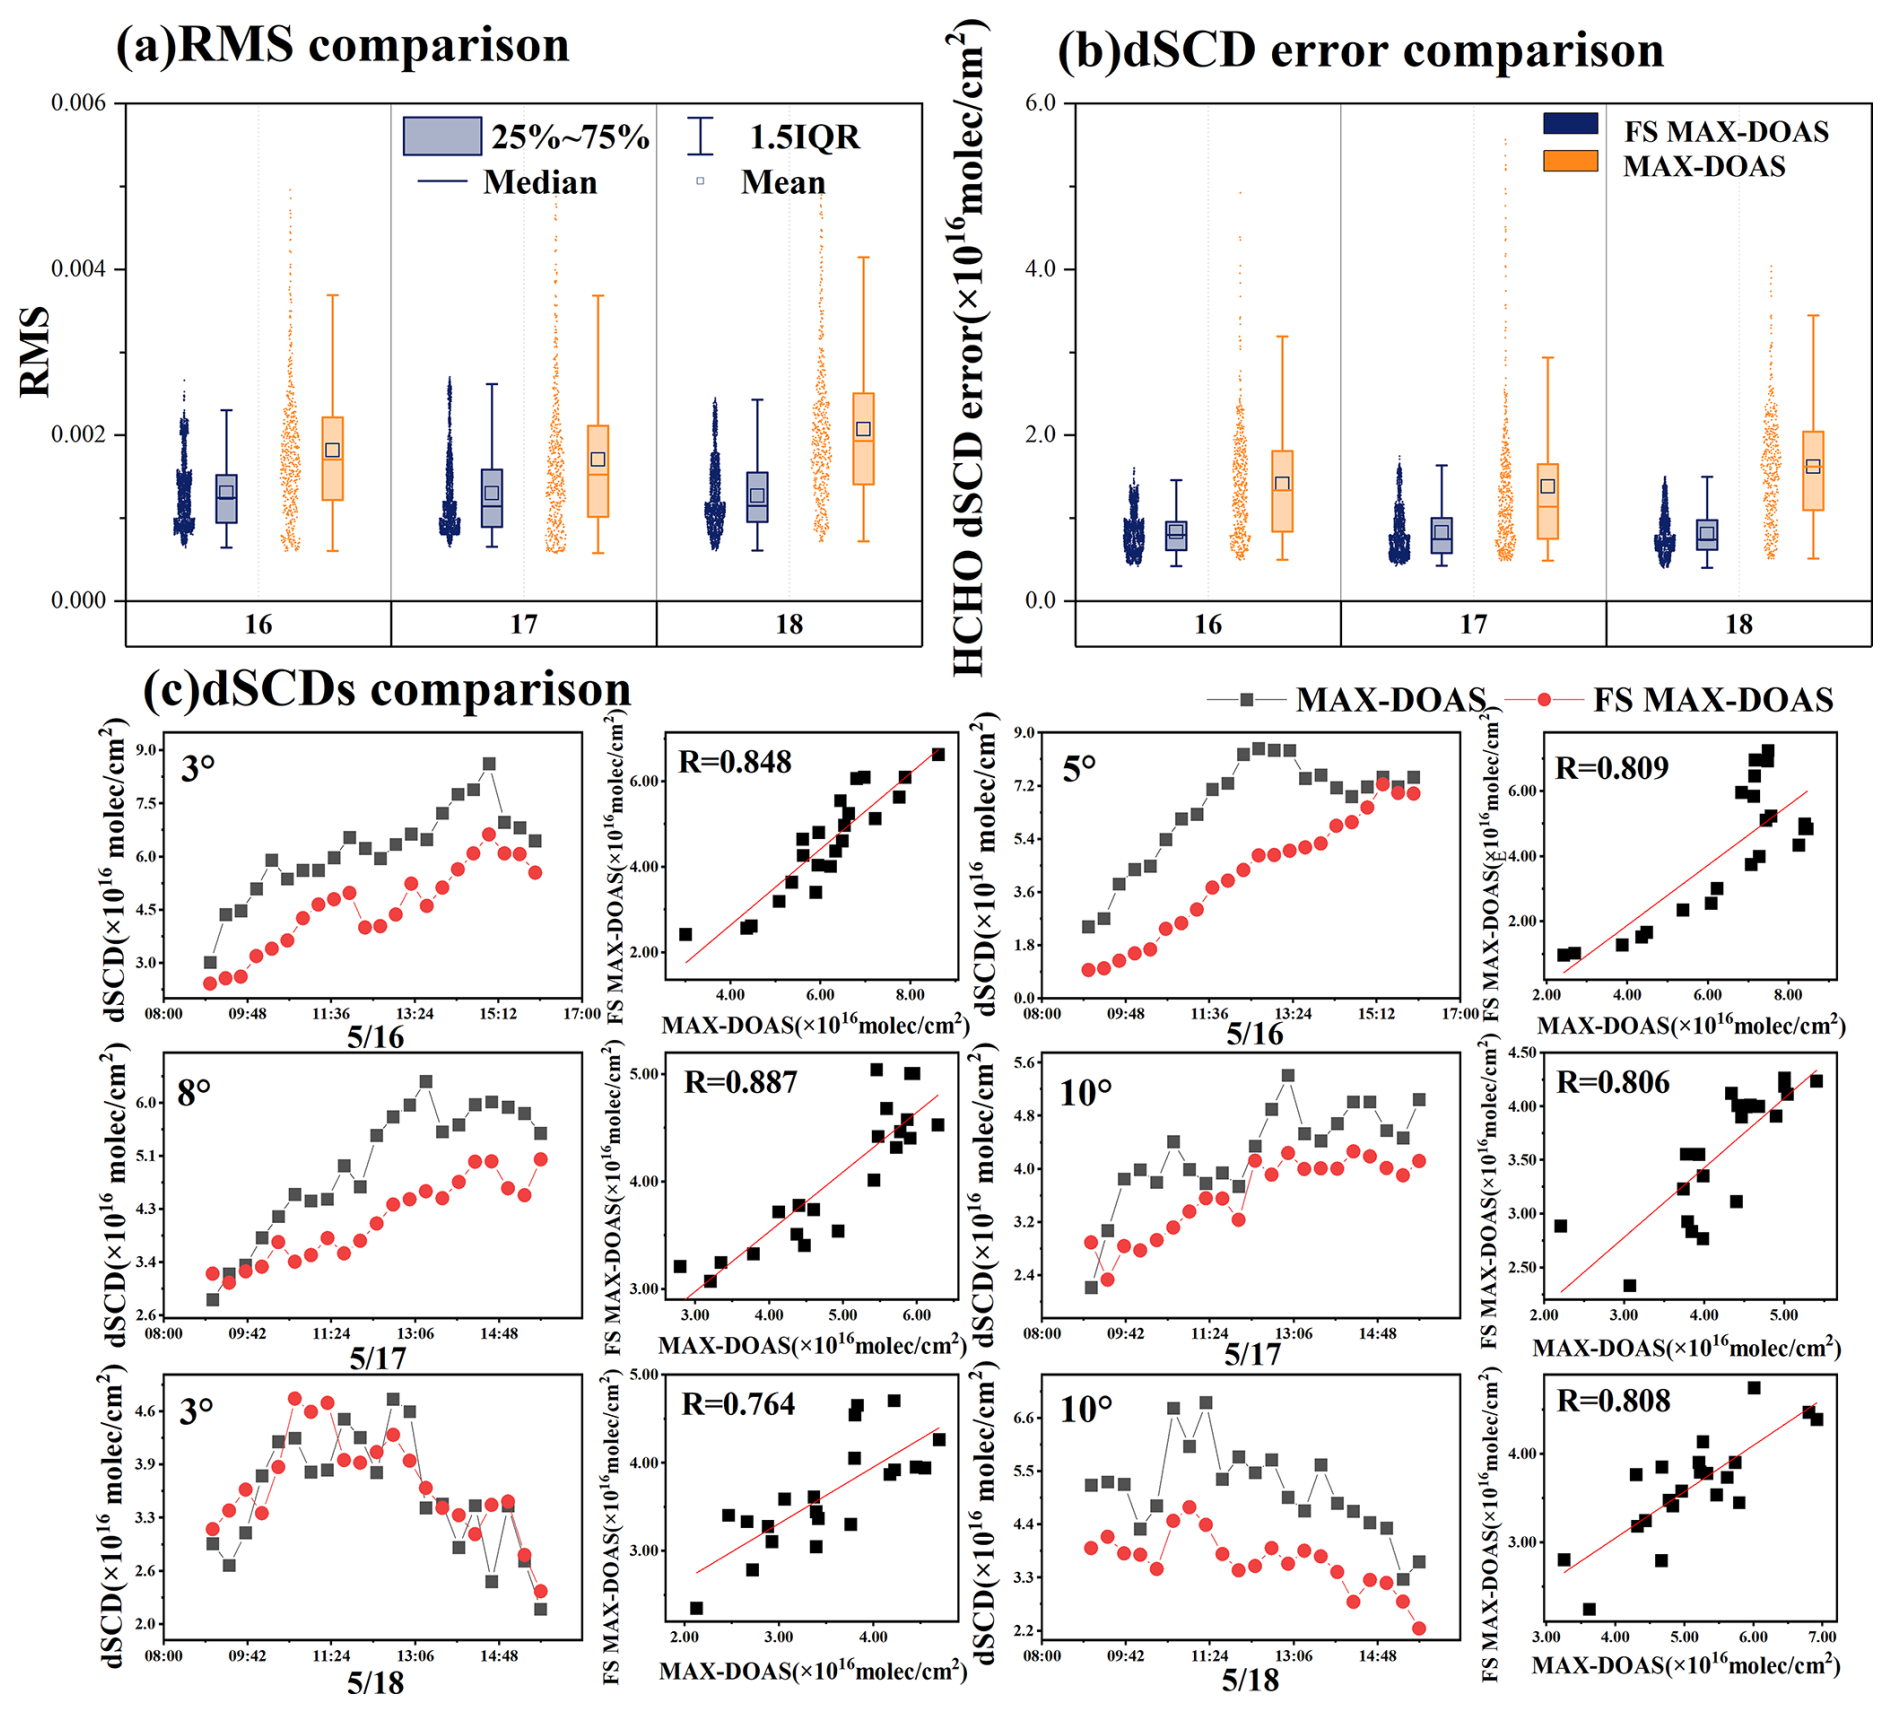
Figure 10Comparison of HCHO results between FS MAX-DOAS and MAX-DOAS (20 min average processing): (a) rms results, (b) dSCD error results, and (c) dSCD results. Panels (a) and (b) give the day, and the date format for panel (c) is month/day.
5.3 Vertical profiles of NO2 and HCHO
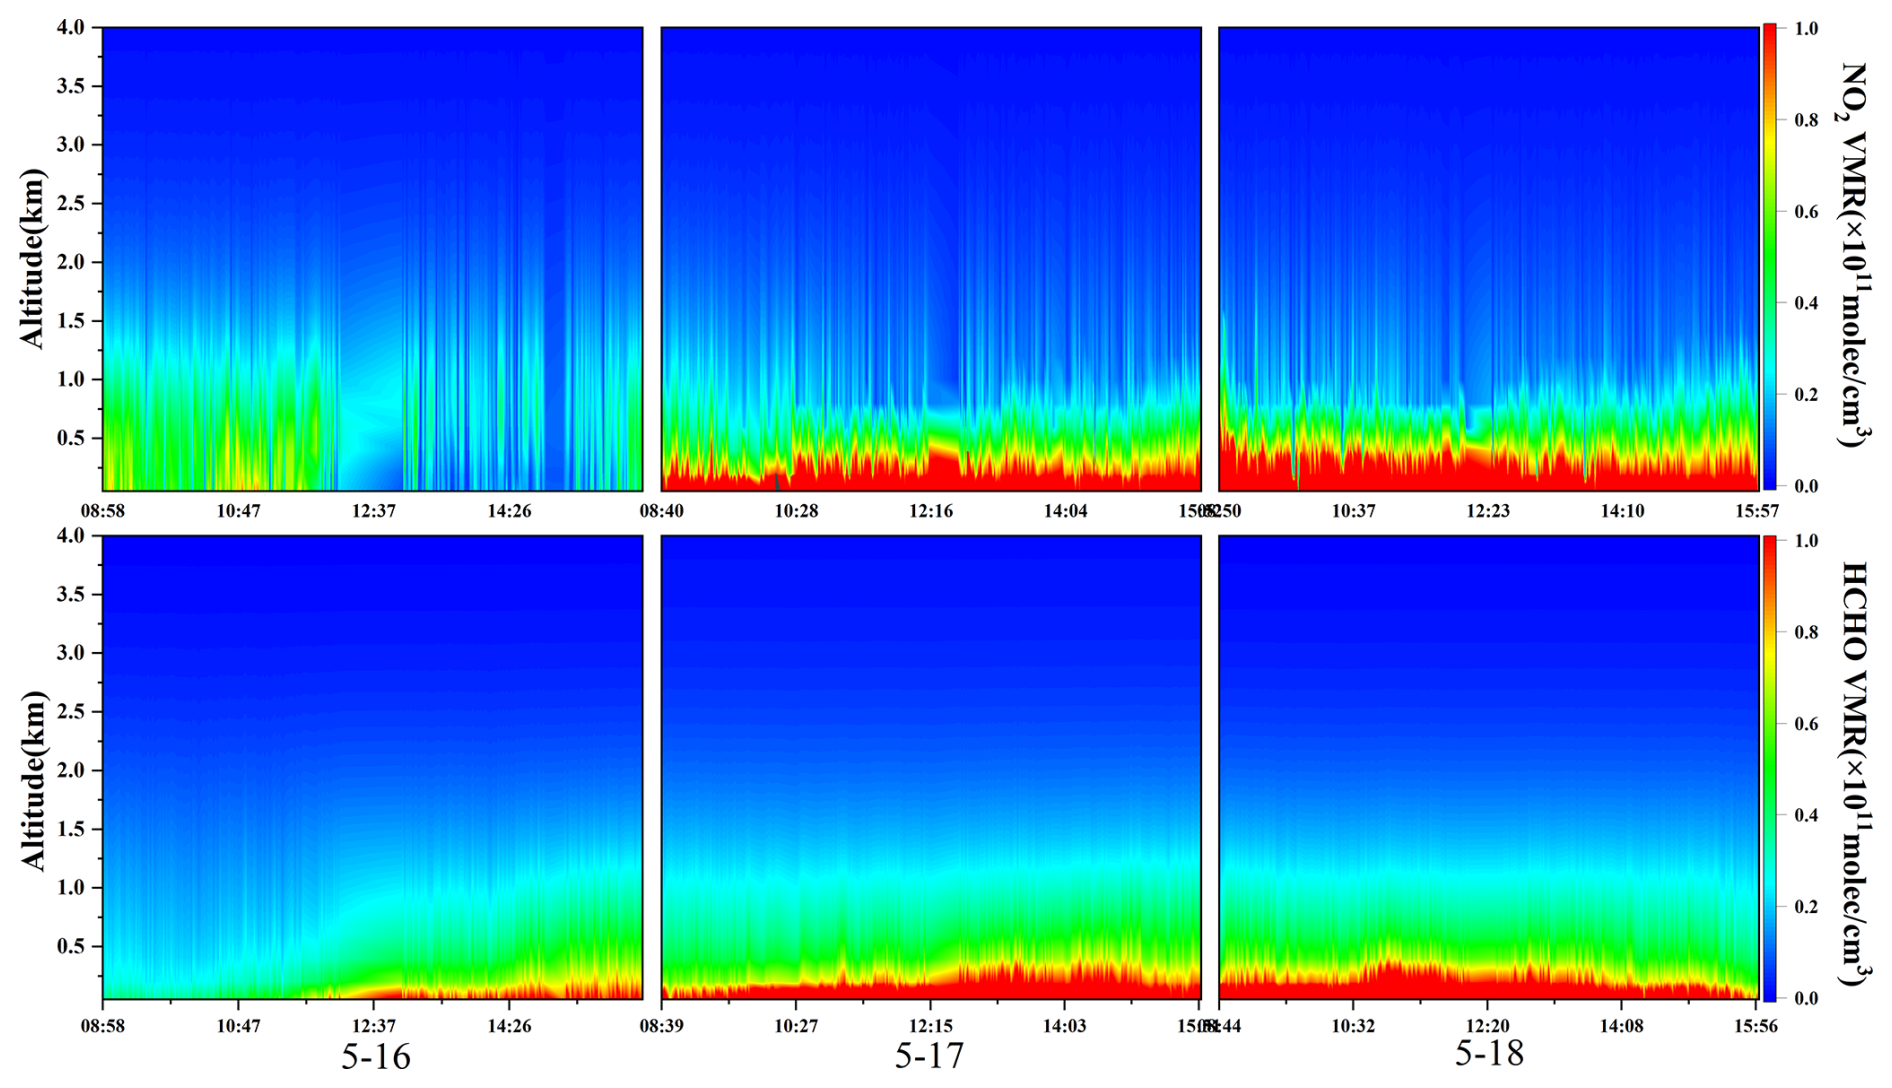
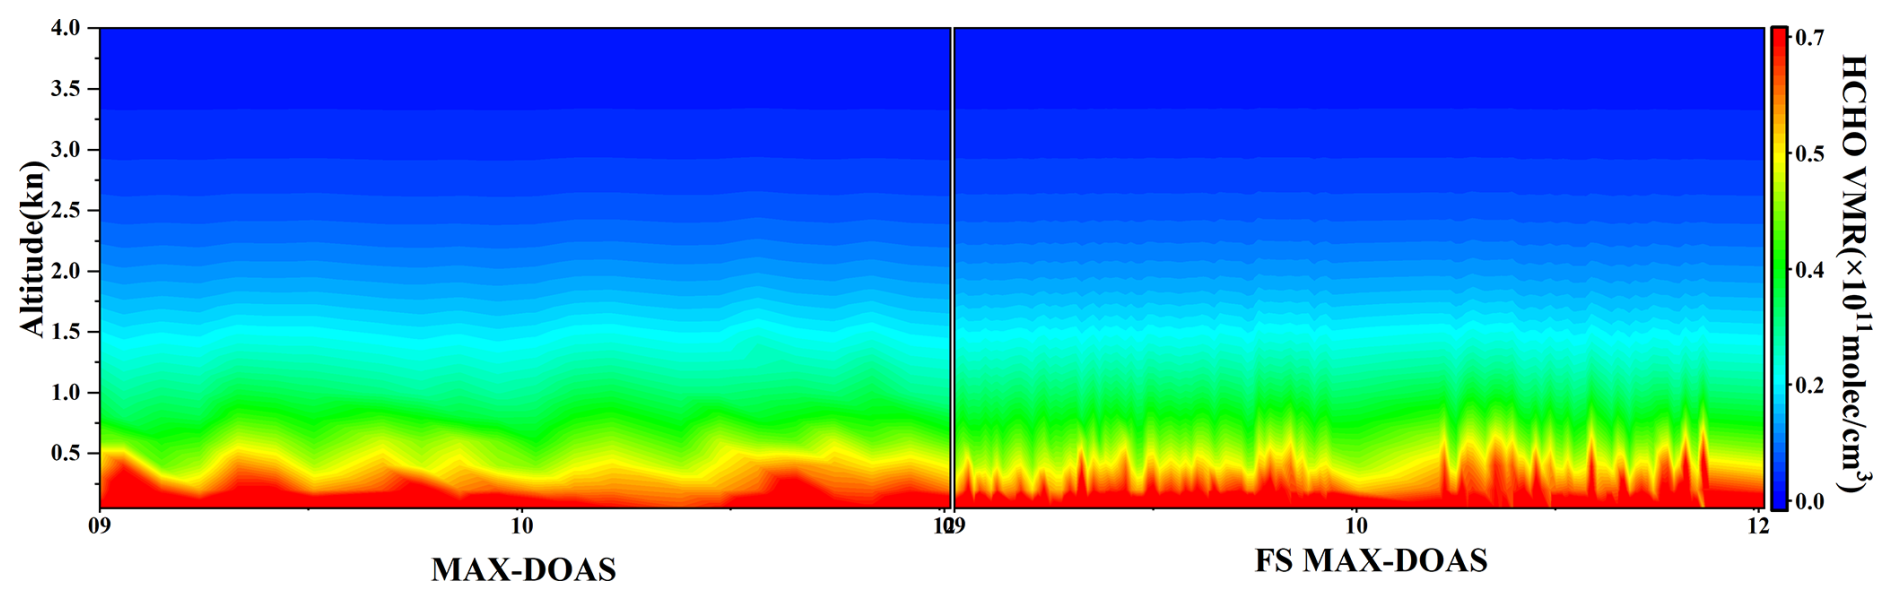
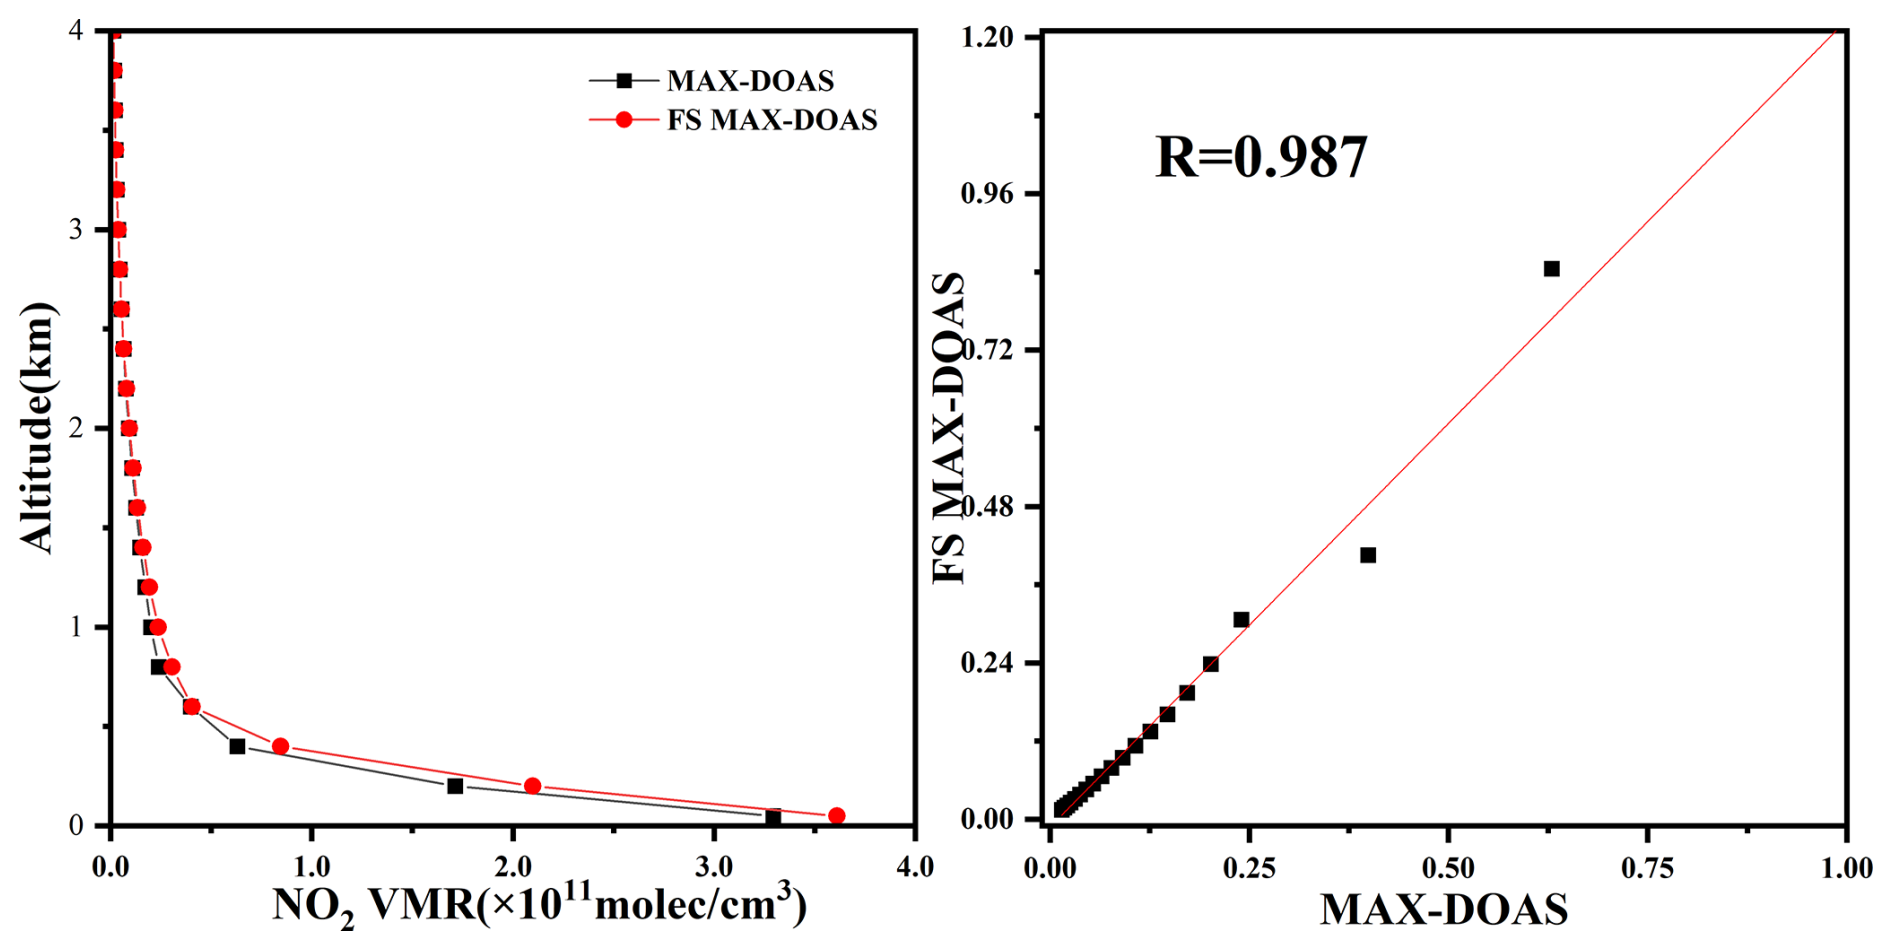
The PriAM algorithm was used to further analyze the trace gas slant column concentration obtained in this observational experiment. Vertical profiles of NO2 and HCHO of 4 km in length were generated, as shown in Fig. 11. NO2 exhibited significant pollution levels throughout the day from 17 to 18 May during the observation period and was transported vertically. The concentration levels were lower than those in autumn and winter. However, the high concentration of HCHO in early summer was related to the photochemical oxidation promoted by strong solar radiation and high temperature. From 16 to 18 May, there were consecutive sunny days. A continuous process of pollution accumulation can be observed in Fig. 11, where the vertical distribution of HCHO was generally lower than that of NO2. Figure 12 shows a comparison of the original vertical profiles of HCHO obtained by the two systems on 17 May. The trend of change was consistent during the time period from 09:00 to 12:00 LT. Since FS MAX-DOAS significantly improves the time resolution, the profile on the right is more detailed than the one on the left. However, the concentration value of the profile measured by the new method was slightly different from that of MAX-DOAS within a height of 1 km, typically varying by around 8 %. Figure 13 shows the comparison of a single vertical distribution of NO2 measured by the two systems at 10:23 LT on 17 May. Both distributions follow an exponential pattern, and the correlation coefficient between them is 0.987.
5.4 NO2 surface volume mixing ratio (VMR) comparison of LP-DOAS
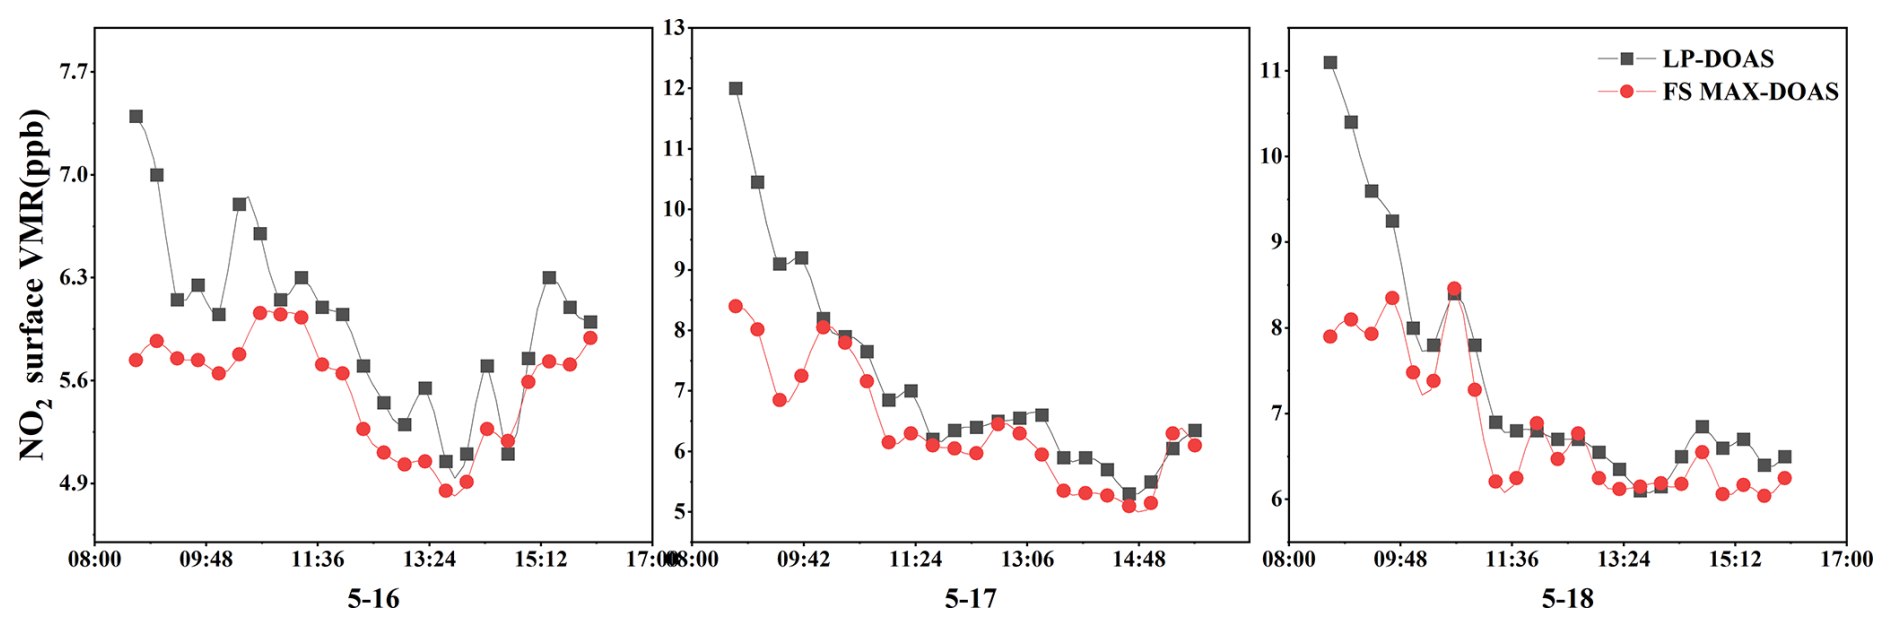
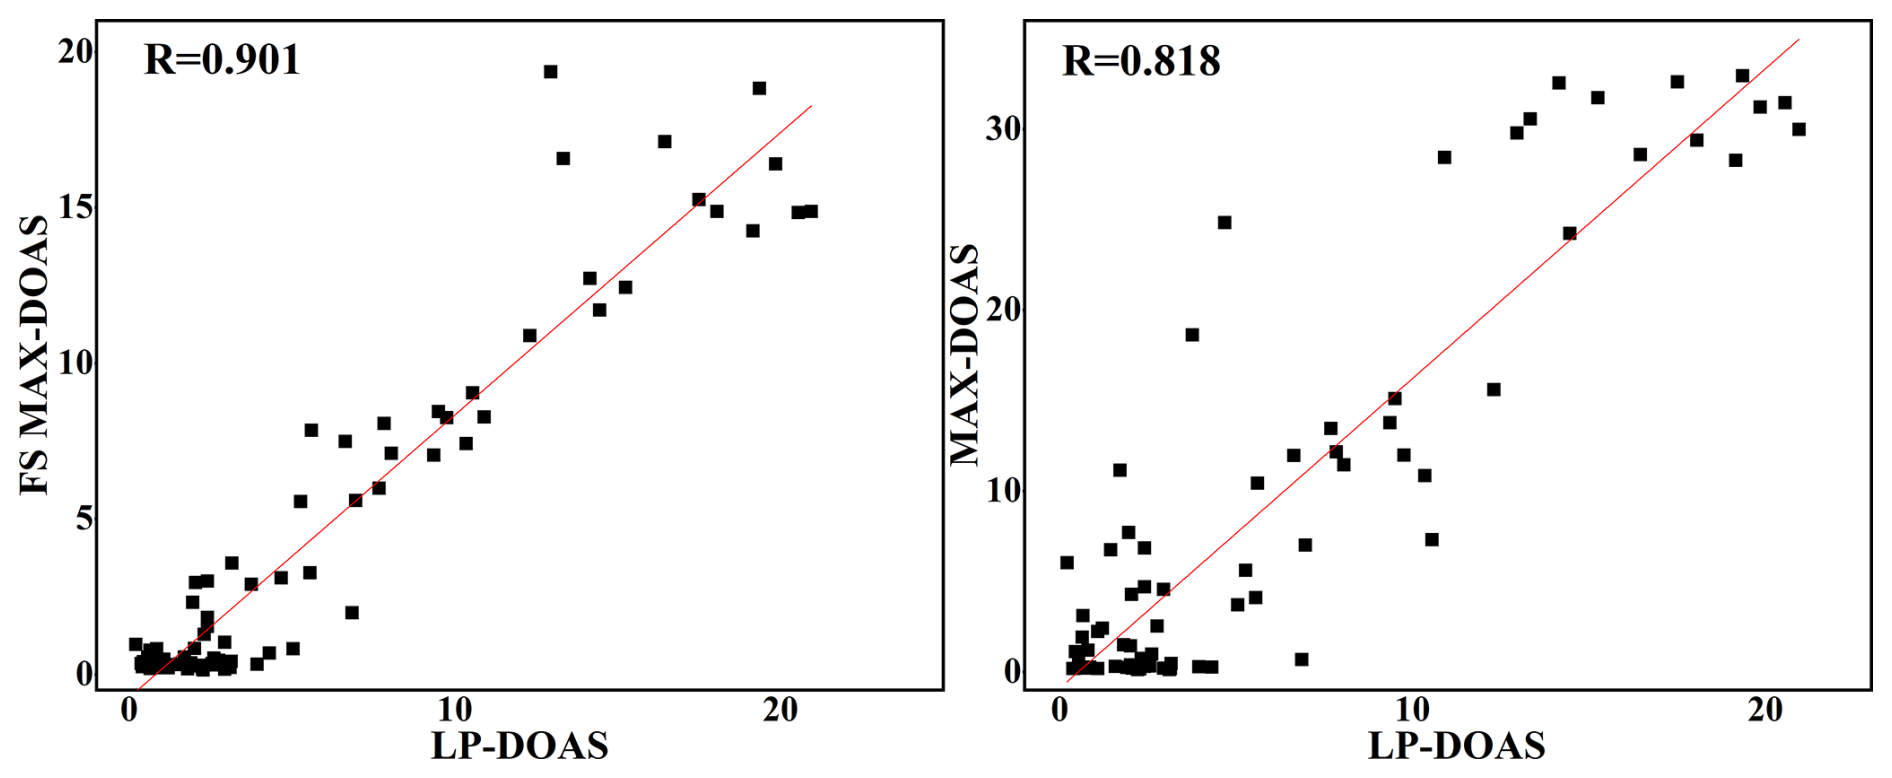
During the measurement period of this experiment, an LP-DOAS system was placed on the sixth floor of the laboratory building for long-term operation. It can measure NO2, SO2, HCHO, and other gases. Owing to the abnormal data of HCHO measured by LP-DOAS, Fig. 15 only compares the near-surface VMR of NO2 from FS MAX-DOAS and LP-DOAS. Generally, the concentration change trends of the two instruments were consistent, showing obvious diurnal variation characteristics of being high in the morning and starting to decrease at noon, The near-surface VMR of LP-DOAS was generally higher than that of FS MAX-DOAS. This LP-DOAS system measured the average value within the 700 m optical path between the telescope and the reflector; the specific instrument location is shown in Fig. 14. MAX-DOAS usually measures the average value over an effective optical path of approximately 10 km, and variations in the measured air mass lead to specific systematic discrepancies. The telescope of the LP-DOAS instrument was on the sixth floor of the laboratory building, while the reflector was on the sixth floor of “Building One”, and there is Innovation Avenue in the middle. In addition, the high volume of vehicles on this road during morning working hours caused the measured value of LP-DOAS to be much higher than that of FS MAX-DOAS before 10:00 LT. The linear correlations between the NO2 VMR measured by FS MAX-DOAS and MAX-DOAS with LP-DOAS were compared. The Pearson correlation coefficients of the two variables were 0.880 and 0.747, respectively, as shown in Fig. 16.
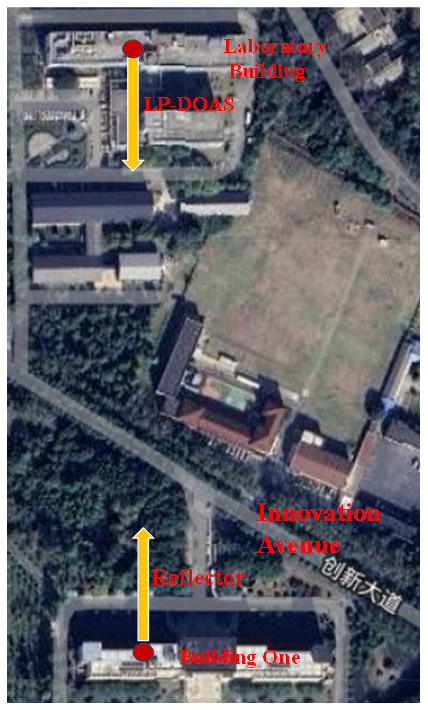
Figure 14LP-DOAS telescope and reflector position (optical path of 700 m, from © Google Maps).
This article introduces an experimental system for rapidly acquiring trace gas profiles using multi-channel spectroscopy. The system controlled the angle of the telescopes as needed through the shutter switching module to capture scattered light. This light then entered the spectrometer at various locations on the area array CCD. Subsequently, the light was binned into spectral information with different pitch angles, significantly enhancing the time resolution of spectral collection. The optimal resolution range (0.3–0.6 nm) for gas inversion was determined through simulation and analysis of the impact of spectral resolution on the detection of NO2 and HCHO by FS MAX-DOAS. The system was placed on the seventh floor of the laboratory building to measure NO2 and HCHO in the actual atmosphere and compare the data with those of MAX-DOAS and LP-DOAS during the same observation period (16–18 May 2024). Among the comparison results of dSCDs at various angles between FS MAX-DOAS and MAX-DOAS, the linear correlation (R) of NO2 reached 0.9. Specifically, the angles of 3 and 5° exhibited the highest correlation coefficients. The R for HCHO ranged mostly between 0.76 and 0.85, with 10 and 3° showing the highest correlation coefficients. The results of the QDOAS inversion showed that the rms and dSCD errors in the FS MAX-DOAS spectra inversion consistently stayed lower than those of MAX-DOAS for an extended period. Owing to the improved temporal resolution, the gas profile obtained by the FS MAX-DOAS system can show more details, and the correlation coefficient of a single NO2 profile at 10:23 BJT (UTC+8) on 17 May was 0.987. Compared with the NO2 near-surface concentration measured by the LP-DOAS system, both exhibit a daily variation trend characterized by higher levels in the morning that start to decrease at noon. Due to the concentrated emissions from vehicles on the road in the morning and the difference in the optical path of the two systems, the concentration value of LP-DOAS before 10:00 LT was significantly higher. In terms of correlation coefficients, the Pearson coefficient of FS MAX-DOAS (R = 0.901) with LP-DOAS was higher than that of MAX-DOAS (R = 0.818). This study modifies the previous mode of motor switching scopes and overcomes the limitation of low measurement time resolution. From the perspective of the dSCD inversion, the gas concentration in the new system was more stable, and the rms value was lower. During the experiment, only a few data sources could be compared for data analysis. In future studies, a variety of data sources will be considered for comparison. This work can also be integrated with mobile platforms for navigational observation research, which is crucial for achieving mobile MAX-DOAS profile measurements. It can also be considered for implementing other forms of gas profile detection, such as for SO2. For industrial point source emissions, the FS MAX-DOAS system will be used on a mobile platform with a three-axis stabilized head, and we will adopt the tomography scheme to scan and reconstruct the two-dimensional distribution of the smoke plume.
Data underlying the results presented in this paper are not publicly available at this time but may be obtained from the authors upon reasonable request.
JX: conceptualization, methodology, software, writing (original draft). AL: supervision, conceptualization, methodology, writing (review and editing). ZH: methodology, writing (review and editing). HZ: resources. MQ: data curation, resources.
The contact author has declared that none of the authors has any competing interests.
Publisher's note: Copernicus Publications remains neutral with regard to jurisdictional claims made in the text, published maps, institutional affiliations, or any other geographical representation in this paper. While Copernicus Publications makes every effort to include appropriate place names, the final responsibility lies with the authors.
We would like to thank KeTengEdit (https://www.ketengedit.com/, last access: 9 May 2024) for its linguistic assistance during the preparation of a draft version of this paper.
This research has been supported by the National Key Research and Development Project of China (grant no. 2023YFC3705601) and National Natural Science Foundation of China (grant no. 42105133).
This paper was edited by Haichao Wang and reviewed by two anonymous referees.
Biswas, M. S., Mali, P., Lerot, C., De Smedt, I., and Mahajan, A. S.: Study of atmospheric glyoxal using multiple axis differential optical spectroscopy (MAX-DOAS) in India, Atmos. Environ., 314, 120109, https://doi.org/10.1016/j.atmosenv.2023.120109, 2023.
Chan, K. L., Hartl, A., Lam, Y. F., Xie, P. H., Liu, W. Q., Cheung, H. M., Lampel, J., Pöhler, D., Li, A., Xu, J., Zhou, H. J., Ning, Z., and Wenig, M. O.: Observations of tropospheric NO2 using ground based MAX-DOAS and OMI measurements during the Shanghai World Expo 2010, Atmos. Environ., 119, 45–58, https://doi.org/10.1016/j.atmosenv.2015.08.041, 2015.
Chan, K. L., Wiegner, M., Wenig, M., and Pöhler, D.: Observations of tropospheric aerosols and NO2 in Hong Kong over 5 years using ground based MAX-DOAS, Sci. Total Environ., 619–620, 1545–1556, https://doi.org/10.1016/j.scitotenv.2017.10.153, 2018.
Chan, K. L., Wang, Z., Ding, A., Heue, K.-P., Shen, Y., Wang, J., Zhang, F., Shi, Y., Hao, N., and Wenig, M.: MAX-DOAS measurements of tropospheric NO2 and HCHO in Nanjing and a comparison to ozone monitoring instrument observations, Atmos. Chem. Phys., 19, 10051–10071, https://doi.org/10.5194/acp-19-10051-2019, 2019.
Cota, S. A., Florio, C. J., Duvall, D. J., and Leon, M. A.: The use of the general image quality equation in the design and evaluation of imaging systems, SPIE Optical Engineering + Applications, San Diego, CA, 2–6 August 2009, SPIE, 27, 74580H, https://doi.org/10.1117/12.829024, 2009.
Di Carlo, P., Aruffo, E., Busilacchio, M., Giammaria, F., Dari-Salisburgo, C., Biancofiore, F., Visconti, G., Lee, J., Moller, S., Reeves, C. E., Bauguitte, S., Forster, G., Jones, R. L., and Ouyang, B.: Aircraft based four-channel thermal dissociation laser induced fluorescence instrument for simultaneous measurements of NO2, total peroxy nitrate, total alkyl nitrate, and HNO3, Atmos. Meas. Tech., 6, 971–980, https://doi.org/10.5194/amt-6-971-2013, 2013.
Fleischmann, O. C., Hartmann, M., Burrows, J. P., and Orphal, J.: New ultraviolet absorption cross-sections of BrO at atmospheric temperatures measured by time-windowing Fourier transform spectroscopy, J. Photoch. Photobio. A, 168, 117–132, https://doi.org/10.1016/j.jphotochem.2004.03.026, 2004.
Franco, B., Hendrick, F., Van Roozendael, M., Müller, J.-F., Stavrakou, T., Marais, E. A., Bovy, B., Bader, W., Fayt, C., Hermans, C., Lejeune, B., Pinardi, G., Servais, C., and Mahieu, E.: Retrievals of formaldehyde from ground-based FTIR and MAX-DOAS observations at the Jungfraujoch station and comparisons with GEOS-Chem and IMAGES model simulations, Atmos. Meas. Tech., 8, 1733–1756, https://doi.org/10.5194/amt-8-1733-2015, 2015.
Heckel, A., Richter, A., Tarsu, T., Wittrock, F., Hak, C., Pundt, I., Junkermann, W., and Burrows, J. P.: MAX-DOAS measurements of formaldehyde in the Po-Valley, Atmos. Chem. Phys., 5, 909–918, https://doi.org/10.5194/acp-5-909-2005, 2005.
Hönninger, G. and Platt, U.: Observations of BrO and its vertical distribution during surface ozone depletion at Alert, Atmos. Environ., 36, 2481–2489, https://doi.org/10.1016/S1352-2310(02)00104-8, 2002.
Jion, Most. M. M. F., Jannat, J. N., Mia, Md. Y., Ali, Md. A., Islam, Md. S., Ibrahim, S. M., Pal, S. C., Islam, A., Sarker, A., Malafaia, G., Bilal, M., and Islam, A. R. M. T.: A critical review and prospect of NO2 and SO2 pollution over Asia: Hotspots, trends, and sources, Sci. Total Environ., 876, 162851, https://doi.org/10.1016/j.scitotenv.2023.162851, 2023.
Kuerban, M., Waili, Y., Fan, F., Liu, Y., Qin, W., Dore, A. J., Peng, J., Xu, W., and Zhang, F.: Spatio-temporal patterns of air pollution in China from 2015 to 2018 and implications for health risks, Environ. Pollut., 258, 113659, https://doi.org/10.1016/j.envpol.2019.113659, 2020.
Lee, J. S., Kim, Y. J., Kuk, B., Geyer, A., and Platt, U.: Simultaneous Measurements of Atmospheric Pollutants and Visibility with a Long-Path DOAS System in Urban Areas, Environ. Monit. Assess., 104, 281–293, https://doi.org/10.1007/s10661-005-1616-6, 2005.
Leigh, R. J., Corlett, G. K., Friess, U., and Monks, P. S.: Concurrent multiaxis differential optical absorption spectroscopy system for the measurement of tropospheric nitrogen dioxide, Appl. Optics, 45, 7504, https://doi.org/10.1364/AO.45.007504, 2006.
Li, S., Zhao, W., Xu, H., Qiu, L., and Wang, Y.: Optical system design of aberration-corrected Czerny–Turner imaging spectrometer with high resolution, Opt. Commun., 459, 125015, https://doi.org/10.1016/j.optcom.2019.125015, 2020.
Lui, K. H.: Seasonal behavior of carbonyls and source characterization of formaldehyde (HCHO) in ambient air, Atmos. Environ., 152, 51–60, https://doi.org/10.1016/j.atmosenv.2016.12.004, 2017.
Meller, R. and Moortgat, G. K.: Temperature dependence of the absorption cross sections of formaldehyde between 223 and 323 K in the wavelength range 225–375 nm, J. Geophys. Res., 105, 7089–7101, https://doi.org/10.1029/1999JD901074, 2000.
Ojeda Lerma, Z., Rivera Cardenas, C., Friedrich, M. M., Stremme, W., Bezanilla, A., Arellano, E. J., and Grutter, M.: Evaluation of OMI NO2 Vertical Columns Using MAX-DOAS Observations over Mexico City, Remote Sensing, 13, 761, https://doi.org/10.3390/rs13040761, 2021.
Pinardi, G., Van Roozendael, M., Abuhassan, N., Adams, C., Cede, A., Clémer, K., Fayt, C., Frieß, U., Gil, M., Herman, J., Hermans, C., Hendrick, F., Irie, H., Merlaud, A., Navarro Comas, M., Peters, E., Piters, A. J. M., Puentedura, O., Richter, A., Schönhardt, A., Shaiganfar, R., Spinei, E., Strong, K., Takashima, H., Vrekoussis, M., Wagner, T., Wittrock, F., and Yilmaz, S.: MAX-DOAS formaldehyde slant column measurements during CINDI: intercomparison and analysis improvement, Atmos. Meas. Tech., 6, 167–185, https://doi.org/10.5194/amt-6-167-2013, 2013.
Platt, U. and Stutz, J.: Differential optical absorption spectroscopy: principles and applications, Springer Verlag, Berlin, https://doi.org/10.1007/978-3-540-75776-4, 2008.
Ren, H., Li, A., Xie, P., Hu, Z., Xu, J., Huang, Y., Li, X., Zhong, H., Tian, X., Ren, B., Wang, S., and Chai, W.: Investigation of the Influence of Water Vapor on Heavy Pollution and Its Relationship With AOD Using MAX-DOAS on the Coast of the Yellow Sea, J. Geophys. Res.-Atmos., 126, e2020JD034143, https://doi.org/10.1029/2020JD034143, 2021.
Roscoe, H. K., Van Roozendael, M., Fayt, C., du Piesanie, A., Abuhassan, N., Adams, C., Akrami, M., Cede, A., Chong, J., Clémer, K., Friess, U., Gil Ojeda, M., Goutail, F., Graves, R., Griesfeller, A., Grossmann, K., Hemerijckx, G., Hendrick, F., Herman, J., Hermans, C., Irie, H., Johnston, P. V., Kanaya, Y., Kreher, K., Leigh, R., Merlaud, A., Mount, G. H., Navarro, M., Oetjen, H., Pazmino, A., Perez-Camacho, M., Peters, E., Pinardi, G., Puentedura, O., Richter, A., Schönhardt, A., Shaiganfar, R., Spinei, E., Strong, K., Takashima, H., Vlemmix, T., Vrekoussis, M., Wagner, T., Wittrock, F., Yela, M., Yilmaz, S., Boersma, F., Hains, J., Kroon, M., Piters, A., and Kim, Y. J.: Intercomparison of slant column measurements of NO2 and O4 by MAX-DOAS and zenith-sky UV and visible spectrometers, Atmos. Meas. Tech., 3, 1629–1646, https://doi.org/10.5194/amt-3-1629-2010, 2010.
Rozanov, V. V. and Rozanov, A. V.: Differential optical absorption spectroscopy (DOAS) and air mass factor concept for a multiply scattering vertically inhomogeneous medium: theoretical consideration, Atmos. Meas. Tech., 3, 751–780, https://doi.org/10.5194/amt-3-751-2010, 2010.
Sanders, R. W., Solomon, S., Smith, J. P., Perliski, L., Miller, H. L., Mount, G. H., Keys, J. G., and Schmeltekopf, A. L.: Visible and near-ultraviolet spectroscopy at McMurdo Station, Antarctica: 9. Observations of OClO from April to October 1991, J. Geophys. Res., 98, 7219–7228, https://doi.org/10.1029/93JD00042, 1993.
Serdyuchenko, A., Gorshelev, V., Weber, M., Chehade, W., and Burrows, J. P.: High spectral resolution ozone absorption cross-sections – Part 2: Temperature dependence, Atmos. Meas. Tech., 7, 625–636, https://doi.org/10.5194/amt-7-625-2014, 2014.
Schreier, S. F., Richter, A., Peters, E., Ostendorf, M., Schmalwieser, A. W., Weihs, P., and Burrows, J. P.: Dual ground-based MAX-DOAS observations in Vienna, Austria: Evaluation of horizontal and temporal NO2, HCHO, and CHOCHO distributions and comparison with independent data sets, Atmospheric Environment: X, 5, 100059, https://doi.org/10.1016/j.aeaoa.2019.100059, 2020.
Takenaga, K., Arakawa, Y., Sasaki, Y., Tanigawa, S., Matsuo, S., Saitoh, K., and Koshiba, M.: A large effective area multi-core fiber with an optimized cladding thickness, Opt. Express, 19, B543–B550, https://doi.org/10.1364/OE.19.00B543, 2011.
Tang, D., Chen, L., Liu, J., and Zhang, X.: Achromatic metasurface doublet with a wide incident angle for light focusing, Opt. Express, 28, 12209–12218, https://doi.org/10.1364/OE.392197, 2020.
Thalman, R. and Volkamer, R.: Temperature dependent absorption cross-sections of O2–O2 collision pairs between 340 and 630 nm and at atmospherically relevant pressure, Phys. Chem. Chem. Phys., 15, 15371, https://doi.org/10.1039/c3cp50968k, 2013.
Tian, X., Xie, P., Xu, J., Wang, Y., Li, A., Wu, F., Hu, Z., Liu, C., and Zhang, Q.: Ground-based MAX-DOAS observations of tropospheric formaldehyde VCDs and comparisons with the CAMS model at a rural site near Beijing during APEC 2014, Atmos. Chem. Phys., 19, 3375–3393, https://doi.org/10.5194/acp-19-3375-2019, 2019.
Vandaele, A. C., Hermans, C., Simon, P. C., Carleer, M., Colin, R., Fally, S., Mérienne, M. F., Jenouvrier, A., and Coquart, B.: Measurements of the NO2 absorption cross-section from 42 000 cm−1 to 10 000 cm−1 (238–1000 nm) at 220 K and 294 K, J. Quant. Spectrosc. Ra., 59, 171–184, https://doi.org/10.1016/S0022-4073(97)00168-4, 1998.
Wang, D., Xu, Y., Yao, Y., Xu, Z., and Hung, H.: Effects of electron multiplication on the CCD SNR in remote sensing application, Optik, 124, 4832–4835, https://doi.org/10.1016/j.ijleo.2013.02.037, 2013.
Wang, Y., Lampel, J., Xie, P., Beirle, S., Li, A., Wu, D., and Wagner, T.: Ground-based MAX-DOAS observations of tropospheric aerosols, NO2, SO2 and HCHO in Wuxi, China, from 2011 to 2014, Atmos. Chem. Phys., 17, 2189–2215, https://doi.org/10.5194/acp-17-2189-2017, 2017.
Wang, Y., Puķīte, J., Wagner, T., Donner, S., Beirle, S., Hilboll, A., Vrekoussis, M., Richter, A., Apituley, A., Piters, A., Allaart, M., Eskes, H., Frumau, A., Van Roozendael, M., Lampel, J., Platt, U., Schmitt, S., Swart, D., and Vonk, J.: Vertical Profiles of Tropospheric Ozone From MAX-DOAS Measurements During the CINDI-2 Campaign: Part 1 – Development of a New Retrieval Algorithm, J. Geophys. Res.-Atmos., 123, 10637–10670, https://doi.org/10.1029/2018JD028647, 2018.
Wang, Y., Li, A., Xie, P.-H., Chen, H., Mou, F.-S., Xu, J., Wu, F.-C., Zeng, Y., Liu, J.-G., and Liu, W.-Q.: Measuring tropospheric vertical distribution and vertical column density of NO2 by multi-axis differential optical absorption spectroscopy, Acta Phys. Sin., 62, 200705, https://doi.org/10.7498/aps.62.200705, 2013.
Westra, A. H., Heemskerk, J. W. T., Korevaar, M. A. N., Theuwissen, A. J. P., Kreuger, R., Ligtvoet, K. M., and Beekman, F. J.: On-Chip Pixel Binning in Photon-Counting EMCCD-Based Gamma Camera: A Powerful Tool for Noise Reduction, IEEE T. Nucl. Sci., 56, 2559–2565, https://doi.org/10.1109/TNS.2009.2012931, 2009.
You, H.-Y., Jia, J.-H., Chen, J.-K., Han, T., Ni, W.-M., Wang, S.-Y., Li, J., Zhang, R.-J., Yang, Y.-M., Chen, L.-Y., and Lynch, D. W.: New design of a spectroscopic ellipsometer by using a spectrometer with multiple gratings and a two-dimensional CCD array detector, Thin Solid Films, 455–456, 84–89, https://doi.org/10.1016/j.tsf.2003.11.211, 2004.
Zhang, H., Li, A., Hu, Z., Guo, J., Yun, L., Zhang, M., Ren, H., Zhong, H., and Xu, J.: Evaluation and measurement of tropospheric glyoxal retrieved from MAX-DOAS in Shenzhen, China, Sci. Total Environ., 878, 162727, https://doi.org/10.1016/j.scitotenv.2023.162727, 2023.
Zhu, J., Jin, Y., Huang, X., Liu, Q., and Shen, W.: Design and optimization of broadband convex blazed grating, Infrared and Laser Engineering, 46, 1120003, https://doi.org/10.3788/IRLA201746.1120003, 2017.