the Creative Commons Attribution 4.0 License.
the Creative Commons Attribution 4.0 License.
 | 25 Feb 2025
Remote sensing of lower-middle-thermosphere temperatures using the N2 Lyman–Birge–Hopfield (LBH) bands
Richard Eastes
J. Scott Evans
Quan Gan
William McClintock
Jerry Lumpe
The scientific and societal importance of short-term changes in the thermosphere–ionosphere (T–I) system highlights a need to better understand short-term changes in the thermosphere. For collision avoidance, this need becomes increasingly important as the number of low-earth-orbiting satellites increases because geomagnetic activity can cause dramatic, unexpected increases in satellite drag. The thermospheric density changes responsible for changes in drag depend primarily on changes in the thermospheric temperature. However, for collision avoidance, the specification of drag could also be problematic during quiet periods when the number of satellites and the uncertainties in their orbits are large. While temperatures and densities at higher altitudes (≳250 km) have been extensively studied and modeled, there is a knowledge gap for densities at lower-middle-thermosphere altitudes (≲200 km). At these lower altitudes, the primary sources of thermospheric density data, in situ and drag data from satellites, are rarely available. Remote sensing of temperatures and composition by NASA's Global-scale Observations of the Limb and Disk (GOLD) mission can help fill this gap. The GOLD mission produces disk images of neutral temperature, a key parameter for understanding neutral density in the lower-middle thermosphere. However, while disk images of the temperature have been available since the launch of GOLD, recent improvements to its observational capability that are relevant to data interpretation may not be widely known. Also, other temperature retrieval techniques than GOLD's have been published. Comparisons indicate that GOLD's technique gives the most consistent results and yields the lowest uncertainties. This paper discusses both temperature retrieval techniques and issues in interpreting GOLD's images of temperatures.
- Article
(5001 KB) - Full-text XML
- BibTeX
- EndNote


The lower-middle thermosphere (≲200 km) plays a key role in the temporal and spatial variability in the thermosphere–ionosphere (T–I) system. Below ∼200 km, the temperature and composition (e.g., ratio) change rapidly with altitude: both are influenced by forcing from below and above. Waves from below ∼100 km deposit energy and momentum in the lower T–I region, as do geomagnetic and solar forcing from above. The response of the lower-middle thermosphere to these forcings is believed to be a significant source of the unexplained variability observed throughout the entire T–I system (e.g., Forbes et al., 2024). While the mean state of the T–I system has been extensively studied, the spatial–temporal variability within it is inadequately understood. A lack of observations sufficient to constrain the state variables, especially temperature, in the lower-middle thermosphere has limited advances in modeling and forecasting. Coincident with the disk images of neutral temperature (Tdisk), the Global-scale Observations of the Limb and Disk (GOLD) mission makes images of a second important variable in the T–I, the composition ratio. Images of the composition ratio have previously been used to make tremendous progress in understanding the T–I (e.g., citations in Christensen et al., 2003), and having an additional key variable, temperature, at the same locations and times multiplies the potential for progress in understanding the T–I state and its variability. Temperature is one of the most fundamental state variables of the T–I system. It is a key to understanding the system's energetics and dynamics and to advancing modeling capabilities.
A clear understanding of the observational limitations of GOLD temperature images is essential for researchers using the data. Since Cantrall and Matsuo (2021) analyzed the angular dependence of an early version (V03) of the GOLD Tdisk data, there have been significant advances in the algorithms the GOLD team uses to retrieve temperatures. As shown in this paper, the changes with solar zenith angle (SZA) in the GOLD Tdisk (V05) and the analysis of Cantrall and Matsuo (2021) are consistent, but there is a key difference between them. Additionally, we provide an overview of the remote-sensing technique used by GOLD and summarize additional information relevant to current and potential users of the GOLD temperatures.
Remote sensing is essential for observing the lower-middle thermosphere for extended periods of time. While in situ observations are possible for brief periods, satellites orbiting at altitudes below ∼ 300 km encounter significant atmospheric drag. Consequently, their orbits decay rapidly, leading to re-entry into the Earth's atmosphere unless they have propulsion or are in highly eccentric orbits. In contrast, far ultraviolet (FUV; < 180 nm) emissions resulting from absorption of solar extreme ultraviolet (EUV) radiation by the Earth's atmosphere have been used by numerous satellite missions for remote sensing of Earth's daytime thermosphere at altitudes near 150–160 km (e.g., Dynamics Explorer 1/Spin-Scan Auroral Imager (DE 1/SAI); Thermosphere, Ionosphere, Mesosphere Energetics and Dynamics/Global Ultraviolet Imager (TIMED/GUVI); Ionospheric Connection Explorer/Far Ultraviolet instrument (ICON/FUV); and GOLD). NASA's GOLD mission, which provides daily spatial–temporal disk images of temperature at 150–160 km, is the first satellite mission to routinely quantify synoptic neutral temperatures at those altitudes using FUV remote sensing. These disk images are retrieved from the widths of N2 Lyman–Birge–Hopfield (LBH) band emissions observed.
2.1 N2 Lyman–Birge–Hopfield band observations and modeling
Earth's FUV emissions (∼ 120–180 nm) have been used extensively for space-based remote sensing of the T–I system. A key advantage of using FUV emissions is that they are absorbed by O2 in Earth's atmosphere, which blocks contributions from below ∼ 100 km. Consequently, FUV emissions observed from space must come from higher altitudes, and, since these emissions cannot reach Earth's surface, observations are only possible from space.
The LBH bands are one of Earth's most important FUV emissions for remote sensing of the thermosphere (e.g., Christensen et al., 2003). Photoelectrons – produced when the Sun's short-wavelength photons (<45 nm) are absorbed in Earth's atmosphere – collide with N2, producing the LBH band emissions. These typically peak near 150–160 km when the SZA is small, with the peak trending higher as the SZA increases. Examples of this behavior are shown in recent publications by Aryal et al. (2022, Fig. 2) and Evans et al. (2024, Fig. 4). Although there are longer wavelength emissions, most satellite missions have focused on wavelengths below 180 nm, where the brightest emissions occur. An example of the N2 LBH spectrum within GOLD's bandpass is shown in Fig. 4 of McClintock et al. (2020).
The LBH bands are emitted when N2 makes transitions from the vibrational levels of the a1Πg(a) state to the ground state. The full width at half maximum (∼0.35 nm) of individual bands, attributable to the molecules' rotational energy levels, varies with the temperature of the N2 molecules. As discussed in Aksnes et al. (2006), the band width is expected to reflect the ground (X) state temperature Consequently, the band widths observed are representative of thermospheric temperature, which can be retrieved from the emissions when observed with spectral resolution sufficient to distinguish changes in the band widths (i.e., a full width at half maximum of ∼ 0.35 nm).
2.2 Thermospheric temperatures from the N2 LBH band widths
The GOLD mission measures changes in the N2 LBH band widths to produce disk images of thermospheric temperature. It also retrieves temperatures from limb brightness profiles of the N2 LBH emission, a technique that has been used on numerous missions and is described in detail elsewhere (e.g., Meier and Anderson, 1983; Evans et al., 2020). This paper focuses on atmospheric temperature retrievals from the N2 LBH band widths. In Fig. 1, the LBH bands observed at the beginning of the mission are shown. Wavelength coverage during the mission has been shifted to shorter wavelengths to address detector gain fatigue that occurs for the bright OI 135.6 nm emission.
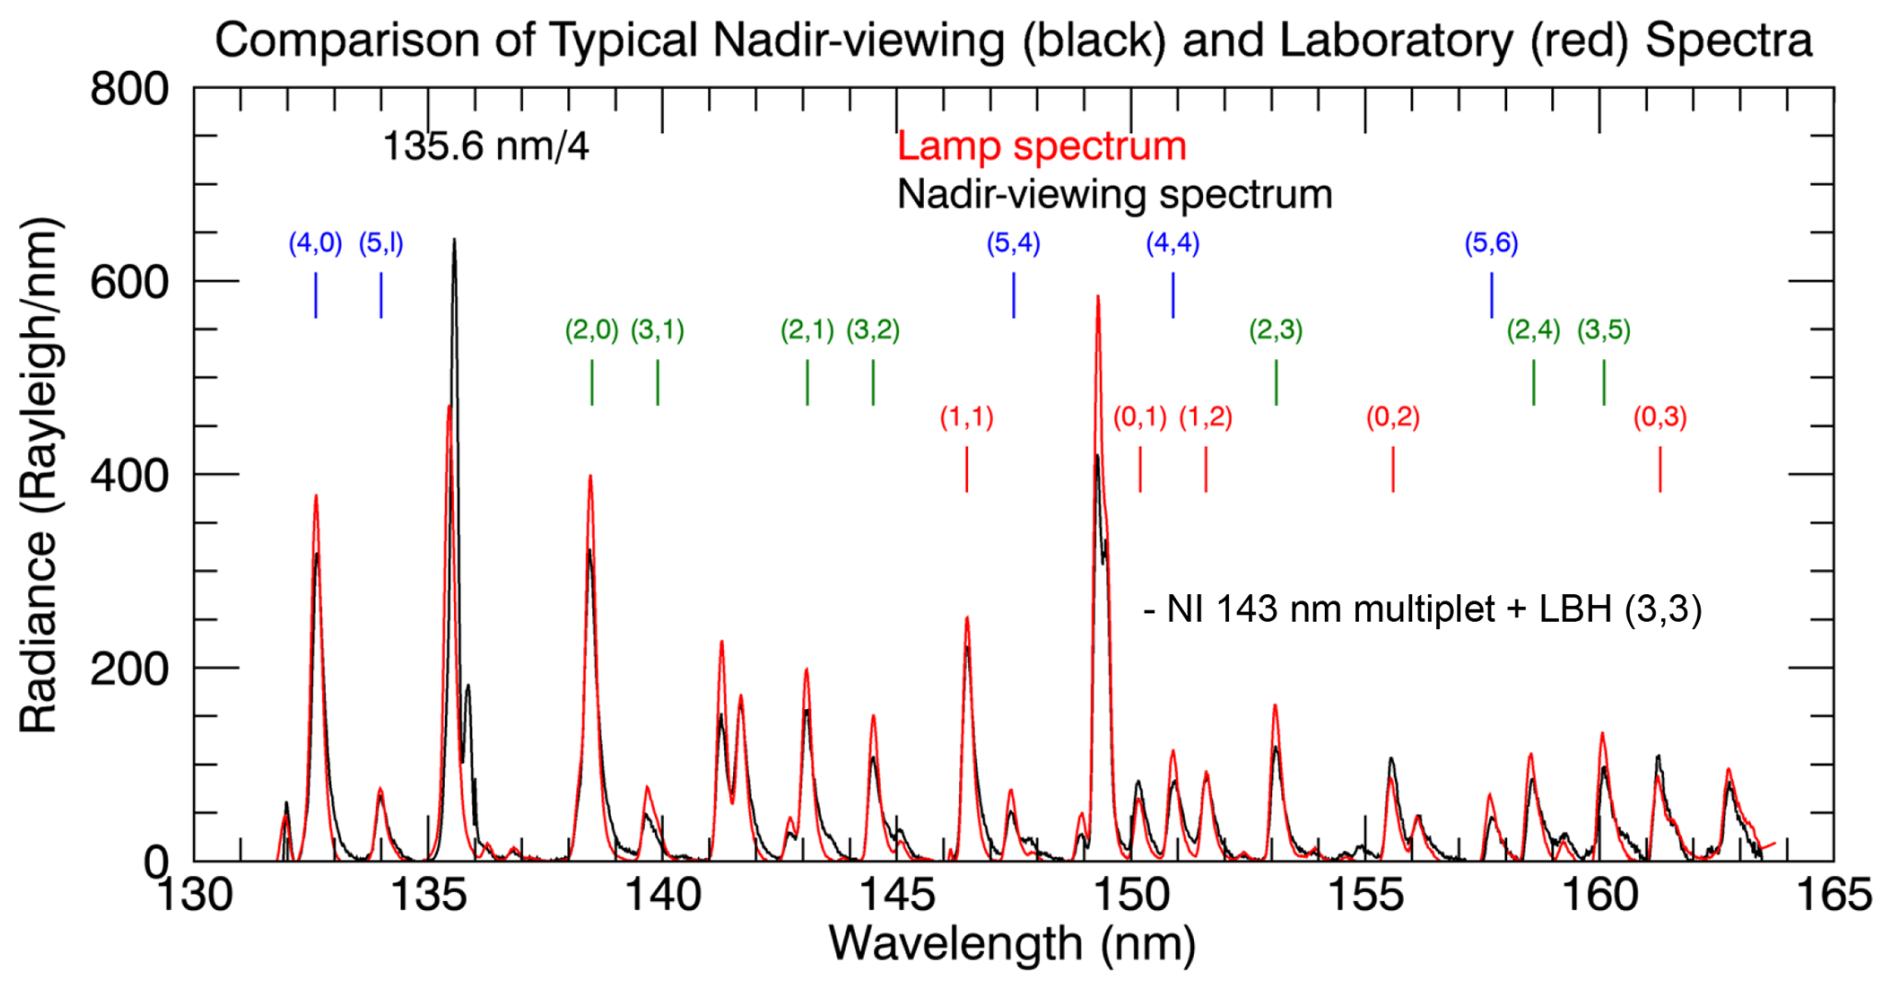
Figure 1Dayside spectrum observed by GOLD (black) with modeled LBH spectrum (red). Tdisk is retrieved using fits to all the LBH bands in the 137.0–148.5 nm range.
Since each band of LBH emission is similarly dependent on N2 temperature, retrievals can, in principle, use either a single band or multiple bands. GOLD uses all the bands between 137.0 and 148.5 nm to increase the signal-to-noise ratio (SNR) and precision of Tdisk, but this also increases the number of parameters that must be determined, either during the retrieval or in advance. To minimize the uncertainties, this is done in advance when possible. For example, GOLD retrievals use emissions from multiple vibrational levels, and that requires knowledge of their relative populations (i.e., the fraction of the molecules in each vibrational level), which are taken from Aryal et al. (2022) (Evans et al., 2024). Although Eastes and Dentamaro (1996) and Eastes (2000) have shown that some of the LBH excitation occurs by cascade into the (a) state from other higher-lying states in addition to electron impact directly to the (a) state from the ground (X) state, observations (Aryal et al., 2022) indicate that the vibrational populations observed in the dayglow are essentially constant and that the only appreciable cascade contributions are via radiative cascade (that cascade due to collisions, which changes with the number densities, is insignificant).
GOLD temperature retrievals are also sensitive to errors in the wavelength scale. These are not known in advance and can be significant. Their significance can be seen in Fig. 2, which shows displacements of the OI 135.6 nm line during the first 2 years of the mission and knowing that 1 pixel is ∼ 0.4 Å/0.04 nm. The changes shown in Fig. 2 are attributed to seasonal changes in solar illumination altering the temperature gradient within the instrument. The resulting shifts in wavelength scale are tracked using the locations of the OI 135.6 nm and NI 149.3 nm emission lines, which do not change with temperature, throughout each day to calculate scales for individual rows in each image. From these, an average wavelength scale for each GOLD image is calculated and recorded in the GOLD L1C data products. However, row-by-row deviations by ∼ pixel (0.2 Å/0.02 nm) from this average are present in the L1C data. While averaging across multiple bands decreases the influence of small-scale wavelength errors on GOLD's Tdisk values, overall shifts in wavelength are fitted during the retrieval (Evans et al., 2024) to further reduce the effects of these errors.
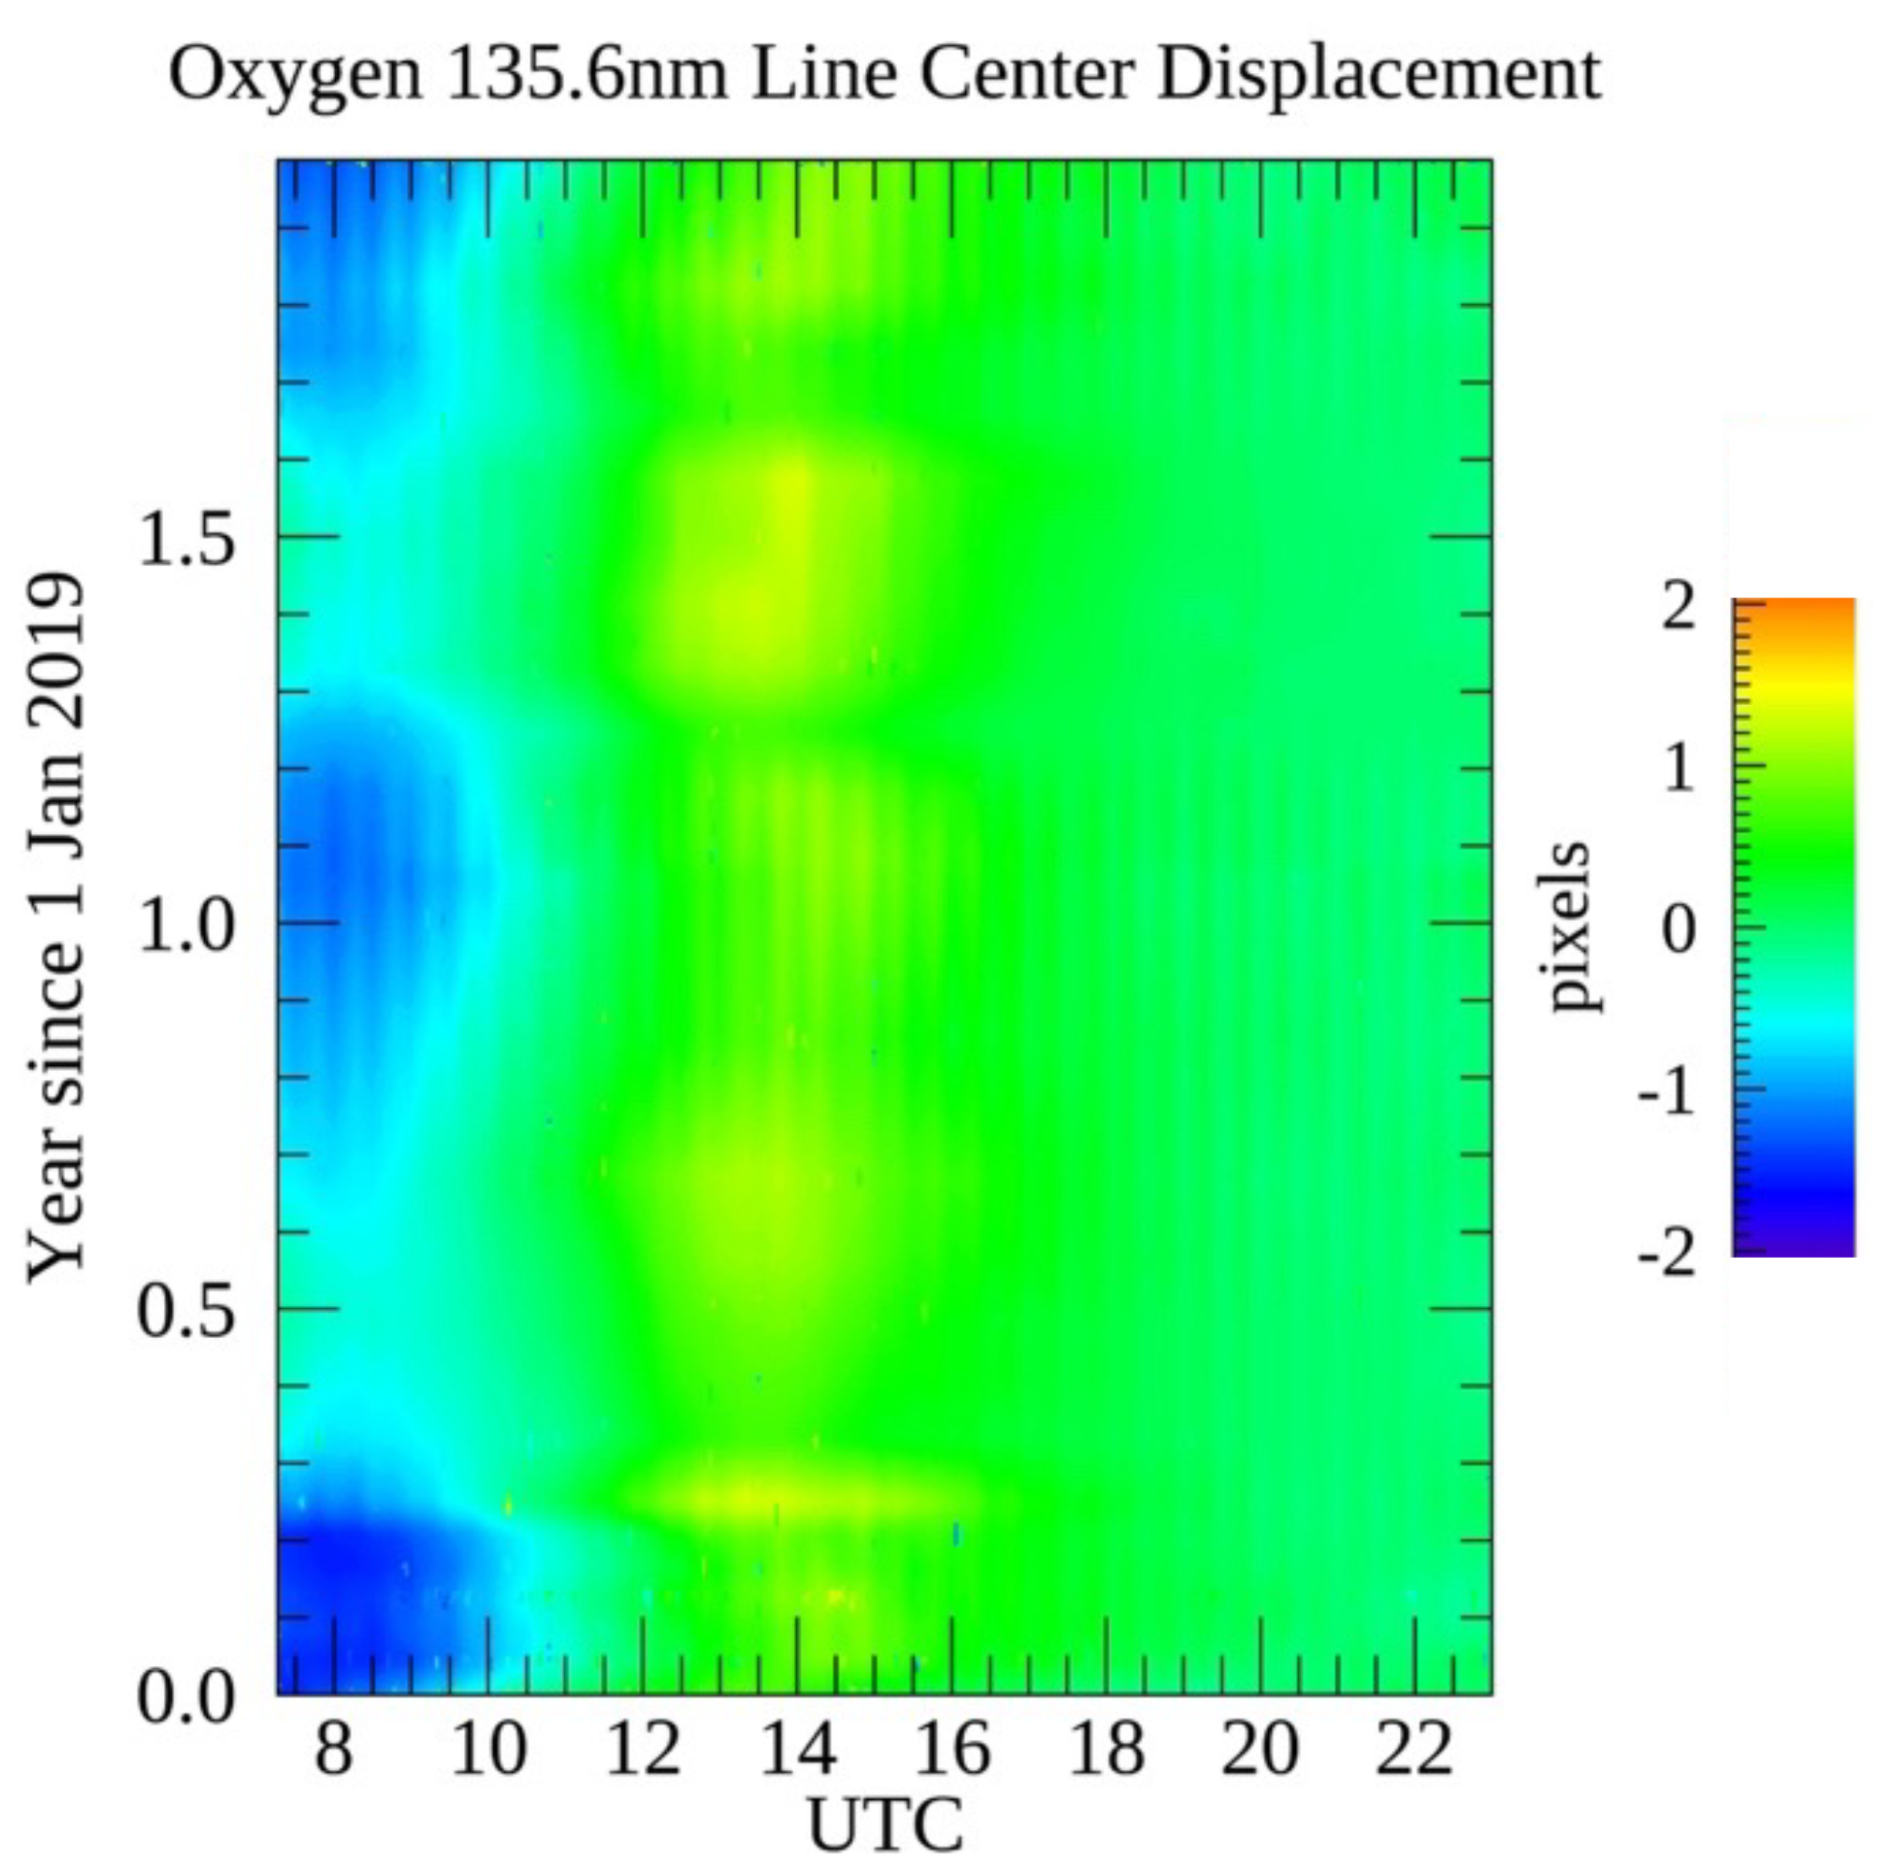
Figure 2Changes in the peak pixel for the OI 135.6 nm line observed by GOLD throughout each day during 2019 and 2020. The wavelength scales included in the L1C data for each scan decrease the deviations to ∼ 0.2 Å (∼ pixel).
An example of GOLD's Tdisk values and uncertainties since the beginning of the mission is shown in Fig. 3. The temperatures shown in panel (a) are the mean of the V05 Tdisk data (NASA, 2024a, b; released 26 May 2023) in a 10° × 10° (1100 km × 1100 km) sample at the subsatellite longitude and 10° latitude for three local times (LTs; 07:00, 12:00, and 15:00). The V05 mean absolute and relative random uncertainties (errors) for these data samples are shown in Fig. 3b and c, respectively. While observed temperatures vary with local solar time, the relative changes throughout the mission are similar at all LTs. As discussed earlier, uncertainties in the retrieved temperatures vary with SNR in the dayglow observations, which varies with local time, since the dayglow brightness has a strong dependence on solar zenith angle changes with local time. The mission began observations during solar minimum, in late 2018. Now, 5 years later, the Sun is near solar maximum and its irradiance has increased, increasing the brightness of the LBH bands (Fig. 3d; average brightness at 07:00, 12:00, and 15:00 LT is 0.135, 0.456, and 0.347 kR, respectively, in January 2019 for the LBH bands used for temperature retrieval) and the SNR of the data (Fig. 3e). The result is a long-term decrease in the uncertainties and increase in the temperatures. An annual variation superimposed on the transition from solar minimum to maximum, most clearly seen in the uncertainties, is primarily due to the annual SZA variation at the sampled area, 10° N of the Equator. The largest uncertainties are during the Northern Hemisphere winter, when the mean SZA is larger, resulting in smaller SNR. Further reductions in the uncertainties can be achieved by combining pixels when smaller uncertainties are needed.
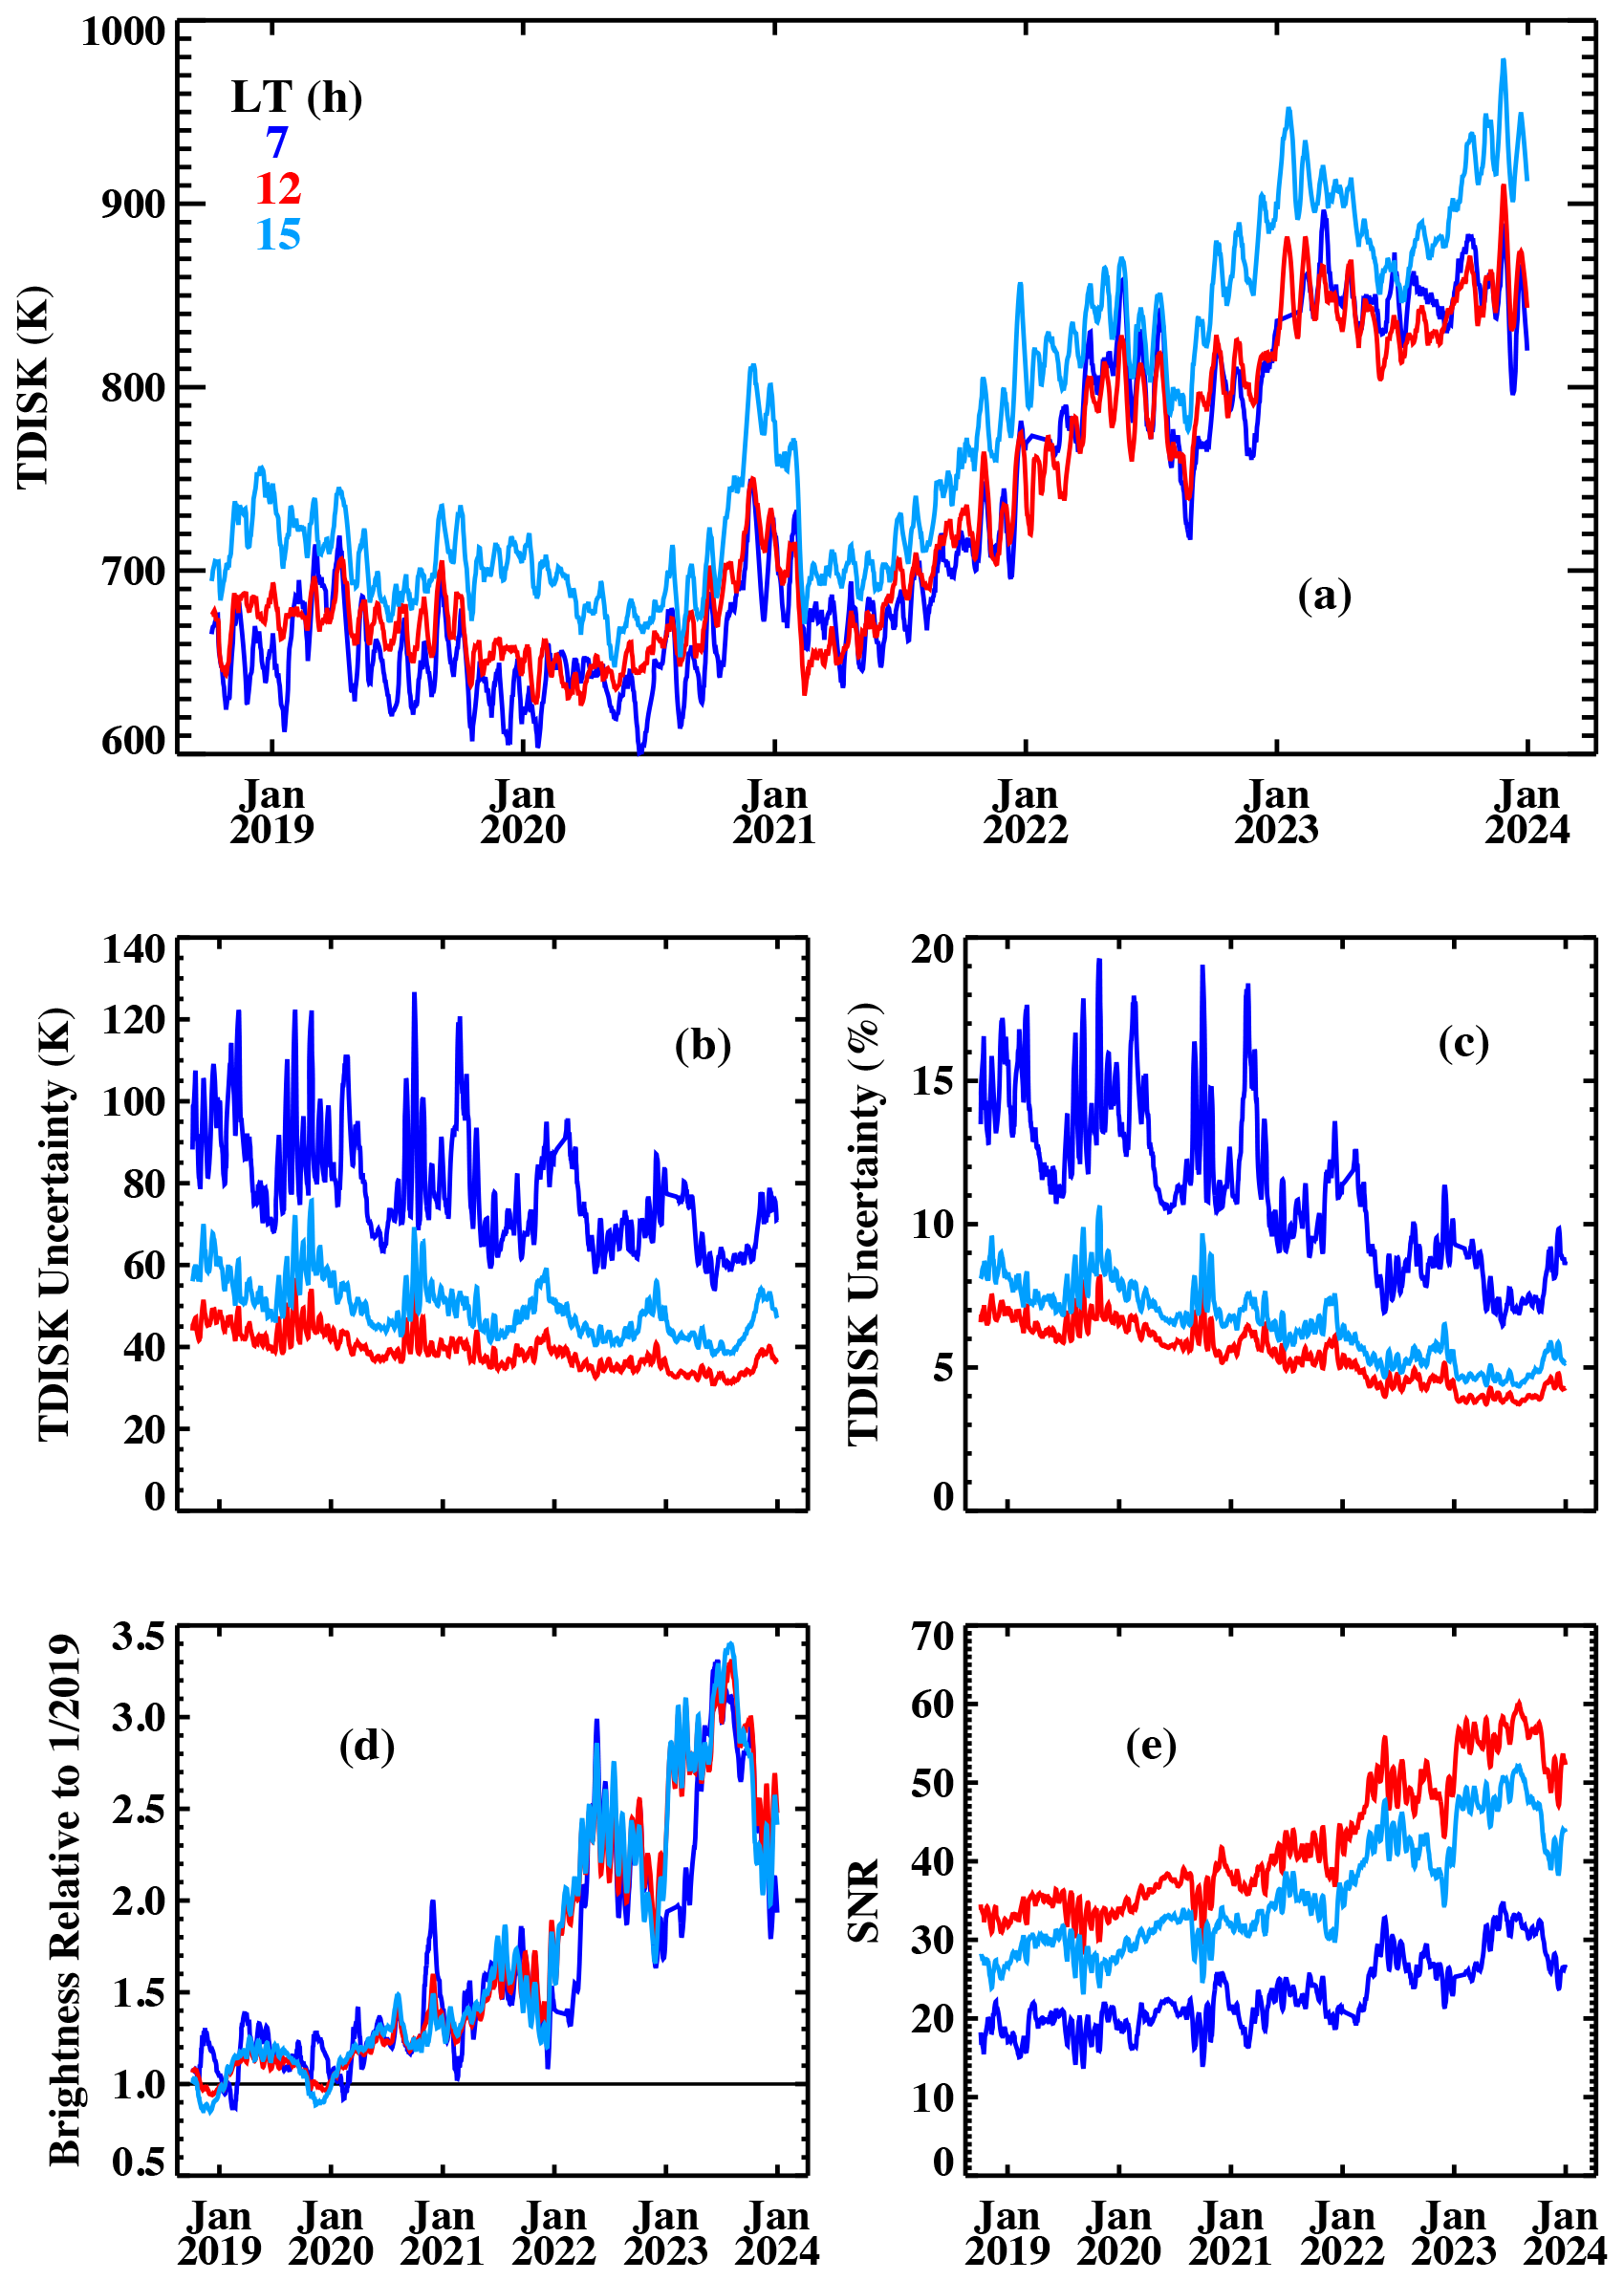
Figure 3Tdisk mean temperatures and uncertainties near subsatellite. (a) Mean Tdisk temperatures at 07:00, 12:00, and 15:00 local time (LT) in a 10° × 10° (1100 km × 1100 km) area centered at 10° latitude and the spacecraft longitude (47.5° W). Uncertainties for the temperatures are shown in panels (b) and (c). The relative brightness of the LBH bands and SNR are shown in panels (d) and (e), respectively. Average brightness at 07:00, 12:00, and 15:00 LT are 0.135, 0.456, and 0.347 kR for the 137.0–148.5 nm LBH bands in January 2019.
2.3 Other temperature retrieval approaches
Temperature retrieval using a single LBH band has also been studied by Cantrall and Matsuo (2021). They used the LBH (2,0) band, the brightest band resolved by GOLD (the (3,0) band overlaps the OI 135.6 nm emission), but the SNR is lower than for GOLD's retrievals. They noted that their single-band technique is sensitive to wavelength errors and performed additional row-by-row (corresponding to latitude on the detector) fitting of the L1C wavelength scale to mitigate this. Their analyses indicated that a 0.5-pixel (0.2 Å) uncertainty in their wavelength registration corresponded to an uncertainty of ∼ 100 K in the retrieved temperature. This dependence on the wavelength registration is a possible source of differences from GOLD's results discussed in the next section. The approach used by Cantrall and Matsuo (2021) assumed that the LBH (2,0) band emissions at wavelengths >138.56 nm (<138.56 nm) were positively (negatively) correlated with temperature. However, Evans et al. (2024) found that the separation between positively and negatively correlated portions of the band changes slightly with thermospheric temperatures. Further testing and possibly development of temperature retrievals from a single band would be needed before relying on the technique.
A third approach, by Zhang et al. (2019), proposed using the ratio of the (0,0) and (1,0) bands to deduce temperature. The relative brightness of the bands would be insensitive to the wavelength shifts in GOLD L1C data. However, the reliability of the technique is uncertain because the vibrational populations are affected by the radiative cascade contributions, as discussed by Eastes and Dentamaro (1996). Recent laboratory work by Ajello et al. (2020) has confirmed that there is excitation by cascade into the (a) state from other excited states, in addition to direct excitation from the ground (X) state. This excitation by cascade alters the brightness ratio of the , 1, and 2 emissions from the (a) state, causing deviations from the X-a Franck–Condon (F–C) factors, as assumed in the band ratio technique. Much more development would be needed before the band ratios could be a viable possibility. Although there are small changes in spectral distribution of the emission, which both the GOLD mission and Cantrall and Matsuo (2021) rely upon to determine the temperature, the total amount of emission from individual bands (i.e., v′, v′′) is independent of rotational temperature. Consequently, the SNR for retrievals from GOLD data would be significantly less (factor of >5 based on F–C factors) than is used in GOLD's approach, and uncertainties in the derived information would be significantly larger than from GOLD's approach.
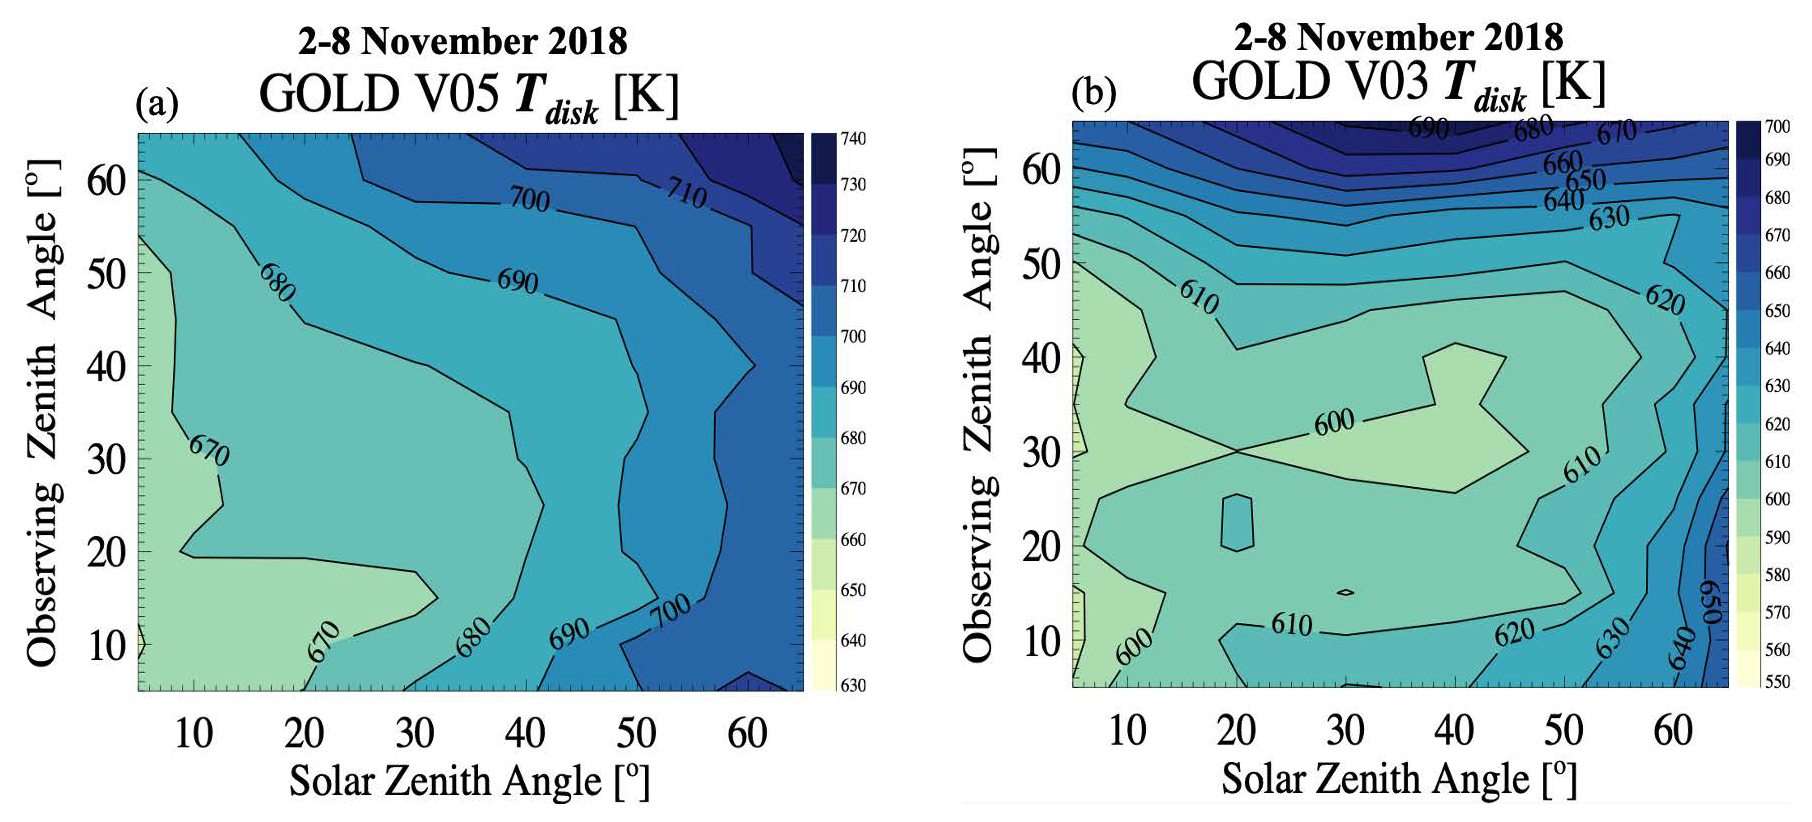
Figure 4Disk temperatures retrieved from the observations on 2–8 November 2018. Additional binning used in V05 retrievals (a, left panel) removes a cold bias that was present in earlier versions (b, right panel).
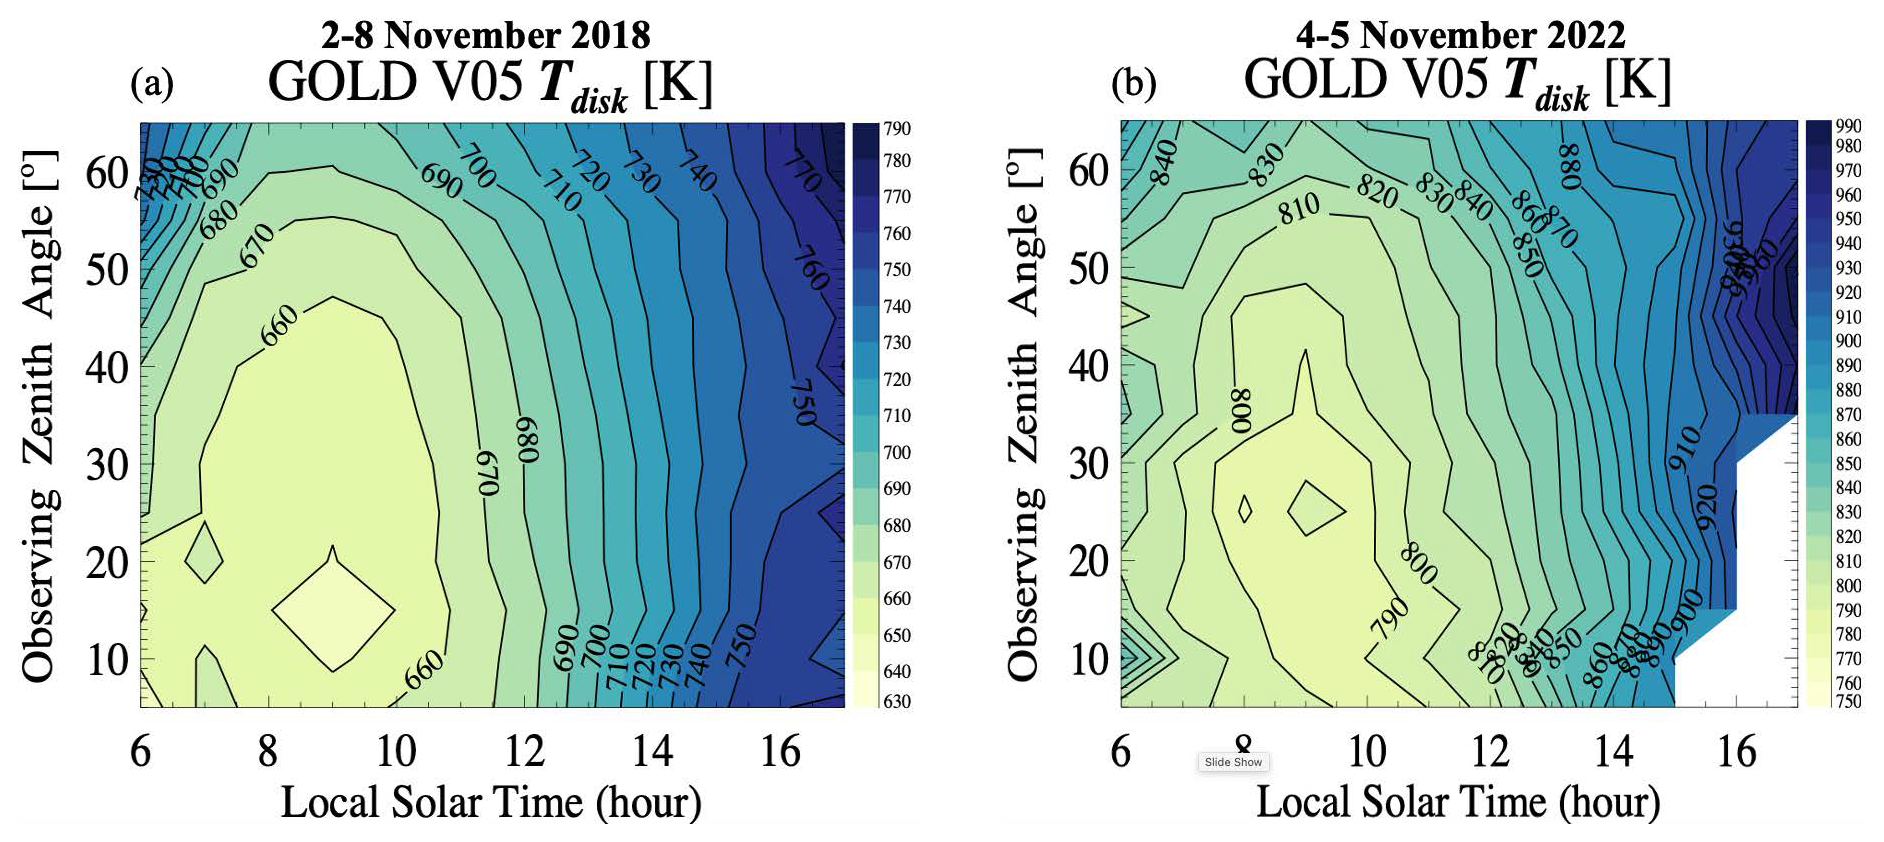
Figure 5Disk temperatures retrieved from the observations as a function of observing zenith angle versus local solar time (LST) on (a) 2–8 November 2018 (same data as Fig. 4a and including some geomagnetically active days) near solar minimum and on (b) 4–5 November 2022, 2 geomagnetically quiet days near solar maximum.
2.4 GOLD mission observations of disk temperatures
GOLD's observations provide temperatures (Tdisk) near 160 km over much of the hemisphere centered on 47.5° W. Early versions (V1–V3) of the Tdisk data contained a bias, to lower temperatures, for SNR ≤ 20. Additional spatial (from 125 × 125 km to 250 × 250 km) and spectral (from 0.04 to 0.08 nm) binning was implemented in V04 (released 5 August 2022) and later Tdisk data, increasing the SNR and eliminating the cold bias for essentially all observations, including those near solar minimum. Analysis of the temperatures from individual images binned at a range of spatial and spectral resolutions shows that the retrieved temperatures are consistent when SNR > 20 and that there is a cold bias that increases with decreasing SNR. The bias is evident in V03 when compared to V05, as seen in Fig. 4a and b for observations acquired on 2–8 November 2018, which was during solar minimum. The V05 temperatures (panel a) are higher than V03 (panel b) by as much as ∼ 90 K.
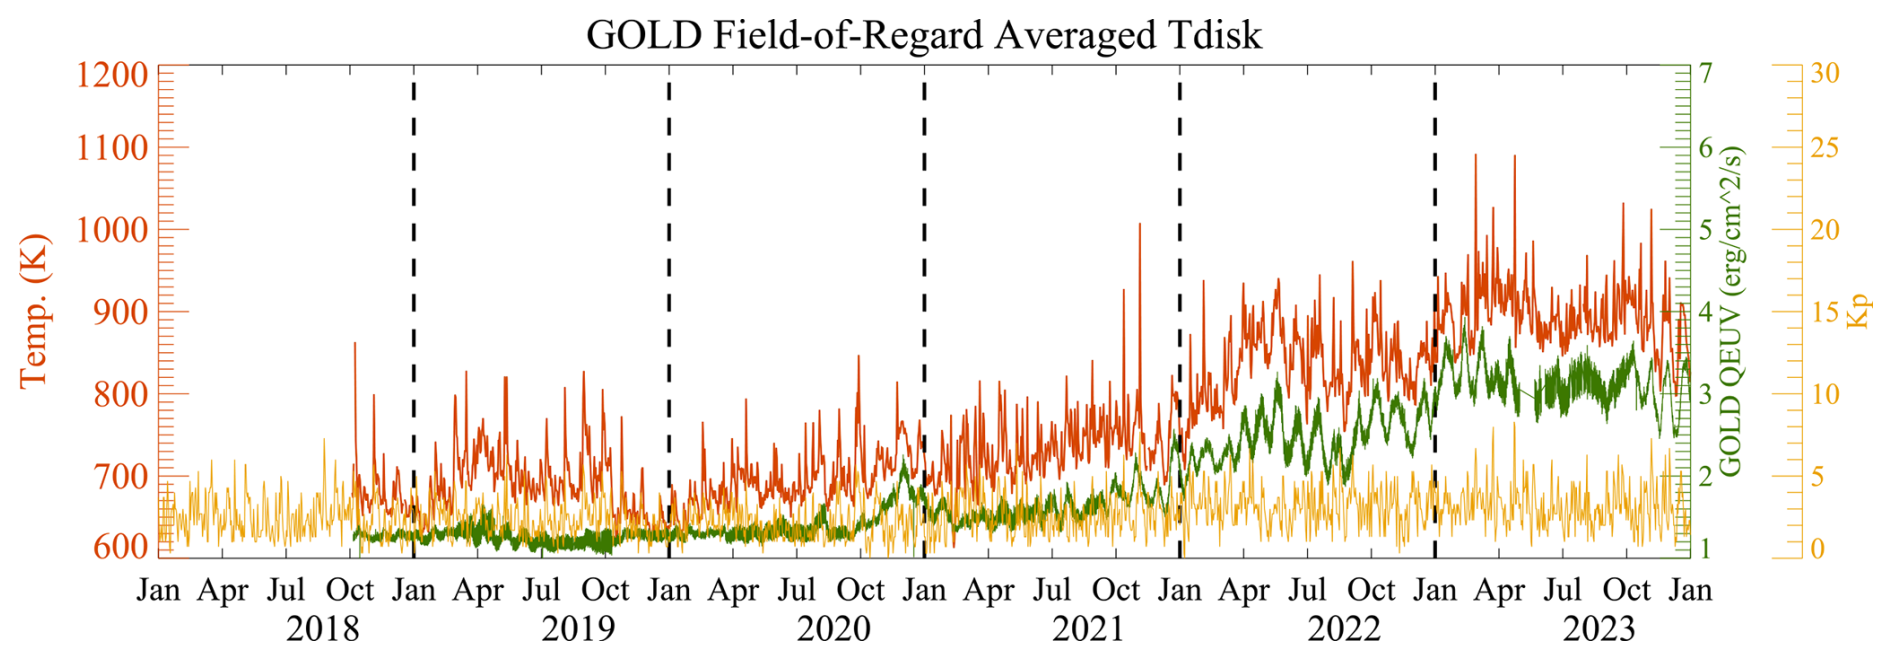
Figure 6Daily averaged Tdisk and Qeuv (a solar proxy derived from GOLD's dayside disk observations) from the beginning of operations (and Kp data from 1 January 2018) to 1 January 2023. Daily averages include all locations and local times with released Tdisk data.
The 2–8 November 2018 data were also discussed by Cantrall and Matsuo (2021), and the angular dependence shown in Fig. 4a matches their retrievals (; the left panel in their Fig. 9). However, the Cantrall and Matsuo (2021) temperatures for these data are ∼ 40 K lower at all angles. This suggests a systematic bias because it is much larger than expected given the random uncertainties in the GOLD V05 data and that an average of 7 d of data are used. According to Cantrall and Matsuo (2021), a wavelength-scale error of 0.1 Å introduces a 50 K error when using their technique. This is in addition to the uncertainties associated with the SNR of the LBH (2,0) band. Simulations indicate that maintaining the precision of the wavelength scale to 0.01 Å would limit contributions to the temperature uncertainty to 5 K, which would be a factor of ∼ 1.2 increase in the lowest uncertainties show in Fig. 3a. Achieving a precision of ∼ 0.01 Å for GOLD observations over extended time periods may require one to also track the shape of the 135.6 nm emission because it changes as the detector's response degrades, as discussed by McClintock et al. (2020). As discussed by Evans et al. (2024), GOLD's retrievals include wavelength-scale shifts concurrently with the temperatures during retrievals. Uncertainties in the wavelength scale are included in the uncertainties shown in Fig. 3. This difference highlights an advantage of GOLD's approach.
Eliminating the cold bias in Tdisk also decreases the gradients seen in temperature. Since the cold bias is SNR-dependent, earlier versions of the data (e.g., V03) from near solar minimum had gradients due to both the cold bias at low SNR and the change in SZA. The SZA dependence, as explained by Evans et al. (2024) and summarized briefly in Sect. 2.1, is geometrically inherent to all remote sensing of disk temperatures. A higher-level data product (Level 3) that is corrected for the SZA and emission angle dependence is possible and can hopefully be produced for a future data release.
Given that SZA and local solar time (LST) at a location are directly related, the structure seen in Fig. 5 when plotting temperature by LST rather than SZA is similar to that in Fig. 4. That there is less change with LST (or equivalently SZA) before noon than after noon is attributed to a combination of two factors. Firstly, the peak in the observed LBH emission is lowest at local noon and increases with LST difference from noon. Secondly, thermospheric temperatures at all altitudes increase until after noon as the exospheric temperature increases (e.g., Evans et al., 2020). Consequently, as the atmospheric temperatures increase following sunrise, the most relevant altitudes shift downward rapidly enough that the combined effect is lower temperatures until noon. After noon, the thermospheric temperature and the peak altitude of the observed emissions both increase initially, and the effect of changing the peak altitude is sufficient for the observed temperatures to increase until the observations end. Modeling indicates a 50–100 K temperature increase for SZA values ranging from 0–70° (Evans et al., 2024). This SZA effect is not removed from the current Tdisk data. The missing data in the lower right of Fig. 5b are attributed to a change in the observing schedule. In 2022, nighttime observations by channel A, which was used for the Tdisk observations, began at an earlier LST (UT) than in 2018.
In both Figs. 4a and 5, there is a 20–40 K increase in the temperatures at the largest viewing angles. This increase may be attributable to energy deposition at high latitudes (e.g., Gan et al., 2024). Heating by geomagnetic forcing could be expected, even during geomagnetically quiet times. In addition, since GOLD is in a geostationary orbit, all the high-latitude observations are at the larger observing zenith angles, where higher altitudes and consequently higher temperatures are observed.
The SZA/LST dependence seen in Figs. 4a and 5 is much smaller than the thermospheric temperature changes seen during storms or throughout the mission, as shown by the daily average of all values from the entire disk that is shown in Fig. 6. The maximum estimated bias in V05 Tdisk at large observing zenith angles is 10–20 K (see Fig. S5 of Evans et al., 2024). Dayside average disk temperatures exhibit a high correlation with the solar irradiance, represented here by Qeuv from GOLD (Correira et al., 2021). Similar agreement between the long-term trends is also seen with FISM-2 (Chamberlin et al., 2020) and F10.7 (neither shown). A significant correlation with geomagnetic activity (represented by Kp, NASA, 2024c, in Fig. 6) is also discernible. A ∼ 27 d solar rotation period is seen in both the temperatures and Qeuv. For solar minimum conditions, the correlation between geomagnetic activity and Tdisk was discussed by Laskar et al. (2021) and is also readily identifiable in Fig. 6 near solar maximum.
The uncertainties summarized and discussed in this paper, the details of which were described by Evans et al. (2024), demonstrate the robustness of GOLD's approach to retrieving disk temperatures by simultaneously fitting multiple LBH bands. This method explicitly addresses limitations in the other approaches that have been documented. As a result, GOLD provides the most reliable neutral temperatures in Earth's lower-middle thermosphere (150–160 km). GOLD V05 uncertainties depend on the signal-to-noise ratio (SNR) of the data, as for any retrieval, and biases toward low temperatures, which were present in versions prior to V04, are negligible in V05, as seen from examination of the solar zenith angle (SZA) versus observing zenith angle dependence. While the SZA dependence (which is inherent to all remotely sensed disk temperatures and could be addressed in a future data product) slightly complicates the use and interpretation of the data, the effect is typically less than the uncertainties in the temperatures.
In the current version, the random uncertainties during solar maximum are sometimes ∼ 30 K per pixel (250 km × 250 km at nadir). Significantly lower uncertainties can be achieved by spatial averaging or smoothing the V05 data to the larger spatial scales typical of many thermospheric effects. GOLD uncertainties are sufficiently low to provide unprecedented opportunities to study the T–I responses to forcing from below and from above. The Tdisk data provide unprecedented opportunities – especially with the concurrent and co-located data derived from the same spectra.
The GOLD TDISK data were taken from either NASA (2024a, http://gold.cs.ucf.edu/search/) or NASA (2024b, https://spdf.gsfc.nasa.gov), while the Kp data were taken from and NASA (2024c, https://omniweb.gsfc.nasa.gov/).
RE developed the concept for and prepared the article. QG, BM, and JL created figures used in the paper. JSE provided details for interpretation of the GOLD Tdisk data. All authors contributed to editing drafts of this paper.
The contact author has declared that none of the authors has any competing interests.
Publisher's note: Copernicus Publications remains neutral with regard to jurisdictional claims made in the text, published maps, institutional affiliations, or any other geographical representation in this paper. While Copernicus Publications makes every effort to include appropriate place names, the final responsibility lies with the authors.
The authors thank Clayton Cantrall and Tomoko Matsuo for their efforts to elucidate the sensitivity of GOLD Tdisk retrievals to low signal-to-noise ratio.
This study was supported by NASA Contract 80GSFC18C0061 to the University of Colorado, Boulder.
This paper was edited by Marloes Penning de Vries and reviewed by two anonymous referees.
Ajello, J. M., Evans, J. S., Veibell, V., Malone, C. P., Holsclaw, G. M., Hoskins, A. C., Lee, R. A., McClintock, W. E., Aryal, S., Eastes, R. W., and Schneider, N.: The uv spectrum of the lyman-birge-hopfield band system of N2 induced by cascading from electron impact, J. Geophys. Res.-Space, 125, e2019JA027546, https://doi.org/10.1029/2019JA027546, 2020.
Aksnes, A., Eastes, R., Budzien, S., and Dymond, K.: Neutral temperatures in the lower thermosphere from N2 Lyman-Birge-Hopfield (LBH) band profiles, Geophys. Res. Lett., 33, L15103, https://doi.org/10.1029/2006GL026255, 2006.
Aryal, S., Evans, J. S., Ajello, J., Solomon, S., Burns, A., Eastes, R., and McClintock, W.: Constraining the upper level vibrational populations of the N2 lyman-birge-hopfield band system using gold mission's dayglow observations, J. Geophys. Res.-Space, 127, e2021JA029869, https://doi.org/10.1029/2021JA029869, 2022.
Cantrall, C. and Matsuo, T.: Deriving column-integrated thermospheric temperature with the N2 Lyman–Birge–Hopfield (2,0) band, Atmos. Meas. Tech., 14, 6917–6928, https://doi.org/10.5194/amt-14-6917-2021, 2021.
Chamberlin, P. C., Eparvier, F. G., Knoer, V., Leise, H., Pankratz, A., Snow, M., Templeman, B., Thiemann, E. M. B., Woodraska, D. L., and Woods, T. N.: The flare irradiance spectral model-version 2 (FISM2), Space Weather, 18, e2020SW002588, https://doi.org/10.1029/2020SW002588, 2020.
Christensen, A. B., Paxton, L. J., Avery, S., Craven, J., Crowley, G., Humm, D. C., Kil, H., Meier, R. R., Meng, C. I., Morrison, D., and Ogorzalek, B.S.: Initial observations with the Global Ultraviolet Imager (GUVI) in the NASA TIMED satellite mission, J. Geophys. Res.-Space, 108, 1451, https://doi.org/10.1029/2003JA009918, 2003.
Correira, J., Evans, J. S., Lumpe, J. D., Krywonos, A., Daniell, R., Veibell, V., McClintock, W. E., and Eastes, R. W.: Thermospheric composition and solar EUV flux from the Global-scale Observations of the Limb and Disk (GOLD) mission, J. Geophys. Res.-Space, 126, e2021JA029517, https://doi.org/10.1029/2021JA029517, 2021.
Eastes, R. W.: Modeling the N2 Lyman-Birge-Hopfield bands in the dayglow: Including radiative and collisional cascading between the singlet states, J. Geophys. Res.-Space, 105, 18557–18573, https://doi.org/10.1029/1999JA000378, 2000.
Eastes, R. W. and Dentamaro, A. V.: Collision-induced transitions between the a1Πg, , and w1Δu states of N2: Can they affect auroral N2 Lyman-Birge-Hopfield band emissions?, J. Geophys. Res.-Space, 101, 26931–26940, https://doi.org/10.1029/96JA01636, 1996.
Evans, J. S., Lumpe, J., Correira, J., Viebell, V., Kyrwonos, A., Solomon, S. C., and Eastes, R. W.: Neutral exospheric temperatures from the Global-scale Observations of the Limb and Disk (GOLD) mission, J. Geophys. Res.-Space, 125, e2020JA027814, https://doi.org/10.1029/2020JA027814, 2020.
Evans, J. S., Lumpe, J. D., Eastes, R. W., Correira, J., Aryal, S., Laskar, F., Veibell, V., Krywonos, A., Plummer, T., and McClintock, W. E.: Neutral disk temperatures from the Global-scale Observations of the Limb and Disk (GOLD) mission, J. Geophys. Res., 129, e2024JA032424, https://doi.org/10.1029/2024JA032424, 2024.
Forbes, J. M., Zhang, X., Maute, A., and Cullens, C.: Responses of the mean thermosphere circulation, ratio and Ne to solar and magnetospheric forcing from above and tidal forcing from below, J. Geophys. Res.-Space, 129, e2024JA032449, https://doi.org/10.1029/2024JA032449, 2024.
Gan, Q., Eastes, R. W., Wu, Y.-J., Qian, L., Cai, X., Wang, W., England, S. L., and McClintock, W. E.: Thermospheric responses to the 3 and 4 November 2021 geomagnetic storm during the main and recovery phases as observed by NASA's GOLD and ICON missions, Geophys. Res. Lett., 51, e2023GL106529, https://doi.org/10.1029/2023GL106529, 2024.
Laskar, F. I., Eastes, R. W., Codrescu, M. V., Evans, J. S., Burns, A. G., Wang, W., McClintock, W. E., Aryal, S., and Cai, X.: Response of GOLD retrieved thermospheric temperatures to geomagnetic activities of varying magnitudes, Geophys. Res. Lett., 48, e2021GL093905, https://doi.org/10.1029/2021GL093905, 2021.
McClintock, W. E., Eastes, R. W., Hoskins, A. C., Siegmund, O. H. W., McPhate, J. B., Krywonos, A., Solomon, S. C., and Burns, A. G.: Global-scale Observations of the Limb and Disk mission implementation: 1. Instrument design and early flight performance, J. Geophys. Res.-Space, 125, e2020JA027797, https://doi.org/10.1029/2020JA027797, 2020.
Meier, R. R. and Anderson Jr., D. E.: Determination of atmospheric composition and temperature from the UV airglow, Planet. Space Sci., 31, 967, https://doi.org/10.1016/0032-0633(83)90088-0, 1983.
NASA: GOLD, http://gold.cs.ucf.edu/search/ (last access: 5 February 2024), 2024a.
NASA: NASA's Space Physics Data Facility (SPDF), https://spdf.gsfc.nasa.gov (last access: 5 February 2024), 2024b.
NASA: OMNIWeb Plus, https://omniweb.gsfc.nasa.gov/ (last access: 5 February 2024), 2024c.
Zhang, Y., Paxton, L. J., and Schaefer, R. K.: Deriving thermospheric temperature from observations by the global ultraviolet imager on the thermosphere ionosphere mesosphere energetics and dynamics satellite, J. Geophys. Res.-Space, 124, 5848–5856, https://doi.org/10.1029/2018JA026379, 2019.