the Creative Commons Attribution 4.0 License.
the Creative Commons Attribution 4.0 License.
 | 27 Feb 2025
Evaluating spectral cloud effective radius retrievals from the Enhanced MODIS Airborne Simulator (eMAS) during ORACLES
Steven Platnick
G. Thomas Arnold
Nandana Amarasinghe
Daniel Miller
Jennifer Small-Griswold
Mikael Witte
Brian Cairns
Siddhant Gupta
Greg McFarquhar
Joseph O'Brien
Satellite remote sensing retrievals of cloud effective radius (CER) are widely used for studies of aerosol–cloud interactions. Such retrievals, however, rely on forward radiative transfer (RT) calculations using simplified assumptions that can lead to retrieval errors when the real atmosphere deviates from the forward model. Here, coincident airborne remote sensing and in situ observations obtained during NASA's ObseRvations of Aerosols above CLouds and their intEractionS (ORACLES) field campaign are used to evaluate retrievals of CER for marine boundary layer stratocumulus clouds and to explore impacts of forward RT model assumptions and other confounding factors. Specifically, spectral CER retrievals from the Enhanced MODIS Airborne Simulator (eMAS) and the Research Scanning Polarimeter (RSP) are compared with polarimetric retrievals from RSP and with CER derived from droplet size distributions (DSDs) observed by the Phase Doppler Interferometer (PDI) and a combination of the Cloud and Aerosol Spectrometer (CAS) and the Two-Dimensional Stereo Probe (2D-S). The sensitivities of the eMAS and RSP spectral retrievals to assumptions about the DSD effective variance (CEV) and liquid water complex index of refraction are explored. CER and CEV inferred from eMAS spectral reflectance observations of the backscatter glory provide additional context for the spectral CER retrievals. The spectral and polarimetric CER retrieval agreement is case dependent, and updating the retrieval RT assumptions, including using RSP polarimetric CEV retrievals as a constraint, yields mixed results that are tied to differing sensitivities to vertical heterogeneity. Moreover, the in situ cloud probes, often used as the benchmark for remote sensing CER retrieval assessments, themselves do not agree, with PDI DSDs yielding CER values 1.3–1.6 µm larger than CAS and with CEV roughly 50 %–60 % smaller than CAS. Implications for the interpretation of spectral and polarimetric CER retrievals and their agreement are discussed.
- Article
(18606 KB) - Full-text XML
- BibTeX
- EndNote


The Earth's climate is strongly influenced by clouds. Cloud interactions with incoming shortwave solar radiation and emitted longwave terrestrial radiation, reflecting the former (cooling effect) and trapping the latter (warming effect), are the largest modulator of the Earth's radiative budget. These radiative effects themselves can be altered by cloud microphysical interactions with atmospheric aerosols that can change cloud albedo (Twomey, 1974, 1977; Costantino and Bréon, 2010, 2013; Gupta et al., 2021), cloud lifetime (Albrecht, 1989), and precipitation (van den Heever et al., 2006; van den Heever and Cotton, 2007; Martins et al., 2009; Chen et al., 2011; Gupta et al., 2022a), having direct implications on the Earth's hydrological cycle. While much is known about clouds, a complete understanding of the role of clouds in the Earth's climate and on cloud feedbacks in response to climate change on regional and global scales remains a challenge that is the leading contributor to inter-model uncertainty in climate sensitivity (Dufresne and Bony, 2008; Webb et al., 2012; Zelinka et al., 2012, 2017).
Satellite remote sensing retrievals of cloud properties enable the characterization of clouds, as well as studies of cloud processes, over large spatial and temporal scales. Of particular note are cloud retrievals using spectral imagery from polar-orbiting satellites that provide global observations such as the Advanced Very High Resolution Radiometer (AVHRR) on NOAA's heritage operational weather satellites (e.g., Heidinger et al., 2014), the Moderate Resolution Imaging Spectroradiometer (MODIS) on NASA's Terra and Aqua satellites (Platnick et al., 2017; Minnis et al., 2021), and the Visible Infrared Imaging Radiometer Suite (VIIRS) on the NASA/NOAA Suomi NPP satellite as well as the new generation of NOAA weather satellites (e.g., Frey et al., 2020; Platnick et al., 2021). These sensors observe reflected shortwave and emitted longwave radiation in narrowband spectral channels and provide rich information on cloud detection, cloud-top properties (Wylie and Menzel, 1999; Menzel et al., 2008; Baum et al., 2012), and cloud optical/microphysical properties that include cloud optical thickness (COT) and cloud effective radius (CER) (e.g., Twomey and Cocks, 1982). CER in particular has been widely used for studies of the impacts of aerosol–cloud interactions on radiation (Oreopoulos and Platnick, 2008; Platnick and Oreopoulos, 2008), liquid cloud droplet concentration (Grosvenor et al., 2018), and precipitation (Rosenfeld et al., 2012; Braga et al., 2021).
Imager remote sensing retrievals of CER, from satellites or airborne platforms, typically occur simultaneously with retrievals of COT using a bi-spectral approach pairing reflectance in a non-absorbing visible (VIS), near-infrared (NIR), or shortwave infrared (SWIR) spectral channel sensitive to COT with reflectance in an absorbing SWIR or mid-wave IR (MWIR) channel sensitive to CER (Nakajima and King, 1990). In practice, the observed reflectance-to-COT/CER retrieval inversion relies on forward radiative transfer (RT) calculations using simplified assumptions, e.g., a single, plane-parallel cloud layer having a horizontally and vertically homogeneous particle size distribution. These simplifications, while pragmatic for global-scale retrievals where computational efficiency is a key requirement, nevertheless can lead to retrieval errors for both liquid clouds (Zuidema and Evans, 1998; Várnai and Marshak, 2002; Marshak et al., 2006), whose droplet sizes typically increase with height due to adiabatic growth, and ice clouds (Zhang et al., 2010; Wang et al., 2019), whose crystal sizes typically decrease with height due to sedimentation of larger particles, or for scenes having broken or otherwise spatially heterogeneous cloud fields (Zhang et al., 2012, 2016). Moreover, for liquid clouds, recent studies have shown that the imaginary part of the complex index of refraction of liquid water, a fundamental assumption for RT calculations, has a temperature dependence in the SWIR (Kou et al., 1993) that has sizable impacts on computed cloudy reflectance in this spectral region and thus on spectral retrievals of CER (Platnick et al., 2020).
Given their utility and wide use, numerous efforts have been undertaken to evaluate satellite cloud remote sensing retrievals. For retrievals of liquid CER, defined as the ratio of the third to second moments of the particle size distribution, evaluation efforts for liquid clouds often include comparisons against cloud droplet size distributions (DSDs) measured in situ by airborne cloud probes. Such evaluations against cloud probes have a long history (Nakajima et al., 1991; Platnick and Valero, 1995; Painemal and Zuidema, 2011; Min et al., 2012; King et al., 2013; Noble and Hudson, 2015; Gupta et al., 2022b) and consistently find that bi-spectral CER retrievals, while highly correlated with CER derived from in situ DSDs, nevertheless are on average roughly 2 µm larger than the in situ measurements. In contrast, Witte et al. (2018), using DSDs measured by the Phase Doppler Interferometer (PDI) (Chuang et al., 2008) during three different field campaigns, found no systematic bias in MODIS CER retrievals, which could be interpreted as the CER derived from legacy probe DSDs being biased low due to inadequate characterization of the full width of the DSD.
The ObseRvations of Aerosols above CLouds and their intEractionS (ORACLES) field campaign (Redemann et al., 2021), a NASA Earth Venture Suborbital-2 investigation with three deployments from 2016 to 2018, provides another opportunity to evaluate imager bi-spectral CER retrievals against cloud probe DSDs. ORACLES targeted the unique aerosol and cloud environment over the southeast (SE) Atlantic Ocean where an extensive biomass burning smoke layer overlies a quasi-permanent marine stratocumulus cloud deck (Swap et al., 2003; Devasthale and Thomas, 2011; Meyer et al., 2013; Alfaro-Contreras et al., 2014a). The 2016 ORACLES deployment featured two aircraft: the low-altitude P-3 Orion, hosting a comprehensive suite of aerosol, cloud, and atmospheric chemistry and meteorological in situ instrumentation, and the high-altitude ER-2, hosting a diverse active and passive remote sensing payload. The P-3 in situ instruments included the PDI cloud probe, the Cloud and Aerosol Spectrometer (CAS) (Baumgardner et al., 2001) cloud probe on the Cloud, Aerosol, and Precipitation Spectrometer (CAPS), the Cloud Droplet Probe (CDP) (Lance et al., 2010), the Two-Dimensional Stereo Probe (2D-S) (Lawson et al., 2006), the High Volume Precipitation Sampler (HVPS-3) (Lawson et al., 1998), and the King hot wire (King et al., 1978) to measure the bulk liquid water content. The ER-2 remote sensing payload included multi-spectral imagery from the Enhanced MODIS Airborne Simulator (eMAS) (King et al., 1996; Ellis et al., 2011) and multi-angle polarimetry from the Research Scanning Polarimeter (RSP) (Cairns et al., 1999, 2003); eMAS has SW and LW spectral channels analogous to MODIS, VIIRS, and other satellite imagers, enabling bi-spectral COT/CER retrievals using channel pairs featuring several SWIR channels in both the 1.6 and 2 µm spectral regions. RSP's along-track hyper-angle polarimetric observations provide independent retrievals of CER along with the effective variance (CEV) of the DSD for observations that sample the scattering angles around the cloud bow, and its spectral channel complement also enables multi-angle bi-spectral COT/CER retrievals. During ORACLES 2016, multiple science flights featured coordinated maneuvers where the P-3 sampled within the stratocumulus cloud layer while the ER-2 made multiple passes overhead. These coordinated flights enable an evaluation of remote sensing retrievals, as well as key retrieval assumptions, against spatially and temporally co-located cloud probe measurements using distinctly different in situ sampling techniques.
In this paper, we provide a brief overview of the multi-spectral imager eMAS, its operations during ORACLES 2016 (including spectral channel configuration changes and their impacts on eMAS science products), and post-deployment radiometric calibration efforts. We then show results of an extensive evaluation of bi-spectral CER retrievals from eMAS and RSP against polarimetric CER retrievals from RSP and CER derived from the in situ cloud probes. In addition, in several instances during the campaign the ER-2 flight direction was oriented such that eMAS observed scattering angles near the direct backscatter region within its swath, enabling the inference of CER and DSD effective variance from the total reflectance angular features of the “glory” akin to the polarized cloud-bow retrievals of RSP. We show results from these glory retrievals and conclude with a discussion of the broader implications of the consistency, or lack thereof, of in situ cloud probe observations and remote sensing retrievals of CER from spectral reflectance and polarimetry having different, though complementary, sensitivities and information content.
2.1 ER-2 remote sensing observations
Two instruments in the ER-2 remote sensing payload are used here – the Enhanced MODIS Airborne Simulator (eMAS) and the Research Scanning Polarimeter (RSP). The instrument eMAS, a NASA facility instrument managed by the Ames Research Center (ARC) Airborne Sensor Facility (ASF), is a scanning spectrometer that measures reflected solar and emitted terrestrial radiation in 38 narrowband spectral channels between 0.47 and 14.1 µm wavelengths (King et al., 1996; Ellis et al., 2011). It was originally designed to provide an airborne platform for developing, testing, and refining geophysical retrieval algorithms for the Moderate Resolution Imaging Spectroradiometer (MODIS) prior to its launch on NASA's Terra and Aqua satellites. From a notional ER-2 flight altitude of 20 km, eMAS views a 37.25 km wide swath with a ground-level pixel size at nadir of roughly 50 m. In addition to broad swath imagery that provides scene context for nadir-viewing ER-2 remote sensing instruments (lidars, radars, etc.) as well as co-located P-3 in situ instruments during targeted coordination, eMAS can also provide Level-2 geophysical retrievals of land and ocean surface and atmospheric parameters that for ORACLES include cloud and aerosol optical and microphysical properties (King et al., 2004, 2010; Meyer et al., 2016).
RSP, a principal investigator (PI) instrument from NASA's Goddard Institute for Space Studies (GISS), is a scanning polarimeter that simultaneously observes both the total reflectance and its linear polarization state in nine narrowband spectral channels from 0.41 to 2.26 µm (Cairns et al., 2003). Rather than imaging across track, RSP only scans in the along-flight-track direction, achieving a high angular resolution at the expense of an across-track swath, which is only a single pixel wide. With a 14 mrad instantaneous field of view (FOV), RSP has a native ground-level pixel size at nadir of roughly 300 m from a notional ER-2 flight altitude of 20 km, though the effective pixel size may be larger due to co-location of the multi-angle observations to different target heights for cloud retrieval products.
2.2 P-3 in situ observations
We make use of various in situ probes in this study that were flown on the P-3 during ORACLES. Several cloud probes provide independent observations of cloud droplet size distributions (DSDs) that are used to calculate CER for comparisons with the eMAS and RSP retrievals. These cloud probes include the legacy Cloud and Aerosol Spectrometer (CAS) (Baumgardner et al., 2001), the Two-Dimensional Stereo Probe (2D-S) (Lawson et al., 2006), and the Phase Doppler Interferometer (PDI) (Chuang et al., 2008). Note that CAS and 2D-S, having sensitivities to different droplet size ranges (droplets up to 50 µm diameter for CAS and roughly between 25–150 µm diameter for 2D-S), are merged to create a single microphysics DSD; PDI, on the other hand, has sensitivity to droplets between 3–500 µm. The Cloud Droplet Probe (CDP) (Lance et al., 2010) was also flown in ORACLES, though its 2016 data are affected by an optical misalignment issue (Gupta et al., 2022a) and are not used here. A King hot wire (King et al., 1978) provides liquid water content (LWC) measurements that are used as constraints on the CAS DSDs. All in situ data used in this study are reported at 1 s sampling and are obtained from the multi-instrument merged product files pre-packaged by the ORACLES science team for ease of use: King LWC and PDI DSDs from a P-3 merged dataset product (Shinozuka, 2025) and CAS/2D-S DSDs from a merged microphysics product (Poellet, 2025; O'Brien et al., 2025).
2.3 Remote sensing cloud property datasets
The standard eMAS and RSP cloud product datasets, produced by their respective science teams at NASA's Goddard Space Flight Center (GSFC) and at GISS, are used here. For eMAS, the primary science products produced during and after field campaign deployments are the geolocated and calibrated Level-1B (L1B) spectral radiances (NASA, 2020a) and the Level-2 (L2) cloud geophysical retrieval products (NASA, 2020b) that include cloud masking and cloud-top and optical/microphysical properties. The L2 cloud products have heritage with the cloud products for MODIS and the Visible Infrared Imaging Radiometer Suite (VIIRS) from the NASA MODIS/VIIRS Science Team. Specifically, the cloud mask has heritage with the NASA MODIS Collection 6 cloud mask product (MOD35) (Ackerman et al., 2008; Frey et al., 2008), the cloud-top property retrievals have heritage with the NOAA Algorithm Working Group (AWG) PATMOS-x algorithm (based on CLAVR-x ;Heidinger and Pavolonis, 2009) that is part of the MODIS/VIIRS CLDPROP continuity cloud products (Platnick et al., 2021), and the cloud optical/microphysical properties (e.g., thermodynamic phase, optical thickness, particle effective size, water path) have heritage with the NASA MODIS Collection 6 cloud product (MOD06) (Platnick et al., 2017). These L2 algorithms are part of the CHIMAERA shared-core suite of cloud algorithms (Wind et al., 2020) that also includes the MODIS MOD06 and MODIS/VIIRS CLDPROP cloud optical property algorithms.
The along-track RSP data products produced by GISS include geolocated and calibrated L1B stokes-vector multi-angle reflectances (I, Q, U) in nine spectral channels and L2 cloud geophysical retrieval products that feature cloud-top and optical/microphysical properties (Cairns, 2025). As an additional step prior to the L2 cloud retrievals, there is an L1C product that reprojects and co-locates the L1B multi-angle reflectances to cloud-top height. This additional step is required to account for view angle parallax that causes targets at different altitudes in the atmosphere to shift relative to observations co-located to the surface. As a consequence, the L1C product requires prior cloud masking and cloud-top height retrievals, which are produced as an interim geophysical retrieval obtained from the stereoscopic approach described in (Sinclair et al., 2017). The L2 cloud microphysical properties include, along with nadir-only COT/CER retrievals from bi-spectral reflectance observations, retrievals of CER and CEV from the polarized cloud bow (Alexandrov et al., 2012), which are enhanced microphysical information for aerosol–cloud–radiation interaction studies (Adebiyi et al., 2020).
In addition to the above standard RSP cloud products produced by GISS, the GSFC CHIMAERA shared-core cloud algorithm suite has been updated to provide bi-spectral COT/CER retrievals from RSP at each RSP observational angle. These multi-angle optical property retrievals are internally consistent with the standard eMAS retrievals in that they use the same science code, radiative transfer code and assumptions, and ancillary data. This consistency of approach enables synergistic use of the eMAS and RSP retrievals in the evaluations and science analyses shown here.
2.4 Computing remote sensing cloud effective radius from in situ probe observations
Comparing remote sensing retrievals of CER with those derived from in situ cloud probe measurements of droplet size distributions (DSDs) is not a straightforward enterprise. For instance, the spectral channels used for retrievals have differences in liquid water absorption that can yield quite different vertical penetration depths for the light scattered within the cloud. These spectral differences can lead to sensitivity to the vertical variation in the droplet size distributions and thus sensitivity to vertical variations in CER (e.g., Platnick, 2000). Furthermore, these vertically varying DSDs and associated spectral sensitivities can be independently coupled to retrieval sensitivities to horizontal heterogeneity. As such, care must be taken to ensure that the in situ cloud probe sufficiently sampled the cloud layer and that the CER calculated from the probe observations reflects an appropriate estimate of what the imager spectral channel should ideally expect to retrieve from this known cloud profile. Thus, for the in situ cloud probe data, calculating the CER that would approximate an eMAS spectral CER retrieval is a multistep process.
CER is defined as the ratio of the third and second moments of the DSD (Hansen and Travis, 1974). From cloud probe data, this is calculated as (Painemal and Zuidema, 2011)
where ni is the droplet number concentration (cm−3) per particle size bin i, and ri is the mean radius within the bin; ni and ri are obtained directly from the PDI or CAS/2D-S datasets, aggregated over 1 s intervals, in the ORACLES P-3 merged and microphysics files. For qualitative purposes, we compute CER for each 1 s probe DSD sample. Of more relevance for the CER retrieval evaluation, however, for each case study we also aggregate the 1 s PDI and CAS/2D-S DSD samples into single vertical profiles having 10 m thick layers, from which we then compute a profile of CER for each probe at consistent vertical levels. This is accomplished first by calculating the layer DSD by averaging all 1 s sampled DSDs within the 10 m layer having corresponding probe LWC > 0.01 g m−3. Then the layer CER(z) is calculated from the layer DSD using Eq. (1) above. This CER vertical profile is used as input to a forward radiative transfer (RT) model to calculate spectral vertical weighting functions from which estimates of the remotely sensed eMAS spectral CER retrievals can be computed following Platnick (2000).
For the vertical weighting function computation, we use the 1-D, plane-parallel DISORT (Stamnes et al., 1988) as our RT model. Mie calculations using MIEV0 (Wiscombe, 1980) are used to calculate the spectrally resolved monodisperse single-scattering properties of each PDI and CAS/2D-S size bin at high spectral resolution. The mean single-scattering properties for each layer are subsequently computed by first weighting over the size dimension of the PDI or CAS/2D-S DSDs (i.e., ni) and then weighting spectrally with respect to the eMAS spectral response function (f(λ)) and spectral solar irradiance (F0(λ)). The monochromatic bulk extinction coefficient βext(z,λ) for each layer, z, and wavelength, λ, is calculated as
where is the extinction efficiency for the given wavelength, DSD bin center radius, and layer; ni(z) is the droplet number concentration (cm−3) for the layer and DSD bin. The band-averaged extinction coefficient for eMAS spectral channel b is then
Layer spectral COT for eMAS channel b, the vertical integral of the extinction coefficient over the layer, is then estimated as
where Δz is the layer physical thickness (here 10 m). We then input COT(z,b) and the layer scattering properties into DISORT, along with the eMAS sun/sensor viewing geometry (solar and sensor zenith angles, relative azimuth), to iteratively calculate cumulative top-of-cloud reflectance stepping vertically through the cloud layer by layer, starting at cloud top.
The radiative weighting functions are defined following Platnick (2000):
where z here is physical depth into the cloud and is defined as zero at cloud top, Δz is the physical thickness of the vertical layers (10 m), τ is the spectral COT at a given depth, τc is the total spectral COT of the entire sampled cloud depth, and R is top-of-cloud reflectance or reflectance observed at cloud top without the influence of atmospheric gaseous absorption and aerosol scattering. Thus, the weighting function essentially represents the incremental contribution of each layer to the cumulative cloud-top reflectance with respect to its incremental contribution to the increase in cloud optical thickness, normalized by the reflectance of the entire cloud, with the calculation starting at cloud top and moving down. The estimate of the expected eMAS CER from spectral channel b (1.6, 2.13, 3.7 µm, etc.) is then
CER from Eq. (6) can be thought of as a radiatively weighted average of the CER vertical profile observed by the cloud probes. Platnick (2000) showed that, for spectral channels in the 1.6, 2, and 3.7 µm regions observed by imagers such as eMAS, MODIS, and VIIRS, the weighting functions in Eq. (5) for liquid clouds peak near the top of the cloud (see also Figs. 10c and 14c below). Where these peaks are located vertically in relation to cloud top is determined by the spectral absorption strength (extinction coefficient in Eqs. 2–3), with more strongly absorbing spectral channels weighted closer to cloud top and more weakly absorbing channels weighted deeper within the cloud. While we attempt to explicitly account for varying spectral vertical sensitivities using Eqs. (2)–(6), previous studies often consider only a broad sensitivity to near-cloud-top CER irrespective of spectral channel sensitivities. For instance, the Gupta et al. (2022b) evaluation of MODIS CER against CAS and CDP DSDs observed in ORACLES averages the probe data over the topmost 10 % of the geometrical thickness of the cloud.
In addition to evaluating CER retrievals, we are also interested in evaluating assumptions about the DSD that are used in the computation of cloud single-scattering properties that serve as inputs to the forward RT model and look-up tables (LUTs) used in the retrieval inversion. For imager bi-spectral retrievals, the DSD is typically assumed to be a modified gamma distribution defined by a pair of scale and shape parameters, namely, the effective radius (CER), i.e., the mean radius of the cross-section distribution, and the effective variance (CEV), i.e., the narrowness/symmetry of the distribution (small CEVs correspond to more narrow and less asymmetric distributions and vice versa).
Following Eq. (3) in Miller et al. (2018), CEV can be estimated from in situ probe data as
where is the mth moment of the DSD.
In this study, we show 1 s and aggregated 10 m layer CER and CEV calculated from both the CAS/2D-S and PDI probes. We note that O'Brien et al. (2025) selects CAS/2D-S to produce the best estimate merged microphysics product for ORACLES 2016 since they found that LWC computed from PDI overestimates the bulk and computed adiabatic LWC when considering all cloud samples. However, for samples near cloud top where the imager spectral CER retrievals are most sensitive, the PDI LWC matches more closely and in fact slightly underestimates the adiabatic LWC (see Fig. 3, O'Brien et al., 2025), whereas CAS/2D-S significantly underestimates LWC, implying an underestimation of droplet size. Gupta et al. (2022b) provide an adjustment to the magnitude of the CAS DSD size bins using the King LWC as a constraint that results in larger CER. However, these adjustments were derived via comparisons of bulk CAS and King LWC statistics across all in-cloud observations, regardless of position with respect to cloud top, obtained over multiple flights, and still appear to underestimate droplet size near cloud top (see Figs. 10 and 14 below).
3.1 Deployment overview
Flight operations during ORACLES 2016 were based out of Walvis Bay, Namibia, on the Atlantic coast from late August through September. From Walvis Bay, the P-3 flew 13 science flights, beginning 30 August and ending 25 September, while the ER-2 flew 10 science flights, beginning 10 September and ending 27 September. Both aircraft operated solely over the SE Atlantic in a region off the coasts of Angola and northern Namibia. Flight paths largely focused on targets of opportunity in addition to a frequent routine flight path that followed a diagonal from 20° S, 10° E to 10° S, 0° E. For the routine flight, the P-3 flew out and back along the diagonal, with frequent maneuvers to sample the environment above, below, and within both the aerosol and cloud layers; the ER-2, due to its longer range, typically flew the diagonal only on its return to Walvis Bay. Coordination between the two aircraft, i.e., direct ER-2 overflights of the P-3 for co-located in situ and remote sensing observations, was periodically pursued. In particular, two such coordinated flights, on 14 and 20 of September, featured multiple ER-2 overpasses while the P-3 was sampling within the cloud layer at two different locations on each day. Results from the 20 September co-locations are shown in Sect. 4.2.
The flight tracks of the 10 ER-2 science flights are shown in Fig. 1. Note that eMAS was not powered during the 22 September ER-2 flight (red track) due to a pre-flight data system issue. During the entirety of the ORACLES 2016 deployment, eMAS operated without its full complement of spectral channels. Prior to pre-campaign integration on the ER-2, the 7.3 µm longwave channel became inoperable due to faulty wiring; thus, eMAS entered the field with only 37 spectral channels. Furthermore, issues with the cooling system for the cold optical bench caused periodic losses of the mid-wave/longwave (MW/LW) spectrometer and thus losses of thermal infrared (IR) channels. The first instance occurred prior to the 16 September flight, and only the shortwave spectrometer was powered for the flight. Post-flight hardware replacements allowed the MW/LW spectrometer to operate for the next two flights, but after issues arose again prior to the 24 September flight, the decision was made to not power the MW/LW spectrometer for the duration of the deployment. Nevertheless, for the two intensive aircraft coordinations on 14 and 20 September, eMAS operated with both the SW and MW/LW spectrometers obtaining data. The flight tracks without the MW/LW spectrometer are shown in yellow in Fig. 1.
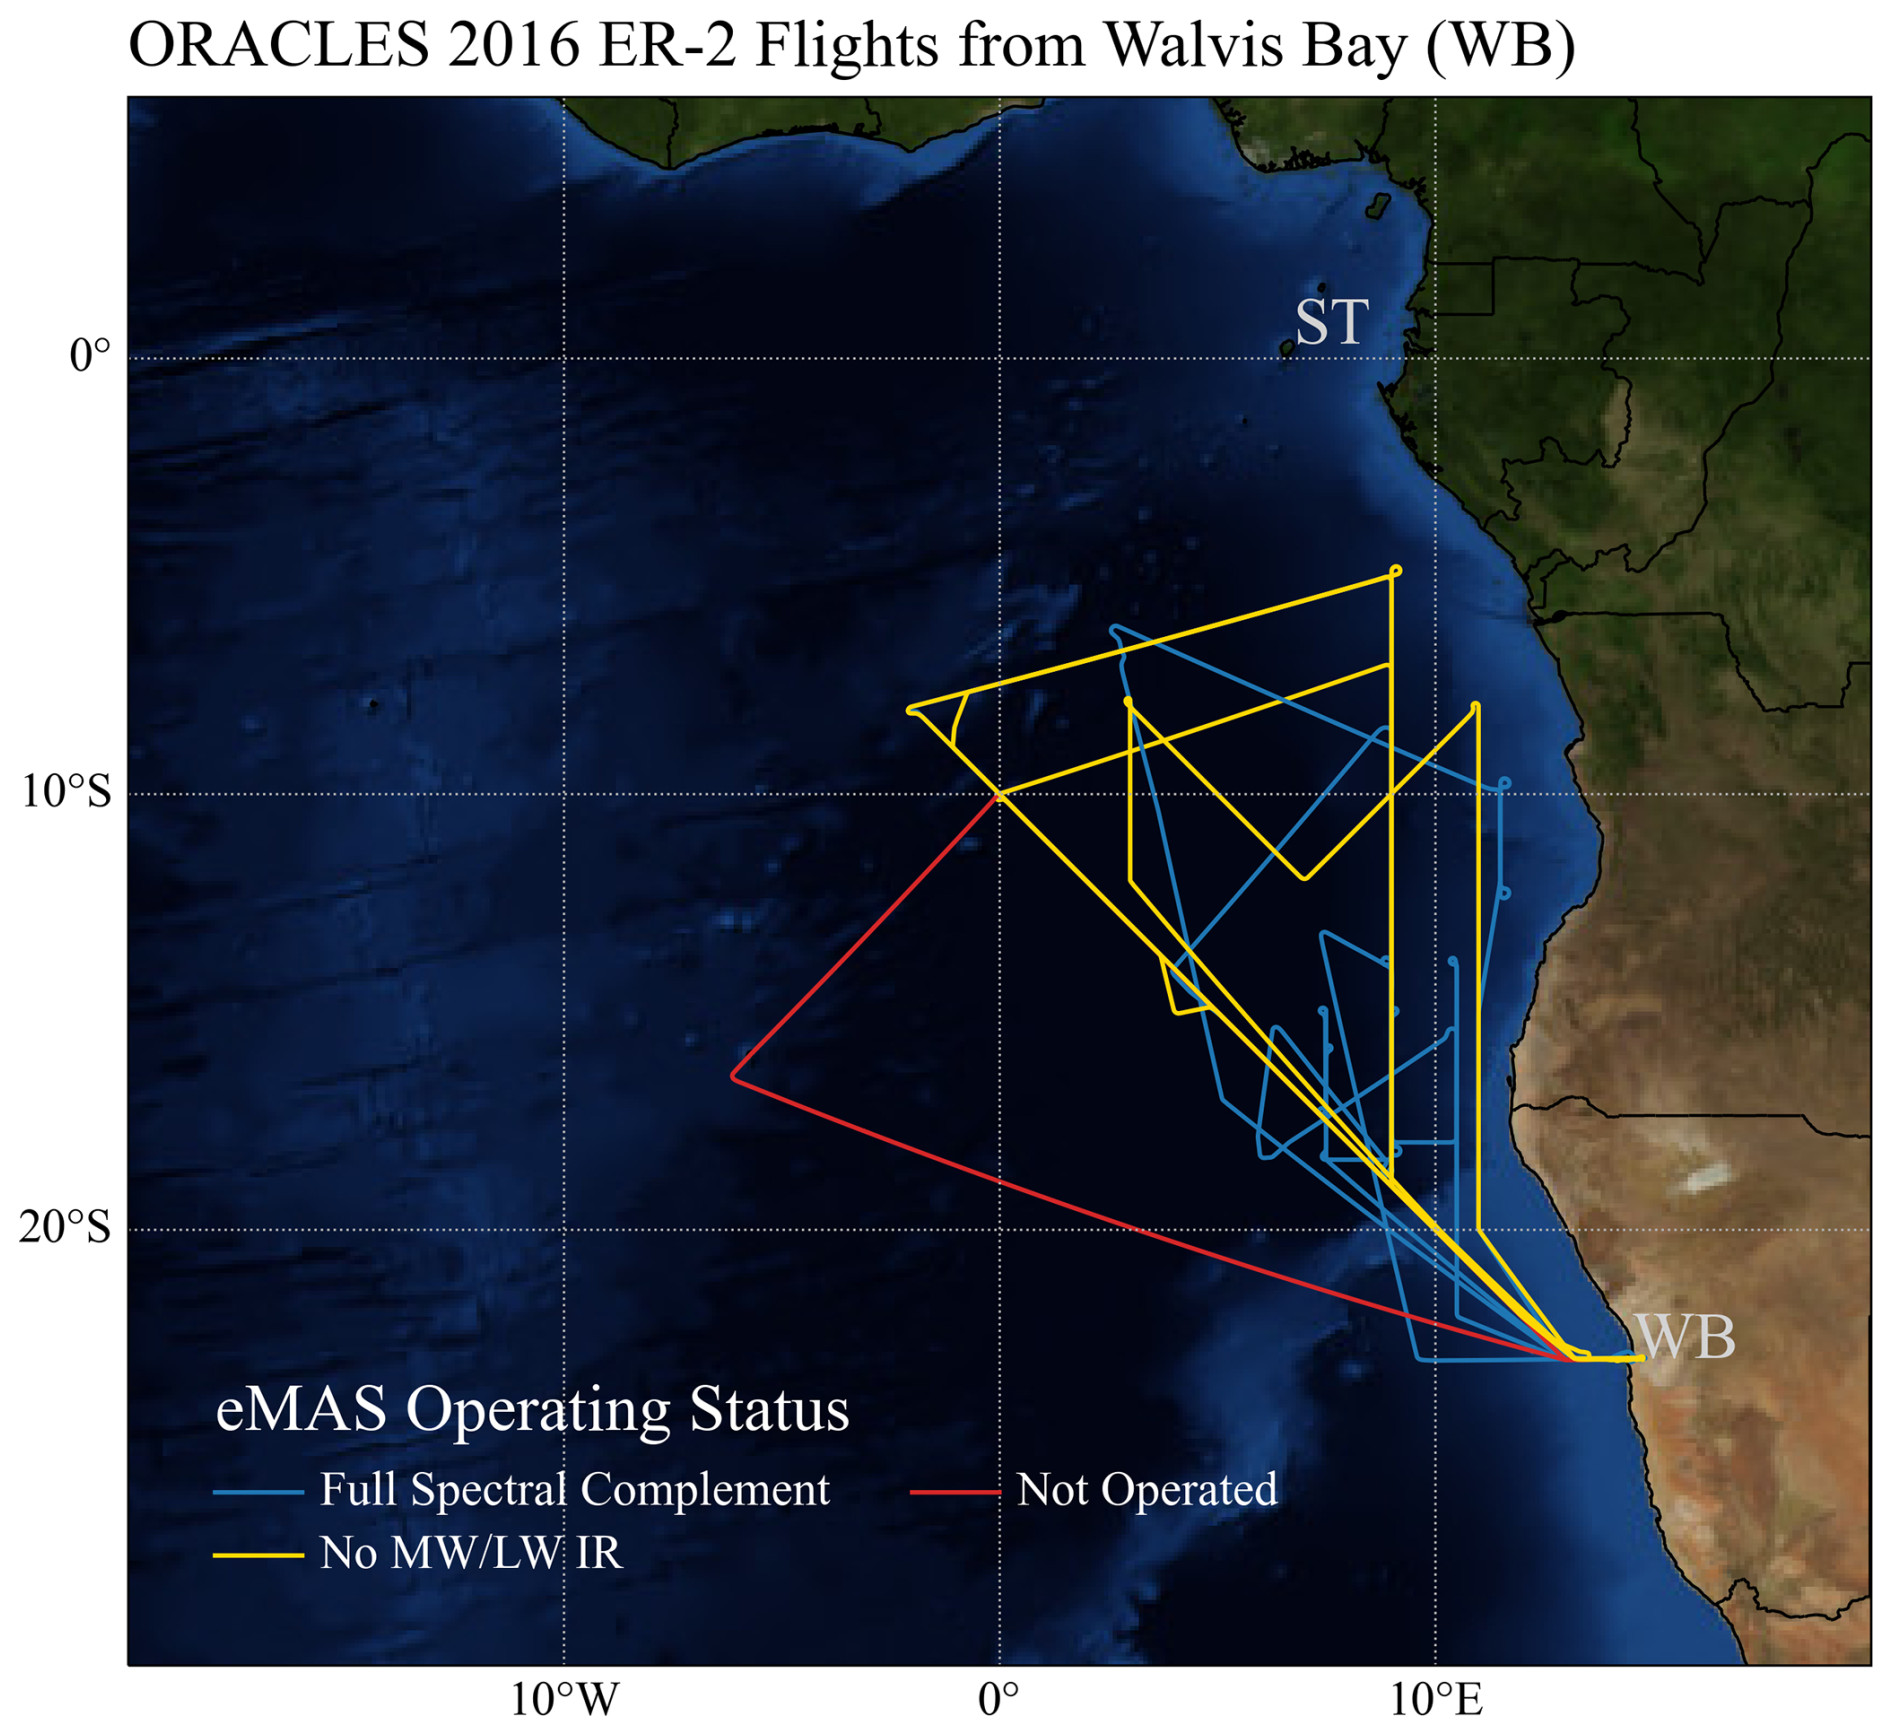
Figure 1The 10 ER-2 science flight tracks during ORACLES 2016 originating from Walvis Bay, Namibia (location indicated by “WB”). Tracks in blue are those for which the full complement of eMAS spectral channels was available (minus 7.3 µm; five flights). Tracks in yellow are those for which the eMAS MW/LW spectrometer was not powered (four flights). The red track indicates the flight on which eMAS did not operate.
3.2 eMAS radiometric calibration
Science analysis of eMAS field campaign data, in particular generating L2 geophysical retrievals for use by the science team and the broader community, relies on the ability to characterize, with some degree of confidence, the absolute radiometric calibration of both the SW and MW/LW spectrometers. For the MW/LW spectral channels, in-flight radiometric calibration is monitored by observing two IR blackbody sources once each scan.
Radiometric calibration of the SW spectral channels, on the other hand, is a more onerous process. It includes pre- and post-deployment laboratory calibration using ASF's NIST-traceable standard integrating hemispheres and in-field radiometric stability monitoring using a stable portable integrating hemisphere prior to each science flight. However, the eMAS optical path is exposed to ambient in-flight conditions; thus, the applicability at flight altitude of the radiometric calibration determined at ground level is uncertain. These ground monitoring activities therefore only provide insight into relative calibration changes and trends that often occur during the campaign due to the accumulation of dust, dirt, or other debris on the optics that can gradually degrade the radiometric response over time. They are not used to establish absolute radiometric calibration. Absolute radiometric calibration is instead established via comparisons of cloudy reflectance and cloud optical/microphysical property retrievals with those of co-located spaceborne imagers during targeted satellite underflights and, when available, via reflectance comparisons against vicarious calibration sites (Hook et al., 2001; King et al., 2010; Bruegge et al., 2021) obtained from overflights of such sites before, during, and/or after the campaign.
For ORACLES 2016, the pre- and post-deployment laboratory calibration and in-field hemisphere data suggested a non-negligible degradation (darkening) of the SW channels with time, though flight-to-flight variability of the hemisphere data precluded definitively quantifying the change. Thus, for the first time, we used direct comparisons of nadir reflectance against co-located RSP nadir total reflectance observations to establish the radiometric degradation trend, as well as flight-to-flight changes to the calibration adjustments, in the primary eMAS spectral channels used for cloud optical and microphysical property retrievals. For the absolute calibration, three coordinated underflights of Aqua MODIS were obtained, occurring on 18, 20, and 27 September, though broken cloud conditions on 27 September precluded its use in the calibration analysis.
Our comparisons with Aqua MODIS during the satellite underflights and with RSP during all science flights suggest that eMAS experienced a roughly 5 %–7 % radiometric degradation in its SW channels over the course of the campaign. Moreover, this degradation was not linear with respect to flight number as had been assumed in past campaigns. Figure 2 shows the temporal radiometric adjustment factors (solid lines), derived from the RSP comparisons, for the six primary eMAS channels used for cloud optical and microphysical property retrievals, plotted as a function of flight date. The calibration results from the Aqua MODIS comparisons, used to anchor the RSP-derived flight-to-flight changes to an absolute calibration benchmark (i.e., shifting the RSP-derived results up or down based on the comparisons with MODIS), are also shown for the 18 and 20 September underflights (dashed lines and boxes).
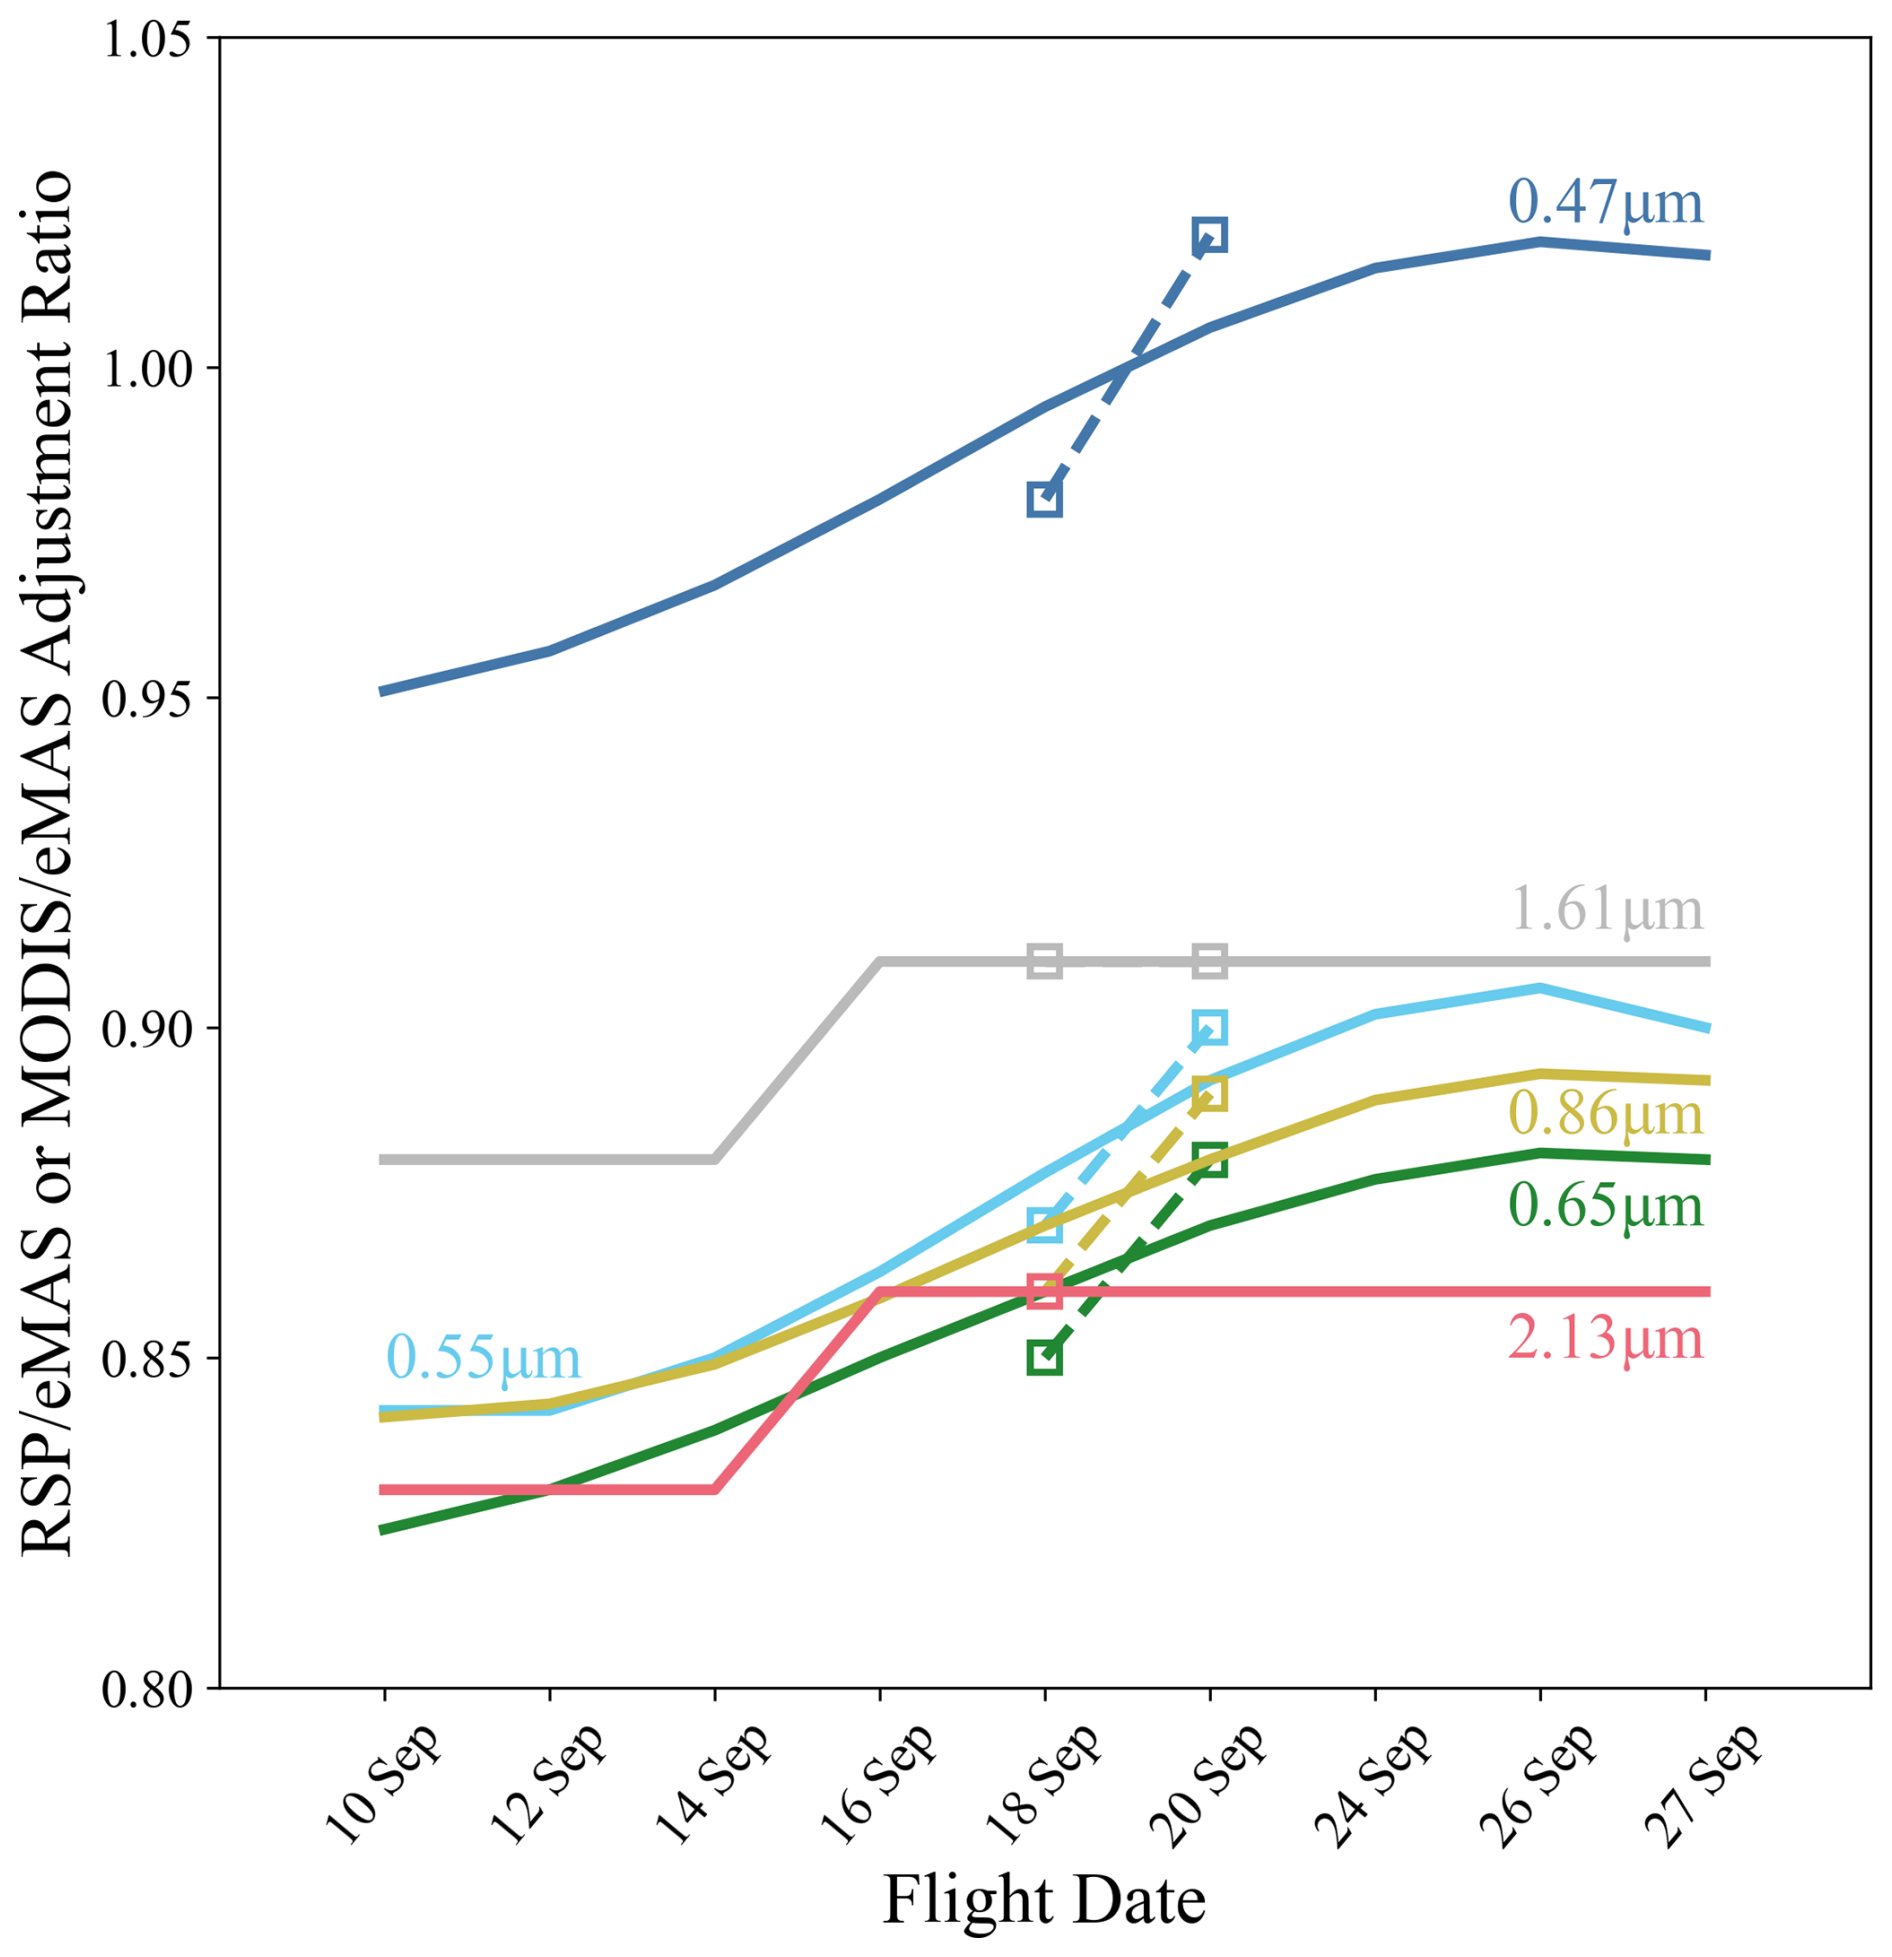
Figure 2Flight-dependent radiometric adjustment factors applied to the eMAS shortwave spectral channels. The solid lines, capturing flight-to-flight eMAS changes, were derived from comparisons with RSP (assumed stable across all flights), while the absolute magnitudes were anchored by comparisons with Aqua MODIS on 18 and 20 September (dashed lines with box symbols).
Calibration of the remaining SW channels not included in Fig. 2, which does not have analogous MODIS counterparts and thus whose absolute calibration cannot be established directly from MODIS comparisons, instead relies on past vicarious calibration experience. Vicarious calibration data collected in 2013 after the SEAC4RS (Studies of Emissions and Atmospheric Composition, Clouds and Climate Coupling by Regional Surveys) campaign (Arnold et al., 2025) and in 2019 after the FIREX-AQ (Fire Influence on Regional to Global Environments Experiment – Air Quality) campaign (Bruegge et al., 2021) showed a reasonably consistent channel-to-channel relative calibration. Given this consistency, we assume that the channel-to-channel relative calibration for ORACLES 2016 follows the 2013 and 2019 vicarious calibration results. Thus, we derive the calibration adjustments for the remaining SW channels relative to the six primary channels in Fig. 2 using the mean of the 2013 and 2019 channel-to-channel relative calibration offsets. Note that the eMAS L1B data in the public archive have the above adjustment factors pre-applied.
4.1 eMAS standard cloud property products
Example eMAS imagery and L2 cloud property retrievals from the ER-2 science flight on 14 September 2016 (flight track 4, 09:17–09:22 UTC) are shown in Fig. 3. Shown here are the true-color RGB (0.47, 0.55, 0.65 µm) and retrieved cloud-top temperature (CTT), cloud optical thickness (COT), and cloud droplet effective radius (CER) from three spectral channels having heritage with MODIS (1.62, 2.13, 3.7 µm). The arrow in the RGB indicates the direction of flight of the ER-2, which for this track had a southwestward heading of 234.2° (relative to due north); the eMAS swath width and track length are denoted by the labels on the horizontal and vertical axes, respectively, of the RGB. As was often the case during ORACLES, only liquid-phase boundary layer stratocumulus clouds were observed in this track. Note that the spectral CER retrievals exhibit differences that can be linked in part to real physics, namely, differences in vertical penetration depths of spectral radiation (Platnick, 2000) coupled with droplet sizes that often correlate with height within the cloud consistent with the droplet growth of the adiabatic cloud parcel model. These differences are revisited in Sect. 4.2 via comparisons with in situ droplet size distribution measurements by the PDI and CAS/2D-S cloud probes.
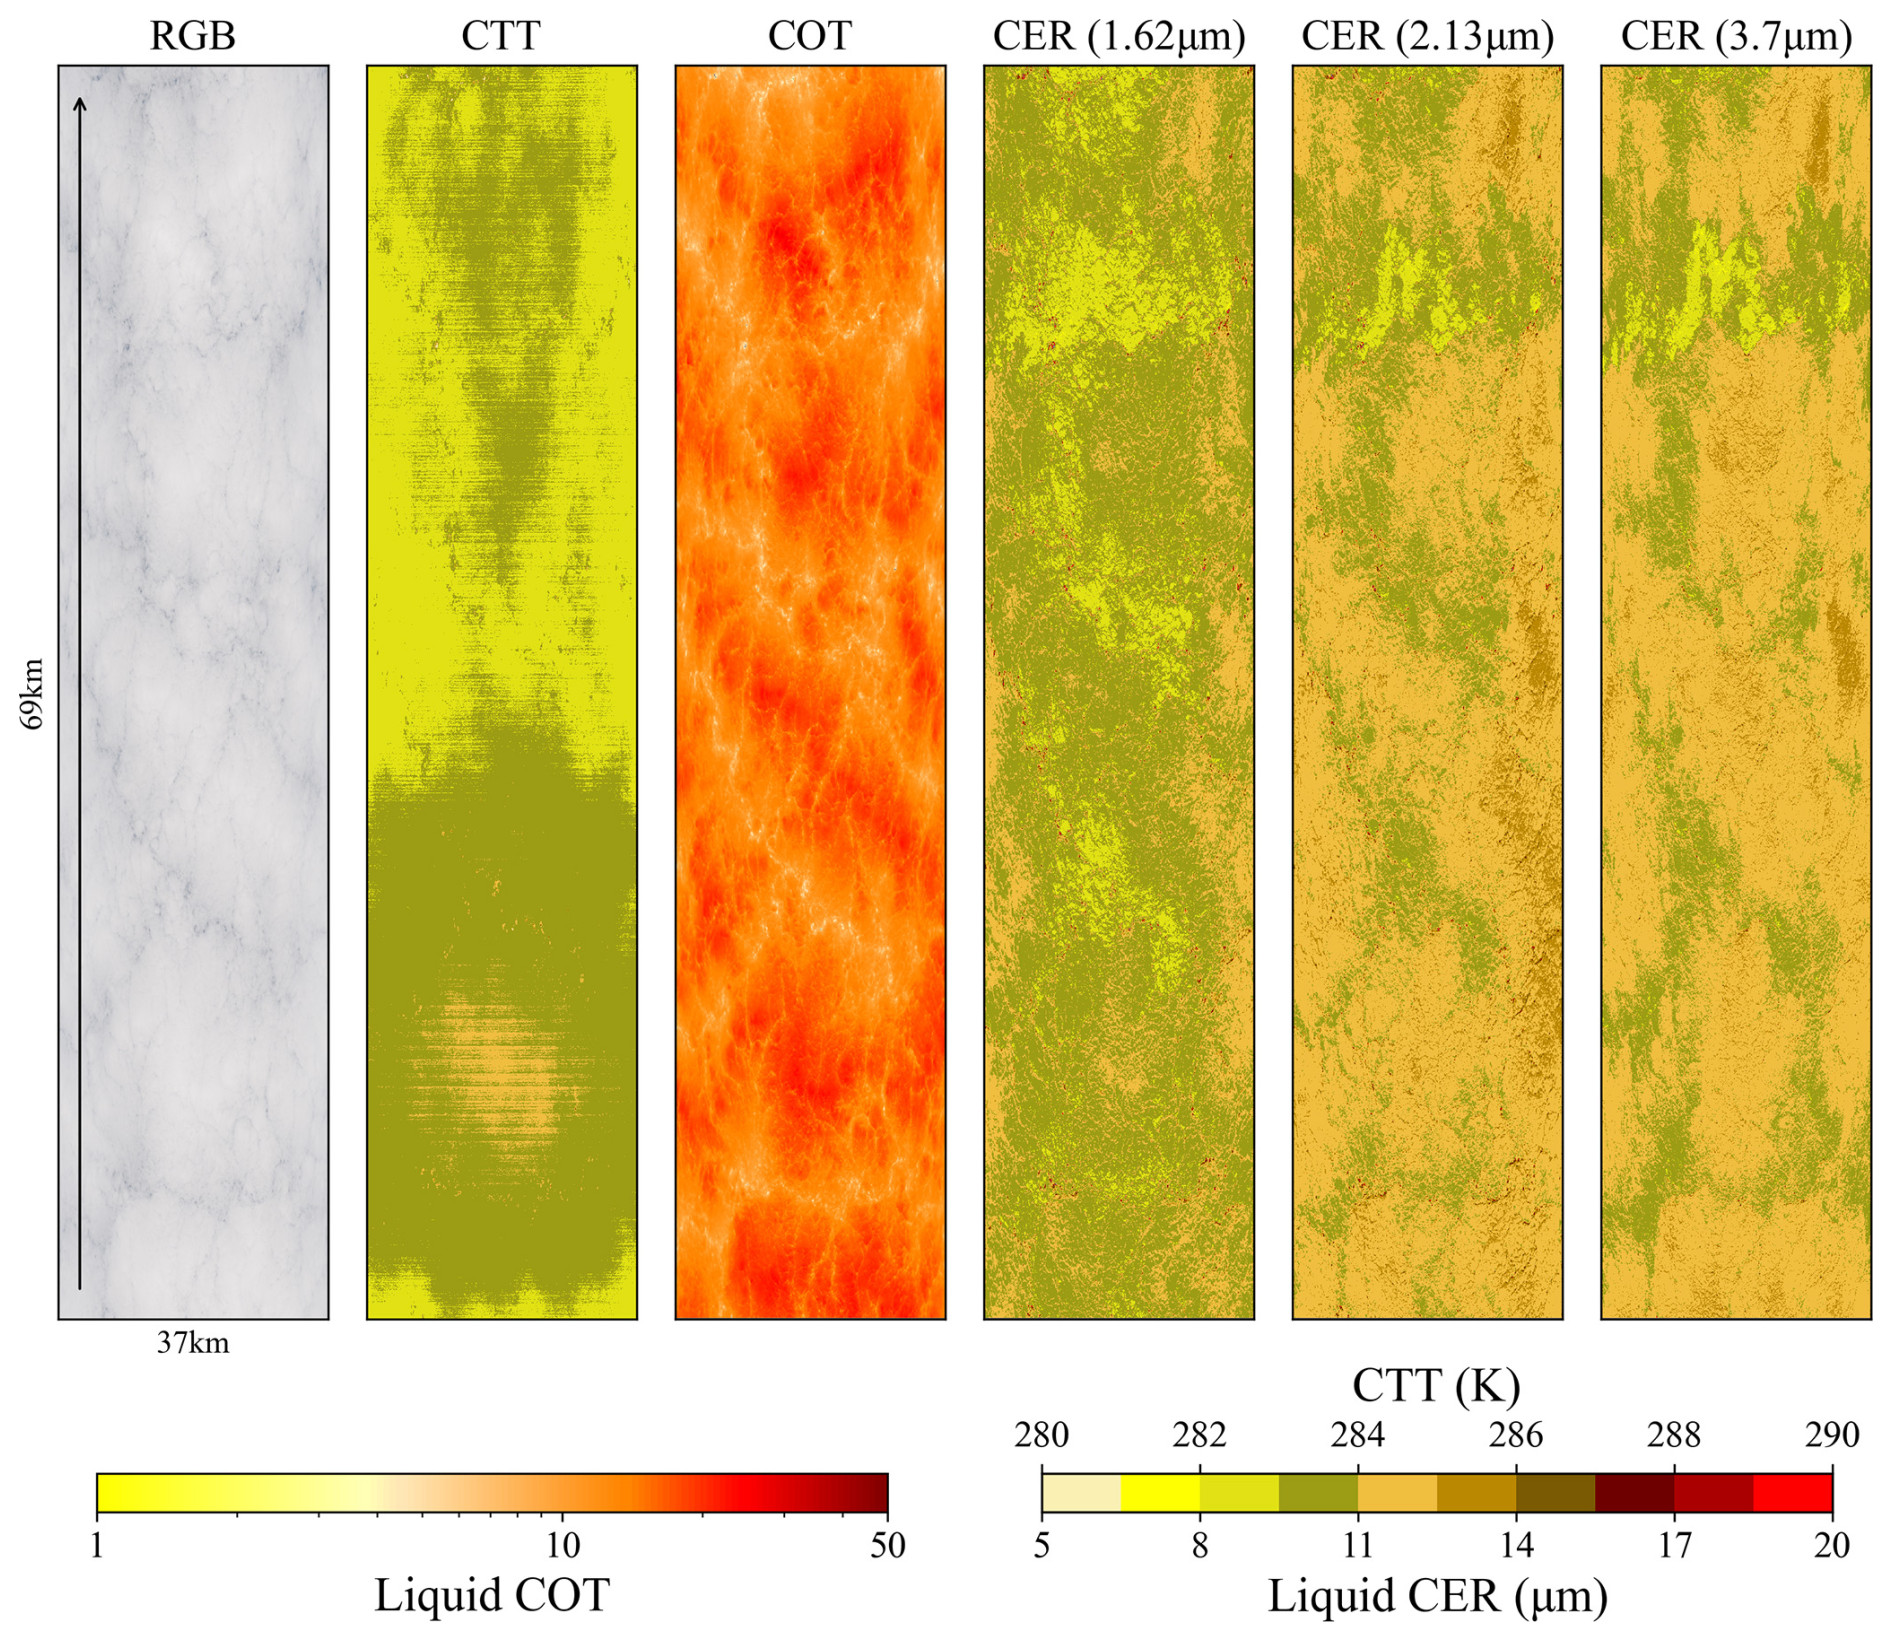
Figure 3Example eMAS imagery and standard Level-2 cloud property retrievals from the ER-2 science flight on 14 September 2016 (flight track 4, 09:17–09:22 UTC).
Pixel-level retrieval uncertainties for the COT and spectral CER retrievals in Fig. 3 are shown in Fig. 4. Like their heritage MOD06 retrieval counterparts, these uncertainties account for known and quantifiable error sources such as instrument radiometry, atmospheric corrections (ancillary atmosphere profiles), surface spectral reflectance, and forward model errors (e.g., effective variance of the assumed droplet size distribution), and for the 3.7 µm retrievals, there are additional error sources arising from the necessity to remove the contribution of thermal emission from the surface and atmosphere from the observed radiance (Platnick et al., 2017). However, unlike MOD06 that uses the pixel-level radiometric uncertainties reported in the MODIS L1B product, the eMAS L1B does not include pixel-level radiometric uncertainties, and the cloud optical and microphysical retrievals must assume fixed relative radiometric uncertainties for retrieval uncertainty estimates; for ORACLES, these radiometric uncertainties are set at 7 % in all SW spectral channels and 5 % for the solar component of the 3.7 µm MWIR channel. Uncertainties in the spectral CER retrievals are shown here to decrease with increasing wavelength, largely a consequence of the increasing orthogonality of the COT/CER solution space moving from 1.62 via 2.13 to 3.7 µm that decreases sensitivity to changes in spectral reflectance.

Figure 4Pixel-level retrieval uncertainties for the COT and spectral CER retrievals in Fig. 3.
In addition to the MODIS-heritage 1.62, 2.13, and 3.7 µm spectral channels, the eMAS spectral channel set includes four additional channels in the 1.6 and 2 µm spectral regions (hereafter 1.6x and 2.x µm, respectively, when referring collectively to spectral channels in each region) that can be leveraged for CER retrievals, including channels analogous to the 2.25 µm channel on VIIRS on NOAA's Suomi NPP and JPSS platforms and the 2.26 µm channel on RSP. The spectral response functions of the eMAS 1.6x and 2.x µm spectral channels (red lines), along with the spectral co-albedo for a notional liquid cloud (gray line; co-albedo defined as 1−ω0, where ω0 is the single-scattering albedo), are shown in Fig. 5. Table 1 shows the channel center wavelengths for the 1.6x and 2.x µm spectral channels, as well as the 3.7 µm channel, along with band-averaged single-scattering properties (ω0, asymmetry parameter g, and extinction efficiency Qe). The scattering properties in both Fig. 5 and Table 1 are computed for a liquid water cloud having CER = 10 µm.
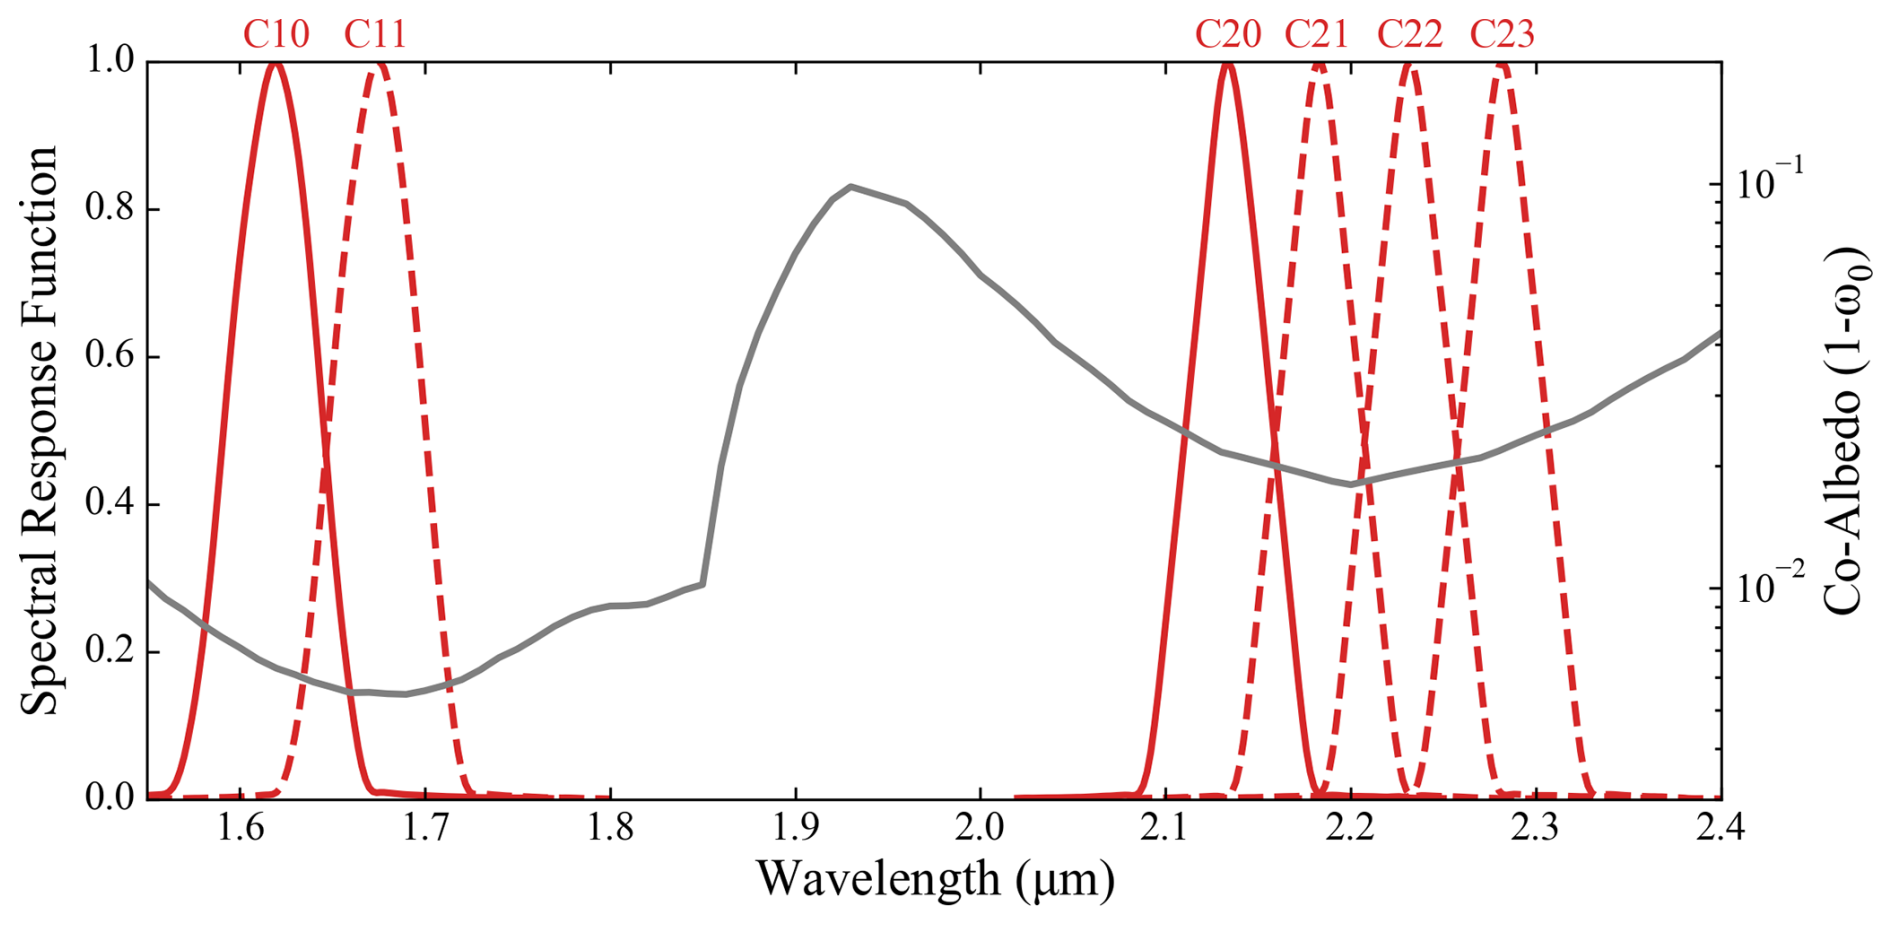
Figure 5Spectral response functions (red lines) for the eMAS SWIR channels in the 1.6x µm (channels 10, 11) and 2.x µm (channels 20–23) spectral regions. Also plotted is the co-albedo (gray line, defined as 1−ω0) for a liquid water cloud having CER = 10 µm.
Table 1Single-scattering properties for the eMAS SWIR channels in the 1.6x and 2.x µm spectral regions, along with the 3.7 µm MWIR channel. These properties are calculated for a liquid cloud with CER = 10 µm. Note that the 1.62 µm (channel 10), 2.13 µm (channel 20), and 3.7 µm (channel 26) spectral channels are the MODIS-heritage channels and are used for the standard eMAS CER retrievals.
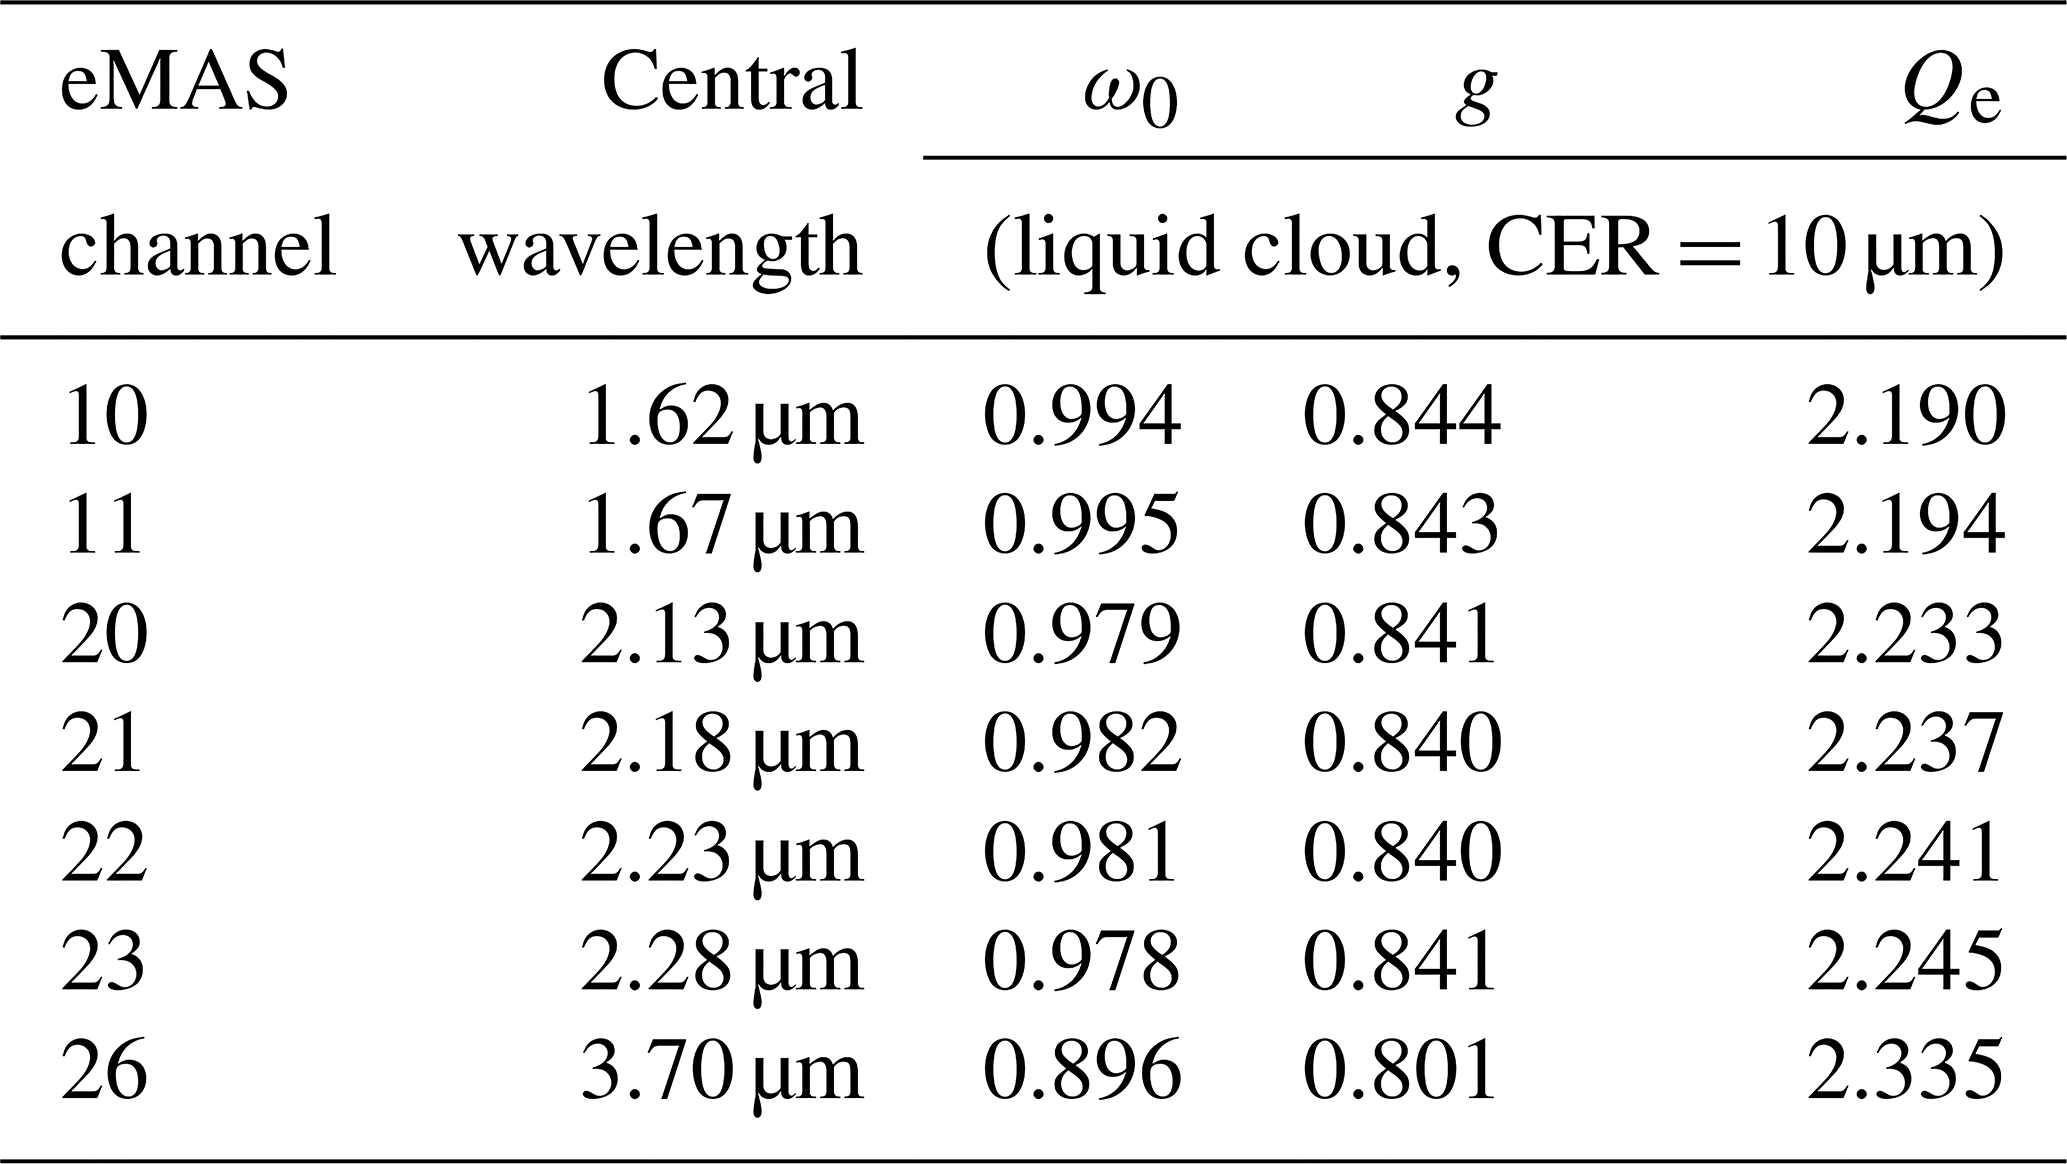
Figure 6 shows CER retrievals for the scene in Fig. 3 from the additional SWIR spectral channels along with those from the MODIS-heritage channels. It is interesting to note the deviation amongst these retrievals: not just between the 1.6x, 2.x, and 3.7 µm regions that have been noted in the past with MODIS, but also within the 2.x µm region that includes the various analogs to MODIS and VIIRS. A detailed analysis of these differences is shown in the microphysical retrieval evaluation in Sect. 4.2.
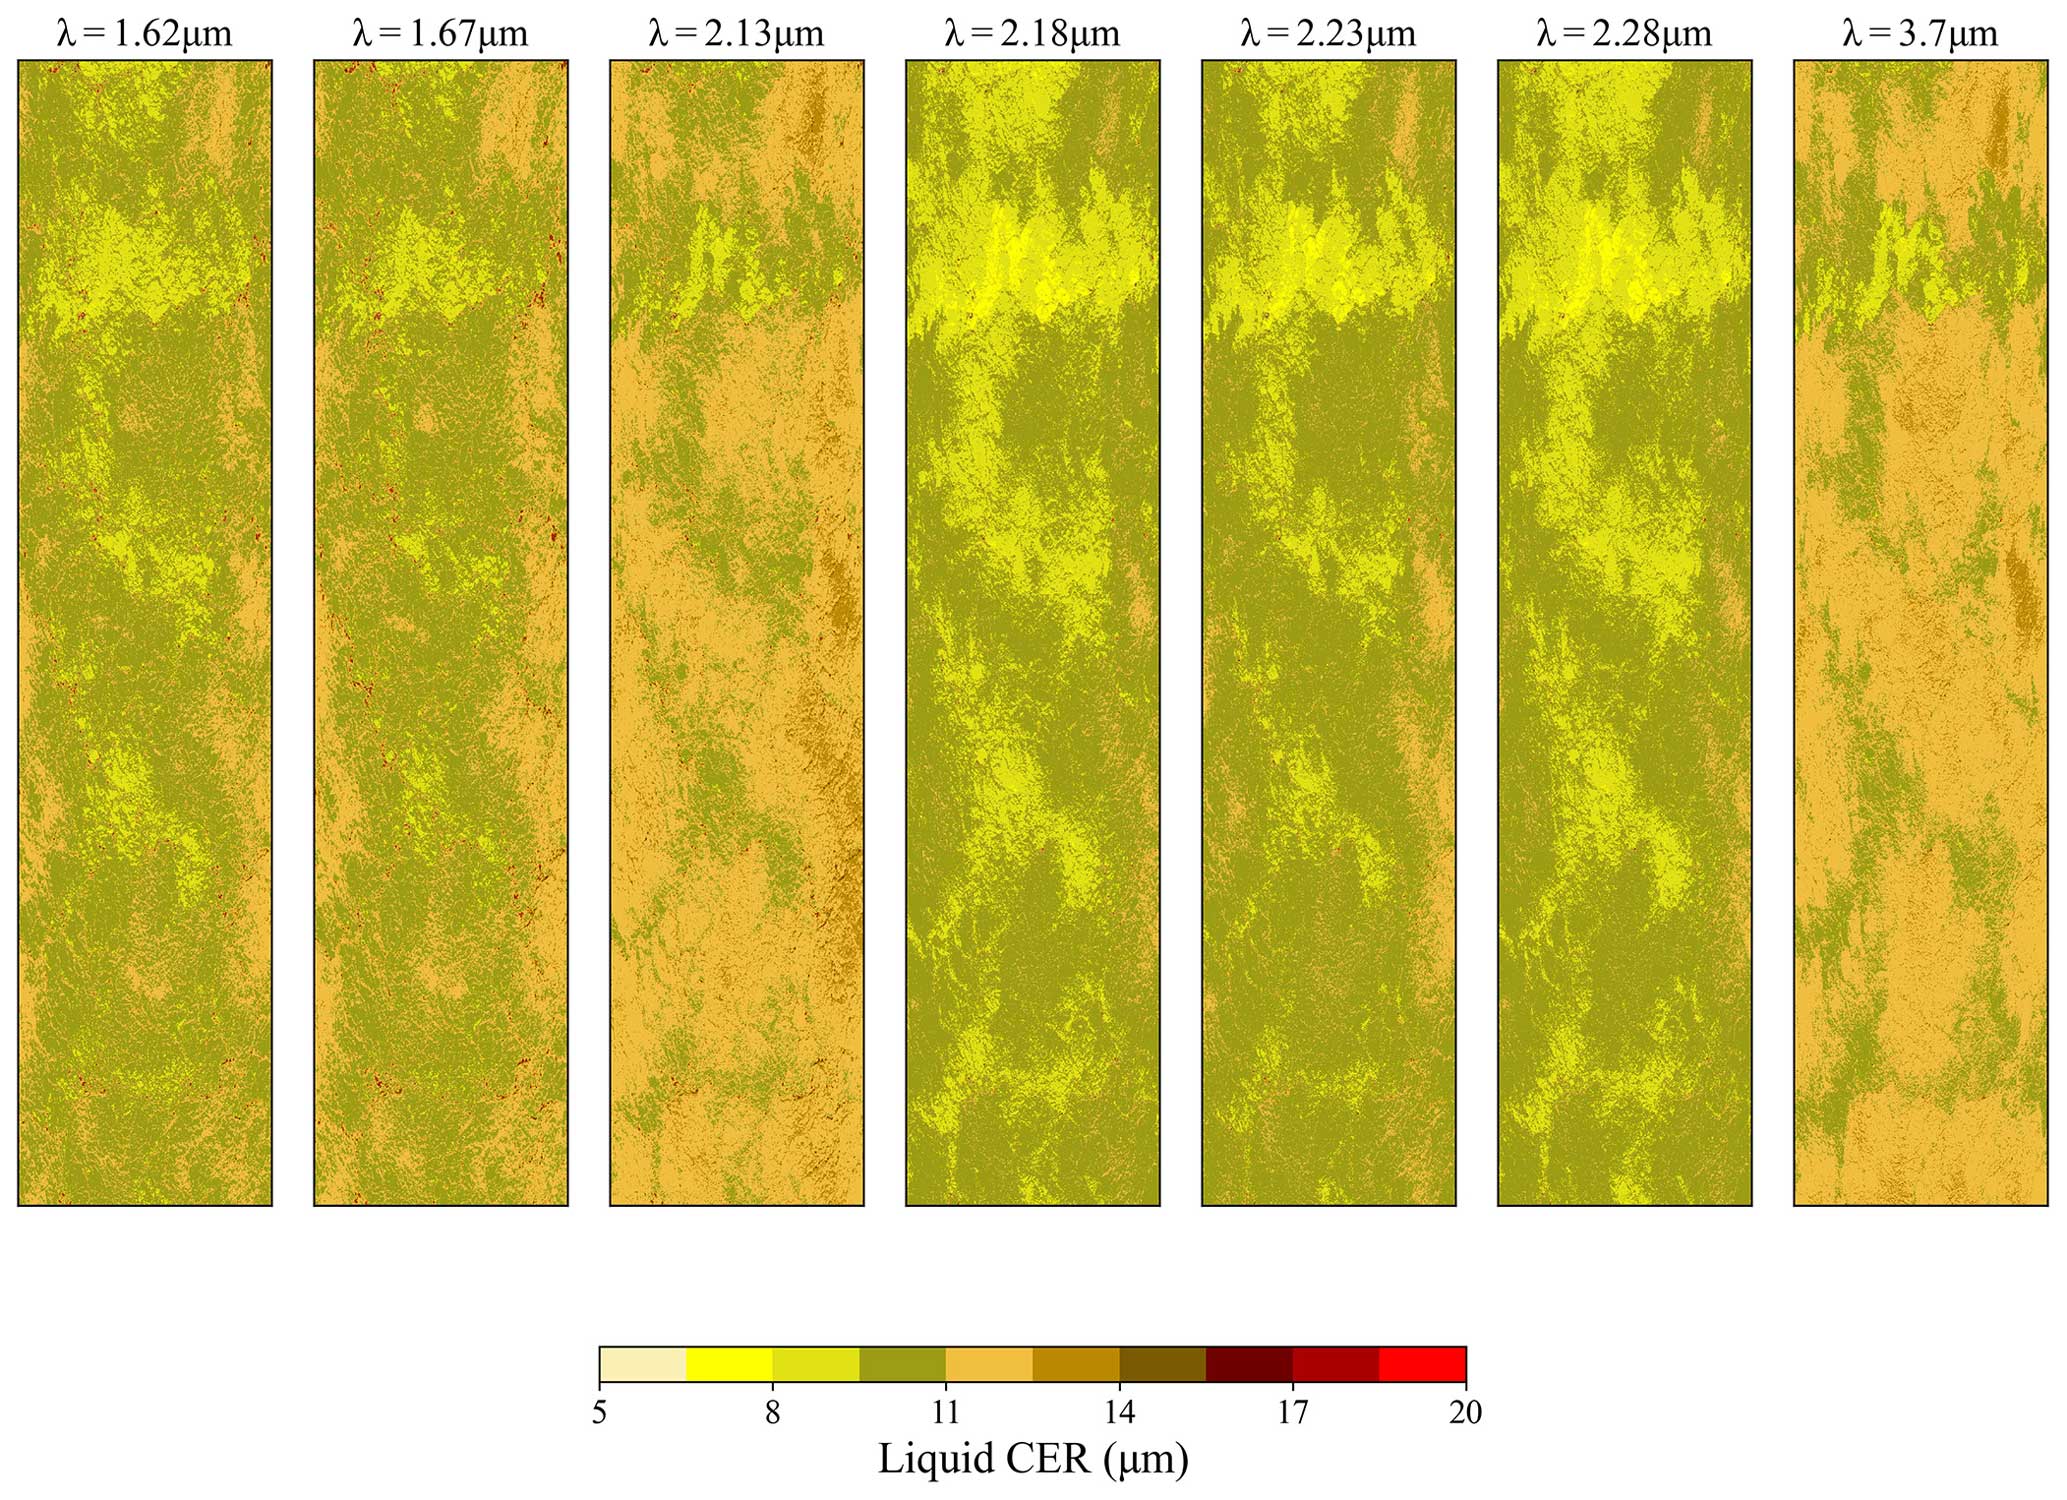
Figure 6Spectral CER retrievals from all available SWIR/MWIR eMAS channels (wavelengths from left to right: 1.62, 1.67, 2.13, 2.18, 2.23, 2.28, 3.7 µm) for the flight track in Fig. 3.
An important caveat to consider regarding the eMAS cloud optical and microphysical property datasets is the impact of the spectral absorption of the aerosol layer overlying the MBL clouds in the SE Atlantic. Previous studies have shown that MODIS COT retrievals for the MBL stratocumulus clouds in the SE Atlantic can be biased low by up to 25 % or more on a monthly mean scale due to above-cloud aerosol absorption in the 0.87 µm spectral channel (Meyer et al., 2013, 2015; Jethva et al., 2013; Alfaro-Contreras et al., 2014b). CER retrievals, on the other hand, are substantially less biased, e.g., less than 5 % on a monthly mean scale (Meyer et al., 2015), since the above-cloud aerosol spectral absorption is at a minimum in the SWIR and MWIR (Haywood et al., 2004; De Graaf et al., 2012). Nevertheless, above-cloud absorbing aerosols can have impacts on CER retrievals via non-orthogonality of the COT/CER solution space (Haywood et al., 2004), an effect that is estimated in the case studies below.
4.2 Microphysical retrieval comparisons against PDI, CAS/2D-S, and RSP
During the 2016 ORACLES deployment, coordinated flights were performed that included ER-2 overpasses while the P-3 was sampling within the cloud layer. These co-locations of in situ cloud probe observations from the P-3 with the remote sensing observations of the ER-2 provide an opportunity to evaluate eMAS spectral CER retrievals against the CER derived from droplet size distributions measured by the probes. Given the spectral channel complement of eMAS that includes both MODIS and VIIRS analogs, this evaluation can inform our understanding of the differences in the sensitivities of the MODIS 2.13 µm and VIIRS 2.25 µm SWIR channels to CER, a particular challenge for ongoing efforts towards cloud data record continuity between the two imagers (e.g., Platnick et al., 2020, 2021). We focus here on two coordinated maneuvers that occurred during the 20 September 2016 science flight.
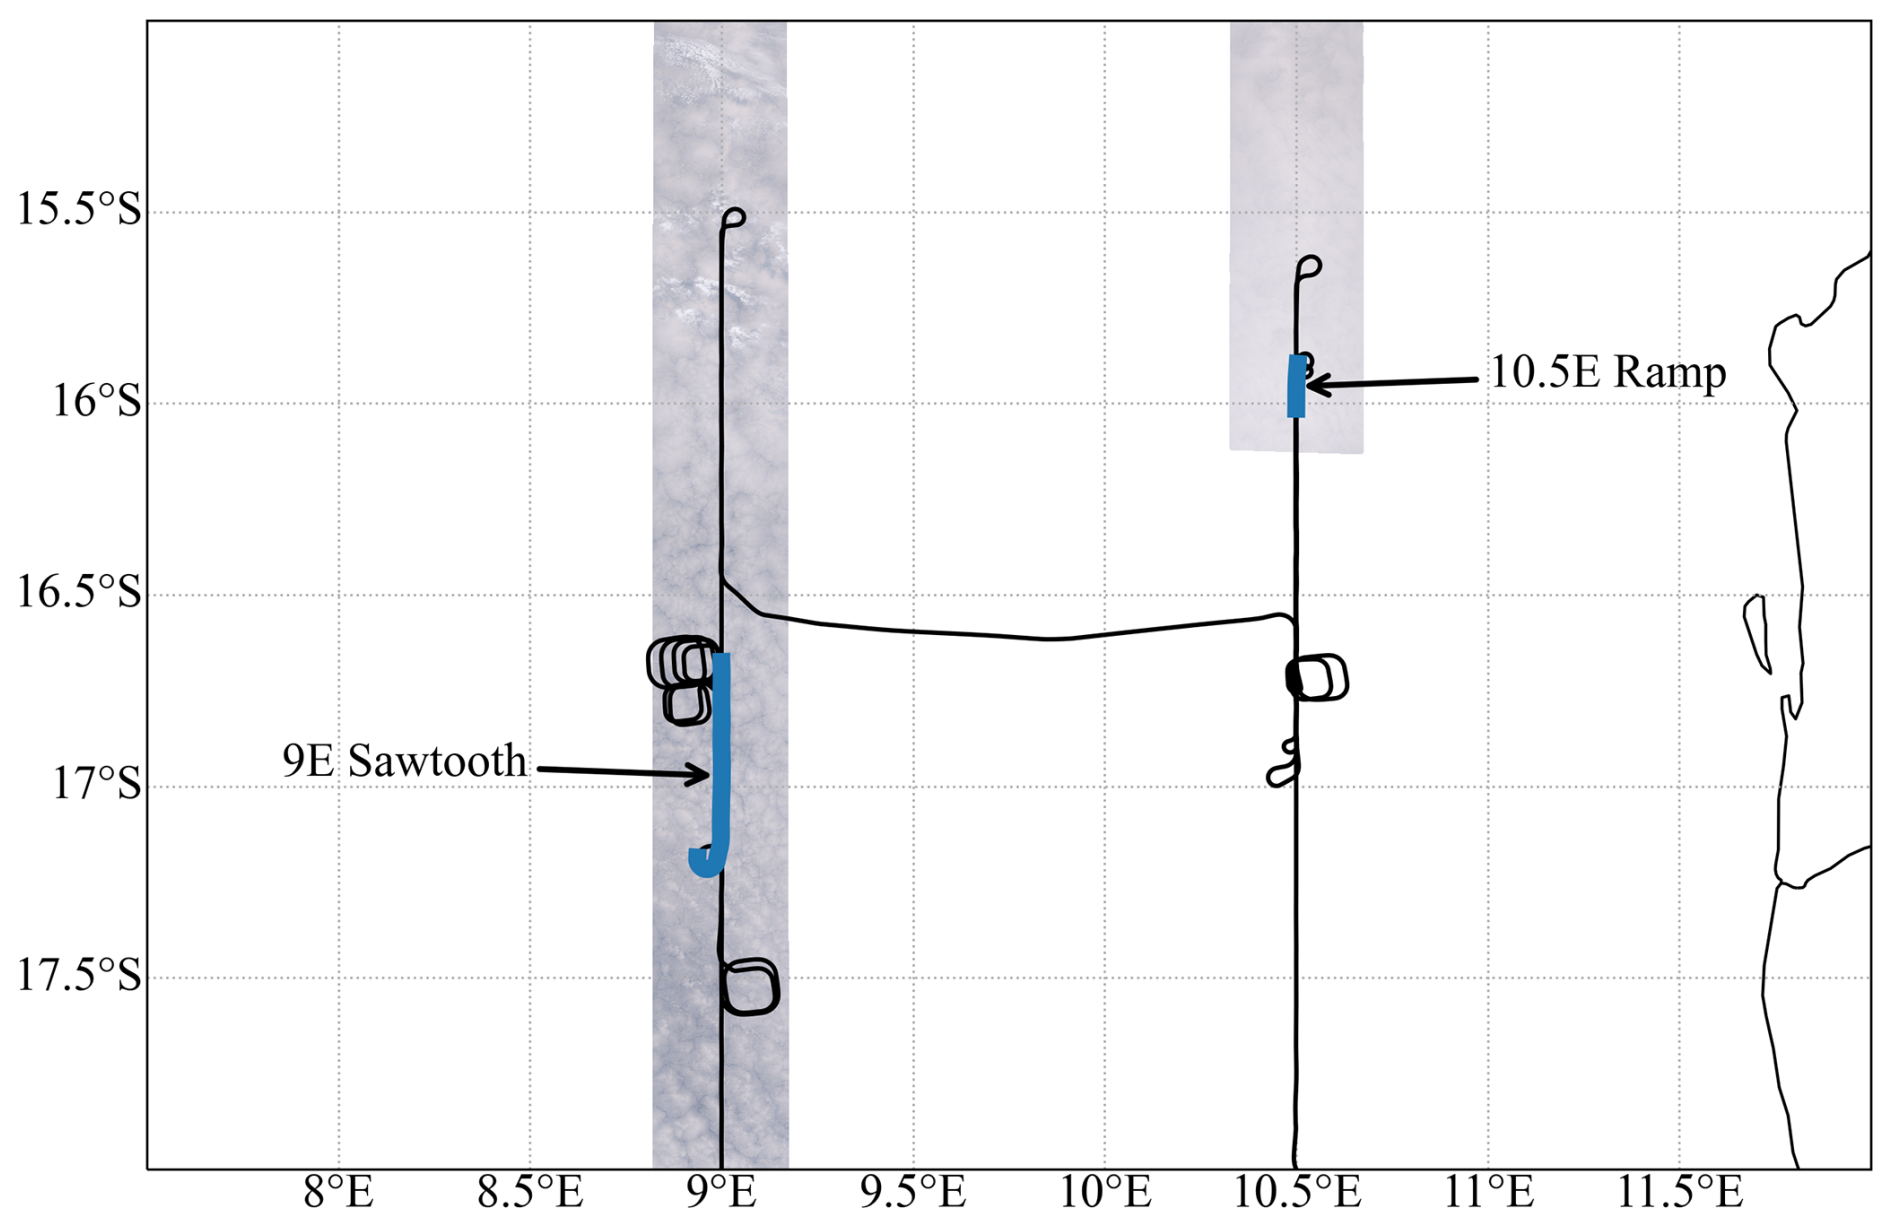
Figure 7P-3 flight track on 20 September 2016, featuring two coordinated maneuvers when an ER-2 overpass occurred while the P-3 was sampling within the cloud layer. True-color RGB imagery obtained by eMAS during ER-2 overpasses are also shown. The locations of the two temporally coordinated maneuvers are indicated by the blue portions of the P-3 flight track. Each is designated by the P-3 flight module nomenclature used during ORACLES: a Ramp occurring at 10.5° E longitude and a Sawtooth within the cloud layer at 9° E longitude.
The 20 September P-3 flight track (black lines) in the region of two coordinated maneuvers with the ER-2, along with eMAS true-color RGB imagery obtained during each coordination, is shown in Fig. 7. The specific locations where the P-3 was in the cloud layer while the ER-2 passed overhead, which serve as the case studies for this eMAS CER evaluation, are denoted by the blue segments. Each of these segments is labeled using the P-3 flight module nomenclature used during ORACLES: a “Ramp” at 10.5° E longitude (09:37–09:40 UTC) and a “Sawtooth” at 9° E longitude (11:42–11:52 UTC), each part of broader “Radiation Wall” vertical flight tracks designed to sample the full depths of the cloud and aerosol layers along with the surrounding environment. The vertical profiles of the P-3 flight tracks during these coordinated Radiation Wall activities are shown in Fig. 8, with blue segments again denoting the location of ER-2 overpass while the P-3 was sampling within the cloud (note that the ER-2 made several overpasses at each location while the P-3 performed the Radiation Wall flight tracks shown). During the 9° E Sawtooth maneuver (Fig. 8a), the P-3 sampled the full depth of the cloud layer repeatedly over a short duration, providing good statistics on the vertical profile of the droplet size distribution. The 10.5° E Ramp (Fig. 8b), on the other hand, featured a single P-3 descent through the full depth of the cloud. While the P-3 also later ascended through the cloud layer in a stair-step fashion during this 10.5° E Radiation Wall as the ER-2 again flew overhead, that portion of this coordination is excluded from the evaluation due to the uncertainties involved in piecing together a cloud vertical profile from spatially decoupled layer sampling over a long distance.
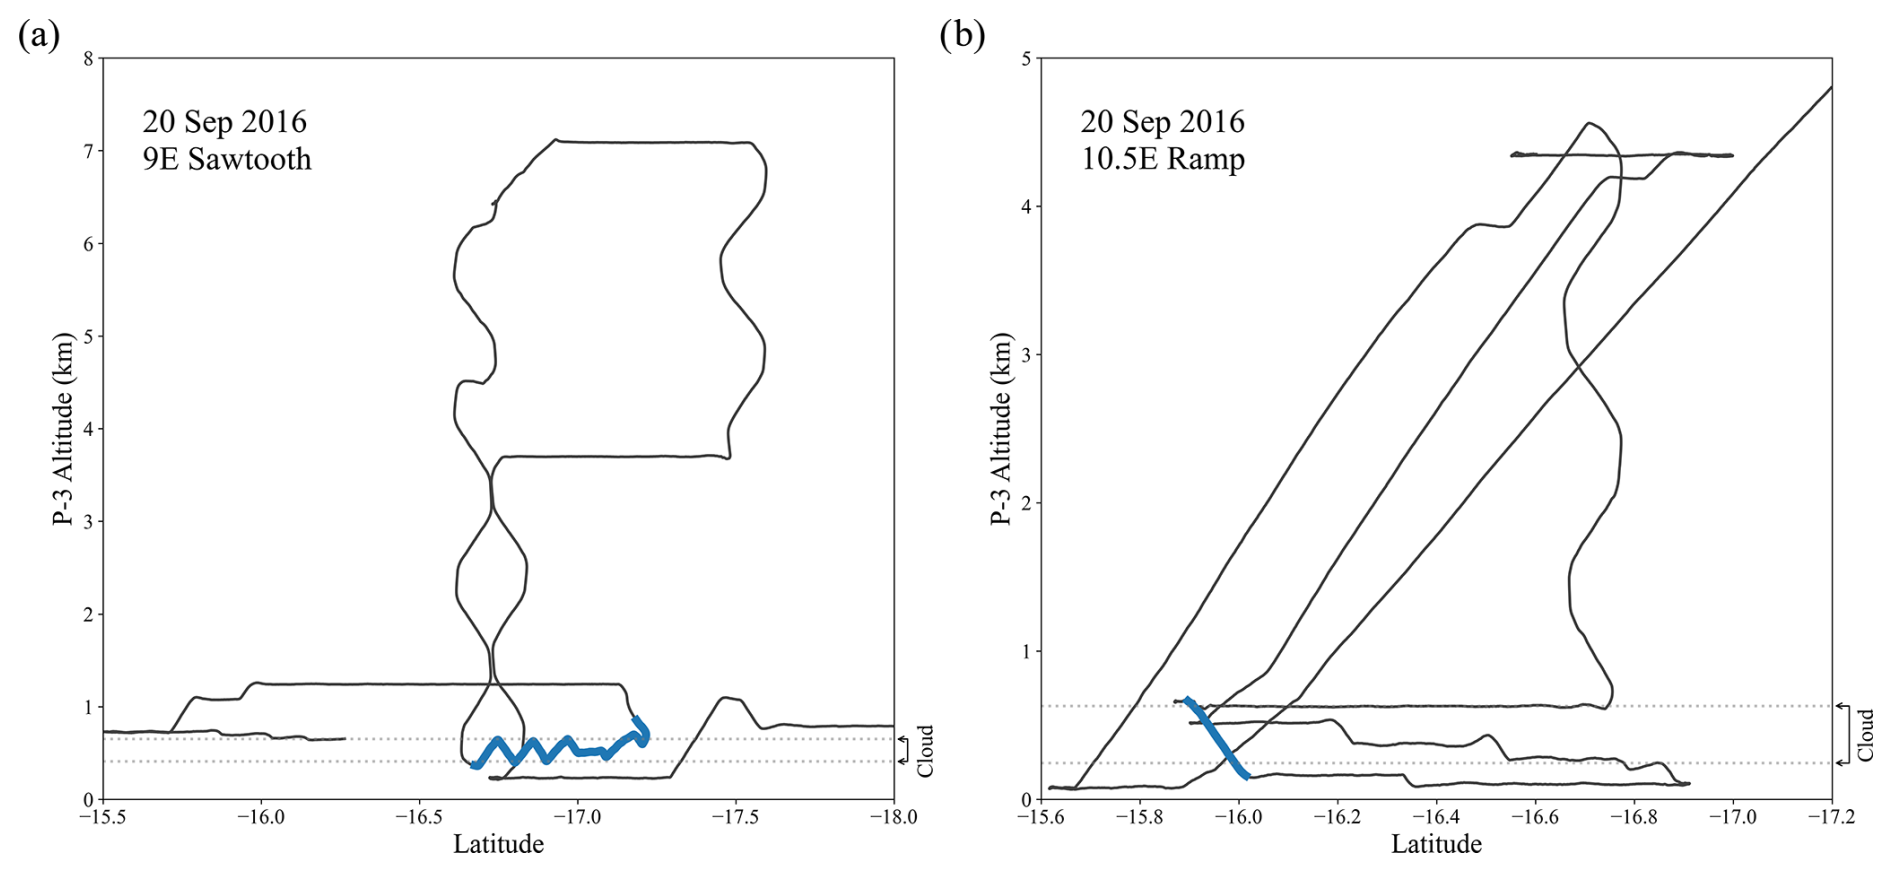
Figure 8Vertical profiles of the P-3 flight tracks during the two coordinated maneuvers with the ER-2 in Fig. 7. The blue segments denote the P-3 locations in the cloud while the ER-2 was overhead. (a) Sawtooth profile at 9° E longitude where the P-3 repeatedly vertically sampled the full depth of the cloud layer over a short duration. (b) Ramp profile at 10.5° E longitude where the P-3 descended through the cloud layer.
Figure 9 shows eMAS imagery for the 9° E Sawtooth coordination, along with outlines denoting the approximate region in which the P-3 was sampling within the cloud during this ER-2 overpass (Figs. 7 and 8a). The RGB image shown here also includes an arrow denoting direction of travel of the ER-2 and axis labels indicating the length and width of the scene. This imagery shows relatively homogeneous, moderately optically thick (mean COT = 9.4 within the blue box) closed-cell stratocumulus clouds, a cloud regime that is expected to best conform to the plane-parallel radiative transfer assumptions used in the cloud optical property retrievals of eMAS and other airborne and spaceborne imagers. Note also that the spectral CER retrievals shown appear to conform to the adiabatic cloud assumption, with CER retrievals increasing with increasing wavelength (and decreasing photon vertical penetration depth).
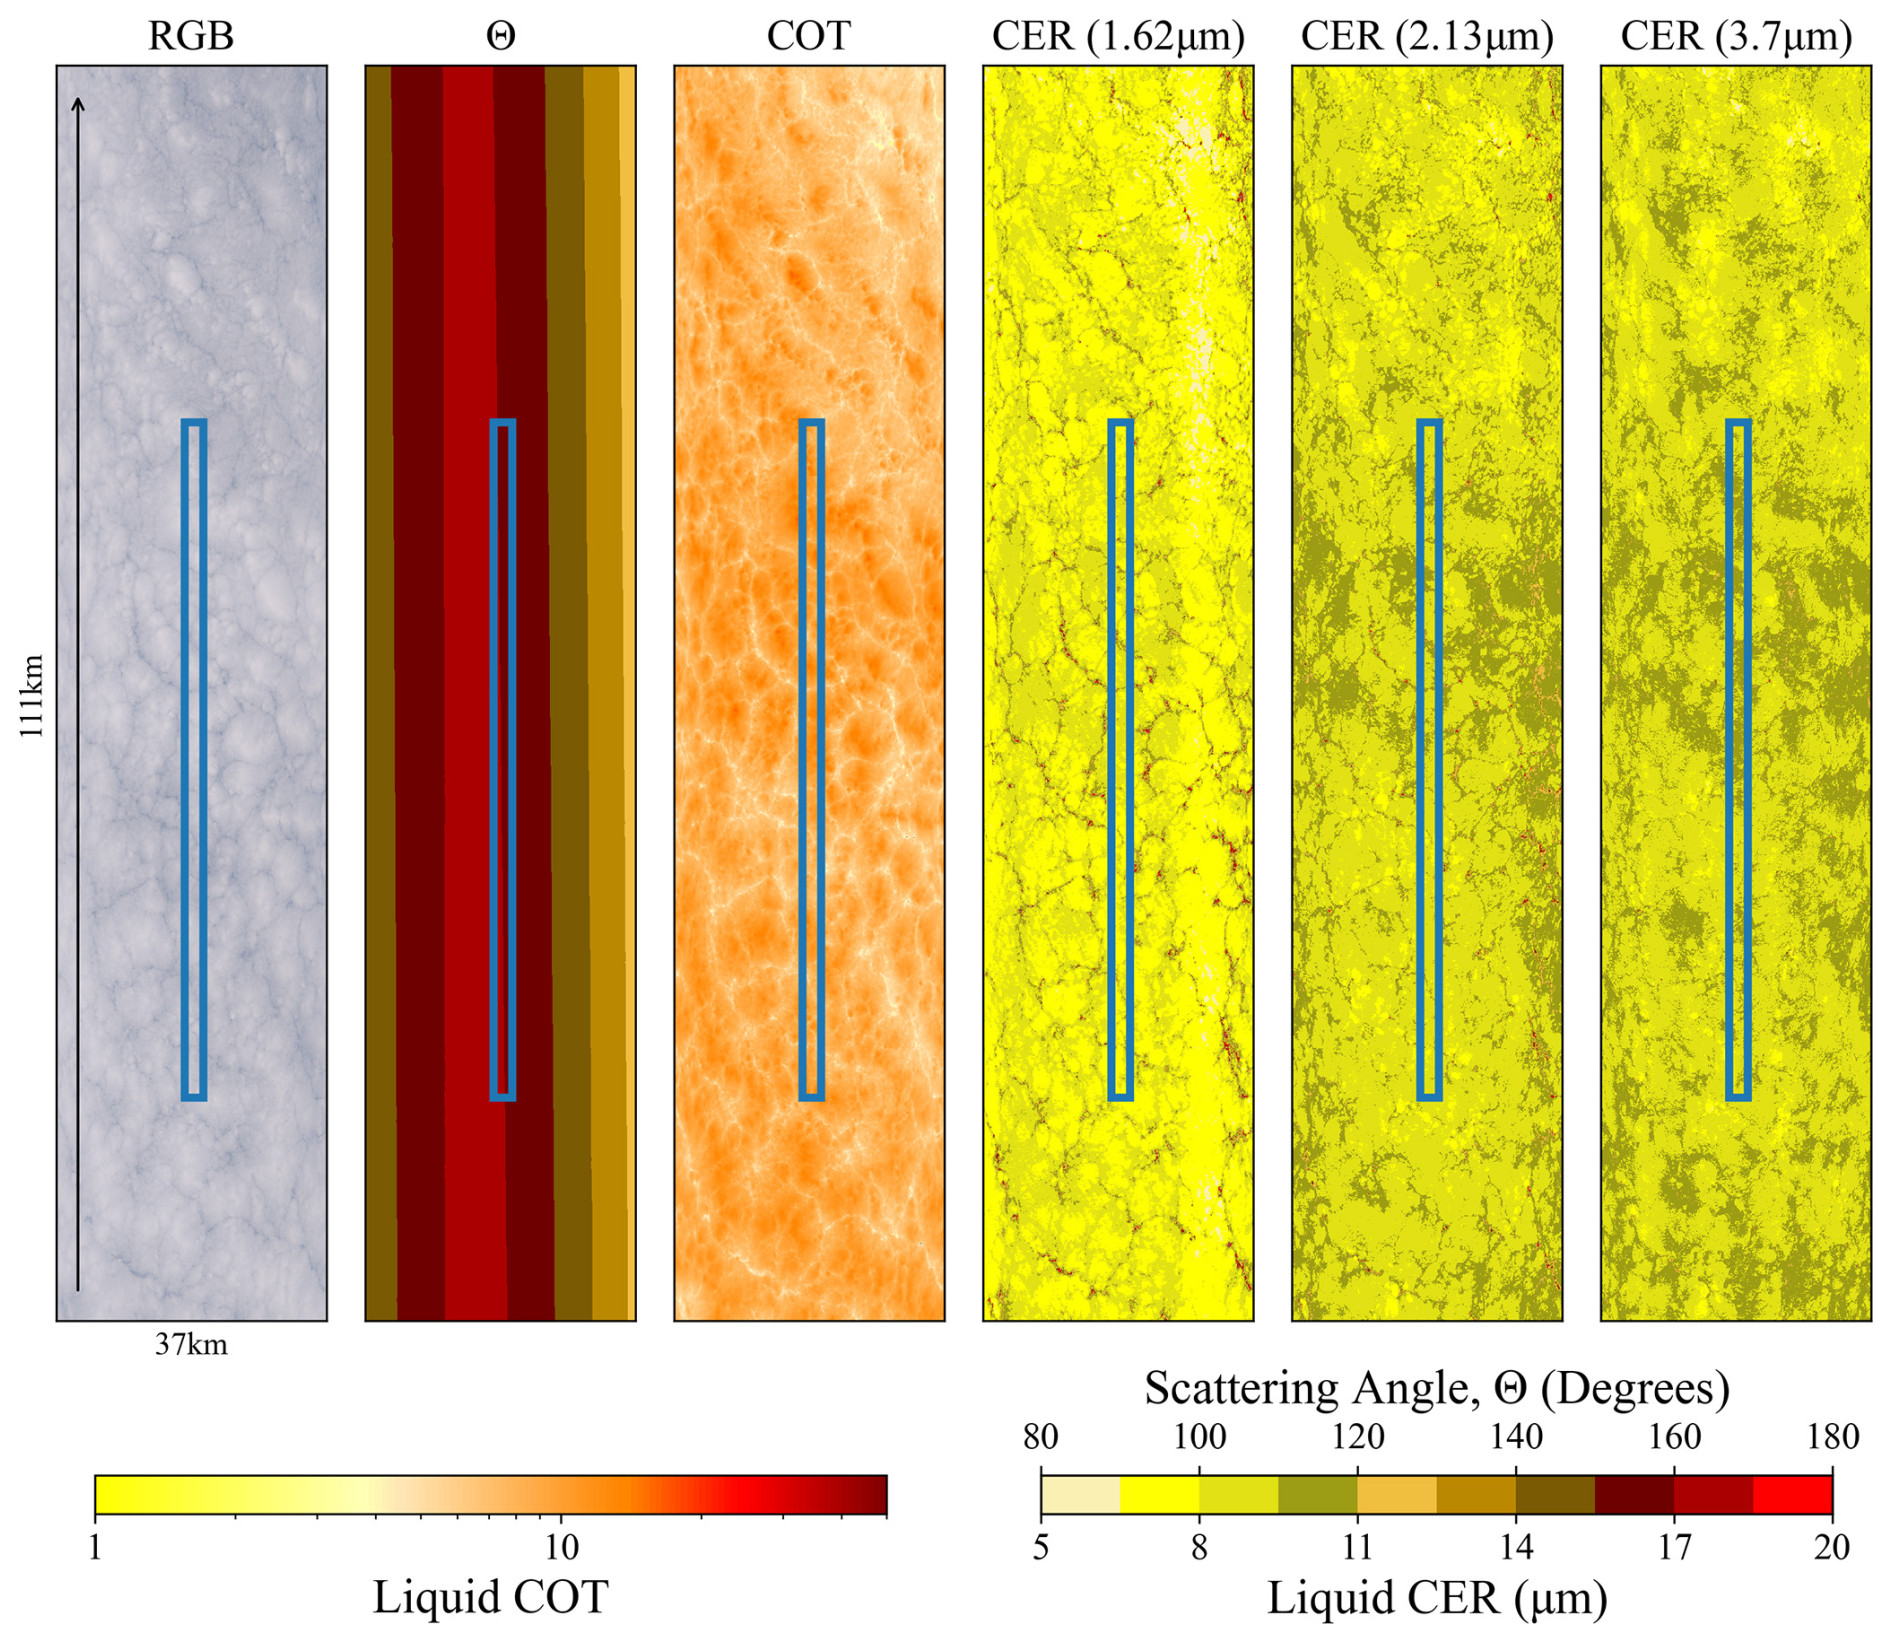
Figure 9eMAS imagery obtained during the 9° E Sawtooth coordination shown in Figs. 7 and 8a. From left to right: true-color RGB image; observed scattering angle (Θ); COT; and CER from the 1.62, 2.13, and 3.7 µm channels. The blue boxes in each panel denote the region where the P-3 was sampling within the cloud layer during the ER-2 overpass.
CER profiles derived from PDI (blue) and CAS/2D-S (gray, red) DSDs obtained during the 9° E Sawtooth are shown in Fig. 10a. The circles denote CER derived from the 1 s DSDs, while the triangles denote CER derived from the DSDs aggregated to fixed 10 m vertical layers. For CAS/2D-S, two profiles of CER are shown: one derived from the original DSDs (gray, denoted CAS for simplicity) and one derived from the DSDs having the CAS size bins shifted using the King LWC constraint (red, denoted CASshifted). While there appears to be good correlation between CER from CAS/CASshifted and PDI, the CASshifted CER remains almost 2 µm smaller than PDI at cloud top, though these CER differences gradually decrease to near-zero at cloud base. Interestingly, the roughly 2 µm difference between PDI and CASshifted at cloud top is within the range of MODIS CER retrieval biases found in previous comparisons against CAS and other legacy cloud probes (see Witte et al., 2018, and references therein).
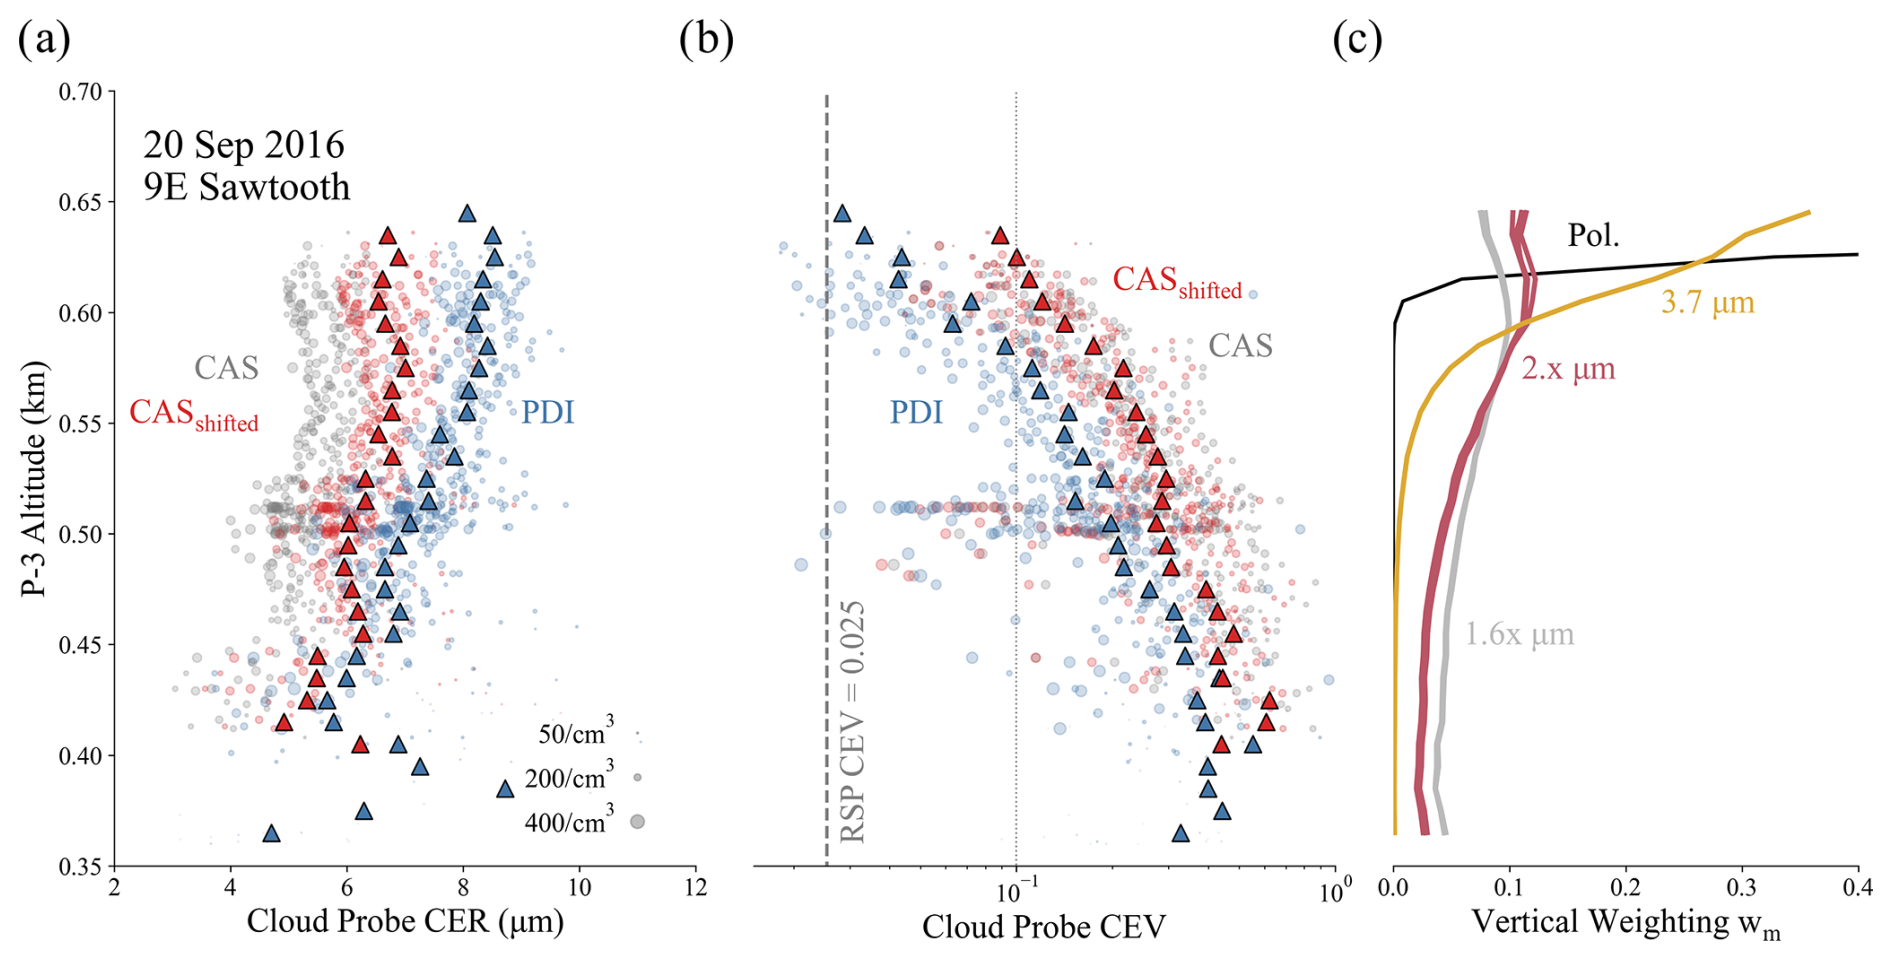
Figure 10P-3 cloud probe data obtained during the 9° E Sawtooth coordination (blue segment in Fig. 8a and corresponding blue box in Fig. 9), where PDI is plotted in blue, CAS/2D-S is plotted in gray, and CAS/2D-S with CAS shifted to correct for liquid water content biases is plotted in red. (a) CER profiles derived from the reported 1 s probe DSD observations (circles) and from DSD observations aggregated to 10 m vertical layers (triangles). (b) Profiles of probe DSD effective variance, CEV, for the 1 s observations (circles) and 10 m vertical layer aggregations (triangles). Also shown is the mean CEV retrieved from co-located RSP polarimetric observations (vertical dashed line) along with a vertical dotted line denoting the CEV assumed for the eMAS and RSP bi-spectral retrievals (CEV = 0.1). (c) Vertical weighting functions for the eMAS 1.6x µm (gray), 2.x µm (red), and 3.7 µm (yellow) channels, along with the single-scattering weighting function approximating polarization sensitivity (black), derived from forward radiative transfer calculations using the 10 m binned PDI DSD observations.
Profiles of CEV computed from the PDI and CAS/2D-S (again denoted CAS and CASshifted for simplicity) DSDs using Eq. (7) are shown in Fig. 10b. Also shown in this plot is the mean CEV from co-located RSP polarimetric cloud-bow retrievals (vertical dashed line at CEV = 0.025) and the CEV assumed in the eMAS (and MODIS heritage) cloud optical property retrievals (vertical dotted line at CEV = 0.1). Both PDI and CASshifted indicate a strong vertical CEV gradient, with CEV decreasing rapidly with increasing altitude. The two probes strongly disagree on CEV at the top of the cloud, however, with CASshifted indicating CEV at cloud top roughly consistent with the heritage bi-spectral retrieval assumption and with PDI indicating CEV roughly a factor of 4 smaller than CASshifted and more consistent with the RSP polarimetric retrieval. This difference is notable given the sensitivity of bi-spectral CER retrievals to assumptions about CEV, and its implications are explored below.
Figure 10c shows vertical weighting functions for the eMAS 1.6x (gray lines), 2.x (red lines), and 3.7 µm (yellow line) spectral channels, along with the RSP polarimetric weighting function (black line) approximated from a single-scattering assumption (Miller et al., 2016), computed from the PDI 10 m DSDs used to compute the layer CER (triangles) in Fig. 10a and forward RT calculations following Eqs. (2)–(5). Consistent with Platnick (2000), the 1.6x µm channels have sensitivities deepest into the cloud with respect to cloud top, followed by the 2.x µm channels and finally the 3.7 µm channel that is only sensitive to the uppermost portions of the cloud.
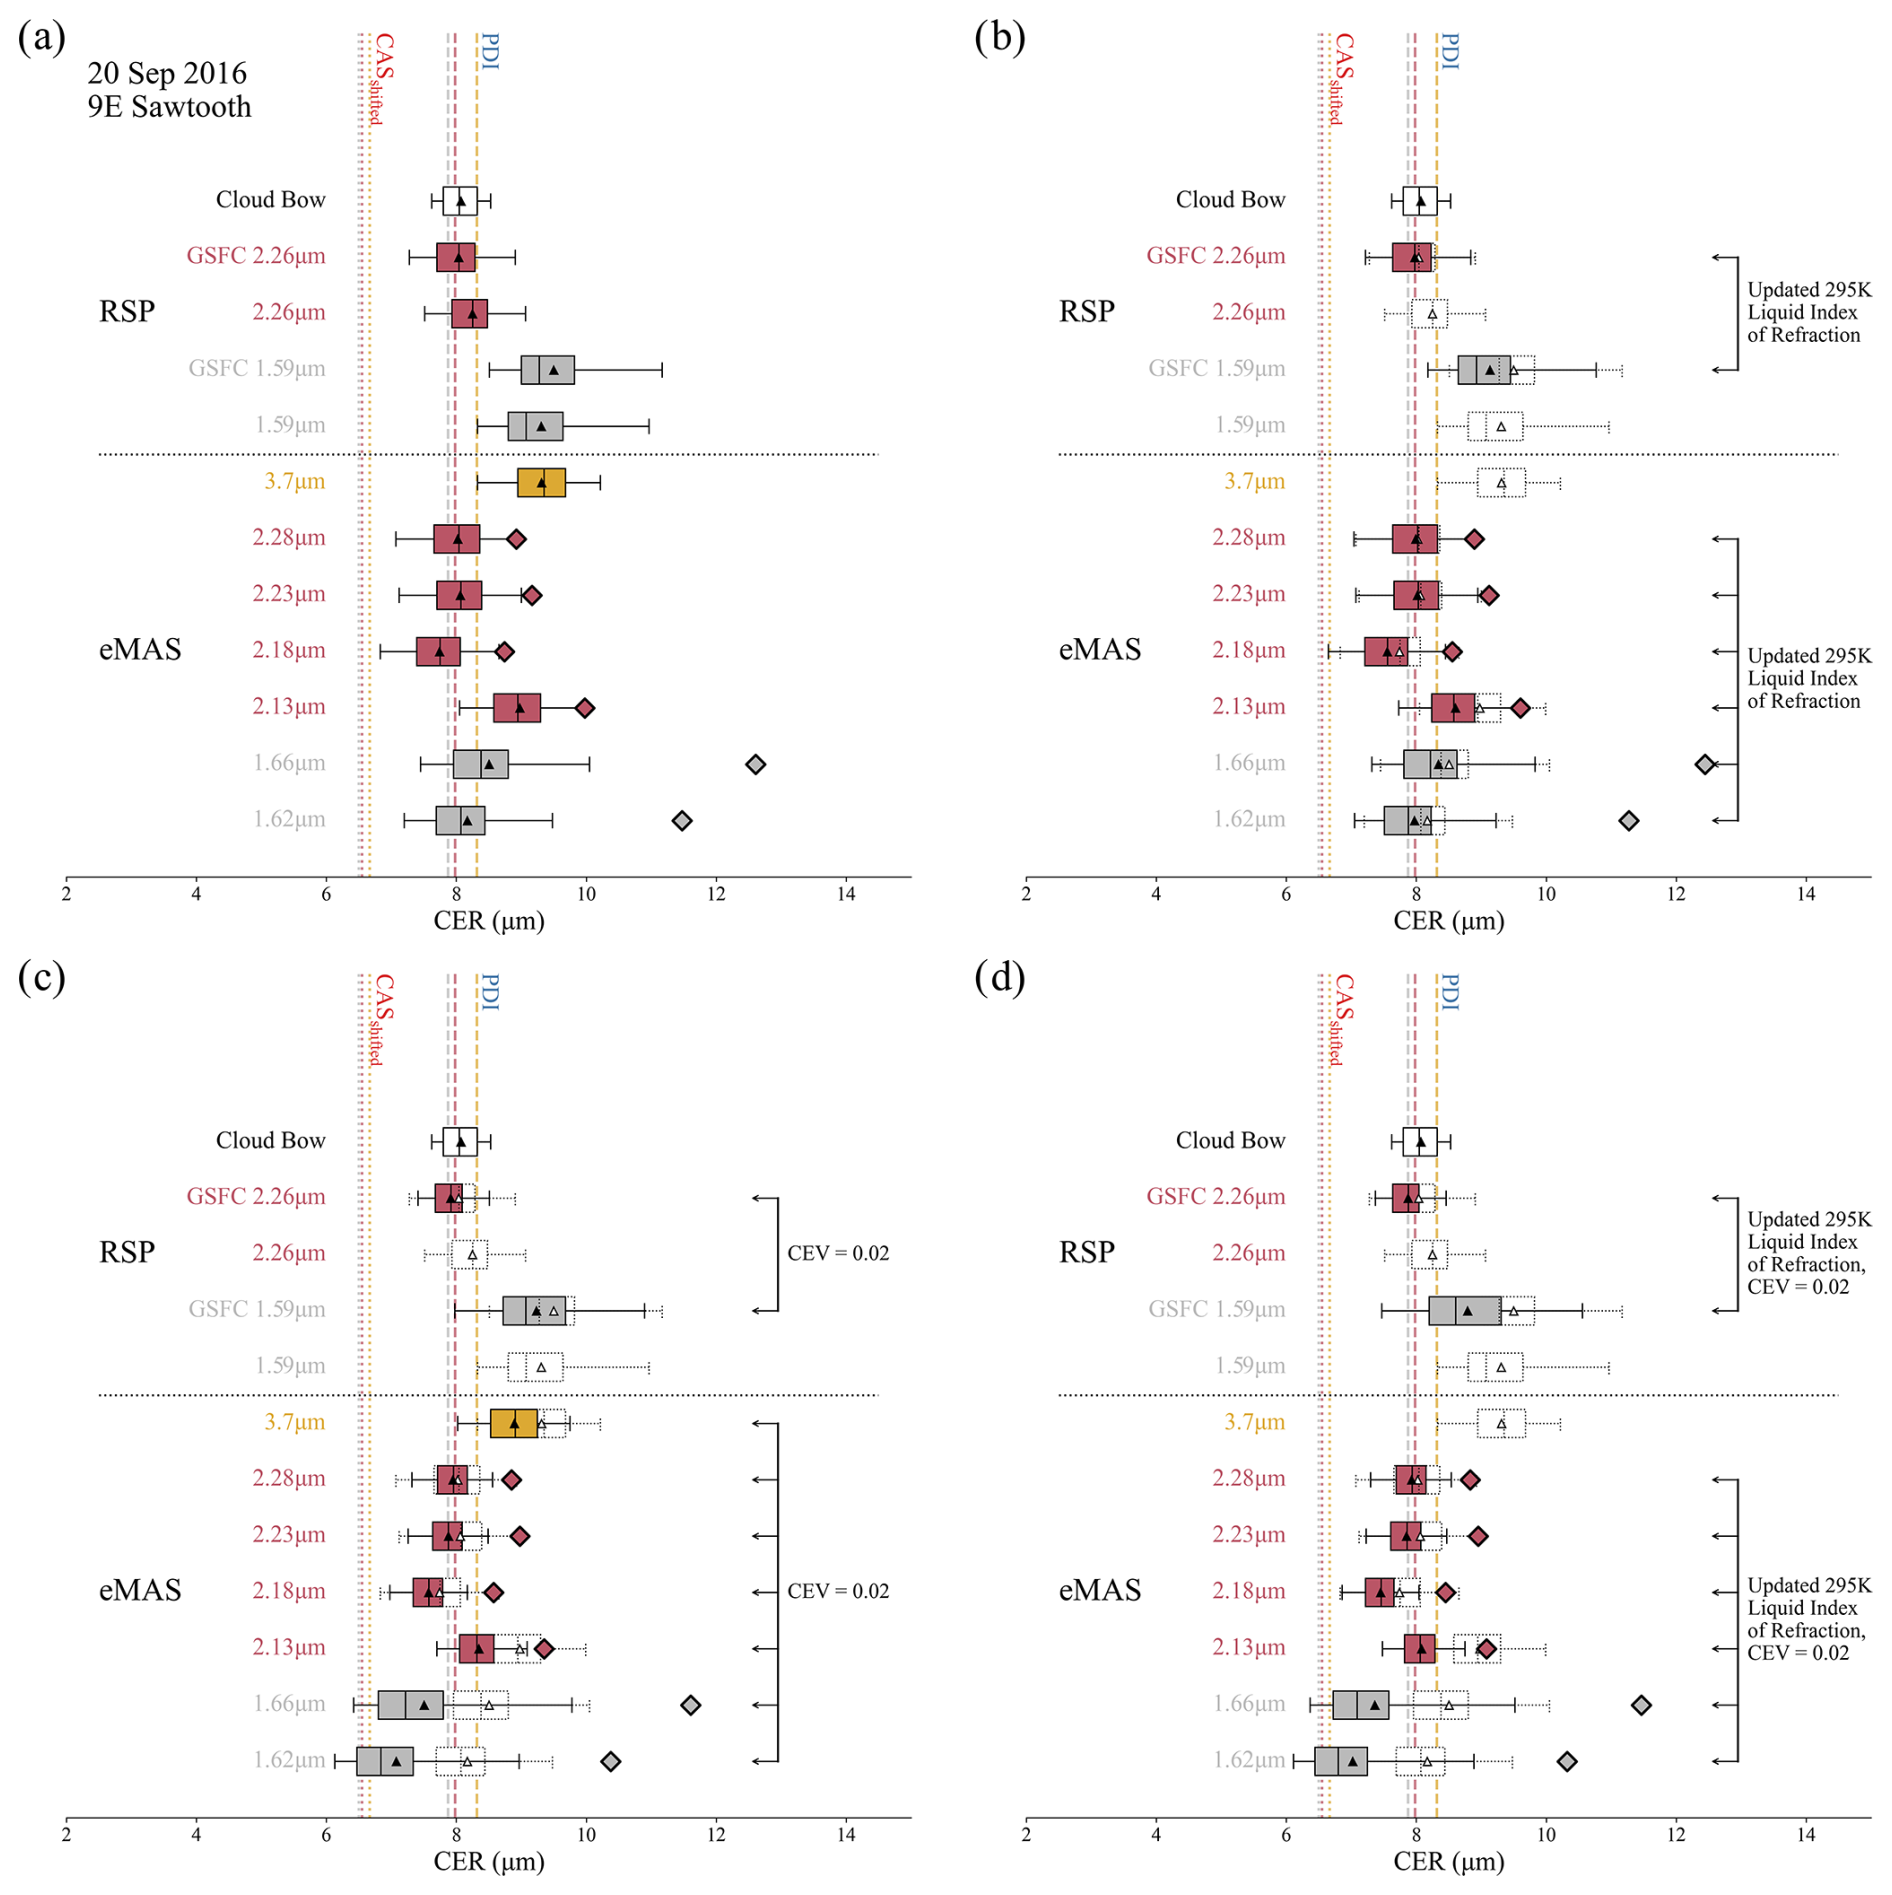
Figure 11eMAS spectral CER retrieval statistics for the 9° E Sawtooth coordination (blue box, Fig. 9) for the 1.6x (gray), 2.x (red), and 3.7 µm (yellow) channels. Also shown are statistics of RSP multi-angle polarimetric cloud-bow retrievals (clear) and nadir spectral CER retrievals from both the GISS and GSFC algorithms (same colors as eMAS spectral regions). The dashed vertical lines in each panel denote the expected CER retrievals from each spectral region derived from the PDI and CAS/2D-S 10 m CER profiles and vertical weighting functions (Fig. 10). The four panels show retrieval statistics under different retrieval assumptions for eMAS and the GSFC RSP retrievals only: (a) MODIS-heritage assumptions about CEV = 0.1 and liquid water complex index of refraction; (b) MODIS-heritage CEV assumption coupled with an updated liquid water complex imaginary refractive index measured at 295 K; (c) MODIS-heritage refractive index assumption coupled with an updated assumption on CEV = 0.02, the latter roughly consistent with the co-located RSP CEV retrieval (Fig. 10); (d) updated assumptions about both the refractive index (295 K) and CEV (0.02). The diamonds denote estimates of mean CER for the eMAS 1.6x and 2.x channels that account for the impacts of VIS/NIR above-cloud aerosol absorption via LUT non-orthogonality; above-cloud aerosol loading, in this case an above-cloud aerosol optical depth (ACAOD) of roughly 0.6, is estimated from co-located HSRL-2. In panels (b)–(d), the dotted box/whiskers denote the MODIS-heritage retrieval statistics shown in panel (a), highlighting the impact of the changes to each retrieval assumption. Note that the updated refractive index assumption is not available for the eMAS 3.7 µm channel; thus, those spectral channel retrieval statistics in (b) and (d) include only the heritage retrievals; neither the refractive index nor CEV assumption updates are available for the GISS RSP retrievals.
Figure 11 shows statistics of CER retrievals from eMAS and RSP (polarimetric and nadir-only bi-spectral) for the region within the blue-outlined box in Fig. 9 that corresponds to the 9° E Sawtooth coordination. The statistics are shown as box-and-whisker plots for each retrieval (spectral channel or approach used labeled on the left), with box face colors corresponding to spectral regions consistent with Fig. 10c, i.e., gray for the 1.6x µm channels, red for the 2.x µm channels, and yellow for the 3.7 µm channel, along with white for the polarimetric cloud-bow retrievals. Both the mean (triangle) and median (vertical line within the box) for each retrieval are shown. The width of each box extends from the first to the third quartile, and the whiskers extend to the farthest data point within 1.5 times the interquartile range from the box. For clean visual analysis, outliers exceeding this whisker range are omitted. For the nadir-only bi-spectral RSP retrievals, statistics are shown from both the GISS and GSFC cloud retrieval algorithms, the latter statistics indicated by the inclusion of GSFC in the labels on the left. Also shown, as the vertical lines spanning the extent of each panel, are estimates of expected eMAS spectral CER retrievals computed from the cloud probe 10 m CER profiles and vertical weighting functions (Fig. 10) using Eq. (6), with the dashed and dotted lines being derived from PDI and CASshifted, respectively, and color indicating the spectral region consistent with the box-and-whisker plots. Note that for both probes, only the expected CER specific to the 1.62, 2.13, and 3.7 µm channels are shown in the figure since the expected CER from the other 1.6x and 2.x µm channels are consistent within each spectral region, as shown in Table 2. Both the CASshifted and PDI expected CER exhibit the well-known adiabatic signature, with CER(3.7 µm) > CER(2.x µm) > CER(1.6x µm), though for PDI all are within 0.6 µm of each other and for CASshifted there is even less spread. Moreover, the CASshifted CER values are 1.4 to 1.6 µm smaller than the expected CER derived from PDI, a result that is roughly consistent with the CER profiles shown in Fig. 10a.
Table 2The expected CER, weighted CEV, and weighted optical depth within the cloud (τ) for the eMAS SWIR and MWIR channels, along with the single-scattering weighting approximating polarization (Pol.) sensitivity, for the 20 September 2016, 9° E Sawtooth case study, computed from the PDI and CASshifted probe data.
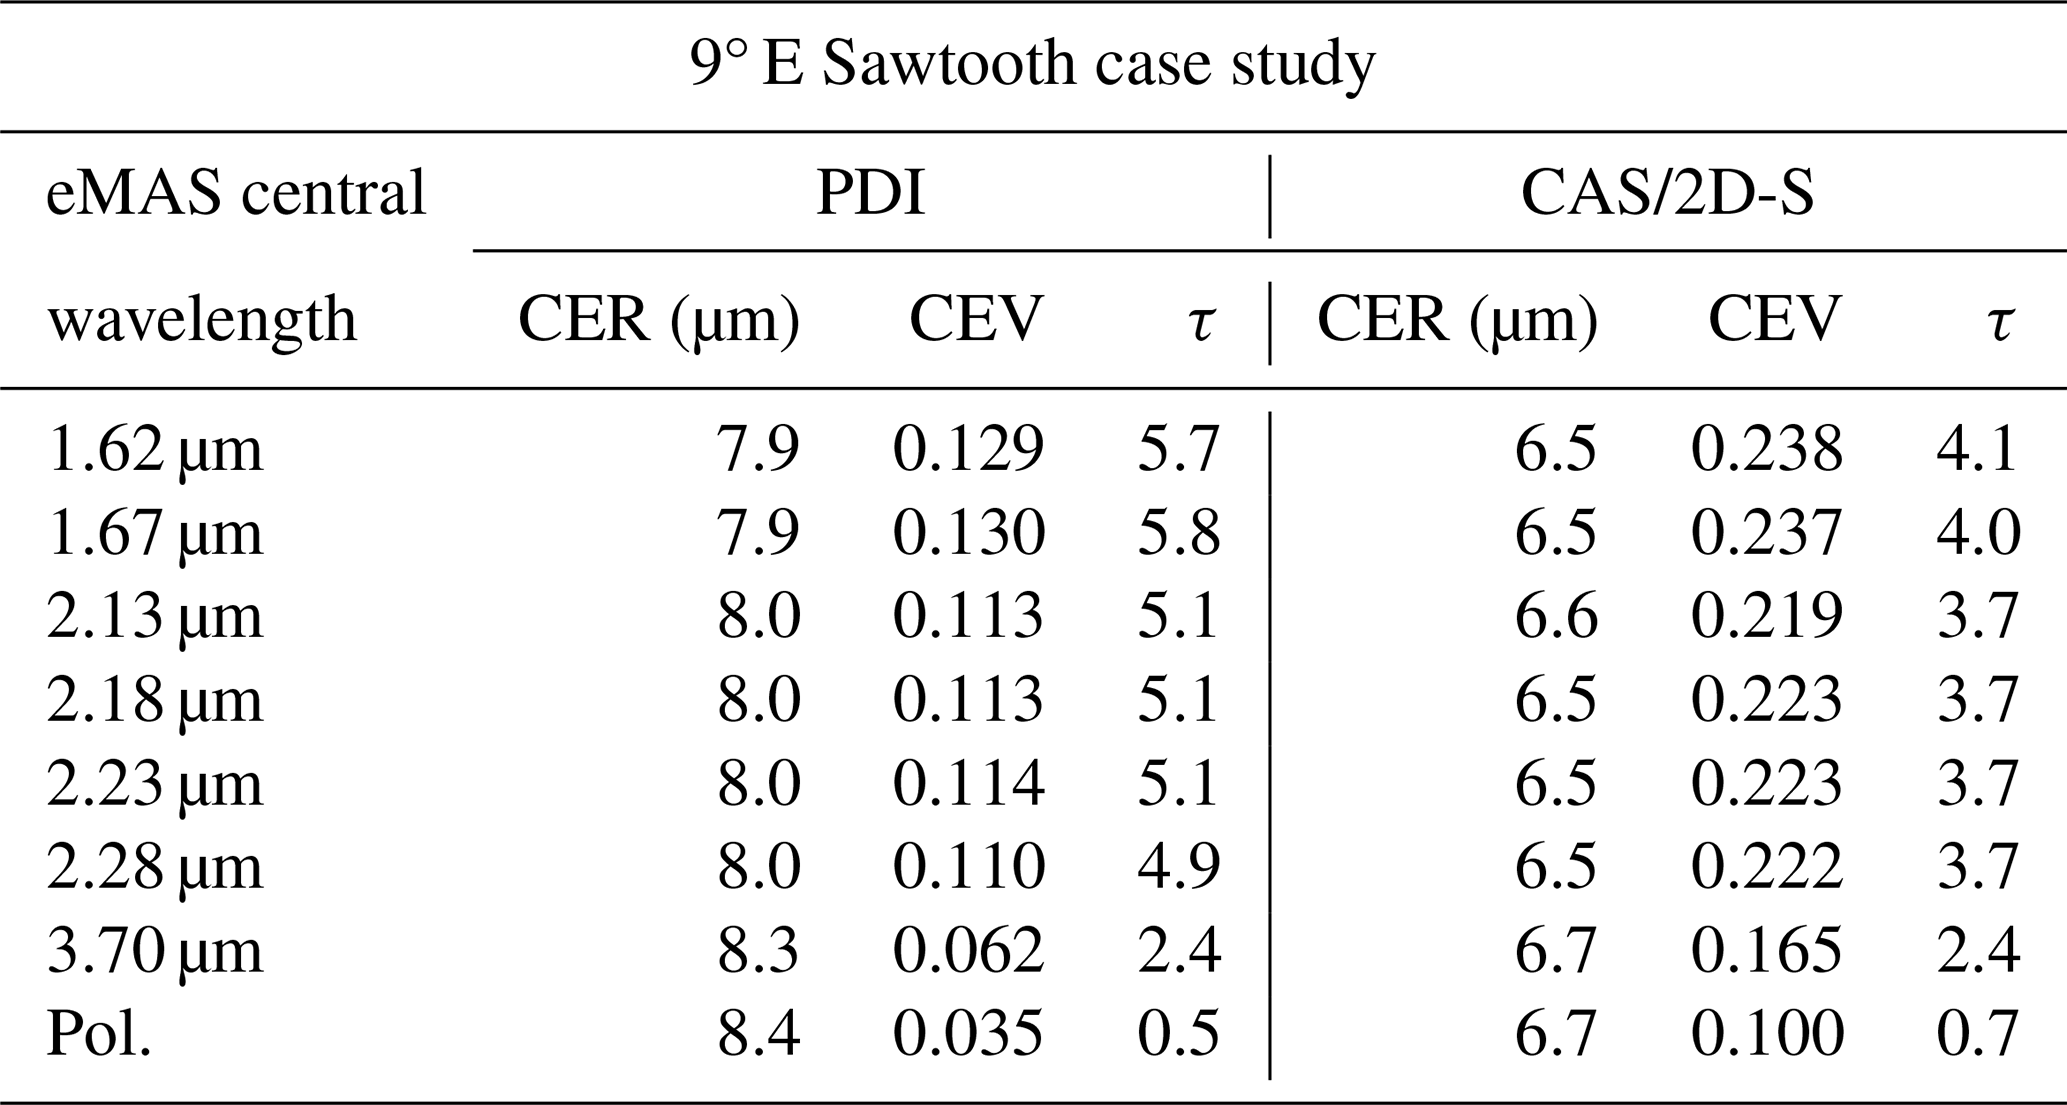
Figure 11a shows the CER statistics using heritage cloud forward radiative model assumptions in the bi-spectral retrieval LUTs. For eMAS and the GSFC RSP retrievals, those LUT assumptions are consistent with the assumptions made for the MODIS MOD06 cloud optical property retrievals, namely, single-scattering properties computed from Mie calculations assuming a homogeneous cloud having DSD CEV = 0.1 and wavelength-dependent complex indices of refraction for liquid water obtained from Hale and Querry (1973) for wavelengths λ < 1.0 µm, Palmer and Williams (1974) for 1.0 µm < λ < 2.6 µm, and Downing and Williams (1975) for λ > 3.5 µm. Note that the same radiative model assumptions are made for the GISS RSP bi-spectral retrievals, though the liquid water complex indices of refraction are derived from a compilation by Segelstein (1981) that nevertheless is consistent with the refractive index datasets used in MOD06. It is interesting to note that, for this relatively homogeneous cloud case, the CER retrievals, both bi-spectral and polarimetric, are in good agreement with each other and with the PDI expected CER, with the exception of the eMAS 2.13 and 3.7 µm channels and the RSP 1.59 µm channel retrievals that are larger by 1 µm or more.
A caveat to the CER retrieval statistics shown here is the presence of the absorbing biomass burning aerosol layer above the clouds that is not accounted for in the bi-spectral retrievals. While the aerosol absorption is negligible in the SWIR, Haywood et al. (2004) showed that its absorption in the VIS/NIR nevertheless can induce apparent CER retrieval biases due to the non-orthogonality of portions of the bi-spectral COT/CER solution space. These non-orthogonality effects are more pervasive for bi-spectral retrievals using the 1.6x µm channels, for which cloud droplets are less absorbing than either the 2.x µm or the 3.7 µm channels, and are negligible throughout much of the solution space for retrievals using the 3.7 µm channel (see Haywood et al., 2004; Fig. 3).
For the coordination box in Fig. 9, co-located lidar curtains from the High Spectral Resolution Lidar (HSRL-2) (Hair et al., 2008), also flown on the ER-2, indicate an aerosol layer overlying the clouds having an aerosol optical depth (AOD) of roughly 0.6. The estimated effect of this overlying aerosol layer on the COT/CER solution space for this coordination is shown in Fig. 12 for the bi-spectral retrievals using the eMAS 1.62 µm (a) and 2.13 µm (b) channels. Here, the black lines denote RT calculations for a liquid cloud only, and the red dotted lines denote RT calculations for the same liquid cloud but with an overlying absorbing aerosol layer of AOD = 0.6. Note that in these calculations the aerosol absorption is only accounted for in the NIR channel; that is, it is considered to be negligible and thus ignored in the SWIR channels. The aerosol scattering properties used in these RT calculations are derived from observations by the Spectrometers for Sky-Scanning Sun-Tracking Atmospheric Research (4STAR) (Dunagan et al., 2013; Shinozuka et al., 2013) obtained during the entirety of ORACLES 2016 (Pistone et al., 2019). The red diamonds denote the mean eMAS reflectance observations for the spectral channels shown. It is apparent that, while the aerosol absorption is accounted for only in the NIR, the CER retrievals nevertheless change when the NIR reflectance decreases due to the above-cloud aerosol attenuation, a non-orthogonality effect that is stronger in the retrievals using the 1.62 µm channel (a) than in those using the 2.13 µm channel (b). More specifically, when accounting for the above-cloud aerosol layer, the CER retrievals for this case increase by roughly 3.3 and 4.1 µm, respectively, for the 1.62 and 1.66 µm channels and by roughly 1.0 µm for all 2.x µm channels. These CER increases for the 1.6x µm retrievals in particular are quite large and highlight the highly non-orthogonal 1.6x µm solution spaces, though this non-orthogonality also makes the 1.6x µm retrievals more susceptible to retrieval errors deriving from forward model (e.g., the assumed aerosol and cloud single-scattering properties) and other (uncertainty in the above-cloud AOD, radiometry, etc.) error sources; thus, retrieval uncertainties are larger (see Fig. 4) and the above-cloud aerosol impacts themselves are less certain. Regardless, the presence of above-cloud aerosols is a notable confounding factor for this case. Returning to Fig. 11, the diamonds in each panel denote the above-estimated shifts in the mean CER for the eMAS SWIR retrievals when these above-cloud aerosol-induced non-orthogonality effects are considered.
Figure 12COT/CER solution spaces for the eMAS (a) 0.87/1.62 µm and (b) 0.87/2.13 µm bi-spectral channel pairs. Solid black lines indicate calculations for a liquid cloud only, and dotted red lines indicate calculations for the same cloud but with an overlying absorbing biomass burning aerosol layer of AOD of roughly 0.6 (estimated from co-located HSRL-2 observations). The red diamonds denote the mean eMAS reflectance observations within the coordination box in Fig. 9. While the aerosol absorption is accounted for in the RT calculations only for the 0.87 µm channel, it is evident that the reflectance change in this channel yields changes in the CER retrievals via the non-orthogonality of the solution space.
CER statistics using various combinations of updated cloud radiative model assumptions in the eMAS and GSFC RSP bi-spectral retrieval LUTs are shown in Fig. 11b–d, specifically (b) updated imaginary index of refraction datasets for the SWIR channels obtained from laboratory measurements at 295 K (Kou et al., 1993; Platnick et al., 2020), (c) heritage refractive index datasets (see previous paragraph) but with a narrower DSD CEV (0.02) more consistent with both the PDI DSDs at the top of the cloud and the RSP polarimetric CEV retrieval (Fig. 10b), and (d) a combination of the 295 K SWIR refractive indices and CEV = 0.02. For each panel, retrieval statistics using the heritage cloud forward radiative model assumptions, consistent with Fig. 11a, are also included as the dotted box-and-whisker plots, providing a visual reference for CER retrieval changes due to the updated assumptions. Note that the eMAS 3.7 µm retrievals in (b) and (d) do not have updated retrievals, as the 295 K refractive index dataset does not extend into the MWIR.
Figure 13eMAS imagery obtained during the 10.5° E Ramp coordination shown in Figs. 7 and 8b. From left to right: true-color RGB image; observed scattering angle (Θ); COT; and CER from the 1.62, 2.13, and 3.7 µm channels. The blue boxes in each panel denote the region where the P-3 was sampling within the cloud layer during ER-2 overpass.
For all combinations of updated cloud radiative model assumptions in Fig. 11, the bi-spectral CER retrievals from all spectral channels decrease, with the largest impacts being in the eMAS 1.6x and 2.13 µm channels due to changing the CEV assumption from 0.1 to 0.02 (see panels c, d). That change seems to yield better agreement amongst the 2.x µm channels for both refractive index assumptions, though its impact on the eMAS 1.6x µm retrievals is mixed. With respect to the expected spectral differences implied by both the PDI- and CASshifted-weighted CER (dashed and dotted vertical lines, respectively) and without estimating the impacts of the aerosol absorption on the COT/CER solution space, the updated CEV assumption appears to overcorrect the 1.6x µm retrievals. This result is seemingly consistent with the DSD CEV profiles from the cloud probes shown in Fig. 10b, where the vertical weighting functions in Fig. 10c imply that the vertical sensitivities of the 1.6x, 2.x, and 3.7 µm spectral channels are deeper in the cloud where CEV is larger. Indeed, using Eq. (6) to compute a weighted CEV for each spectral channel, i.e., replacing CER(z) with CEV(z), shows that the CEV for all the spectral channels is closer to the heritage 0.1 assumption rather than the PDI value at cloud top and the RSP polarimetric retrieval whose single-scattering sensitivity is inherently weighted to cloud top. The weighted CEV values for all eMAS SWIR/MWIR spectral channels for this case, along with the weighted optical depth within cloud indicating the level of vertical sensitivity, are shown in Table 2. Thus, using a smaller CEV closer to the polarimetric retrievals might be expected to yield CER retrieval biases. Conversely, accounting for the estimated impacts of the above-cloud absorbing aerosols on the CER retrievals, denoted by the diamonds in each panel of Fig. 11, implies that an updated CEV assumption might instead improve retrieval agreement with the probes and certainly might bring the eMAS 1.6x µm retrievals more in line with the 2.x and 3.7 µm retrievals. However, given the higher susceptibility to retrieval errors and larger uncertainties discussed above, it is difficult to unambiguously disentangle these contradictory effects on the 1.6x µm CER retrievals.
eMAS imagery for the 10.5° E Ramp coordination is shown in Fig. 13. Like Fig. 9, the blue-outlined boxes in each panel denote the approximate region in which the P-3 was sampling within the cloud during this ER-2 overpass, which in this case was a single descent from cloud top to cloud base (Figs. 7 and 8b), inherently over a much shorter distance with reduced sampling compared to the 9° E Sawtooth case. Nevertheless, this imagery again shows relatively homogeneous stratocumulus clouds, though much more optically thick than the 9° E Sawtooth case, with mean eMAS COT = 23.3 within the blue box. Moreover, the spectral CER retrievals shown here appear to diverge from the adiabatic cloud assumption, with retrievals from the 2.13 µm channel yielding the largest CER.
The CER profiles derived from PDI (blue) and CAS/2D-S (gray, red) DSDs obtained during the 10.5° E Ramp are shown in Fig. 14a. Like Fig. 10, the circles denote CER derived from the 1s DSDs and the triangles denote CER derived from the DSDs aggregated to the fixed 10 m vertical layers, and two CAS/2D-S profiles are shown: one derived from the original DSDs (gray, denoted CAS for simplicity) and the other derived from DSDs having CAS size bins shifted given the King LWC constraint (red, denoted CASshifted). Again, there is a good correlation between CAS/CASshifted and PDI, though CASshifted CER values are still nearly 2 µm smaller than those derived from PDI at cloud top, with differences decreasing to near-zero at cloud base. Note, however, the obvious sampling reduction evident in the 1 s CER compared with the 9° E Sawtooth, due to the single descent through the cloud in this case.
Figure 14P-3 cloud probe data obtained during the 10.5° E Ramp coordination (blue segment in Fig. 8b and corresponding blue box in Fig. 13), where PDI is plotted in blue, CAS/2D-S is plotted in gray, and CAS/2D-S with CAS shifted to correct for liquid water content biases is plotted in red. (a) CER profiles derived from the reported 1 s probe DSD observations (circles) and from DSD observations aggregated to 10 m vertical layers (triangles). (b) Profiles of probe DSD effective variance, CEV, for the 1 s observations (circles) and 10 m vertical layer aggregations (triangles). Also shown is the mean CEV retrieved from co-located RSP polarimetric observations (vertical dashed line) along with a vertical dotted line denoting the CEV assumed for the eMAS and RSP bi-spectral retrievals (CEV = 0.1). (c) Vertical weighting functions for the eMAS 1.6x (gray), 2.x (red), and 3.7 µm (yellow) channels, along with the single-scattering weighting function approximating polarization sensitivity (black), derived from forward radiative transfer calculations using the 10 m binned PDI DSD observations.
The profiles of CEV computed from PDI and CAS/2D-S (again denoted CAS and CASshifted for simplicity) DSDs are shown in Fig. 14b. The mean CEV from the co-located RSP polarimetric cloud-bow retrievals (vertical dashed line at CEV = 0.028) and the CEV assumed in the eMAS cloud optical property retrievals (vertical dotted line at CEV = 0.1) are also shown. As in the 9° E Sawtooth case, there is a strong vertical CEV gradient throughout most of the cloud, except in the topmost 100 m or so. The two probes again strongly disagree on CEV at cloud top, with CASshifted indicating CEV roughly consistent with the heritage bi-spectral retrieval assumption and with PDI indicating CEV of roughly a factor of 3 smaller than CASshifted and consistent with the RSP polarimetric retrieval.
The vertical weighting functions for the eMAS 1.6x (gray lines), 2.x (red lines), and 3.7 µm (yellow line) spectral channels, along with the RSP polarimetric weighting function (black line) approximated from a single-scattering assumption, computed from the PDI 10 m DSDs in Fig. 14a and forward RT calculations, are shown in Fig. 14c. Like the 9° E Sawtooth case in Fig. 10c, the 3.7, 2.x, and 1.6x µm channels are each subsequently weighted deeper into the cloud. However, note that the sensitivity for all spectral channels is practically limited to the topmost 100 m of the cloud where the CEV (Fig. 10b) is roughly vertically invariant. The implications on retrieval sensitivities to CEV are discussed below.
Figure 15eMAS spectral CER retrieval statistics for the 10.5° E Ramp coordination (blue box, Fig. 13) for the 1.6x (gray), 2.x (red), and 3.7 µm (yellow) channels. Also shown are statistics of RSP multi-angle cloud-bow polarimetric retrievals (clear) and nadir spectral CER retrievals (same colors as eMAS spectral regions). The dashed vertical lines denote the expected CER retrievals from each spectral region derived from PDI (Fig. 14). As in Fig. 11, the diamonds denote estimates of mean CER for the eMAS 1.6x and 2.x channels that account for the impacts of VIS/NIR above-cloud aerosol absorption via LUT non-orthogonality; above-cloud aerosol loading, again an ACAOD of roughly 0.6, is estimated from co-located HSRL-2.
Figure 15 shows statistics of CER retrievals from eMAS and RSP for the region within the blue box in Fig. 13 that corresponds to the 10.5° E Ramp coordination. The retrievals and statistics shown, along with the color scheme, are consistent with the same plots for the 9° E Sawtooth in Fig. 11. For the expected CER derived from the probes (vertical lines), again only those specific to the 1.62, 2.13, and 3.7 µm channels are shown in the figure since the expected CER from the other 1.6x and 2.x µm channels are consistent within each spectral region, as shown in Table 3. As in Fig. 11, the impacts of above-cloud absorbing aerosols on the eMAS 1.6x and 2.x µm retrievals are denoted by the diamonds in each panel; in this case, AOD = 0.6 again as indicated by co-located HSRL-2 curtains. Both the CASshifted and PDI expected CER values again exhibit the well-known adiabatic signature, with CER(3.7 µm) > CER(2.x µm) > CER(1.6x µm). The differences between the PDI and CASshifted expected CER values shown in Table 3, ranging from 1.3 to 1.6 µm, are also generally smaller than what was seen in the Sawtooth case, particularly for the 3.7 µm channel.
Table 3Same as Table 2 but for the 20 September 2016 for the 10.5° E Ramp case study.
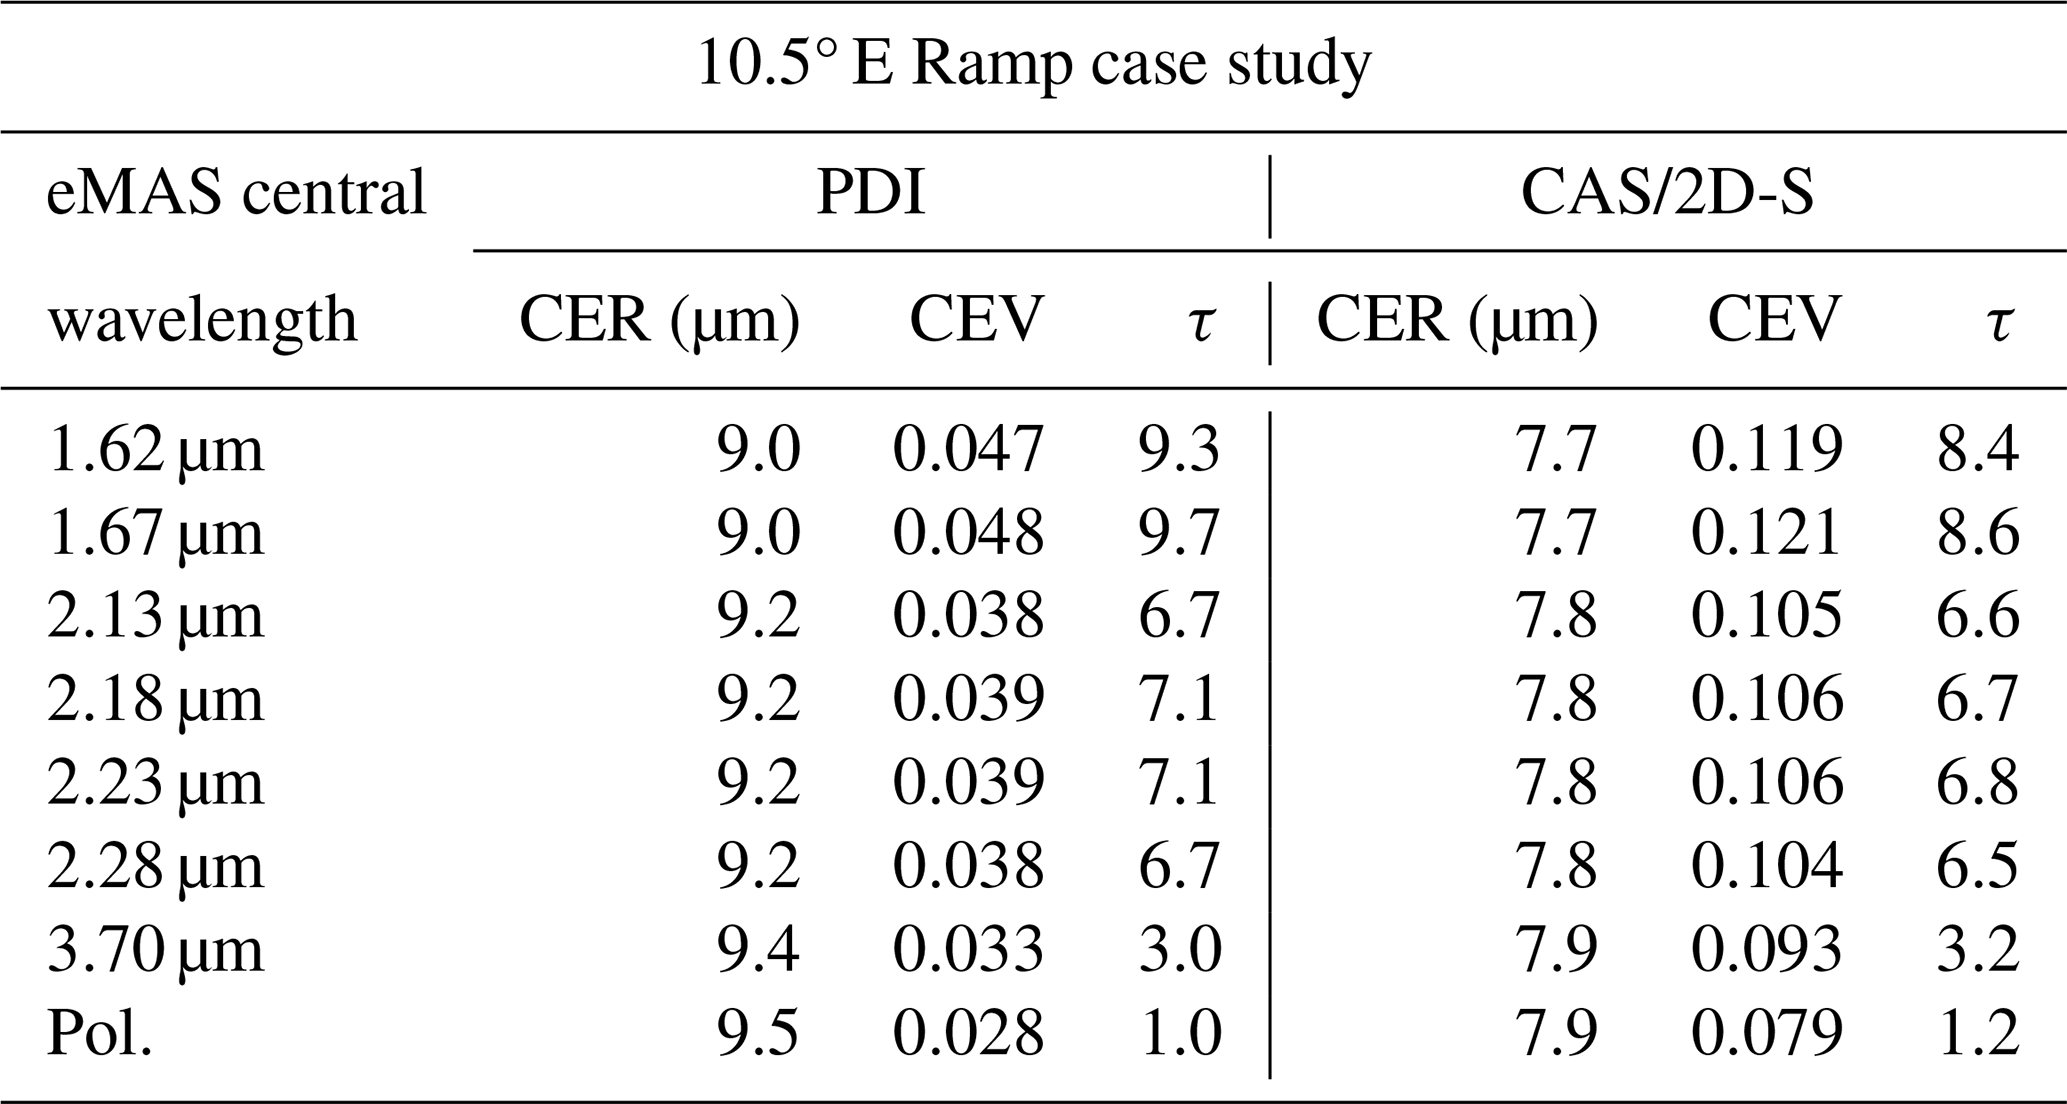
Figure 15a shows the CER statistics using the heritage cloud forward radiative model assumptions in the bi-spectral retrieval LUTs. Unlike the retrievals for the 9° E Sawtooth case in Fig. 11a, however, the bi-spectral and polarimetric retrievals here do not agree, with differences of 2 µm or more. Moreover, there is large disagreement amongst the bi-spectral retrievals themselves: up to 1.5 µm in the case of the eMAS 2.13 and 2.28 µm spectral channels. And none of the retrievals agree with the expected CER derived from the cloud probes, unlike the Sawtooth case where the retrievals were roughly consistent with PDI. Here, the polarimetric retrievals from RSP are smaller than the CER derived from PDI, and the bi-spectral retrievals are larger. The estimated impacts of the above-cloud absorbing aerosols on the eMAS retrievals, denoted by the triangles, also differ from those of the 9° E Sawtooth case in Fig. 11, with CER increases much smaller given that the larger COT is associated with brighter observed spectral reflectance that places the observations within the more orthogonal portions of the COT/CER solution spaces. Specifically, accounting for the above-cloud aerosols in this case yields CER increases of roughly 1.1 and 1.5 µm for the 1.62 and 1.6x µm channels, respectively, and only 0.1, 0.17, 0.2, and 0.14 µm for the 2.13, 2.18, 2.23, and 2.28 µm channels, respectively; for the 2.x µm channels, these impacts are essentially negligible.
Figure 15b–d show CER statistics using the same combinations of updated cloud radiative model assumptions in the eMAS and GSFC RSP bi-spectral retrieval LUTs as those used for the 9° E Sawtooth case in Fig. 11b–d. Like the Sawtooth case, all combinations of updated radiative model assumptions yield smaller bi-spectral CER retrievals. The largest impacts result from coupling the alternate refractive index assumption with the smaller CEV (again 0.02, more consistent with both the PDI DSDs at the top of the cloud and the RSP polarimetric CEV retrieval shown in Fig. 14b), where, for instance, the 2.13 µm channel retrievals decrease by over 1 µm.
Unlike the 9° E Sawtooth case, however, the updated radiative model assumptions in the 10.5° E Ramp case across the board improve the bi-spectral retrieval agreement with the expected CER derived from PDI, and they move the bi-spectral retrievals, both with and without accounting for above-cloud absorbing aerosol impacts, closer to the RSP polarimetric retrievals. This is particularly the case for the combination of the 295 K refractive index and CEV = 0.02 assumptions. Recalling the CEV profiles and vertical weighting functions in Fig. 14, all the spectral channels are primarily sensitive to the topmost 100 m of the cloud. While this physical vertical sensitivity is consistent with the 9° E Sawtooth case (Fig. 10), in this 10.5° E Ramp case the CEV is roughly vertically invariant within that portion of the cloud and, for PDI, is consistent with the RSP polarimetric CEV retrievals, implying that the CEV experienced by the SWIR and MWIR spectral channels is closer to the RSP retrievals (CEV = 0.028) than to the heritage CEV = 0.1 assumption. This is confirmed by the computed weighted CEV shown in Table 3, where the weighted CEV computed from PDI for each spectral channel is between 0.035 and 0.05. It should be noted that the alternate CEV assumption is smaller than what the polarimetric retrievals and PDI suggest, implying the retrieval impacts shown here are likely overestimates. Nevertheless, using the exact polarimetric CEV or the weighted PDI CEV would still decrease the bi-spectral CER retrievals and improve agreement with both PDI and the polarimetric CER retrievals. Moreover, it is interesting to note that the updated refractive index assumption further improves the bi-spectral CER retrieval agreement, both amongst themselves and with PDI. The same assumption in the 9° E Sawtooth case (Fig. 11b) also improved agreement amongst the bi-spectral retrievals while not adversely affecting their agreement with PDI and the polarimetric retrievals. The broader implications of the results of both the 9° E Sawtooth and 10.5° E Ramp comparisons are discussed further in Sect. 5.
4.3 Retrievals at glory scattering angles
On multiple occasions during ORACLES 2016, the ER-2 flight heading was oriented such that eMAS observed within its swath scattering angles (Θ) in the region around direct backscattering where liquid cloud spectral reflectance has distinct angular features. These backscatter angular features, known as the glory (Khare and Nussenzveig, 1977), occur at Θ roughly between 160 and 180°, though the exact range depends on wavelength, with the NIR having the narrowest glory region and the MWIR the widest. The backscatter glory, much like the cloud bow observed in polarized NIR reflectance around Θ = 140° (see Bréon and Goloub, 1998; Bréon and Doutriaux-Boucher, 2005), is strongly coupled to the single-scattering phase function and has similar sensitivities to the DSD of the cloud, with the location and relative amplitude of reflectance peaks at a given wavelength having sensitivity to CER and CEV, respectively (Spinhirne and Nakajima, 1994). Figure 16 illustrates these glory sensitivities using liquid cloud single-scattering phase functions in the backscatter region computed for the eMAS narrowband SWIR channel centered at 2.13 µm. Here, the normalized phase functions are shown for (a) various CER values, assuming a fixed CEV of 0.1, and (b) various CEV values, assuming a fixed CER of 10 µm.
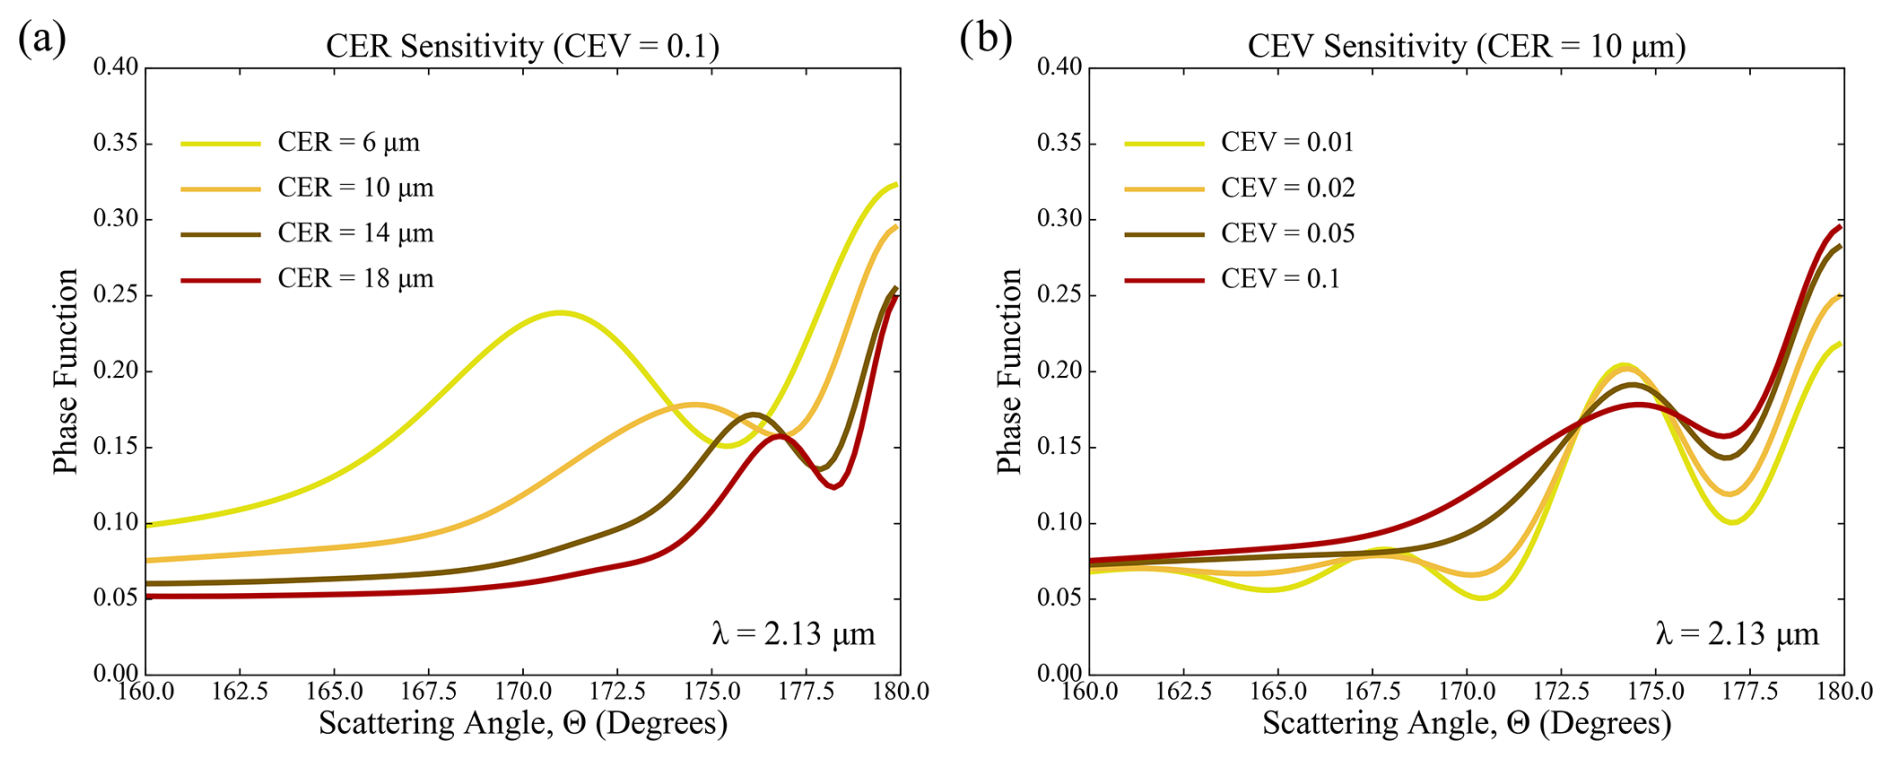
Figure 16Sensitivity of liquid cloud normalized phase functions in the glory scattering angle region to (a) CER and (b) CEV. Like the polarized phase functions in the cloud-bow scattering angle region, the locations of the phase function peaks in the glory scattering angle space are sensitive to CER, while the amplitude of the peaks/valleys is sensitive to CEV.
While the scattering angles sampled by satellite and airborne imagers are more frequently outside the direct backscatter region, glories are often observed in both airborne and satellite narrowband spectral reflectance observations and are most readily apparent over relatively homogeneous liquid cloud fields such as marine stratocumulus. For instance, during the First International Satellite Cloud Climatology Program Regional Experiment (FIRE) in 1987, glories over marine stratus clouds were observed in NIR and SWIR spectral channel reflectance images obtained by two airborne cross-track scanning radiometers flown aboard NASA's ER-2 aircraft, and extensive forward radiative transfer modeling was performed to demonstrate the sensitivities of these glories to both CER and CEV (Spinhirne and Nakajima, 1994). Glories observed by satellite imagers also have been used to infer DSD CEV (Benas et al., 2019) and cloud droplet size (Koren et al., 2022).
Of more relevance here, Mayer et al. (2004) used airborne observations of the glory from the Compact Airborne Spectrographic Imager (CASI) to simultaneously retrieve both CER and CEV for a stratocumulus case study using observed reflectance in a single NIR spectral channel (0.753 µm). Like the polarimetric cloud-bow retrieval, this glory retrieval finds the CER and CEV pair whose simulated reflectance best matches the observed angular shape of the glory, i.e., matching the angular location of the observed reflectance peaks to determine CER and matching the amplitude of the observed reflectance peaks to determine CEV. While cloud reflectance is also a function of COT, the angular shape of the glory is assumed to be nearly independent of COT, and the retrieval least-square fitting is performed using the “glory reflectivity” that isolates the shape of the glory by subtracting the mean reflectance of the scene (Mayer et al., 2004).
We perform a similar analysis here for the eMAS glory observations for the purpose of providing context for the eMAS bi-spectral CER retrievals and the above evaluation against RSP polarimetric retrievals and CER derived from in situ cloud probe DSDs, as well as for the CEV assumption used in the bi-spectral retrieval forward RT calculations. Following Mayer et al. (2004), we define the glory reflectivity at eMAS spectral channel b as a function of across-track pixel location p, such that
where is the mean reflectance across the eMAS swath. However, rather than implementing a rigorous least-square fitting approach to match the simulated glory reflectivity to the observed glory reflectivity, for our case study we simply infer CER and CEV by visually comparing simulated reflectance peaks and amplitudes to the observations. In addition, we perform this analysis for three eMAS channels in the SWIR (1.62 and 2.13 µm) and MWIR (3.7 µm) that have different vertical sensitivities within the cloud.
Figure 17 shows eMAS browse imagery for a flight track on 14 September 2016, where the backscattering region was observed. The ER-2 direction of travel is indicated by the arrow on the left of the true-color RGB; the track length is also indicated on the left. While not visible in the true-color RGB, the scattering angle (Θ) image clearly shows that eMAS observed scattering angles across the backscatter region on the right side of its swath. Moreover, the angular pattern of the glory is clearly visible in the retrieval imagery for both COT and spectral CER, indicating that the forward RT model calculations used for the retrieval inversion do not accurately describe the angular reflectance of the glory, a likely consequence of inadequate assumptions about the DSD (e.g., CEV, vertical homogeneity).
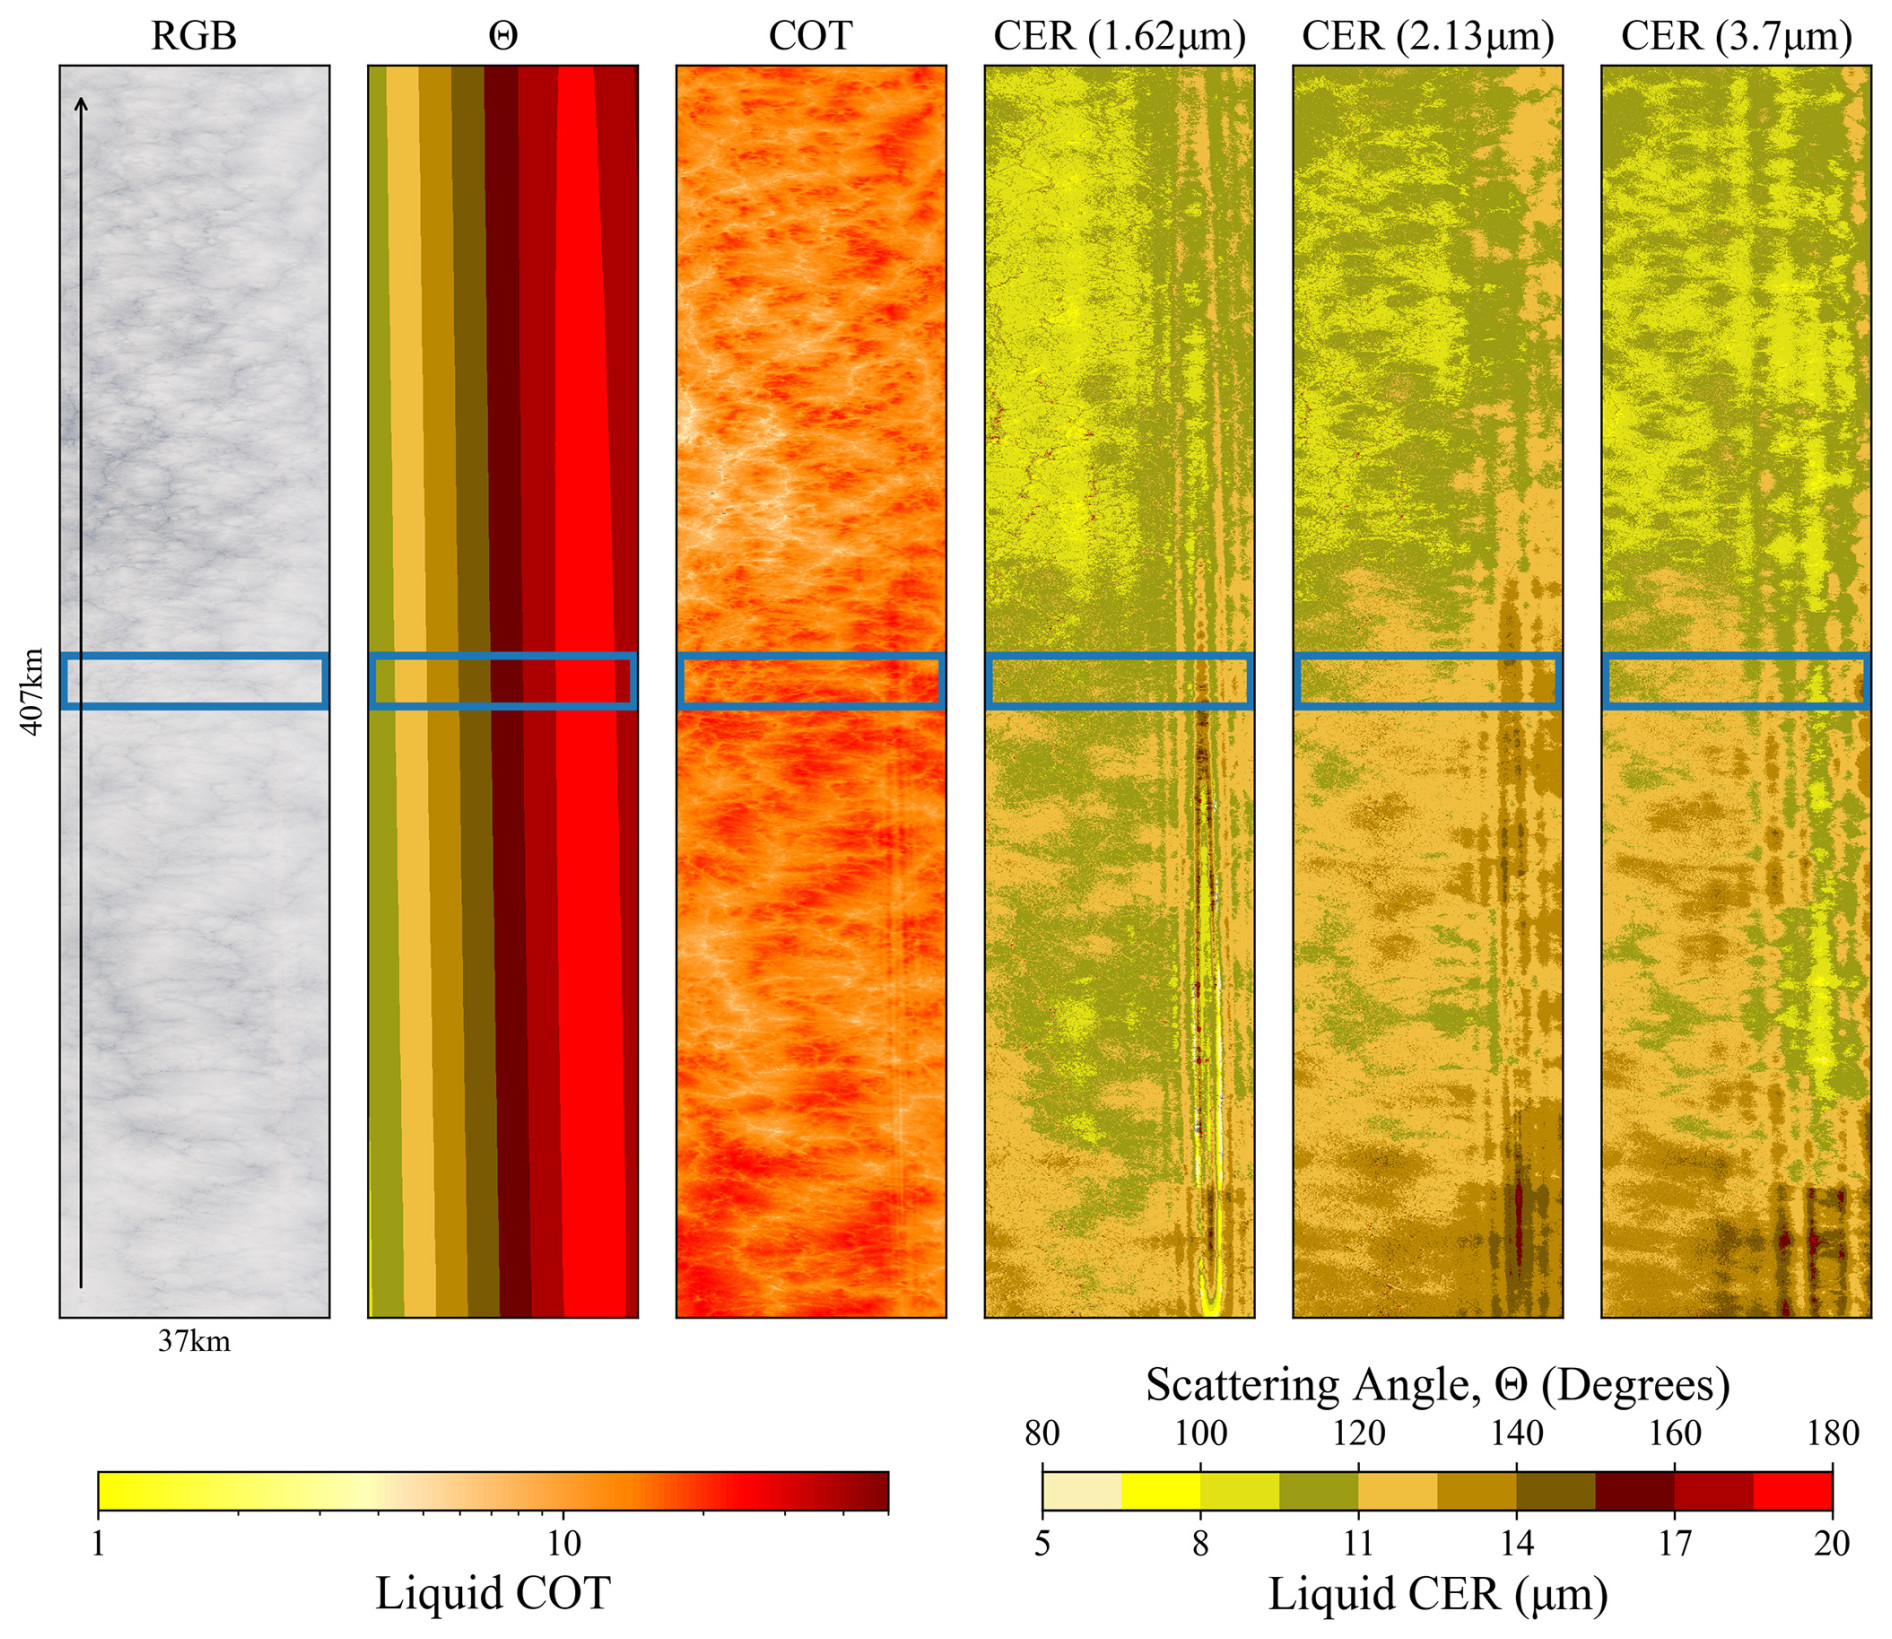
Figure 17eMAS browse imagery (true-color RGB; scattering angle Θ; COT; and spectral CER from the 1.62, 2.13, and 3.7 µm channels) for an ER-2 flight track on 14 September 2016. ER-2 direction of travel is indicated by the arrow on the left of the RGB image; track length is also indicated on the left. While the glory is not visible in the true-color RGB using VIS wavelengths, its angular features are clearly visible in the retrieval imagery on the right. The blue box denotes the region where the glory features in spectral reflectance are used to infer CER and veff.
Figure 18 shows additional imagery and retrieval statistics for the blue-outlined region in Fig. 17. A false-color RGB using SWIR and VIS channels is shown in (a); the exact channel wavelengths used are denoted in the panel title at the top. Note that we have stretched the color scale in this RGB such that the glory feature on the right side of the image is enhanced for visibility, at the expense of also misleadingly intensifying the appearance of scene heterogeneity. The scattering angle observed by eMAS (black line), as well as the retrieved cloud-top pressure (CTP, blue line), is shown in (b), with the backscattering region (largest scattering angles) nicely correlating with the glory in (a). Across-track statistics for eMAS retrievals of COT (blue line) and spectral CER (black lines) are shown in (c). The lines here represent means of each retrieval computed for the along-track pixels at each across-track pixel location; eMAS spectral CER retrieval means are shown for the 1.62 µm (dotted black line), 2.13 µm (solid black line), and 3.7 µm (dashed black line) channels. RSP polarimetric cloud-bow CER retrieval statistics for the same along-track region are also shown as the red box-and-whisker plot at the eMAS center pixel location, roughly where the RSP and eMAS observations are spatially co-located.
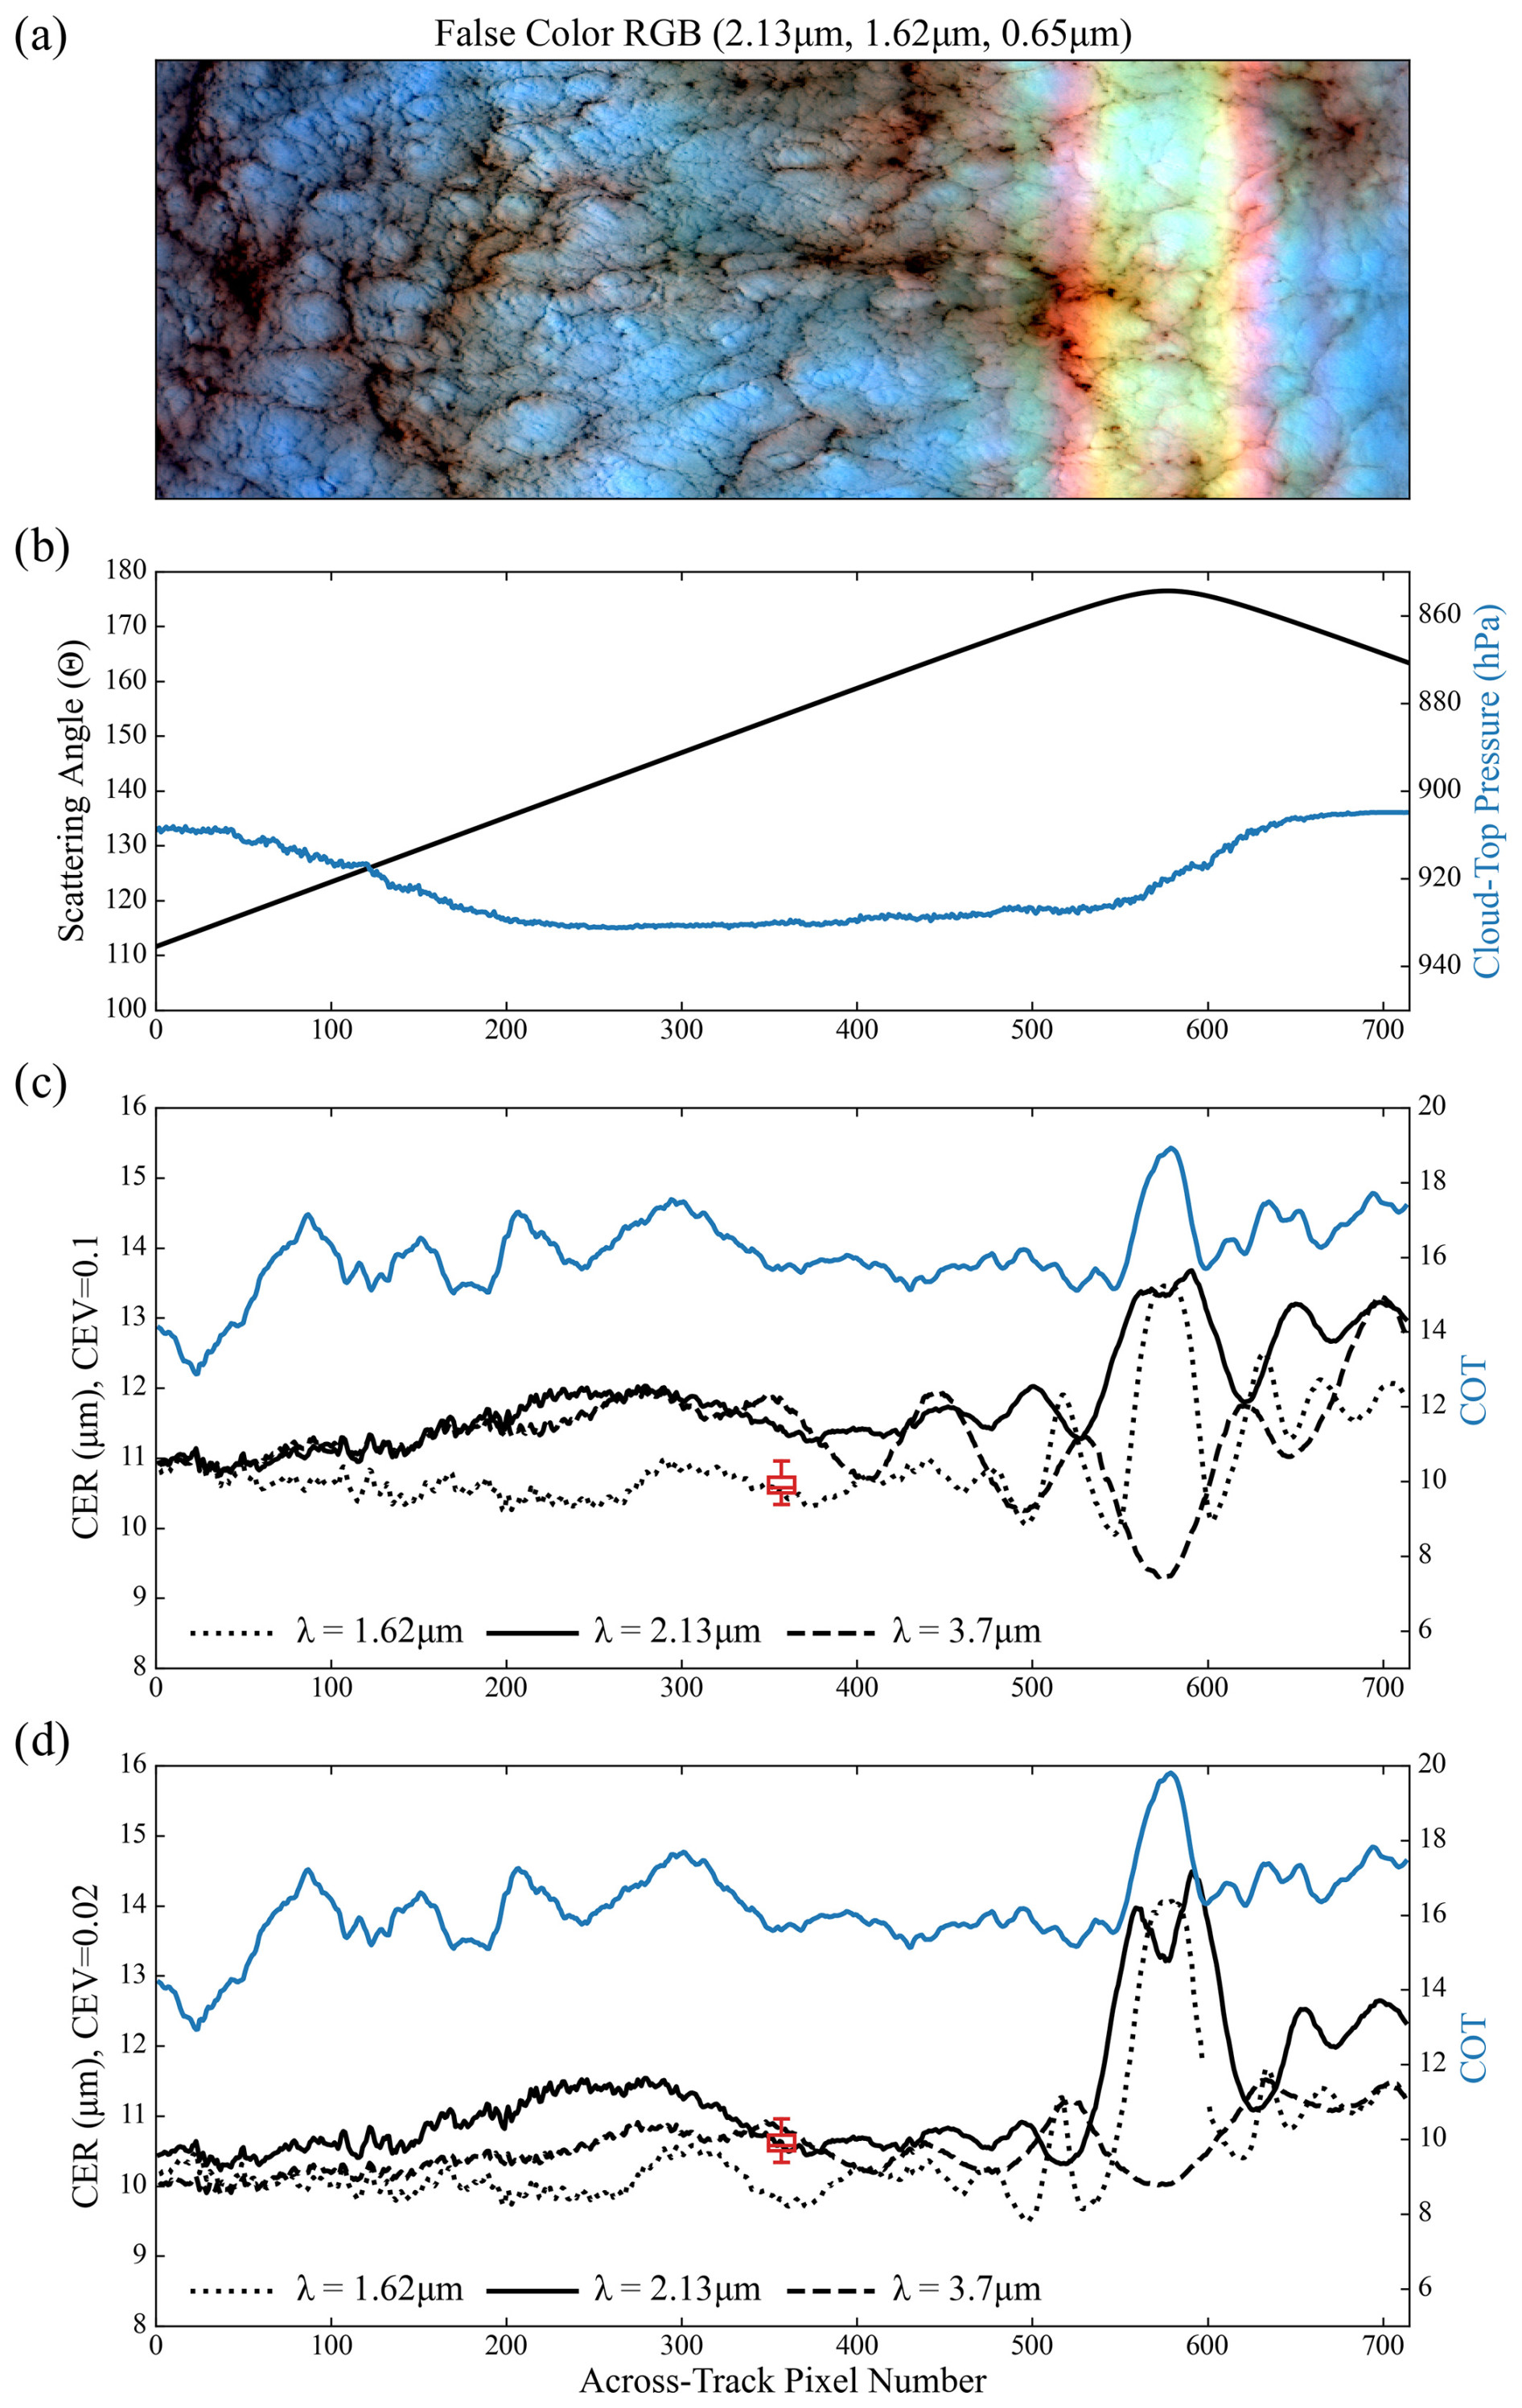
Figure 18eMAS false-color RGB (a) and across-track retrieval statistics for the blue-outlined region in Fig. 17. The spectral channels used in the RGB (a) are indicated in the title at the top. (b) The observed scattering angle (black line) and retrieved cloud-top pressure (CTP, blue line). (c) Statistics for COT (blue line) and CER from the 1.62 µm (dotted black line), 2.13 µm (solid black line), and 3.7 µm (dashed black line) channels using heritage forward model assumptions (e.g., CEV = 0.1). RSP polarimetric CER retrieval statistics are shown as the red box-and-whisker plot at the center of the swath where RSP is roughly co-located with eMAS. (d) Same as (c) except assuming CEV = 0.02 in the eMAS forward RT model, an assumption that is close to the CEV = 0.017 retrieved by RSP near the swath center. The plots for all eMAS retrievals represent the along-track means of the retrievals at each across-track pixel location.
While the false-color RGB in Fig. 18a has the appearance of strong heterogeneity across the eMAS swath in this sub-region, the variability in the CTP and COT means across track is relatively small, though angular features, in particular a peak at the largest observed scattering angle, are evident for COT. Spectral CER retrievals, on the other hand, exhibit the strong angular patterns indicative of the glory across most of the right-hand side of the swath – the 1.62 µm CER, for instance, has a fluctuation of more than 3 µm across the backscatter peak. These results are consistent with the retrieval sensitivities found by Benas et al. (2019). Moreover, the angular peaks of each spectral CER retrieval across the glory region are not aligned, a consequence of the spectral dependence of the glory width that also produces the glory's distinctive rainbowlike appearance in the RGB. Interestingly, the RSP polarimetric cloud-bow retrievals agree best with the eMAS 1.62 µm channel retrievals and are roughly 1.5–2 µm smaller than the 2.13 and 3.7 µm retrievals, consistent with the comparisons shown for the 20 September Sawtooth coordination in Fig. 11.
Plots of observed and simulated glory reflectivity, Rglory, at cloud top for the glory portion of the scene in Fig. 18, specifically the rightmost portion of the swath starting at across-track pixel 450, are shown in Figs. 19, 20, and 21 for the 3.7, 2.13, and 1.62 µm channels, respectively. Note that the observed cloud-top Rglory for each spectral channel (solid black lines) is computed from the eMAS reflectance observations corrected for above-cloud gaseous absorption and, like the retrieval statistics in Fig. 18, is the mean of the along-track pixel observations at each across-track pixel location. For the 3.7 µm channel, thermal emission also has been removed from the observations as part of the COT/CER retrieval process. For each plot in these figures, the rough locations of the observed Rglory peaks are indicated by the vertical dotted black lines, providing a visual reference for inferring CER via Rglory peak matching. The simulated Rglory is computed for four values of CEV corresponding to the four panels in each figure, namely, 0.1, 0.05, 0.02, and 0.01, moving from the top panel to the bottom panel. The CER values and corresponding line colors are indicated at the bottom of each figure and are computed for each CEV assumption.
Collectively, the Rglory simulations in Figs. 19, 20, and 21 do not provide an unambiguous match for the observed Rglory for any spectral channel, an unsurprising result when working with real observations. Nevertheless, some interesting conclusions can be drawn. Starting first with the 3.7 µm channel in Fig. 19, which is the easiest to decipher, there are three observed Rglory peaks in this portion of the swath. Because eMAS does not observe the direct backscatter angles in this scene (Θ=180° and angles immediately adjacent; see Fig. 18b), the middle Rglory peak is difficult to interpret and, given the simulated Rglory shown, does not appear to exhibit sensitivity to CER beyond suggesting that CER is likely smaller than 12 µm. The two side peaks, however, do exhibit sensitivity to CER, as indicated by the shifting locations of the peaks in the simulated Rglory. Here, the right side peak, near across-track pixel 650, implies a CER of perhaps 11 µm given that the observed peak is roughly centered between the computed 10 µm (brown line) and 12 µm (red line) peaks. The left side peak near across-track pixel 500, on the other hand, implies a CER perhaps between 9–10 µm. This apparent increase in CER from the left side of the glory to the right side is consistent with the general increase in CER shown in the bi-spectral retrieval statistics in Fig. 18c, implying both approaches are characterizing real microphysical changes across the swath. In both sides of the glory, however, the CER values are smaller than what the bi-spectral retrievals suggest.
The 2.13 and 1.62 µm channels in Figs. 20 and 21, respectively, tell much the same story even though the Rglory peaks are increasingly more difficult to discern at shorter wavelengths. For the 2.13 µm channel, the primary left side Rglory peak suggests a roughly 9 µm CER, while the primary right side peak suggests a roughly 10 µm CER. For 1.62 µm, only the right side primary peak is clearly discernible and suggests a CER of perhaps 9–10 µm. The tertiary peaks in the 1.62 µm Rglory, however, are more evident and suggest a roughly 9 µm CER on the left side and perhaps a 10 µm CER on the right. Similar to the 3.7 µm channel, both the 1.62 and 2.13 µm channel glories suggest larger CER on the right side of the glory than the left, and both seem at least 1 µm smaller than their respective bi-spectral retrievals (Fig. 18c). Moreover, the CER values implied by the SWIR glories are smaller than those implied by the 3.7 µm channel glory.
For CEV, the 0.1 assumption (top panels in Figs. 19, 20, and 21) yields a computed Rglory for all three spectral channels that is much too flat across the swath, without the strong angular features evident in the observed Rglory. These angular features, however, become increasingly evident with decreasing CEV. While attempting to match the Rglory peak amplitudes to an exact CEV is difficult given the additional sensitivity to COT, the simulations for all three spectral channels clearly suggest that the CEV for the vertical region of these clouds from which the single-scattering glory signal originated is smaller than the 0.1 assumption used in the heritage bi-spectral multiple scattering retrievals. This result is supported, to the extent that CEV can be assumed to not significantly vary across this scene, by RSP that retrieves, from the polarized cloud bow, CEV = 0.017 at the center of the swath in Fig. 18; eMAS COT and CER retrievals constrained by these CEV results, namely, assuming CEV =0.02 in the forward RT model, are shown in Fig. 18d. Compared to the CEV = 0.1 case in Fig. 18c, the bi-spectral retrievals are smaller and, except for the 1.62 µm channel, are now in much better agreement with the RSP polarimetric retrievals (red box-and-whisker plot) at the center of the swath. Moreover, the small-scale oscillations around the backscatter peak in Fig. 18c have been reduced significantly. These results initially might suggest that the CEV = 0.02 forward model assumption is more appropriate for this scene than the heritage CEV = 0.1 assumption. However, the 1.62 and 2.13 µm channel CER retrievals at the largest scattering angles are now even larger than with the CEV = 0.1 assumption and are more out of line with the adjacent retrievals. These contradictory results imply that a single forward model assumption is unable to provide consistency across retrievals having differing information content and sensitivities to vertical heterogeneity, among others.
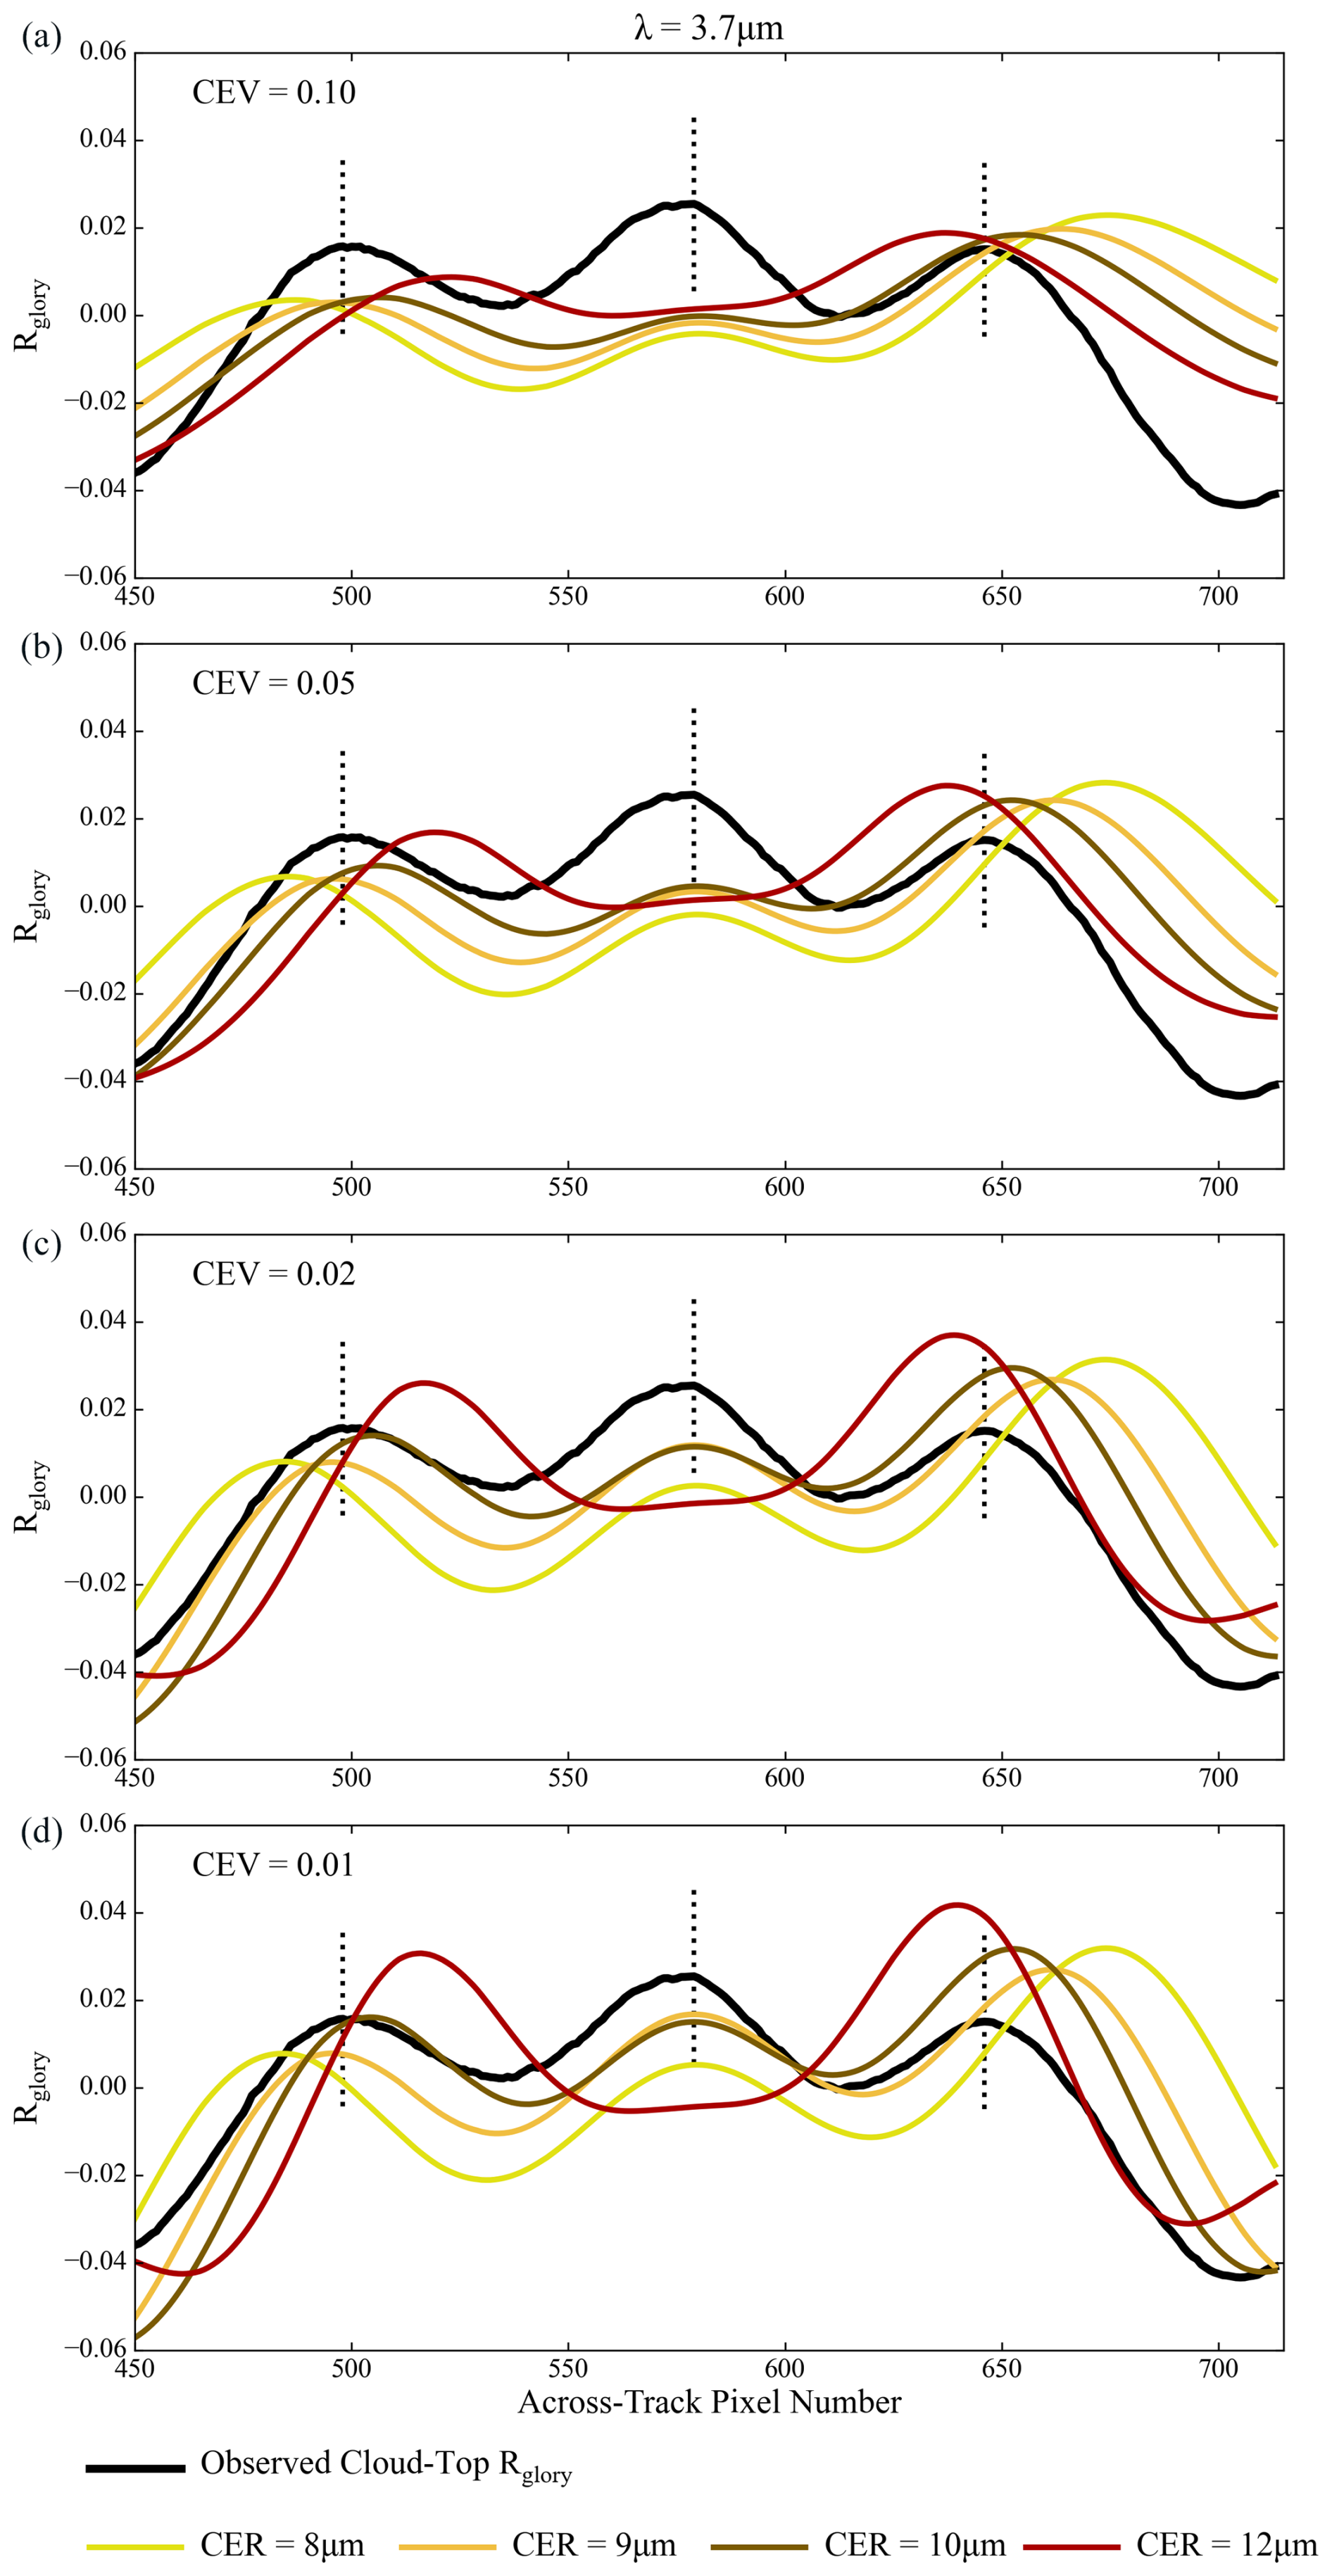
Figure 19Observed (black lines) and simulated glory reflectivity Rglory (see Eq. 7 for definition) for the 3.7 µm eMAS channel corresponding to the right-hand side of the swath (starting at across-track pixel 450) in Fig. 18. The Rglory simulations are performed for four CEV assumptions, namely, 0.1, 0.05, 0.02, and 0.01, moving from the top panel to the bottom panel, and for four CER values as indicated by the legend at the bottom of the figure. The rough locations of the observed Rglory peaks are indicated by the vertical dotted black lines.
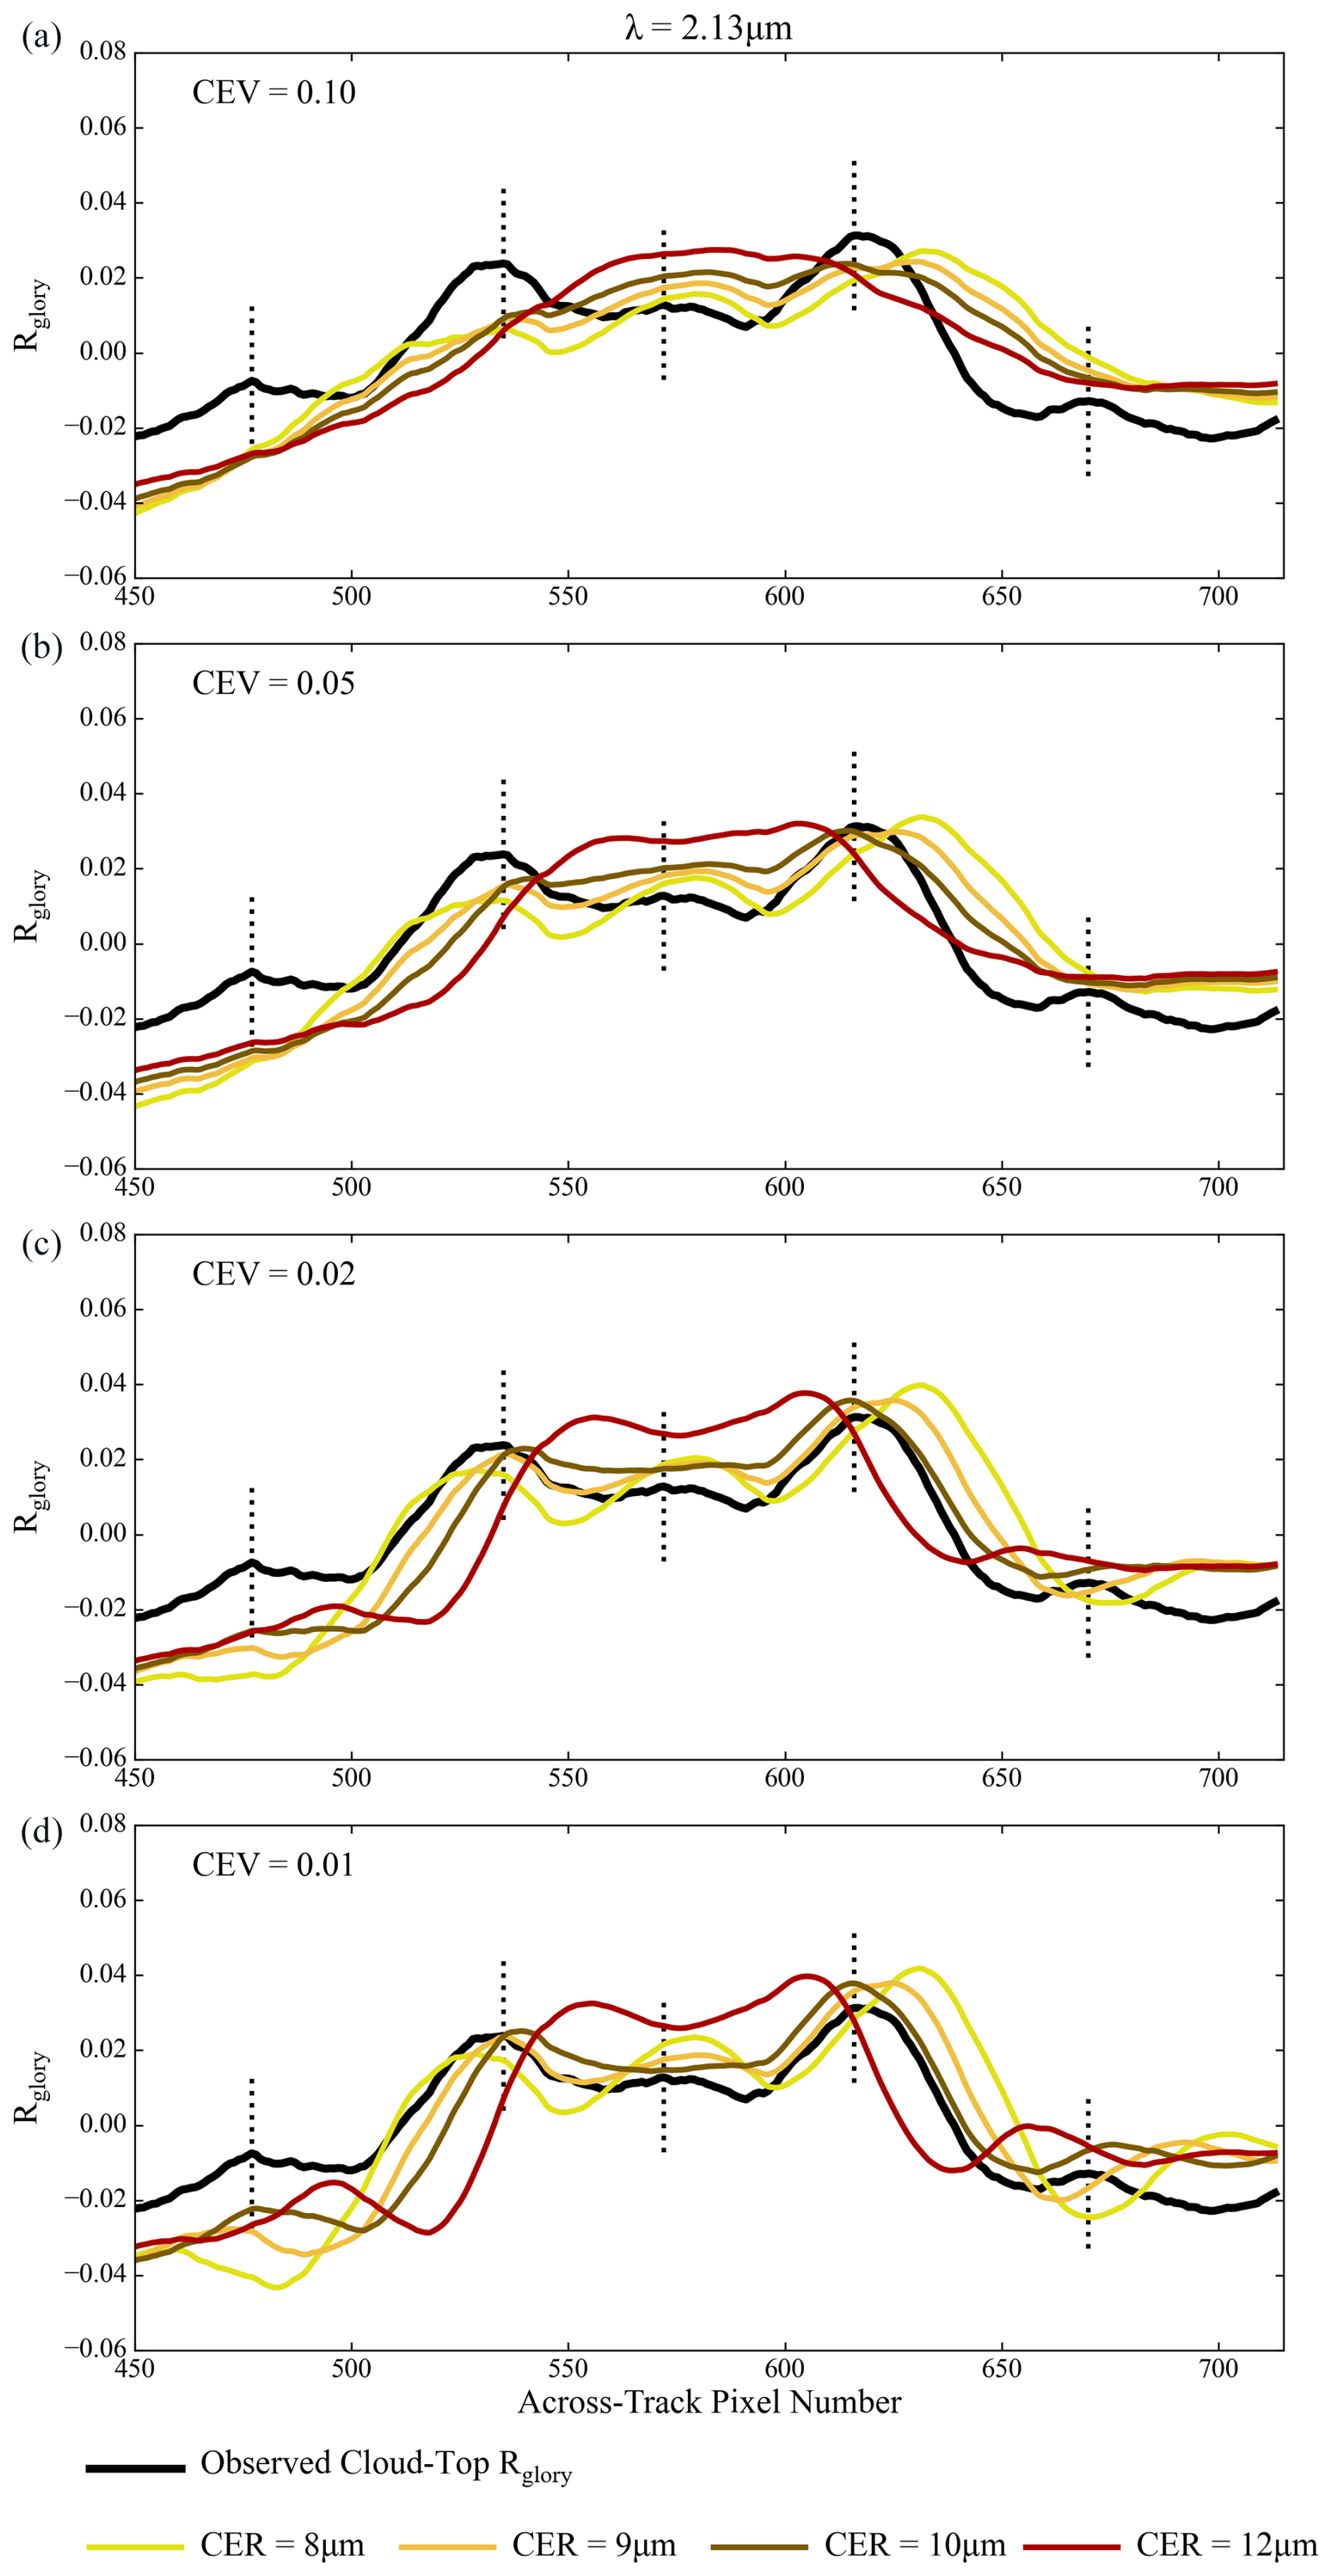
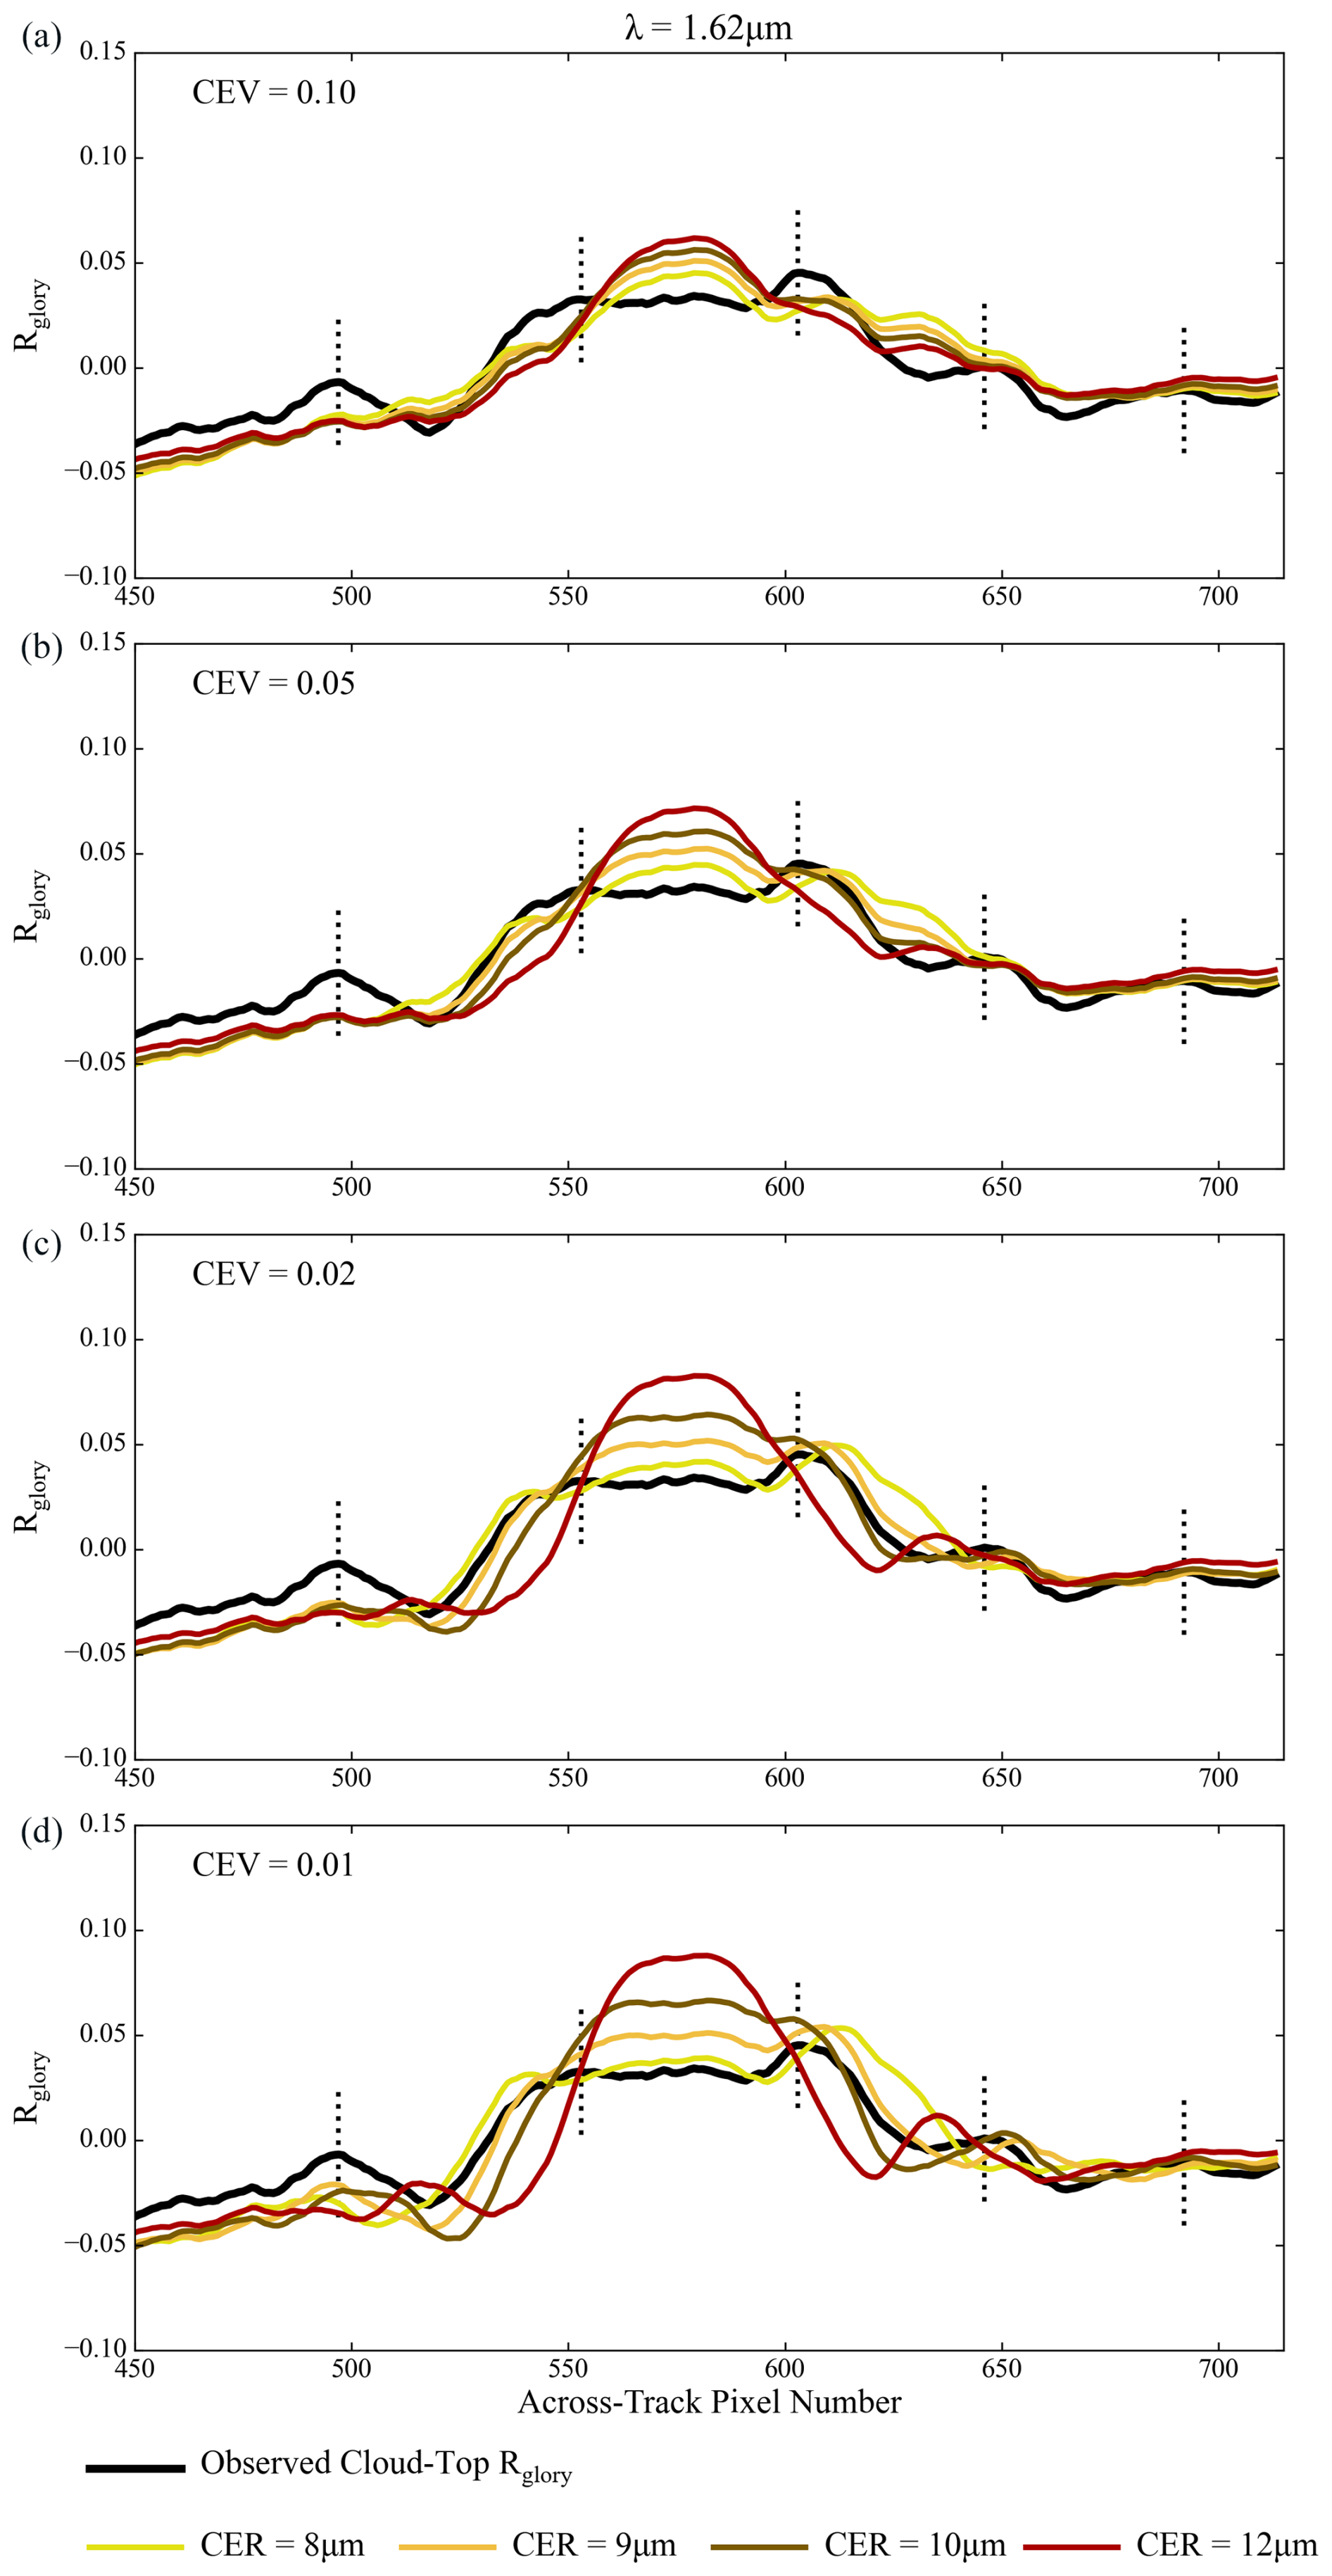
The results of the intercomparison in Sect. 4.2 and the glory analysis in Sect. 4.3 have important implications for interpreting existing spaceborne CER retrievals and their evaluations, as well as for informing remote sensing activities that seek synergy between spectral and polarimetric observations. Both analyses indicate that agreement amongst the various spectral and polarimetric retrievals is achieved in some cases and not in others. Furthermore, the use of alternate forward model assumptions in the spectral retrievals, presumably more appropriate for the scenes in question, also yield mixed results. This is particularly the case when “constraining” the DSD CEV assumption used in the forward RT models for the spectral CER retrievals with CEV close to what was retrieved from RSP polarimetry. For example, in the two comparison case studies in Sect. 4.2, this polarimetric constraint helped retrieval agreement in the 10.5° E Ramp case, where the cloud probes indicated weighted CEV closer to the RSP retrieval, but yielded mixed results in the 9° E Sawtooth case, where the probes indicated weighted CEV closer to the heritage spectral retrieval assumption (CEV = 0.1). There is strong evidence from the co-located in situ cloud probe observations (Figs. 10 and 14, Tables 2 and 3) that these results are a direct consequence of the vertical profile of CEV in the cloud. This perhaps should not be surprising, since spectral cloud reflectance (intensity) and polarized cloud reflectance have sensitivities to different parts of the cloud. Spectral reflectance has strong contributions from multiple scattering that can extend deep into the cloud (see the vertical weighting functions in Figs. 10 and 14, particularly for the SWIR channels), while polarization of the cloud reflectance is a single-scattering phenomenon with contributions mainly from the very top of the cloud that may not be descriptive of the deeper cloud column that contributes to spectral reflectance (Miller et al., 2016, 2018). Thus, while leveraging complementary observations or retrievals as constraints on spectral retrievals is a worthy endeavor, for clouds with strong vertical heterogeneity the CEV retrieved from polarimetry at cloud top may be quite different from what is influencing the total spectral reflectance and may not be an appropriate constraint on total-reflectance-based CER retrievals. Such approaches must not be pursued cavalierly.
Considering the spectral retrievals themselves, their variability in the comparison case studies shown in Figs. 11 and 15 does not appear to conform to common conceptualizations of retrieval sensitivity, particularly the additional spectral channels beyond the heritage MODIS-like 1.62, 2.13, and 3.7 µm channels of eMAS. For instance, in the 9° E Sawtooth comparison case, both cloud probes indicate that CER increases with height, indicative of adiabatic droplet growth, a commonly observed and assumed characteristic of marine boundary layer (MBL) stratocumulus clouds. Coupling this CER gradient with the spectral vertical sensitivities indicated by the weighting functions in Fig. 10c, we should expect an increase in retrieved CER moving from shorter to longer wavelengths, i.e., CER(1.6x µm) < CER(2.x µm) < CER(3.7 µm). Considering only the MODIS-like heritage 1.62, 2.13, and 3.7 µm eMAS channels, this retrieval pattern does indeed seem to hold, though accounting for above-cloud aerosol absorption might reverse this pattern if the assumptions used to do this here were appropriate. However, the additional 2.x µm channels yield CER retrievals that are smaller than those from the 2.13 µm channel and are on the order of or, when accounting for above-cloud absorbing aerosols, are smaller than those from the 1.6x µm channels, which is inconsistent with the adiabatic assumption. This result implies that factors beyond vertical heterogeneity are at play, such as radiometric calibration, above-cloud gaseous absorption correction errors, or forward RT model assumptions other than the DSD CEV discussed above.
5.1 Radiometric calibration
As we describe in Sect. 3.2, for ORACLES the radiometric calibration of the additional 1.6x and 2.x µm eMAS channels is defined relative to the heritage MODIS-like 1.62 and 2.13 µm eMAS channels. The calibration of the heritage MODIS-like channels themselves is established via comparisons with co-located Aqua MODIS observations during targeted underflights during the campaign. While previous and subsequent in-flight vicarious calibration experience informed this approach, some uncertainty nevertheless is involved. Using the COT/CER solution space plots in Fig. 12 as a reference, calibration adjustments resulting in SWIR reflectances that are darker than they should be yield larger CER retrievals, and conversely adjustments resulting in SWIR reflectances that are too bright yield smaller CER retrievals. The CER retrievals from the additional 2.x µm channels in Fig. 11 thus might imply that those channels remain too bright due to underestimated calibration adjustments, though this is difficult to say with any certainty. Nevertheless, given the nature of airborne imager calibration, which for eMAS involves multi-sensor intercomparisons with relatively large uncertainties compared to laboratory or satellite on-orbit methodologies, calibration cannot be ruled out as a contributor.
5.2 Above-cloud gaseous absorption corrections
While the spectral channels used for cloud optical property retrievals notionally are “window” channels and indeed their locations are selected outside of absorption bands to minimize signal attenuation, no spectral channel enjoys a perfectly transparent atmosphere. For the SWIR channels used here, the absorption by three atmospheric constituents must be estimated and corrected for to obtain the top-of-cloud reflectance – water vapor for all channels, a CO2 absorption band near 1.6 µm, and methane (CH4) at wavelengths around 2.2 µm and longer. Errors in this atmospheric correction can arise from errors in the atmospheric profiles of the above constituents, from errors in cloud-top height retrievals that are used to define the above-cloud atmospheric column, or (to a lesser extent) from errors in the forward RT models used to compute atmospheric transmittance. The atmospheric corrections for the eMAS and GSFC RSP spectral retrievals are done via a MODTRAN-computed above-cloud transmittance LUT coupled with co-located atmospheric profiles from meteorological reanalysis data (Wind et al., 2020). We have evaluated the MODTRAN-based LUT approach against rigorous line-by-line calculations (LBLRTM; Clough et al., 1992) for the comparison case studies in Sect. 4.2 and found good agreement between the two (results not shown), suggesting that the LUT approach is not an important source of retrieval error. Moreover, a sensitivity study (also not shown) using line-by-line calculations and doubled concentrations of CO2 and CH4 showed only small changes in above-cloud transmittance in the affected SWIR channels, thus implying only small impacts on spectral CER retrievals for more reasonable CO2 and CH4 concentration errors. For water vapor, on the other hand, which is the primary absorber across much of the SWIR, doubling its concentration in the two case studies in Sect. 4.2 yields decreased CER for all SWIR channels except 1.62 µm, as shown in Fig. 22. The biggest impacts are on retrievals from the 2.13 and 2.18 µm channels, with CER decreases of roughly 0.4–0.5 µm and 0.7 µm, respectively, for both case studies; impacts on CER retrievals from the other SWIR channels are roughly 0.3 µm or less. These CER decreases are on the order of the impacts of the CEV and refractive index assumption changes shown in Sect. 4.2. However, assuming that a doubling of the concentration is a likely overestimate of the water vapor error, the resulting spectral CER retrieval errors can be expected to be smaller. Furthermore, the likelihood, sign, and magnitude of any such water vapor concentration errors cannot be quantified in practice such that it is difficult to determine the exact impacts on spectral CER retrievals for any given case study.
5.3 Forward RT model assumptions
Exposing retrieval methodologies to new information content, such as new spectral channels, often reveals deficiencies in forward models and key assumptions. Such was the case for our previous experience extending MODIS cloud optical property retrieval algorithms to VIIRS for climate data record continuity, where large disagreement between CER retrievals from the MODIS 2.13 µm channel and the VIIRS 2.25 µm channel indicated an inadequate complex refractive index dataset for liquid water in the SWIR. An updated assumption on the imaginary index of refraction of liquid water using a dataset from more modern laboratory measurements made at 265 K (Kou et al., 1993) improved agreement in these retrievals (Platnick et al., 2020, 2021). For this analysis, in addition to the DSD CEV assumption discussed above, we also investigated the use of these alternate assumptions about the imaginary index of refraction of liquid water. While the 265 K measurements from the Kou et al. (1993) dataset were chosen for the global application of the MODIS and VIIRS retrievals, that dataset also includes measurements at 295 K that are more appropriate for the stratocumulus clouds in the ORACLES region that, being located in the boundary layer, have warm cloud tops. This 295 K refractive index assumption did improve agreement amongst the SWIR retrievals in the comparison case studies in Sect. 4.2 when used alone, particularly for the 10.5° E Ramp case (Fig. 15) but with only small impacts on the 9° E Sawtooth case (Fig. 11). Coupling it with the CEV = 0.02 assumption appears to yield further improvement in the 10.5° E Ramp case. These results are encouraging and merit further investigation, though the variability of the spectral retrievals still does not approach that expected from the co-located in situ cloud probes.
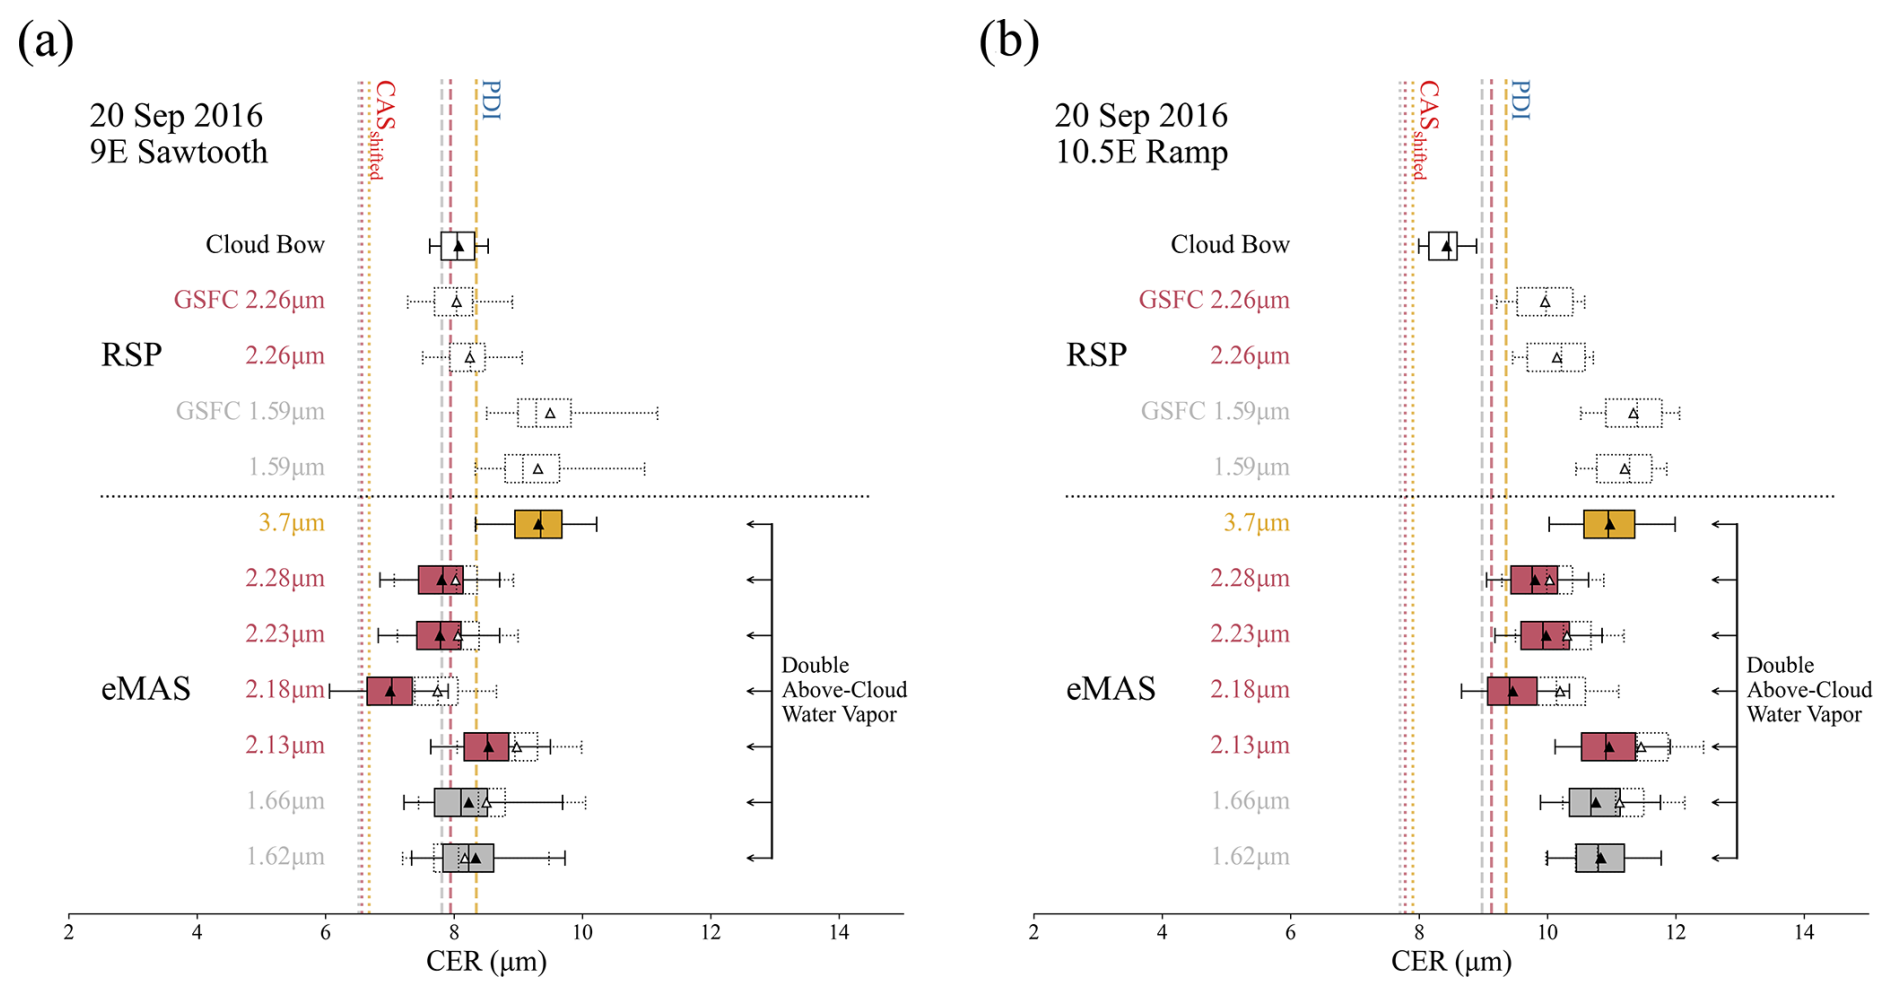
Figure 22The impacts on eMAS spectral CER retrievals due to doubling the above-cloud water vapor concentration in the atmospheric correction calculations. The dotted box/whiskers denote the baseline retrieval statistics shown in Figs. 11a and 15a. For all SWIR channels except 1.62 µm, such a doubling yields larger water vapor absorption (lower transmittance), larger atmospherically corrected cloud-top reflectance, and ultimately smaller retrieved CER.
5.4 Probe datasets
To complicate matters further, the in situ cloud probe measurements, used by numerous studies as a “ground truth” for evaluating imager retrievals of CER and attributing retrieval biases, also do not agree, with CER derived from PDI DSDs being 1.3–1.6 µm larger and CEV roughly 50 %–60 % smaller than those derived from CAS/2D-S for the case studies shown here (see Tables 2 and 3). Previous studies have noted similar or larger differences between different probes (or similar probes on different platforms) in the context of remote sensing CER retrieval evaluation (Platnick and Valero, 1995; King et al., 2013; Witte et al., 2018). While some of these studies attribute such differences in part to errors associated with the probe measurements themselves (Witte et al., 2018), in general the errors and uncertainties of cloud probe DSD measurements are perhaps underappreciated. Propagating the stated bin-level sizing uncertainties for both PDI and CAS/2D-S (±0.5 µm) for the two case studies shown in Sect. 4.2 indicates that derived layer 1σ CER uncertainties are on the order of ±1 µm for both probes at the top of the cloud, as shown in Fig. 23a. These uncertainties are on the order of the CER differences between the probes as well as the spectral retrieval differences shown in the case study comparisons in Figs. 11 and 15. In addition, the bin size adjustment applied to CAS, derived from the King LWC constraint, yields derived CER increases of 1 µm or more (see Figs. 10a, 14a). This again is on the order of, or exceeds, the spectral retrieval differences. While diagnosing the exact mechanisms behind the observed probe differences in this campaign is beyond the scope of this investigation, a separate investigation is likely of interest to the community.
Moreover, the representativeness of the probe data with respect to the broader FOV of the remote sensing instruments is inherently dictated by the sampling strategies within the cloud, the footprint of the remote sensing instrument, and the heterogeneity of the scene. Such potential sampling biases are demonstrated in Fig. 23b and c using the PDI CER from the 9° E Sawtooth case in Fig. 10. In Fig. 23b, the P-3 altitude during the entire sawtooth maneuver is plotted in blue, with a single ramp of the sawtooth highlighted in gray. CER from both the entire sawtooth (blue symbols) and the single ramp (gray symbols) are plotted in Fig. 23c where, as in Fig. 10a, circles represent the 1 s observations and triangles represent the observations aggregated to 10 m vertical levels. The layer CER from the single ramp profile (gray triangles) is relatively consistent with the layer CER from the entire sawtooth (blue triangles) in the middle of the cloud, though near cloud top where the spectral retrievals have their sensitivity the two profiles have a difference of 0.5 µm or more. These differences at the top of the cloud yield larger expected spectral CER from the single profile (computed again using the weighting function methodology in Sect. 2.4) than from the full Sawtooth, roughly 0.25-0.26 µm larger for the 1.6x and 2.x µm channels and roughly 0.4 µm larger for the 3.7 µm channel. While these differences for this case are within the uncertainty of the PDI observations, the clouds sampled here are more spatially homogeneous than most clouds globally, and these results likely cannot be extrapolated beyond this scene – e.g., to the 10.5° E Ramp case in Figs. 13–15 and Table 3. In any event, probe sampling biases with respect to the remote sensing FOV that may exist in any specific case study in practice cannot be quantified. Thus, taken collectively, the uncertainties and errors of the probe DSD measurements themselves and potential sampling biases within a given instrument FOV suggest that, while in situ cloud probes are useful tools for understanding and evaluating remote sensing retrievals of CER, using probes as an unambiguous truth for CER retrieval validation is challenging.
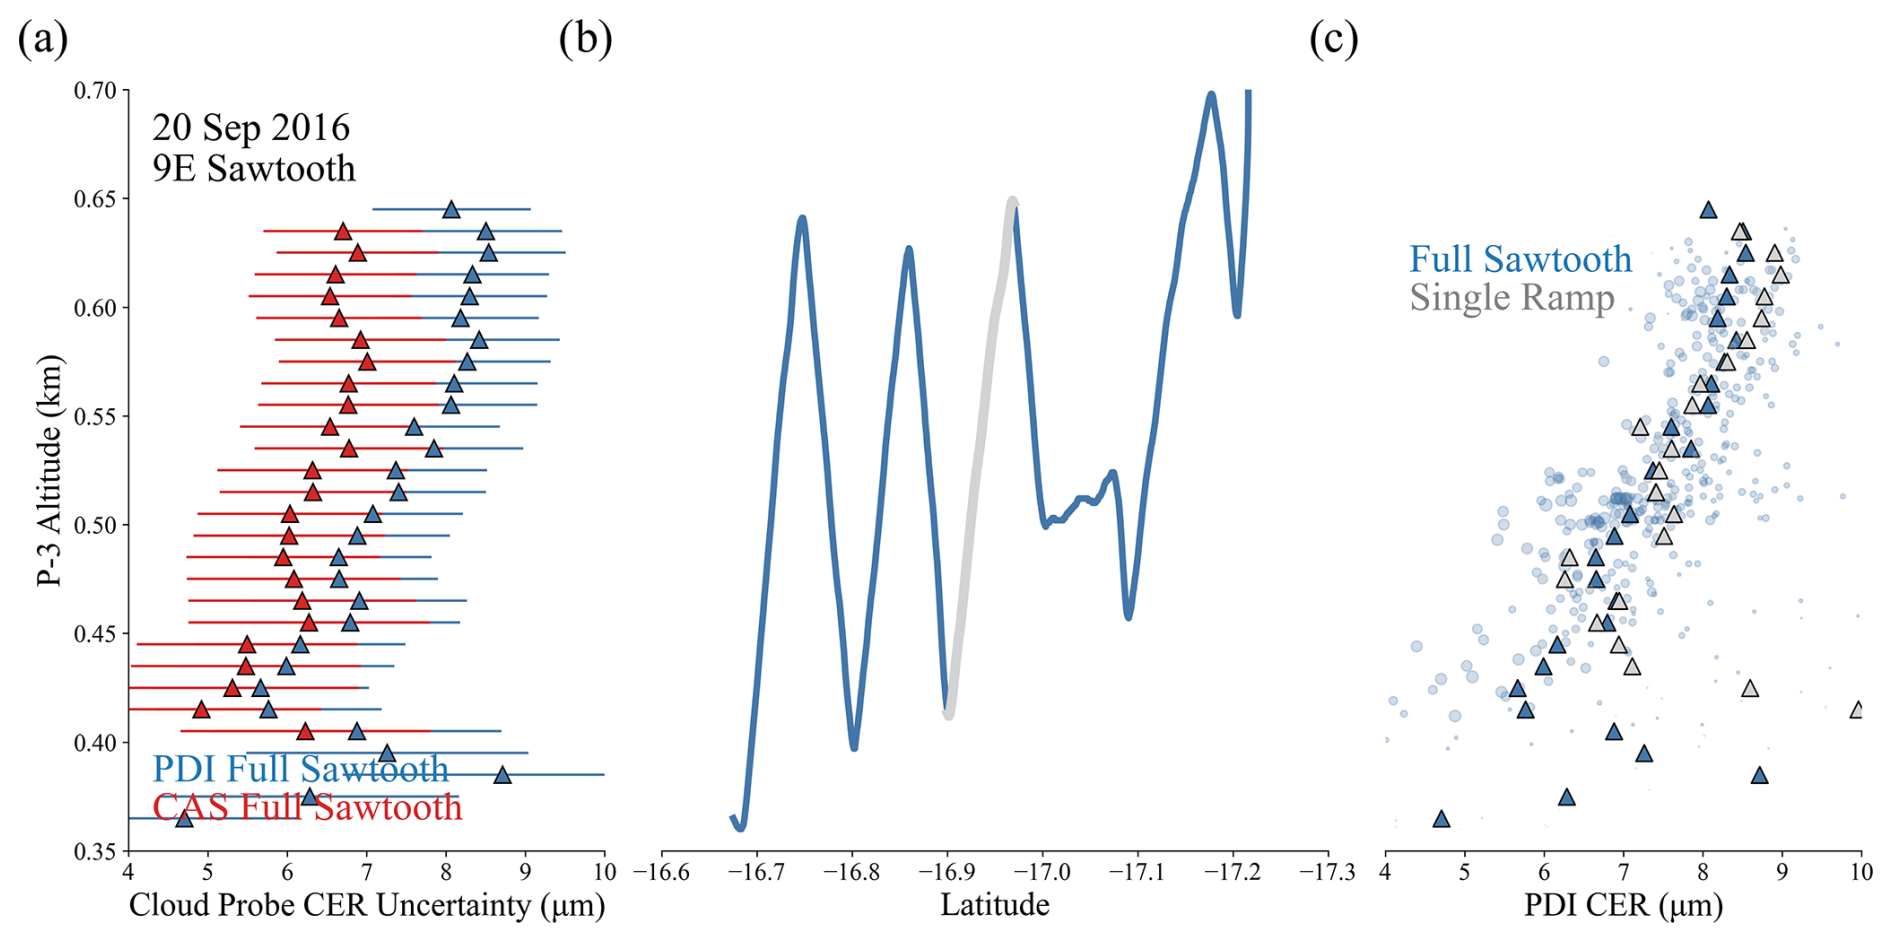
Figure 23Cloud probe CER uncertainties and potential sampling biases using the 9° E Sawtooth case in Sect. 4.2 (see Figs. 9–11). (a) Uncertainties in the 10 m layer CER derived from the PDI (blue) and CAS/2D-S (red) DSDs, computed by propagating a ±0.5 µm droplet-sizing uncertainty. (b) P-3 flight track (altitude) for the 9° E Sawtooth, where a single ramp segment is highlighted in gray. (c) CER derived from PDI DSDs when using the single ramp segment (gray) versus using the entire Sawtooth maneuver (blue), highlighting potential biases resulting from how the cloud is sampled.
5.5 Guidance for users
The results of this study and the open questions discussed here serve as a reminder that cloud microphysics remains a difficult observational problem and that additional information content – spectral, polarimetric, in situ, or otherwise – does not always help to clarify. Although spectral and polarimetric observations are complementary, this does not imply that these observations provide similar information on the cloud. They in fact have differing sensitivities and information content, and it is difficult to bridge their respective retrieval spaces using one cloud radiative model. Moreover, the disagreement between the probes used here, as well as the uncertainties and potential sampling biases involved with their use, implies that an objective microphysical truth in many cases may be elusive.
For users of the eMAS ORACLES datasets, the results of this investigation do not alter our advice on spectral CER retrieval usage, namely, to strongly consider the pixel-level retrieval uncertainties that are provided alongside the retrieval datasets when interpreting the spectral retrievals and their differences. It is clear from this and previous studies that CER retrievals using the 1.6x µm channels have larger retrieval uncertainties (see Fig. 4; also see Platnick et al., 2017, and others), are more strongly affected by external factors such as the presence of above-cloud absorbing aerosols (see Figs. 11, 12, and 15), and have higher rates of retrieval failure (Cho et al., 2015), due in large part to a highly non-orthogonal solution space that is more sensitive to spectral reflectance changes in either the VIS/NIR or 1.6x µm channels. These non-orthogonality effects are less significant for the 2.x µm retrievals and are smallest for the 3.7 µm retrievals. CER retrieval uncertainties are also higher for large CER where SWIR/MWIR reflectance becomes less sensitive to particle size. Regardless, for all retrieval channel pairs, CER retrieval uncertainty is a useful, though not perfect, indicator of retrieval confidence.
In this paper, we show results of an evaluation of imager spectral retrievals of liquid cloud effective radius (CER) for marine boundary layer clouds from eMAS against co-located polarimetric retrievals from RSP and multiple in situ cloud probes (CAS/2D-S, PDI) obtained during the 2016 deployment of the NASA ORACLES field campaign. A brief overview of eMAS operations during ORACLES 2016 is also included, as are examples of cloud optical property retrieval imagery. In addition to shortwave spectral channels having heritage with MODIS, including the 1.6 and 2.13 µm SWIR channels and the 3.7 µm MWIR channel having sensitivity to CER, eMAS has additional SWIR spectral channels having similar, though not identical, CER sensitivities that have not been used in previous campaigns for such retrievals. Moreover, on several occasions eMAS observed the backscatter glory region that, having sensitivities similar to the polarized cloud bow, enables inference of CER and the effective variance (CEV) of the droplet size distribution (DSD) of the cloud; CER and CEV results from one of these cases are shown.
The evaluation is focused on two case studies on 20 September 2016 featuring coordination between the ER-2 remote sensing and P-3 in situ aircraft, where the P-3 was sampling within the cloud while the ER-2 flew overhead. For the first case, i.e., a coordination at 9° E longitude featuring a sawtooth sampling strategy by the P-3 (9° E Sawtooth), the eMAS spectral retrievals agree to within roughly 1 µm with the RSP cloud-bow retrievals. For the second case, i.e., a coordination at 10.5° E longitude featuring a ramp maneuver through the cloud by the P-3 (10.5° E Ramp), there is strong disagreement amongst the retrievals, with the spectral retrievals being 1–3 µm larger than the RSP cloud-bow retrievals. In both cases, the in situ probes also disagreed on CER by over 1 µm, with PDI observing larger CER than CAS/2D-S. Alternate spectral retrieval assumptions were explored for both cases, namely, an updated complex index of refraction dataset for liquid water in the SWIR and assumptions about the DSD CEV that are closer to the CEV retrieved by RSP polarimetry. For the 9° E Sawtooth case where good initial agreement was seen, the alternate retrieval assumptions, particularly on CEV, negatively affected retrieval agreement (see Fig. 11), though the opposite effect is found when accounting for above-cloud absorbing aerosol impacts that can increase the CER retrievals due to the non-orthogonality of the COT/CER solution space. On the other hand, for the 10.5° E Ramp case where the spectral and polarimetric retrievals strongly disagreed initially, the spectral retrievals are brought into closer agreement with RSP polarimetry and PDI using the combination of the updated CEV and refractive index assumptions.
The glory analysis focused on a single case obtained on 14 September 2016. For this case, the eMAS spectral CER retrievals were generally larger than those retrieved from RSP polarimetry. However, matching forward-modeled SWIR and MWIR reflectance across the glory, computed for various combinations of CER and CEV, to the observed reflectance implied smaller CER, closer to the polarimetric retrievals, and CEV also closer to the polarimetric retrievals (and smaller than the heritage CEV = 0.1 assumption). Using CEV roughly consistent with these retrieved values yields smaller spectral CER and better agreement with the polarimetry.
The standard eMAS Level-1B (https://doi.org/10.5067/EMAS/EMASL1B.001, NASA, 2000a) geolocation/calibrated radiance and Level-2 (https://doi.org/10.5067/EMAS/EMASL2CLD.001, NASA, 2020b) cloud products are publicly archived at the Level-1 and Atmosphere Archive and Distribution System (LAADS) Distributed Active Archive Center (DAAC) hosted at NASA’s Goddard Space Flight Center (GSFC). The RSP polarimetric and spectral cloud products from the NASA Goddard Institute for Space Studies (GISS) team can be found at https://data.giss.nasa.gov/pub/rsp/data/ORACLES-2016/L2CLD/ (Cairns, 2025). NASA ORACLES 2016 P-3 data, including the merged dataset products and the merged microphysics products used in this paper, can be found at https://espoarchive.nasa.gov/archive/browse/oracles/P3/Microphysics (Poellot, 2025); the ER-2 data, including the platform housekeeping files used in this paper, can be found at https://espoarchive.nasa.gov/archive/browse/oracles/ER2/Hskping (Martin, 2025).
KM designed and performed the scientific analysis and led the preparation of the manuscript with contributions from all authors. SP and DM provided extensive guidance and insight into the scientific analysis. GTA processed all eMAS cloud retrievals along with the GSFC RSP retrievals. NA provided the RT calculations and other supporting analyses. JS-G and MW provided guidance on the use and interpretation of PDI data. BC provided guidance on the use and interpretation of RSP data. SG, GM, and JOB provided guidance on the use and interpretation of CAS/2D-S data and the ORACLES microphysics datasets.
The contact author has declared that none of the authors has any competing interests.
Publisher’s note: Copernicus Publications remains neutral with regard to jurisdictional claims made in the text, published maps, institutional affiliations, or any other geographical representation in this paper. While Copernicus Publications makes every effort to include appropriate place names, the final responsibility lies with the authors.
This article is part of the special issue “New observations and related modelling studies of the aerosol–cloud–climate system in the Southeast Atlantic and southern Africa regions (ACP/AMT inter-journal SI)”. It is not associated with a conference.
The authors are extremely grateful for the technical support for eMAS before, during, and after ORACLES 2016 that was provided by the Airborne Sensor Facility (ASF) at NASA Ames Research Center (ARC), in particular contributions by Rose Dominguez, Ted Hildum, Pat Grant, Kent Dunwoody, Jeff Myers, Tom Ellis, and James Jacobson.
This research has been supported by the National Aeronautics and Space Administration Earth Venture Suborbital program (grant no. NNH13ZDA001N-EVS2) and the Radiation Sciences Program.
This paper was edited by Paquita Zuidema and reviewed by two anonymous referees.
Ackerman, S. A., Holz, R. E., Frey, R., Eloranta, E. W., Maddux, B. C., and McGill, M.: Cloud Detection with MODIS. Part II: Validation, J. Atmos. Ocean. Technol., 25, 1073–1086, https://doi.org/10.1175/2007JTECHA1053.1, 2008.
Adebiyi, A. A., Zuidema, P., Chang, I., Burton, S. P., and Cairns, B.: Mid-level clouds are frequent above the southeast Atlantic stratocumulus clouds, Atmos. Chem. Phys., 20, 11025–11043, https://doi.org/10.5194/acp-20-11025-2020, 2020.
Albrecht, B. A.: Aerosols, Cloud Microphysics, and Fractional Cloudiness, Science, 245, 1227–1230, 1989.
Alexandrov, M. D., Cairns, B., Emde, C., Ackerman, A. S., and Van Diedenhoven, B.: Accuracy assessments of cloud droplet size retrievals from polarized reflectance measurements by the research scanning polarimeter, Remote Sens. Environ., 125, 92–111, https://doi.org/10.1016/j.rse.2012.07.012, 2012.
Alfaro-Contreras, R., Zhang, J., Campbell, J. R., Holz, R. E., and Reid, J. S.: Evaluating the impact of aerosol particles above cloud on cloud optical depth retrievals from MODIS, J. Geophys. Res.-Atmos., 119, 5410–5423, https://doi.org/10.1002/2013JD021270, 2014a.
Alfaro-Contreras, R., Zhang, J., Campbell, J. R., Holz, R. E., and Reid, J. S.: Evaluating the impact of aerosol particles above cloud on cloud optical depth retrievals from MODIS, J. Geophys. Res.-Atmos., 119, 5410–5423, 2014b.
Arnold, G. T., Dominguez, R., Platnick, S., Myers, J., and Meyer, K.: eMAS Solar Reflectance Band Calibration for SEAC4RS, https://asapdata.arc.nasa.gov/emas/data/configs/eMAS_Solar_Reflectance_Band_Calibration_for_SEAC4RS.pdf (last access: 14 February 2025), 2025.
Baum, B. A., Menzel, W. P., Frey, R. A., Tobin, D. C., Holz, R. E., Ackerman, S. A., Heidinger, A. K., and Yang, P.: MODIS Cloud-Top Property Refinements for Collection 6, J. Appl. Meteorol. Climatol., 51, 1145–1163, https://doi.org/10.1175/JAMC-D-11-0203.1, 2012.
Baumgardner, D., Jonsson, H., Dawson, W., O'Connor, D., and Newton, R.: The cloud, aerosol and precipitation spectrometer: a new instrument for cloud investigations, Atmos. Res., 59–60, 251–264, https://doi.org/10.1016/S0169-8095(01)00119-3, 2001.
Benas, N., Meirink, J. F., Stengel, M., and Stammes, P.: Sensitivity of liquid cloud optical thickness and effective radius retrievals to cloud bow and glory conditions using two SEVIRI imagers, Atmos. Meas. Tech., 12, 2863–2879, https://doi.org/10.5194/amt-12-2863-2019, 2019.
Braga, R. C., Rosenfeld, D., Krüger, O. O., Ervens, B., Holanda, B. A., Wendisch, M., Krisna, T., Pöschl, U., Andreae, M. O., Voigt, C., and Pöhlker, M. L.: Linear relationship between effective radius and precipitation water content near the top of convective clouds: measurement results from ACRIDICON–CHUVA campaign, Atmos. Chem. Phys., 21, 14079–14088, https://doi.org/10.5194/acp-21-14079-2021, 2021.
Bréon, F.-M. and Doutriaux-Boucher, M.: A comparison of cloud droplet radii measured from space, IEEE T. Geosci. Remote Sens., 43, 1796–1805, 2005.
Bréon, F.-M. and Goloub, P.: Cloud droplet effective radius from spaceborne polarization measurements, Geophys. Res. Lett., 25, 1879–1882, https://doi.org/10.1029/98GL01221, 1998.
Bruegge, C. J., Arnold, G. T., Czapla-Myers, J., Dominguez, R., Helmlinger, M. C., Thompson, D. R., Bosch, J. V. D., and Wenny, B. N.: Vicarious Calibration of eMAS, AirMSPI, and AVIRIS Sensors During FIREX-AQ, IEEE Trans. Geosci. Remote Sens., 59, 10286–10297, https://doi.org/10.1109/TGRS.2021.3066997, 2021.
Cairns, B.: Research Scanning Polarimeter (RSP) L2 Cloud Product for ORACLES (V004), NASA [data set], https://data.giss.nasa.gov/pub/rsp/data/ORACLES-2016/L2CLD/ (last access: 14 February 2025), 2025.
Cairns, B., Russell, E. E., and Travis, L. D.: Research Scanning Polarimeter: calibration and ground-based measurements, in: Polarization: Measurement, Analysis, and Remote Sensing II, edited by: Goldstein, D. H. and Chenault, D. B., International Society for Optics and Photonics, 186–197, 1999.
Cairns, B., Russell, E. E., LaVeigne, J. D., and Tennant, P. M. W.: Research scanning polarimeter and airborne usage for remote sensing of aerosols, Optical Science and Technology, SPIE's 48th Annual Meeting, San Diego, California, USA, 33, https://doi.org/10.1117/12.518320, 2003.
Chen, Q., Yin, Y., Jin, L., Xiao, H., and Zhu, S.: The effect of aerosol layers on convective cloud microphysics and precipitation, Atmos. Res., 101, 327–340, https://doi.org/10.1016/j.atmosres.2011.03.007, 2011.
Cho, H.-M., Zhang, Z., Meyer, K., Lebsock, M., Platnick, S., Ackerman, A. S., Di Girolamo, L., C.-Labonnote, L., Cornet, C., Riedi, J., and Holz, R. E.: Frequency and causes of failed MODIS cloud property retrievals for liquid phase clouds over global oceans, J. Geophys. Res.-Atmos., 120, 4132–4154, https://doi.org/10.1002/2015JD023161, 2015.
Chuang, P. Y., Saw, E. W., Small, J. D., Shaw, R. A., Sipperley, C. M., Payne, G. A., and Bachalo, W. D.: Airborne Phase Doppler Interferometry for Cloud Microphysical Measurements, Aerosol Sci. Technol., 42, 685–703 https://doi.org/10.1080/02786820802232956, 2008.
Clough, S. A., Iacono, M. J., and Moncet, J.-L.: Line-by-line calculations of atmospheric fluxes and cooling rates: Application to water vapor, J. Geophys. Res.-Atmos., 97, 15761–15785, https://doi.org/10.1029/92JD01419, 1992.
Costantino, L. and Bréon, F.: Analysis of aerosol-cloud interaction from multi-sensor satellite observations, Geophys. Res. Lett., 37, 2009GL041828, https://doi.org/10.1029/2009GL041828, 2010.
Costantino, L. and Bréon, F.-M.: Aerosol indirect effect on warm clouds over South-East Atlantic, from co-located MODIS and CALIPSO observations, Atmos. Chem. Phys., 13, 69–88, https://doi.org/10.5194/acp-13-69-2013, 2013.
De Graaf, M., Tilstra, L. G., Wang, P., and Stammes, P.: Retrieval of the aerosol direct radiative effect over clouds from spaceborne spectrometry, J. Geophys. Res., 117, 2011JD017160, https://doi.org/10.1029/2011JD017160, 2012.
Devasthale, A. and Thomas, M. A.: A global survey of aerosol-liquid water cloud overlap based on four years of CALIPSO-CALIOP data, Atmos. Chem. Phys., 11, 1143–1154, https://doi.org/10.5194/acp-11-1143-2011, 2011.
Downing, H. D. and Williams, D.: Optical constants of water in the infrared, J. Geophys. Res.-Atmos. (1984–2012), 80, 1656–1661, https://doi.org/10.1029/JC080i012p01656, 1975.
Dufresne, J.-L. and Bony, S.: An assessment of the primary sources of spread of global warming estimates from coupled atmosphere-ocean models, J. Climate, 21, 5135–5144, https://doi.org/10.1175/2008JCLI2239.1, 2008.
Dunagan, S. E., Johnson, R., Zavaleta, J., Russell, P. B., Schmid, B., Flynn, C., Redemann, J., Shinozuka, Y., Livingston, J., and Segal-Rosenhaimer, M.: Spectrometer for Sky-Scanning Sun-Tracking Atmospheric Research (4STAR): Instrument Technology, Remote Sens., 5, 3872–3895, https://doi.org/10.3390/rs5083872, 2013.
Ellis, T. A., Myers, J., Grant, P., Platnick, S., Guerin, D. C., Fisher, J., Song, K., Kimchi, J., Kilmer, L., LaPorte, D. D., and Moeller, C. C.: The NASA enhanced MODIS airborne simulator, in: Earth Observing Systems XVI, Earth Observing Systems XVI, 234–242, https://doi.org/10.1117/12.894482, 2011.
Frey, R. A., Ackerman, S. A., Liu, Y., Strabala, K. I., Zhang, H., Key, J. R., and Wang, X.: Cloud Detection with MODIS. Part I: Improvements in the MODIS Cloud Mask for Collection 5, J. Atmos. Ocean. Technol., 25, 1057–1072, https://doi.org/10.1175/2008JTECHA1052.1, 2008.
Frey, R. A., Ackerman, S. A., Holz, R. E., Dutcher, S., and Griffith, Z.: The continuity MODIS-VIIRS cloud mask, Remote Sens., 12, 3334, https://doi.org/10.3390/rs12203334, 2020.
Grosvenor, D. P., Sourdeval, O., Zuidema, P., Ackerman, A., Alexandrov, M. D., Bennartz, R., Boers, R., Cairns, B., Chiu, J. C., Christensen, M., Deneke, H., Diamond, M., Feingold, G., Fridlind, A., Hünerbein, A., Knist, C., Kollias, P., Marshak, A., McCoy, D., Merk, D., Painemal, D., Rausch, J., Rosenfeld, D., Russchenberg, H., Seifert, P., Sinclair, K., Stier, P., van Diedenhoven, B., Wendisch, M., Werner, F., Wood, R., Zhang, Z., and Quaas, J.: Remote sensing of droplet number concentration in warm clouds: A review of the current state of knowledge and perspectives, Rev. Geophys., 56, 409–453, https://doi.org/10.1029/2017RG000593, 2018.
Gupta, S., McFarquhar, G. M., O'Brien, J. R., Delene, D. J., Poellot, M. R., Dobracki, A., Podolske, J. R., Redemann, J., LeBlanc, S. E., Segal-Rozenhaimer, M., and Pistone, K.: Impact of the variability in vertical separation between biomass burning aerosols and marine stratocumulus on cloud microphysical properties over the Southeast Atlantic, Atmos. Chem. Phys., 21, 4615–4635, https://doi.org/10.5194/acp-21-4615-2021, 2021.
Gupta, S., McFarquhar, G. M., O'Brien, J. R., Poellot, M. R., Delene, D. J., Miller, R. M., and Small Griswold, J. D.: Factors affecting precipitation formation and precipitation susceptibility of marine stratocumulus with variable above- and below-cloud aerosol concentrations over the Southeast Atlantic, Atmos. Chem. Phys., 22, 2769–2793, https://doi.org/10.5194/acp-22-2769-2022, 2022a.
Gupta, S., McFarquhar, G. M., O'Brien, J. R., Poellot, M. R., Delene, D. J., Chang, I., Gao, L., Xu, F., and Redemann, J.: In situ and satellite-based estimates of cloud properties and aerosol–cloud interactions over the southeast Atlantic Ocean, Atmos. Chem. Phys., 22, 12923–12943, https://doi.org/10.5194/acp-22-12923-2022, 2022b.
Hair, J. W., Hostetler, C. A., Cook, A. L., Harper, D. B., Ferrare, R. A., Mack, T. L., Welch, W., Izquierdo, L. R., and Hovis, F. E.: Airborne High Spectral Resolution Lidar for profiling aerosol optical properties, Appl. Opt., 47, 6734–6752, https://doi.org/10.1364/AO.47.006734, 2008.
Hale, G. M. and Querry, M. R.: Optical constants of water in the 200-nm to 200-µm wavelength region, Appl. Opt., 12, 555–563, https://doi.org/10.1364/AO.12.000555, 1973.
Hansen, J. E. and Travis, L. D.: Light scattering in planetary atmospheres, Space Sci. Rev., 16, 527–610, https://doi.org/10.1007/BF00168069, 1974.
Haywood, J. M., Osborne, S. R., and Abel, S. J.: The effect of overlying absorbing aerosol layers on remote sensing retrievals of cloud effective radius and cloud optical depth, Q. J. Roy. Meteorol. Soc., 130, 779–800, 2004.
Heidinger, A. K. and Pavolonis, M. J.: Gazing at Cirrus Clouds for 25 Years through a Split Window. Part I: Methodology, J. Appl. Meteorol. Climatol., 48, 1100–1116, 2009.
Heidinger, A. K., Foster, M. J., Walther, A., and Zhao, X. T.: The Pathfinder Atmospheres–Extended AVHRR climate dataset, B. Am. Meteorol. Soc., 909–922, https://doi.org/10.1175/BAMS-D-12-00246.1, 2014.
Hook, S. J., Myers, J. J., Thome, K. J., Fitzgerald, M., and Kahle, A. B.: The MODIS/ASTER airborne simulator (MASTER) – a new instrument for earth science studies, Remote Sens. Environ., 76, 93–102, https://doi.org/10.1016/S0034-4257(00)00195-4, 2001.
Jethva, H., Torres, O., Remer, L. A., and Bhartia, P. K.: A Color Ratio Method for Simultaneous Retrieval of Aerosol and Cloud Optical Thickness of Above-Cloud Absorbing Aerosols From Passive Sensors: Application to MODIS Measurements, IEEE T. Geosci. Remote Sens., 51, 3862–3870, 2013.
Khare, V. and Nussenzveig, H. M.: Theory of the Glory, Phys. Rev. Lett., 38, 1279–1282, https://doi.org/10.1103/PhysRevLett.38.1279, 1977.
King, M. D., Menzel, W. P., Grant, P. S., Myers, J. S., Arnold, G. T., Platnick, S. E., Gumley, L. E., Tsay, S.-C., Moeller, C. C., Fitzgerald, M., Brown, K. S., and Osterwisch, F. G.: Airborne Scanning Spectrometer for Remote Sensing of Cloud, Aerosol, Water Vapor, and Surface Properties, J. Atmos. Ocean. Technol., 13, 777–794, https://doi.org/10.1175/1520-0426(1996)013<0777:ASSFRS>2.0.CO;2, 1996.
King, M. D., Platnick, S., Yang, P., Arnold, G. T., Gray, M. A., Riedi, J. C., Ackerman, S. A., and Liou, K.-N.: Remote Sensing of Liquid Water and Ice Cloud Optical Thickness and Effective Radius in the Arctic: Application of Airborne Multispectral MAS Data, J. Atmos. Ocean. Technol., 21, 857–875, https://doi.org/10.1175/1520-0426(2004)021<0857:RSOLWA>2.0.CO;2, 2004.
King, M. D., Platnick, S., Wind, G., Arnold, G. T., and Dominguez, R. T.: Remote sensing of radiative and microphysical properties of clouds during TC 4: Results from MAS, MASTER, MODIS, and MISR, J. Geophys. Res., 115, D00J07, https://doi.org/10.1029/2009JD013277, 2010.
King, N. J., Bower, K. N., Crosier, J., and Crawford, I.: Evaluating MODIS cloud retrievals with in situ observations from VOCALS-REx, Atmos. Chem. Phys., 13, 191–209, https://doi.org/10.5194/acp-13-191-2013, 2013.
King, W. D., Parkin, D. A., and Handsworth, R. J.: A Hot-Wire Liquid Water Device Having Fully Calculable Response Characteristics, J. Appl. Meteor., 17, 1809–1813, https://doi.org/10.1175/1520-0450(1978)017<1809:AHWLWD>2.0.CO;2, 1978.
Koren, I., Kostinski, A., Wollner, U., and Dubrovin, D.: Faint yet widespread glories reflect microphysics of marine clouds, npj Clim. Atmos. Sci., 5, 87, https://doi.org/10.1038/s41612-022-00312-z, 2022.
Kou, L., Labrie, D., and Chylek, P.: Refractive-indexes of water and ice in the 0.65- to 2.5- µm spectral range, Appl. Opt., 32, 3531–3540, 1993.
Lance, S., Brock, C. A., Rogers, D., and Gordon, J. A.: Water droplet calibration of the Cloud Droplet Probe (CDP) and in-flight performance in liquid, ice and mixed-phase clouds during ARCPAC, Atmos. Meas. Tech., 3, 1683–1706, https://doi.org/10.5194/amt-3-1683-2010, 2010.
Lawson, R. P., Stewart, R. E., and Angus, L. J.: Observations and Numerical Simulations of the Origin and Development of Very Large Snowflakes, J. Atmos. Sci., 55, 3209–3229, https://doi.org/10.1175/1520-0469(1998)055<3209:OANSOT>2.0.CO;2, 1998.
Lawson, R. P., O'Connor, D., Zmarzly, P., Weaver, K., Baker, B., Mo, Q., and Jonsson, H.: The 2D-S (Stereo) Probe: Design and Preliminary Tests of a New Airborne, High-Speed, High-Resolution Particle Imaging Probe, https://doi.org/10.1175/JTECH1927.1, 2006.
Marshak, A., Platnick, S., Várnai, T., Wen, G., and Cahalan, R. F.: Impact of three-dimensional radiative effects on satellite retrievals of cloud droplet sizes, J. Geophys. Res., 111, 2005JD006686, https://doi.org/10.1029/2005JD006686, 2006.
Martin, Y.: ORACLES ER-2 Housekeeping Data (R1), NASA [data set], https://espoarchive.nasa.gov/archive/browse/oracles/ER2/Hskping (last access: 14 February 2025), 2025.
Martins, J. A., Silva Dias, M. a. F., and Gonçalves, F. L. T.: Impact of biomass burning aerosols on precipitation in the Amazon: A modeling case study, J. Geophys. Res.-Atmos., 114, D02207, https://doi.org/10.1029/2007JD009587, 2009.
Mayer, B., Schröder, M., Preusker, R., and Schüller, L.: Remote sensing of water cloud droplet size distributions using the backscatter glory: a case study, Atmos. Chem. Phys., 4, 1255–1263, https://doi.org/10.5194/acp-4-1255-2004, 2004.
Menzel, W. P., Frey, R. A., Zhang, H., Wylie, D. P., Moeller, C. C., Holz, R. E., Maddux, B., Baum, B. A., Strabala, K. I., and Gumley, L. E.: MODIS Global Cloud-Top Pressure and Amount Estimation: Algorithm Description and Results, J. Appl. Meteorol. Climatol., 47, 1175–1198, https://doi.org/10.1175/2007JAMC1705.1, 2008.
Meyer, K., Platnick, S., Oreopoulos, L., and Lee, D.: Estimating the direct radiative effect of absorbing aerosols overlying marine boundary layer clouds in the southeast Atlantic using MODIS and CALIOP, J. Geophys. Res.-Atmos., 118, 4801–4815, 2013.
Meyer, K., Platnick, S., and Zhang, Z.: Simultaneously inferring above-cloud absorbing aerosol optical thickness and underlying liquid phase cloud optical and microphysical properties using MODIS, J. Geophys. Res.-Atmos., 120, 5524–5547, https://doi.org/10.1002/2015JD023128, 2015.
Meyer, K., Platnick, S., Arnold, G. T., Holz, R. E., Veglio, P., Yorks, J., and Wang, C.: Cirrus cloud optical and microphysical property retrievals from eMAS during SEAC4RS using bi-spectral reflectance measurements within the 1.88 µm water vapor absorption band, Atmos. Meas. Tech., 9, 1743–1753, https://doi.org/10.5194/amt-9-1743-2016, 2016.
Miller, D. J., Zhang, Z., Ackerman, A. S., Platnick, S., and Baum, B. A.: The impact of cloud vertical profile on liquid water path retrieval based on the bi-spectral method: A theoretical study based on large-eddy simulations of shallow marine boundary-layer clouds, J. Geophys. Res.-Atmos., 121, 4122–4141, https://doi.org/10.1002/2015JD024322, 2016.
Miller, D. J., Zhang, Z., Platnick, S., Ackerman, A. S., Werner, F., Cornet, C., and Knobelspiesse, K.: Comparisons of bispectral and polarimetric retrievals of marine boundary layer cloud microphysics: case studies using a LES–satellite retrieval simulator, Atmos. Meas. Tech., 11, 3689–3715, https://doi.org/10.5194/amt-11-3689-2018, 2018.
Min, Q., Joseph, E., Lin, Y., Min, L., Yin, B., Daum, P. H., Kleinman, L. I., Wang, J., and Lee, Y.-N.: Comparison of MODIS cloud microphysical properties with in-situ measurements over the Southeast Pacific, Atmos. Chem. Phys., 12, 11261–11273, https://doi.org/10.5194/acp-12-11261-2012, 2012.
Minnis, P., Sun-Mack, S., Chen, Y., Chang, F.-L., Yost, C. R., Smith, W. L., Heck, P. W., Arduini, R. F., Bedka, S. T., Yi, Y., Hong, G., Jin, Z., Painemal, D., Palikonda, R., Scarino, B. R., Spangenberg, D. A., Smith, R. A., Trepte, Q. Z., Yang, P., and Xie, Y.: CERES MODIS Cloud Product Retrievals for Edition 4 – Part I: Algorithm Changes, IEEE Trans. Geosci. Remote Sensing, 59, 2744–2780, https://doi.org/10.1109/TGRS.2020.3008866, 2021.
Nakajima, T. and King, M. D.: Determination of the optical-thickness and effective particle radius of clouds from reflected solar-radiation measurements .1., Theory, 47, 1878–1893, https://doi.org/10.1175/1520-0469(1990)047<1878:DOTOTA>2.0.CO;2, 1990.
Nakajima, T., King, M. D., SPINHIRNE, J. D., and RADKE, L. F.: Determination of the Optical-Thickness and Effective Particle Radius of Clouds From Reflected Solar-Radiation Measurements .2., Marine Stratocumulus Observations, 48, 728–750, 1991.
NASA: Enhanced MODIS Airborne Simulator (eMAS) Level-1B Calibrated and Geolocated Radiances for ORACLES (V02), NASA [data set], https://doi.org/10.5067/EMAS/EMASL1B.001, 2020a.
NASA: Enhanced MODIS Airborne Simulator (eMAS) Level-2 Cloud Products for ORACLES (eMASL2CLD) (V1.0), NASA [data set], https://doi.org/10.5067/EMAS/EMASL2CLD.001, 2020b.
Noble, S. R. and Hudson, J. G.: MODIS comparisons with northeastern Pacific in situ stratocumulus microphysics, J. Geophys. Res.-Atmos., 120, 8332–8344, https://doi.org/10.1002/2014JD022785, 2015.
O'Brien, J., Gupta, S., McFarquhar, G., Poellot, M. R., Delene, D. J., and Small Griswold, J. D.: Combined Cloud Microphysics Data Set for ORACLES, https://espo.nasa.gov/sites/default/files/archive_docs/ORACLES_Microphysics_Dataset_Readme_0.pdf (last access: 14 February 2025), 2025.
Oreopoulos, L. and Platnick, S.: Radiative susceptibility of cloudy atmospheres to droplet number perturbations: 2. Global analysis from MODIS, J. Geophys. Res., 113, D14S21, https://doi.org/10.1029/2007JD009655, 2008.
Painemal, D. and Zuidema, P.: Assessment of MODIS cloud effective radius and optical thickness retrievals over the Southeast Pacific with VOCALS-REx in situ measurements, J. Geophys. Res.-Atmos., 116, D24206, https://doi.org/10.1029/2011JD016155, 2011.
Palmer, K. F. and Williams, D.: Optical-properties of water in near-infrared, J. Opt. Soc. Am., 64, 1107–1110, https://doi.org/10.1364/JOSA.64.001107, 1974.
Pistone, K., Redemann, J., Doherty, S., Zuidema, P., Burton, S., Cairns, B., Cochrane, S., Ferrare, R., Flynn, C., Freitag, S., Howell, S. G., Kacenelenbogen, M., LeBlanc, S., Liu, X., Schmidt, K. S., Sedlacek III, A. J., Segal-Rozenhaimer, M., Shinozuka, Y., Stamnes, S., van Diedenhoven, B., Van Harten, G., and Xu, F.: Intercomparison of biomass burning aerosol optical properties from in situ and remote-sensing instruments in ORACLES-2016, Atmos. Chem. Phys., 19, 9181–9208, https://doi.org/10.5194/acp-19-9181-2019, 2019.
Platnick, S.: Vertical photon transport in cloud remote sensing problems, J. Geophys. Res.-Atmos., 105, 22919–22935, 2000.
Platnick, S. and Oreopoulos, L.: Radiative susceptibility of cloudy atmospheres to droplet number perturbations: 1. Theoretical analysis and examples from MODIS, J. Geophys. Res., 113, D14S20, https://doi.org/10.1029/2007JD009654, 2008.
Platnick, S. and Valero, F. P. J.: A Validation of a Satellite Cloud Retrieval during ASTEX, J. Atmos. Sci., 52, 2985–3001, https://doi.org/10.1175/1520-0469(1995)052<2985:AVOASC>2.0.CO;2, 1995.
Platnick, S., Meyer, K. G., King, M. D., Wind, G., Amarasinghe, N., Marchant, B., Arnold, G. T., Zhang, Z., Hubanks, P. A., Holz, R. E., Yang, P., Ridgway, W. L., and Riedi, J.: The MODIS cloud optical and microphysical products: Collection 6 updates and examples from Terra and Aqua, IEEE T. Geosci. Remote Sens., 55, 502–525, https://doi.org/10.1109/TGRS.2016.2610522, 2017.
Platnick, S., Meyer, K. G., Amarasinghe, N., Wind, G., Hubanks, P. A., and Holz, R. E.: Sensitivity of Multispectral Imager Liquid Water Cloud Microphysical Retrievals to the Index of Refraction, Remote Sens., 12, 4165, https://doi.org/10.3390/rs12244165, 2020.
Platnick, S., Meyer, K., Wind, G., Holz, R., Amarasinghe, N., Hubanks, P. A., Marchant, B., Dutcher, S., and Veglio, P.: The NASA MODIS-VIIRS continuity cloud optical properties products, Remote Sens., 13, 2, https://doi.org/10.3390/rs13010002, 2021.
Poellot, M. R.: ORACLES P-3 Orion Microphysics Files (R0), NASA [data set], https://espoarchive.nasa.gov/archive/browse/oracles/P3/Microphysics (last access: 14 February 2025), 2025.
Redemann, J., Wood, R., Zuidema, P., Doherty, S. J., Luna, B., LeBlanc, S. E., Diamond, M. S., Shinozuka, Y., Chang, I. Y., Ueyama, R., Pfister, L., Ryoo, J.-M., Dobracki, A. N., da Silva, A. M., Longo, K. M., Kacenelenbogen, M. S., Flynn, C. J., Pistone, K., Knox, N. M., Piketh, S. J., Haywood, J. M., Formenti, P., Mallet, M., Stier, P., Ackerman, A. S., Bauer, S. E., Fridlind, A. M., Carmichael, G. R., Saide, P. E., Ferrada, G. A., Howell, S. G., Freitag, S., Cairns, B., Holben, B. N., Knobelspiesse, K. D., Tanelli, S., L'Ecuyer, T. S., Dzambo, A. M., Sy, O. O., McFarquhar, G. M., Poellot, M. R., Gupta, S., O'Brien, J. R., Nenes, A., Kacarab, M., Wong, J. P. S., Small-Griswold, J. D., Thornhill, K. L., Noone, D., Podolske, J. R., Schmidt, K. S., Pilewskie, P., Chen, H., Cochrane, S. P., Sedlacek, A. J., Lang, T. J., Stith, E., Segal-Rozenhaimer, M., Ferrare, R. A., Burton, S. P., Hostetler, C. A., Diner, D. J., Seidel, F. C., Platnick, S. E., Myers, J. S., Meyer, K. G., Spangenberg, D. A., Maring, H., and Gao, L.: An overview of the ORACLES (ObseRvations of Aerosols above CLouds and their intEractionS) project: aerosol–cloud–radiation interactions in the southeast Atlantic basin, Atmos. Chem. Phys., 21, 1507–1563, https://doi.org/10.5194/acp-21-1507-2021, 2021.
Rosenfeld, D., Wang, H., and Rasch, P. J.: The roles of cloud drop effective radius and LWP in determining rain properties in marine stratocumulus, Geophys. Res. Lett., 39, L13801, https://doi.org/10.1029/2012GL052028, 2012.
Segelstein, D. J.: The Complex Refractive Index of Water, University of Missouri-Kansas City, Kansas City, Missouri, 174 pp., https://mospace.umsystem.edu/xmlui/handle/10355/11599 (last access: 24 February 2025), 1981.
Shinozuka, Y.: ORACLES P-3 Orion mrg1 files, MASA, https://espo.nasa.gov/ORACLES/archive/browse/oracles/P3/mrg1 (last access: 14 February 2025), 2025.
Shinozuka, Y., Johnson, R. R., Flynn, C. J., Russell, P. B., Schmid, B., Redemann, J., Dunagan, S. E., Kluzek, C. D., Hubbe, J. M., Segal-Rosenheimer, M., Livingston, J. M., Eck, T. F., Wagener, R., Gregory, L., Chand, D., Berg, L. K., Rogers, R. R., Ferrare, R. A., Hair, J. W., Hostetler, C. A., and Burton, S. P.: Hyperspectral aerosol optical depths from TCAP flights, J. Geophys. Res.-Atmos., 118, 12180–12194, https://doi.org/10.1002/2013JD020596, 2013.
Sinclair, K., van Diedenhoven, B., Cairns, B., Yorks, J., Wasilewski, A., and McGill, M.: Remote sensing of multiple cloud layer heights using multi-angular measurements, Atmos. Meas. Tech., 10, 2361–2375, https://doi.org/10.5194/amt-10-2361-2017, 2017.
Spinhirne, J. D. and Nakajima, T.: Glory of clouds in the near infrared, Appl. Opt., 33, 4652, https://doi.org/10.1364/AO.33.004652, 1994.
Stamnes, K., Tsay, S.-C., Wiscombe, W., and Jayaweera, K.: Numerically stable algorithm for discrete-ordinate-method radiative transfer in multiple scattering and emitting layered media, Appl. Opt., 27, 2502–2509, 1988.
Swap, R. J., Annegarn, H. J., Suttles, J. T., King, M. D., Platnick, S., Privette, J. L., and Scholes, R. J.: Africa burning: A thematic analysis of the Southern African Regional Science Initiative (SAFARI 2000), J. Geophys. Res.-Atmos., 108, 8465, https://doi.org/10.1029/2003JD003747, 2003.
Twomey, S.: Pollution and the planetary albedo, Atmos. Environ., 8, 1251–1256, 1974.
Twomey, S.: The Influence of Pollution on the Shortwave Albedo of Clouds, J. Atmos. Sci., 34, 1149–1152, https://doi.org/10.1175/1520-0469(1977)034<1149:TIOPOT>2.0.CO;2, 1977.
Twomey, S. and Cocks, T.: Spectral reflectance of clouds in the near-infrared – comparison of measurements and calculations, J. Meteorol. Soc. JPN, 60, 583–592, https://doi.org/10.2151/jmsj1965.60.1_583, 1982.
van den Heever, S. C. and Cotton, W. R.: Urban Aerosol Impacts on Downwind Convective Storms, J. Appl. Meteorol. Climatol., 46, 828–850, https://doi.org/10.1175/JAM2492.1, 2007.
van den Heever, S. C., Carrió, G. G., Cotton, W. R., DeMott, P. J., and Prenni, A. J.: Impacts of Nucleating Aerosol on Florida Storms. Part I: Mesoscale Simulations, J. Atmos. Sci., 63, 1752–1775, https://doi.org/10.1175/JAS3713.1, 2006.
Várnai, T. and Marshak, A.: Observations of Three-Dimensional Radiative Effects that Influence MODIS Cloud Optical Thickness Retrievals, J. Atmos. Sci., 59, 1607–1618, https://doi.org/10.1175/1520-0469(2002)059<1607:OOTDRE>2.0.CO;2, 2002.
Wang, C., Platnick, S., Fauchez, T., Meyer, K., Zhang, Z., Iwabuchi, H., and Kahn, B. H.: An Assessment of the Impacts of Cloud Vertical Heterogeneity on Global Ice Cloud Data Records From Passive Satellite Retrievals, J. Geophys. Res.-Atmos., 124, 1578–1595, https://doi.org/10.1029/2018JD029681, 2019.
Webb, M. J., Lambert, F. H., and Gregory, J. M.: Origins of differences in climate sensitivity, forcing and feedback in climate models, Clim. Dynam., 40, 677–707, https://doi.org/10.1007/s00382-012-1336-x, 2012.
Wind, G., Platnick, S., Meyer, K., Arnold, T., Amarasinghe, N., Marchant, B., and Wang, C.: The CHIMAERA system for retrievals of cloud top, optical and microphysical properties from imaging sensors, Comput. Geosci., 134, 104345–104646, https://doi.org/10.1016/j.cageo.2019.104345, 2020.
Wiscombe, W. J.: Improved Mie scattering algorithms, Appl. Opt., AO, 19, 1505–1509, https://doi.org/10.1364/AO.19.001505, 1980.
Witte, M. K., Yuan, T., Chuang, P. Y., Platnick, S., Meyer, K. G., Wind, G., and Jonsson, H. H.: MODIS Retrievals of Cloud Effective Radius in Marine Stratocumulus Exhibit No Significant Bias, Geophys. Res. Lett., 45, 10656–10664, https://doi.org/10.1029/2018GL079325, 2018.
Wylie, D. P. and Menzel, W. P.: Eight Years of High Cloud Statistics Using HIRS, J. Climate, 12, 170–184, https://doi.org/10.1175/1520-0442(1999)012<0170:EYOHCS>2.0.CO;2, 1999.
Zelinka, M. D., Klein, S. A., and Hartmann, D. L.: Computing and partitioning cloud feedbacks using cloud property histograms. Part II: Attribution to changes in cloud amount, altitude, and optical depth, J. Climate, 25, 3736–3754, https://doi.org/10.1175/JCLI-D-11-00249.1, 2012.
Zelinka, M. D., Randall, D. A., Webb, M. J., and Klein, S. A.: Clearing clouds of uncertainty, Nat. Clim. Change, 7, 674–678, https://doi.org/10.1038/nclimate3402, 2017.
Zhang, Z., Platnick, S., Yang, P., Heidinger, A. K., and Comstock, J. M.: Effects of ice particle size vertical inhomogeneity on the passive remote sensing of ice clouds, J. Geophys. Res., 115, D17203, https://doi.org/10.1029/2010JD013835, 2010.
Zhang, Z., Ackerman, A. S., Feingold, G., Platnick, S., Pincus, R., and Xue, H.: Effects of cloud horizontal inhomogeneity and drizzle on remote sensing of cloud droplet effective radius: Case studies based on large-eddy simulations, J. Geophys. Res., 117, 2012JD017655, https://doi.org/10.1029/2012JD017655, 2012.
Zhang, Z., Werner, F., Cho, H.-M., Wind, G., Platnick, S., Ackerman, A. S., Di Girolamo, L., Marshak, A., and Meyer, K.: A framework based on 2-D Taylor expansion for quantifying the impacts of subpixel reflectance variance and covariance on cloud optical thickness and effective radius retrievals based on the bispectral method, J. Geophys. Res.-Atmos., 121, 7007–7025, https://doi.org/10.1002/2016JD024837, 2016.
Zuidema, P. and Evans, K. F.: On the validity of the independent pixel approximation for boundary layer clouds observed during ASTEX, J. Geophys. Res.-Atmos., 103, 6059–6074, https://doi.org/10.1029/98JD00080, 1998.
- Abstract
- Introduction
- Data and methodology
- eMAS operations during ORACLES 2016
- ORACLES cloud retrieval results and analysis
- Discussion
- Summary
- Code and data availability
- Author contributions
- Competing interests
- Disclaimer
- Special issue statement
- Acknowledgements
- Financial support
- Review statement
- References