the Creative Commons Attribution 4.0 License.
the Creative Commons Attribution 4.0 License.
 | 05 Jan 2026
Two optimized methods for the quantification of anthropogenic and biogenic markers in aerosol samples using liquid chromatography mass spectrometry and gas chromatography mass spectrometry
Diana L. Pereira
Aline Gratien
Chiara Giorio
Emmanuelle Mebold
Thomas Bertin
Cécile Gaimoz
Jean-François Doussin
Paola Formenti
In this study, we present two optimized analytical methods for the quantification of molecular markers to attribute the contribution of various Volatile Organic Compound (VOC) oxidation products to Secondary Organic Aerosol (SOA). Those involve Ultrahigh Performance Liquid Chromatography Electrospray Ionization coupled to Ion Mobility Time-of-Flight Mass Spectrometry (UPLC/ESI-IMS-QTOFMS) and Gas Chromatography Mass Spectrometry (GC-MS). Liquid extraction was performed for both techniques, with an extra derivatization step with N,O-Bis(trimethylsilyl)trifluoroacetamide (BSTFA) containing 1 % trimethylchlorosilane (TMCS) for GC-MS analysis, enhancing the compound detection capacity. Between the two techniques, 23 biogenic and anthropogenic markers were identified, with five common species detected. Recoveries between 40 % and 170 % were observed for nitro-containing compounds and between 70 % and 140 % for aromatic and non-aromatic acids except for 3-methyl-1,2,3-butanetricarboxylic acid. Limits of detection <5 ng were observed by UPLC/ESI-IMS-QTOFMS analysis for 4-nitrophenol and 2-methyl-4-nitrophenol, while GC-MS (with BSTFA derivatization) analysis allowed better detection of lower mass compounds (for example limit of detection for 2-methylerythritol was 0.10 ng). While UPLC/ESI-IMS-QTOFMS allows for the analysis of high molecular weight compounds at high resolution and sensitivity, GC-MS analysis focuses on compounds of lower mass and higher polarity, together, these complementary methods provide a comprehensive tool for the quantification of organic markers arising from the airborne transformation of compounds of both biogenic and anthropogenic origins.
- Article
(2123 KB) - Full-text XML
-
Supplement
(1381 KB) - BibTeX
- EndNote


Secondary organic aerosol (SOA) can contribute approximately 70 % to the organic aerosol (OA) (Hallquist et al., 2009; Srivastava et al., 2018a) and influence both the Earth's climate and human health (Fan et al., 2022; Jimenez et al., 2009). Understanding its origin, and hence quantifying their sources it is essential for many source apportionment studies (Srivastava et al., 2018a). This implies detailed understanding on its molecular composition, particularly through the determination of organic molecular markers. While it is relatively well established for primary OA sources, it is more challenging for SOA sources, which result from the oxidation of volatile organic compounds (VOCs), as atmospheric oxidation processes lead to thousands of products varying upon conditions, space and time. Proper markers quantification is henceforth needed to evaluate the contribution of specific VOCs to SOA chemical composition. Approaches such as the molecular markers method, positive matrix factorization and chemical mass balance are commonly used to achieve this (Srivastava et al., 2018a).
Molecular markers have to be both conservative and source specific (Nozière et al., 2015). Some have been identified for major biogenic and anthropogenic VOCs such as isoprene, pinene and aromatic oxidation products (Claeys and Maenhaut, 2021; Forstner et al., 1997; Kleindienst et al., 2007; Sato et al., 2022). Isoprene photo-oxidation initiated by OH-radical has led to the formation and identification of polyol markers such as 2-methylthreitol, 2-methylerythritol (Claeys et al., 2004), and 2-methylglyceric acid (Edney et al., 2005). Pinene oxidation has been associated with a higher number of markers from first and second generation. For example, first oxidation products such as pinic acid, cis-pinonic, norpinic acid and terpenylic acid can derive from pinene ozonolysis reactions (Claeys et al., 2009; Yu et al., 1999). Further OH-oxidation of pinic and cis-pinonic acids involves the formation of 3-methylbutane-1,2,3-tricarboxylic acid (MBTCA) (Szmigielski et al., 2007) and 3-Hydroxyglutaric acid (Claeys et al., 2007). Terpenylic acid oxidation by OH leads to terebic acid formation (Yasmeen et al., 2010). Evidence for the formation of organosulfate and nitrooxy organosulfate markers from biogenic VOCs has been also provided (Surratt et al., 2007, 2008).
A lower specificity is observed for common anthropogenic photo-oxidation products assigned as markers for aromatic compounds. 2,3-dihydroxy-4-oxopentanoic acid (DHOPA) has been considered the most common monoaromatic marker (Al-Naiema and Stone, 2017; Kleindienst et al., 2007) while phthalic acid is linked to diaromatic compounds (Kleindienst et al., 2012). Aromatic compounds such as 4-hydroxy-3-methyl-benzaldehyde, 4-nitrophenol and 2-methyl-4-nitrophenol, p/m-toluic acid (Forstner et al., 1997), 2,5-dihydroxy benzoic acid (Hamilton et al., 2005), salicylic acid (Jang and Kamens, 2001) and open ring products such as glycolic acid (Kleindienst et al., 2004), succinic acid, and malonic acid (Sato et al., 2007) were also associated with aromatic VOCs oxidation.
Analytical tools that focus on the identification and quantification of organic markers in aerosol samples generally comprise the analysis of polar compounds with hydroxyl, carbonyl and carboxyl groups, normally achieved using chromatography-based methods (Nozière et al., 2015). Liquid Chromatography- Mass Spectrometry (LC-MS) and/or Gas Chromatography- Mass Spectrometry (GC-MS) are the most common techniques used in the identification of markers (Albinet et al., 2019; Iinuma et al., 2010; King et al., 2019; Kleindienst et al., 2004; Lanzafame et al., 2021; Sato et al., 2022; Srivastava et al., 2018b). They require additional steps for sample extraction and, in the case of highly polar compounds, derivatization. Dichloromethane (Hu et al., 2008), acetonitrile aqueous mixtures (Yu et al., 1998), methanol and methanol/dichloromethane mixtures (Pashynska et al., 2002) are common extraction solvents for GC-MS while methanol and acetonitrile are the most common organic mobile phases used in LC-MS analysis (Gao et al., 2021; Grace et al., 2019; Hutchinson et al., 2012).
Protocols for the analysis of organic markers from aerosol particles have been previously developed (Amarandei et al., 2023; Albinet et al., 2019; Chien et al., 1998; Hoffmann et al., 2007; Hu et al., 2008; Ikemori et al., 2019; King et al., 2019; Pashynska et al., 2002; Yu et al., 1998). Those protocols either focus on a specific type of marker or a group of them. For example, Pashynska et al. (2002) developed a GC-ion trap-MS method to follow levoglucosan and monosaccharides anhydrides as markers of biomass burning, with recoveries >90 %. Hoffmann et al. (2007) also followed biomass burning markers using High Performance Liquid Chromatography/Atmospheric Pressure Chemical Ionisation Mass Spectrometry (HPLC/APCI-MS) with instrumental limits of detection (LODs) lower than 786.2 ng mL−1 and recoveries >15 %. Ikemori et al. (2019) focus on the quantification of nitroaromatic compounds with LC-MS/MS analysis and polar acids by GC-MS with instrumental limit of detections (LODs) of 0.64 to 4.2 and 0.6 to 1 ng mL−1, respectively. Recoveries were reported as >90 %. A LC-MS method for the detection of terrestrial and marine biomarkers (e.g., pinene, isoprene) in ice cores was developed by King et al. (2019). LOD varied between 2 to 20 ng mL−1 with average recoveries of 80 %. Yu et al.'s (1998) GC-MS method allows for the detection of biogenic and anthropogenic markers in the order of pg mL−1 and 100 % was assumed as collection and derivatization efficiency. Albinet et al. (2019) provided a methodology comparing HPLC/MS-MS and GC-MS protocol development for target common biogenic and anthropogenic markers such as those associated with pinene, isoprene and aromatics oxidation. Compound-dependent limit of quantifications (LOQs) between 1.0 and 14.5 pg were reported for GC-MS and between 10 and 40 pg for HPLC/MS-MS. Recovery rates ranged between 10 and 90 %. Similarly, Amarandei et al. (2023) explored markers of pinene, biomass burning and other biogenic and anthropogenic acids, using a HPLC Electrospray Ionization Time-of-Flight Mass Spectrometer (HPLC-ESI-TOF-MS), with LODs values between 0.88 and 48 ng mL−1.
In this work, we present two methods for the detection and quantification of varied biogenic and anthropogenic organic markers with their validation parameters. The methods were developed using Ultrahigh Performance Liquid Chromatography Electrospray Ionization coupled to Ion-Mobility Time-of-Flight Mass Spectrometry (UPLC/ESI-IMS-QTOFMS) and GC-MS. While UPLC/ESI-IMS-QTOFMS will allow the analysis of high molecular weight compounds at high resolution and sensitivity, the GC-MS analysis is focused on compounds of lower molecular weight. Together, these complementary methods will provide a comprehensive tool for the quantification of biogenic and anthropogenic markers with different chemical functionalities including aromatic and nonaromatic compounds with five common species detected. Additionally, we achieved for the first-time quantification of terebic acid and syringaldehyde using a single analytical method (UPLC/ESI-IMS-QTOFMS), unlike previous studies that focused on the detection of only one of the two markers. The differences between the two methods are evaluated in terms of their performance and compounds quantification in real atmospheric samples.
The quantification of 23 organic molecular markers was performed by means of UPLC/ESI-IMS-QTOFMS and GC-MS. The steps undertaken to optimize the methods are described in the “Results and discussion” section.
2.1 Chemicals and reagents
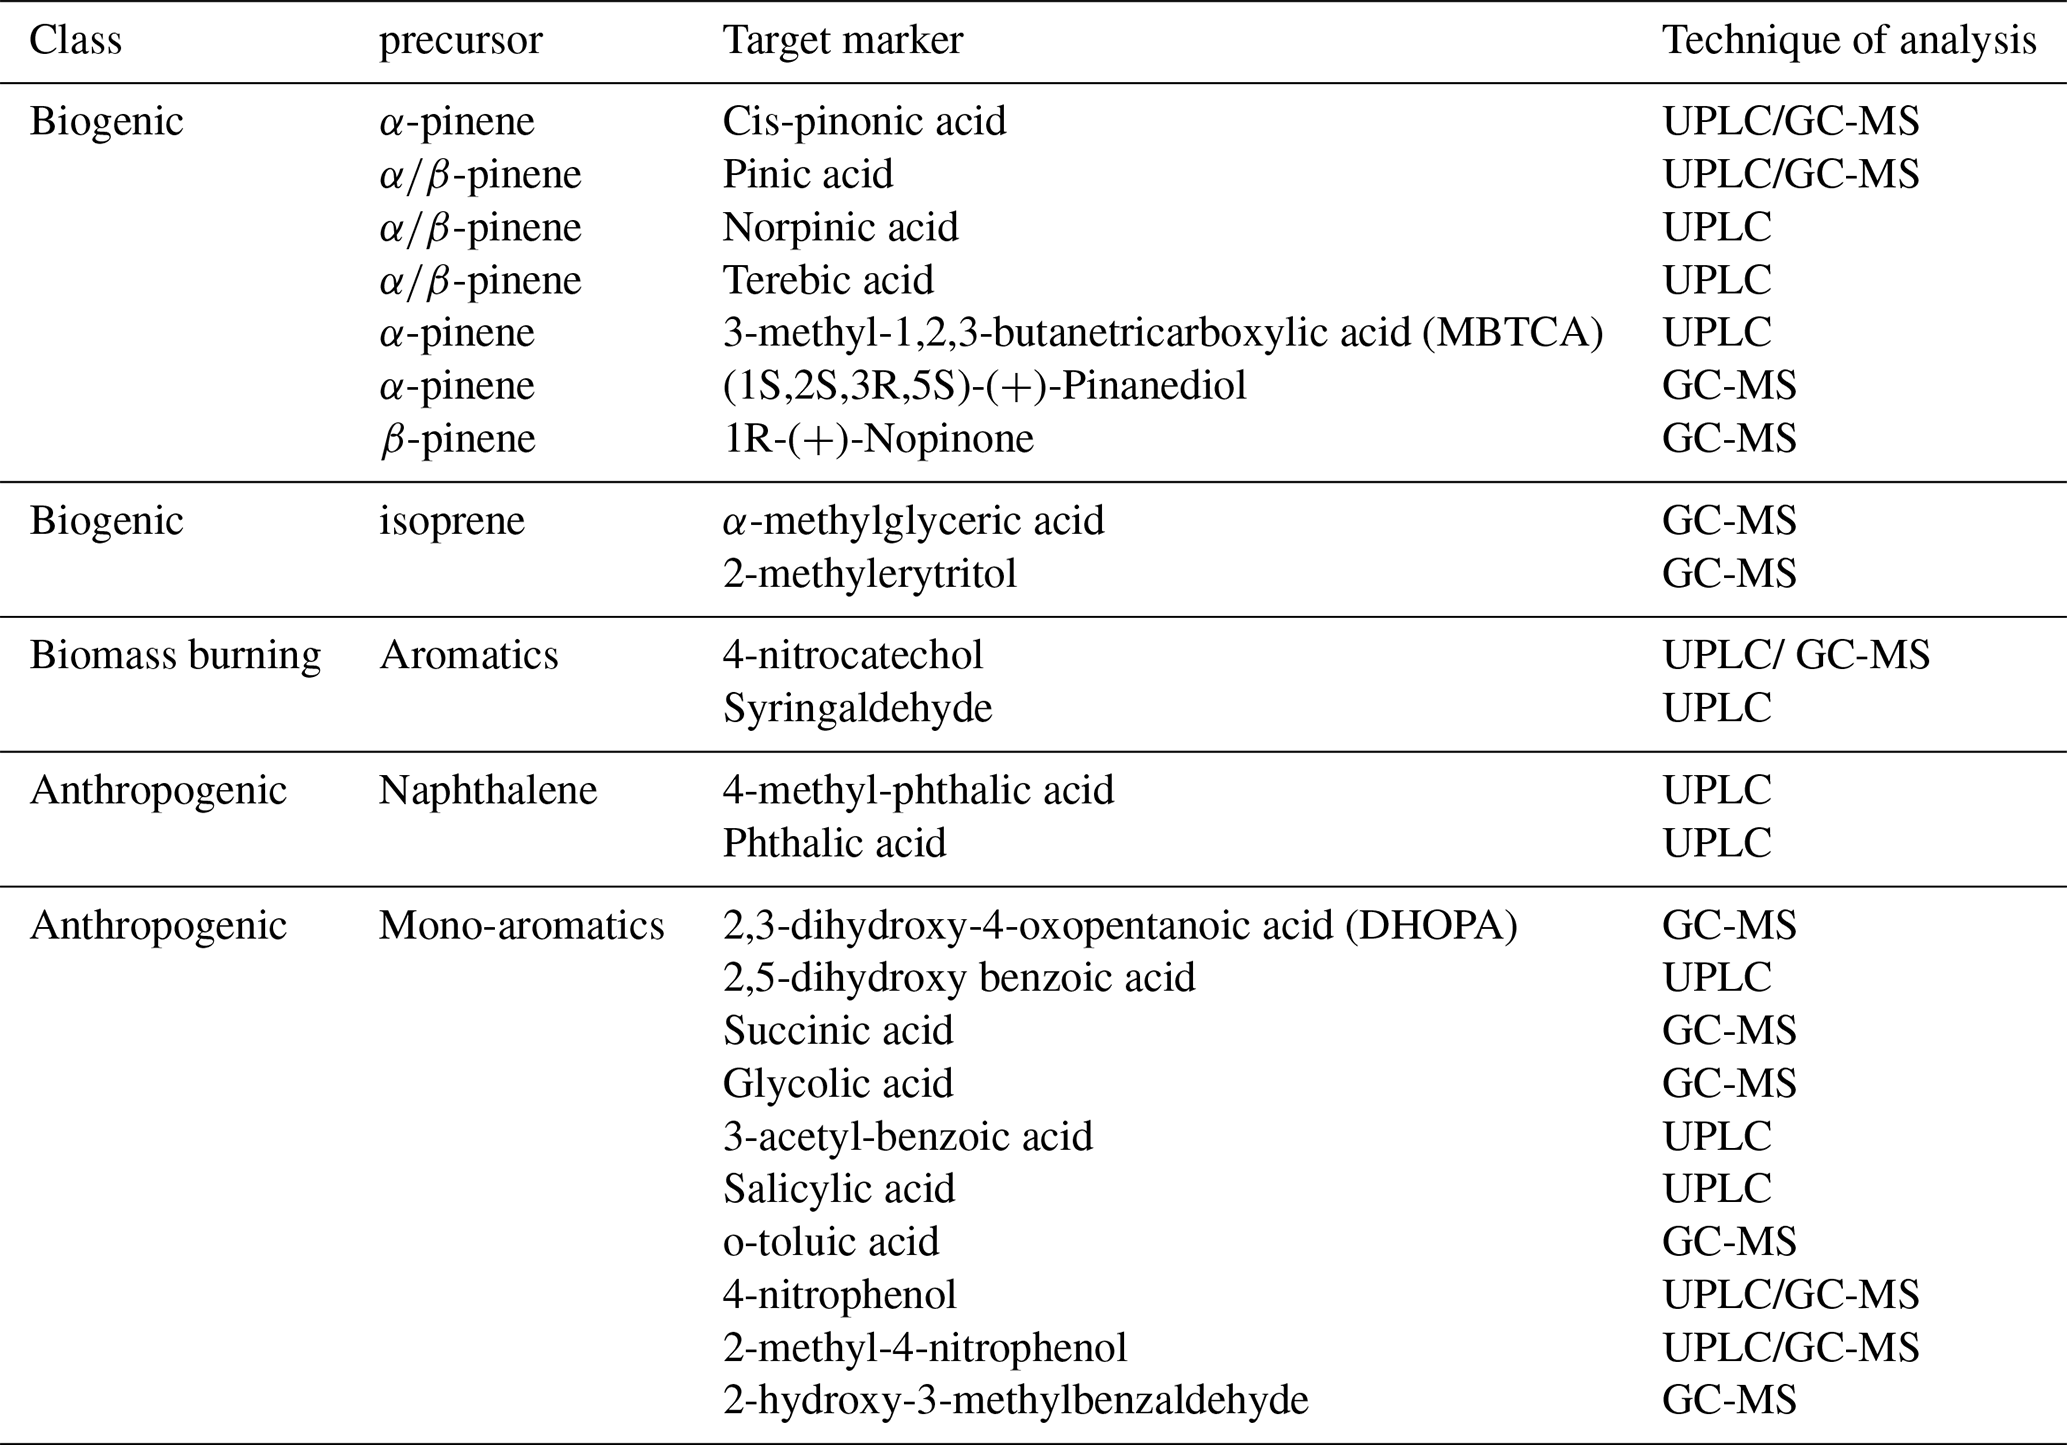
All chemicals, gases and solvents used during the analysis of the organic markers are summarized in Table S1 in the Supplement. The different compounds (Table 1) were selected as available commercial standards of common oxidation products of major VOCs precursors of biogenic and anthropogenic origin. The biogenic markers are α- and β-pinene oxidation products and isoprene oxidation products. The anthropogenic markers belong to the oxidation of different aromatic precursors such as benzene, toluene, ethylbenzene, xylene (BTEX) and naphthalene. Two of them are markers of biomass burning. The organic markers selected in this study belong to the list of commonly used markers of biogenic and anthropogenic origin implemented by the European Calibration Center (OGTAC-CC) (Herrmann and Mutzel, 2019; Mothes and Herrmann, 2024) of the ACTRIS research infrastructure (Laj et al., 2024).
Table 1List of target analytes for this study representing molecular markers of biogenic and anthropogenic SOA.
2.2 Sample collection
In this work, PM1 samples were collected on 150 mm diameter quartz fiber filters (Pallflex Tissuquartz), previously baked at 550 °C for 8 h. After exposure, samples were conserved in pre-baked aluminum foil and sealed at −20 °C. Sampling was performed during daytime (06:00–22:00, local time) and nighttime (22:00–06:00, local time) in the framework of the ACROSS (Atmospheric Chemistry Of the Suburban Forest) campaign (Cantrell and Michoud, 2022) at the forest of Rambouillet (France), in the summer 2022. An automatic continuous high-volume aerosol sampler (30 m3 h−1) DHA-80 (DIGITEL Enviro-Sense) was used. The procedures of aerosol sampling in the field are fully described in Pereira et al. (2025). The samples discussed in this work were collected on 3, 4, 11, 12, 13, 17, 18 and 19 July.
2.3 UPLC/ESI-IMS-QTOFMS method
2.3.1 Sample extraction
Samples (punch of 46 mm) were spiked with 5 µL of the internal standard (1S)-(+)-camphor-10-sulfonic acid (Sigma Aldrich, 98 %) at 20 µg mL−1 in 50:50 () acetonitrile/ ultrapure water and cut into smaller pieces. Pieces were transferred to amber vials and extracted with 4 mL of acetonitrile (ULC/MS-CC/SFC grade, Biosolve, 99.99 %) using a Mini Shaker (15 mm Orbital, VWR) at 1000 rev min−1 for 30 min. The extracts were individually filtered using a glass syringe coupled to a syringe filter (PTFE membrane, 13 mm ×0.2 µm, VWR). The filtered solutions were then evaporated to dryness using a 12 positions N-Evap (Organomation) under a gentle stream of nitrogen at 99 % purity fed by a CALYPSO 35 L min−1 generator (F-DGSi, 2023). Samples were dissolved with 200 µL of 50:50 () acetonitrile/ ultrapure water, transferred to 250 µL vial inserts and stored for up to 24 h at −18 °C prior to analysis.
2.3.2 Analysis
Samples were analyzed by means of an UPLC/ESI-IMS-QTOFMS system consisting of an ACQUITY™ UPLC I-Class system and a Vion™ ion mobility hybrid (IMS) QTOF mass analyzer (Waters™). A UPLC BEH C18 column (1.7 µm, 2.1×100 mm, Waters) was used as stationary phase. Mobile phases were ultrapure water with 0.1 % formic acid () (A) and acetonitrile with 0.1 % formic acid () (B) with an elution gradient of: 2 min 5 % B, 2–32 min from 5 % to 60 % B, 32–35 min from 60 to 95 % B, 35–38 min hold at 95 % B, 38–40 min from 95 % to 5 % B, and finally stabilization at 5 % B for 5 min. Separation was performed at a 40 °C column temperature and a flow rate of 0.4 mL min−1. 2 µL of sample were injected in triplicates. Solvent blanks (50:50 () acetonitrile/ ultrapure water) were injected between replicates to check for any carry-over. Between sequences, a source cleaning step was performed to increase the instrument sensitivity (as detailed in Sect. 2.5).
Analysis was performed in negative ionization mode with the following ESI parameters: 120 °C source temperature, 600 °C of desolvation temperature and cone gas flow of 150 L h−1. Mass spectra were recorded in full scan mode in the range of 50–1000, where the corresponds to the mass of the deprotonated molecules. Further data processing was performed only for a range between 50–350. Compounds were then identified by means of their , retention time (Rt) and collision cross section (CCS) with error ≤5 ppm, CCS error ≤2 % and Rt error ≤0.1 min. Quantification was done on the full scan spectra, in extracted ion current, with an external calibration in the range 10 to 200 µg mL−1 with (1S)-(+)-camphor-10-sulfonic acid as internal standard. Calibrations were performed using the same extraction procedure as for the real samples. Further details of the calibration procedure are discussed in Sect. 3.1.5.
2.4 GC-MS method
2.4.1 Sample extraction and derivatization
Samples (punch of 46 mm) were spiked with 5 µL of a heptanoic acid (Sigma Aldrich, 99 %) solution at 40 µg mL−1 as internal standard and extracted in acetonitrile (HPLC grade, VWR, 99.95 %), filtered and evaporated to dryness similarly to the extraction procedure described in Sect. 2.3.1. Samples were then reconstituted by adding 50 µL of acetonitrile. 200 µL of N,O-Bis(trimethylsilyl)trifluoroacetamide (BSTFA) containing 1 % trimethylchlorosilane (TMCS) (Sigma Aldrich, purity 99 %) was added to each solution and then heated at 60 °C for 30 min to allow derivatization. This derivatization process, including the volumes, was selected following Albinet et al. (2019). Final extracts were stored at −18 °C and analyzed as quickly as possible after 24 h.
Furthermore, derivatization was used as a support for product identification. In the derivatization process with BSTFA, the labile hydrogens of the alcohols and acid functions of the compounds are replaced by trimethylsilyl-Si(CH3)3 groups as follows:
BSTFA derivatization gives specific ion fragments in mass spectra at 73 [Si(CH3)3]+ and 117 [COO=Si(CH3)3]+. For compounds bearing labile H atoms, they exhibit a 147 peak corresponding to [(CH3)2Si=OSi(CH3)3]+. For identification of individual compounds using authentic standards and evaluation of their response, a 50:50 () mixture of BSTFA and the standard solution was left reacting overnight at room temperature. BSTFA was selected as one of the most common derivatization reagents for compounds with labile hydrogens (Claeys and Maenhaut, 2021; Cochran et al., 2012; Chiappini et al., 2006) due to the predominance of acidic groups of the target markers (Table 1). However, other derivatization reagents could be used to expand the detection to other functionalities, for example, O-(2,3,4,5,6-pentafluorobenzyl)hydroxylaminehydrochloride for carbonyl compounds (Nozière et al., 2015; Orata, 2012).
2.4.2 Analysis
Analysis was performed using a GC-MS made of a gas chromatograph (Clarus 650, Perkin Elmer) and a mass spectrometer (MS SQ8C, Perkin Elmer). Separation was achieved using an analytical column RXi-5Sil MS (30 m, 0.25 mm ID, 0.25 µm Restek) and the following GC oven temperature gradient: an initial temperature of 60 °C held for 15 min, followed by a ramp of 5 °C min−1 from 60 to 280 °C, and 7 min held at 280 °C. Helium was used as carrier gas at a flow rate of 1 mL min−1. An injection volume of 5 µL with a high precision syringe (84301 CR700-20 1–20 µL, Hamilton) was used. Ionization was performed using an electron impact source. Mass spectrometry analysis was performed in a mass range between 50 and 500 with a mass scan time of 0.3 s between 6 to 66 min. We used the full scan total ion current (TIC) mode and when additional compound verification was required, the selected ion recording (SIR) mode for 6 channels. Compounds were identified by monitoring the Rt and major or specific ions derived from fragmentation using a mass spectra database built from the individual standards injection. Some of them were also verified using the NIST (National Institute of Standards and Technology) library. Quantification was performed by ion mass extraction in the TIC mode for characteristic fragments, subtracting the signal of the blanks and using external calibration with heptanoic acid as internal standard. Calibration standards underwent the same extraction and derivatization procedure as the real samples. Further details are provided in Sect. 3.2.3.
2.5 Cleaning procedure between experiments
In between experiments, all the glassware used was cleaned in an automatic laboratory glasswasher PG 8593 [WW AD] (Miele) following a protocol for organic residues cleaning (Miele, 2022). Cleaning was performed with tap water at 75 °C using a KOH solution neodisher® LaboClean FLA as detergent. Then, the glassware was rinsed with a H3PO4/C6H8O7 solution neodisher® N as neutralizer in distilled water, followed by a second rinsing cycle in distilled water at 75 °C and dried at 110 °C for 30 min. Afterwards, the material was covered with aluminum foil and baked in a furnace at 500 °C for 2 h to remove possible additional organic contaminants.
The metallic tips used for evaporation were cleaned with an ultrasonic bath for 15 min using isopropanol. Test and final calibrations were performed on quartz filters, which were cleaned by baking at 550 °C for 8 h and stored in pre-baked aluminum foil under a laminar flow hood. For the UPLC/ESI-IMS-QTOFMS, the ESI source cone was manually cleaned between experiments using aluminum oxide powder (Restek) and sonicated for 10 min in an ultrasonic bath first with ultrapure water and then with isopropanol (LC-MS grade).
2.6 Method validation
The performances of both methods were assessed by analyzing the following analytical parameters: variability (Eq. 1), sample recovery (Eq. 2), the coefficient of variation of the method (Eq. 3) and LOD. The variability of measurements for UPLC/ESI-IMS-QTOFMS analysis was obtained by calculating the percent variability between triplicate injections as:
The recovery for each compound for both methods was calculated using the ratio between the amount of the compound found after extraction and the amount added to a filter blank before extraction as:
The recovery not only provides an estimation of trueness of a method (Thompson et al., 2002), but it also defines the extraction efficiency of the target analytes. The recovery can be influenced by parameters such as the analyte concentrations, the matrix, solvent, and extraction procedure (Golubović et al., 2019; Kumar et al., 2022). In this study, the overall recovery of the extraction procedure is calculated.
Following the ISO 8466-1:2021 standard, the coefficient of variation of the method (VXO) for the target compounds was calculated using Eq. (3):
The residual standard deviation (Sy) was calculated in function of the fit, using Eq. (4) for linear calibrations (y=bx) and Eq. (5) for quadratic functions () with a, b and c as calibration coefficients, as the mean value of the different xi and n the number of points considered in the calibration:
The LOD for each technique was compound specific for real standard solutions. For UPLC/ESI-IMS-QTOFMS, LOD for each compound was assigned as the x-value associated to the y-intercept of the confidence interval derived from the calibration curves using a linear fit with 95 % confidence (Hubaux and Vos, 1970). For GC-MS, LODs were calculated as the blank response (from the calibrations) plus three times its standard deviation. All LODs reported here are in mass (in ng) of analyte referred to the whole filter sample (corrected for the size of the portion analyzed). For comparison with the literature, LODs are additionally reported as the concentration in the injected solution (in ng mL−1).
The two analytical methods were compared by quantifying compounds that are targets in both techniques on samples collected at the Rambouillet forest during the ACROSS campaign. Bland-Altman plots (Bland and Altman, 1995, 1999) were used for the comparison. Those consider the similarity of two independent methods by visual inspection of the difference in concentrations derived from GC-MS and UPLC/ESI-IMS-QTOFMS in function of the mean of both measurements.
3.1 Optimization of the UPLC/ESI-IMS-QTOFMS analytical method for the quantification of biogenic and anthropogenic markers
3.1.1 Optimization of the chromatographic method
Selection of the chromatographic method
Different methods were tested to separate and identify 14 compounds using the UPLC/ESI-IMS-QTOFMS: cis-pinonic acid, pinic acid, norpinic acid, terebic acid, MBTCA, 4-nitrocatechol, syringaldehyde, 4-methyl phthalic acid, phthalic acid, 3-acetylbenzoic acid, 4-nitrophenol, 2-methyl-4-nitrophenol, azelaic acid and (1S)-(+)-camphor-10-sulfonic acid. Initial methods tested on individual standard solutions at 10 µg mL−1 in 100 % methanol used elution gradients with varying mobile phases, slopes and lengths of 17 and 60 min. Mobile phases consisted of 0.1 % formic acid () added in both solvents, ultrapure water (A) and methanol (B). Addition of formic acid is a common practice used to stabilize the solution pH, reducing unwanted adducts formation and leading to the improvement in detection of the analyte signals, ionization, peak shape and separation efficiency (Kaufmann et al., 2024; Liigand et al., 2014).
For the 17 min elution method, the following gradient was used: 2 min isocratic at 5 % B, 2–10 min linear gradient from 5 % to 50 % B, 10–11 min linear gradient from 50 % to 99 % B followed by an isocratic at 99 % B for 2 min, 13–15 min linear gradient from 99 to 5 % B and equilibration at 5 % B for two min. For the 60 min method, the elution conditions were: 3 min isocratic at 5 % B, 3–25 min linear gradient from 5 % to 50 % B, 25–43 min linear gradient from 50 % to 90 % B, 43–48 min linear gradient from 90 to 5 % B and equilibration at 5 % B for 3 min. The 17 min method showed the overlap and irregular peak shapes for MBTCA, terebic acid, and phthalic acid with coelution of pinic acid and 4-nitrophenol, and of norpinic acid and camphor sulfonic acid (Fig. S1 in the Supplement). The 60 min method provided better performance associated with a decrease in the number of compounds coeluted (Fig. S2), however, given that most of the target compounds elute in the first 20 min, such a long method would be unnecessarily time and resource consuming.
An intermediate method of 45 min with mobile phases with 0.1 % formic acid () in ultrapure water (A) and 0.1 % formic acid in organic solvent (B) was selected. For this method, acetonitrile and methanol were considered for the evaluation and the following gradient was tested: 2 min isocratic at 5 % B, 2–32 min linear gradient from 5 % to 60 % B, 32–35 min linear gradient from 60 % to 95 % B, 35–38 min isocratic at 95 % B, 38–40 min linear gradient from 95 % to 5 % B, and equilibration for 5 min at 5 % B. Example chromatograms using the 45 min method with methanol and with acetonitrile as mobile phase are shown in Fig. S3. As observed, most of the standards were properly identified after chromatographic separation with good peak shapes and compounds eluting in the first 18 min for both organic solvents. To assess whether carry over would affect the measurements with a reduced method compared with the 60 min one, blanks were injected in between samples. No carry over was observed therefore, the 45 min elution method was selected for the analysis.
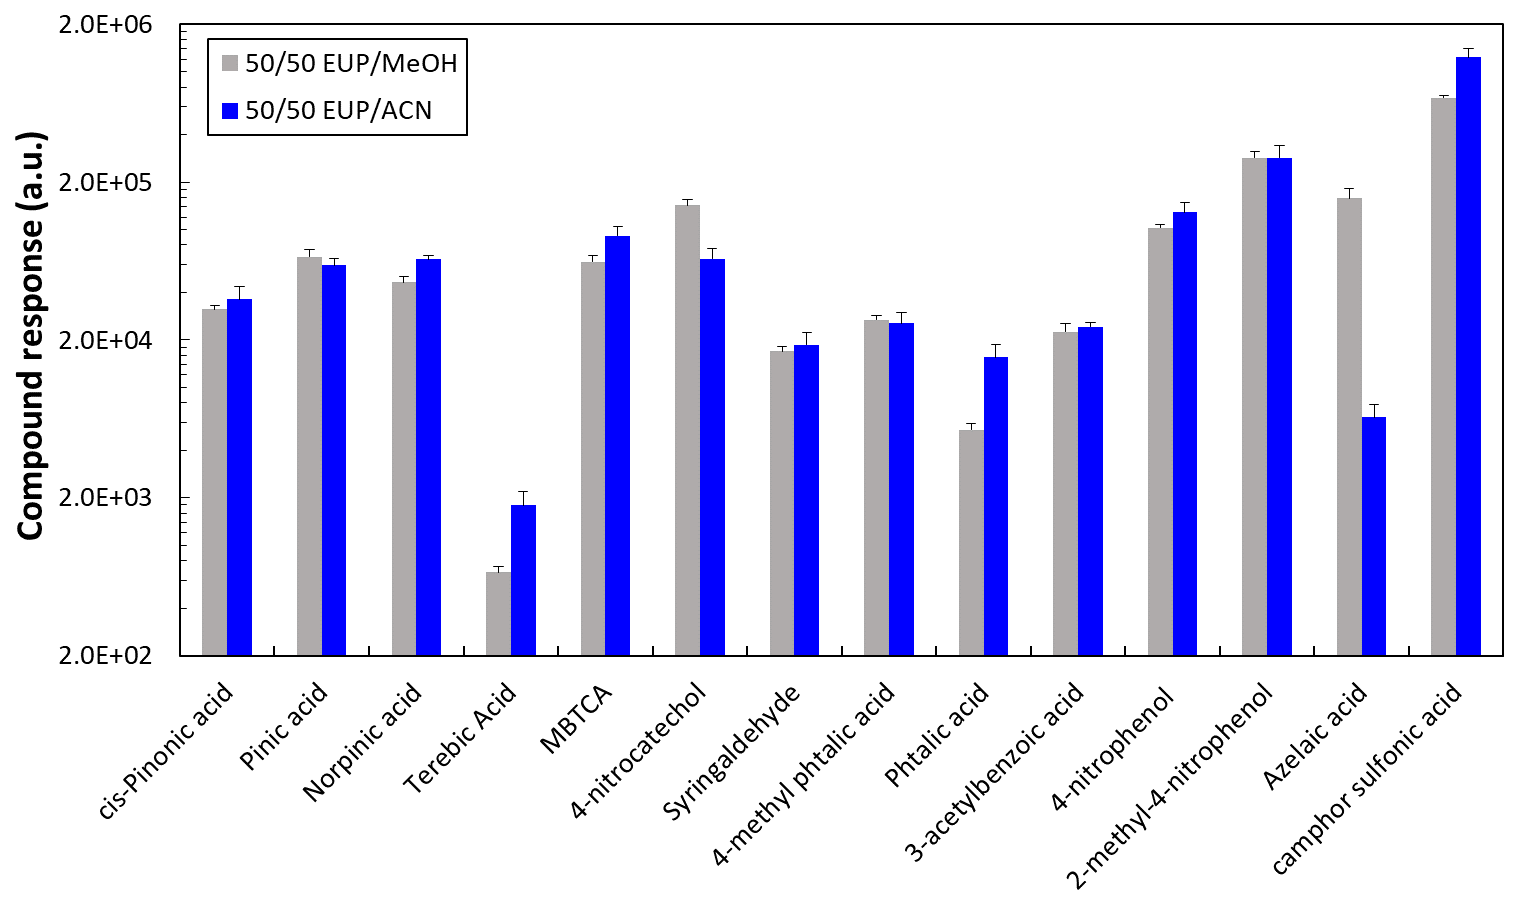
Figure 1Comparison of the compound responses observed for the 45 min elution method. Individual standard solutions were prepared in 50/50 ultrapure water (UPW) and organic solvent methanol (MeOH) or acetonitrile (ACN) at a concentration of 10 µg mL−1.
Selection of the organic solvent for the chromatographic method
The use of methanol and acetonitrile as organic solvents for the chromatographic separation was evaluated by comparing the compound responses obtained using both solvents as shown in Fig. 1. For these tests, standard solutions were prepared in 50/50 ultrapure water/organic solvent mixture, matching the same organic solvent used for mobile phase B in order to minimize any possible artifact that could affect the peak shape even though the injection volume was only 2 µL. Among the 14 target compounds, six (pinic acid, 3-acetyl benzoic acid, 4-methyl phthalic acid, cis pinonic acid, syringaldehyde and 2-methyl-4-nitrophenol) showed a similar response with both solvents. In the case of terebic acid, camphor sulfonic acid, MBTCA, norpinic acid, and phthalic acid, higher responses were observed with acetonitrile as organic solvent and the opposite effect was observed for azelaic acid and 4-nitrocatechol. Azelaic acid was the compound most negatively affected using acetonitrile as an eluent. However, this compound was initially considered in our tests to identify possible sample contamination as it was identified by the software at multiple Rt. After its identification, we discarded azelaic acid presence. Acetonitrile was therefore selected due to the higher elution power observed for the analysis of the target compounds, better suitability for the column (operated at 40 °C) used in this work, and overall better response for most of the target analytes.
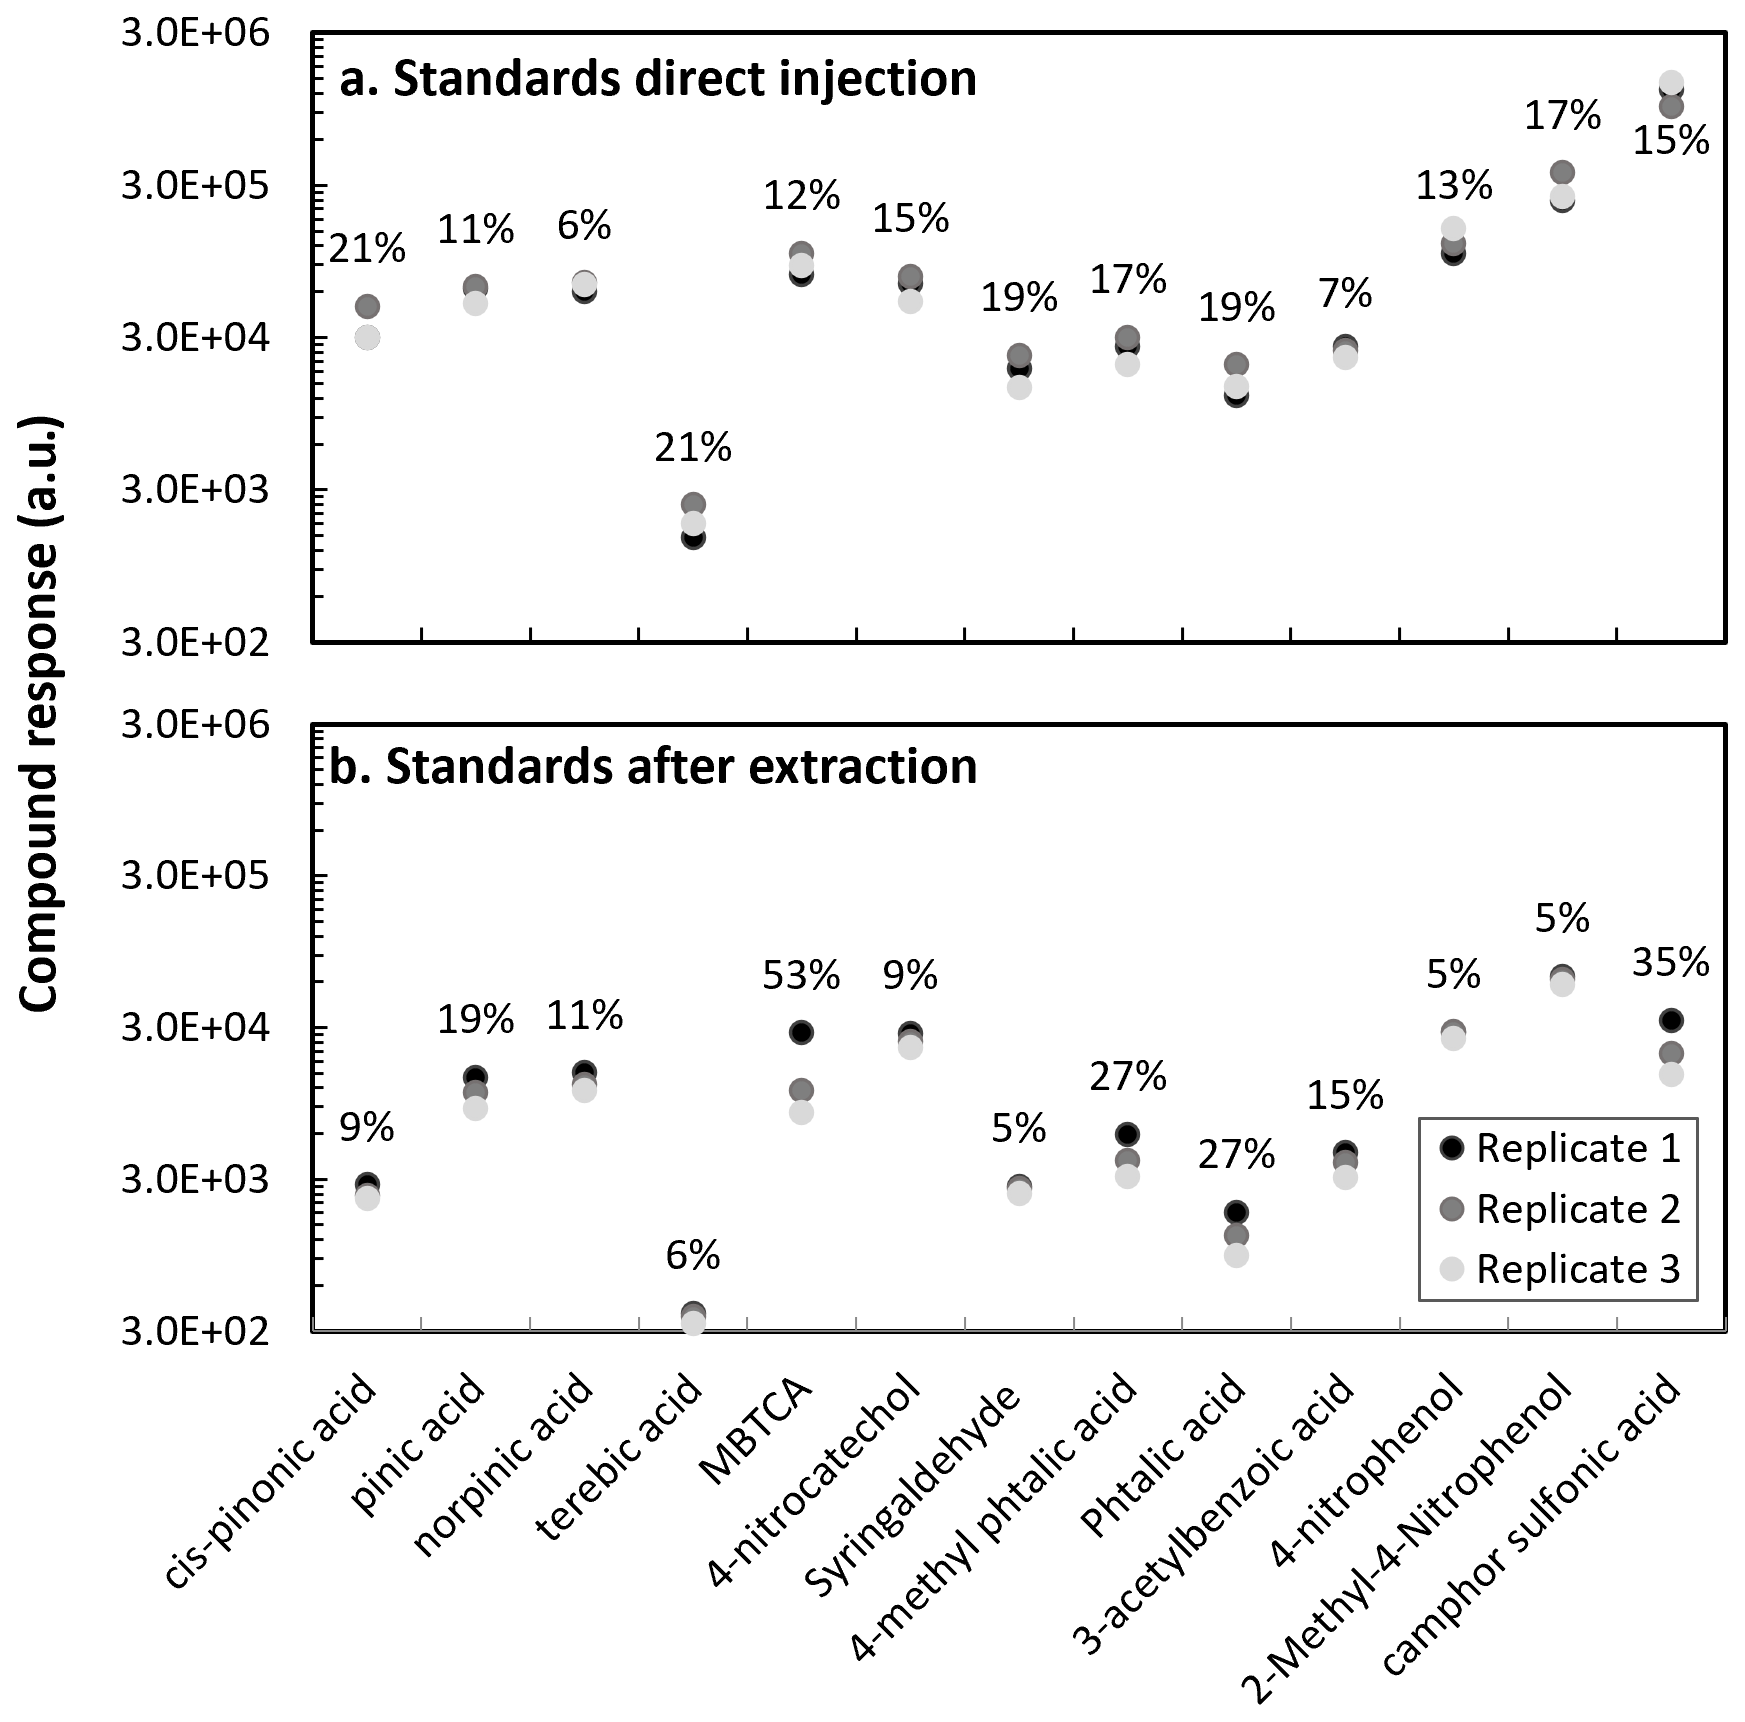
Figure 2Standards injection response: (a) Direct injection (without filter extraction) and (b) After filter extraction for various anthropogenic and biogenic compounds. Direct injection was performed from a mixture at 10 µg mL−1, and with filter extraction an equivalent solution at 400 µg mL−1, considering the dilution factor. Coefficients of variation are reported in the graph in percentages.
3.1.2 Evaluation of the instrumental response with and without filter extraction
Samples in this work were collected on quartz fiber filters (Sect. 2.2), therefore, to mimic the sample conditions, we evaluate the response of the compounds after performing the sample extraction procedure (Sect. 2.3.1). Two mixtures of compounds were prepared: biogenic (cis-pinonic acid, pinic acid, norpinic acid, terebic acid and MBTCA) and anthropogenic (4-nitrocatechol, syringaldehyde, 4-methyl phthalic acid, phthalic acid, 3-acetylbenzoic acid, 4-nitrophenol, 2-methyl-4-nitrophenol) mixtures at 400 µg mL−1. Then, blank filters were spiked with 5 µL of a (1S)-(+)-camphor-10-sulfonic acid and 5 µL of each 400 µg mL−1 mixture containing the compounds under analysis. As shown in Fig. 2, the instrument variability between three randomly injected replicates of the mixture solution without filter extraction was less than 21 % for all target compounds. After filter extraction, a higher replicate variability for phthalic acid (27 %), 4-methyl phthalic acid (27 %), MBTCA (53 %) and camphor sulfonic acid (35 %) was observed. The response variability of the target compounds can result from the extraction procedure. Given the different compound polarities and volatilities, their extraction will be influenced by the dissolution, filtration and solvent evaporation steps.
3.1.3 Optimization of the experimental setup (inserts, needle position, and sample stability)
Individual standards and liquid samples injected without extraction were conserved in actinic glass vials of 1.5 mL with a solution volume of 0.5 mL. In the case of samples extracted from filters, a lower volume was used (200 µL) to increase compound concentrations and detection probability, requiring the use of vial inserts. In this study, we chose a conical bottom shaped insert with plastic spring. To understand possible artifacts from the experimental setup, we evaluated the needle position, effect of inserts and storage time influence on the sample stability on a mixture containing the target anthropogenic standards (Table 1). The needle position test refers to variations in the height from the bottom of the vials.
We first focused on the analysis of anthropogenic standards in solutions containing mixtures at 0.5, 1.0 and 2.5 µg mL−1. As shown in Fig. S4, the variability between replicates for samples directly injected from the vials is high (>14 %). The compound-dependent injection variability from the vials was lower than 20 % for syringaldehyde while for 2,5-dihydroxybenzoic acid it was much higher (87 %). The same solutions on the vials were also injected in nonconsecutive triplicates during two different dates, labeled as new (14 March 2023) and old (3 March 2023) experiments (Fig. S5). The compound responses between triplicates were stable, with nitrophenol compounds showing the highest variability. When comparing the old and the new experiments, a compound-dependent variability in the response was observed. The responses were similar for acidic and aldehyde functionalities, but not for nitrophenol compounds, as higher responses were observed in the new experiment, especially at lower concentrations (0.5 µg mL−1). This suggest that time influence the compound response (see also Sect. 3.1.4).
Signals were also higher than for samples using inserts, for which the replicate variability is lower. These differences between injections without and with inserts can be influenced by sample degradation and signal loss over time as samples in vials (without inserts) were analyzed first in the sequence. Although the differences between using and not using of inserts, their presence is needed to maximize the sample intake into the system due to the low sample volumes after extraction. Variations in sample response when using inserts could be influenced by the amount of sample entering the system. Bubble formation in the bottom of the conical shaped inserts during sample transfer into the insert can limit the sample intake. This hypothesis was discarded as changing the distance of the needle from the bottom of the vial between 5 and 10 mm did not affect the signals. Further explanations for the response variation are explored in Sect. 3.1.4. As no influence was observed at varying the needle position, we selected 10 mm distance from the bottom for future experiments as a default parameter suggested by the manufacturer.
3.1.4 Optimization of the system and instrumental response evaluation
To better understand the signal decrease of the target compounds, the response from the mixture solutions (Sect. 3.1.3) of the anthropogenic markers in the 50/50 solvent of ultrapure water/ acetonitrile directly injected (vial) is shown in Fig. S6. Stability tests were performed using mixture solutions at 1.5 and 2.5 µg mL−1. A decrease between the first and the third injection was observed for all the compounds, which could be either associated to the stability of the solution or a decrease in the instrumental response. The target markers showed to be stable in solution as a variability <20 % was observed at consecutively injecting them (Table S2, Sect. 3.1.3). Therefore, the stability of the compounds in solution was discarded to have such an influence in the decrease of the response.
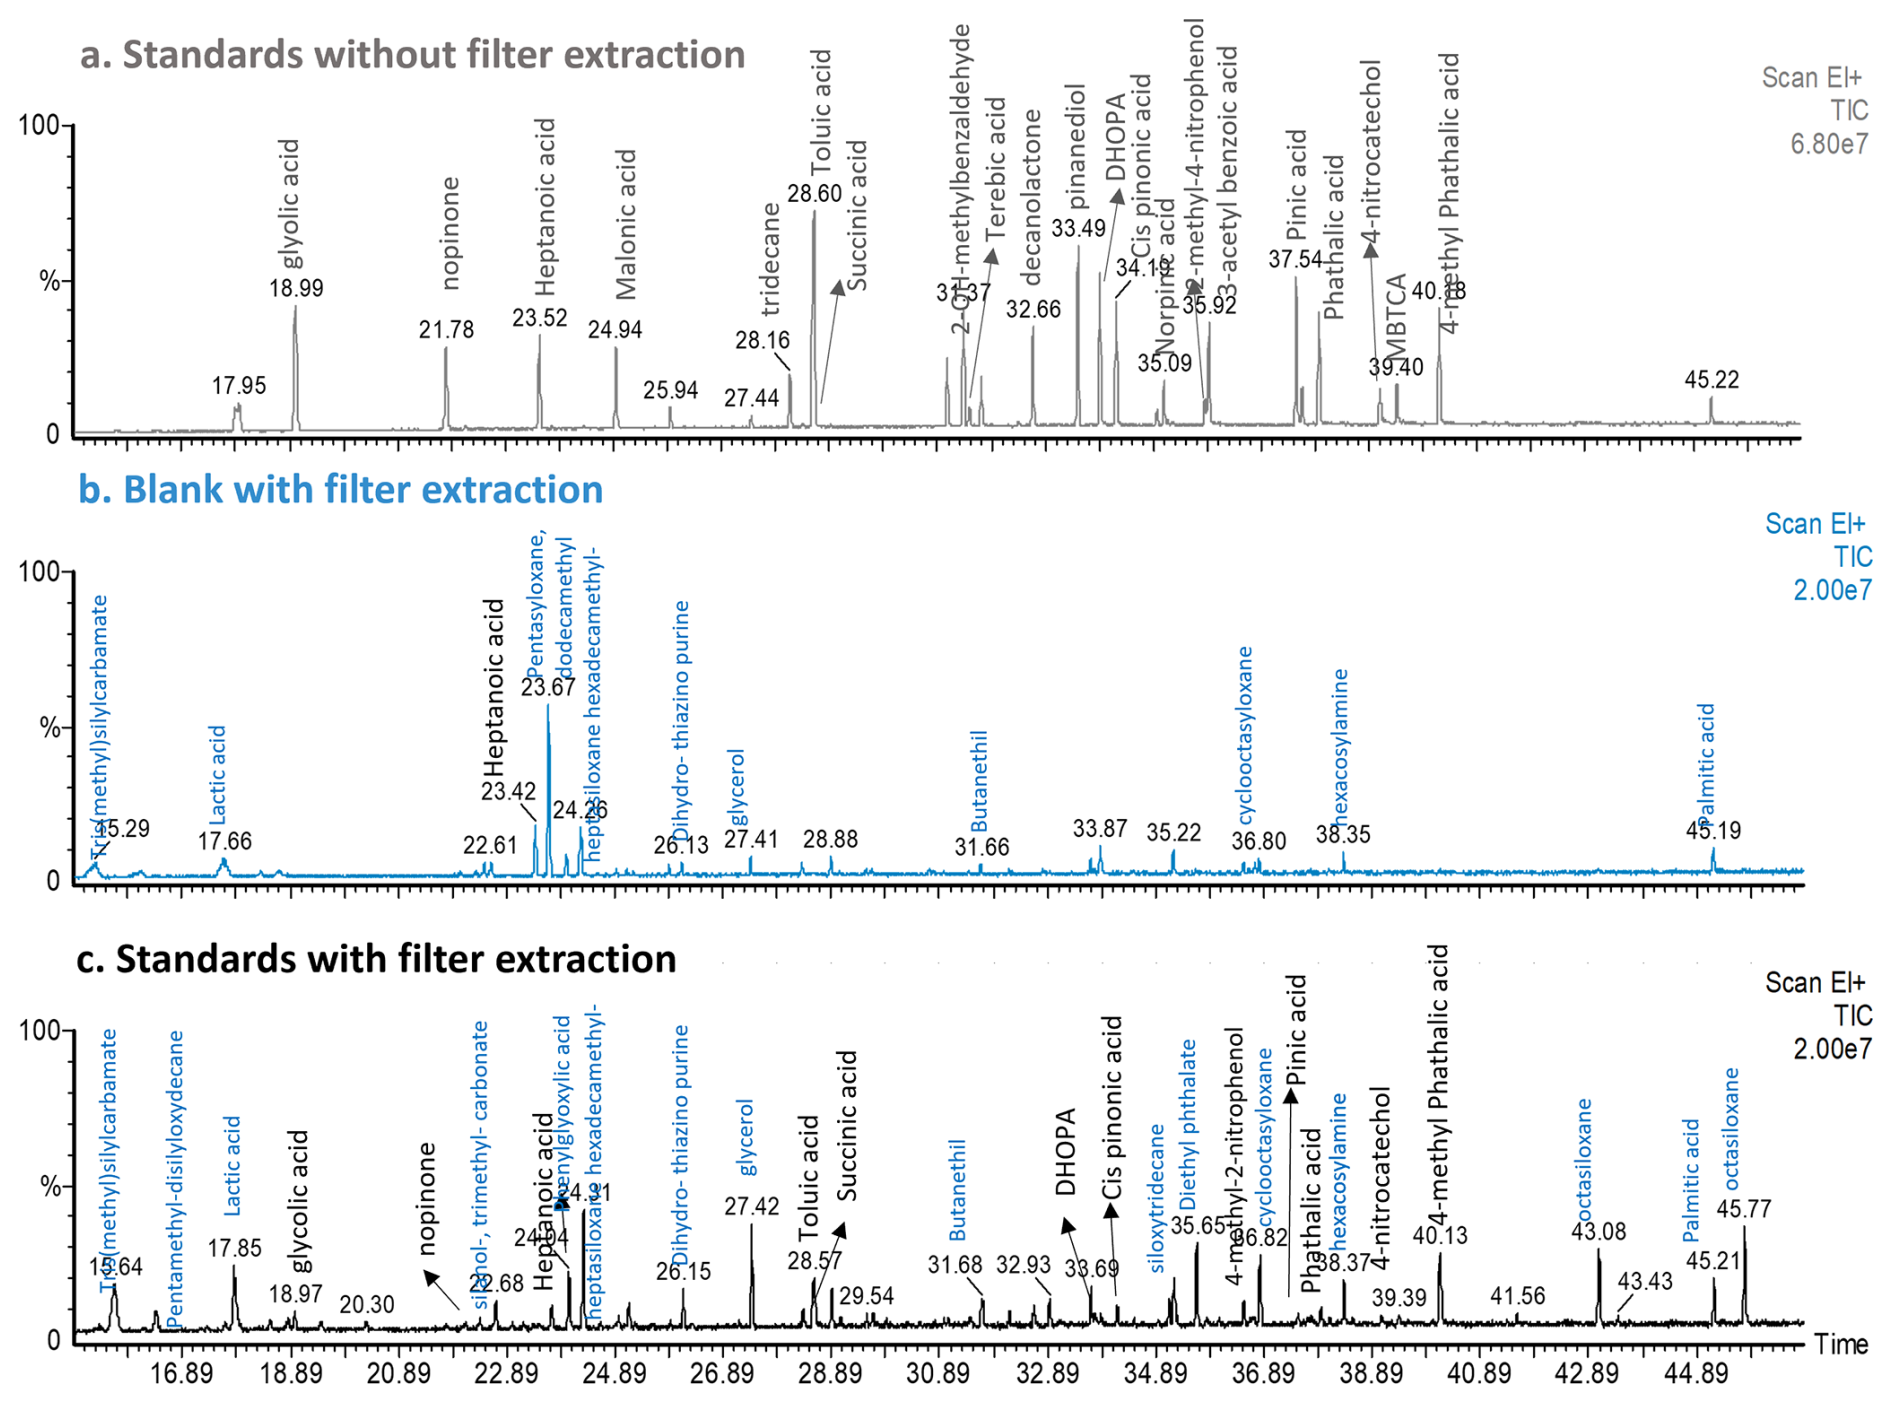
Figure 3TIC Chromatogram of solutions injected directly in the GC-MS after derivatization: (a) Standards without filter extraction, (b) Filter blank and (c) Standards with filter extraction. Standards represent a mixture of anthropogenic and biogenic compounds. Peak assignation for the standards compounds is highlighted in black color, while blue represents the peak identification performed with the NIST library.
A control solution containing a mixture of acetaminophen, leucine enkephalin, sulfadimethoxide, sulfaguanidine and Val-Tyr-Val (Waters), referred to as SST solution hereafter, was systematically used as quality control, injected in 5 replicates at the beginning of each experiment, to assess the quality of the instrument calibration. The same SST solution was injected in 5 replicates before and after a sequence of 34 sample injections (duration approx. 25 h) to monitor the evolution of signal intensity over time. A signal decrease by more than 70 % was observed after the analyzed sequence (Fig. S7), which was associated with an instrumental signal loss since the SST solution is normally stable for up to several months and is thus unlikely degraded by 70 % over a 25h period.
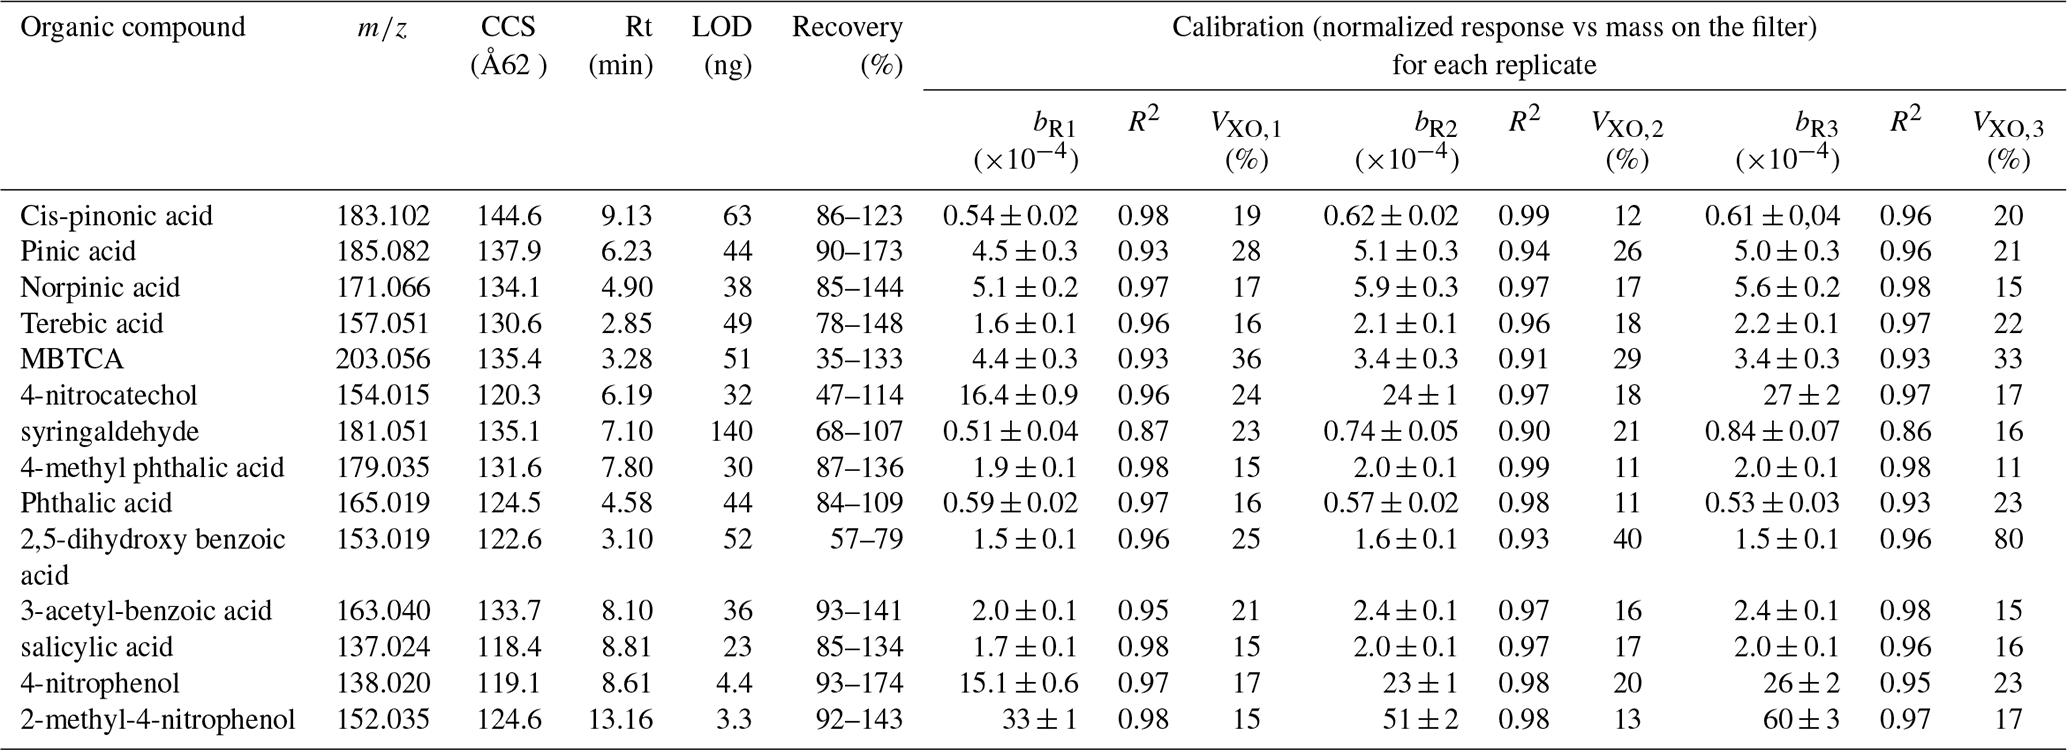
Table 2Mass to charge ratio (), collision cross section (CCS), retention time (Rt), limit of detection (LOD), recovery and calibration information (slope, R2 and VXO) for individual replicates (R1, R2 and R3). Calibrations represent the normalized response (compound response to the internal standard response) versus the mass deposit on the filter. Calibration curves were performed using camphor-10-sulfonic acid as internal standard at 20 µg mL−1 for mixtures of anthropogenic and biogenic standards at concentrations between 10 to 200 µg mL−1. VXO shows the coefficient of variation of the method for each replicate and b the slope.
To follow the signal decrease more precisely over time, we additionally used the LockMass solution (Waters) which is infused continuously at 15 µL min−1 to correct for minor mass deviations in real time throughout whole analysis sequences. The LockMass solution consists of 200 pg µL−1 Leucine-Enkephalin in 50/50 acetonitrile/ultrapure water with 0.1 % formic acid; this solution is normally stable for weeks at ambient temperature. For simple injection-to-injection comparison, the response of the LockMass was extracted by summing the signal (TIC) over the 45 min of each individual infusion (Fig. S8) and we observed a linear decrease in the solution response. Such variation observed at testing the signal evolution over time for the SST and LockMass solutions could only derive from the instrumental signal loss over time. Therefore, calibrations over time were performed during analysis to account for the signal stability (as detailed in Sect. 3.1.5).
Additionally, the cone gas flow was tested at three levels to increase the signal stability: 50, 100 and 150 L h−1 using a fresh mixture at 2.5 µg mL−1 containing the target anthropogenic compounds. As shown in Table S3, similar responses were observed at different levels of cone gas flow for acids. However, at 150 L h−1 a slightly higher response for nitrophenol compounds was observed. Therefore, 150 L h−1 was selected as the cone gas flow for further analysis.
3.1.5 Calibration curves for target compounds
To evaluate the compound response and account for instrumental signal loss, calibrations were performed in sequences on non-consecutive triplicates, using increasing concentrations of mixtures containing the target compounds. Standard solutions containing the biogenic and anthropogenic mixtures of target compounds were prepared in 50/50 ultrapure water/acetonitrile at concentrations of 4, 10, 20, 40, 100, 150 and 200 µg mL−1. For each standard solution, 5 µL of each standard mixture were individually added to clean (baked) quartz filters together with 5 µL of a solution of (1S)-(+)-camphor-10-sulfonic acid as internal standard. The filters were extracted following the procedure of Sect. 2.3.1. Calibration curves were performed by considering the mass of the compound deposited on the filter before extraction.
The variability of the response of the internal standard is represented in Fig. S9. A 60 % decrease in the signal of camphor-10-sulfonic acid was observed between the first and second replicate, with a higher variability (30 %) compared to the replicates 2 and 3 which had a response difference of 5 %. A signal decrease from the first replicate was also observed for most of the calibration standards (Fig. S10). As an instrumental signal decrease was observed, the variations in the compound response between replicates can be attributed to this loss. For the nitrophenol compounds (2-methyl-4-nitrophenol, 4-nitrocatechol and 4-nitrophenol), an apparent increase in the signal response for intermediate concentration was observed. This variability can be influenced by the stability of the solution, possible signal interferences for nitro compounds and matrix effects which can affect individual compound responses, as this behavior was not observed for acids. We consider that a similar effect would occur also on real samples. Therefore, the variation observed for the calibration standards is representative of phenomena affecting the atmospheric sample responses. Carry-over effect on the column was rejected as an explanation as these nitro compounds were not detected in the blanks that were analyzed between replicates.
At normalizing the compound response for the internal standard response, the variability between the replicates decreased for compounds such as 4-methyl phthalic acid, but not for the nitro compounds. Although (1S)-(+)-camphor-10-sulfonic acid (open ring-acid) may not represent the more suitable internal standard for aromatic compounds, this acid shows variations <30 % being representative of most of the target compounds. Therefore, we use the normalization to its response to reduce the uncertainties associated with the system set-up and extraction procedure for the samples analyzed here.
Linear calibrations with high determination coefficients were derived for all target compounds, including those with lower responses. We used sequences of a maximum of 54 injections (approx. 40 h). Because the quantification is replicate-dependent, for each set of experiments, we performed calibrations and sample injection in a consecutive way for each replicate. Calibrations over time in the sequence account for instrumental signal degradation and allows to perform the quantification with the closest replicate. The calibration for each replicate is reported in Table 2, together with the , Rt and CCS values used to identify each compound. For compounds for which the mass derived from the normalized signal present a high variability between the triplicates, only the closest two replicates were considered in the quantification. VXO values for individual calibration replicates showed the increase in the method variability between replicate for compounds such as 2,5-dihydroxy benzoic acid (from 25 % to 40 %), which also showed the lowest recovery. The rest of the compounds, with exception of MBTCA, were associated to VXO values <30 %, showing the good performance of the method at considering linear calibrations. The final individual compound concentrations are reported as the arithmetic mean, and the error associated to their concentrations consider the standard deviation between triplicates and the volume deviation during the sampling.
3.2 GC-MS method development for the quantification of molecular markers
GC-MS analysis with an extra derivatization step with BSTFA was performed to evaluate the response of highly polar compounds and semi-volatile compounds. The GC-MS system used in this work is normally operated with supercritical fluid extraction (SFE) by using CO2, as described in detail in Chiappini et al. (2006). The online SFE-GC-MS has been previously used for the quantification of biogenic (Chiappini et al., 2006) and anthropogenic hydrocarbons (Lamkaddam et al., 2020) and aromatic alkenes (Chiappini et al., 2019). In this work the online SFE extraction procedure described in the original protocol was substituted by liquid extraction of the samples and direct injection in the system.
3.2.1 Evaluation of the target compounds' response
Compound response was evaluated for a mixture of 19 biogenic and anthropogenic markers (Table S1) with and without filter extraction. First, after an over-night derivatization as described in Sect. 2.4.1, a mixture of the target compounds at 6 µg mL−1 was directly injected in the system on the following day. All the compounds added to the mixture were detected (Fig. 3). Therefore, 10 µL of a standard mixture of the target compounds at 50 µg mL−1 (more concentrated to account for dilution) was spiked on a blank filter together with the internal standard and extracted as described in Sect. 2.4. A blank filter containing only the internal standard was simultaneously extracted to identify possible interferences.
As shown in Fig. 3, there was an increase in the background signal represented by a blank filter (blue chromatogram) compared to the standard solution directly injected without any extraction step, but with a derivatization step. Some of the peaks observed in the blank were also present in the filter containing the standards mixture. Those were assigned following the NIST library and most of them were identified as Si-groups such as siloxane and silanol compounds, which can come from impurities present in the quartz filters that appear during the extraction. In contrast to direct injection, not all the compounds (malonic acid, terebic acid) present in the solution were identified, showing possible issues during the extraction procedure and/or derivatization time. It is worth to consider that after extraction, the response of compounds of higher volatility can be influenced by the solvent evaporation step. Another additional peaks can arise from experimental manipulation (e.g., palmitic acid, lactic acid) or impurities present in the quartz filters used.
3.2.2 Analysis of blank contributions from the experimental procedure
As a significant blank contribution was observed, we tested a mixture of acetonitrile HPLC grade (VWR chemical, 99.95 % purity) and the derivatization reagent BSTFA with the different steps of the method. First, the mixture was directly injected into the system and the noise level of Fig. 3 or possible impurities were not observed (grey plot, Fig. S11). Consecutively, the solution containing both components (solvent and BSTFA) was heated following the derivatization protocol, and the peaks previously observed in the blank in Fig. 3 were also present (blue plot, Fig. S11). As this blank contribution could originate from possible impurities derived from the solvent-filter interaction, we evaluated the response of acetonitrile ULC/MS-CC/SFC grade (Biosolve, 99.99 % purity) as it has a higher purity. No improvements in the blank signals were observed by switching the solvent (black plot, Fig. S11). The derivatization procedure is required to allow the decrease in polarity of some target compounds and therefore their identification and quantification. Although blank contributions to the signal were observed (Fig. 3), most of the target compounds could be identified and quantified. Therefore, a blank filter was simultaneously analyzed with each batch of real samples and its contribution was subtracted.
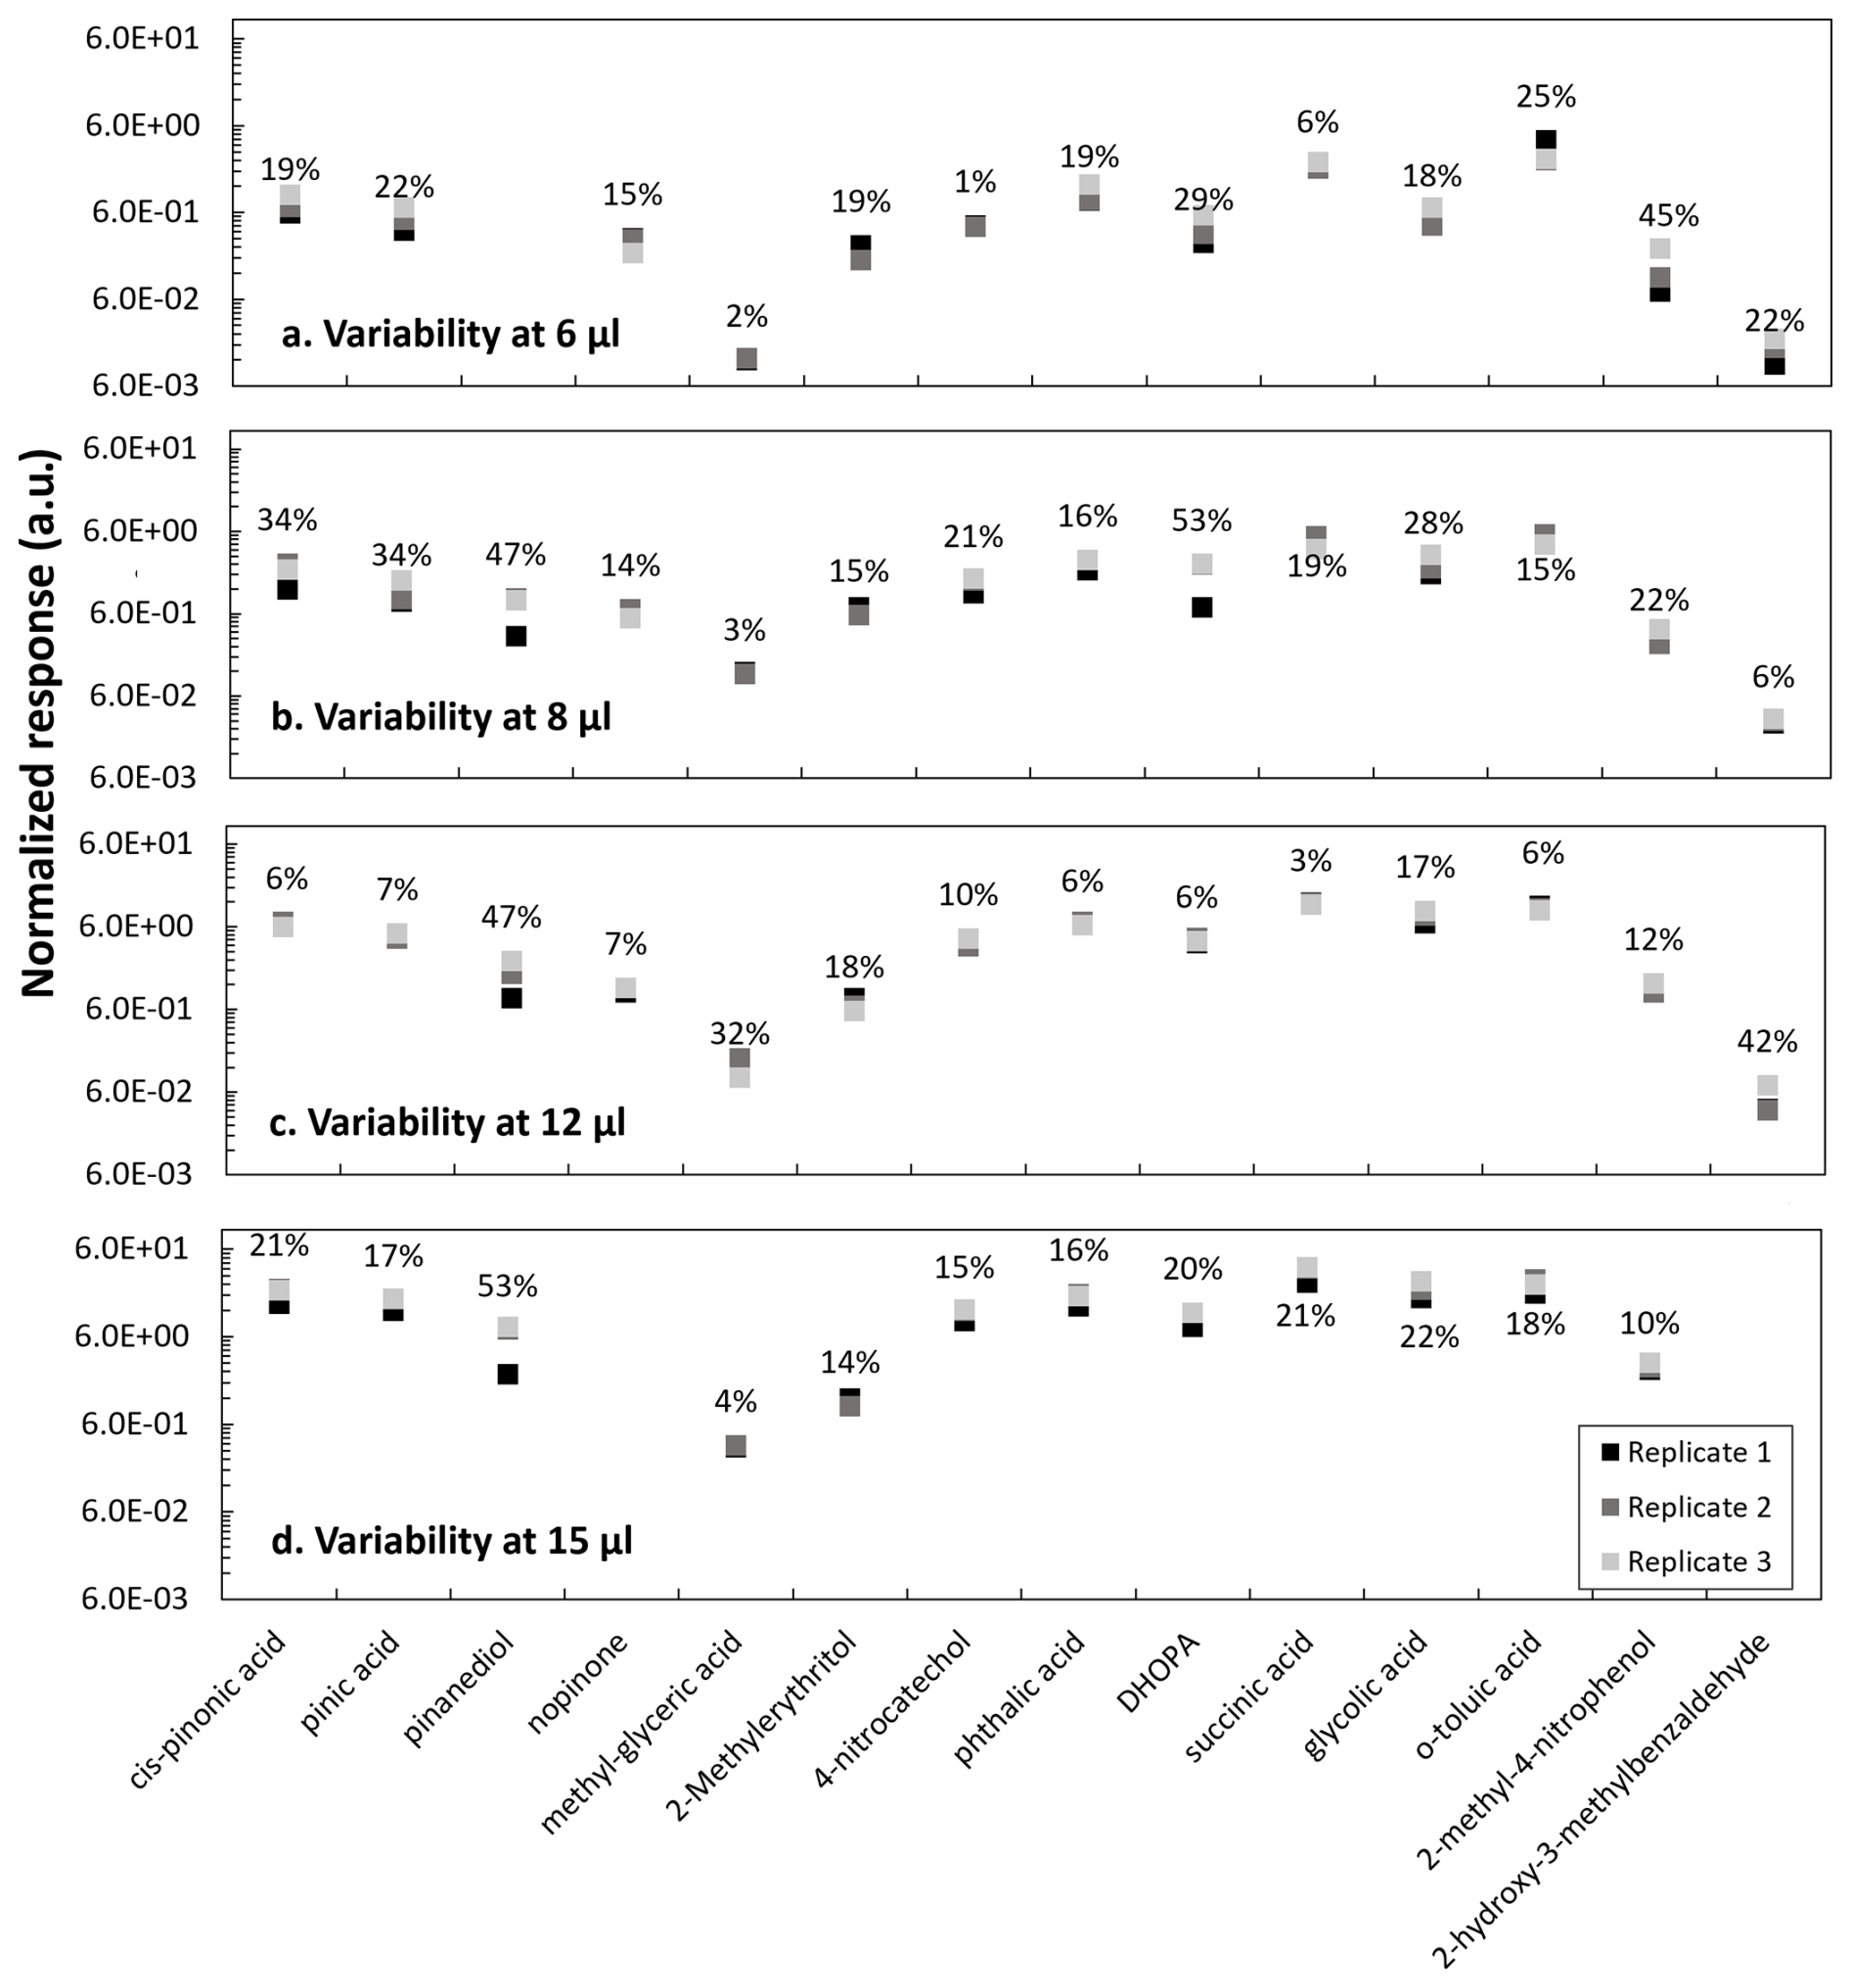
Figure 4Replicates variability at different injection volumes of (a) 6, (b) 8, (c) 12 and (d) 15 µL from a mixture solution of anthropogenic and biogenic standards at 50 µg mL−1 analyzed in the GC-MS. Transition time between replicates injection varies between 3 and 4 d. Compound responses are normalized to the internal standard response.
3.2.3 Evaluation of calibration
As deuterated standards were not commercially available, we selected heptanoic acid as internal standard. In online SFE-GC-MS, tridecane and/or o-toluic acid have been used as internal standards (Chiappini et al., 2006, 2019; Lamkaddam et al., 2020). Here, heptanoic acid was selected over other compounds such as tridecane and octanal due to its higher solubility in acetonitrile and presence of a labile proton, making it more representative of the target compounds (mainly carboxylic acids). The variability between replicates for the heptanoic acid was evaluated with and without filter extraction as shown in Fig. S12. A minimum variability was observed for the peak area without filter extraction (<3 %), while it reached 36 % for solutions extracted from spiked filters. A similar variability between samples and replicates was observed for octanal (30 %), and attributed to the extraction procedure as no influence of the derivatization was found.
From a mixture of biogenic and anthropogenic standards at 50 µg mL−1, volumes of 6, 8, 12 and 15 µL were individually added to quartz filters with a constant volume of 5 µL of a heptanoic acid solution. After filter extraction and analysis, the variability between triplicates for each injection volume was evaluated (Fig. 4). Replicates were injected on different days, within 3 and 4 d from the first injection. The time between injections was selected to best represent typical storage time of real samples, assuring instrumental response and non-significant solution degradation after storage at −18 °C. Longer storage times were not evaluated and are not discussed here.
The proposed method seems suitable for most of the target compounds: cis-pinonic acid, pinic acid, pinanediol, α-methylglyceric acid, 2-methylerythritol, 4-nitrocatechol, phthalic acid, DHOPA, succinic acid, glycolic acid, p-toluic acid and 2-methyl-4-nitrophenol. However, for pinanediol and 2-hydroxy-3-hydrobenzaldehyde (Fig. 4), the variability for the injections at 12 and 15 µL was high and the compounds were not detected in some replicates. The lack of detection of those compounds could derive from an incomplete derivatization after 30 min or enhanced matrix effects at higher concentrations. For other compounds, such as DHOPA and 2-methyl-4-nitrophenol, higher variability was observed at the lowest measured concentrations, close to the LOD.
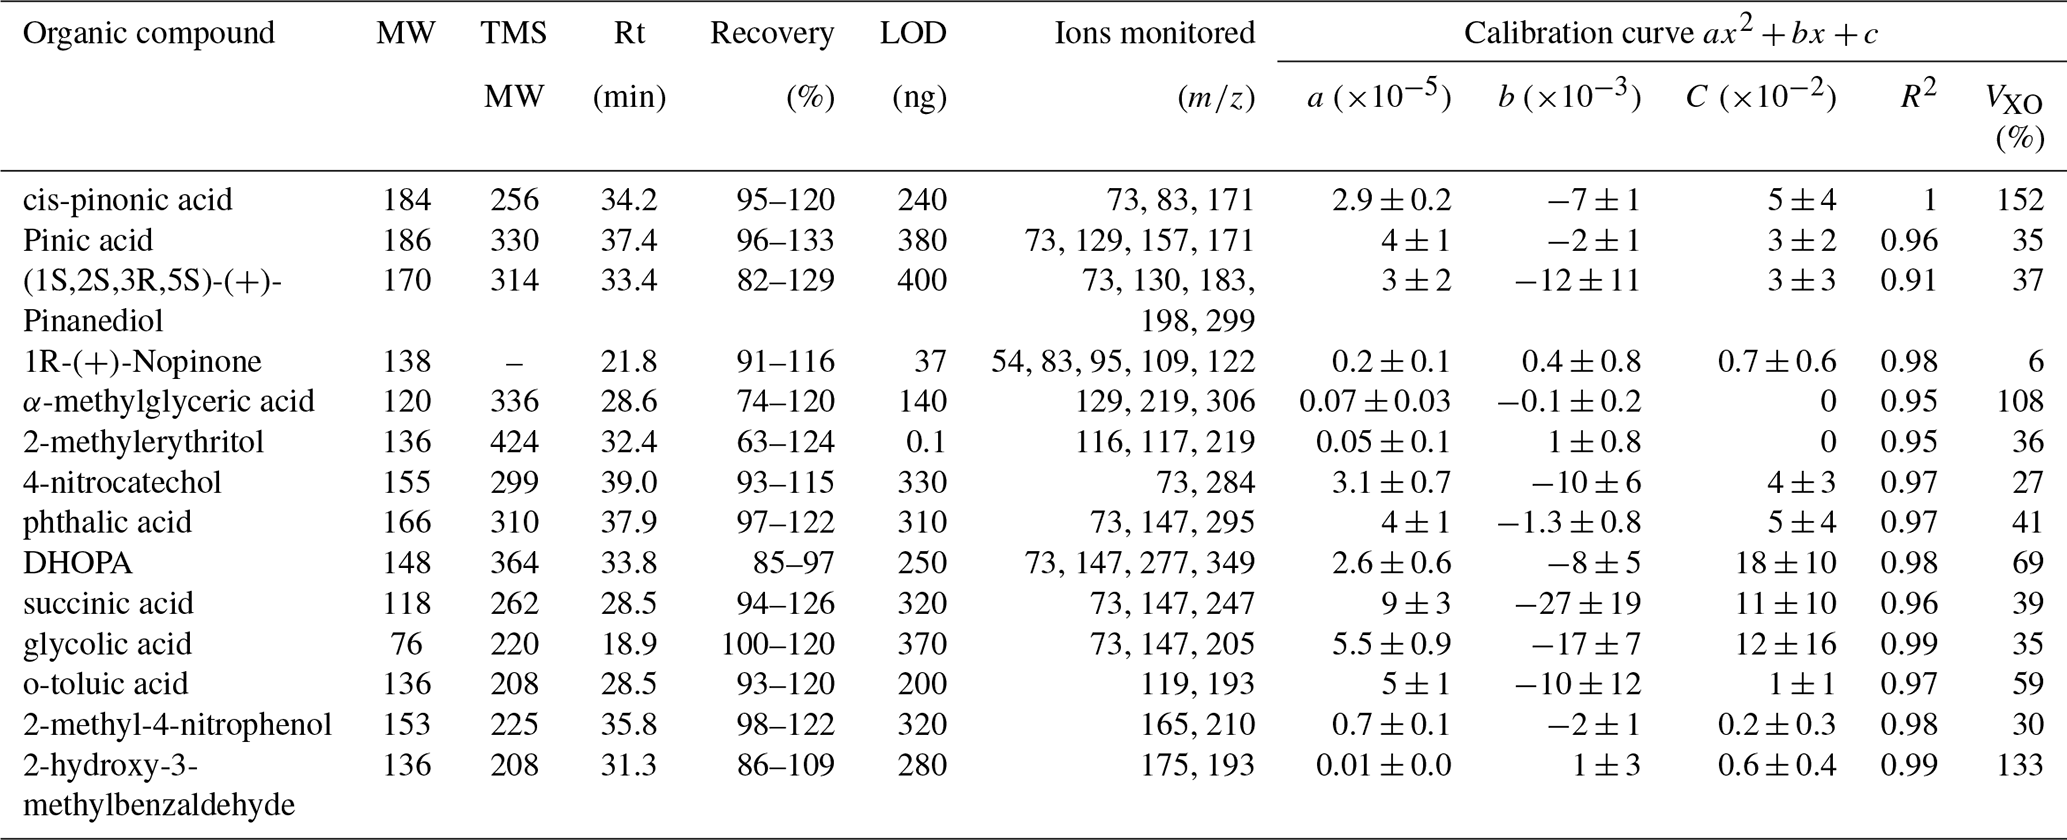
Quadratic calibrations with R2>0.90 were used for the target compounds. The calibration information together with Rt, molecular weight and ions monitored after fragmentation are summarized in Table 3. While quadratic calibrations were more suitable for the GC-MS measurements, the VXO of the method showed higher values than those of the UPLC/ESI-IMS-QTOFMS. The lower performance of this method can be associated with a lower sensitivity. Comparison between both methods is discussed further in Sect. 3.3. Coefficients of variation (CV) are higher for more substituted compounds such as DHOPA and α-methylglyceric acid and compounds with aldehyde functions (2-hydroxy-3-methylbenzaldehyde), showing a lower performance for those compounds. Contrastingly, lower values of CV were observed for nopinone (no derivatization) and acids of lower molecular weight such as glycolic acid and succinic acid. For the rest of the compounds, CV was ∼ 40 %. The final individual compound concentrations are reported with their experimental error obtained from the quadratic fit for the compound mass and the volume deviation during the sampling.
Table 3Molecular weight (MW) before and after TMS derivatisation, retention time (Rt), limit of detection (LOD), ions monitored and calibration information (a, b, c, R2 and VXO). Calibrations represent the normalized response versus the mass deposit on filter. Calibration curves were performed using heptanoic acid as the internal standard at 40 µg mL−1 for two mixtures of anthropogenic and biogenic standards at 50 µg mL−1 adding 6, 8, 12 and 15 µL on filters. VXO shows the coefficient of variation of the method considering a quadratic calibration.
3.3 Methods' validation, application to real samples, and intercomparison
3.3.1 Methods performance comparison
Between UPLC/ESI-IMS-QTOFMS and GC-MS, 23 biogenic and anthropogenic organic markers were quantified, with 5 species being detected by both methods (Tables 2 and 3). Together, those methods allowed for the analysis of a substantial list of aromatic and non-aromatic compounds containing acids, alcohols and aldehyde functions. UPLC/ESI-IMS-QTOFMS offered the advantage of detecting phenol compounds at higher sensitivity. For example, UPLC/ESI-IMS-QTOFMS analysis showed lower values of the LODs (<5 ng) and higher recoveries (92 %–174 %) for 4-nitrophenol and 2-methyl-4-nitrophenol. This was not the case with the other phenol compound (nitrocatechol), which showed lower extraction recoveries (47 %–114 %). For the rest of the organic acids and aldehydes, LOD between 23 and 140 ng were obtained (Table 2). Lower extraction recoveries were additionally observed for more substituted markers such as MBTCA, terebic acid, syringaldehyde and 2,5-dihydroxy benzoic acid. Acceptable values of recoveries are suggested between 70 % and 130 % (Golubović et al., 2019). The higher ranges of recoveries observed for nitrophenol compounds shows the possible influence of the matrix.
As shown in Table 3, LODs for GC-MS were higher than for UPLC/ESI-IMS-QTOFMS, due to its lower sensitivity. Despite the differences in the sensitivity, the extra derivatization step on GC-MS offered the advantage of highly functionalized compounds detection, especially those of higher polarity, enhancing the number of markers that can be quantified. Recovery rates between 82 %–133 % were observed for the biogenic and anthropogenic markers with exception of α-methylglyceric acid, 2-methylerythritol and DHOPA for which recovery rates were lower. For 2-methylerythritol, a polyol with four OH groups susceptible to derivatization with labile protons, the lower recovery rate is attributed to incomplete derivatization, affecting the extraction efficiency. Similarly, α-methylglyceric acid and DHOPA functionalities can derive into three substitutions. Despite the lower LOD values observed by UPLC/ESI-IMS-QTOFMS, a higher recovery rate was observed for 4-nitrocatechol using GC-MS.
Table S4 summarizes LODs values observed in this work compared to those of the literature for some of the target species. Values for pinonic and pinic acids of this work (>44 ng) are higher than those reported by Chiappini et al. (2006). This variability can be attributed to differences in the extraction and derivatization steps performed during GC-MS analysis. Chiappini et al. (2006) performed online SFE, which allows the solvent removal from the separation step, while in this work the presence of the solvent and derivatization reagent mixture contributes to the background signal, influencing the LOD. When comparing with Albinet et al. (2019), LODs were compound dependent as similar values were observed for 2-methylerytritol, but not for pinic and cis-pinonic acids, both using GC-MS but different calibration methodologies. Variations were also observed between LC-MS techniques. For example, King et al. (2019) and Amarandei et al. (2023) provided LOD <5.7 ng mL−1 for terebic acid, lower than the one obtained here. Similar LODs for 4-nitrophenol and 2-methyl-4-nitrophenol were observed in this work (17 and 22 ng mL−1) compared with Hoffmann et al. (2007), but higher than those reported by Ikemori et al. (2019). For syringaldehyde, the LOD was one order of magnitude higher than Hoffmann et al.'s (2007). Such differences among the validation parameters between the different studies can result from instruments sensitivity, sample preparation protocols and calibration types.
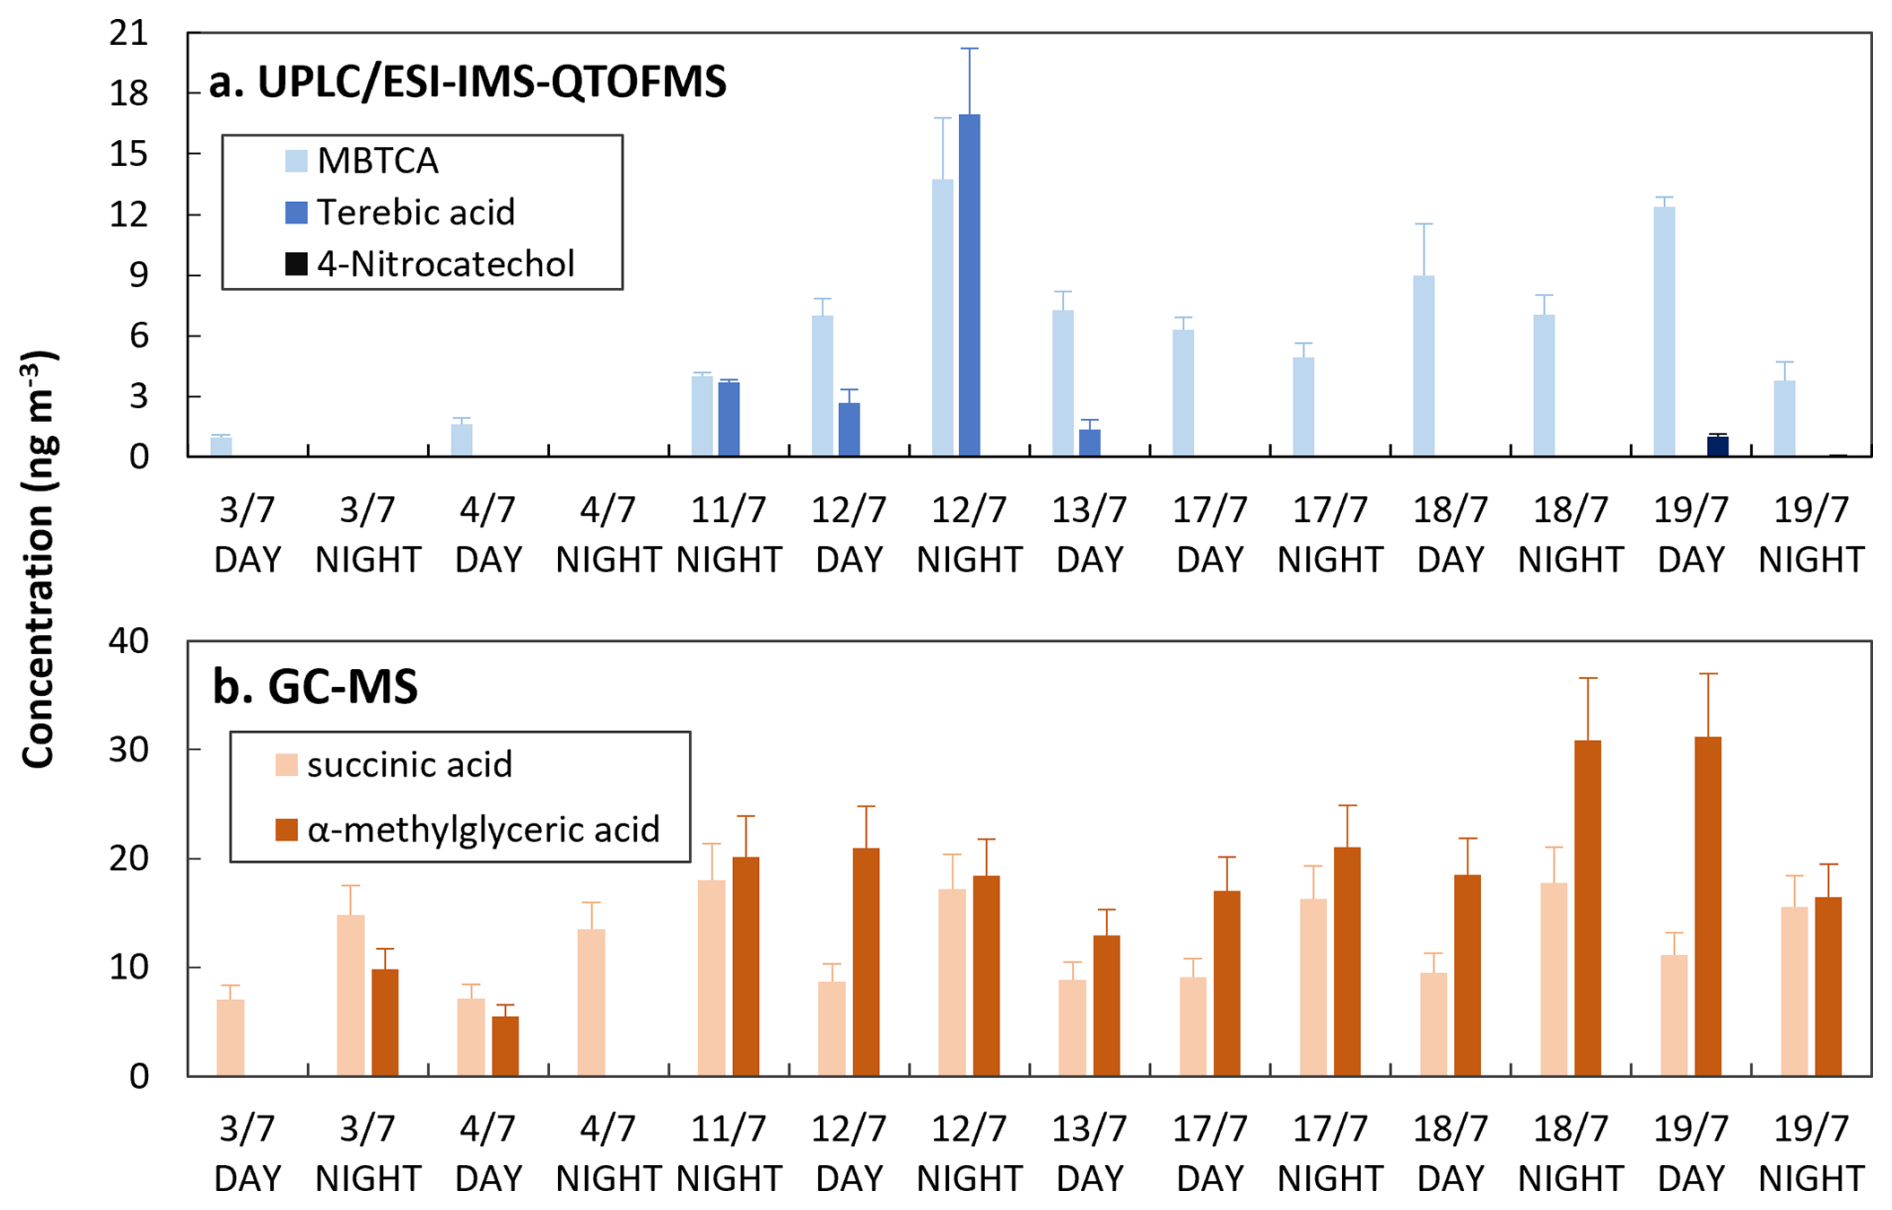
Figure 5Concentrations of a selection of markers of biogenic and anthropogenic origin detected by (a) UPLC/ESI-IMS-QTOFMS and (b) GC-MS analysis of samples collected at the Rambouillet forest (France) during the summer 2022.
3.3.2 Evaluation of UPLC/ESI-IMS-QTOFMS and GC-MS methods on aerosol samples from the Rambouillet forest and intercomparison
Samples collected in the Rambouillet forest were analyzed by both UPLC/ESI-IMS-QTOFMS and GC-MS. Some of the biogenic and anthropogenic markers identified are summarized in Fig. 5.
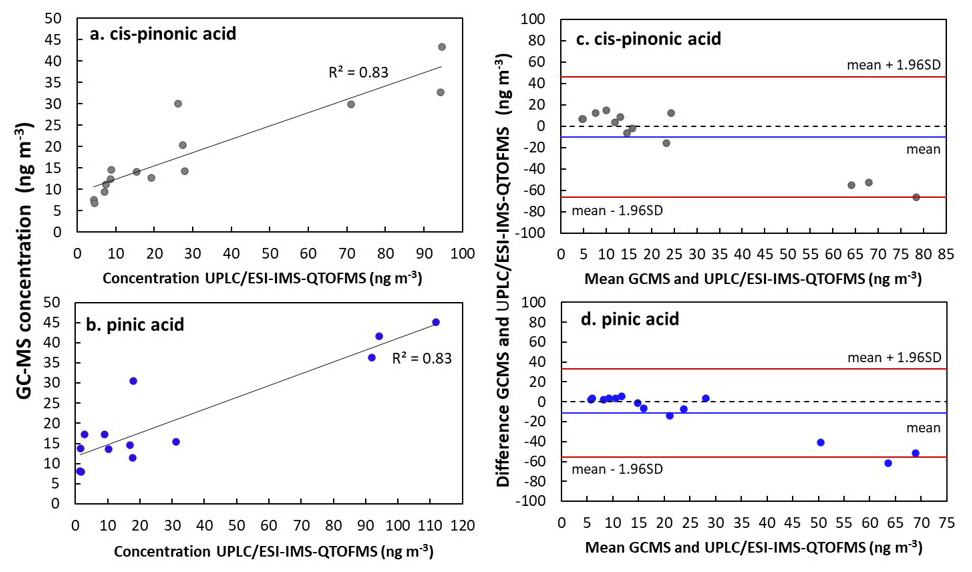
Figure 6Concentration plots (a, b) and Bland-Altman plots (c, d) for comparison of UPLC/ESI-IMS-QTOFMS and GC-MS methods for cis-pinonic acid and pinic acid. Analysis was performed on aerosol samples collected at the Rambouillet forest (France) during the summer 2022. Bland-Altman plots show the difference between UPLC/ESI-IMS-QTOFMS and GC-MS methods. Black and blue lines show the mean of the difference between measurements and red lines represent the upper and lower limits of agreement, which were calculated considering 1.96 times the standard deviation (Bland and Altman, 1999).
Terebic acid was detected in four of the forest samples while MBTCA was detected in most of the samples using UPLC/ESI-IMS-QTOFMS. For GC-MS analysis anthropogenic and biogenic acids such as succinic and α-methylglyceric acid were detected. 4-nitrocatechol, which we considered here as a biomass burning marker, was quantified only during 19 July, where a fire event was reported (Menut et al., 2023). Five common compounds could be detected: cis-pinonic acid, pinic acid, 4-nitrophenol, 2-methyl-4-nitrophenol, and 4-nitrocatechol. Because the concentrations of the nitro-compounds were below the LOD for GC-MS, hereafter we focus on the comparison of cis-pinonic acid and pinic acid. As observed in Fig. 6, the comparison of the concentration values obtained for cis-pinonic acid and pinic acid showed good determination coefficients (8). For cis-pinonic acid, most of the concentration's values obtained by the two methods are similar, except for three samples for which the concentrations obtained by UPLC/ESI-IMS-QTOFMS were about twice or three times higher than those measured by GC-MS. A similar behavior was observed for pinic acid for the highest concentrations. While for the remaining samples, at lower concentrations, values observed by GC-MS were higher than those measured by UPLC/ESI-IMS-QTOFMS.
As shown in the Bland-Altman plots (Fig. 6), measurements between GC-MS and UPLC/ESI-IMS-QTOFMS are comparable as they fall inside the limits of agreement (red lines). However, at comparing the concentration values, a mean difference (reported as mean values in Fig. 6) between both techniques of 11 ng m−3 for cis-pinonic and 10 ng m−3 for pinic acid were observed. Both compounds follow a similar behavior of standard deviation variation on the upper interval, with exception of three measurements, which were systematically closer to the lower limit. Differences between the concentrations observed for both techniques can be influenced by their sensitivity, extraction procedure and sample aging. As discussed in Sect. 2.4.1, the derivatization in GC-MS lowers the polarity of the compounds and influences their detection. Additionally, we assumed that filter samples used here have a homogenous distribution between different pieces used for this analysis, this together with a time of 8 months between UPLC/ESI-IMS-QTOFMS and GC-MS analysis can also introduce discrepancies between the techniques.
In this paper we describe two complementary methods for the quantification of 23 biogenic and anthropogenic molecular markers in SOA collected on filters using UPLC/ESI-IMS-QTOFMS and GC-MS after solvent extraction and derivatization (for GC-MS). Combining the two methods, the quantification of -pinene, mono-and di-aromatic compounds and a few markers of isoprene oxidation products was possible with five common species (cis-pinonic acid, pinic acid, 4-nitrophenol, 2-methyl-4-nitrophenol, and 4-nitrocatechol). Additionally, to the best of our knowledge syringaldehyde and terebic acid detection was achieved for the first time using a single analytical method (UPLC/ESI-IMS-QTOFMS). We observed good recovery rates (between 80 %–130 %), determined through filter extraction, for most of the organic markers with the exception of the most substituted ones for GC-MS (e.g., methylerythritol), nitrophenols and the high polar ones such as 2,5-dihydroxy benzoic acid and MBTCA for UPLC/ESI-IMS-QTOFMS. The latter technique showed a better suitability for the analysis of molecular markers, especially for nitro-compounds with LOD <5 ng, aromatic compounds such as methyl phthalic and salicylic acid (LOD <30 ng) and less polar biogenic markers such as cis-pinonic and pinic acid. GC-MS analysis allowed the identification of smaller organic acids and polyols, improving the range of functionalities that can be detected due to the derivatization step. Common compounds comparison derived from both techniques showed a good agreement between different techniques.
UPLC/ESI-IMS-QTOFMS data treatment was conducted using the software UNIFY 1.9.4.053 (Waters). GC-MS data analysis was performed using the proprietary software TurboMass 6.1.0.1965 (PerkinElmer®).
Organic marker concentrations for the Rambouillet forest are available at the AERIS (French national center for atmospheric data and services, https://across.aeris-data.fr/catalogue, last access: 18 December 2025) facility for species obtained by UPLC/ESI-IMS-QTOFMS and G-CMS.
The supplement related to this article is available online at https://doi.org/10.5194/amt-19-1-2026-supplement.
Conceptualization DLP, AG, ChG, PF; Formal analysis DLP, EM, TB, AG; Funding acquisition AG, PF; Investigation DLP, AG, ChG, PF; Methodology DLP, AG, PF, ChG, EM, TB, CeG; Project administration AG, PF, ChG; Resources AG, PF, ChG; Supervision AG, PF, ChG; Writing original draft DLP, ChG; Writing-review & editing DLP, ChG, AG, PF, EM, TB, CeG, JFD; Final approval of all the authors.
The contact author has declared that none of the authors has any competing interests.
Publisher's note: Copernicus Publications remains neutral with regard to jurisdictional claims made in the text, published maps, institutional affiliations, or any other geographical representation in this paper. The authors bear the ultimate responsibility for providing appropriate place names. Views expressed in the text are those of the authors and do not necessarily reflect the views of the publisher.
This article is part of the special issue “Atmospheric Chemistry of the Suburban Forest – multiplatform observational campaign of the chemistry and physics of mixed urban and biogenic emissions”. It is not associated with a conference.
The authors acknowledge Alexander Albinet for providing the isoprene markers standards and the ACROSS team for their contribution during the samples collection. The authors also acknowledge PRAMMICS Platform from OSU-EFLUVE UMS 3563 for the instrument access.
This work was supported by the project TRAC-AOS-A within the LEFE-CHAT national program from CNRS-INSU and from ADEME. The PhD scholarship of DLP is supported by the IDEX program of the Université Paris Cité. The ACROSS project received funding from the French National Research Agency (ANR) under the program ANR-17-MPGA-0002 and supported by the French National program LEFE of CNRS-INSU.
This paper was edited by Hendrik Fuchs and reviewed by three anonymous referees.
Albinet, A., Lanzafame, G. M., Srivastava, D., Bonnaire, N., Nalin, F., and Wise, S. A.: Analysis and determination of secondary organic aerosol (SOA) tracers (markers) in particulate matter standard reference material (SRM 1649b, urban dust), Anal. Bioanal. Chem., 411, 5975–5983, https://doi.org/10.1007/s00216-019-02015-6, 2019.
Al-Naiema, I. M. and Stone, E. A.: Evaluation of anthropogenic secondary organic aerosol tracers from aromatic hydrocarbons, Atmos. Chem. Phys., 17, 2053–2065, https://doi.org/10.5194/acp-17-2053-2017, 2017.
Amarandei, C., Olariu, R. I., and Arsene, C.: Offline analysis of secondary formation markers in ambient organic aerosols by liquid chromatography coupled with time-of-flight mass spectrometry, Journal of Chromatography A, 1702, 464092, https://doi.org/10.1016/j.chroma.2023.464092, 2023.
Bland, J. M. and Altman, D. G.: Comparing methods of measurement: why plotting difference against standard method is misleading, The Lancet, 346, 1085–1087, https://doi.org/10.1016/S0140-6736(95)91748-9, 1995.
Bland, J. M. and Altman, D. G.: Measuring agreement in method comparison studies, Stat. Methods Med. Res., 8, 135–160, https://doi.org/10.1177/096228029900800204, 1999.
Cantrell, C. and Michoud, V.: An Experiment to Study Atmospheric Oxidation Chemistry and Physics of Mixed Anthropogenic–Biogenic Air Masses in the Greater Paris Area, BAMS, 599–603, https://doi.org/10.1175/BAMS-D-21-0115.1, 2022.
Chiappini, L., Perraudin, E., Durand-Jolibois, R., and Doussin, J. F.: Development of a supercritical fluid extraction–gas chromatography–mass spectrometry method for the identification of highly polar compounds in secondary organic aerosols formed from biogenic hydrocarbons in smog chamber experiments, Anal. Bioanal. Chem., 386, 1749–1759, https://doi.org/10.1007/s00216-006-0744-3, 2006.
Chiappini, L., Perraudin, E., Maurin, N., Picquet-Varrault, B., Zheng, W., Marchand, N., Temime-Roussel, B., Monod, A., Le Person, A., Bernard, F., Eyglunent, G., Mellouki, A., and Doussin, J.-F.: Secondary Organic Aerosol Formation from Aromatic Alkene Ozonolysis: Influence of the Precursor Structure on Yield, Chemical Composition, and Mechanism, J. Phys. Chem. A, 123, 1469–1484, https://doi.org/10.1021/acs.jpca.8b10394, 2019.
Chien, C.-J., Charles, M. J., Sexton, K. G., and Jeffries, H. E.: Analysis of Airborne Carboxylic Acids and Phenols as Their Pentafluorobenzyl Derivatives: Gas Chromatography/Ion Trap Mass Spectrometry with a Novel Chemical Ionization Reagent, PFBOH, Environ. Sci. Technol., 32, 299–309, https://doi.org/10.1021/es970526s, 1998.
Claeys, M. and Maenhaut, W.: Secondary Organic Aerosol Formation from Isoprene: Selected Research, Historic Account and State of the Art, Atmosphere, 12, 728, https://doi.org/10.3390/atmos12060728, 2021.
Claeys, M., Graham, B., Vas, G., Wang, W., Vermeylen, R., Pashynska, V., Cafmeyer, J., Guyon, P., Andreae, M. O., Artaxo, P., and Maenhaut, W.: Formation of Secondary Organic Aerosols Through Photooxidation of Isoprene, Science, 303, 1173–1176, https://doi.org/10.1126/science.1092805, 2004.
Claeys, M., Szmigielski, R., Kourtchev, I., Van Der Veken, P., Vermeylen, R., Maenhaut, W., Jaoui, M., Kleindienst, T. E., Lewandowski, M., Offenberg, J. H., and Edney, E. O.: Hydroxydicarboxylic Acids: Markers for Secondary Organic Aerosol from the Photooxidation of α-Pinene, Environ. Sci. Technol., 41, 1628–1634, https://doi.org/10.1021/es0620181, 2007.
Claeys, M., Iinuma, Y., Szmigielski, R., Surratt, J. D., Blockhuys, F., Van Alsenoy, C., Böge, O., Sierau, B., Gómez-González, Y., Vermeylen, R., Van Der Veken, P., Shahgholi, M., Chan, A. W. H., Herrmann, H., Seinfeld, J. H., and Maenhaut, W.: Terpenylic Acid and Related Compounds from the Oxidation of α-Pinene: Implications for New Particle Formation and Growth above Forests, Environ. Sci. Technol., 43, 6976–6982, https://doi.org/10.1021/es9007596, 2009.
Cochran, R. E., Dongari, N., Jeong, H., Beránek, J., Haddadi, S., Shipp, J., and Kubátová, A.: Determination of polycyclic aromatic hydrocarbons and their oxy-, nitro-, and hydroxy-oxidation products, Analytica Chimica Acta, 740, 93–103, https://doi.org/10.1016/j.aca.2012.05.050, 2012.
Edney, E. O., Kleindienst, T. E., Jaoui, M., Lewandowski, M., Offenberg, J. H., Wang, W., and Claeys, M.: Formation of 2-methyl tetrols and 2-methylglyceric acid in secondary organic aerosol from laboratory irradiated isoprene/NOX/SO2/air mixtures and their detection in ambient PM2.5 samples collected in the eastern United States, Atmos. Environ., 39, 5281–5289, https://doi.org/10.1016/j.atmosenv.2005.05.031, 2005.
Fan, W., Chen, T., Zhu, Z., Zhang, H., Qiu, Y., and Yin, D.: A review of secondary organic aerosols formation focusing on organosulfates and organic nitrates, J. Hazard. Mater., 430, 128406, https://doi.org/10.1016/j.jhazmat.2022.128406, 2022.
F-DGSi: CALYPSO Nitrogen Gas Generator for LCMS, Innovative Gas System Company, https://www.f-dgs.com/wp-content/uploads/2022/03/CALYPSO-DOC-EN-FDGSI.pdf (last access: 18 December 2025), 2023.
Forstner, H. J. L., Flagan, R. C., and Seinfeld, J. H.: Secondary Organic Aerosol from the Photooxidation of Aromatic Hydrocarbons: Molecular Composition, Environ. Sci. Technol., 31, 1345–1358, https://doi.org/10.1021/es9605376, 1997.
Gao, K., Zhang, Y., Liu, Y., Yang, M., and Zhu, T.: Screening of imidazoles in atmospheric aerosol particles using a hybrid targeted and untargeted method based on ultra-performance liquid chromatography-quadrupole time-of-flight mass spectrometry, Anal. Chim. Acta, 1163, 338516, https://doi.org/10.1016/j.aca.2021.338516, 2021.
Golubović, J., Heath, E., and Heath, D.: Validation challenges in liquid chromatography-tandem mass spectrometry methods for the analysis of naturally occurring compounds in foodstuffs, Food Chemistry, 294, 46–55, https://doi.org/10.1016/j.foodchem.2019.04.069, 2019.
Grace, D. N., Sebold, M. B., and Galloway, M. M.: Separation and detection of aqueous atmospheric aerosol mimics using supercritical fluid chromatography–mass spectrometry, Atmos. Meas. Tech., 12, 3841–3851, https://doi.org/10.5194/amt-12-3841-2019, 2019.
Hallquist, M., Wenger, J. C., Baltensperger, U., Rudich, Y., Simpson, D., Claeys, M., Dommen, J., Donahue, N. M., George, C., Goldstein, A. H., Hamilton, J. F., Herrmann, H., Hoffmann, T., Iinuma, Y., Jang, M., Jenkin, M. E., Jimenez, J. L., Kiendler-Scharr, A., Maenhaut, W., McFiggans, G., Mentel, Th. F., Monod, A., Prévôt, A. S. H., Seinfeld, J. H., Surratt, J. D., Szmigielski, R., and Wildt, J.: The formation, properties and impact of secondary organic aerosol: current and emerging issues, Atmos. Chem. Phys., 9, 5155–5236, https://doi.org/10.5194/acp-9-5155-2009, 2009.
Hamilton, J., Webb, P., Lewis, A., and Reviejo, M.: Quantifying small molecules in secondary organic aerosol formed during the photo-oxidation of toluene with hydroxyl radicals, Atmospheric Environment, 39, 7263–7275, https://doi.org/10.1016/j.atmosenv.2005.09.006, 2005.
Herrmann, H. and Mutzel, A.: First laboratory-intercomparison on biogenic SOA marker compounds – Overview and first results, Vienna, Austria, 7–12 April 2019.
Hoffmann, D., Iinuma, Y., and Herrmann, H.: Development of a method for fast analysis of phenolic molecular markers in biomass burning particles using high performance liquid chromatography/atmospheric pressure chemical ionisation mass spectrometry, J. Chromatogr. A, 1143, 168–175, https://doi.org/10.1016/j.chroma.2007.01.035, 2007.
Hu, D., Bian, Q., Li, T. W. Y., Lau, A. K. H., and Yu, J. Z.: Contributions of isoprene, monoterpenes, β -caryophyllene, and toluene to secondary organic aerosols in Hong Kong during the summer of 2006, J. Geophys. Res., 113, 2008JD010437, https://doi.org/10.1029/2008JD010437, 2008.
Hubaux, A. and Vos, G.: Decision and detection limits for calibration curves, Anal. Chem. 42, 849–855, https://doi.org/10.1021/AC60290A013, 1970.
Hutchinson, J. P., Remenyi, T., Nesterenko, P., Farrell, W., Groeber, E., Szucs, R., Dicinoski, G., and Haddad, P. R.: Investigation of polar organic solvents compatible with Corona Charged Aerosol Detection and their use for the determination of sugars by hydrophilic interaction liquid chromatography, Analytica Chimica Acta, 750, 199–206, https://doi.org/10.1016/j.aca.2012.04.002, 2012.
Iinuma, Y., Böge, O., Gräfe, R., and Herrmann, H.: Methyl-Nitrocatechols: Atmospheric Tracer Compounds for Biomass Burning Secondary Organic Aerosols, Environ. Sci. Technol., 44, 8453–8459, https://doi.org/10.1021/es102938a, 2010.
Ikemori, F., Nakayama, T., and Hasegawa, H.: Characterization and possible sources of nitrated mono- and di-aromatic hydrocarbons containing hydroxyl and/or carboxyl functional groups in ambient particles in Nagoya, Japan, Atmos. Environ., 211, 91–102, https://doi.org/10.1016/j.atmosenv.2019.05.009, 2019.
Jang, M. and Kamens, R. M.: Characterization of Secondary Aerosol from the Photooxidation of Toluene in the Presence of NOx and 1-Propene, Environ. Sci. Technol., 35, 3626–3639, https://doi.org/10.1021/es010676+, 2001.
Jimenez, J. L., Canagaratna, M. R., Donahue, N. M., Prevot, A. S. H., Zhang, Q., Kroll, J. H., DeCarlo, P. F., Allan, J. D., Coe, H., Ng, N. L., Aiken, A. C., Docherty, K. S., Ulbrich, I. M., Grieshop, A. P., Robinson, A. L., Duplissy, J., Smith, J. D., Wilson, K. R., Lanz, V. A., Hueglin, C., Sun, Y. L., Tian, J., Laaksonen, A., Raatikainen, T., Rautiainen, J., Vaattovaara, P., Ehn, M., Kulmala, M., Tomlinson, J. M., Collins, D. R., Cubison, M. J., E., Dunlea, J., Huffman, J. A., Onasch, T. B., Alfarra, M. R., Williams, P. I., Bower, K., Kondo, Y., Schneider, J., Drewnick, F., Borrmann, S., Weimer, S., Demerjian, K., Salcedo, D., Cottrell, L., Griffin, R., Takami, A., Miyoshi, T., Hatakeyama, S., Shimono, A., Sun, J. Y., Zhang, Y. M., Dzepina, K., Kimmel, J. R., Sueper, D., Jayne, J. T., Herndon, S. C., Trimborn, A. M., Williams, L. R., Wood, E. C., Middlebrook, A. M., Kolb, C. E., Baltensperger, U., and Worsnop, D. R.: Evolution of Organic Aerosols in the Atmosphere, Science, 326, 1525–1529, https://doi.org/10.1126/science.1180353, 2009.
Kaufmann, A., Butcher, P., Maden, K., Walker, S., Widmer, M., and Kaempf, R.: Improved method robustness and ruggedness in liquid chromatography–mass spectrometry by increasing the acid content of the mobile phase, Journal of Chromatography A, 1717, 464694, https://doi.org/10.1016/j.chroma.2024.464694, 2024.
King, A. C. F., Giorio, C., Wolff, E., Thomas, E., Karroca, O., Roverso, M., Schwikowski, M., Tapparo, A., Gambaro, A., and Kalberer, M.: A new method for the determination of primary and secondary terrestrial and marine biomarkers in ice cores using liquid chromatography high-resolution mass spectrometry, Talanta, 194, 233–242, https://doi.org/10.1016/j.talanta.2018.10.042, 2019.
Kleindienst, T. E., Conver, T. S., McIver, C. D., and Edney, E. O.: Determination of Secondary Organic Aerosol Products from the Photooxidation of Toluene and their Implications in Ambient PM2.5, Journal of Atmospheric Chemistry, 47, 79–100, https://doi.org/10.1023/B:JOCH.0000012305.94498.28, 2004.
Kleindienst, T. E., Jaoui, M., Lewandowski, M., Offenberg, J. H., Lewis, C. W., Bhave, P. V., and Edney, E. O.: Estimates of the contributions of biogenic and anthropogenic hydrocarbons to secondary organic aerosol at a southeastern US location, Atmos. Environ., 41, 8288–8300, https://doi.org/10.1016/j.atmosenv.2007.06.045, 2007.
Kleindienst, T. E., Jaoui, M., Lewandowski, M., Offenberg, J. H., and Docherty, K. S.: The formation of SOA and chemical tracer compounds from the photooxidation of naphthalene and its methyl analogs in the presence and absence of nitrogen oxides, Atmos. Chem. Phys., 12, 8711–8726, https://doi.org/10.5194/acp-12-8711-2012, 2012.
Kumar, D., Gautam, N., and Alnouti, Y.: Analyte recovery in LC-MS/MS bioanalysis: An old issue revisited, Analytica Chimica Acta, 1198, 339512, https://doi.org/10.1016/j.aca.2022.339512, 2022.
Laj, P., Lund Myhre, C., Riffault, V., Amiridis, V., Fuchs, H., Eleftheriadis, K., Petäjä, T., Salameh, T., Kivekäs, N., Juurola, E., Saponaro, G., Philippin, S., Cornacchia, C., Alados Arboledas, L., Baars, H., Claude, A., De Mazière, M., Dils, B., Dufresne, M., Evangeliou, N., Favez, O., Fiebig, M., Haeffelin, M., Herrmann, H., Höhler, K., Illmann, N., Kreuter, A., Ludewig, E., Marinou, E., Möhler, O., Mona, L., Eder Murberg, L., Nicolae, D., Novelli, A., O'Connor, E., Ohneiser, K., Petracca Altieri, R. M., Picquet-Varrault, B., Van Pinxteren, D., Pospichal, B., Putaud, J.-P., Reimann, S., Siomos, N., Stachlewska, I., Tillmann, R., Voudouri, K. A., Wandinger, U., Wiedensohler, A., Apituley, A., Comerón, A., Gysel-Beer, M., Mihalopoulos, N., Nikolova, N., Pietruczuk, A., Sauvage, S., Sciare, J., Skov, H., Svendby, T., Swietlicki, E., Tonev, D., Vaughan, G., Zdimal, V., Baltensperger, U., Doussin, J.-F., Kulmala, M., Pappalardo, G., Sorvari Sundet, S., and Vana, M.: Aerosol, Clouds and Trace Gases Research Infrastructure (ACTRIS): The European Research Infrastructure Supporting Atmospheric Science, Bulletin of the American Meteorological Society, 105, E1098–E1136, https://doi.org/10.1175/BAMS-D-23-0064.1, 2024.
Lamkaddam, H., Gratien, A., Pangui, E., David, M., Peinado, F., Polienor, J.-M., Jerome, M., Cazaunau, M., Gaimoz, C., Picquet-Varrault, B., Kourtchev, I., Kalberer, M., and Doussin, J.-F.: Role of Relative Humidity in the Secondary Organic Aerosol Formation from High-NOx Photooxidation of Long-Chain Alkanes: n-Dodecane Case Study, ACS Earth Space Chem., 4, 2414–2425, https://doi.org/10.1021/acsearthspacechem.0c00265, 2020.
Lanzafame, G. M., Srivastava, D., Favez, O., Bandowe, B. A. M., Shahpoury, P., Lammel, G., Bonnaire, N., Alleman, L. Y., Couvidat, F., Bessagnet, B., and Albinet, A.: One-year measurements of secondary organic aerosol (SOA) markers in the Paris region (France): Concentrations, gas/particle partitioning and SOA source apportionment, Sci. Total Environ., 757, 143921, https://doi.org/10.1016/j.scitotenv.2020.143921, 2021.
Liigand, J., Kruve, A., Leito, I., Girod, M., and Antoine, R.: Effect of Mobile Phase on Electrospray Ionization Efficiency, J. Am. Soc. Mass Spectrom., 25, 1853–1861, https://doi.org/10.1007/s13361-014-0969-x, 2014.
Menut, L., Cholakian, A., Siour, G., Lapere, R., Pennel, R., Mailler, S., and Bessagnet, B.: Impact of Landes forest fires on air quality in France during the 2022 summer, Atmos. Chem. Phys., 23, 7281–7296, https://doi.org/10.5194/acp-23-7281-2023, 2023.
Miele: Mode d'emploi: Laveur-désinfecteur pour verrerie de laboratoire et ustensiles de laboratoire PG 8593, https://media.miele.com/downloads/82/36/00_F6154D09FD151EECAB8614B05D228236.pdf (last access: 18 December 2025), 2022.
Mothes, F. and Herrmann, H.: 1st OGTAC-CC community meeting, Leibniz Institute for Tropospheric Research (TROPOS), Leipzig, Germany, https://www.actris-ecac.eu/units-ogtac-cc.html#pdf1 (last access: 18 December 2025), 2024.
Nozière, B., Kalberer, M., Claeys, M., Allan, J., D'Anna, B., Decesari, S., Finessi, E., Glasius, M., Grgić, I., Hamilton, J. F., Hoffmann, T., Iinuma, Y., Jaoui, M., Kahnt, A., Kampf, C. J., Kourtchev, I., Maenhaut, W., Marsden, N., Saarikoski, S., Schnelle-Kreis, J., Surratt, J. D., Szidat, S., Szmigielski, R., and Wisthaler, A.: The Molecular Identification of Organic Compounds in the Atmosphere: State of the Art and Challenges, Chem. Rev., 115, 3919–3983, https://doi.org/10.1021/cr5003485, 2015.
Orata, F.: Derivatization Reactions and Reagents for Gas Chromatography Analysis, in: Advanced Gas Chromatography - Progress in Agricultural, Biomedical and Industrial Applications, edited by: Ali Mohd, M., InTech, https://doi.org/10.5772/33098, 2012.
Pashynska, V., Vermeylen, R., Vas, G., Maenhaut, W., and Claeys, M.: Development of a gas chromatographic/ion trap mass spectrometric method for the determination of levoglucosan and saccharidic compounds in atmospheric aerosols. Application to urban aerosols, J. Mass Spectrom., 37, 1249–1257, https://doi.org/10.1002/jms.391, 2002.
Pereira, D. L., Giorio, C., Gratien, A., Zherebker, A., Noyalet, G., Chevaillier, S., Alage, S., Almarj, E., Bergé, A., Bertin, T., Cazaunau, M., Coll, P., Di Antonio, L., Harb, S., Heuser, J., Gaimoz, C., Guillemant, O., Language, B., Lauret, O., Macias, C., Maisonneuve, F., Picquet-Varrault, B., Torres, R., Triquet, S., Zapf, P., Hawkins, L., Pronovost, D., Riley, S., Flaud, P.-M., Perraudin, E., Pouyes, P., Villenave, E., Albinet, A., Favez, O., Aujay-Plouzeau, R., Michoud, V., Cantrell, C., Cirtog, M., Di Biagio, C., Doussin, J.-F., and Formenti, P.: Molecular characterization of organic aerosols in urban and forested areas of Paris using high-resolution mass spectrometry, Atmos. Chem. Phys., 25, 4885–4905, https://doi.org/10.5194/acp-25-4885-2025, 2025.
Sato, K., Hatakeyama, S., and Imamura, T.: Secondary Organic Aerosol Formation during the Photooxidation of Toluene: NOx Dependence of Chemical Composition, J. Phys. Chem. A, 111, 9796–9808, https://doi.org/10.1021/jp071419f, 2007.
Sato, K., Ikemori, F., Ramasamy, S., Iijima, A., Kumagai, K., Fushimi, A., Fujitani, Y., Chatani, S., Tanabe, K., Takami, A., Tago, H., Saito, Y., Saito, S., Hoshi, J., and Morino, Y.: Formation of secondary organic aerosol tracers from anthropogenic and biogenic volatile organic compounds under varied NO and oxidant conditions, Atmospheric Environment: X, 14, 100169, https://doi.org/10.1016/j.aeaoa.2022.100169, 2022.
Srivastava, D., Favez, O., Perraudin, E., Villenave, E., and Albinet, A.: Comparison of Measurement-Based Methodologies to Apportion Secondary Organic Carbon (SOC) in PM2.5: A Review of Recent Studies, Atmosphere, 9, 452, https://doi.org/10.3390/atmos9110452, 2018a.
Srivastava, D., Tomaz, S., Favez, O., Lanzafame, G. M., Golly, B., Besombes, J.-L., Alleman, L. Y., Jaffrezo, J.-L., Jacob, V., Perraudin, E., Villenave, E., and Albinet, A.: Speciation of organic fraction does matter for source apportionment. Part 1: A one-year campaign in Grenoble (France), Sci. Total Environ., 624, 1598–1611, https://doi.org/10.1016/j.scitotenv.2017.12.135, 2018b.
Surratt, J. D., Kroll, J. H., Kleindienst, T. E., Edney, E. O., Claeys, M., Sorooshian, A., Ng, N. L., Offenberg, J. H., Lewandowski, M., Jaoui, M., Flagan, R. C., and Seinfeld, J. H.: Evidence for Organosulfates in Secondary Organic Aerosol, Environ. Sci. Technol., 41, 517–527, https://doi.org/10.1021/es062081q, 2007.
Surratt, J. D., Gómez-González, Y., Chan, A. W. H., Vermeylen, R., Shahgholi, M., Kleindienst, T. E., Edney, E. O., Offenberg, J. H., Lewandowski, M., Jaoui, M., Maenhaut, W., Claeys, M., Flagan, R. C., and Seinfeld, J. H.: Organosulfate Formation in Biogenic Secondary Organic Aerosol, J. Phys. Chem. A, 112, 8345–8378, https://doi.org/10.1021/jp802310p, 2008.
Szmigielski, R., Surratt, J. D., Gómez-González, Y., Van Der Veken, P., Kourtchev, I., Vermeylen, R., Blockhuys, F., Jaoui, M., Kleindienst, T. E., Lewandowski, M., Offenberg, J. H., Edney, E. O., Seinfeld, J. H., Maenhaut, W., and Claeys, M.: 3-methyl-1,2,3-butanetricarboxylic acid: An atmospheric tracer for terpene secondary organic aerosol, Geophys. Res. Lett., 34, 2007GL031338, https://doi.org/10.1029/2007GL031338, 2007.
Thompson, M., Ellison, S. L. R., and Wood, R.: Harmonized guidelines for single-laboratory validation of methods of analysis (IUPAC Technical Report), Pure and Applied Chemistry, 74, 835–855, https://doi.org/10.1351/pac200274050835, 2002.
Yasmeen, F., Vermeylen, R., Szmigielski, R., Iinuma, Y., Böge, O., Herrmann, H., Maenhaut, W., and Claeys, M.: Terpenylic acid and related compounds: precursors for dimers in secondary organic aerosol from the ozonolysis of α- and β-pinene, Atmos. Chem. Phys., 10, 9383–9392, https://doi.org/10.5194/acp-10-9383-2010, 2010.
Yu, J., Flagan, R. C., and Seinfeld, J. H.: Identification of Products Containing -COOH, -OH, and -CO in Atmospheric Oxidation of Hydrocarbons, Environ. Sci. Technol., 32, 2357–2370, https://doi.org/10.1021/es980129x, 1998.
Yu, J., Cocker Iii, D. R., Griffin, R. J., Flagan, R. C., and Seinfeld, J. H.: Gas-Phase Ozone Oxidation of Monoterpenes: Gaseous and Particulate Products, J. Atmos. Chem., 34, 207–258, https://doi.org/10.1023/A:1006254930583, 1999.