the Creative Commons Attribution 4.0 License.
the Creative Commons Attribution 4.0 License.
 | 17 Feb 2026
A systematic comparison of ACE-FTS δD retrievals with airborne in situ sampling
Benjamin W. Clouser
Carly C. KleinStern
Adrien Desmoulin
Clare E. Singer
Jason M. St. Clair
Thomas F. Hanisco
David S. Sayres
Elisabeth J. Moyer
The isotopic composition of water vapor in the upper troposphere and lower stratosphere (UTLS) can be used to understand and constrain the budget and pathways of water transport into that region of the atmosphere. Measurements of the water isotopic composition help further understanding of the region's chemistry, radiative budget, and the sublimation and growth of polar stratospheric clouds and high-altitude cirrus, both of which are also important to stratospheric chemistry and Earth's radiation budget. Here we present the first intercomparison of water isotopic composition (δD) using in situ measurements from the ChiWIS, Harvard ICOS, and Hoxotope instruments and satellite retrievals from ACE-FTS. The in situ data come from the AVE-WIIF, TC4, CR-AVE, StratoClim, and ACCLIP field campaigns, and satellite retrievals of isotopic composition are derived from the ACE-FTS v5.2 data set. We find that in all campaign intervals, satellite retrievals above about 14 km altitude are depleted by up to 150 ‰ with respect to in situ measurements. This difference persists even in transit flights through stratospheric air in high-latitude regions, which should be relatively free of observational biases present in other regions. We also use in situ measurements from the ChiWIS instrument, which has flown in both the Asian Summer Monsoon (AM) and the North American Monsoon (NAM), to confirm the isotopic enhancement in δD observed in satellite retrievals above the NAM.
- Article
(6776 KB) - Full-text XML
- Companion paper
- BibTeX
- EndNote


The abundance of water vapor in the stratosphere is a critical control on ozone production and destruction, surface climate, and stratospheric temperatures (Shindell, 2001). Methane and water oxidation are the primary sources of the hydroxyl radical, which helps to control ozone in the lower stratosphere (Stenke and Grewe, 2005). Moisture concentrations also provide strong controls on the distribution and frequency of polar stratospheric clouds (PSCs) and high-altitude cirrus, both of which provide surfaces on which heterogeneous chemical reactions occur (Zondlo et al., 2000; Tritscher et al., 2021). Furthermore, of the molecules responsible for the greenhouse effect, water vapor makes the largest direct contribution (Held and Soden, 2000), and stratospheric water plays a disproportionate role (Shindell, 2001; Dessler et al., 2013). The transport of water into and through the upper troposphere and lower stratosphere (UTLS) is of critical importance to our understanding of current and future climate, and the isotopic composition of that water can provide a needed constraint on this transport process.
Observations of water isotopologues in Earth's atmosphere provide unique information about an air parcel's condensation, sublimation, and mixing history (Webster and Heymsfield, 2003; Galewsky et al., 2016). As hydrometeors grow in an ascending and cooling air parcel, they take up water vapor. Since the heavier isotopologues of water (e.g., HDO and ) have lower vapor pressures than , they are preferentially taken up during growth, thereby leaving the vapor isotopically depleted and the condensate isotopically enriched. The isotopic composition of water vapor can therefore provide an important observational constraint to identify different sources of water vapor to the UTLS and to improve our understanding of the microphysical processes impacting cirrus cloud formation. In the last decade, in situ measurements obtained from airborne platforms have become sufficiently accurate and precise to allow interpretation of their substantial temporal and spatial variations. However, isotopic signatures in water vapor are not straightforward to interpret, as they are the result of both complex microphysical processes and larger-scale dynamical processes. These observations give unprecedented detail into the importance of convective influence on stratospheric water vapor in the mid-latitudes, for example. However, as noted in Fueglistaler et al. (2009) (see Sect. 2.6 and Fig. 10), there is a need for reconciliation between satellite and in situ measurements of water isotopologues in this region before either could properly be used for interpretation.
Deep convection is an important transport pathway for aerosols, trace gases, and pollutants from Earth's boundary layer into the stratosphere. The key sources of water vapor to the stratosphere are predominately due to large-scale ascent and dehydration of air as it passes through the tropical tropopause layer (TTL), and in situ production from methane oxidation. In addition, convective events and volcanic eruptions can directly inject water vapor into the stratosphere from the troposphere. Both remote sensing (Nassar et al., 2007; Moyer et al., 1996) and in situ (Hanisco et al., 2007; Sayres et al., 2010) instruments have measured isotopic profiles that show isotopic enrichment with increasing altitude, indicating the importance of convectively lofted ice to the UTLS water budget. Khaykin et al. (2022a) observed strong isotopic enhancement of H2O and HDO in the stratosphere due to the Hunga Tonga eruption. The Asian Summer Monsoon (AM) and North American Monsoon (NAM), which are annual changes in circulation patterns characterized by significant convection, are climatically significant contributors to stratospheric water vapor and have understandably been the focus of two recent NASA campaigns: ACCLIP and DCOTSS, respectively. The AM may contribute up to 75 % of the upward water vapor flux to the tropopause in Northern Hemisphere summer (e.g. Gettelman et al., 2004; Kremser et al., 2009), making it a particularly important region for UTLS isotopic studies. Analysis of ACE-FTS satellite data (Randel et al., 2012) shows significant differences in water vapor isotopic enhancement between the North American and Asian monsoons, suggesting differences in water transport processes, but until now, no in-situ water isotopologue measurements in the AM have tested this observation.
Despite the key role stratospheric water vapor plays in both the radiation budget of the Earth and the chemistry of the stratosphere, current climate models struggle to predict water vapor in the lower stratosphere. There is a significant bias across the ensemble of models in CMIP6, with models showing a substantial moist bias compared with observations (Keeble et al., 2021; Charlesworth et al., 2023). Almost all climate models predict that stratospheric water vapor is likely to increase with increased CO2. A better understanding of current and future changes in stratospheric water vapor concentrations requires stronger observational constraints on the importance and variability of different sources of water vapor to the stratosphere. Furthermore, isotopically-enabled GCMs do a poor job simulating both water content and isotopic composition of water in the UTLS region (e.g., Eichinger et al., 2015).
Several satellites have observed vapor phase HDO and H2O in the UTLS of Earth's atmosphere in recent decades. The Atmospheric Trace Molecule Spectroscopy (ATMOS) Fourier-transform spectrometer observed HDO and H2O in Earth's atmosphere between 100 and 10 mb (≈ 15 to 30 km) (Farmer, 1987; Irion et al., 1996). These observations were intermittently made from the Space Shuttle via solar occultation during four missions between the years 1985 and 1994. The sub-millimeter radiometer (SMR) aboard the Odin satellite measured H2O, , , and HDO in Earth's stratosphere and mesosphere from 2001 through the present day (Murtagh et al., 2002; Zelinger et al., 2006; Murtagh et al., 2020). The Envisat satellite (Louet and Bruzzi, 1999) contained a Fourier transform spectrometer for the detection of limb emission spectra in the middle and upper atmosphere called the Michelson Interferometer for Passive Atmospheric Sounding (MIPAS). This instrument observed HDO and H2O profiles at altitudes above about 10 km from 1 July 2002 through 8 April 2012 (Fischer et al., 2008; Steinwagner et al., 2007). The Atmospheric Chemistry Experiment Fourier Transform Spectrometer (ACE-FTS) (Bernath et al., 2005) observes H2O, , , and HDO via solar occultation. The instrument has been in operation from 2004 through the present day, and measures water vapor and its isotopologues from the lower troposphere up to approximately 50 km, although the measurement is highly sensitive to the presence of thick clouds (Boone et al., 2005). The Infrared Atmospheric Sounding Interferometer (IASI) instruments operate onboard the Metop (Meteorological operational) satellites in nadir geometry (Herbin et al., 2009; Liuzzi et al., 2016; Schneider et al., 2022). IASI makes hyperspectral measurements from 645 to 2760 cm−1 and has been in operation since October 2006 to present day (Liuzzi et al., 2016). IASI makes simultaneous, uncorrelated retrievals of coarse resolution vertical profiles of H2O and HDO in the troposphere between the surface and 20 km (6 independent pieces of information for H2O and 3.5 for HDO) at about 25 km horizontal resolution (Herbin et al., 2009).
There are few studies in the literature comparing retrievals of water vapor isotopic composition from different instruments in field conditions. Lossow et al. (2011) compared HDO retrievals from the Envisat/MIPAS instrument to those of the Odin/SMR and ACE-FTS instruments. The ACE-FTS data in this study came from v2.2 retrievals covering January to March 2004. This work found large disagreements below about 15 km, although latitudinal structures in HDO amount were consistent. There was some agreement in the 15–20 km range, and fairly good agreement above 20 km. In general, MIPAS and ACE-FTS agreed to within 10 %, and MIPAS showed higher HDO abundances than ACE-FTS. Both instruments show considerably more than Odin/SMR. Observed biases were consistent with uncertainties in spectroscopic parameters. Högberg et al. (2019) found reasonable agreement in MIPAS and ACE-FTS δD between 10 and 100 hPa, and Lossow et al. (2020) showed that the two satellites both retrieve a tape recorder signal with a magnitude of approximately 25 ‰ in the lower stratosphere.
More recently, De Los Ríos et al. (2024) compared H2O and HDO from two retrievals from Envisat/MIPAS satellite with ACE-FTS over the common interval from February 2004 to April 2012. They compare the MIPAS-IMK V5, MIPAS-ESA V8, and ACE-FTS v4.1/4.2 retrievals using a profile-to-profile approach as well as by comparing climatological structures. Stratospheric profiles of H2O retrievals show good agreement between 16 and 30 km, with biases between profile-to-profile comparisons near zero for the MIPAS-IMK and ACE-FTS data sets. However, the HDO and δD retrievals from MIPAS-ESA and ACE-FTS exhibit low biases compared to MIPAS-IMK (typically −41.2 ‰ to 10.5 ‰).
The work of St. Clair et al. (2008) included a comparison of the isotopic compositions observed by the Hoxotope and Harvard ICOS instruments which both flew aboard NASA's WB-57F research aircraft during the AVE-WIIF campaigns (see Sect. 4.1 for more details on AVE-WIIF). This intercomparison showed agreement in H2O measurements over three orders of magnitude between Hoxotope, Harvard ICOS, and the Harvard Water Vapor (HWV) Lyman-α instrument (Weinstock et al., 1994). A line fit to the Hoxotope and HWV H2O retrievals yields a slope of 1.00, an intercept of 0.96 ppmv, and an R2 value of 0.98. The HDO values retrieved by Hoxotope and Harvard ICOS during the AVE-WIIF campaign agree to within their stated accuracies over the full range. A line fit to the HDO retrievals yields a slope of 1.05, intercept of −0.14 ppbv, and an R2 value of 0.99. The Harvard ICOS instrument measures higher than Hoxotope on average, but is still within the combined uncertainty of the instruments.
Hanisco et al. (2007) contains a brief intercomparison of the δD values retrieved by Hoxotope and Harvard ICOS in the AVE-WIIF campaign, stating that the average absolute difference between the instruments was 15 ‰, well within the stated uncertainties of 50 ‰. Thurnherr et al. (2024) evaluates TROPOMI total column δD retrievals with respect to airborne measurements in the lower troposphere below about 3500 m, and use model simulations to better interpret the data sets relative to each other.
In situ and satellite data sets of UTLS isotopic composition can provide valuable constraints on GCMs, and further our understanding of water transport into the UTLS. As a first step towards imposing more global constraints, we present here the first intercomparison between in situ and satellite measurements in the UTLS using the Harvard ICOS, Hoxotope, and Chicago Water Isotope Spectrometer (ChiWIS) in situ data sets and satellite retrievals from the Atmospheric Chemistry Experiment Fourier Transform Spectrometer (ACE-FTS).
In this work we compare the in situ measurements of ChiWIS, Harvard ICOS, and Hoxotope to the ACE-FTS retrievals. We compare three quantities provided by each instrument: H2O, HDO, and δD. The isotopic composition, δD, is the fractional deviation in per mil (‰) units of the observed ratio from that of a known standard:
where RSMOW = 155.76 × 10⁻⁶ is the isotopic ratio of [D] to [H] in Vienna Standard Mean Ocean Water (SMOW, Hagemann et al., 1970). To write the isotopic ratio in terms of measured quantities, we use the approximation:
δD notation is often used because it is insensitive to how the isotopic ratio is defined: or both yield the same δD values. This allows for easier and more universal comparison across different definitions.
An airmass is said to be isotopically depleted with respect to another if its isotopic composition is more negative, and isotopically enhanced if its isotopic composition is more positive. For reference, typical δD values in the UTLS are about −500 ‰, with significant regional and seasonal variation.
In this study we compare the in situ measurements of two airborne off-axis integrated cavity output spectrometer (OA-ICOS) instruments, the Chicago Water Isotope Spectrometer (ChiWIS) (Clouser et al., 2025) and Harvard ICOS (Sayres et al., 2009), and an in situ laser-induced fluorescence (LIF) instrument, Hoxotope (St. Clair et al., 2008), with satellite retrievals from the Atmospheric Chemistry Experiment Fourier Transform Spectrometer (ACE-FTS) (Bernath et al., 2005). Figure 1 summarizes the spatial and temporal extent of the data considered here. Flight tracks from the ChiWIS instrument (cyan) and Harvard ICOS and Hoxotope instruments (lime green) are shown for each campaign, as well as the averaging regions (black boxes) used in subsequent sections for the ACE-FTS instrument. The five regions considered here are summarized in Table 1, and are spatially defined as follows: AM, 5–35° N, 60–120° E; AM Outflow, 10–45° N, 100–160° E; NAM, 10–50° N, 230–290° E; Arctic, 40–70° N, 130–240° E; Tropics, −10 to 20° N, 260–300° E. Altogether, these measurements cover the latitude range of 10° S to 60° N, including the NAM and AM systems, the tropics, subtropics, and mid-latitudes from about 12 to 20 km in altitude. Figure 1 shows the ACE-FTS average for the years 2004–2022 from the boreal summer (JJA) and boreal winter (DJF) seasons. The isotopic enhancement (see Sect. 2 for definition) over the NAM relative to the AM is highly apparent in the boreal summer averages, as are the extreme depletions found in the tropics during boreal winter.

Figure 1ACE-FTS retrievals of δD at 16.5 km altitude during the (a) boreal summer months (JJA) and (b) boreal winter months (DJF). Superimposed on both contour plots are the flight tracks of the ChiWIS instrument (cyan) and the Harvard ICOS/Hoxotope instruments (lime green). The black boxes show the spatial boundaries within which ACE-FTS occultations are collected for comparison to the relevant field campaign. Latitude-longitude range of each box is listed in Table 1.
Table 1Counts for observations between 400 and 500 K in potential temperature. Counts represent seconds of sampling time for in situ instruments and number of occultations for ACE-FTS. ACE-FTS retrievals are co-located in the specified region and time period of each campaign, but drawn from all years 2004–2022.

3.1 ChiWIS
ChiWIS is an OA-ICOS instrument which has to date flown in the StratoClim (2017) and ACCLIP (2021/2022) field campaigns. The instrument uses a tunable diode laser (TDL) to rapidly scan over H2O and HDO absorption features centered around 2647.6 nm. The highly reflective mirrors of the instrument's optical cavity yield an effective path length of greater than 7 km in a cell 90 cm in length. The instrument flew aboard the M55 Geophysica during the StratoClim campaign and the WB-57F during the ACCLIP campaigns. In both cases it was configured with a rear-facing inlet to make vapor phase measurements of isotopic composition. In laboratory conditions the instrument has demonstrated a measurement precision of 3.6 ppbv in H2O and 82 pptv in HDO in 5 s averages.
3.2 Harvard ICOS
The Harvard ICOS instrument is an OA-ICOS instrument which flew aboard the NASA WB-57F aircraft during the AVE-WIIF (2005), CR-AVE (2006), and TC4 (2007) campaigns out of Houston, Costa Rica, and Houston, respectively. The instrument uses a quantum cascade laser (QCL) to scan over H2O, , , and HDO features near 6800 nm. The instrument features a 90.57 cm cell with an effective path length of about 4.5 km, and was configured with a rear-facing inlet to make vapor phase measurements of isotopic composition. Laboratory and in-flight calibrations established an accuracy of 5 % for all measured species, and the instrument showed measurement precisions in 4 s averages of 0.14 ppmv, 0.10 ppbv, and 0.16 ppbv in H2O, HDO and , respectively.
3.3 Hoxotope
The Hoxotope instrument made vapor phase measurements of H2O and δD using vacuum UV photolysis of water molecules and the subsequent laser-induced fluorescence of OH and OD fragments. This method yielded a signal-to-noise ratio of greater than 20 for 1 ppbv HDO and greater than 30 for 5 ppmv H2O in 10 s averages, sufficient for measurements of δD in the UTLS region. The instrument flew aboard the NASA WB-57F aircraft in the AVE-WIIF and TC4 field campaigns. In the AVE-WIIF campaign, the instrument flew with a rear-facing inlet to make measurements of water vapor isotopic composition, and in the TC4 campaign it flew with a forward-facing isokinetic inlet to make measurements of total water isotopic composition. Hoxotope measurements should be particularly robust against contamination due to the instrument's high flow rate and small sample volume. Additionally, measurements made via photolysis should be more robust against contamination effects due to, e.g., outgassing within the sample cavity. Since OD and OH fragments are the actual species being measured, further outgassing of HDO and H2O downstream of the photolysis cell will not contribute to contamination.
3.4 ACE-FTS
The Atmospheric Chemistry Experiment (ACE) mission is a Canadian satellite mission launched on 12 August 2003 into a high-inclination (74°) circular orbit with altitude 650 km. This orbit provides coverage from 85° S to 85° N and primarily makes observations in the middle and high latitudes. The satellite's primary instrument is a Fourier Transform Spectrometer (FTS), which measures atmospheric absorption spectra between 2.2 and 13.3 µm (750–4400 cm−1) with a resolution of 0.02 cm−1. The instrument operates in a solar occultation geometry, in which it observes radiation from the Sun attenuated by Earth's atmosphere at each sunrise and sunset in its orbit, of which there are about 15 of each per day. The H2O molecule is ideally sampled from 5–95 km altitude, and the HDO molecule from 5–42 or 50 km, depending on the latitude of the occultation. In practice, the lower observational limit often depends on the presence of clouds, which interfere with the volumetric mixing ratio (VMR) retrievals. In this work, we use ACE-FTS version 5.2 retrievals (Boone et al., 2023).
The typical uncertainty associated with a single ACE-FTS profile varies with altitude and its spatial location. Figure 2 shows ACE-FTS δD retrievals from JJA 2004–2022 over the AM region and relatively cloud-free Sahara desert region. Since ACE-FTS retrievals are not generally possible through thick clouds (Boone et al., 2005), the Sahara desert region has many more retrievals down to lower altitudes than the much cloudier Asian Monsoon region. In both regions, the interquartile range (IQR) is approximately 50 ‰ in stratospheric air above about 19.5 km. The IQR in both regions increases to a maximum at 10.5 km of about 300 ‰ in the Sahara and about 450 ‰ in the AM. The increase in IQR at lower altitudes is likely due to a combination of factors. First, the troposphere is inherently more variable than the stratosphere. Second, the presence of clouds may interfere with retrievals. Third, isotopic retrievals at low altitudes typically use weak spectral features with high temperature sensitivity. Thus, retrievals made in the troposphere, which exhibits more temperature variability than the stratosphere, may be less precise for this reason.

Figure 2All ACE-FTS retrievals from JJA 2004–2022 for the (a) AM region and (b) relatively cloud-free Sahara desert region. The inset map in each panel shows the spatial region from which observations are taken (green boxes). Both regions have the same area and latitudinal extent (5–35°): AM region (60–120°) and Sahara region (−15 to 45°). At each altitude level, a box-and-whisker plot (red) shows the extrema, first quartile, median, and third quartile. The number of points considered at each altitude level varies due to the presence of clouds. In the AM region, there are 375 occultations above 20.5 km, but only 45 occultations at 8.5 km. In the less cloudy Sahara region, 350 occultations are considered above 18.5 km, and 154 at 8.5 km.
Depending on the satellite's viewing angle through Earth's atmosphere, spectra are sampled with a resolution of 2–6 km, and the resulting VMRs of target species are oversampled onto a 1 km grid. Similar to the ATMOS instrument, solar occultation method of the ACE-FTS instrument necessarily results in sampling path lengths of approximately 200 km (Rinsland et al., 1998).
We note here that the orientation of the SCISAT's orbit varies as Earth orbits the sun, meaning that observations at a particular latitude are highly correlated with the day-of-year on which the measurement occurs, which biases the number of retrievals seasonally (cf. Fig. 1 in Randel et al., 2012). This means that for a given latitude it is not possible to construct truly seasonal averages.
We compare the ACE-FTS retrievals with in situ measurements made during five aircraft field campaigns from 2004 to 2022. See Table 1 for number of observations (“Counts”) made by each instrument during each campaign. ACE-FTS data sum all occultations bounding the seasonal and spatial ranges of the campaign bounding boxes shown in Fig. 1 and defined in Table 1, averaged over all years from 2004–2022.
4.1 AVE-WIIF (North American Monsoon, NAM)
The Aura Validation Experiment Water Isotope Intercomparison Flight (AVE-WIIF) campaign consisted of three five-hour flights in June and July 2005 aboard the NASA WB-57F aircraft. The flights were undertaken to compare the Hoxotope and Harvard ICOS instruments, both of which were new at the time. The flights took place out of Ellington Field (EFD) in Houston, TX and sampled the UTLS with level legs between 10 and 19 km. During the campaign, Hoxotope returned 12.5 hours of data and Harvard ICOS returned 7.9 h of data.
We construct ice water content (IWC) for AVE-WIIF from the total water (TW) measurements of the Harvard Total Water (HTW) instrument (Weinstock et al., 2006) and the water vapor measurements of the Harvard Water Vapor (HWV) Lyman-α instrument (Hintsa et al., 1999). These instruments were operational whenever Hoxotope and Harvard ICOS were operational.
4.2 CR-AVE (Tropics)
The Costa Rica Aura Validation Experiment (CR-AVE) campaign took place in January and February of 2006 with 12 research flights in total. This campaign focused on providing validations of the Aura satellite, as well as the microphysical characteristics of the tropical UTLS. This campaign provided isotopic sampling of the tropics during the boreal winter months, and sampled some of the most dry and isotopically depleted air on record. During this campaign the Harvard ICOS instrument returned isotopic compositions for eight flights from the end of January to the middle of February for a total of 16.4 h of isotopic data.
IWC in the CR-AVE campaign is provided by the NCAR counterflow virtual impactor (CVI) instrument (Twohy et al., 1997; Noone et al., 1988). The CVI inlet samples only cloud particles, evaporates them, then measures the concentration downstream with a Lyman-α hygrometer.
4.3 TC4 (Tropics)
The Tropical Composition, Cloud and Climate Coupling (TC4) campaign investigated the structure, properties, and processes in the tropical Eastern Pacific. The field campaign consisted of transit flights and research flights based in Costa Rica and Panama during boreal summer 2007. During this campaign Hoxotope returned data on 5 flights for a total of 4.6 h of isotopic data, and Harvard ICOS on 2 flights for a total of 5.1 h.
During this campaign the Hoxotope instrument was operated with a forward-facing inlet, allowing for measurements of the total water isotopic composition. We construct an IWC measurement by subtracting the HWV water vapor values from the Hoxotope total water values.
4.4 StratoClim (Asian Monsoon, AM)
The EU StratoClim campaign consisted of 8 flights in the Asian Summer Monsoon UTLS in July and August of 2017. The flights took place in Kathmandu, Nepal and used the M55 Geophysica high-altitude research aircraft. The campaign aimed to produce more reliable projections of climate and stratospheric ozone by using UTLS observations of relevant trace gas species in the heart of the AM to better understand atmospheric structure in the AM anticyclone, as well as to quantify the transport of near-surface pollutants to higher altitudes. During this campaign, the instrument returned data on 6 flights for a total of 11.9 h of isotopic data, and made measurements between 10.5 and 18.5 km.
The presence of clouds in StratoClim is indicated with a combination of the backscatter ratio (BR) from the Multiwavelength Aerosol Scatterometer (MAS) (Cairo et al., 2011) and the ice particle number concentration (Nice) from the Novel Ice EXpEriment – Cloud and Aerosol Particle Spectrometer (NIXE-CAPS) instrument (Krämer et al., 2016, 2020). An interval is assessed to be cloud-free when the BR is less than 1.2 and Nice = 0.
4.5 ACCLIP (NAM, Arctic, and AM Outflow)
The Asian Summer Monsoon Chemical and CLimate Impact Project (ACCLIP) field campaign aimed to investigate the transport pathways of uplifted air from within the Asian Summer Monsoon Anticyclone into the global UTLS, to sample the chemical content of AM air to better quantify AM transport, and to evaluate water transport across the tropopause to better understand the AM's role in hydrating the stratosphere. The campaign consisted of 4 test flights out of EFD in July 2021 (NAM), 3 test and research flights from EFD in July 2022 (NAM), 5 transit flights from EFD to Osan Air Base in South Korea in late July 2022 (Arctic), 15 research flights out of Osan in August 2022 (AM Outflow), and 4 transit flights from Osan to EFD in early September 2022 (Arctic). During this campaign, the instrument returned isotopic data on 28 out of the 31 ACCLIP flights for a total of 112.8 h of data.
The presence of clouds in ACCLIP is indicated by the cloud flag provided by the second-generation Cloud, Aerosol, and Precipitation Spectrometer (CAPS) instrument (Dollner et al., 2024).
The in situ and remotely sensed measurements have vastly different spatial and temporal characteristics, and are not straightforward to compare. By their nature, in situ measurements are irregular, highly localized in space and time, retrieved both in and out of clouds, and oriented around local meteorology favorable to the science goals of a particular field campaign. ACE-FTS retrievals, on the other hand, are relatively regular, integrate over a large area, retrieved outside of thick clouds, and effectively random with respect to local meteorological conditions.
ACE-FTS measurements are first spatially and temporally filtered according to the parameters of Table 1 to generate a climatology associated with each of the five campaign regions described above in Sect. 4. Due to the relative sparsity of ACE-FTS observations, accumulating samples in a given spatial region over the lifetime of the satellite is necessary to generate robust statistics in most cases. A brief discussion of the effects of interannual variability is presented in Sect. 6.1 and Table 4.
ACE-FTS measurements are then filtered by removing missing or flagged retrievals as prescribed by the data usage guide. This still leaves retrievals which do not converge or have other large deviations. To avoid drawing conclusions based on these retrievals, we use the median value throughout this work when interpreting the satellite retrievals as this metric is far less susceptible to outliers in the data than the mean. For consistency, we extend this treatment to the in situ data as well.
To bridge the differences between these data sets, we first make a broad comparison between the average characteristics of the isotopic retrievals from each campaign and the characteristics of ACE-FTS VMRs for the seasonally representative latitude/longitude boxes centered around the campaign region. In all cases, only cloud-free intervals from the in situ field campaigns are considered. A variety of additional measurements are used to determine the presence of clouds, which are described in each campaign subsection of Sect. 4.
Campaign information and parameters of the ACE-FTS averages are summarized in Table 2. This approach is most effective in cases where the sampled air masses are broadly similar over large geographic regions and/or exhibit low seasonal variations, e.g., comparisons of air in the overworld stratosphere (Θ > 400 K) or within and above Earth's monsoon systems, which can seasonally dominate atmospheric composition over large regions.
Table 2Mean, standard deviation, and median for H2O observations between 400 and 500 K in potential temperature. All units are in ppmv.
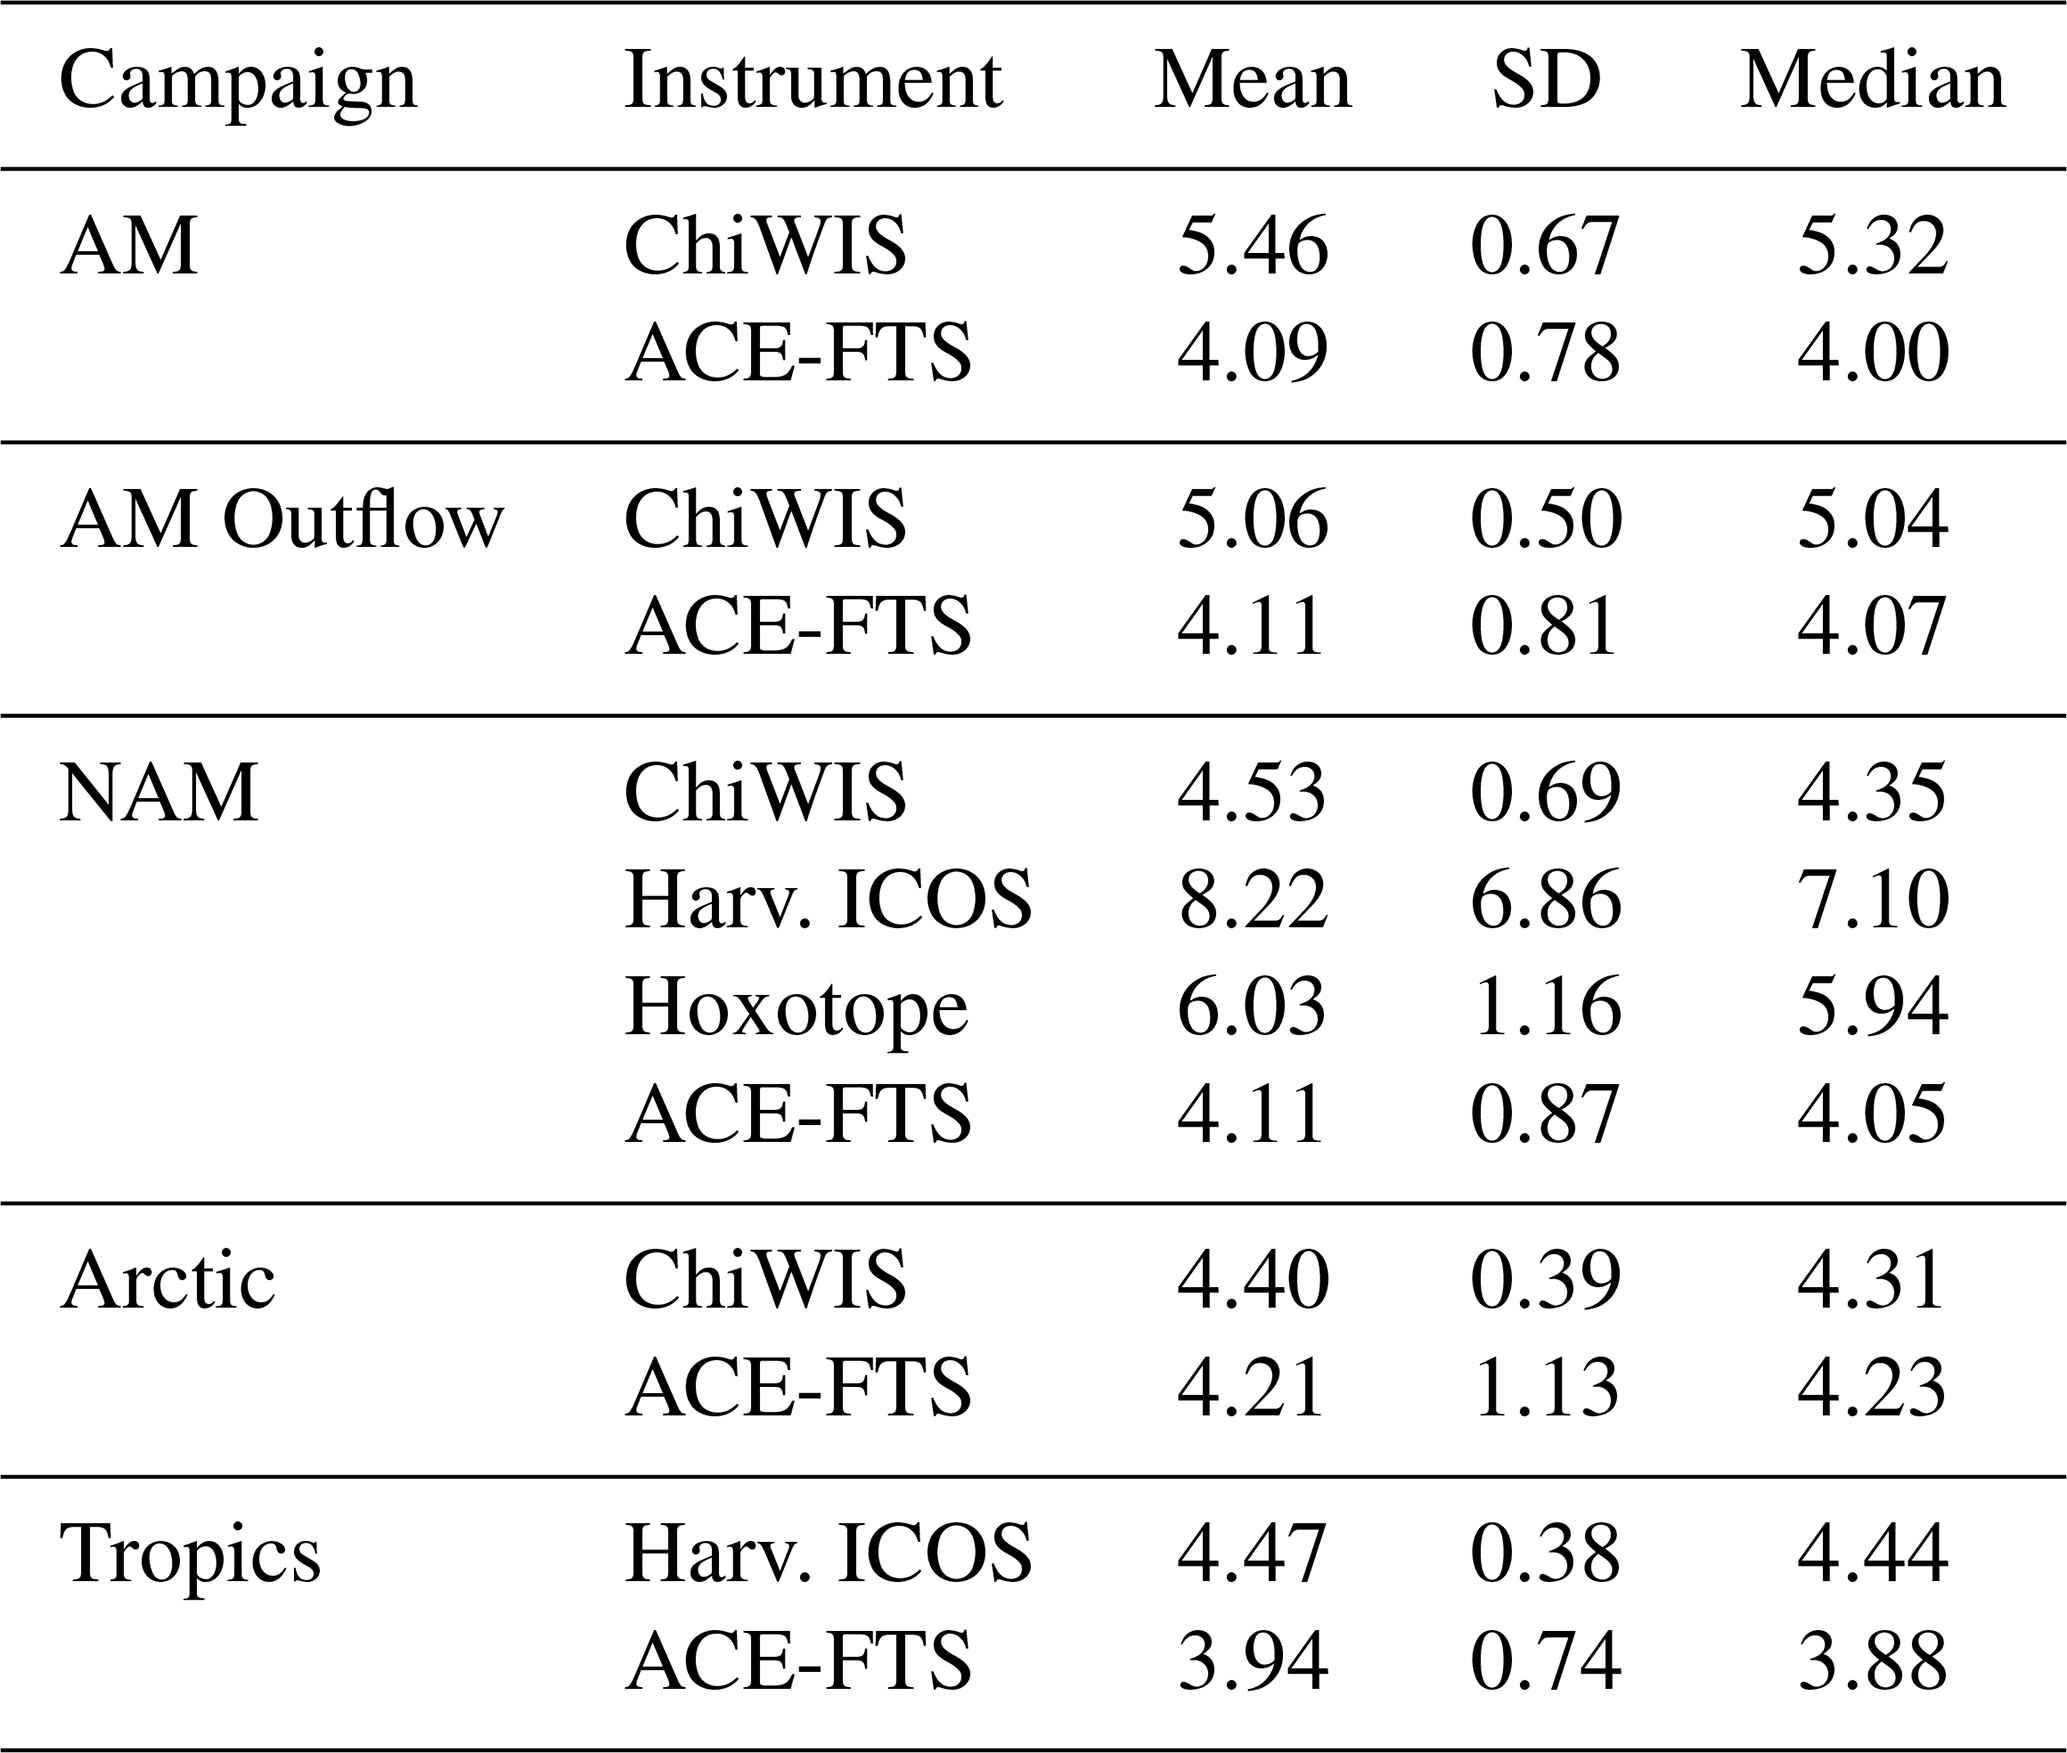
Figure 3 presents isotopic data for all regions considered in this study, with in situ measurements in the left column and ACE-FTS retrievals in the right column. Observations of median δD are shown in the phase-space of H2O and altitude. Viewing isotopic composition in the phase-space of water vapor variations helps distinguish/separate air masses of different origin at the same altitude level. On average, the water vapor mixing ratio is highly correlated with δD through the depth of the troposphere; it is therefore the difference in isotopic composition between airmasses with the same water vapor mixing ratio which provides insight into their convective history. See, for example, Fig. 4 in Khaykin et al. (2022b) which uses this presentation to relate isotopic composition to convective influence to show the convective origin of the most isotopically enhanced airmasses.

Figure 3δD from in situ measurements (left column) to satellite retrievals from ACE-FTS (right column). Each row shows a different field campaign region. In situ observations were made by ChiWIS for panels (a)–(d) and Harvard ICOS/Hoxotope for panels (e)–(f). Data are binned by H2O and altitude at a resolution of 2 ppmv × 0.5 km for the in situ measurements and 4 ppmv × 1 km for the satellite observations. Bins are colored by their median isotopic composition.
Although this presentation of the data obscures some of the natural and instrumental variability in each bin, it still allows the identification of broad features. First, we note that in all campaign regions the ACE-FTS retrievals are isotopically lighter than the in situ observations in stratospheric air. This feature is most apparent above about 14 km in altitude and in air with less than about 10 ppmv water vapor. Second, there is considerable isotopic variability between campaign regions in both the in situ measurements and the satellite retrievals.
6.1 Isotopic composition above 14 km
Above about 14 km, in situ isotopic measurements are often 100 ‰–200 ‰ heavier than ACE-FTS retrieval. Figure 4 shows that this feature occurs across all measurement campaigns. The average tropopause height (Hoffmann and Spang, 2022; Zou et al., 2023) for the in situ sampling interval is plotted in orange, and shows that nearly all Arctic transit flights in ACCLIP occurred in stratospheric air. We note here that Fig. 10 of Fueglistaler et al. (2009) shows a similar relationship between the ATMOS retrievals reported in Kuang et al. (2003) and ICOS measurements from the Harvard Isotope instrument. In that case, in situ measurements above about 380 K in potential temperature are approximately 150 ‰ enhanced with respect to the ATMOS measurements.

Figure 4Comparison of ACE-FTS retrievals and in situ isotopic data for each campaign. In situ data are shown as black dots, and are rebinned into roughly 1 km bins. Rebinned ChiWIS data is plotted with a solid cyan line, Harvard ICOS with a solid green line, and Hoxotope with a dashed blue line. ACE-FTS median δD at each altitude level in the campaign region for the years 2004–2022 is shown with a red line. The error bars represent the inter-quartile range at each altitude level. The orange dashed line represents the average tropopause height in each region.
The positive bias of the in situ measurements occurs in some of the driest regions of the UTLS (H2O < 4 ppmv). Two potential causes of error in the in situ measurements may be: (1) line strength errors in the HITRAN data base (Gordon et al., 2022) or (2) contamination of the instruments' optical cavities. Regarding the first possibility, we note that ChiWIS and Harvard ICOS operate in very different wavelength regions and utilize different spectral features, thus making it unlikely that both instruments would yield the same deviations with respect to ACE-FTS retrievals at high altitudes due to line strength errors. Furthermore, during flights in which both Harvard ICOS and Hoxotope are operating, they both show enhancement above ACE-FTS retrievals in the same region (cf. Fig. 4). The Hoxotope instrument should be highly resistant to contamination due to outgassing due to its fast response time (cf. St. Clair et al., 2008 Fig. 10) and that the LIF measurement methodology of the Hoxotope is inherently destructive to water vapor contamination, meaning that the measurement is insensitive to H2O outgassing beyond the dissociation region. The authors note as well that these extractive, in situ instruments all maintain a constant cavity pressure and temperature regardless of the ambient conditions, and that temperature-dependent line strength errors should therefore be constant between the instruments in the data considered here. Together these suggest that HITRAN line strength errors or retrievals are responsible for the discrepancy, although outgassing in the inlets of instruments or sampling from the aircraft's boundary layer could contaminate observations.
Regarding the second possibility, contamination of water and isotopic retrievals, especially in dry conditions, is a serious concern for in situ instruments. The AQUAVIT-1 water intercomparison (Fahey et al., 2014) showed at worst 20 % disagreement between water instruments between 1 and 10 ppmv, which could easily account for the increased isotopic composition of in situ instruments on its own. However, the Harvard ICOS instrument was calibrated with two different calibration methodologies (Sayres et al., 2009), and ChiWIS showed excellent agreement with two other in situ water vapor measurements during the StratoClim campaign (Singer et al., 2022).
Comparisons of H2O and HDO observations in stratospheric air are presented in Fig. 5. The histograms of each data set are normalized to ease comparison of their means and standard deviations. The statistical characteristics of H2O and HDO observations for each data set are summarized in Tables 2 and 3, respectively. Table 1 summarizes the sampling information including spatiotemporal location of each region and instrument sampling counts. The instrument counts represent the number of seconds of observations for in situ measurements, and the number of occultations for ACE.
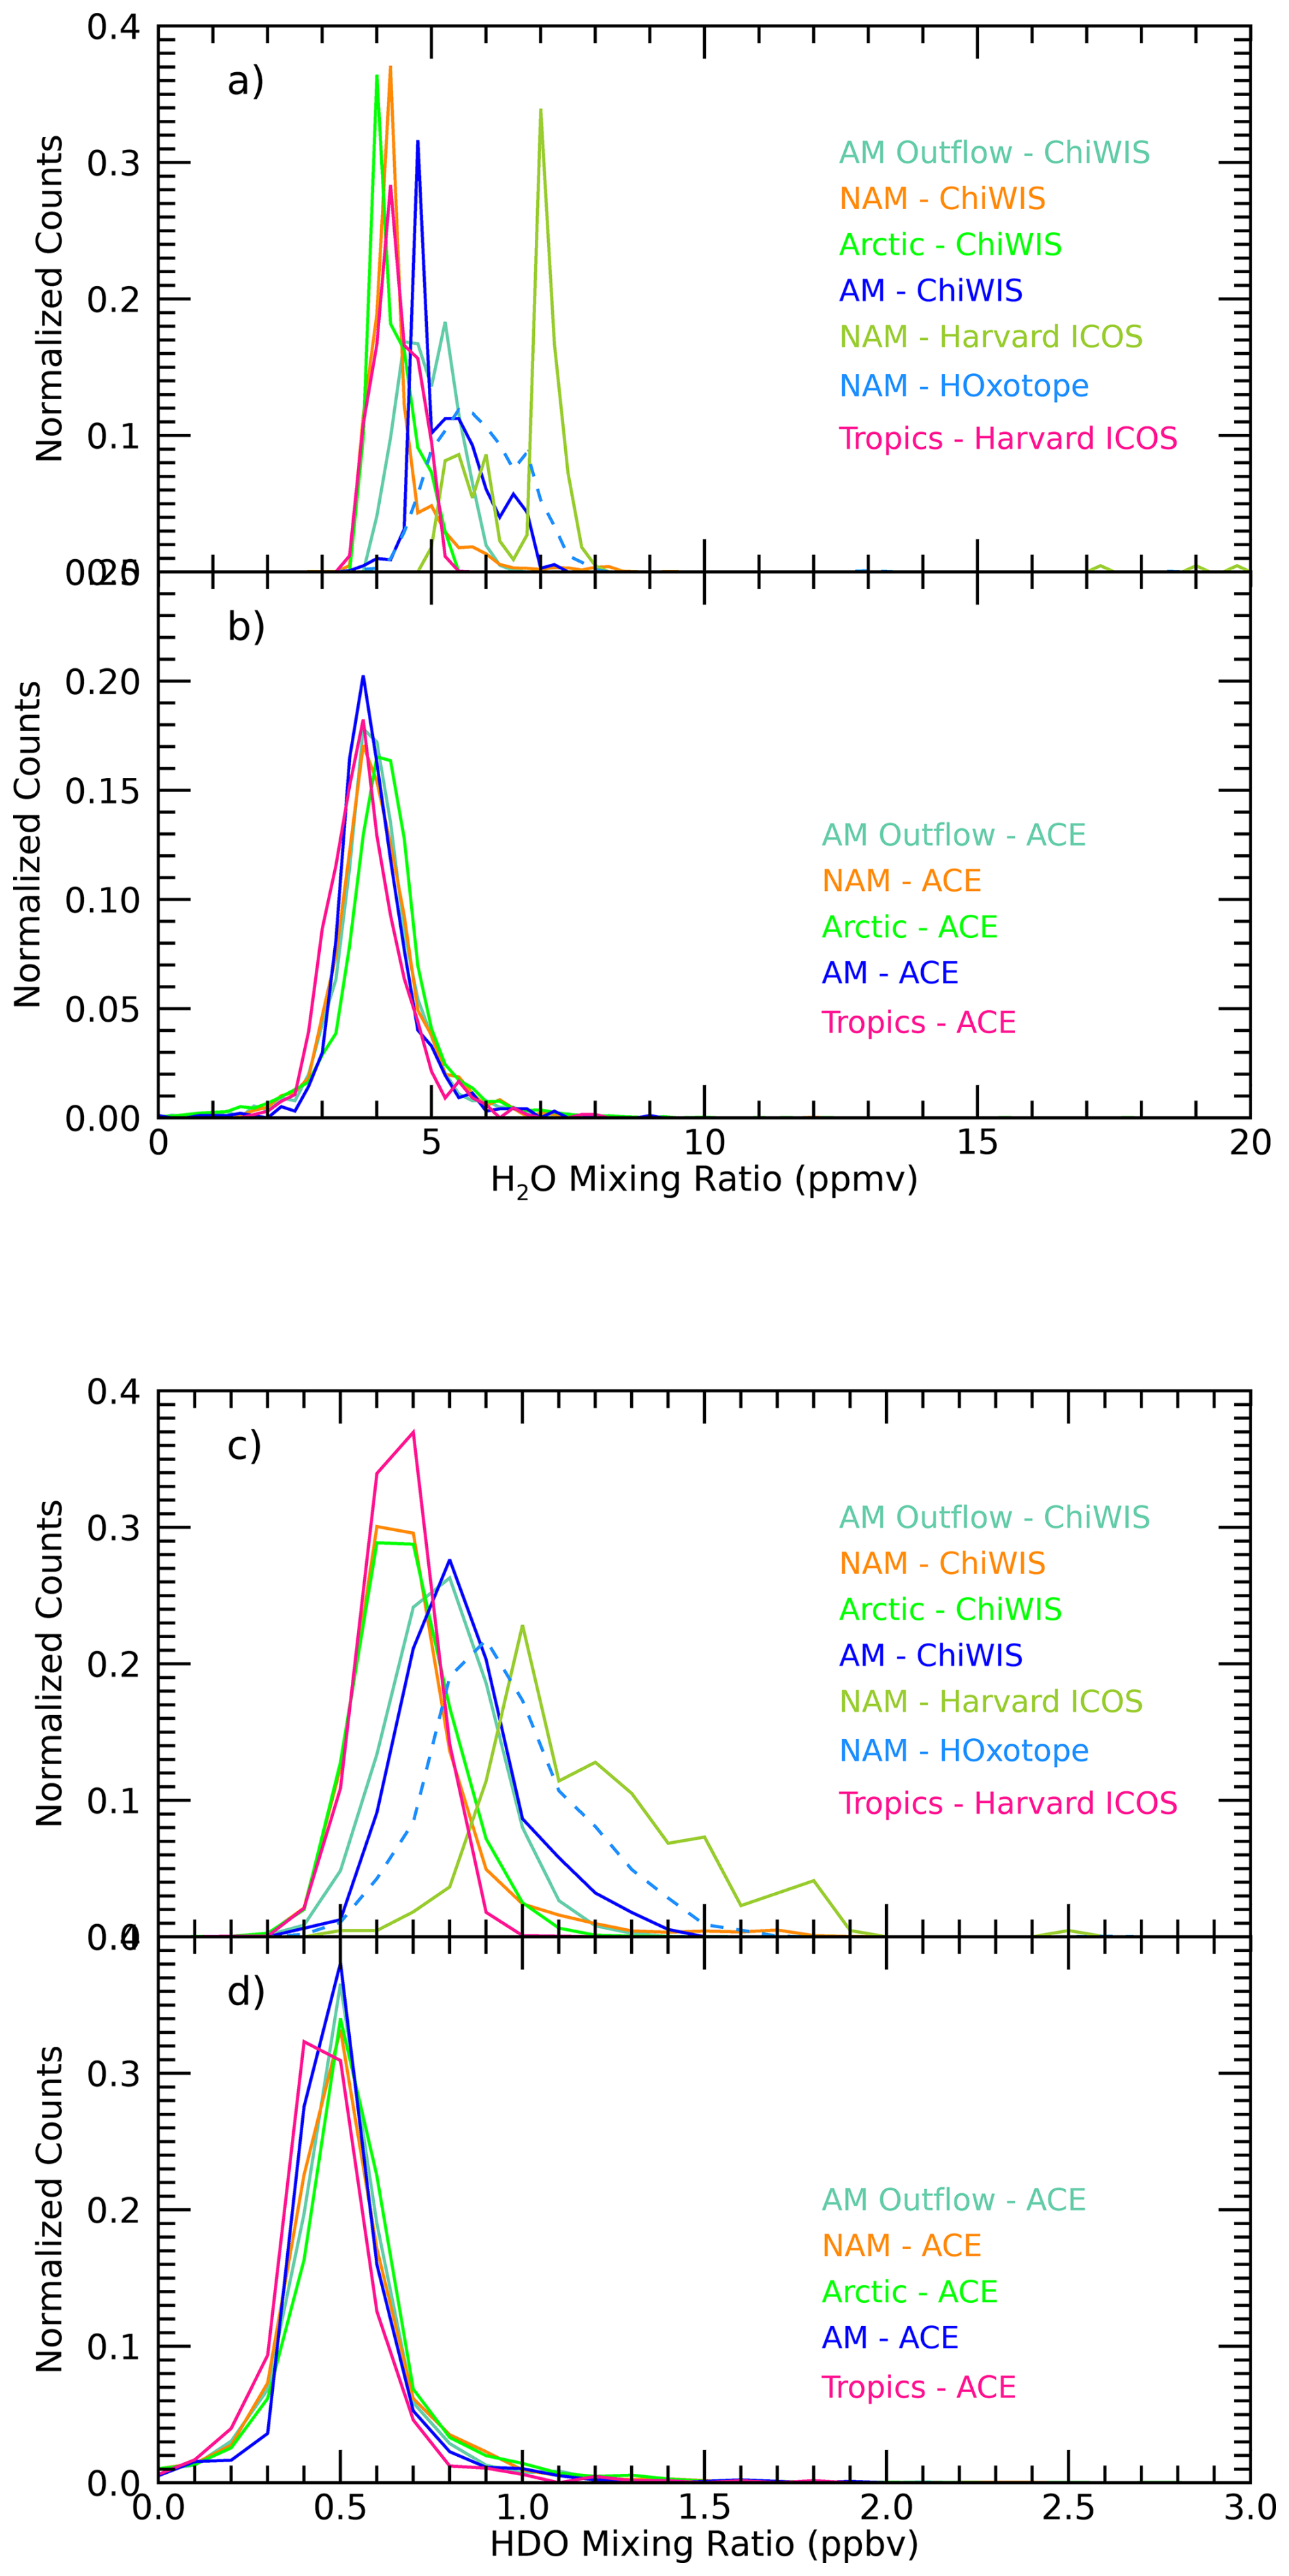
Figure 5Normalized probability density functions of (a–b) H2O and (c–d) HDO comparing in situ measurements (a, c) and satellite retrievals (b, d) in stratospheric conditions. Stratospheric air is defined here as conditions with potential temperature between 400 and 500 K. ACE-FTS retrievals over regions aligned with each corresponding aircraft campaign (color coded) located in the campaign bounding boxes shown in Fig. 1 and defined in Table 1, and are drawn from the appropriate season over the entire 2004–2022 interval.
Table 3Mean, standard deviation, and median for HDO observations between 400 and 500 K in potential temperature. All units are in ppbv.

In situ observations of water vapor (Fig. 5a) show considerable variability between in situ field campaigns. Harvard ICOS measurements in the CR-AVE campaign, and ChiWIS measurements in the NAM and Arctic have modes at or just above 4 ppmv, although in each case the distributions show skew towards higher mixing ratios. This skew may be due to deliberate targeting of convective outflow during these campaigns, resulting in oversampling of wet, isotopically enriched air. Campaigns associated with the AM region (StratoClim and ACCLIP measurements of AM outflow) show broader distributions, which likely reflect the export of moisture to high altitudes by convection in the AM system. H2O measurements from ACE-FTS (Fig. 5b) are very consistent across all measurement regions, with modal values between 3.75 and 4 ppmv. These observations show less variability than in situ observations likely due to their broad spatial and temporal averaging windows, and due to their essentially random sampling relative to local meteorological features.
In situ observations of HDO are inherently noisier than H2O observations, which therefore masks some natural variability. These observations have more normal distributions but generally cluster in ways similar to the H2O observations (Fig. 5c). The Harvard ICOS measurements in the CR-AVE campaign, and ChiWIS measurements in the NAM and Arctic all have modal values around 0.65 ppbv. Campaigns associated with the AM region have distributions of similar width, but with modal values around 0.80 ppbv. The large spreads in HDO retrievals observed in ChiWIS/AM outflow, ChiWIS/AM, Harvard ICOS/NAM, and Hoxotope/NAM data could be the result of several different effects. First, it is possible the spread is a consequence of some form of contamination. Second, the spread could be the result of biases introduced by the scientific objectives of the campaign, e.g., flying in and out of convective plumes would likely manifest as broad variability in these plots. As with H2O, ACE-FTS HDO retrievals are nearly identical throughout all measurement regions (Fig. 5d).
To assess this variability, we calculate the annual means in H2O, HDO, and δD using the ACE-FTS data set for 2006–2022 for each observation region in this study. The results are summarized in Table 4.
Table 4Mean of annual means and standard deviation of annual means for ACE-FTS retrievals of H2O, HDO, and δD between 400 and 500 K in potential temperature. H2O units are ppmv, HDO units are ppbv, and δD units are ‰. Individual yearly averages are indicated by a single overbar. The expectation value of each yearly average is indicated with the E symbol, and is roughly equivalent to the averages presented in Tables 2 and 3.
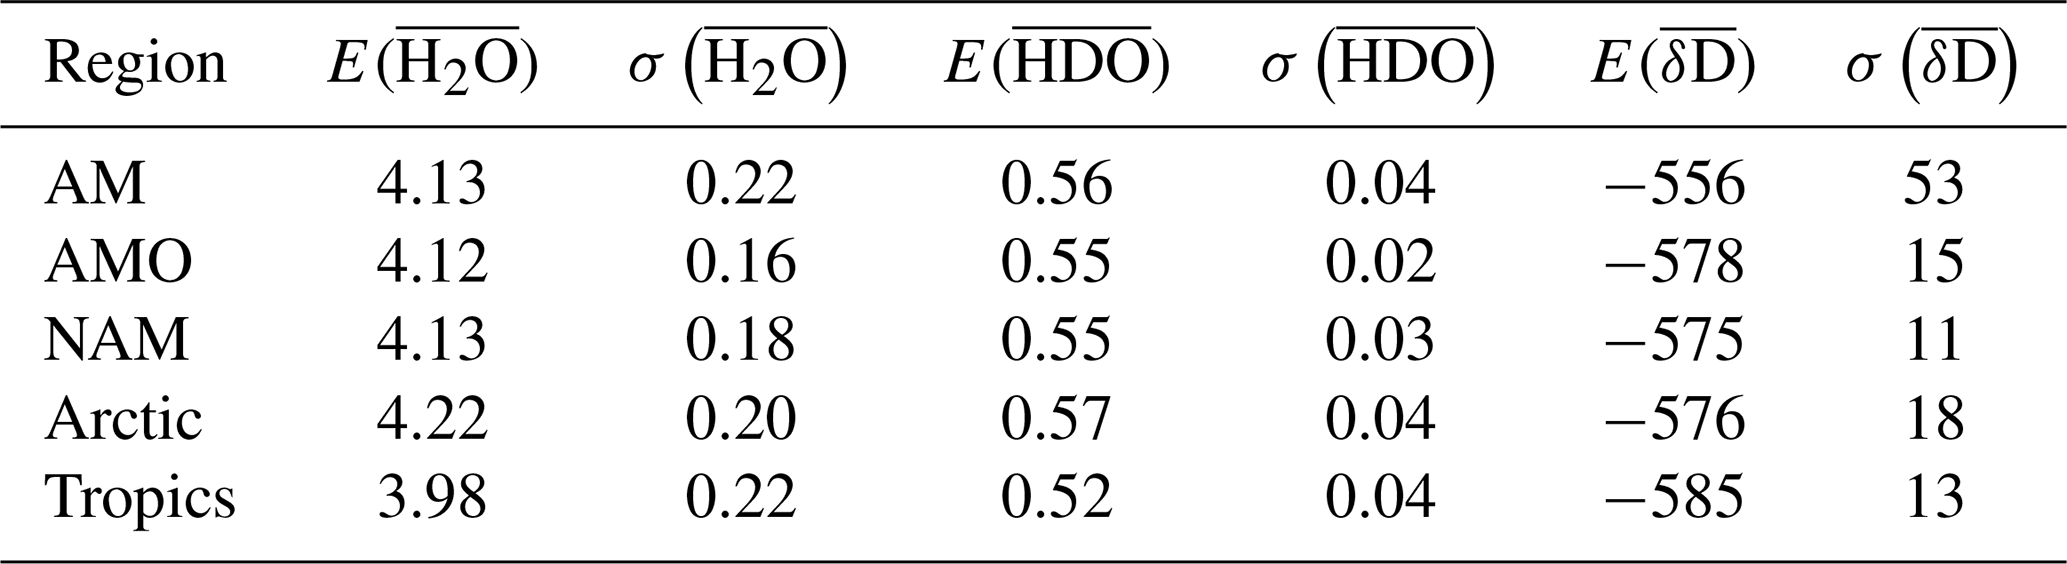
Cross-referencing the instrumental means for each campaign from Tables 2 and 3 with the means and standard deviations in Table 4 shows that interannual variability is unlikely to be responsible for the observed differences, assuming that the interannual variability of the satellite retrievals is representative of what would be measured in situ. In the case of H2O and HDO, the mean of each set of campaign measurements is two or more standard deviations wetter than the mean of the annual ACE-FTS retrievals, with the exception of the high-latitude measurements made by ChiWIS during its transits between Osan AB and Houston.
Although the ACE-FTS retrievals of H2O are slightly drier than those of in situ campaigns and the HDO satellite retrievals are significantly lower than in situ measurements, these effects are likely due to observational biases in most campaign regions. In the NAM, AM, AM Outflow, and Tropic regions, the 400–500 K potential temperature range analyzed in Fig. 5 includes at least some upper tropospheric air, which will tend to be relatively moist. Indeed, observations of air with H2O mixing ratios above 8 ppmv are found in both data sets.
Combined with the tendency of in situ campaigns to target scientifically interesting moist air at these altitudes, it is not surprising to find relatively more observations of moist air in the in situ data. Given the long sampling path length of the ACE-FTS instrument, the lower HDO measurements in the satellite data suggest the possibility of condensation within thin clouds impacting one of those observations more than the in situ observations. Lower H2O and significantly lower HDO are characteristic of a low-temperature isotopic fractionation effect. The geometry of ACE-FTS measurements makes it more susceptible to condensation effects than in situ measurements due to its long observational path length (see Sect. 3.4), and ability to sample through thin cirrus (Eremenko et al., 2005). This could also explain the similar discrepancy in average observed for the previous study’s comparison with ATMOS results (Sect. 6.1), since ATMOS had essentially the same measurement geometry as ACE. This effect could be especially pronounced in tropical regions where thin cirrus common in the UTLS. Thus even if both the in situ and ACE-FTS measurements are instrumentally unbiased, it is still possible the instruments might return significantly different isotopic compositions from the same general region due to their very different sampling methodologies.
The Arctic transit flights during the ACCLIP campaign offer the strongest evidence of a systematic bias between the in situ measurements and satellite retrievals. These flights had no scientific objectives and can therefore reasonably be taken to represent random samples of air in the flight region, removing a potential source of bias from the in situ measurements. In addition, as shown in Fig. 4, the bulk of the transit flight measurements were taken in stratospheric air (above the orange dashed line), and the 400–500 K region of Fig. 5 is purely stratospheric and should therefore be essentially cloud-free and less susceptible to observations of isotopically depleted air within thin cirrus clouds. In these data, Fig. 5 and Table 2 show agreement in H2O between the in situ and ACE measurements, but the HDO values are still lower in the satellite retrievals. We therefore conclude that the HDO retrievals are the main driver of the difference between in situ and satellite retrievals of δD.
6.2 Isotopic Enhancement above the North American Monsoon
In the region of common measurements between 19 and 30° latitude and 15 and 19 km altitude, the ACE-FTS and ChiWIS observations both show enhancement above the NAM, with values of 46 ‰ and 33 ‰, respectively. Figure 6 shows this isotopic composition in the AM and NAM regions for ACE-FTS retrievals (top row) and ChiWIS in situ measurements (bottom row). The isotopic enhancement over the NAM region was first noted in Randel et al. (2012), who attributed the differences in isotopic composition to the background thermodynamic structure and differences in relative humidity. Here we make use of the increased number of ACE-FTS observations to construct meridional plots of the isotopic structure over the Asian and North American Monsoon regions.
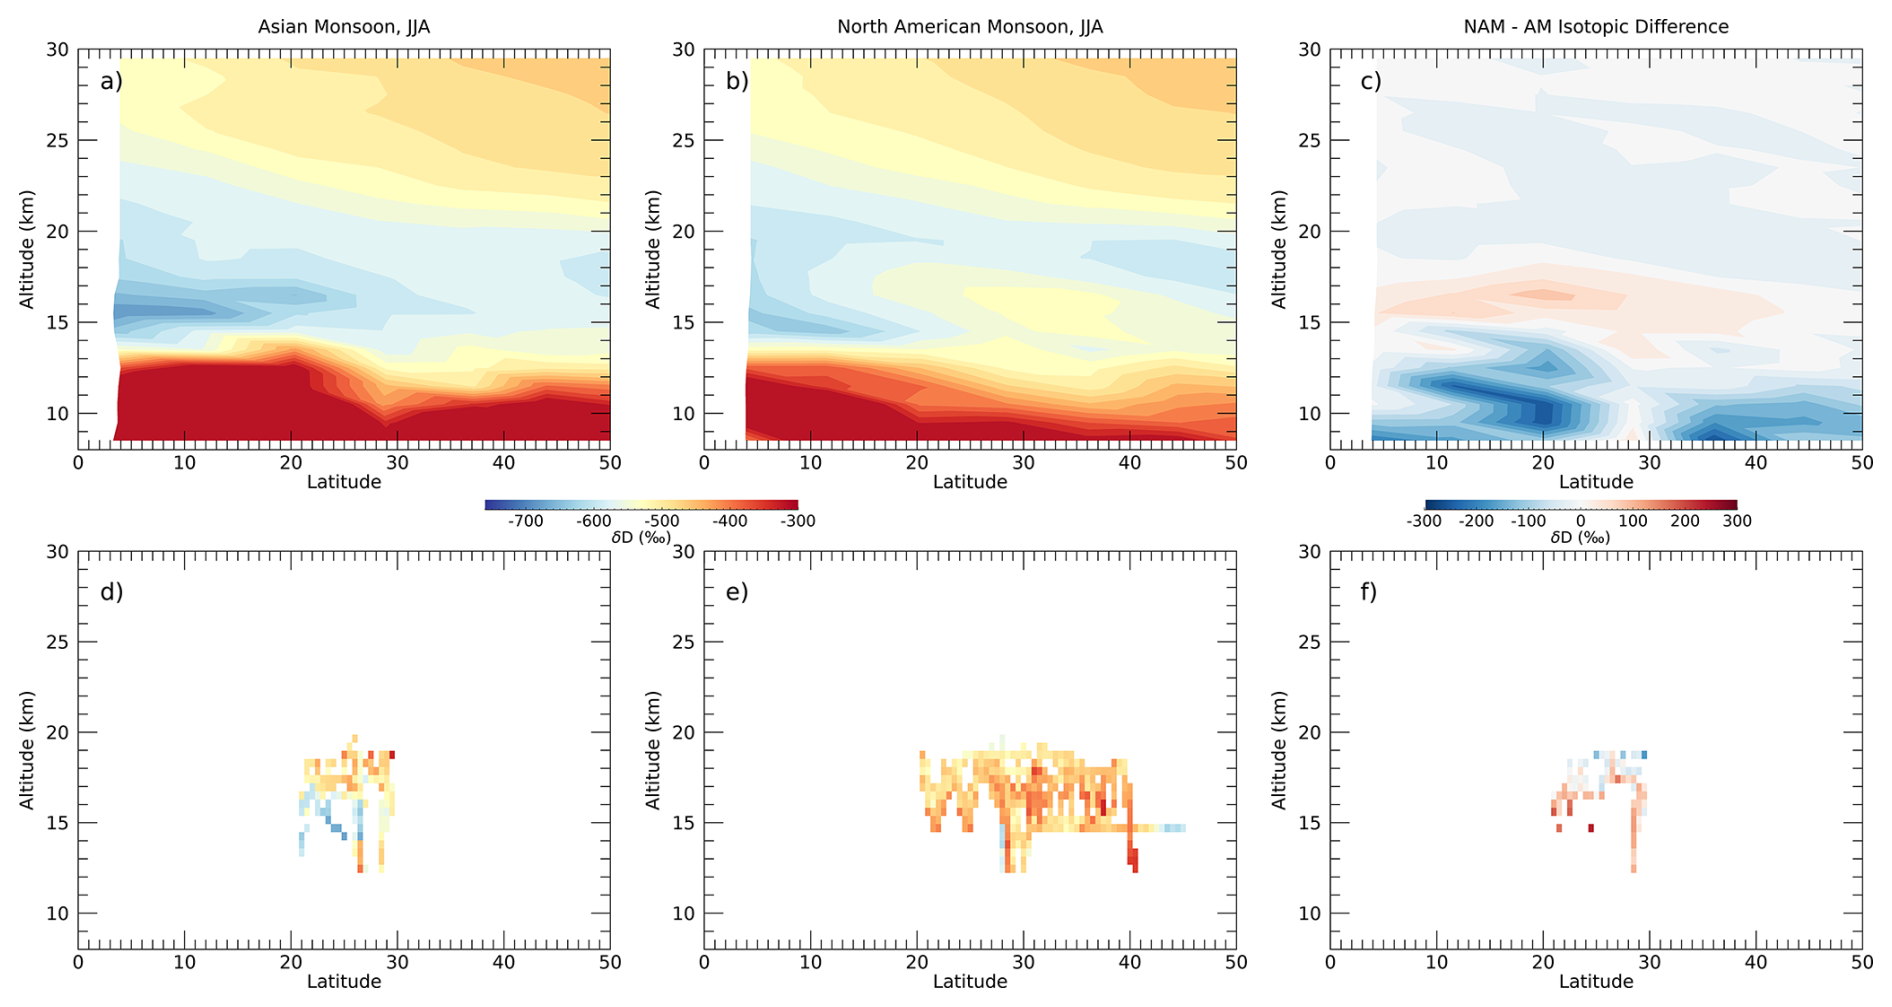
Figure 6ACE-FTS (top row) and ChiWIS (bottom row) isotopic compositions for the Asian Monsoon (a, d), North American Monsoon (b, e), and their difference (c, f). The ACE-FTS data in each longitudinal wedge between the latitudes of 0 and 50° N and altitudes of 8–30 km are rebinned into 6.25° by 1 km boxes, and the isotopic compositions shown are the median value of each bin. The Asian Monsoon region is defined here to be between 60 and 120° longitude, and the North American Monsoon region to be between 230 and 290°. A similar procedure is followed with the ChiWIS in situ data, although the boxes are 0.9° by 0.5 km. The difference in isotopic composition between boxes is calculated only for boxes in which ChiWIS made measurements in both the NAM and AM.
In the overworld stratosphere (above about 18 km), ACE-FTS retrievals show evidence of increasing δD due to methane oxidation, although as expected the difference plot shows little difference in this altitude range between the two regions. High-altitude research aircraft do not reach altitudes where methane oxidization is a significant effect.
In the transition region between about 15–18 km, satellite retrievals show the NAM region to be significantly enriched compared to the AM region, confirming that this result is still present in the v5.2 retrievals. Interestingly, the point at which the NAM is most enhanced (approximately 35° N and 15.5 km) does not correspond to the point with the largest difference between the NAM and AM regions, which occurs at approximately 20° N and 16.5 km. These differences call for a more detailed investigation into their origins.
Below 15 km, the AM region is much more isotopically enhanced than the NAM region, primarily because it is much wetter, and wetter air tends to be more isotopically enriched.
Here we present the first systematic comparison of water vapor isotopic composition from satellite and in situ retrievals. This work spans five measurement campaigns, covers the northern hemisphere from approximately 10° N to 60°, and the Asian and North American Monsoon systems. The field campaigns span the years from 2006 to 2022, providing significant overlap with the operational years of the ACE-FTS instrument.
This work compares the H2O, HDO, and δD data sets in three ways. Climatological averages of δD are compared to in situ measurements to look for systematic deviations between the data sets in terms of systematic biases over certain altitude intervals, inconsistent measurement envelopes, and large regional differences. This qualitative comparison shows that the in situ retrievals of δD in the lower stratosphere are consistently higher than those of the ACE-FTS instrument.
Detailed investigation of the in situ measurements shows that they are consistently about 100‰ more isotopically enriched than the median ACE-FTS δD retrievals above 14 km in the same region. This difference holds across measurements made by the ChiWIS, Harvard ICOS, and Hoxotope instruments, the last of which should be especially resistant to contamination due to its measurement principle, and in the Arctic transit flights, which offer the best opportunity for comparison due to essentially random sampling of stratospheric air during transit flights and the absence of thin cirrus which could yield more representative observations of isotopic depletion in the satellite data. We take this to be evidence that the spectroscopic features used in the satellite retrievals have error in high-altitude retrievals, and note that while both H2O and HDO satellite retrievals are biased low, the HDO retrievals are significantly more so. However, we cannot fully rule out bias in the in situ instruments due to contamination. In any case, resolving these large differences (> 100 ‰) is important as the limited in situ and remote sensing measurements of δD at these altitudes form the only basis for constraining isotopically-enabled GCMs.
It is noteworthy that the satellite/in situ difference is smallest in both species in the high-latitude transits of ChiWIS during the ACCLIP campaign, and largest in the CR-AVE tropical measurements. Three possible causes present themselves: (a) the high-latitude flights have no science targets and no clear bias towards a particular type of airmass, (b) the 400 to 500 K potential temperature range is found at a lower altitude in the high-latitudes, and retrievals there are therefore spread across a different set of microwindows than those in the tropics and mid-latitudes, and (c) the ACE-FTS instrument observes cirrus clouds over a relatively long path length in the tropics resulting in depletion in δD relative to localized in situ measurements.
In situ measurements of δD in both the NAM and AM by the ChiWIS instrument confirm the isotopic enhancement over the NAM reported in ACE-FTS observations by Randel et al. (2012). These differences likely reflect the specific thermodynamic and relative humidity structure of the NAM and AM systems. Further investigation is needed to fully exploit the information contained in these isotopic measurements.
Observations of water isotopologues in Earth's upper atmosphere are a powerful tool for understanding the influence of convection and transport of moisture into the region. Fundamental spectroscopy is needed to improve satellite retrievals of δD, which could then be more effectively used to constrain the global water vapor budget of the TTL and isotopically enabled GCMs. Furthermore, increased sampling frequency is needed in both in situ measurements and in the next generation of remote sensing platforms. Ideally, this sampling would comprise a research payload targeted to ACE-FTS measurements aboard a high-altitude aircraft such as the WB-57F or ER-2, with flight paths co-located with occultations.
ChiWIS data from the 2017 StratoClim campaign is accessible via the HALO database at https://halo-db.pa.op.dlr.de/mission/101 (StratoClim Team, 2021). Data from the ACCLIP campaign is accessible via the NASA LaRC database at https://www-air.larc.nasa.gov/missions/acclip/index.html (ACCLIP Team, 2022). Data from the CR-AVE, TC4, and AVE-WIIF campaigns are available on the NASA ESPO archive at https://espoarchive.nasa.gov/archive/browse (NASA ESPO archive, 2025). ACE-FTS v5.2 retrievals are available at https://databace.scisat.ca (last access: 14 May 2024). The software used to process, analyze, and visualize the ACE-FTS data can be found at https://github.com/bwclouser/ACE-FTS-Handler (last access: 17 March 2023).
BWC conceived of the study and performed the analysis. BWC and CES wrote the manuscript, with contributions from all coauthors. AD, CCK, JMS, TFH, RSS, and EJM provided feedback on the manuscript.
At least one of the (co-)authors is a member of the editorial board of Atmospheric Measurement Techniques. The peer-review process was guided by an independent editor, and the authors also have no other competing interests to declare.
Publisher's note: Copernicus Publications remains neutral with regard to jurisdictional claims made in the text, published maps, institutional affiliations, or any other geographical representation in this paper. The authors bear the ultimate responsibility for providing appropriate place names. Views expressed in the text are those of the authors and do not necessarily reflect the views of the publisher.
Benjamin Wade Clouser and Carly Cyd KleinStern acknowledge support by the NSF through the Partnerships in International Research and Education (PIRE) program (grant no. OISE-1743753). We thank the StratoClim coordination team, Myasishchev Design Bureau, and Geophysica pilots and ground crew for the successful execution of the StratoClim campaign. We thank the NASA support team and the WB-57 pilots and ground crew for the successful execution of the ACCLIP campaign.
This work was supported by the National Science Foundation through the Partnerships in International Research and Education program under grant number OISE-1743753. This research has been supported by the StratoClim project of the European Community's Seventh Framework Programme (FP7/2007–2013) under grant agreement no. 603557. The ACCLIP campaign was supported by NSF, NASA, and NOAA.
This paper was edited by Marc von Hobe and reviewed by Chris Boone and one anonymous referee.
ACCLIP Team: ACCLIP Campaign Data, National Aeronautics and Space Administration [data set], https://www-air.larc.nasa.gov/missions/acclip/index.html (last access: 15 May 2025), 2022. a
Bernath, P. F., McElroy, C. T., Abrams, M. C., Boone, C. D., Butler, M., Camy-Peyret, C., Carleer, M., Clerbaux, C., Coheur, P.-F., Colin, R., DeCola, P., DeMazière, M., Drummond, J. R., Dufour, D., Evans, W. F. J., Fast, H., Fussen, D., Gilbert, K., Jennings, D. E., Llewellyn, E. J., Lowe, R. P., Mahieu, E., McConnell, J. C., McHugh, M., McLeod, S. D., Michaud, R., Midwinter, C., Nassar, R., Nichitiu, F., Nowlan, C., Rinsland, C. P., Rochon, Y. J., Rowlands, N., Semeniuk, K., Simon, P., Skelton, R., Sloan, J. J., Soucy, M.-A., Strong, K., Tremblay, P., Turnbull, D., Walker, K. A., Walkty, I., Wardle, D. A., Wehrle, V., Zander, R., and Zou, J.: Atmospheric Chemistry Experiment (ACE): Mission overview, Geophys. Res. Lett., 32, https://doi.org/10.1029/2005GL022386, 2005. a, b
Boone, C., Bernath, P., and Lecours, M.: Version 5 retrievals for ACE-FTS and ACE-imagers, J. Quant. Spectrosc. Ra., 310, 108749, https://doi.org/10.1016/j.jqsrt.2023.108749, 2023. a
Boone, C. D., Nassar, R., Walker, K. A., Rochon, Y., McLeod, S. D., Rinsland, C. P., and Bernath, P. F.: Retrievals for the atmospheric chemistry experiment Fourier-transform spectrometer, Appl. Optics, 44, 7218–7231, https://doi.org/10.1364/AO.44.007218, 2005. a, b
Cairo, F., Di Donfrancesco, G., Snels, M., Fierli, F., Viterbini, M., Borrmann, S., and Frey, W.: A comparison of light backscattering and particle size distribution measurements in tropical cirrus clouds, Atmos. Meas. Tech., 4, 557–570, https://doi.org/10.5194/amt-4-557-2011, 2011. a
Charlesworth, E., Plöger, F., Birner, T., Baikhadzhaev, R., Abalos, M., Abraham, N. L., Akiyoshi, H., Bekki, S., Dennison, F., Jöckel, P., Keeble, J., Kinnison, D., Morgenstern, O., Plummer, D., Rozanov, E., Strode, S., Zeng, G., Egorova, T., and Riese, M.: Stratospheric water vapor affecting atmospheric circulation, Nat. Commun., 14, 3925, https://doi.org/10.1038/s41467-023-39559-2, 2023. a
Clouser, B. W., Sarkozy, L. C., Singer, C. E., KleinStern, C. C., Desmoulin, A., Gaeta, D., Khaykin, S., Gabbard, S., Shertz, S., and Moyer, E. J.: The airborne chicago water isotope spectrometer: an integrated cavity output spectrometer for measurements of the isotopic ratio in the Asian Summer Monsoon, Atmos. Meas. Tech., 18, 6465–6491, https://doi.org/10.5194/amt-18-6465-2025, 2025. a
De Los Ríos, K., Ordoñez, P., Stiller, G. P., Raspollini, P., Gai, M., Walker, K. A., Peña-Ortiz, C., and Acosta, L.: Comparison of the H2O, HDO and δD stratospheric climatologies between the MIPAS-ESA V8, MIPAS-IMK V5 and ACE-FTS V4.1/4.2 satellite datasets, Atmos. Meas. Tech., 17, 3401–3418, https://doi.org/10.5194/amt-17-3401-2024, 2024. a
Dessler, A. E., Schoeberl, M. R., Wang, T., Davis, S. M., and Rosenlof, K. H.: Stratospheric water vapor feedback, P. Natl. Acad. Sci. USA, 110, 18087–18091, https://doi.org/10.1073/pnas.1310344110, 2013. a
Dollner, M., Gasteiger, J., Schöberl, M., Gattringer, A., Beres, N. D., Bui, P. T., Diskin, G., and Weinzierl, B.: The Cloud Indicator: A novel algorithm for automatic detection and classification of clouds using airborne in situ observations, Atmos. Res., 308, 107504, https://doi.org/10.1016/j.atmosres.2024.107504, 2024. a
Eichinger, R., Jöckel, P., Brinkop, S., Werner, M., and Lossow, S.: Simulation of the isotopic composition of stratospheric water vapour – Part 1: Description and evaluation of the EMAC model, Atmos. Chem. Phys., 15, 5537–5555, https://doi.org/10.5194/acp-15-5537-2015, 2015. a
Eremenko, M. N., Zasetsky, A. Y., Boone, C. D., and Sloan, J. J.: Properties of high-altitude tropical cirrus clouds determined from ACE FTS observations, Geophys. Res. Lett., 32, https://doi.org/10.1029/2005GL022428, 2005. a
Fahey, D. W., Gao, R.-S., Möhler, O., Saathoff, H., Schiller, C., Ebert, V., Krämer, M., Peter, T., Amarouche, N., Avallone, L. M., Bauer, R., Bozóki, Z., Christensen, L. E., Davis, S. M., Durry, G., Dyroff, C., Herman, R. L., Hunsmann, S., Khaykin, S. M., Mackrodt, P., Meyer, J., Smith, J. B., Spelten, N., Troy, R. F., Vömel, H., Wagner, S., and Wienhold, F. G.: The AquaVIT-1 intercomparison of atmospheric water vapor measurement techniques, Atmos. Meas. Tech., 7, 3177–3213, https://doi.org/10.5194/amt-7-3177-2014, 2014. a
Farmer, C. B.: High resolution infrared spectroscopy of the Sun and the Earth's atmosphere from space, Microchim. Acta, 93, 189–214, 1987. a
Fischer, H., Birk, M., Blom, C., Carli, B., Carlotti, M., von Clarmann, T., Delbouille, L., Dudhia, A., Ehhalt, D., Endemann, M., Flaud, J. M., Gessner, R., Kleinert, A., Koopman, R., Langen, J., López-Puertas, M., Mosner, P., Nett, H., Oelhaf, H., Perron, G., Remedios, J., Ridolfi, M., Stiller, G., and Zander, R.: MIPAS: an instrument for atmospheric and climate research, Atmos. Chem. Phys., 8, 2151–2188, https://doi.org/10.5194/acp-8-2151-2008, 2008. a
Fueglistaler, S., Dessler, A. E., Dunkerton, T. J., Folkins, I., Fu, Q., and Mote, P. W.: Tropical tropopause layer, Rev. Geophys., 47, https://doi.org/10.1029/2008RG000267, 2009. a, b
Galewsky, J., Steen-Larsen, H. C., Field, R. D., Worden, J., Risi, C., and Schneider, M.: Stable isotopes in atmospheric water vapor and applications to the hydrologic cycle, Rev. Geophys., 54, 809–865, https://doi.org/10.1002/2015RG000512, 2016. a
Gettelman, A., Kinnison, D. E., Dunkerton, T. J., and Brasseur, G. P.: Impact of monsoon circulations on the upper troposphere and lower stratosphere, J. Geophys. Res.-Atmos., 109, https://doi.org/10.1029/2004JD004878, 2004. a
Gordon, I., Rothman, L., Hargreaves, R., Hashemi, R., Karlovets, E., Skinner, F., Conway, E., Hill, C., Kochanov, R., Tan, Y., Wcisło, P., Finenko, A., Nelson, K., Bernath, P., Birk, M., Boudon, V., Campargue, A., Chance, K., Coustenis, A., Drouin, B., Flaud, J., Gamache, R., Hodges, J., Jacquemart, D., Mlawer, E., Nikitin, A., Perevalov, V., Rotger, M., Tennyson, J., Toon, G., Tran, H., Tyuterev, V., Adkins, E., Baker, A., Barbe, A., Canè, E., Császár, A., Dudaryonok, A., Egorov, O., Fleisher, A., Fleurbaey, H., Foltynowicz, A., Furtenbacher, T., Harrison, J., Hartmann, J., Horneman, V., Huang, X., Karman, T., Karns, J., Kassi, S., Kleiner, I., Kofman, V., Kwabia–Tchana, F., Lavrentieva, N., Lee, T., Long, D., Lukashevskaya, A., Lyulin, O., Makhnev, V., Matt, W., Massie, S., Melosso, M., Mikhailenko, S., Mondelain, D., Müller, H., Naumenko, O., Perrin, A., Polyansky, O., Raddaoui, E., Raston, P., Reed, Z., Rey, M., Richard, C., Tóbiás, R., Sadiek, I., Schwenke, D., Starikova, E., Sung, K., Tamassia, F., Tashkun, S., Vander Auwera, J., Vasilenko, I., Vigasin, A., Villanueva, G., Vispoel, B., Wagner, G., Yachmenev, A., and Yurchenko, S.: The HITRAN2020 molecular spectroscopic database, J. Quant. Spectrosc. Ra., 277, 107949, https://doi.org/10.1016/j.jqsrt.2021.107949, 2022. a
Hagemann, R., Nief, G., and Roth, E.: Absolute isotopic scale for deuterium analysis of natural waters. Absolute ratio for SMOW, Tellus, 22, 712–715, 1970. a
Hanisco, T. F., Moyer, E. J., Weinstock, E. M., St. Clair, J. M., Sayres, D. S., Smith, J. B., Lockwood, R., Anderson, J. G., Dessler, A. E., Keutsch, F. N., Spackman, J. R., Read, W. G., and Bui, T. P.: Observations of deep convective influence on stratospheric water vapor and its isotopic composition, Geophys. Res. Lett., 34, https://doi.org/10.1029/2006GL027899, 2007. a, b
Held, I. M. and Soden, B. J.: Water Vapor Feedback and Global Warming, Annu. Rev. Env. Resour., 25, 441–475, https://doi.org/10.1146/annurev.energy.25.1.441, 2000. a
Herbin, H., Hurtmans, D., Clerbaux, C., Clarisse, L., and Coheur, P.-F.: and HDO measurements with IASI/MetOp, Atmos. Chem. Phys., 9, 9433–9447, https://doi.org/10.5194/acp-9-9433-2009, 2009. a, b
Hintsa, E. J., Weinstock, E. M., Anderson, J. G., May, R. D., and Hurst, D. F.: On the accuracy of in situ water vapor measurements in the troposphere and lower stratosphere with the Harvard Lyman-α hygrometer, J. Geophys. Res.-Atmos., 104, 8183–8189, https://doi.org/10.1029/1998JD100110, 1999. a
Hoffmann, L. and Spang, R.: An assessment of tropopause characteristics of the ERA5 and ERA-Interim meteorological reanalyses, Atmos. Chem. Phys., 22, 4019–4046, https://doi.org/10.5194/acp-22-4019-2022, 2022. a
Högberg, C., Lossow, S., Khosrawi, F., Bauer, R., Walker, K. A., Eriksson, P., Murtagh, D. P., Stiller, G. P., Steinwagner, J., and Zhang, Q.: The SPARC water vapour assessment II: profile-to-profile and climatological comparisons of stratospheric δD(H2O) observations from satellite, Atmos. Chem. Phys., 19, 2497–2526, https://doi.org/10.5194/acp-19-2497-2019, 2019. a
Irion, F. W., Moyer, E. J., Gunson, M. R., Rinsland, C. P., Yung, Y. L., Michelsen, H. A., Salawitch, R. J., Chang, A. Y., Newchurch, M. J., Abbas, M. M., Abrams, M. C., and Zander, R.: Stratospheric observations of CH3D and HDO from ATMOS infrared solar spectra: Enrichments of deuterium in methane and implications for HD, Geophys. Res. Lett., 23, 2381–2384, https://doi.org/10.1029/96GL01402, 1996. a
Keeble, J., Hassler, B., Banerjee, A., Checa-Garcia, R., Chiodo, G., Davis, S., Eyring, V., Griffiths, P. T., Morgenstern, O., Nowack, P., Zeng, G., Zhang, J., Bodeker, G., Burrows, S., Cameron-Smith, P., Cugnet, D., Danek, C., Deushi, M., Horowitz, L. W., Kubin, A., Li, L., Lohmann, G., Michou, M., Mills, M. J., Nabat, P., Olivié, D., Park, S., Seland, Ø., Stoll, J., Wieners, K.-H., and Wu, T.: Evaluating stratospheric ozone and water vapour changes in CMIP6 models from 1850 to 2100, Atmos. Chem. Phys., 21, 5015–5061, https://doi.org/10.5194/acp-21-5015-2021, 2021. a
Khaykin, S., Podglajen, A., Ploeger, F., Grooß, J.-U., Tencé, F., Bekki, S., Khlopenkov, K., Bedka, K., Rieger, L., Baron, A., Godin-Beekmann, S., Legras, B., Sellitto, P., Sakai, T., Barnes, J., Uchino, O., Morino, I., Nagai, T., Wing, R., Baumgarten, G., Gerding, M., Duflot, V., Payen, G., Jumelet, J., Querel, R., Liley, B., Bourassa, A., Clouser, B., Feofilov, A., Hauchecorne, A., and Ravetta, F: Global perturbation of stratospheric water and aerosol burden by Hunga eruption, Communications Earth & Environment, 3, 316, https://doi.org/10.1038/s43247-022-00652-x, 2022a. a
Khaykin, S. M., Moyer, E., Krämer, M., Clouser, B., Bucci, S., Legras, B., Lykov, A., Afchine, A., Cairo, F., Formanyuk, I., Mitev, V., Matthey, R., Rolf, C., Singer, C. E., Spelten, N., Volkov, V., Yushkov, V., and Stroh, F.: Persistence of moist plumes from overshooting convection in the Asian monsoon anticyclone, Atmos. Chem. Phys., 22, 3169–3189, https://doi.org/10.5194/acp-22-3169-2022, 2022b. a
Krämer, M., Rolf, C., Luebke, A., Afchine, A., Spelten, N., Costa, A., Meyer, J., Zöger, M., Smith, J., Herman, R. L., Buchholz, B., Ebert, V., Baumgardner, D., Borrmann, S., Klingebiel, M., and Avallone, L.: A microphysics guide to cirrus clouds – Part 1: Cirrus types, Atmos. Chem. Phys., 16, 3463–3483, https://doi.org/10.5194/acp-16-3463-2016, 2016. a
Krämer, M., Rolf, C., Spelten, N., Afchine, A., Fahey, D., Jensen, E., Khaykin, S., Kuhn, T., Lawson, P., Lykov, A., Pan, L. L., Riese, M., Rollins, A., Stroh, F., Thornberry, T., Wolf, V., Woods, S., Spichtinger, P., Quaas, J., and Sourdeval, O.: A microphysics guide to cirrus – Part 2: Climatologies of clouds and humidity from observations, Atmos. Chem. Phys., 20, 12569–12608, https://doi.org/10.5194/acp-20-12569-2020, 2020. a
Kremser, S., Wohltmann, I., Rex, M., Langematz, U., Dameris, M., and Kunze, M.: Water vapour transport in the tropical tropopause region in coupled Chemistry-Climate Models and ERA-40 reanalysis data, Atmos. Chem. Phys., 9, 2679–2694, https://doi.org/10.5194/acp-9-2679-2009, 2009. a
Kuang, Z., Toon, G. C., Wennberg, P. O., and Yung, Y. L.: Measured ratios across the tropical tropopause, Geophys. Res. Lett., 30, https://doi.org/10.1029/2003GL017023, 2003. a
Liuzzi, G., Masiello, G., Serio, C., Venafra, S., and Camy-Peyret, C.: Physical inversion of the full IASI spectra: Assessment of atmospheric parameters retrievals, consistency of spectroscopy and forward modelling, J. Quant. Spectrosc. Ra., 182, 128–157, https://doi.org/10.1016/j.jqsrt.2016.05.022, 2016. a, b
Lossow, S., Steinwagner, J., Urban, J., Dupuy, E., Boone, C. D., Kellmann, S., Linden, A., Kiefer, M., Grabowski, U., Glatthor, N., Höpfner, M., Röckmann, T., Murtagh, D. P., Walker, K. A., Bernath, P. F., von Clarmann, T., and Stiller, G. P.: Comparison of HDO measurements from Envisat/MIPAS with observations by Odin/SMR and SCISAT/ACE-FTS, Atmos. Meas. Tech., 4, 1855–1874, https://doi.org/10.5194/amt-4-1855-2011, 2011. a
Lossow, S., Högberg, C., Khosrawi, F., Stiller, G. P., Bauer, R., Walker, K. A., Kellmann, S., Linden, A., Kiefer, M., Glatthor, N., von Clarmann, T., Murtagh, D. P., Steinwagner, J., Röckmann, T., and Eichinger, R.: A reassessment of the discrepancies in the annual variation of δD-H2O in the tropical lower stratosphere between the MIPAS and ACE-FTS satellite data sets, Atmos. Meas. Tech., 13, 287–308, https://doi.org/10.5194/amt-13-287-2020, 2020. a
Louet, J. and Bruzzi, S.: ENVISAT mission and system, in: IEEE 1999 International Geoscience and Remote Sensing Symposium, IGARSS'99, Cat. No. 99CH36293, IEEE, 3, 1680–1682, 1999. a
Moyer, E. J., Irion, F. W., Yung, Y. L., and Gunson, M. R.: ATMOS stratospheric deuterated water and implications for troposphere-stratosphere transport, Geophys. Res. Lett., 23, 2385–2388, https://doi.org/10.1029/96GL01489, 1996. a
Murtagh, D., Frisk, U., Merino, F., Ridal, M., Jonsson, A., Stegman, J., Witt, G., Eriksson, P., Jiménez, C., Megie, G., Noë, J. d. l., Ricaud, P., Baron, P., Pardo, J. R., Hauchcorne, A., Llewellyn, E. J., Degenstein, D. A., Gattinger, R. L., Lloyd, N. D., Evans, W. F., McDade, I. C., Haley, C. S., Sioris, C., Savigny, C. v., Solheim, B. H., McConnell, J. C., Strong, K., Richardson, E. H., Leppelmeier, G. W., Kyrölä, E., Auvinen, H., and Oikarinen, L.: An overview of the Odin atmospheric mission, Can. J. Phys., 80, 309–319, https://doi.org/10.1139/p01-157, 2002. a
Murtagh, D., Skyman, A., Rydberg, B., and Eriksson, P.: Odin/SMR product validation and evolution report, Tech. rep., Technical report, Chalmers 20 University of Technology, Department of Space, 2020. a
NASA ESPO archive: CR-AVE, TC4, AVE-WIIF Campaign Data, National Aeronautics and Space Administration [data set], https://espoarchive.nasa.gov/archive/browse (last access: 25 November, 2025), 2025 a
Nassar, R., Bernath, P. F., Boone, C. D., Gettelman, A., McLeod, S. D., and Rinsland, C. P.: Variability in abundance ratios in the tropical tropopause layer, J. Geophys. Res.-Atmos., 112, https://doi.org/10.1029/2007JD008417, 2007. a
Noone, K. J., Ogren, J. A., Heintzenberg, J., Charlson, R. J., and Covert, D. S.: Design and Calibration of a Counterflow Virtual Impactor for Sampling of Atmospheric Fog and Cloud Droplets, Aerosol Sci. Tech., 8, 235–244, https://doi.org/10.1080/02786828808959186, 1988. a
Randel, W. J., Moyer, E., Park, M., Jensen, E., Bernath, P., Walker, K., and Boone, C.: Global variations of HDO and ratios in the upper troposphere and lower stratosphere derived from ACE-FTS satellite measurements, J. Geophys. Res.-Atmos., 117, https://doi.org/10.1029/2011JD016632, 2012. a, b, c, d
Rinsland, C., Gunson, M., Wang, P.-H., Arduini, R., Baum, B., Minnis, P., Goldman, A., Abrams, M., Zander, R., Mahiue, E., Salawitch, R., Michelsen, H., Irion, F., and Newchurch, M.: ATMOS/ATLAS 3 infrared profile measurements of clouds in the tropical and subtropical upper troposphere, J. Quant. Spectrosc. Ra., 60, 903–919, https://doi.org/10.1016/S0022-4073(98)00093-4, 1998. a
Sayres, D. S., Moyer, E. J., Hanisco, T. F., St. Clair, J. M., Keutsch, F. N., O'Brien, A., Allen, N. T., Lapson, L., Demusz, J. N., Rivero, M., Martin, T., Greenberg, M., Tuozzolo, C., Engel, G. S., Kroll, J. H., Paul, J. B., and Anderson, J. G.: A new cavity based absorption instrument for detection of water isotopologues in the upper troposphere and lower stratosphere, Rev. Sci. Instrum., 80, 044102, https://doi.org/10.1063/1.3117349, 2009. a, b
Sayres, D. S., Pfister, L., Hanisco, T. F., Moyer, E. J., Smith, J. B., Clair, J. M. S., O'Brien, A. S., Witinski, M. F., Legg, M., and Anderson, J. G.: Influence of convection on the water isotopic composition of the tropical tropopause layer and tropical stratosphere, J. Geophys. Res.-Atmos., 115, D00J20, https://doi.org/10.1029/2009JD013100, 2010. a
Schneider, M., Ertl, B., Diekmann, C. J., Khosrawi, F., Weber, A., Hase, F., Höpfner, M., García, O. E., Sepúlveda, E., and Kinnison, D.: Design and description of the MUSICA IASI full retrieval product, Earth Syst. Sci. Data, 14, 709–742, https://doi.org/10.5194/essd-14-709-2022, 2022. a
Shindell, D. T.: Climate and ozone response to increased stratospheric water vapor, Geophys. Res. Lett., 28, 1551–1554, https://doi.org/10.1029/1999GL011197, 2001. a, b
Singer, C. E., Clouser, B. W., Khaykin, S. M., Krämer, M., Cairo, F., Peter, T., Lykov, A., Rolf, C., Spelten, N., Afchine, A., Brunamonti, S., and Moyer, E. J.: Intercomparison of upper tropospheric and lower stratospheric water vapor measurements over the Asian Summer Monsoon during the StratoClim campaign, Atmos. Meas. Tech., 15, 4767–4783, https://doi.org/10.5194/amt-15-4767-2022, 2022. a
St. Clair, J. M., Hanisco, T. F., Weinstock, E. M., Moyer, E. J., Sayres, D. S., Keutsch, F. N., Kroll, J. H., Demusz, J. N., Allen, N. T., Smith, J. B., Spackman, J. R., and Anderson, J. G.: A new photolysis laser-induced fluorescence instrument for the detection of H2O and HDO in the lower stratosphere, Rev. Sci. Instrum., 79, 064101, https://doi.org/10.1063/1.2940221, 2008. a, b, c
Steinwagner, J., Milz, M., von Clarmann, T., Glatthor, N., Grabowski, U., Höpfner, M., Stiller, G. P., and Röckmann, T.: HDO measurements with MIPAS, Atmos. Chem. Phys., 7, 2601–2615, https://doi.org/10.5194/acp-7-2601-2007, 2007. a
Stenke, A. and Grewe, V.: Simulation of stratospheric water vapor trends: impact on stratospheric ozone chemistry, Atmos. Chem. Phys., 5, 1257–1272, https://doi.org/10.5194/acp-5-1257-2005, 2005. a
StratoClim Team: StratoClim Campaign Data, Deutsches Zentrum fur Luft- und Raumfahrt [data set], https://halo-db.pa.op.dlr.de/mission/101 (last access: 15 May 2025), 2021. a
Thurnherr, I., Sodemann, H., Trent, T., Werner, M., and Bösch, H.: Evaluating TROPOMI δD Column Retrievals With In Situ Airborne Field Campaign Measurements Using Expanded Collocation Criterion, Earth and Space Science, 11, e2023EA003400, https://doi.org/10.1029/2023EA003400, 2024. a
Tritscher, I., Pitts, M. C., Poole, L. R., Alexander, S. P., Cairo, F., and Chipperfield, M. P.: Polar Stratospheric Clouds: Satellite Observations, Processes, and Role in Ozone Depletion, Rev. Geophys., 59, e2020RG000702, https://doi.org/10.1029/2020RG000702, 2021. a
Twohy, C. H., Schanot, A. J., and Cooper, W. A.: Measurement of Condensed Water Content in Liquid and Ice Clouds Using an Airborne Counterflow Virtual Impactor, J. Atmos. Ocean. Tech., 14, 197–202, https://doi.org/10.1175/1520-0426(1997)014<0197:MOCWCI>2.0.CO;2, 1997. a
Webster, C. R. and Heymsfield, A. J.: Water Isotope Ratios , , in and out of Clouds Map Dehydration Pathways, Science, 302, 1742–1745, https://doi.org/10.1126/science.1089496, 2003. a
Weinstock, E. M., Hintsa, E. J., Dessler, A. E., Oliver, J. F., Hazen, N. L., Demusz, J. N., Allen, N. T., Lapson, L. B., and Anderson, J. G.: New fast response photofragment fluorescence hygrometer for use on the NASA ER‐2 and the Perseus remotely piloted aircraft, Rev. Sci. Instrum., 65, 3544–3554, https://doi.org/10.1063/1.1144536, 1994. a
Weinstock, E. M., Smith, J. B., Sayres, D., Spackman, J. R., Pittman, J. V., Allen, N., Demusz, J., Greenberg, M., Rivero, M., Solomon, L., and Anderson, J. G.: Measurements of the Total Water Content of Cirrus Clouds. Part I: Instrument Details and Calibration, J. Atmos. Ocean. Tech., 23, 1397–1409, https://doi.org/10.1175/JTECH1928.1, 2006. a
Zelinger, Z., Barret, B., Kubát, P., Ricaud, P., Attie, J.-L., Le Flochmoën, E., Urban, J., Murtagh, D., and Střižík, M.: Observation of HD18O, CH3OH and vibrationally-excited N2O from Odin/SMR measurements, Mol. Phys., 104, 2815–2820, https://doi.org/10.1080/00268970600875380, 2006. a
Zondlo, M. A., Hudson, P. K., Prenni, A. J., and Tolbert, M. A.: Chemistry and Microphysics of Polar Stratospheric Clouds and Cirrus Clouds, Annu. Rev. Phys. Chem., 51, 473–499, https://doi.org/10.1146/annurev.physchem.51.1.473, 2000. a
Zou, L., Hoffmann, L., Müller, R., and Spang, R.: Variability and trends of the tropical tropopause derived from a 1980–2021 multi-reanalysis assessment, Frontiers in Earth Science, 11, 1177502, https://doi.org/10.3389/feart.2023.1177502, 2023. a