the Creative Commons Attribution 4.0 License.
the Creative Commons Attribution 4.0 License.
 | 20 Feb 2026
The role of size in the multiple scattering correction C for dual-spot aethalometer: a field and laboratory investigation
Claudia Di Biagio
Johannes Heuser
Marco Zanatta
Mathieu Cazaunau
Antonin Bergé
Edouard Pangui
Jérôme Yon
Tommaso Isolabella
Dario Massabò
Virginia Vernocchi
Martina Mazzini
Franziska Vogel
Chenjie Yu
Paola Formenti
Benedicte Picquet-Varrault
Jean-Francois Doussin
Angela Marinoni
The dual-spot aethalometer AE33 is a widely used instrument for measuring the aerosol absorption coefficient, but the accuracy of its measurements is heavily dependent on the multiple scattering correction factor (C), which compensates for multiple scattering effects in the filter matrix. Despite its widespread use, several aspects influencing the variability of C, particularly those related to aerosol microphysical properties, are still not fully constrained.
In this work, we explore the variability of C for the AE33 in a wide range of conditions and aerosol properties by combining chamber experiments with freshly emitted laboratory-generated soot and ambient data from a mountaintop site in Italy (Monte Cimone, CMN). The C factor is derived by comparison with independent filter-based instruments such as the MAAP (Multi-Angle Absorption Photometer) and MWAA (Multi-Wavelength Absorption Analyzer) at CMN and the extinction-minus-scattering (EMS) approach in chamber experiments.
The mean C value at a wavelength of 637 nm derived at CMN is 2.35 with a standard deviation of 0.58, while the average values obtained in chamber experiments in different conditions range from 2.89 ± 0.03 to 3.9 ± 0.06. The variability of C at CMN appears to be primarily influenced by the signal-to-noise ratio of the instruments, especially during the colder months when absorption coefficient values fall below 1 Mm−1. In contrast, in the chamber experiments, the variability is mainly driven by particle properties. The C value at 637 nm, derived from measurements at CMN, increases with increasing single scattering albedo (SSA), particularly for SSA values above 0.94, while showing no statistically significant spectral variability. Both ambient and chamber experiments highlight the dependence of the C factor on particle size, with C increasing as particle diameter decreases below 200 nm. This size dependence is relatively small (within 25 %) under ambient conditions dominated by mostly scattering aerosols, but it leads to changes greater than 60 % for highly absorbing soot particles. These results are relevant for improving the accuracy and comparability of aerosol absorption measurements performed by aethalometers, particularly within monitoring networks. The observed dependence of C on particle size suggests that differences between urban and remote sites, or between periods dominated by nucleation versus coarse-mode particles (e.g., dust), may contribute to the variability reported across locations. Understanding these dependencies is essential for refining correction approaches and reducing inter-site discrepancies in network datasets.
- Article
(3111 KB) - Full-text XML
-
Supplement
(1147 KB) - BibTeX
- EndNote


Absorbing aerosols have a unique and important role in the Earth's climate system (Bond et al., 2013; Liu et al., 2020a). By absorbing solar and terrestrial infrared radiation, aerosols exert an influence on low tropospheric temperature, liquid and ice cloud distribution and properties, atmospheric dynamics, as well as surface reflectivity, in particular over snow and ice surfaces (Ramanathan and Carmichael, 2008; Liu et al., 2020a; Li et al., 2022; Kok et al., 2023). This impact is especially significant for strongly absorbing species such as black carbon (BC), brown carbon (BrC), and mineral dust. These components account for the majority of aerosol light absorption and contribute substantially to the direct radiative effect at both regional and global scales (e.g. Chung et al., 2012; Kok et al., 2023; Sand et al., 2021; Zhu et al., 2021).
The strength of this radiative effect is typically characterized by the aerosol absorption coefficient, expressed in inverse mega meters (babs, Mm−1) that represents the amount of light absorbed by aerosol per unit volume. The babs is commonly measured using filter-based techniques, differential extinction-minus-scattering (EMS) methods, or photoacoustic instruments. Despite its importance, aerosol absorption remains poorly constrained. This is primarily due to the lack of standardized measurement approaches and the presence of instrument-specific biases (Petzold et al., 2013), which introduce substantial uncertainties in babs data. In consequence, a major difficulty lies in capturing the magnitude and spatio-temporal variability of the spectral mass absorption cross section (MAC, m2 g−1), i.e. the absorption coefficient per unit of absorbing specie mass concentration (µg m−3), or the single scattering albedo (SSA), representing the fraction of scattered radiation with respect to extinction. The MAC and SSA depend on a wide variety of variables such as the composition (via the complex refractive index, CRI), size, morphology and mixing state of the particles (Liu et al., 2020b; Moteki, 2023). Understanding these dependencies is required for a better representation of absorbing aerosols in climate models and remote sensing algorithms (e.g., Samset et al., 2018). In this regard, improving the accuracy of in situ measurements of the spectral aerosol absorption coefficient babs is fundamental for contributing to robust CRI, MAC and SSA evaluation.
The Aethalometer (Hansen et al., 1984; Drinovec et al., 2015) is the most used instrument for routine measurements of the aerosol absorption coefficient in the GAW (Global Atmospheric Watch) and ACTRIS-RI (Aerosol, Clouds, and Trace gases Research Infrastructure; https://www.actris.eu/, last access: 16 February 2026) observational networks (e.g., Laj et al., 2020; Savadkoohi et al., 2023; Rovira et al., 2025), with a long-record of applications in ground-based and airborne intensive field campaigns (e.g. Fialho et al., 2005; Sandradewi et al., 2008; Formenti et al., 2011; Di Biagio et al., 2016; Favez et al., 2021; Ohata et al., 2021) and laboratory experiments (e.g. Weingartner et al., 2003; Baldo et al., 2023; Di Biagio et al., 2019; Kalbermatter et al., 2022).
The aethalometer is a filter-based photometer. It measures the light attenuation (ATN) through a filter on which the aerosol is continuously collected at a constant flow rate. The volume absorption coefficient is estimated via the Beer–Bouguer–Lambert law based on the ATN rate of change over the time interval Δt (typically 1–2 min). This rate is proportional to the absorbing aerosol concentration and it is also used to calculate an optically–equivalent BC mass concentration (eBC, µg m−3) using prescribed instrumental MAC spectral values (Petzold et al., 2013). The aethalometer measurement technique has the advantage of being sensitive to low aerosol signals even for relatively low integration times (e.g., Hansen et al., 1984) and so to be adapted to measurements in environments with variable aerosol loadings. The aethalometer is also easily deployable and provides babs at seven wavelengths covering the broad range from 370 to 950 nm.
Despite its operational advantages, the aethalometer measurement is affected by environmental and aerosol-related artefacts that can seriously bias the retrieved absorption coefficient (Arnott et al., 2005; Schmid et al., 2006; Virkkula et al., 2015; Weingartner et al., 2003, hereafter referred as W2003; Collaud Coen et al., 2010, hereafter referred as C2010). These are linked to three causes:
- 1.
the accumulation of particles on the filter that reduces the linearity in the detected attenuation signal, therefore causing an underestimate of the absorption coefficient for increasing aerosol deposition (the loading effect);
- 2.
the scattering from particles deposited on the filter that contributes to detected attenuation and that causes an overestimation of the absorption (the scattering effect);
- 3.
the multiple scattering by the filter fibers causing an increased optical path and absorption overestimation (the multiple scattering effect).
Aethalometer models commercialized by Magee Scientific have evolved over time to address the known measurement artefacts. Earlier models, such as the AE31, did not include any automatic correction for these effects. Instead, post-processing algorithms and empirical correction factors – extensively studied and developed in the literature – were required to compensate for biases such as loading, scattering, and multiple scattering (Weingartner et al., 2003; Arnott et al., 2005; Bond and Bergstrom, 2006; Collaud Coen et al., 2010; Segura et al., 2014; Backman et al., 2017; Di Biagio et al., 2017; Saturno et al., 2017).
The more recent AE33 model, includes a dual-spot system that automatically compensates for the loading effect in real time (Drinovec et al., 2015). However, even in newer models, the correction for scattering and multiple scattering still relies on the application of a scaling factor, typically referred to as C or Cref. As of today, estimations of the C from various field and laboratory studies have been performed, investigating aerosols of different types and properties and varying ambient conditions (Corbin et al., 2018; Kim et al., 2019; Laing et al., 2020; Valentini et al., 2020; Moschos et al., 2021; Yus-Díez et al., 2021; Bernardoni et al., 2021; Kalbermatter et al., 2022). These studies have reported a wide range of C values, from about 2.26 to 8.26, which translates into significant uncertainty, as babs is inversely proportional to this factor. This variability remains one of the major challenges in standardizing and comparing absorption measurements across different studies and networks.
As of today, there is still no consensus on the appropriate value of C or its dependence on specific aerosol properties or experimental conditions. The influence of parameters such as particle size, chemical composition, and spectral wavelength on C remains debated. Particle size can lead to bias in the measurement of the absorption coefficient carried out with filter-based instruments (Lack et al., 2009; Nakayama et al., 2010). This dependence is related to the different depth of penetration of particles of different sizes into the filter, as well as to the characteristics of the filter (Hinds and Zhu, 2022; Huang et al., 2013; Berry et al., 2023). For the aethalometer, particle size has been suggested as a factor that could contribute to the variability of C values across different locations and seasons (Bernardoni et al., 2021, Luoma et al., 2021), although direct observational evidence for this dependence in the aethalometer AE33 remains limited (Drinovec et al., 2022; Romshoo et al., 2022; Yus-Díez et al., 2025). Regarding the composition, previous studies have demonstrated that the optical properties of sampled particles can directly influence aethalometer measurements by altering the amount of scattered light, which the instrument may incorrectly interpret as absorption. An increase in the SSA has been linked in these studies to a corresponding rise in the C values (Schmid et al., 2006; Backman et al., 2017; Yus-Díez et al., 2021). Moreover, very few studies have focused on C estimations for aerosol populations with high fractions of black and brown carbon (BC and BrC), such as those found near combustion sources or in laboratory studies on combustion aerosols.
This uncertainty has practical implications, particularly for international observation networks like ACTRIS RI, which currently recommend the use of a single, wavelength-independent C value. The objective of this study is to improve the characterization of the C parameter for the AE33 aethalometer model, currently the most widely used.
Specifically, we examine its dependence on particle size, while also considering the effects of other properties such as SSA and wavelength to support and complement existing evidence from the literature. The chamber experiments were designed to explore a broader particle size range than in previous studies (Drinovec et al., 2022), taking advantage of controlled conditions to better isolate the role of size and evaluate its relative importance compared to other aerosol properties. These experiments were conducted using freshly generated soot and non-filter-based reference techniques, ensuring independence from filter-related artifacts. Ambient observations, although subject to more variable and less controlled conditions, were used to assess whether the dependence on particle size can also be observed under real atmospheric conditions. This contributes additional context to previous work, where ambient investigations remain limited (e.g., Yus-Díez et al., 2025).
Given the widespread use of aethalometers in long-term observational networks, constraining the variability of the C factor is crucial for ensuring the quality and comparability of absorption data across sites. Differences in aerosol size distributions and mixing states – such as between freshly emitted soot in urban areas and aged or coarse particles at remote stations – can introduce systematic biases if a single, constant C is applied. A more robust understanding of these dependencies is therefore required to guide the harmonization of network measurements and to support the development of improved parameterizations for data correction.
The C dependencies were investigated through the synergic use of both chamber experiments and observational long term data series. While ambient measurements are valuable for investigating the spatial and temporal variability of C in the real atmosphere, chamber experiments provide a more controlled setting, where variability of multiple variables can be minimized, enabling a clearer understanding of how the C-factor depends on specific particle properties.
Table 1Datasets and optical instruments deployed for field observations at Cimone (CMN) and CESAM chamber experiments.
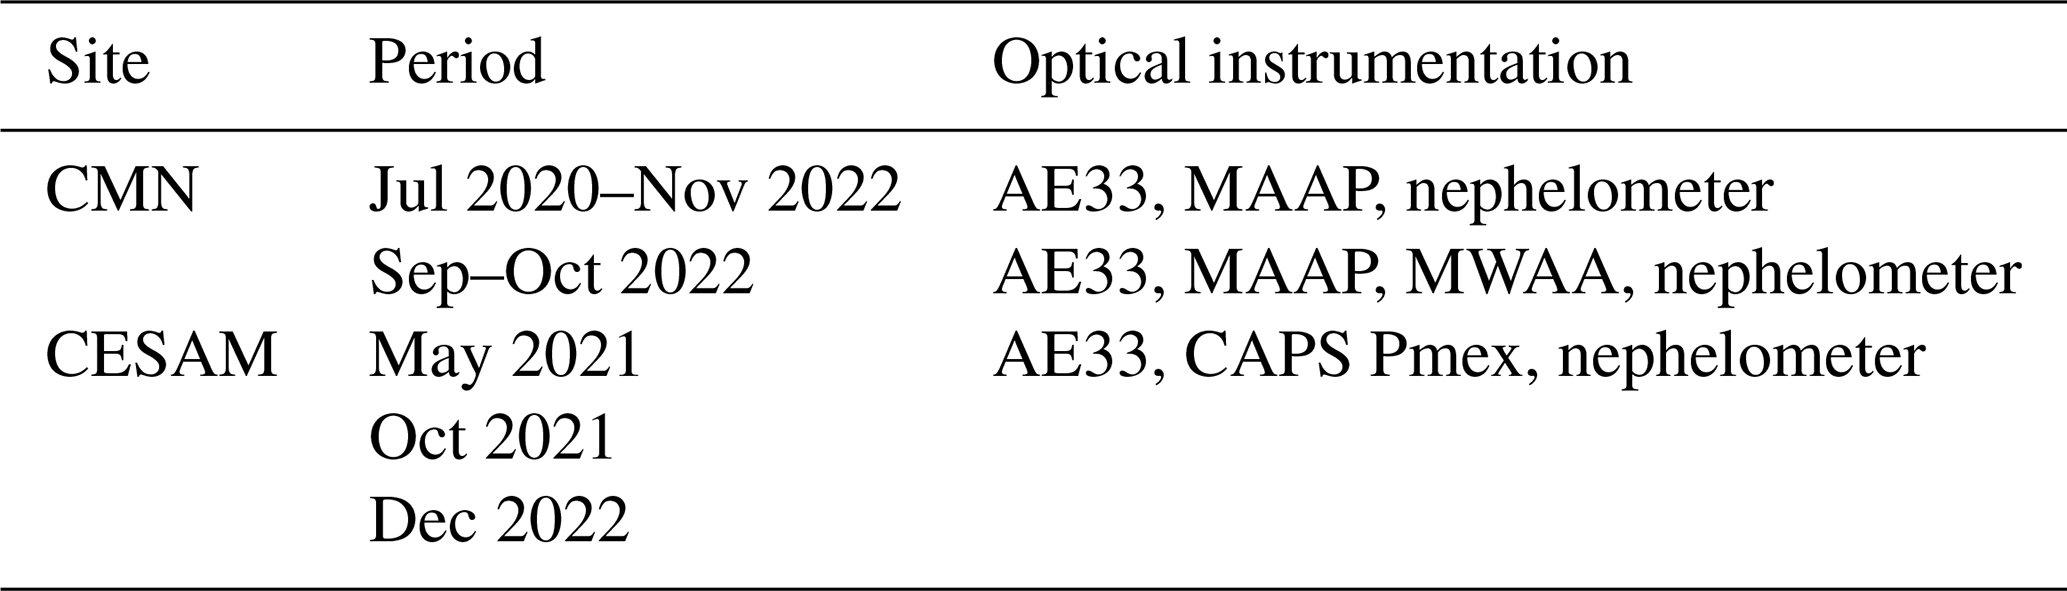
Table 2Technical details of the instruments used in the present analysis.
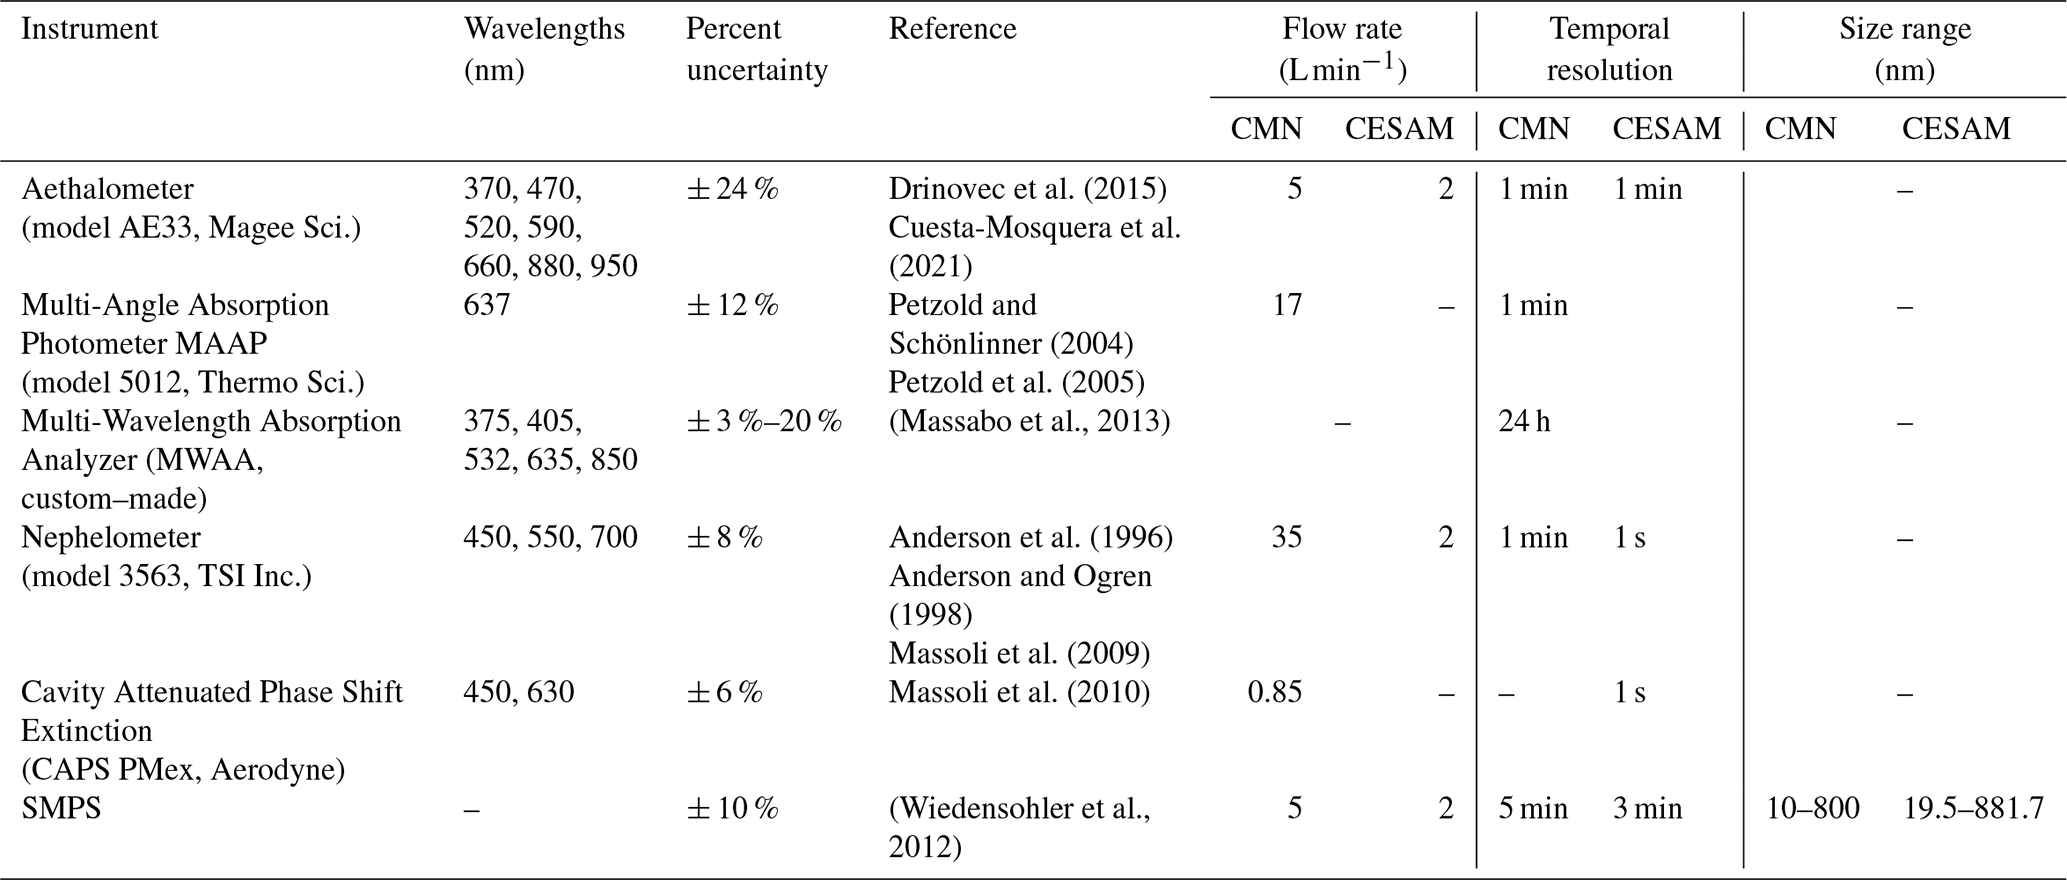
This section provides description of the experimental setup for field and chamber experiments and description of C factor calculations. A summary of the instruments considered in this study, including deployment details and availability, and measurement uncertainties is provided in Tables 1 and 2. All volumetric quantities used in the analysis were converted to standard temperature and pressure conditions (STP), assuming 1013.25 mbar and 273.15 K.
2.1 Experimental set-up
2.1.1 Field measurements at Mt Cimone
Field measurements were carried out at the mountain site of Monte Cimone (CMN, Italy, 44°11′ N, 10°42′ E, 2165 ), located in northern Italy near the Po Valley. The CMN observatory is situated on the summit of the highest mountain in the northern Apennines, and its orographic features allow air masses to arrive from all directions, making it representative of a relatively pristine atmosphere. However, particularly during summer and midday hours, it may be subject to the uplift of pollutants due to planetary boundary layer (PBL) rise and valley breezes (Marinoni et al., 2008; Cristofanelli et al., 2009; Andrews et al., 2011; Cristofanelli et al., 2018). The site is also subject to Saharan dust intrusions (Vogel et al., 2025b) and the long-range transport of wildfire emissions throughout the year (Cristofanelli et al., 2009, 2024). These diverse conditions affect aerosol properties, including particle size (e.g., following dust transport or new particle formation events; Vogel et al., 2025b) as well as their optical and chemical characteristics, influenced by sources such as the Po Valley, wildfires, and dust.
The CMN station is part of the World Meteorological Organization's (WMO) Global Atmosphere Watch (GAW) program and high-quality routine measurements of major aerosol properties are conducted in accordance with the ACTRIS-RI guidelines. This study presents measurements collected between July 2020 and November 2022. Aerosols were sampled through a TSP (Total Suspended Particles) inlet, specifically designed for high mountain stations.
The spectral absorption coefficient was measured using a dual-spot AE33 aethalometer (RH < 40 % ensured by a Nafion® dryer), and complemented by reference absorption techniques: the Multi-Angle Absorption Photometer (MAAP, online, 637 nm, Thermo Sci.; Petzold and Schönlinner, 2004) and the Multi-Wavelength Absorption Analyzer (MWAA, offline, 5 wavelengths, 375–405–532–635–870 nm, Massabò et al., 2015). The scattering coefficient was measured with an integrating nephelometer (TSI Inc., model 3563, Anderson et al., 1996; Massoli et al., 2009).
2.1.2 Simulation experiments in the CESAM chamber
Chamber experiments were performed in controlled conditions in the 4.2 m3 stainless-steel multi-instrumented CESAM chamber (French acronym for Experimental Multiphasic Atmospheric Simulation Chamber, https://cesam.cnrs.fr/, last access: 16 February 2026; Wang et al., 2011), which has been extensively used in recent years to simulate the formation and aging of different types of aerosols and investigate their physico–chemical and spectral optical properties (Denjean et al., 2015; Di Biagio et al., 2017, 2019; De Haan et al., 2020; Baldo et al., 2023).
The experiments were performed during three campaigns occurred in May 2021, October 2021 and December 2022 and involved primary combustion BC- and BrC-containing soot aerosols. Full detailed description of the setup and data analysis for those experiments is provided in Heuser et al. (2025). The data set is available through the EUROCHAMP Data Centre (https://data.eurochamp.org/data-access/chamber-experiments/, last access: 16 February 2026).
Soot aerosols with varying BC and BrC content were generated by a computer-controlled miniCAST burner (model 6204C, Jing Ltd., Switzerland). The miniCAST is a co-flow diffusion flame generator. It produces soot aerosols (hereafter identified as cast soot, CS) by burning a mixture of propane (C3H8), N2 and oxidation air. Varying the proportions of these gases allows to vary the size, composition and morphology of the generated CS particles (e.g. Moore et al., 2014; Bescond et al., 2016). In this study five different miniCAST operation points were investigated, corresponding to four fuel-lean burning conditions (CS1–CS4) and one fuel-rich condition (CS5) (Table S1 in the Supplement). The CS aerosol particles were injected in CESAM via a charcoal denuder to remove volatile organic compounds possibly present in the miniCAST exhaust. After injection in the chamber, the CS was left in suspension to age under different controlled conditions. In this work we only consider experiments in which CS is aged under dry conditions for aging times between 2 and 6 h.
Between experiments, the chamber was mechanically evacuated and pumped to 3 × 10⁻⁴ mbar for at least a few hours and usually over a full nighttime period. In addition to overnight evacuation, the chamber was manually cleaned at the beginning of each campaign. Background concentrations of aerosols in the chamber were usually less than 0.05 µg m−3 (that is nearly 104 times less than the injected CS mass concentration in the chamber reaching up to 60 to 95 µg m−3). The different experimental conditions for chamber experiments are summarized in Tables S1 and S2 in the Supplement. For the majority of experiments several repetitions are performed to test the reproducibility of results.
The spectral absorption coefficient was measured in CESAM by means of a dual spot aethalometer AE33, complemented by the extinction-minus-scattering (EMS) approach (Onasch et al., 2015; Modini et al., 2021) as reference absorption technique. The extinction coefficient was measured by means of a CAPS PMex instrument (Aerodyne, Massoli et al., 2010) and the scattering coefficient by an integrating nephelometer (TSI Inc., model 3563, Anderson et al., 1996; Massoli et al., 2009).
2.2 Quantification of C factor for the dual spot aethalometer
The aethalometer measures the attenuation coefficient batn(λ) which is proportional to the light attenuation (ATN) rate of change over time. The multiple scattering correction factor C is defined as:
where batn,LC is the attenuation coefficient measured by the aethalometer and corrected for the loading effect based on the AE33 automatic internal algorithm, described in the next section, and babs,ref is the reference absorption coefficient.
2.2.1 Dual-spot aethalometer loading correction
The model AE33 automatically corrects for the loading effect, through an internal algorithm, by measuring the change in light attenuation in two filter spots, crossed by different air flows, therefore with different aerosol loads. The ATN measurements from the two spots are combined through a set of equations detailed in Drinovec et al. (2015) to provide as output the eBCAE33 based on the following formulation:
where S is the spot surface area (m2), ΔATN1 is the variation of attenuation through the filter spot1 (that is the one with the highest flow rate) in the time interval Δt, F1 is the flow rate through spot1 (m3 min−1), ζ is the flow leakage (taking into account lateral flow in the filter matrix), MACAE33 (λ) is the instrumental mass absorption cross section (18.47, 14.54, 13.14, 11.58, 10.35, 7.77, 7.19 m2 g−1 at 370, 470, 520, 590, 660, 880, 950 nm, respectively), and k(λ) is a corrective parameter derived by the instrument algorithm to automatically account for the loading effect. As indicated in Eq. (2) the algorithm also accounts for an instrumental multi scattering correction Cinstr,AE33 (wavelength-independent) for harmonization among aethalometers using different tape materials (quartz, TFE-coated glass; Drinovec et al., 2015). The Cinstr,AE33 value depends on the filter material and is 1.39 for the for the M8060 filter tape used in this study. Starting from Eq. (2) the spectral loading-corrected attenuation coefficient batn,LC(λ) is derived from eBCAE33 data by multiplying for the default instrumental Cinstr,AE33 and the MACAE33 (λ) as:
As previously noted by Cuesta-Mosquera et al. (2021), the automatic AE33 loading correction method has limitations, particularly around filter changes, potentially introducing biases. These limitations are particularly critical when absorbing aerosol concentration is high, filter changes frequent (tens of minutes-few hours), and experiment durations relatively short. At CMN, where the concentration of absorbing species is typically low (0.2 µg m−3), the filter changes occur after several hours or days. Conversely, for chamber experiments, the higher soot concentration leads to frequent filter changes (tens of minutes-few hours). In the present analysis, both for field measurements and chamber experiments, the internal correction automatically applied by the instrument was utilized. For field measurements, the batn,LC(λ) values obtained at 1 min resolution from the eBC(λ) values provided by the instrument were averaged over one hour. Conversely chamber data, for which experiment duration is limited, were analysed at 1 min resolution.
A detailed discussion on the effect of high soot concentrations on the loading correction for the AE33 batn,LC(λ) calculation and C evaluation for chamber experiments is provided in the Supplement (Sects. S1 and S2).
2.2.2 Reference absorption coefficient at CMN: filter-based MAAP and MWAA
The MAAP and the MWAA are the filter-based reference instruments used at CMN. The MAAP is based on the simultaneous measure of both the reflected and the transmitted light of aerosols embedded in a filter. An algorithm based on the Mie theory and the two stream approximation is then used to convert these signals in values of SSAPF and optical thickness (τPF = ln(TPF)) of the particle-filter (PF) system. These parameters allow to retrieve the aerosol absorption coefficient using the equation:
where S is the spot surface area (m2) of collection and V the sampled volume of air (m3). The basic principle of the MWAA technique is based on the MAAP concept. However, while the MAAP is a field-deployable instrument working at a single wavelength (637 nm), the MWAA is a laboratory-based setup that extends the principle of the MAAP to 5 wavelengths and analyze filter aerosol samples. Because of their different nature, the MAAP is a high resolution instrument (with observations typically every minute) while the MWAA integrates observations across an aerosol sampling period that can be variable depending on the concentrations (minutes to hours).
The MAAP is routinely measuring at the CMN site collecting data of babs,ref at 637 nm at 1 min time resolution. Data measured in the period from July 2020 to November 2022 are considered in this study. The MWAA technique was instead used to measure the babs,ref at 5 different wavelengths on 43 samples collected every 24 h by the MAAP at CMN in the period September–October 2022.
The absorption coefficient measured by the MAAP at 637 nm (babs,ref) was averaged over the same 1 h intervals as the AE33 data and used to derive the C factor at 637 nm according to Eq. (1). For consistency in wavelength, before calculating the C factor, the AE33 attenuation coefficient (batn,LC) measured at 660 nm was interpolated to 637 nm using the Absorption Ångström Exponent (AAE) obtained from the power-law fit of batn,LC(λ) versus wavelength.
The spectral dependence of C was analysed using MWAA measurements. In this case, the reference absorption coefficients babs,ref(λ) were interpolated to the AE33 wavelengths. C values were then calculated at the seven AE33 wavelengths by averaging the AE33 batn,LC(λ) data over the 24 h corresponding to each MWAA filter sample.
2.2.3 Reference absorption coefficient at CESAM: extinction-minus-scattering approach
The EMS approach is considered as reference absorption technique for chamber experiments. This method involves the simultaneous measurements of both the extinction (bext) and scattering coefficient (bsca) and the absorption coefficient is obtained as the difference of the two. When applied in the field to predominantly scattering samples, this technique is affected by high level of uncertainty as discussed in Modini et al. (2021). However, it can be successfully used as a good standard in laboratory experiments with high absorption signals. Validation of the methodology is provided in Heuser et al. (2025). In this study the extinction coefficient at 630 nm was measured by means of a CAPS PMex instrument (Aerodyne, Massoli et al., 2010). Extinction coefficient measured from the CAPS PMex does not require further adjustments. The scattering coefficient at 450, 550, and 700 nm was measured by an integrating nephelometer (TSI Inc., model 3563, Anderson et al., 1996). The nephelometer bsca needs to be corrected for truncation, in order to compensate for the limited field of view of the instrument. The truncation correction was calculated using the Massoli et al. (2009) approach adapted to highly absorbing aerosols as those probed in chamber experiments, as discussed in Heuser et al. (2025). Assumptions on the real refractive index are required in the Massoli et al. (2009) calculation. For the different experiments considered in this study the real index was set at n=1.9, based on the proposed CRI for fresh BC by Bond and Bergstrom (2006). A sensitivity test was performed to investigate the potential error caused by this assumption. Changes in the corrected scattering signal for a range of likely real parts was found to be 4 %.
The truncation-corrected bsca values were interpolated at 630 nm based on the Scattering Ångström Exponent (SAE) calculated as the power-law fit of bsca vs the wavelength (). The babs at 630 nm was calculated at 1 min resolution as the difference of the CAPS-PMex bext and the nephelometer bsca. The C values at 630 nm were derived at 1 min resolution and then averaged over each aethalometer filer spot.
2.3 Ancillary measurements
2.3.1 Single scattering albedo (SSA)
The aerosol SSA was calculated at 637 nm and 1 h resolution at CMN and at 630 nm at 1 min resolution for chamber experiments, as:
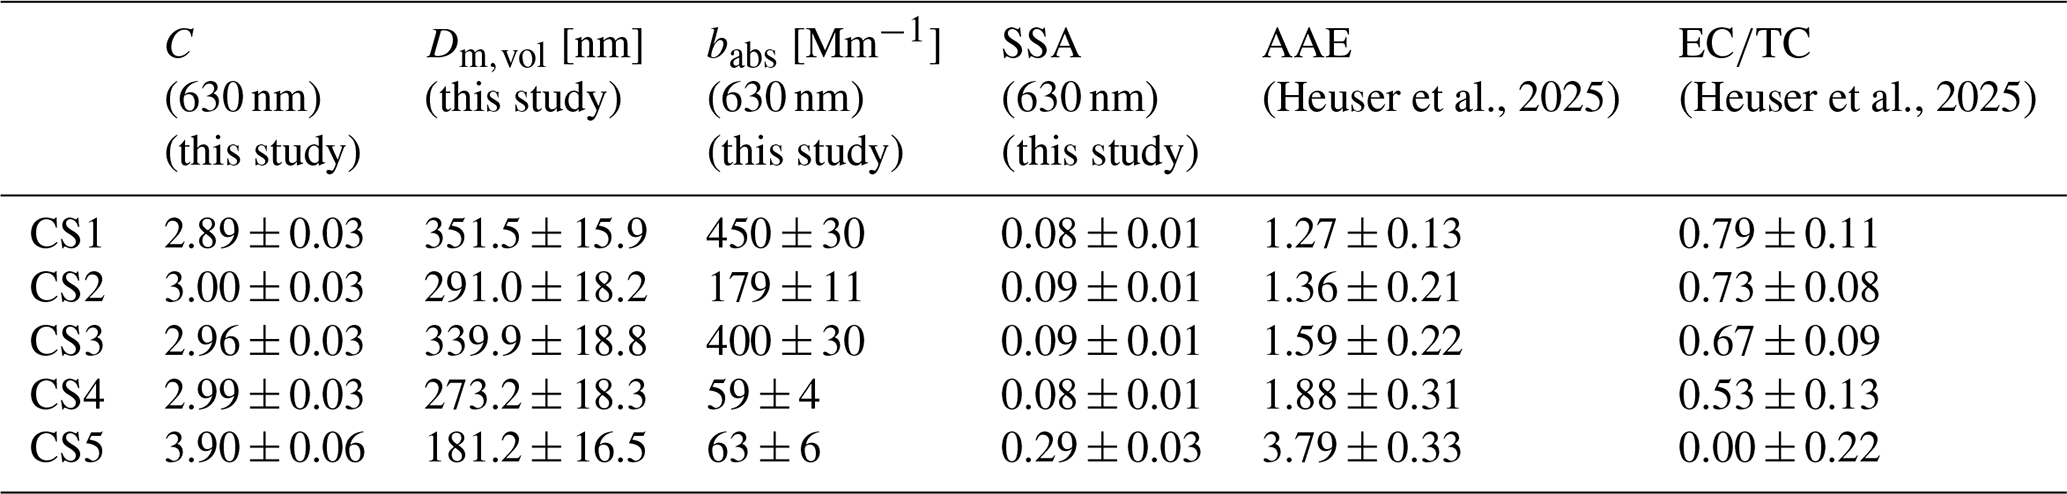
Table 3Average C values for each soot type (CS1–CS5) and associated particles properties. In particular, the average volume mean diameter (Dm,vol), absorption coefficient babs and single scattering albedo (SSA). These values were derived averaging the results obtained for all aethalometer filter spots corresponding to the same CS type. Values obtained in this study are shown together with the ratio between elemental and total carbon mass concentration () and the Absorption Ångstrom Exponent (AAE) derived in Heuser et al. (2025).
The bsca was measured at 450, 550, and 700 nm by the TSI nephelometer both in field and in the chamber. At CMN the nephelometer data were corrected for truncation effects following the method of Anderson and Ogren (1998) and extrapolated at 637 nm as (). Only measurements taken at relative humidity levels below 40 % were considered. The bext in Eq. (5) was calculated as () at CMN, while retrieved from CAPS PMex data in the chamber.
2.3.2 Particle size distribution
The particle number size distribution (; Dm, mobility diameter), in the range of diameters from 10 to 800 nm, was measured at CMN by using a scanning particle mobility sizer (SMPS-TROPOS), operating at 5 min resolution and at 5/1 L min−1 sheath/aerosol flow rates. In chamber experiments the particle number size distribution, was instead measured in the range of diameters from 19.5 to 881.7 nm, by using a scanning particle mobility sizer (TSI SMPS) consisting in an 85Kr neutralizer, a Differential Mobility Analyzer (DMA, model 3080, TSI Inc.), and a Condensation Particle Counter (CPC, model 3772, TSI Inc.), operated at 2.0/0.2 L min−1 sheath/aerosol flow rates, and at a time resolution of 3 min. Measurements were corrected for diffusion losses and multiple charge effects with the instrument software.
The size distribution measured by the SMPS was used to derive the volume mean mobility diameter (Dm,vol). This parameter was derived from hourly averaged size distributions at CMN and to both 3 min size distributions and size distribution averaged on each filter spot of the aethalometer in chamber experiments.
To notice that in the field the size distribution is multi-modal and include both absorbing and non-absorbing particles, in chamber experiments they were mono-modal and including only absorbing aerosols.
3.1 Investigating C dependence on particle properties with chamber experiments
The experiments in the CESAM simulation chamber, presented in this study, were designed to investigate the specific dependence of the C-factor on the chemical and physical properties of highly absorbing BC-containing soot particles. The five different cast soot (CS) studied in the present work correspond to four fuel-lean burning conditions (CS1–CS4) and one fuel-rich condition (CS5) leading to particles with a decreasing ratio (0.79 ± 0.11 for CS1 to 0.00 ± 0.22 for CS5) and decreasing number median diameter (from an average of 145 ± 12 nm for CS1 to 79 ± 2 nm for CS5, expressed as mobility diameter; Heuser et al., 2025).
3.1.1 Average chamber C value and the role of loading correction
The average values of C and their corresponding uncertainties for each experimental condition in the chamber are summarized in Table 3. These values range from 2.89 ± 0.03 to 3.9 ± 0.06, with the highest values corresponding to CS5, which is characterized by a higher organic content and smaller particle sizes. The lowest values correspond to CS1, which has a higher content of elemental carbon and larger particle sizes. The C values obtained for soot in the chamber experiments are similar, considering the uncertainties, to the values reported in other studies from the urban site of Milan (Bernardoni et al., 2021; Ferrero et al., 2021) and laboratory experiments using soot generated with a miniCAST burner (Kalbermatter et al., 2022).
Due to the high concentration of absorbing soot, the possible dependence of the retrieved C on the loading correction scheme was also evaluated. Indeed, in case of high absorbing aerosols concentration and frequent filter changes, the internal AE33 correction can provide uncertain results. The time variability of the batn,LC may in some cases not to follow the same decreasing trend over time as the reference measurement. However, it showed a steeper decline before and after the filter change, with a more rapid decrease in these points, making the trend appear more abrupt and also discontinuous around the filter transition. In these cases, the AE33 data can be re-corrected for loading effect. With this aim, the AE33 can be treated like a single-spot aethalometer and the loading correction schemes from W2003 and C2010, or the Dual Spot aethalometer method itself with a constant compensation parameter, be applied. In the present analysis we tested the impact of different loading correction schemes on C retrieval and found that the method applied to correct loading can introduce differences of maximum 30 % in the average values. Despite not impacting the conclusion of the present study, the role of loading effect and correction scheme on retrieved C and babs should be taken into consideration. A detailed discussion of this specific analysis is provided in the Supplement.
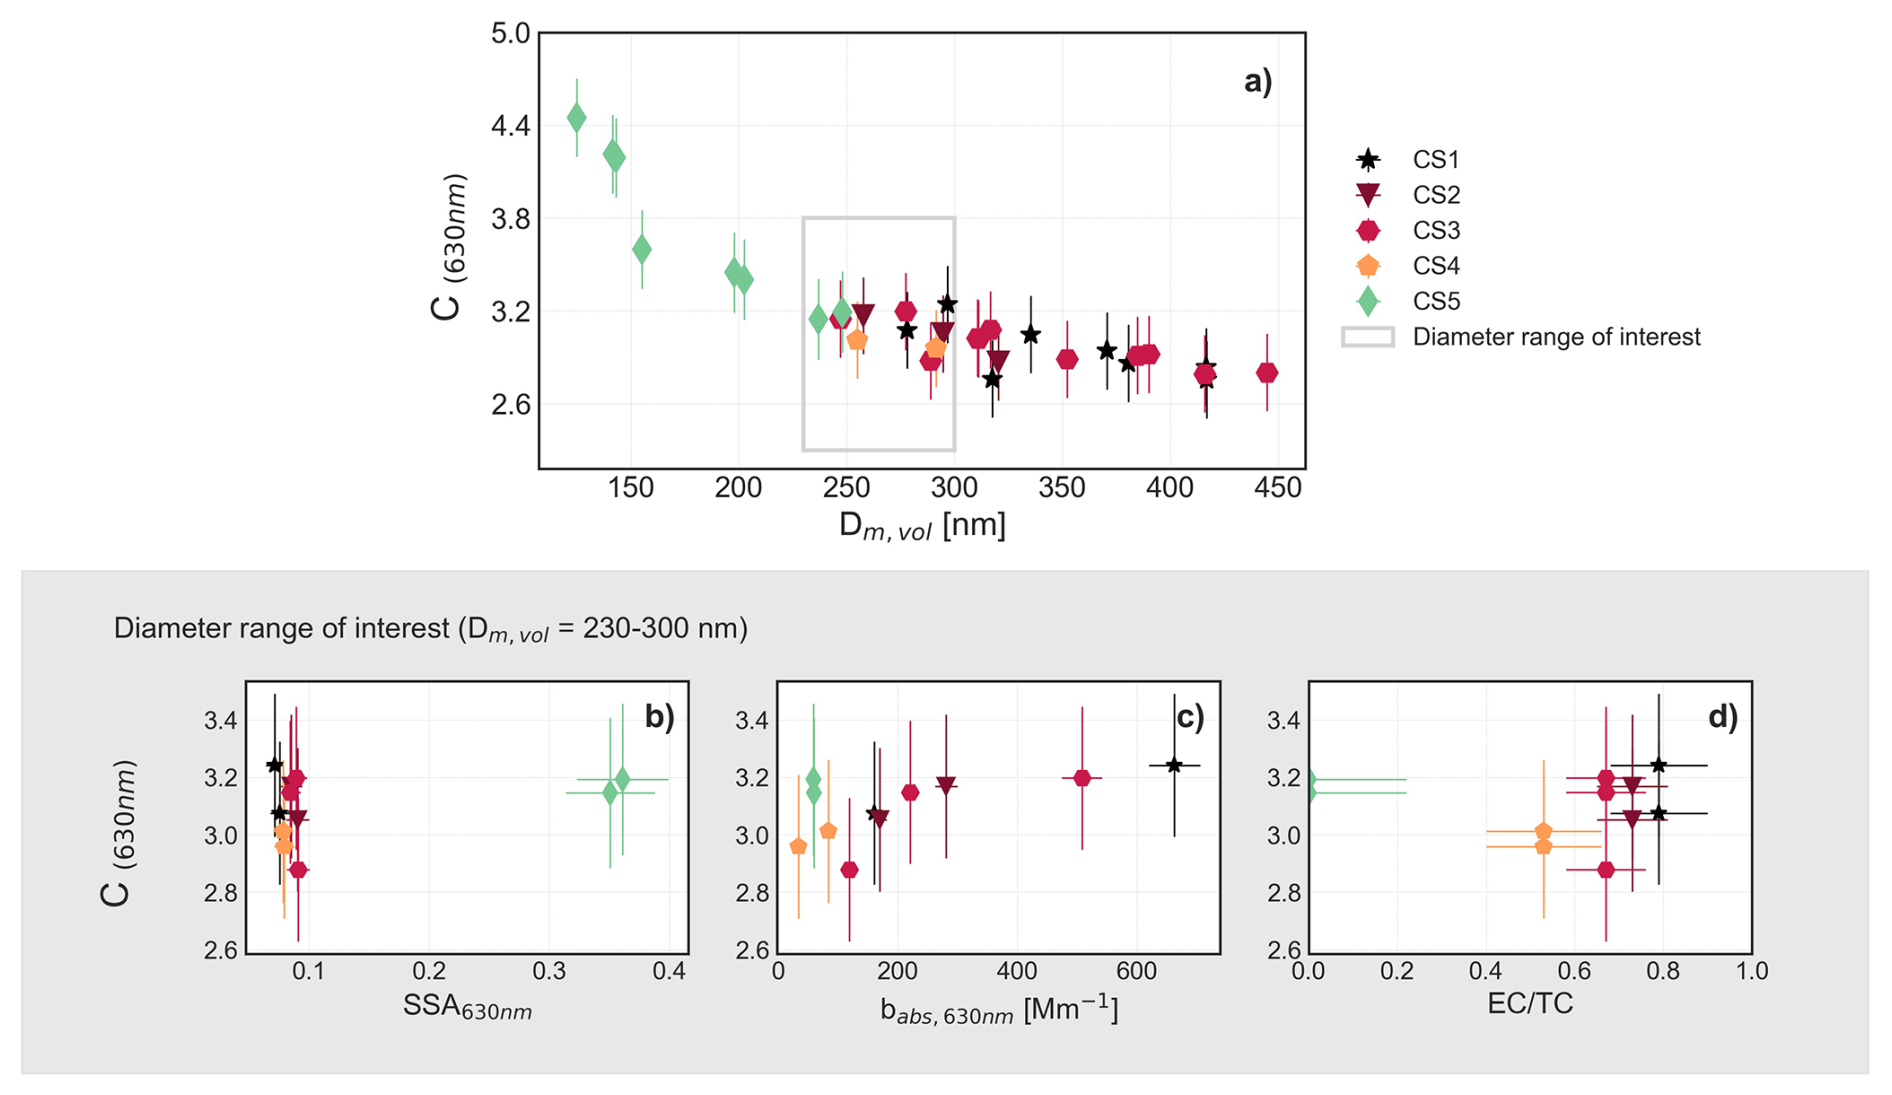
Figure 1C dependence on particle size in laboratory studies measuring the properties of different freshly emitted particles (CS1–CS5). The top panel shows the C dependence on the size (Dm,vol). The bottom panels show the dependence of C values with the SSA, babs (measured by the EMS technique) and the ratio, in experiments where the diameter was in the range 230–300 nm (grey rectangle in the top panel).
3.1.2 C dependence on soot microphysical properties: the dominating role of size
The C values at 630 nm averaged over each aethalometer filter spot interval were analyzed to identify the dependence on average properties of the particles collected on the filter. These properties include particle size, absorption coefficient, SSA, and chemical composition (measured as the ratio). The results are summarized in Fig. 1. The analysis shows that the C factor increases from 2.75 to 4.45 as the volume mean particle diameter of BC generated particles decreases from 444.8 to 124.9 nm. This is particularly evident for particles smaller than 200 nm, while at larger sizes the trend is not significant when considering the associated uncertainties. The points with the highest C values and smallest sizes correspond to experiments involving CS5 particles. These particles are not only smaller but also differ in composition, with a negligible fraction of EC in spite of dominating OC composition. This compositional difference significantly affects the optical properties, increasing the SSA from 0.05–0.09 for C1–CS4 to 0.27 for CS5 at 630 nm and the AAE from around 1.27–1.88 to 3.79 (Heuser et al., 2025). However, focusing on a subset of points with limited size variability (230–300 nm, highlighted in the grey box), it becomes evident that at similar diameters, C values are comparable for CS5 particles and CS1–CS4 particles. Moreover, for CS5 particles, C increases significantly from 3.15 to 4.45 as the volume mean diameter decreases from 247.9 to 124.9 nm. This suggest that the size is the dominant factor impacting the C variability in these experiments. This result is likely attributable to the greater penetration of smaller particles into the filter matrix (Huang et al., 2013; Hinds and Zhu, 2022), that affect the multiple scattering effects between particles and filter, leading to a larger overestimation of true absorption by the aethalometer. This interpretation agrees with modelling results indicating that particle stratification increases the ratio of filter-based and real absorption as particle size decreases (Moteki et al., 2010). Our results are consistent with previous laboratory studies on other filter-based instruments such as COSMOS and PSAP (Lack et al., 2009; Nakayama et al., 2010), and previous studies on the aethalometer (Romshoo et al., 2022; Drinovec et al., 2022; Yus-Díez et al., 2025). Romshoo et al. (2022), using the same reference technique as in this study (EMS), reported C factors decreasing from 2.1 to 0.9, with increasing volume-equivalent diameters from approximately 70 to 530 nm. Drinovec et al. (2022) observed that C is larger for soot particles below ∼ 250 nm than for particles above ∼ 400 nm. Yus-Díez et al. (2025) further reported that fresh soot particles (diameter < 40 nm) exhibit higher C values, whereas dust samples (diameter > 2 µm) generally show lower C values, in line with reduced artefact for larger particles. In these latter two studies, the reference technique used was the PTAAM-2λ.
The variability in SSA, which was observed to influence the C factor at high values in previous works (Yus-Díez et al., 2021), appears to have a limited impact in this low-SSA regime. The C-size dependence was observed for any loading correction scheme applied as shown in the Supplement.
3.2 Ambient variability of the C factor
In this section, the results obtained from field measurements on the environmental variability of the correction factor C are presented. These results provide insights into how C values fluctuate across different seasons and aerosol properties.
3.2.1 Average ambient C value and seasonal variability
The variability of the C factor at a wavelength of 637 nm was analysed on hourly base at the CMN site. The average C value over the period July 2020–November 2022 is 2.35 with a standard deviation of 0.58. This value is comparable, within the combined uncertainties of MAAP and AE33 (27 %), with the 2.45 value suggested by the ACTRIS guidelines for M8060 filter tape (obtained as the product of a Cinstr factor (1.39) and the harmonization factor H∗ (1.76); https://www.actris-ecac.eu/particle-light-absorption.html, last access: 16 February 2026). This value is also in line, even if slightly lower, to mean values reported in other studies conducted at various sites (urban, background and mountain sites) using the same reference techniques (MAAP, MWAA) and filter tape, which range between 2.44 and 2.66 (Moschos et al., 2021; Valentini et al., 2020; Yus-Díez et al., 2021). However, when considering the range of values reported in the literature, which consider different reference techniques for measuring absorption (e.g., two-wavelength Photothermal Aerosol Absorption Monitor PTAAM-2λ, and the Cavity Attenuated Phase Shift CAPS SSA), various AE33 filter types, different wavelengths, and diverse environmental or experimental conditions (such as chamber studies with artificially generated soot or emissions from heavy fuel oil), the reported values can vary significantly from 2.26 to 8.26 (Corbin et al., 2018; Laing et al., 2020; Ferrero et al., 2021; Bernardoni et al., 2021; Kalbermatter et al., 2022). The averaged ambient value was also 23 %–66 % lower compared to the average values obtained for freshly emitted soot in the chamber experiments. The lower ambient values may be partly due to the different reference techniques used. The MAAP can exhibit a positive bias in absorption when compared with non-filter-based reference techniques as the EMS, particularly at relatively high SSA (> 0.9), small particles (diameter < 200 nm) and for aged aerosol (Yus-Díez et al., 2025; Kalbermatter et al., 2022; Romshoo et al., 2022). Such bias would lead to higher MAAP absorption values and, consequently, to lower C values in ambient measurements at CMN compared to those obtained in CESAM. In addition, the aethalometers operated at different flow rates in the ambient and chamber setups (5 and 2 L min−1, respectively). As shown by Moteki et al. (2010) and Huang et al. (2013), variations in flow rate and face velocity can affect particle penetration and stratification by size within the filter. These effects may modify both the absolute value of C (which is expected to decrease with increasing flow rate) and its dependence on particle size. A detailed quantification of this effect is beyond the scope of the present study, but it may represent one of the factors contributing to the lower absolute C values observed in ambient measurements.
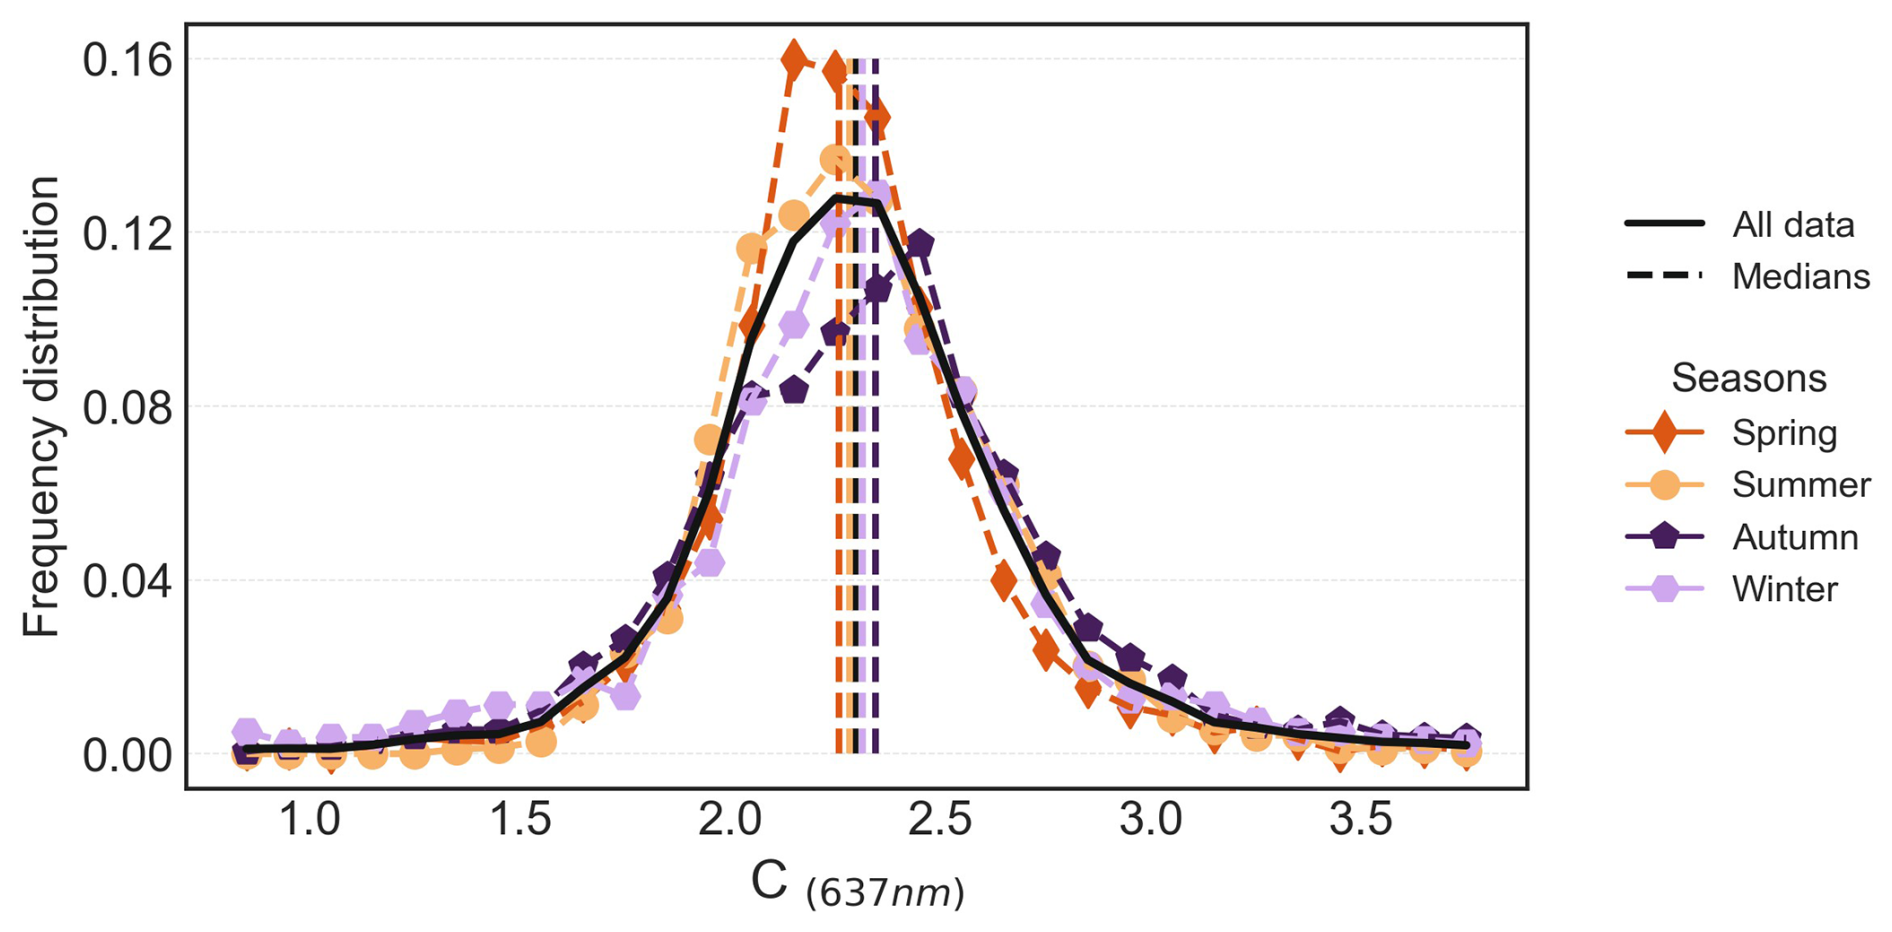
Figure 2Histograms representing hourly averaged C values frequency distribution at 637 nm for the period July 2020–November 2022 at CMN. The black line represents the entire period, the coloured histograms correspond to each season in the analysed period. The median values corresponding to each season are also represented as dashed vertical lines. The MAAP was used as reference technique for measuring the absorption coefficient.
Table 4The mean and standard deviation of C and babs for each season.
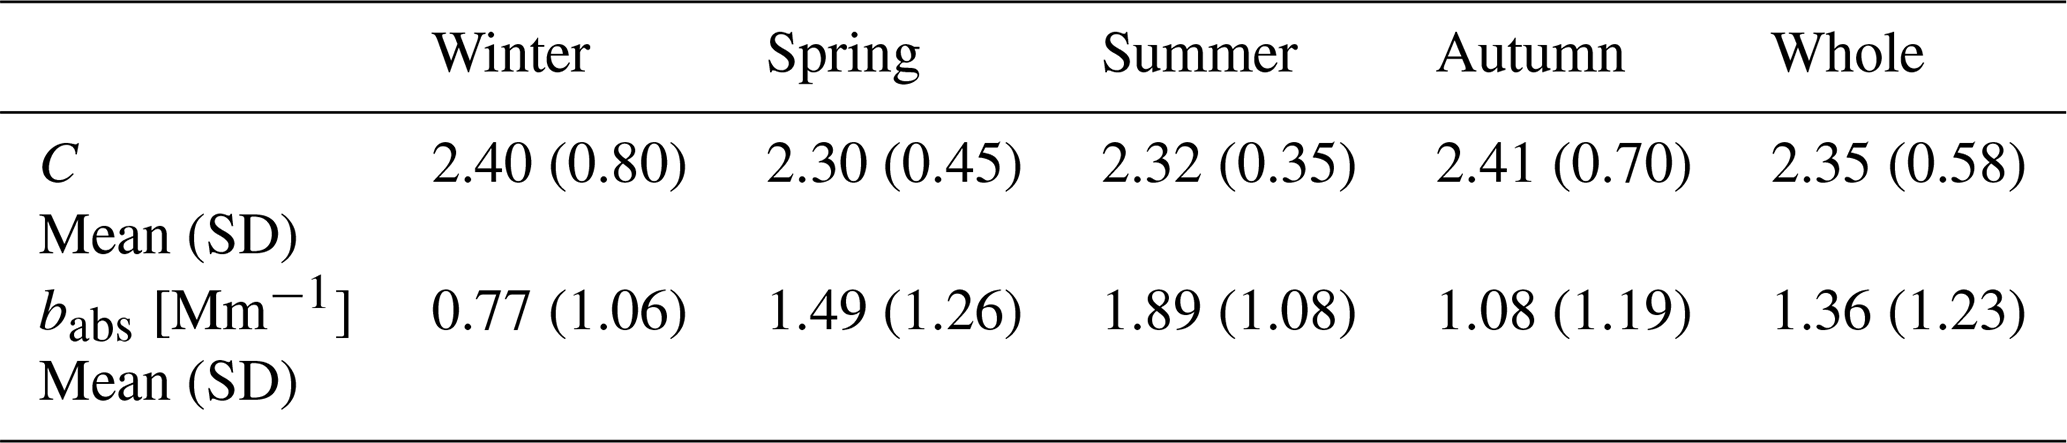
Figure 2 and Table 4 summarize the seasonal variability of C values at the CMN site. Throughout the year, C mean ranged from a minimum of 2.30 in spring to a maximum of 2.41 in winter, indicating a slight increase in the colder months. At the same time, the coldest seasons (winter and autumn), also showed the greatest variability, resulting in the highest standard deviations (0.7–0.8). The difference between the seasons, although significant based on the Kolmogorov–Smirnov test, was small compared to the combined instrumental uncertainty of the MAAP and the AE33. Nonetheless, the seasonal variability observed at CMN was smaller in magnitude and opposite in trend compared to the biogenic-dominated site in the Finnish boreal forest (Luoma et al., 2021) and to the mountain site of Montsec d'Ares (Spain, 1570 ; Yus-Díez et al., 2021). In these previous studies, seasonal variability was explained as a result of dependence on optical (SSA; Yus-Díez et al., 2021) and microphysical (diameter; Luoma et al., 2021) properties, as well as aerosol composition (presence of dust; Yus-Díez et al., 2021). Hence, we addressed the dependency of C at CMN on particles properties, concentration and wavelength.
3.2.2 Lower limit of babs for C determination
One of the most critical challenges in determining C at a remote site like CMN, where aerosol concentrations are low, is that the absorption coefficient (babs) often approaches the detection limits of the instruments used. At very low concentrations, measurements are increasingly affected by instrumental noise, compromising the reliability of the resulting C values. To set a reasonable threshold for investigating the dependence of C on particle properties – while avoiding the exclusion of a substantial portion of the dataset – we first examined how C varies with the absorption coefficient (babs) measured with the MAAP, and assessed the influence of low babs values on the C estimates.
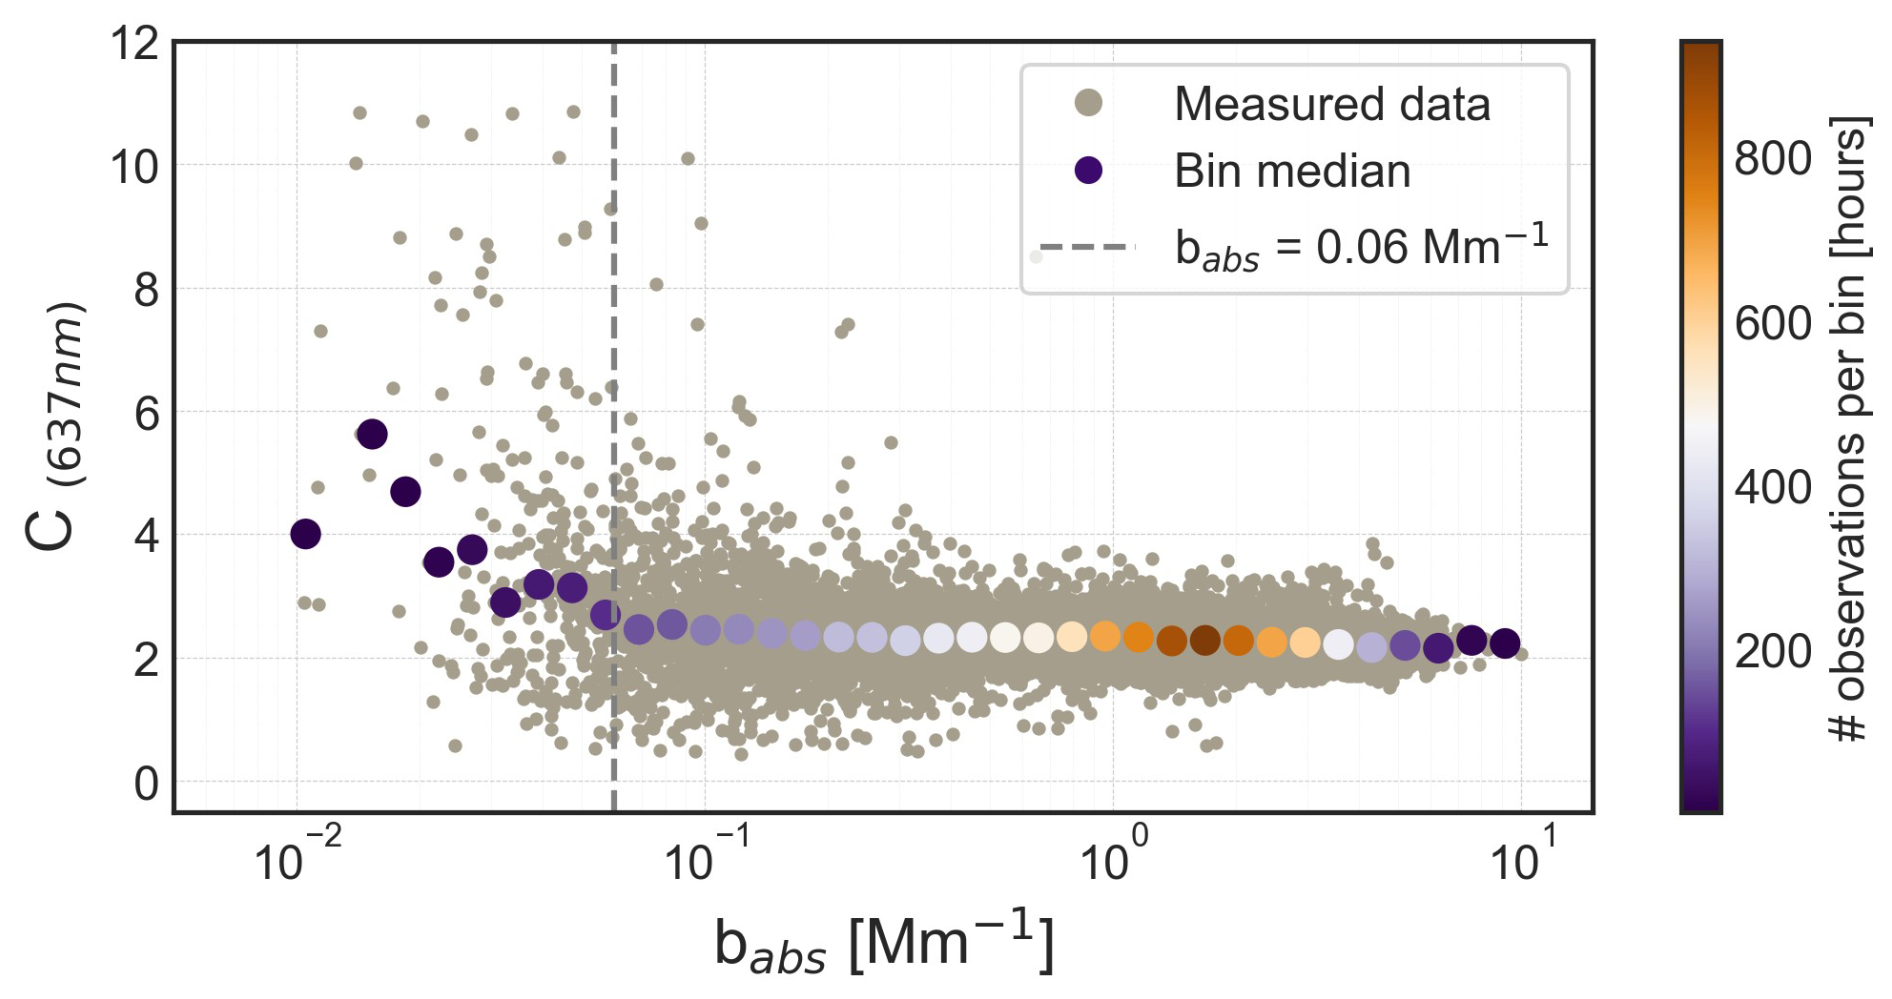
Figure 3Scatterplot of hourly averaged C values at 637 nm as a function of the corresponding babs values measured by the MAAP at CMN. The reference technique used to measure the absorption coefficient is the MAAP. Bigger dots are used to represent the median C values in bins of babs.
Figure 3 shows the dependence of C on babs, with higher C values observed at decreasing babs. In particular, C more frequently reaches values of 10 or higher when babs falls below 0.06 Mm−1, although this condition accounts for less than 3 % of the dataset. These extreme values can significantly affect the median C (Fig. 3), and are more commonly observed during winter and autumn (Table 4) seasons less influenced by anthropogenic emissions from the Po Valley (Marinoni et al., 2008). At such low babs levels – close to or below the detection limits of both the MAAP and AE33 – the signal becomes increasingly dominated by instrumental noise, undermining the reliability of the computed C values (Cuesta-Mosquera et al., 2021). This likely explains both the higher standard deviation observed in winter and the unusually high C values recorded during that season. For this reason, data points where babs is below 0.06 Mm−1 were excluded from subsequent analyses.
3.2.3 C factor increase at high SSA
Previous studies have demonstrated that the optical properties of sampled particles can directly influence aethalometer measurements by altering the amount of scattered light, which the instrument may incorrectly interpret as absorption. An increase in the SSA has been linked in these studies to a corresponding rise in the C values (Schmid et al., 2006; Backman et al., 2017; Yus-Díez et al., 2021).
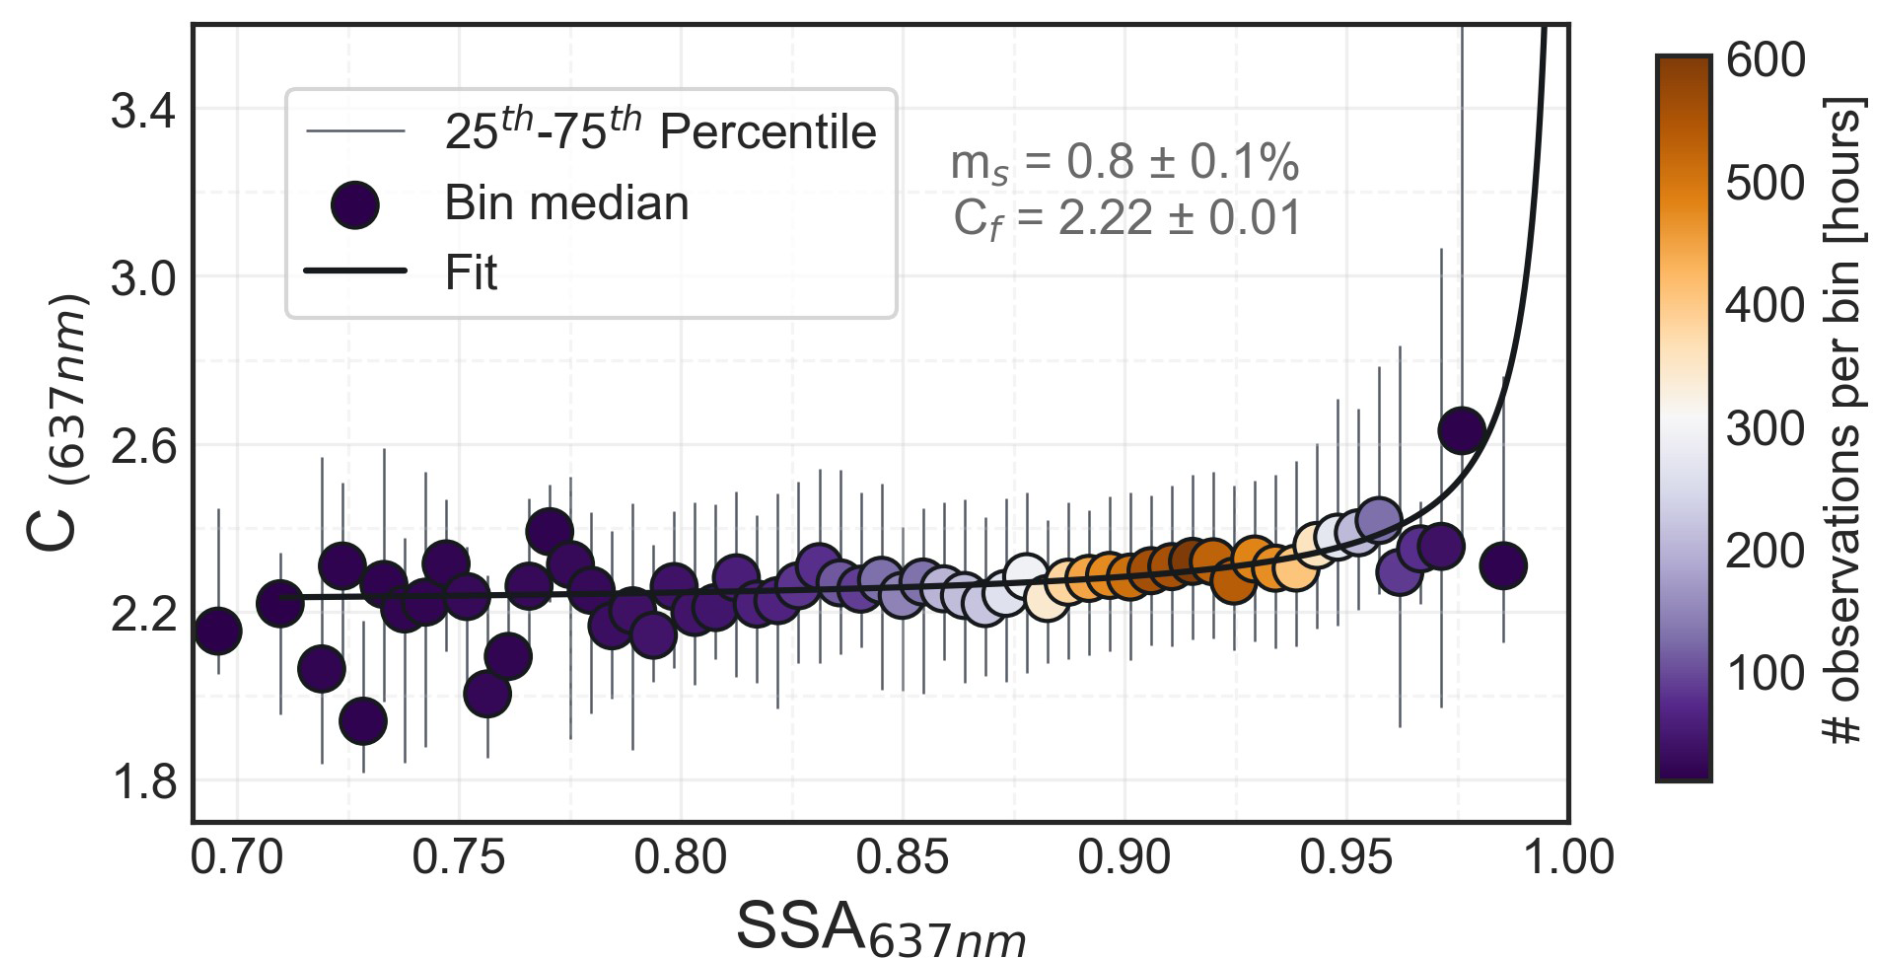
Figure 4C (637 nm) dependence on the SSA (derived at 637 nm combining MAAP and nephelometer). Reference absorption instrument: MAAP. Dots represent the mean values in each SSA bin, the grey lines the 25th and 75th percentile. The dots colours represent the number of observations used in each bin for calculating the mean and the curve obtained using Yus-Díez et al. (2021) relation.
The C values measured during the period considered in this study, are binned to the SSA values (Fig. 4). The number of bins was chosen using the `auto' mode of the numpy histogram_bin_edge function (python). This function selects as best number of bins, the highest value between those obtained with the Freedman and Diaconis, (1981) or the Sturges, (1926) criteria. For each bin, the median C and the corresponding 25th and 75th percentiles were derived.
At CMN, C remained relatively constant for SSA values below 0.90. It increased slowly for values between 0.90 and 0.94, while a more significant variability was observed for SSA higher than 0.94 (Fig. 4). This trend aligns with observations in other studies, where C becomes higher at higher SSA values due to an increase in the multiple scattering between particles and filter fibers and a reduced signal-to-noise ratio in low-absorption regimes (Schmid et al., 2006; Yus-Díez et al., 2021). The SSA–C relationship was fitted using the cross-sensitivity to scattering law proposed by Schmid et al. (2006) and applied in Yus-Díez et al. (2021) as:
Compared to the results presented in Yus-Díez et al. (2021) for another mountaintop site, this curve shows a pronounced increase only at higher SSA values. The fitted curve closely matches the data up to a SSA of 0.97, becoming less representative at higher SSA. The deviation from the expected curve appears to be linked to the occurrence of strong dust events during the 2 year period. In fact, over 80 % of the hours with SSA values above 0.97 and C values below the mean of 2.3 correspond to days identified as dust-affected, characterized by coarse PM mass concentrations exceeding 37 µg m−3 , according to Vogel et al. (2025b). The median C during these days is 2.0, suggesting a decrease in C during dust events, likely related to the increased presence of coarse particles collected on the filter, even at high SSA values. This decrease is consistent with the findings of Di Biagio et al. (2017), who reported lower C values for the AE31 when comparing measurements of ambient air and mineral dust particles.
These results highlight the importance of carefully selecting appropriate correction factors. Under conditions of high SSA, absorption is typically minimal and may approach the detection limits of the instruments, increasing uncertainty in C estimation. Moreover, we should consider that this dependence, estimated using the MAAP as a reference, may have been underestimated. As shown by Yus-Díez et al. (2025), this instrument is also affected by cross-sensitivity to scattering when compared with a non-filter-based technique.
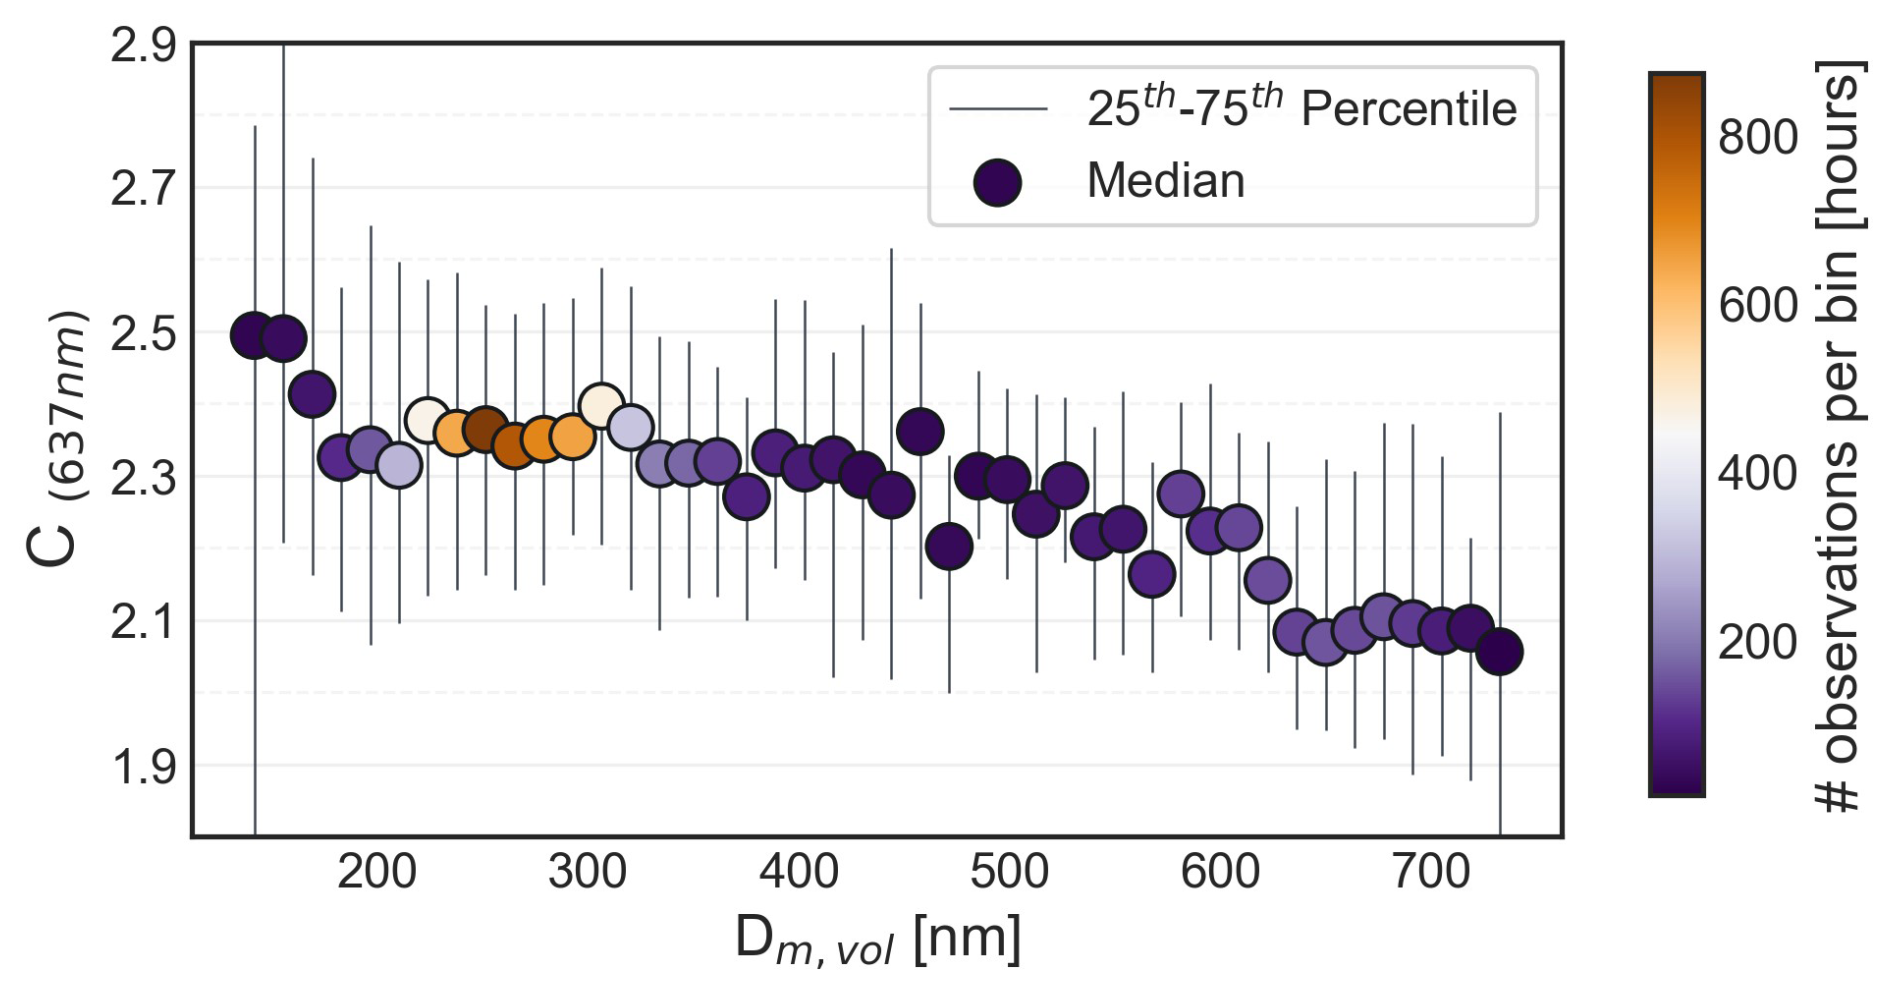
Figure 5C (637 nm) dependence on the geometric mean diameter Dm,vol. Reference absorption instrument: MAAP. Dots represent the mean values in each Dm,vol bin, the grey lines the 25th and 75th percentile. The dots colours represent the number of observations used in each bin for calculating the median.
3.2.4 C factor increase with decreasing particles size
In this section, we examine the dependence of the C factor on particle size under ambient atmospheric conditions, where isolating the influence of individual aerosol properties is not straightforward. The objective is to evaluate whether particle size remains a significant driver of C variability. The analysis was performed by binning C values according to the aerosol volume mean diameter and computing the median together with the 25th and 75th percentiles within each bin, following the same procedure adopted for SSA.
During the observation period at CMN, the hourly Dm,vol of total aerosol particles ranged from 134.5 to 738.9 nm. The resulting C-size relationship shows an increase of approximately 25 % in C as Dm,vol decreases from 732.1 to 141.4 nm (Fig. 5). This trend is consistently observed across the median as well as the interquartile range, indicating a clear dependence of C on particle size. To ensure that the observed variability in C was not primarily driven by other parameters – such as the SSA or exceptionally low absorption values – rather than by particle size itself, we examined the mean SSA and absorption coefficient within each size bin. The results show that neither of these parameters alone can account for the whole observed variability in C with size in Fig. 5 (see Supplement, Figs. S3 and S4).
Although its influence is moderate compared to the instrumental uncertainty, particle size appears to affect C even under ambient atmospheric conditions. This suggests that variations in particle size could contribute to the differences in C observed across sites and seasons, as proposed in previous studies (Bernardoni et al., 2021; Luoma et al., 2021), particularly when there are significant changes in the mean volume size distribution or during specific events. At CMN, this effect can be especially significant during dust transport events, which occur on about 20 % of days throughout the year (Vogel et al., 2025a, b). As shown in the Supplement (Fig. S7 in the Supplement), C at 637 nm decreases with increasing dust event intensity, consistently with the findings of Yus-Díez et al., (2025).
When comparing the size dependence of C with that observed in the chamber experiments and in other laboratory studies on soot (Drinovec et al., 2022; Yus-Díez et al., 2025), the ambient relationship appears more linear and overall weaker. This attenuation may be partly related to the use of the MAAP. Its positive bias compared to non filter-based techniques could be more relevant for smaller particles (Moteki et al., 2010; Romshoo et al., 2022). As a result, the influence of particle size on C under ambient conditions could be partially masked by the measurement bias inherent to the reference technique used. Differences in sampling flow of the aethalometer between the ambient and chamber measurements may also have contributed to this weaker dependence, since different flow rates are expected to affect the penetration of the particles as well as the resulting C dependence on size (Moteki et al., 2010; Huang et al., 2013).

Figure 6Boxplots describing the statistics of C values derived at each aethalometer wavelength, the 25th–75th percentile range, the mean and median are reported. The MWAA was used as the reference technique for measuring the absorption coefficient.
Table 5Mean and standard deviation (SD) of C values for each aethalometer wavelength at CMN. The MWAA was used as reference instrument for the absorption coefficient.
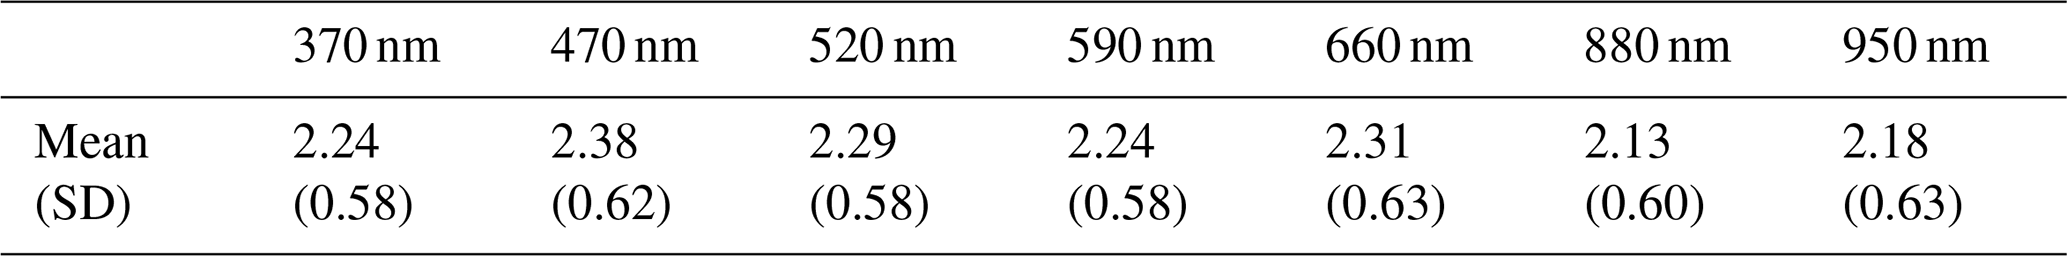
3.2.5 Absence of spectral dependence
Figure 6 shows the spectral dependence of C at CMN for observations between September and October 2022, with 43 filters collected. The mean C values range from 2.38 ± 0.62 at 470 nm to 2.13 ± 0.60 at 880 nm (Table 5). A statistical Kolmogorov–Smirnov test was applied to quantify the significance of the spectral dependence, and a potentially significant distinction was observed between the 470 and 880 nm mean C values (p-value = 0.042). However, for all other wavelength pairs, the test yielded p > 0.05, indicating no statistically significant differences, and that despite the high variability in the data, with standard deviations reaching 0.63. Since the overall precision of the AE33 is not wavelength-dependent (Cuesta-Mosquera et al., 2021), all wavelength-dependent C values reported in this study fall within the relative error of ± 31 %, obtained combining the AE33 and MWAA uncertainties.
Limited studies have investigated the multi-wavelength absorption reference methods for both models of the aethalometer. For the AE31 model, Bernardoni et al. (2021) and Ferrero et al. (2021) did not observe a notable wavelength dependence of the C factor, although they found that applying a wavelength-dependent C correction improved the agreement in the measured absorption coefficient for both AE31 and AE33. In contrast, for the AE33 model, neither Bernardoni et al. (2021) nor Ferrero et al. (2021) detected significant wavelength dependence after accounting for uncertainties. However, Moschos et al. (2021) reported a decreasing trend in the C factor from 2.5 at 370 nm to 2.3 at 880 nm in Swiss background conditions. Moreover, Yus-Díez et al. (2021) found no significant wavelength dependence, except for aged aerosols, where they observed an increasing C value with wavelength, ranging from 3.47 to 4.03.
In this work we studied the role of aerosol properties on the variability of the multiple scattering correction factor C for the dual-spot aethalometer AE33. For this, we combined data from a long term series in a mountaintop station in northern Italy at Monte Cimone, CMN, and from multiple experiments on laboratory-generated soot at the CESAM simulation chamber. We calculated the C factor comparing the attenuation coefficient measured by the AE33 with the absorption coefficient measured with independent techniques: the MAAP and MWAA at CMN, and the extinction-minus-scattering in chamber experiments.
The C factor obtained by chamber experiments ranged from 2.89 to 3.9 at 630 nm, the highest values corresponding to higher organic content and smaller particle sizes, while the lowest values corresponding to a higher content of elemental carbon and larger particle sizes. The possible dependence of the retrieved C on the loading correction scheme applied was also evaluated and quantified in max 30 % of difference in the averaged values.
We found an averaged C factor at 637 nm of 2.35 ± 0.58 at CMN. This value shows a slight seasonal variability with higher values in winter than in summer, difficult to associate to specific particle properties and mainly driven by the impact on C of the very low signal-to-noise ratio of the absorption coefficient, causing very high C values at low babs (< 0.06 Mm−1). This was significant particularly at very high SSA values (> 0.94), where an impact of the low signal-to-noise ratio of the absorption coefficient cannot be excluded. Moreover, part of the variability at high SSA values was influenced by changes in aerosol properties, such as the increased presence of coarse particles during dust events. We studied also the C spectral dependence finding no evidence of a variability of C within the 370–950 nm spectral range.
The present analysis evidences a dependence of C on particle size. This dependence was moderate (within 25 %) under ambient conditions dominated by mostly scattering aerosols, while it became much more pronounced (> 60 %) in chamber experiments using soot-only particles and a non-filter-based absorption reference. This behaviour likely contributes to the variability of C values reported in the literature and highlights the need for further investigation to improve the accuracy of absorption coefficient measurements within international research infrastructures.
The consistency between chamber and ambient results indicates that, although the chamber setup better isolates the size dependence, this effect is also detectable under complex real-world aerosol conditions. These findings suggest that C may vary systematically across monitoring sites depending on the dominant particle size modes – for example, smaller C values at sites dominated by larger, aged particles, and higher C values at locations influenced by fresh combustion or nucleation events. Further studies, combining targeted chamber experiments and modelling under a wider range of conditions, are needed to better quantify these dependencies and support the development of more generalizable parameterizations for harmonized absorption measurements and improved data quality in monitoring networks.
Table A1List of digital object identifier (DOI) for the CESAM chamber experimental data supporting the findings of this study. Those data are available through the Database of Atmospheric Simulation Chamber Studies (DASCS) of the EUROCHAMP Data Centre (https://data.eurochamp.org/data-access/chamber-experiments/, last access: 16 February 2026).
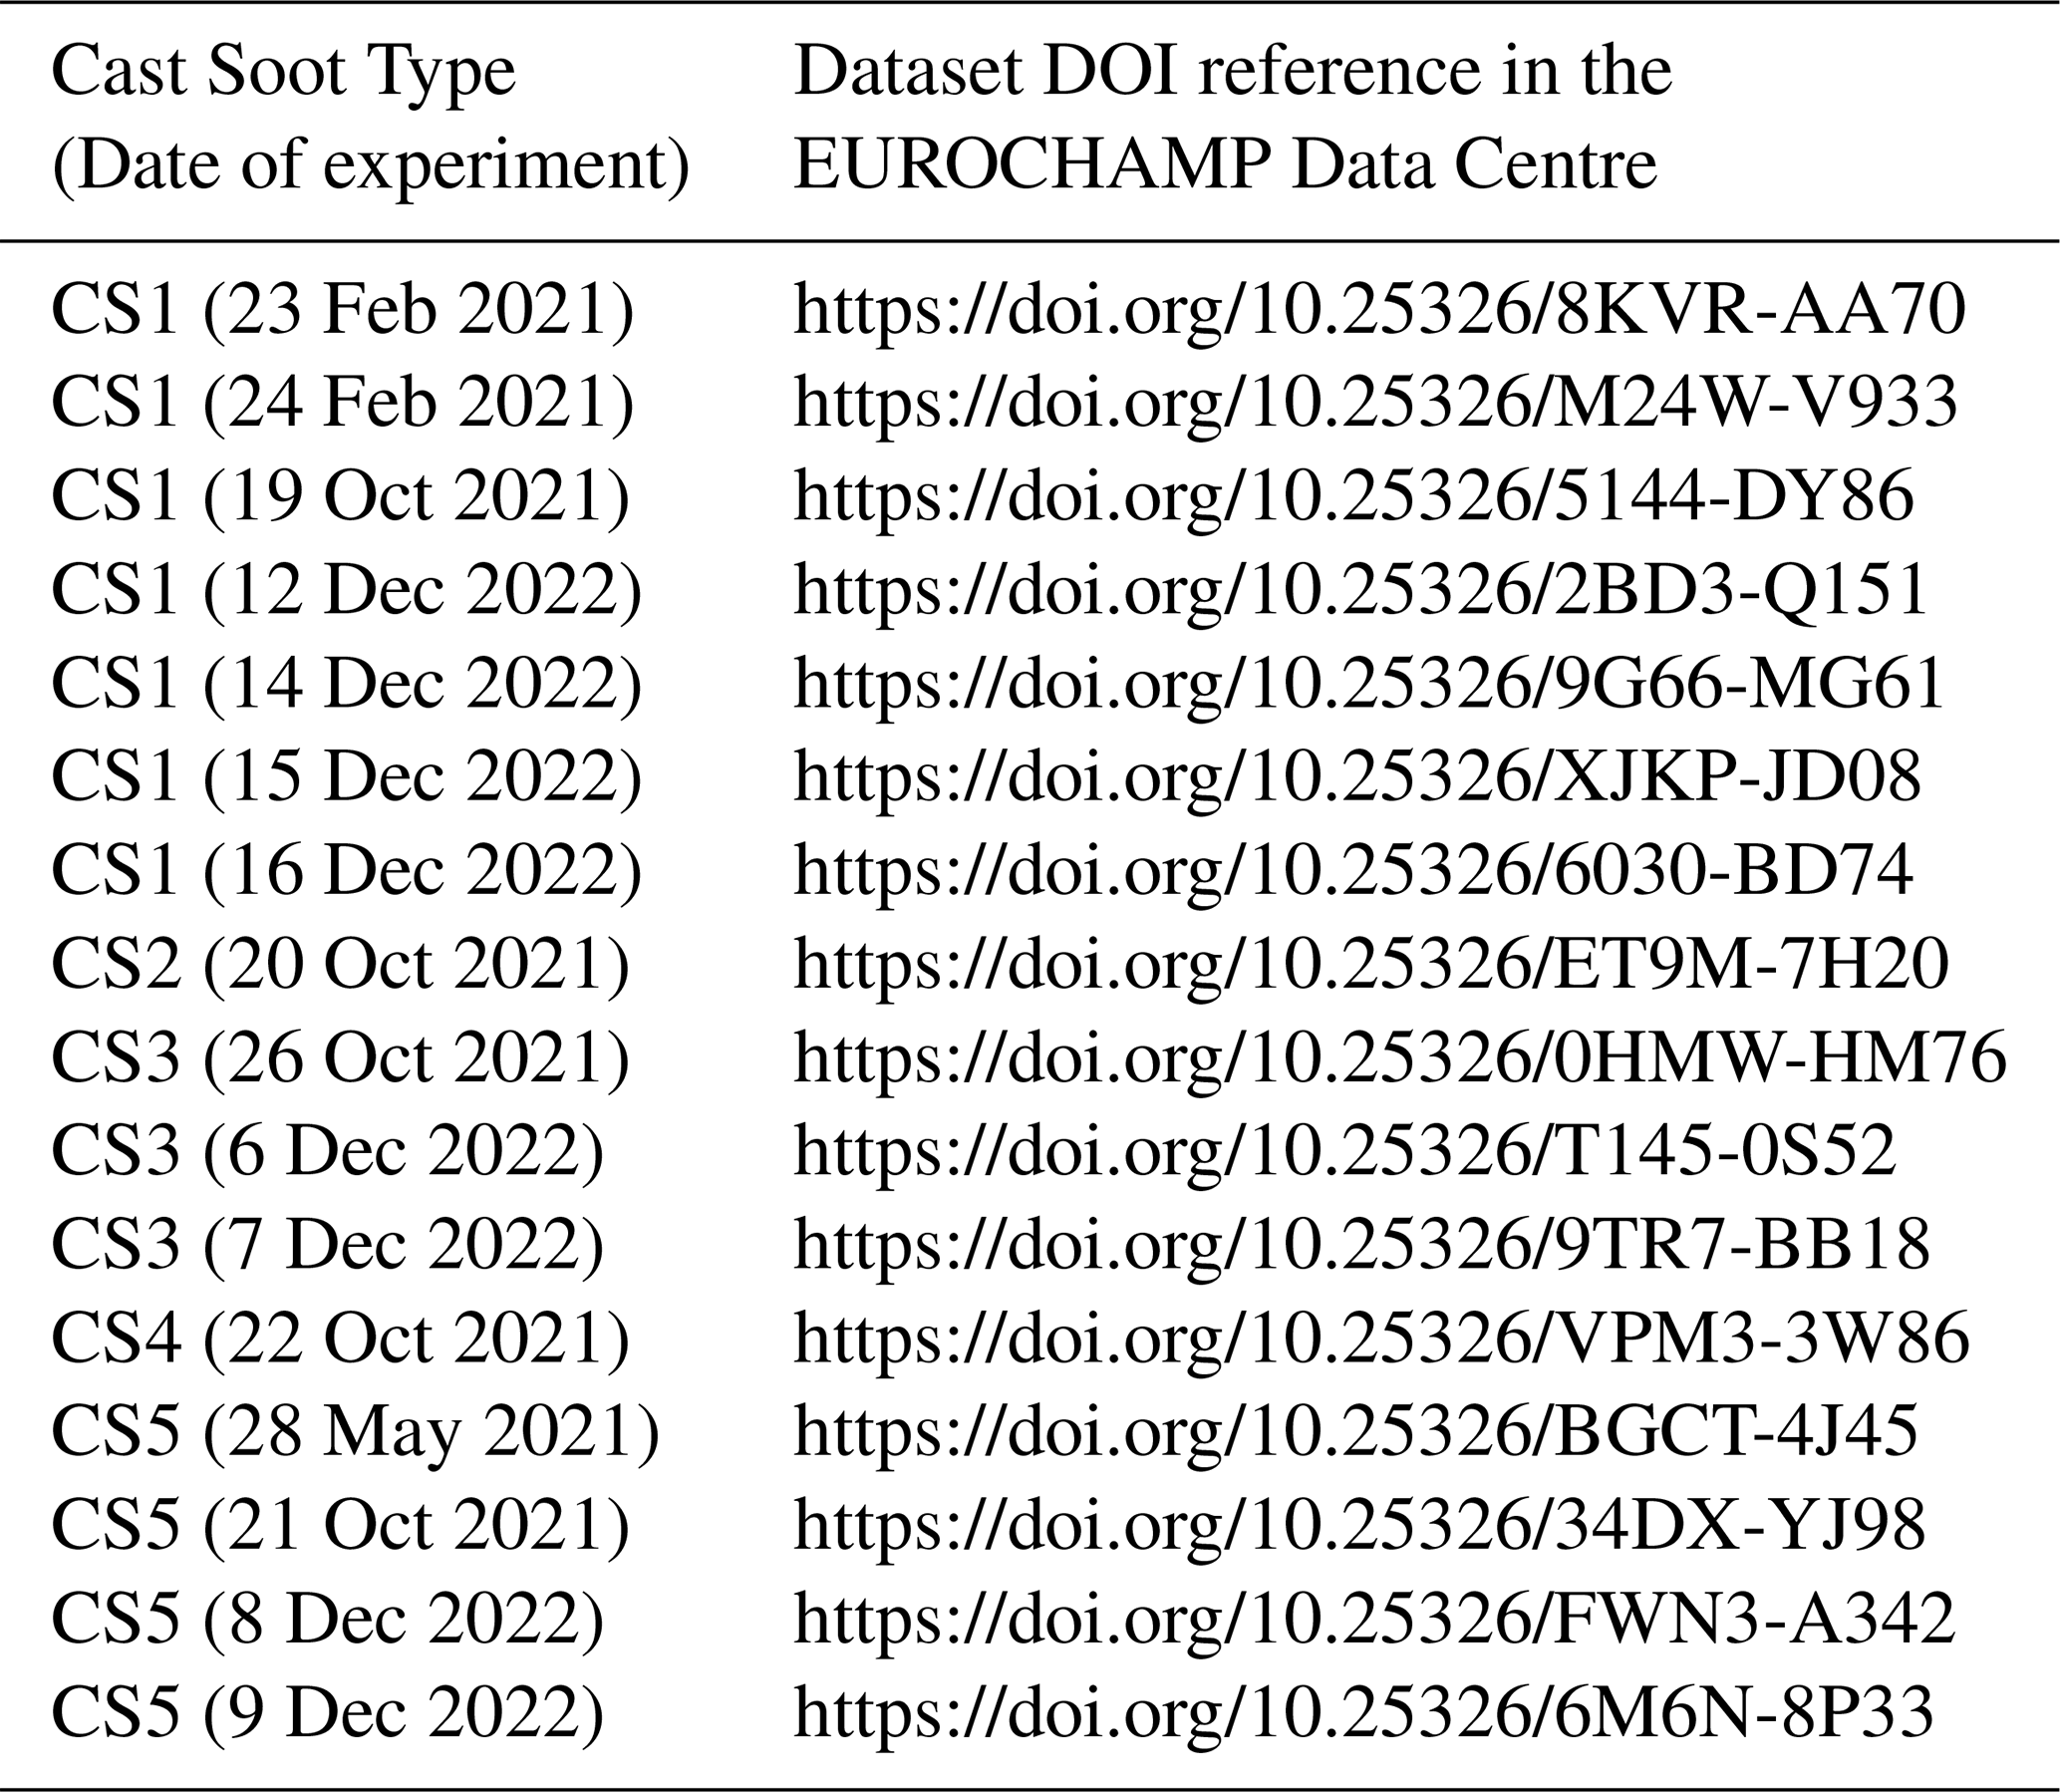
The CESAM data used in this study are available through the Database of Atmospheric Simulation Chamber Studies (DASCS) of the EUROCHAMP Data Centre (https://data.eurochamp.org/data-access/chamber-experiments/, last access: 16 February 2026) with the identifiers listed in Appendix Table A1. The CMN database is available through ACTRIS DC (EBAS/NILU) and dust event identification at CMN is available through the ITINERIS HUB (https://doi.org/10.71763/XDZA-FA77, Vogel et al., 2025a).
The supplement related to this article is available online at https://doi.org/10.5194/amt-19-1365-2026-supplement.
LR, AM and CDB conceived the study and discussed the results. LR, AM, MM took care of field measurements. JH and LR conducted the CESAM experiments with contributions by CDB, MC, AB, EP, AM, JY, CY, MZ, PF, BPV, and JFD. DM, TI and VV performed the MWAA measurements. LR performed the full data analysis under the supervision of MZ, AM and CDB and with contributions from JH, MM and FV. CDB contributed to funding acquisition and project administration for CESAM experiments. LR, MZ, AM and CDB wrote the manuscript. All authors reviewed and commented on the paper.
The contact author has declared that none of the authors has any competing interests.
Publisher's note: Copernicus Publications remains neutral with regard to jurisdictional claims made in the text, published maps, institutional affiliations, or any other geographical representation in this paper. The authors bear the ultimate responsibility for providing appropriate place names. Views expressed in the text are those of the authors and do not necessarily reflect the views of the publisher.
The CNRS-INSU is gratefully acknowledged for supporting the CESAM chamber as a national facility included in the ACTRIS-France Research Infrastructure as well as AERIS (https://www.aeris-data.fr/, last access: 16 February 2026) for curing and distributing the data through the EUROCHAMP Data Center (https://data.eurochamp.org/, last access: 16 February 2026). We thank ACTRIS-Italy for supporting measurements at Monte Cimone, carried out within ACTRIS Research infrastructure (ESFRI).
This work has received funding from the TNA activity of the European Union's Horizon 2020 research and innovation Programme through the EUROCHAMP-2020 Infrastructure Activity under grant agreement No 730997. This study has been supported by the French National Research Agency (ANR) through the B2C project (contract ANR-19-CE01-0024-01), by the French National program LEFE-CHAT (Les Enveloppes Fluides et l'Environnement – Chimie Atmosphérique) through the BACON project. It has been also supported by DIM Qi2 and Paris Ile-de-France Region. L. Renzi and M. Zanatta were partially supported by ITINERIS project (IR0000032), the Italian Integrated Environmental Research Infrastructures System (D.D. n. 130/2022 – CUP B53C22002150006) Funded by EU – Next Generation EU PNRR- Mission 4 “Education and Research”. The measurements at Monte Cimone were carried out within ACTRIS RI and supported by the Italian Ministry project PER_ACTRIS_IT, under PNIR (Piano Nazionale Infrastrutture di Ricerca) 2014–2020.
This paper was edited by Francis Pope and reviewed by two anonymous referees.
Anderson, T. L. and Ogren, J. A.: Determining Aerosol Radiative Properties Using the TSI 3563 Integrating Nephelometer, Aerosol Science and Technology, 29, 57–69, https://doi.org/10.1080/02786829808965551, 1998.
Anderson, T. L., Covert, D. S., Marshall, S. F., Laucks, M. L., Charlson, R. J., Waggoner, A. P., Ogren, J. A., Caldow, R., Holm, R. L., Quant, F. R., Sem, G. J., Wiedensohler, A., Ahlquist, N. A., and Bates, T. S.: Performance Characteristics of a High-Sensitivity, Three-Wavelength, Total Scatter/Backscatter Nephelometer, Journal of Atmospheric and Oceanic Technology, 13, 967–986, https://doi.org/10.1175/1520-0426(1996)013<0967:PCOAHS>2.0.CO;2, 1996.
Andrews, E., Ogren, J. A., Bonasoni, P., Marinoni, A., Cuevas, E., Rodríguez, S., Sun, J. Y., Jaffe, D. A., Fischer, E. V., Baltensperger, U., Weingartner, E., Coen, M. C., Sharma, S., Macdonald, A. M., Leaitch, W. R., Lin, N.-H., Laj, P., Arsov, T., Kalapov, I., Jefferson, A., and Sheridan, P.: Climatology of aerosol radiative properties in the free troposphere, Atmospheric Research, 102, 365–393, https://doi.org/10.1016/j.atmosres.2011.08.017, 2011.
Arnott, W. P., Hamasha, K., Moosmüller, H., Sheridan, P. J., and Ogren, J. A.: Towards aerosol light-absorption measurements with a 7-wavelength aethalometer: Evaluation with a photoacoustic instrument and 3-wavelength nephelometer, Aerosol Science and Technology, 39, 17–29, https://doi.org/10.1080/027868290901972, 2005.
Backman, J., Schmeisser, L., Virkkula, A., Ogren, J. A., Asmi, E., Starkweather, S., Sharma, S., Eleftheriadis, K., Uttal, T., Jefferson, A., Bergin, M., Makshtas, A., Tunved, P., and Fiebig, M.: On Aethalometer measurement uncertainties and an instrument correction factor for the Arctic, Atmos. Meas. Tech., 10, 5039–5062, https://doi.org/10.5194/amt-10-5039-2017, 2017.
Baldo, C., Formenti, P., Di Biagio, C., Lu, G., Song, C., Cazaunau, M., Pangui, E., Doussin, J.-F., Dagsson-Waldhauserova, P., Arnalds, O., Beddows, D., MacKenzie, A. R., and Shi, Z.: Complex refractive index and single scattering albedo of Icelandic dust in the shortwave part of the spectrum, Atmos. Chem. Phys., 23, 7975–8000, https://doi.org/10.5194/acp-23-7975-2023, 2023.
Bernardoni, V., Ferrero, L., Bolzacchini, E., Forello, A. C., Gregorič, A., Massabò, D., Močnik, G., Prati, P., Rigler, M., Santagostini, L., Soldan, F., Valentini, S., Valli, G., and Vecchi, R.: Determination of Aethalometer multiple-scattering enhancement parameters and impact on source apportionment during the winter 2017/18 EMEP/ACTRIS/COLOSSAL campaign in Milan, Atmos. Meas. Tech., 14, 2919–2940, https://doi.org/10.5194/amt-14-2919-2021, 2021.
Berry, G., Beckman, I., and Cho, H.: A comprehensive review of particle loading models of fibrous air filters, Journal of Aerosol Science, 167, 106078, https://doi.org/10.1016/j.jaerosci.2022.106078, 2023.
Bescond, A., Yon, J., Ouf, F.-X., Rozé, C., Coppalle, A., Parent, P., Ferry, D., and Laffon, C.: Soot optical properties determined by analyzing extinction spectra in the visible near-UV: Toward an optical speciation according to constituents and structure, Journal of Aerosol Science, 101, 118–132, https://doi.org/10.1016/j.jaerosci.2016.08.001, 2016.
Bond, T. C. and Bergstrom, R. W.: Light Absorption by Carbonaceous Particles: An Investigative Review, Aerosol Sci. Technol., 40, 27–67, https://doi.org/10.1080/02786820500421521, 2006.
Bond, T. C., Doherty, S. J., Fahey, D. W., Forster, P. M., Berntsen, T., DeAngelo, B. J., Flanner, M. G., Ghan, S., Kärcher, B., Koch, D., Kinne, S., Kondo, Y., Quinn, P. K., Sarofim, M. C., Schultz, M. G., Schulz, M., Venkataraman, C., Zhang, H., Zhang, S., Bellouin, N., Guttikunda, S. K., Hopke, P. K., Jacobson, M. Z., Kaiser, J. W., Klimont, Z., Lohmann, U., Schwarz, J. P., Shindell, D., Storelvmo, T., Warren, S. G., and Zender, C. S.: Bounding the role of black carbon in the climate system: A scientific assessment, Journal of Geophysical Research: Atmospheres, 118, 5380–5552, https://doi.org/10.1002/jgrd.50171, 2013.
Brégonzio-Rozier, L., Giorio, C., Siekmann, F., Pangui, E., Morales, S. B., Temime-Roussel, B., Gratien, A., Michoud, V., Cazaunau, M., DeWitt, H. L., Tapparo, A., Monod, A., and Doussin, J.-F.: Secondary organic aerosol formation from isoprene photooxidation during cloud condensation–evaporation cycles, Atmos. Chem. Phys., 16, 1747–1760, https://doi.org/10.5194/acp-16-1747-2016, 2016.
Caponi, L., Formenti, P., Massabó, D., Di Biagio, C., Cazaunau, M., Pangui, E., Chevaillier, S., Landrot, G., Andreae, M. O., Kandler, K., Piketh, S., Saeed, T., Seibert, D., Williams, E., Balkanski, Y., Prati, P., and Doussin, J.-F.: Spectral- and size-resolved mass absorption efficiency of mineral dust aerosols in the shortwave spectrum: a simulation chamber study, Atmos. Chem. Phys., 17, 7175–7191, https://doi.org/10.5194/acp-17-7175-2017, 2017.
Chung, C. E., Ramanathan, V., and Decremer, D.: Observationally constrained estimates of carbonaceous aerosol radiative forcing, Proceedings of the National Academy of Sciences, 109, 11624–11629, https://doi.org/10.1073/pnas.1203707109, 2012.
Collaud Coen, M., Weingartner, E., Apituley, A., Ceburnis, D., Fierz-Schmidhauser, R., Flentje, H., Henzing, J. S., Jennings, S. G., Moerman, M., Petzold, A., Schmid, O., and Baltensperger, U.: Minimizing light absorption measurement artifacts of the Aethalometer: evaluation of five correction algorithms, Atmos. Meas. Tech., 3, 457–474, https://doi.org/10.5194/amt-3-457-2010, 2010.
Corbin, J. C., Pieber, S. M., Czech, H., Zanatta, M., Jakobi, G., Massabò, D., Orasche, J., El Haddad, I., Mensah, A. A., Stengel, B., Drinovec, L., Mocnik, G., Zimmermann, R., Prévôt, A. S. H., and Gysel, M.: Brown and Black Carbon Emitted by a Marine Engine Operated on Heavy Fuel Oil and Distillate Fuels: Optical Properties, Size Distributions, and Emission Factors, Journal of Geophysical Research: Atmospheres, 123, 6175–6195, https://doi.org/10.1029/2017JD027818, 2018.
Cristofanelli, P., Marinoni, A., Arduini, J., Bonafè, U., Calzolari, F., Colombo, T., Decesari, S., Duchi, R., Facchini, M. C., Fierli, F., Finessi, E., Maione, M., Chiari, M., Calzolai, G., Messina, P., Orlandi, E., Roccato, F., and Bonasoni, P.: Significant variations of trace gas composition and aerosol properties at Mt. Cimone during air mass transport from North Africa – contributions from wildfire emissions and mineral dust, Atmos. Chem. Phys., 9, 4603–4619, https://doi.org/10.5194/acp-9-4603-2009, 2009.
Cristofanelli, P., Brattich, E., Decesari, S., Landi, T. C., Maione, M., Putero, D., Tositti, L., and Bonasoni, P.: The “O. Vittori” Observatory at Mt. Cimone: A “Lighthouse” for the Mediterranean Troposphere, in: High-Mountain Atmospheric Research: The Italian Mt. Cimone WMO/GAW Global Station (2165 ), edited by: Cristofanelli, P., Brattich, E., Decesari, S., Landi, T. C., Maione, M., Putero, D., Tositti, L., and Bonasoni, P., Springer International Publishing, Cham, 1–14, https://doi.org/10.1007/978-3-319-61127-3_1, 2018.
Cristofanelli, P., Trisolino, P., Calzolari, F., Busetto, M., Calidonna, C. R., Amendola, S., Arduini, J., Fratticioli, C., Hundal, R. A., Maione, M., Marcucci, F., Marinoni, A., Montaguti, S., Renzi, L., Roccato, F., Bonasoni, P., and Putero, D.: Influence of wildfire emissions to carbon dioxide (CO2) observed at the Mt. Cimone station (Italy, 2165 m asl): A multi-year investigation, Atmospheric Environment, 330, 120577, https://doi.org/10.1016/j.atmosenv.2024.120577, 2024.
Cuesta-Mosquera, A., Močnik, G., Drinovec, L., Müller, T., Pfeifer, S., Minguillón, M. C., Briel, B., Buckley, P., Dudoitis, V., Fernández-García, J., Fernández-Amado, M., Ferreira De Brito, J., Riffault, V., Flentje, H., Heffernan, E., Kalivitis, N., Kalogridis, A.-C., Keernik, H., Marmureanu, L., Luoma, K., Marinoni, A., Pikridas, M., Schauer, G., Serfozo, N., Servomaa, H., Titos, G., Yus-Díez, J., Zioła, N., and Wiedensohler, A.: Intercomparison and characterization of 23 Aethalometers under laboratory and ambient air conditions: procedures and unit-to-unit variabilities, Atmos. Meas. Tech., 14, 3195–3216, https://doi.org/10.5194/amt-14-3195-2021, 2021.
De Haan, D. O., Hawkins, L. N., Jansen, K., Welsh, H. G., Pednekar, R., de Loera, A., Jimenez, N. G., Tolbert, M. A., Cazaunau, M., Gratien, A., Bergé, A., Pangui, E., Formenti, P., and Doussin, J.-F.: Glyoxal's impact on dry ammonium salts: fast and reversible surface aerosol browning, Atmos. Chem. Phys., 20, 9581–9590, https://doi.org/10.5194/acp-20-9581-2020, 2020.
Denjean, C., Formenti, P., Picquet-Varrault, B., Camredon, M., Pangui, E., Zapf, P., Katrib, Y., Giorio, C., Tapparo, A., Temime-Roussel, B., Monod, A., Aumont, B., and Doussin, J. F.: Aging of secondary organic aerosol generated from the ozonolysis of α-pinene: effects of ozone, light and temperature, Atmos. Chem. Phys., 15, 883–897, https://doi.org/10.5194/acp-15-883-2015, 2015.
Di Biagio, C., Formenti, P., Doppler, L., Gaimoz, C., Grand, N., Ancellet, G., Attié, J.-L., Bucci, S., Dubuisson, P., Fierli, F., Mallet, M., and Ravetta, F.: Continental pollution in the Western Mediterranean basin: large variability of the aerosol single scattering albedo and influence on the direct shortwave radiative effect, Atmos. Chem. Phys., 16, 10591–10607, https://doi.org/10.5194/acp-16-10591-2016, 2016.
Di Biagio, C., Formenti, P., Cazaunau, M., Pangui, E., Marchand, N., and Doussin, J.-F.: Aethalometer multiple scattering correction Cref for mineral dust aerosols, Atmos. Meas. Tech., 10, 2923–2939, https://doi.org/10.5194/amt-10-2923-2017, 2017.
Di Biagio, C., Formenti, P., Balkanski, Y., Caponi, L., Cazaunau, M., Pangui, E., Journet, E., Nowak, S., Andreae, M. O., Kandler, K., Saeed, T., Piketh, S., Seibert, D., Williams, E., and Doussin, J.-F.: Complex refractive indices and single-scattering albedo of global dust aerosols in the shortwave spectrum and relationship to size and iron content, Atmos. Chem. Phys., 19, 15503–15531, https://doi.org/10.5194/acp-19-15503-2019, 2019.
Drinovec, L., Močnik, G., Zotter, P., Prévôt, A. S. H., Ruckstuhl, C., Coz, E., Rupakheti, M., Sciare, J., Müller, T., Wiedensohler, A., and Hansen, A. D. A.: The “dual-spot” Aethalometer: an improved measurement of aerosol black carbon with real-time loading compensation, Atmos. Meas. Tech., 8, 1965–1979, https://doi.org/10.5194/amt-8-1965-2015, 2015.
Drinovec, L., Jagodič, U., Pirker, L., Škarabot, M., Kurtjak, M., Vidović, K., Ferrero, L., Visser, B., Röhrbein, J., Weingartner, E., Kalbermatter, D. M., Vasilatou, K., Bühlmann, T., Pascale, C., Müller, T., Wiedensohler, A., and Močnik, G.: A dual-wavelength photothermal aerosol absorption monitor: design, calibration and performance, Atmos. Meas. Tech., 15, 3805–3825, https://doi.org/10.5194/amt-15-3805-2022, 2022.
Duchi, R., Cristofanelli, P., Landi, T. C., Arduini, J., Bonafe', U., Bourcier, L., Busetto, M., Calzolari, F., Marinoni, A., Putero, D., and Bonasoni, P.: Long-term (2002–2012) investigation of Saharan dust transport events at Mt. Cimone GAW global station, Italy (2165 m a.s.l.), Elementa, 4, 000085, https://doi.org/10.12952/journal.elementa.000085, 2016.
Favez, O., Weber, S., Petit, J.-E., Alleman, L., Albinet, A., Riffault, V., Chazeau, B., Amodeo, T., Salameh, D., Zhang, Y., Srivastava, D., Samaké, A., Aujay-Plouzeau, R., Papin, A., Bonnaire, N., Boullanger, C., Chatain, M., Chevrier, F., Detournay, A., Dominik-Sègue, M., Falhun, R., Garbin, C., Ghersi, V., Grignion, G., Levigoureux, G., Pontet, S., Rangognio, J., Zhang, S., Besombes, J.-L., Conil, S., Uzu, G., Savarino, J. E., Marchand, N., Gros, V., Marchand, C., Jaffrezo, J.-L., and Leoz-Garziandia, E.: Overview of the French Operational Network for In Situ Observation of PM Chemical Composition and Sources in Urban Environments (CARA Program), Atmosphere, 12, 207, https://doi.org/10.3390/atmos12020207, 2021.
Ferrero, L., Bernardoni, V., Santagostini, L., Cogliati, S., Soldan, F., Valentini, S., Massabò, D., Močnik, G., Gregorič, A., Rigler, M., Prati, P., Bigogno, A., Losi, N., Valli, G., Vecchi, R., and Bolzacchini, E.: Consistent determination of the heating rate of light-absorbing aerosol using wavelength- and time-dependent Aethalometer multiple-scattering correction, Science of the Total Environment, 791, https://doi.org/10.1016/j.scitotenv.2021.148277, 2021.
Fialho, P., Hansen, A. D. A., and Honrath, R. E.: Absorption coefficients by aerosols in remote areas: a new approach to decouple dust and black carbon absorption coefficients using seven-wavelength Aethalometer data, Journal of Aerosol Science, 36, 267–282, https://doi.org/10.1016/j.jaerosci.2004.09.004, 2005.
Formenti, P., Rajot, J. L., Desboeufs, K., Saïd, F., Grand, N., Chevaillier, S., and Schmechtig, C.: Airborne observations of mineral dust over western Africa in the summer Monsoon season: spatial and vertical variability of physico-chemical and optical properties, Atmos. Chem. Phys., 11, 6387–6410, https://doi.org/10.5194/acp-11-6387-2011, 2011.
Freedman, D. and Diaconis, P.: On the histogram as a density estimator:L 2 theory, Z. Wahrscheinlichkeitstheorie verw Gebiete, 57, 453–476, https://doi.org/10.1007/BF01025868, 1981.
Hansen, A. D. A., Rosen, H., and Novakov, T.: The aethalometer - An instrument for the real-time measurement of optical absorption by aerosol particles, Science of the Total Environment, The, 36, 191–196, 1984.
Heuser, J., Di Biagio, C., Yon, J., Cazaunau, M., Bergé, A., Pangui, E., Zanatta, M., Renzi, L., Marinoni, A., Inomata, S., Yu, C., Bernardoni, V., Chevaillier, S., Ferry, D., Laj, P., Maillé, M., Massabò, D., Mazzei, F., Noyalet, G., Tanimoto, H., Temime-Roussel, B., Vecchi, R., Vernocchi, V., Formenti, P., Picquet-Varrault, B., and Doussin, J.-F.: Spectral optical properties of soot: laboratory investigation of propane flame particles and their link to composition, Atmos. Chem. Phys., 25, 6407–6428, https://doi.org/10.5194/acp-25-6407-2025, 2025.
Hinds, W. C. and Zhu, Y.: Aerosol technology: properties, behavior, and measurement of airborne particles, John Wiley & Sons, ISBN 978-1-119-49406-5, 2022.
Huang, S.-H., Chen, C.-W., Kuo, Y.-M., Lai, C.-Y., McKay, R., and Chen, C.-C.: Factors Affecting Filter Penetration and Quality Factor of Particulate Respirators, Aerosol Air Qual. Res., 13, 162–171, https://doi.org/10.4209/aaqr.2012.07.0179, 2013.
Kalbermatter, D. M., Močnik, G., Drinovec, L., Visser, B., Röhrbein, J., Oscity, M., Weingartner, E., Hyvärinen, A.-P., and Vasilatou, K.: Comparing black-carbon- and aerosol-absorption-measuring instruments – a new system using lab-generated soot coated with controlled amounts of secondary organic matter, Atmos. Meas. Tech., 15, 561–572, https://doi.org/10.5194/amt-15-561-2022, 2022.
Kim, J.-H., Kim, S.-W., Ogren, J. A., Sheridan, P. J., Yoon, S.-C., Sharma, S., and Lin, N.-H.: Multiple scattering correction factor estimation for aethalometer aerosol absorption coefficient measurement, Aerosol Sci. Technol., 53, 160–171, https://doi.org/10.1080/02786826.2018.1555368, 2019.
Kok, J. F., Storelvmo, T., Karydis, V. A., Adebiyi, A. A., Mahowald, N. M., Evan, A. T., He, C., and Leung, D. M.: Mineral dust aerosol impacts on global climate and climate change, Nat. Rev. Earth Environ., 4, 71–86, https://doi.org/10.1038/s43017-022-00379-5, 2023.
Lack, D. A., Cappa, C. D., Cross, E. S., Massoli, P., Ahern, A. T., Davidovits, P., and Onasch, T. B.: Absorption Enhancement of Coated Absorbing Aerosols: Validation of the Photo-Acoustic Technique for Measuring the Enhancement, Aerosol Science and Technology, 43, 1006–1012, https://doi.org/10.1080/02786820903117932, 2009.
Laing, J. R., Jaffe, D. A., and Sedlacek, A. J.: Comparison of filter-based absorption measurements of biomass burning aerosol and background aerosol at the mt. Bachelor observatory, Aerosol and Air Quality Research, 20, 663–678, https://doi.org/10.4209/aaqr.2019.06.0298, 2020.
Laj, P., Bigi, A., Rose, C., Andrews, E., Lund Myhre, C., Collaud Coen, M., Lin, Y., Wiedensohler, A., Schulz, M., Ogren, J. A., Fiebig, M., Gliß, J., Mortier, A., Pandolfi, M., Petäja, T., Kim, S.-W., Aas, W., Putaud, J.-P., Mayol-Bracero, O., Keywood, M., Labrador, L., Aalto, P., Ahlberg, E., Alados Arboledas, L., Alastuey, A., Andrade, M., Artíñano, B., Ausmeel, S., Arsov, T., Asmi, E., Backman, J., Baltensperger, U., Bastian, S., Bath, O., Beukes, J. P., Brem, B. T., Bukowiecki, N., Conil, S., Couret, C., Day, D., Dayantolis, W., Degorska, A., Eleftheriadis, K., Fetfatzis, P., Favez, O., Flentje, H., Gini, M. I., Gregorič, A., Gysel-Beer, M., Hallar, A. G., Hand, J., Hoffer, A., Hueglin, C., Hooda, R. K., Hyvärinen, A., Kalapov, I., Kalivitis, N., Kasper-Giebl, A., Kim, J. E., Kouvarakis, G., Kranjc, I., Krejci, R., Kulmala, M., Labuschagne, C., Lee, H.-J., Lihavainen, H., Lin, N.-H., Löschau, G., Luoma, K., Marinoni, A., Martins Dos Santos, S., Meinhardt, F., Merkel, M., Metzger, J.-M., Mihalopoulos, N., Nguyen, N. A., Ondracek, J., Pérez, N., Perrone, M. R., Petit, J.-E., Picard, D., Pichon, J.-M., Pont, V., Prats, N., Prenni, A., Reisen, F., Romano, S., Sellegri, K., Sharma, S., Schauer, G., Sheridan, P., Sherman, J. P., Schütze, M., Schwerin, A., Sohmer, R., Sorribas, M., Steinbacher, M., Sun, J., Titos, G., Toczko, B., Tuch, T., Tulet, P., Tunved, P., Vakkari, V., Velarde, F., Velasquez, P., Villani, P., Vratolis, S., Wang, S.-H., Weinhold, K., Weller, R., Yela, M., Yus-Diez, J., Zdimal, V., Zieger, P., and Zikova, N.: A global analysis of climate-relevant aerosol properties retrieved from the network of Global Atmosphere Watch (GAW) near-surface observatories, Atmos. Meas. Tech., 13, 4353–4392, https://doi.org/10.5194/amt-13-4353-2020, 2020.
Li, J., Carlson, B. E., Yung, Y. L., Lv, D., Hansen, J., Penner, J. E., Liao, H., Ramaswamy, V., Kahn, R. A., Zhang, P., Dubovik, O., Ding, A., Lacis, A. A., Zhang, L., and Dong, Y.: Scattering and absorbing aerosols in the climate system, Nat. Rev. Earth Environ., 3, 363–379, https://doi.org/10.1038/s43017-022-00296-7, 2022.
Liu, D., He, C., Schwarz, J. P., and Wang, X.: Lifecycle of light-absorbing carbonaceous aerosols in the atmosphere, npj Clim. Atmos. Sci., 3, 1–18, https://doi.org/10.1038/s41612-020-00145-8, 2020a.
Liu, F., Yon, J., Fuentes, A., Lobo, P., Smallwood, G. J., and Corbin, J. C.: Review of recent literature on the light absorption properties of black carbon: Refractive index, mass absorption cross section, and absorption function, Aerosol Science and Technology, 54, 33–51, https://doi.org/10.1080/02786826.2019.1676878, 2020b.
Luoma, K., Virkkula, A., Aalto, P., Lehtipalo, K., Petäjä, T., and Kulmala, M.: Effects of different correction algorithms on absorption coefficient – a comparison of three optical absorption photometers at a boreal forest site, Atmos. Meas. Tech., 14, 6419–6441, https://doi.org/10.5194/amt-14-6419-2021, 2021.
Marinoni, A., Cristofanelli, P., Calzolari, F., Roccato, F., Bonafè, U., and Bonasoni, P.: Continuous measurements of aerosol physical parameters at the Mt. Cimone GAW Station (2165 m asl, Italy), Science of The Total Environment, 391, 241–251, https://doi.org/10.1016/j.scitotenv.2007.10.004, 2008.
Massabò, D., Bernardoni, V., Bove, M. C., Brunengo, A., Cuccia, E., Piazzalunga, A., Prati, P., Valli, G., and Vecchi, R.: A multi-wavelength optical set-up for the characterization of carbonaceous particulate matter, Journal of Aerosol Science, 60, 34–46, https://doi.org/10.1016/j.jaerosci.2013.02.006, 2013.
Massabò, D., Caponi, L., Bernardoni, V., Bove, M. C., Brotto, P., Calzolai, G., Cassola, F., Chiari, M., Fedi, M. E., Fermo, P., Giannoni, M., Lucarelli, F., Nava, S., Piazzalunga, A., Valli, G., Vecchi, R., and Prati, P.: Multi-wavelength optical determination of black and brown carbon in atmospheric aerosols, Atmospheric Environment, 108, 1–12, https://doi.org/10.1016/j.atmosenv.2015.02.058, 2015.
Massoli, P., Murphy, D. M., Lack, D. A., Baynard, T., Brock, C. A., and Lovejoy, E. R.: Uncertainty in Light Scattering Measurements by TSI Nephelometer: Results from Laboratory Studies and Implications for Ambient Measurements, Aerosol Science and Technology, 43, 1064–1074, https://doi.org/10.1080/02786820903156542, 2009.
Massoli, P., Kebabian, P. L., Onasch, T. B., Hills, F. B., and Freedman, A.: Aerosol Light Extinction Measurements by Cavity Attenuated Phase Shift (CAPS) Spectroscopy: Laboratory Validation and Field Deployment of a Compact Aerosol Particle Extinction Monitor, Aerosol Science and Technology, 44, 428–435, https://doi.org/10.1080/02786821003716599, 2010.
Modini, R. L., Corbin, J. C., Brem, B. T., Irwin, M., Bertò, M., Pileci, R. E., Fetfatzis, P., Eleftheriadis, K., Henzing, B., Moerman, M. M., Liu, F., Müller, T., and Gysel-Beer, M.: Detailed characterization of the CAPS single-scattering albedo monitor (CAPS PMssa) as a field-deployable instrument for measuring aerosol light absorption with the extinction-minus-scattering method, Atmos. Meas. Tech., 14, 819–851, https://doi.org/10.5194/amt-14-819-2021, 2021.
Moore, R. H., Ziemba, L. D., Dutcher, D., Beyersdorf, A. J., Chan, K., Crumeyrolle, S., Raymond, T. M., Thornhill, K. L., Winstead, E. L., and Anderson, B. E.: Mapping the Operation of the Miniature Combustion Aerosol Standard (Mini-CAST) Soot Generator, Aerosol Science and Technology, 48, 467–479, https://doi.org/10.1080/02786826.2014.890694, 2014.
Moschos, V., Gysel-Beer, M., Modini, R. L., Corbin, J. C., Massabò, D., Costa, C., Danelli, S. G., Vlachou, A., Daellenbach, K. R., Szidat, S., Prati, P., Prévôt, A. S. H., Baltensperger, U., and El Haddad, I.: Source-specific light absorption by carbonaceous components in the complex aerosol matrix from yearly filter-based measurements, Atmos. Chem. Phys., 21, 12809–12833, https://doi.org/10.5194/acp-21-12809-2021, 2021.
Moteki, N.: Climate-relevant properties of black carbon aerosols revealed by in situ measurements: a review, Prog. Earth Planet. Sci., 10, 12, https://doi.org/10.1186/s40645-023-00544-4, 2023.
Moteki, N., Kondo, Y., Nakayama, T., Kita, K., Sahu, L. K., Ishigai, T., Kinase, T., and Matsumi, Y.: Radiative transfer modeling of filter-based measurements of light absorption by particles: Importance of particle size dependent penetration depth, Journal of Aerosol Science, 41, 401–412, https://doi.org/10.1016/j.jaerosci.2010.02.002, 2010.
Nakayama, T., Kondo, Y., Moteki, N., Sahu, L. K., Kinase, T., Kita, K., and Matsumi, Y.: Size-dependent correction factors for absorption measurements using filter-based photometers: PSAP and COSMOS, Journal of Aerosol Science, 41, 333–343, https://doi.org/10.1016/j.jaerosci.2010.01.004, 2010.
Ohata, S., Mori, T., Kondo, Y., Sharma, S., Hyvärinen, A., Andrews, E., Tunved, P., Asmi, E., Backman, J., Servomaa, H., Veber, D., Eleftheriadis, K., Vratolis, S., Krejci, R., Zieger, P., Koike, M., Kanaya, Y., Yoshida, A., Moteki, N., Zhao, Y., Tobo, Y., Matsushita, J., and Oshima, N.: Estimates of mass absorption cross sections of black carbon for filter-based absorption photometers in the Arctic, Atmos. Meas. Tech., 14, 6723–6748, https://doi.org/10.5194/amt-14-6723-2021, 2021.
Onasch, T. B., Massoli, P., Kebabian, P. L., Hills, F. B., Bacon, F. W., and Freedman, A.: Single Scattering Albedo Monitor for Airborne Particulates, Aerosol Science and Technology, 49, 267–279, https://doi.org/10.1080/02786826.2015.1022248, 2015.
Petzold, A. and Schönlinner, M.: Multi-angle absorption photometry - A new method for the measurement of aerosol light absorption and atmospheric black carbon, Journal of Aerosol Science, 35, 421–441, https://doi.org/10.1016/j.jaerosci.2003.09.005, 2004.
Petzold, A., Schloesser, H., Sheridan, P. J., Arnott, W. P., Ogren, J. A., and Virkkula, A.: Evaluation of Multiangle Absorption Photometry for Measuring Aerosol Light Absorption, Aerosol Sci. Technol., 39, 40–51, https://doi.org/10.1080/027868290901945, 2005.
Petzold, A., Ogren, J. A., Fiebig, M., Laj, P., Li, S.-M., Baltensperger, U., Holzer-Popp, T., Kinne, S., Pappalardo, G., Sugimoto, N., Wehrli, C., Wiedensohler, A., and Zhang, X.-Y.: Recommendations for reporting “black carbon” measurements, Atmos. Chem. Phys., 13, 8365–8379, https://doi.org/10.5194/acp-13-8365-2013, 2013.
Ramanathan, V. and Carmichael, G.: Global and regional climate changes due to black carbon, Nature Geosci., 1, 221–227, https://doi.org/10.1038/ngeo156, 2008.
Romshoo, B., Pöhlker, M., Wiedensohler, A., Pfeifer, S., Saturno, J., Nowak, A., Ciupek, K., Quincey, P., Vasilatou, K., Ess, M. N., Gini, M., Eleftheriadis, K., Robins, C., Gaie-Levrel, F., and Müller, T.: Importance of size representation and morphology in modelling optical properties of black carbon: comparison between laboratory measurements and model simulations, Atmos. Meas. Tech., 15, 6965–6989, https://doi.org/10.5194/amt-15-6965-2022, 2022.
Rovira, J., Savadkoohi, M., Chen, G. I., Močnik, G., Aas, W., Alados-Arboledas, L., Artiñano, B., Aurela, M., Backman, J., Banerji, S., Beddows, D., Brem, B., Chazeau, B., Coen, M. C., Colombi, C., Conil, S., Costabile, F., Coz, E., de Brito, J. F., Eleftheriadis, K., Favez, O., Flentje, H., Freney, E., Gregorič, A., Gysel-Beer, M., Harrison, R., Hueglin, C., Hyvärinen, A., Ivančič, M., Kalogridis, A.-C., Keernik, H., Konstantinos, G., Laj, P., Liakakou, E., Lin, C., Listrani, S., Luoma, K., Maasikmets, M., Manninen, H. E., Marchand, N., dos Santos, S. M., Mbengue, S., Mihalopoulos, N., Nicolae, D., Niemi, J. V., Norman, M., Ovadnevaite, J., Petit, J.-E., Platt, S., Prévôt, A. S. H., Pujadas, M., Putaud, J.-P., Riffault, V., Rigler, M., Rinaldi, M., Schwarz, J., Silvergren, S., Teinemaa, E., Teinilä, K., Timonen, H., Titos, G., Tobler, A., Vasilescu, J., Vratolis, S., Yttri, K. E., Yubero, E., Zíková, N., Alastuey, A., Petäjä, T., Querol, X., Yus-Díez, J., and Pandolfi, M.: A European aerosol phenomenology – 9: Light absorption properties of carbonaceous aerosol particles across surface Europe, Environment International, 195, 109185, https://doi.org/10.1016/j.envint.2024.109185, 2025.
Samset, B. H., Stjern, C. W., Andrews, E., Kahn, R. A., Myhre, G., Schulz, M., and Schuster, G. L.: Aerosol Absorption: Progress Towards Global and Regional Constraints, Curr. Clim. Change Rep., 4, 65–83, https://doi.org/10.1007/s40641-018-0091-4, 2018.
Sand, M., Samset, B. H., Myhre, G., Gliß, J., Bauer, S. E., Bian, H., Chin, M., Checa-Garcia, R., Ginoux, P., Kipling, Z., Kirkevåg, A., Kokkola, H., Le Sager, P., Lund, M. T., Matsui, H., van Noije, T., Olivié, D. J. L., Remy, S., Schulz, M., Stier, P., Stjern, C. W., Takemura, T., Tsigaridis, K., Tsyro, S. G., and Watson-Parris, D.: Aerosol absorption in global models from AeroCom phase III, Atmos. Chem. Phys., 21, 15929–15947, https://doi.org/10.5194/acp-21-15929-2021, 2021.
Sandradewi, J., Prévôt, A. S. H., Szidat, S., Perron, N., Alfarra, M. R., Lanz, V. A., Weingartner, E., and Baltensperger, U.: Using Aerosol Light Absorption Measurements for the Quantitative Determination of Wood Burning and Traffic Emission Contributions to Particulate Matter, Environ. Sci. Technol., 42, 3316–3323, https://doi.org/10.1021/es702253m, 2008.
Saturno, J., Pöhlker, C., Massabò, D., Brito, J., Carbone, S., Cheng, Y., Chi, X., Ditas, F., Hrabě de Angelis, I., Morán-Zuloaga, D., Pöhlker, M. L., Rizzo, L. V., Walter, D., Wang, Q., Artaxo, P., Prati, P., and Andreae, M. O.: Comparison of different Aethalometer correction schemes and a reference multi-wavelength absorption technique for ambient aerosol data, Atmos. Meas. Tech., 10, 2837–2850, https://doi.org/10.5194/amt-10-2837-2017, 2017.
Savadkoohi, M., Pandolfi, M., Reche, C., Niemi, J. V., Mooibroek, D., Titos, G., Green, D. C., Tremper, A. H., Hueglin, C., Liakakou, E., Mihalopoulos, N., Stavroulas, I., Artiñano, B., Coz, E., Alados-Arboledas, L., Beddows, D., Riffault, V., De Brito, J. F., Bastian, S., Baudic, A., Colombi, C., Costabile, F., Chazeau, B., Marchand, N., Gómez-Amo, J. L., Estellés, V., Matos, V., van der Gaag, E., Gille, G., Luoma, K., Manninen, H. E., Norman, M., Silvergren, S., Petit, J.-E., Putaud, J.-P., Rattigan, O. V., Timonen, H., Tuch, T., Merkel, M., Weinhold, K., Vratolis, S., Vasilescu, J., Favez, O., Harrison, R. M., Laj, P., Wiedensohler, A., Hopke, P. K., Petäjä, T., Alastuey, A., and Querol, X.: The variability of mass concentrations and source apportionment analysis of equivalent black carbon across urban Europe, Environment International, 178, 108081, https://doi.org/10.1016/j.envint.2023.108081, 2023.
Schmid, O., Artaxo, P., Arnott, W. P., Chand, D., Gatti, L. V., Frank, G. P., Hoffer, A., Schnaiter, M., and Andreae, M. O.: Spectral light absorption by ambient aerosols influenced by biomass burning in the Amazon Basin. I: Comparison and field calibration of absorption measurement techniques, Atmos. Chem. Phys., 6, 3443–3462, https://doi.org/10.5194/acp-6-3443-2006, 2006.
Segura, S., Estellés, V., Titos, G., Lyamani, H., Utrillas, M. P., Zotter, P., Prévôt, A. S. H., Močnik, G., Alados-Arboledas, L., and Martínez-Lozano, J. A.: Determination and analysis of in situ spectral aerosol optical properties by a multi-instrumental approach, Atmos. Meas. Tech., 7, 2373–2387, https://doi.org/10.5194/amt-7-2373-2014, 2014.
Sturges, H. A.: The Choice of a Class Interval, Journal of the American Statistical Association, 21, 65–66, https://doi.org/10.1080/01621459.1926.10502161, 1926.
Valentini, S., Barnaba, F., Bernardoni, V., Calzolai, G., Costabile, F., Di Liberto, L., Forello, A. C., Gobbi, G. P., Gualtieri, M., Lucarelli, F., Nava, S., Petralia, E., Valli, G., Wiedensohler, A., and Vecchi, R.: Classifying aerosol particles through the combination of optical and physical-chemical properties: Results from a wintertime campaign in Rome (Italy), Atmospheric Research, 235, 104799, https://doi.org/10.1016/j.atmosres.2019.104799, 2020.
Virkkula, A., Chi, X., Ding, A., Shen, Y., Nie, W., Qi, X., Zheng, L., Huang, X., Xie, Y., Wang, J., Petäjä, T., and Kulmala, M.: On the interpretation of the loading correction of the aethalometer, Atmos. Meas. Tech., 8, 4415–4427, https://doi.org/10.5194/amt-8-4415-2015, 2015.
Vogel, F., Marinoni, A., Putero, D., Mona, L., Ripepi, E., and Volini, M.: Dust event identification product dataset collection over Monte Cimone, Italy 2003–2023 (Version 1), ITINERIS HUB [data set], https://doi.org/10.71763/XDZA-FA77, 2025a.
Vogel, F., Putero, D., Bonasoni, P., Cristofanelli, P., Zanatta, M., and Marinoni, A.: Saharan dust transport event characterization in the Mediterranean atmosphere using 21 years of in-situ observations, Atmos. Chem. Phys., 25, 15453–15468, https://doi.org/10.5194/acp-25-15453-2025, 2025b.
Wang, J., Doussin, J. F., Perrier, S., Perraudin, E., Katrib, Y., Pangui, E., and Picquet-Varrault, B.: Design of a new multi-phase experimental simulation chamber for atmospheric photosmog, aerosol and cloud chemistry research, Atmos. Meas. Tech., 4, 2465–2494, https://doi.org/10.5194/amt-4-2465-2011, 2011.
Weingartner, E., Saathoff, H., Schnaiter, M., Streit, N., Bitnar, B., and Baltensperger, U.: Absorption of light by soot particles: determination of the absorption coefficient by means of aethalometers, Journal of Aerosol Science, 34, 1445–1463, https://doi.org/10.1016/S0021-8502(03)00359-8, 2003.
Wiedensohler, A., Birmili, W., Nowak, A., Sonntag, A., Weinhold, K., Merkel, M., Wehner, B., Tuch, T., Pfeifer, S., Fiebig, M., Fjäraa, A. M., Asmi, E., Sellegri, K., Depuy, R., Venzac, H., Villani, P., Laj, P., Aalto, P., Ogren, J. A., Swietlicki, E., Williams, P., Roldin, P., Quincey, P., Hüglin, C., Fierz-Schmidhauser, R., Gysel, M., Weingartner, E., Riccobono, F., Santos, S., Grüning, C., Faloon, K., Beddows, D., Harrison, R., Monahan, C., Jennings, S. G., O'Dowd, C. D., Marinoni, A., Horn, H.-G., Keck, L., Jiang, J., Scheckman, J., McMurry, P. H., Deng, Z., Zhao, C. S., Moerman, M., Henzing, B., de Leeuw, G., Löschau, G., and Bastian, S.: Mobility particle size spectrometers: harmonization of technical standards and data structure to facilitate high quality long-term observations of atmospheric particle number size distributions, Atmos. Meas. Tech., 5, 657–685, https://doi.org/10.5194/amt-5-657-2012, 2012.
Yus-Díez, J., Bernardoni, V., Močnik, G., Alastuey, A., Ciniglia, D., Ivančič, M., Querol, X., Perez, N., Reche, C., Rigler, M., Vecchi, R., Valentini, S., and Pandolfi, M.: Determination of the multiple-scattering correction factor and its cross-sensitivity to scattering and wavelength dependence for different AE33 Aethalometer filter tapes: a multi-instrumental approach, Atmos. Meas. Tech., 14, 6335–6355, https://doi.org/10.5194/amt-14-6335-2021, 2021.
Yus-Díez, J., Drinovec, L., Alados-Arboledas, L., Titos, G., Bazo, E., Casans, A., Patrón, D., Querol, X., Gonzalez-Romero, A., Perez García-Pando, C., and Močnik, G.: Characterization of filter photometer artifacts in soot and dust measurements – laboratory and ambient experiments using a traceably calibrated aerosol absorption reference, Atmos. Meas. Tech., 18, 3073–3093, https://doi.org/10.5194/amt-18-3073-2025, 2025.
Zhu, C.-S., Qu, Y., Huang, H., Chen, J., Dai, W.-T., Huang, R.-J., and Cao, J.-J.: Black Carbon and Secondary Brown Carbon, the Dominant Light Absorption and Direct Radiative Forcing Contributors of the Atmospheric Aerosols Over the Tibetan Plateau, Geophysical Research Letters, 48, e2021GL092524, https://doi.org/10.1029/2021GL092524, 2021.