the Creative Commons Attribution 4.0 License.
the Creative Commons Attribution 4.0 License.
 | 24 Feb 2026
Vertical profiles of raindrop size distribution parameters of summer rainfall in the eastern Tibetan Plateau: retrieval method and characteristics
Pingyi Dong
Xingwen Jiang
Xingbing Zhao
Yuanchang Dong
Jiafeng Zheng
Chun Hu
Guolu Gao
Shulei Li
Lingbing Bu
The eastern Tibetan Plateau has a high elevation, with a cold and dry atmospheric background. The features of the raindrop size distributions (DSD) in this region have notable differences from those in the plains. The general empirical relationships for retrieving parameters of precipitation from radar observations are not applicable in the eastern Tibetan Plateau. In this study, we developed a new method based on optimal estimation theory to retrieve the vertical profiles of N0 and Dm from a Ka-band zenith-pointing Doppler radar. Validation by a field campaign during the summer of 2024 indicates that the mean bias in the log 10(N0) and Dm derived from the PARSIVEL2 disdrometer and the retrieved values are 0.12 and −0.1 mm respectively, demonstrating the effectiveness of the retrieved DSD parameters in this region. Based on the retrieved vertical profiles of DSD parameters, some unique characteristics are found. The heavy precipitation (the maximum value in the reflectivity profile exceeding 30 dBZ) exhibits a higher particle number concentration above 2 km and larger raindrop size in the bottom of the rainfall on average. The mean values of Dm above 2 km are approximately 0.5 mm, for heavy precipitation, the value increase as the raindrops fall, reaching a peak at around 0.5 km. Precipitation that occurs after the nighttime cooling usually has higher particle concentrations and smaller particle sizes. Based on the above research, empirical relationships for the quantitative precipitation estimates (QPE) and attenuation correction using Ka-band radar in the eastern Tibetan Plateau are established.
- Article
(9293 KB) - Full-text XML
- BibTeX
- EndNote


Modeling and forecasting of precipitation is one of the key challenges in the field of meteorology, with substantial implications for quantifying the dynamics of water and energy cycles within the Earth-atmosphere system and improving the accuracy of numerical weather and climate models (Maggioni and Massari, 2019; Foufoula-Georgiou et al., 2020). The parameters of raindrop size distributions (DSD) are critical for describing the microphysical processes during precipitation (Thomas et al., 2021). Exploring the dynamic evolution of the vertical profile of DSD parameters may enhance the understanding of precipitation processes (Tapiador et al., 2010). Also, DSD is associated with the backscattering signals of radar observations, thereby affecting the outcomes of quantitative precipitation estimates (QPE) derived from radar (Gatidis et al., 2022). Furthermore, DSD and their associated uncertainties are critical components of data assimilation systems and numerical weather models (Yang et al., 2019).
The eastern Tibetan Plateau serves as a pivotal area for the transport of moisture from the Indian Ocean to eastern Asia (Xu et al., 2019). The water cycle in this region affects precipitation patterns across China and the global climate (Hu et al., 2021). The average altitude of this region is above 3000 m, and the atmospheric density is low, with a sparse water vapor content (You et al., 2015). The unique atmospheric background in this region results in distinct features of DSD compared to plain areas (Li et al., 2022). Exploring the characteristics of the vertical distribution of DSD parameters in the eastern Tibetan Plateau is crucial for improving the accuracy of local microphysical parameterizations of precipitation and deepening the understanding of the water cycle in this region.
The high temporal and spatial resolution of weather radar can provide continuous profiles of the precipitation parameters. However, the precipitation intensity and the size of raindrops in the eastern Tibetan Plateau are relatively small compared to those in the middle and lower reaches of the Yangtze River (Pu et al., 2021), and the sensitivity of common weather radars to small particles is limited at their operating frequencies. Ka-band radar exhibits superior spatial resolution and sensitivity to small precipitation particles, and has been widely applied in the observation of precipitation microphysical parameter profiles (Clothiaux et al., 2007). Studies have indicated that the attenuation of the reflectivity factor (Z) of Ka-band radar caused by large raindrops cannot be ignored (Daisley and Aydin, 2002). To minimize the impact of the attenuation effect on the retrieval accuracy, the Doppler spectrum observed by Ka-band radar was used to retrieve the parameters of DSD (Tridon and Battaglia, 2015; Giangrande et al., 2012). However, the results may be affected by turbulence of air, and the retrieval may have multiple solutions (Williams et al., 2016). Observations of the multi-frequency radar can provide additional information on the parameters of DSD. The dual-frequency ratio and differential attenuation coefficients were used to constrain the retrieval of DSD parameters (Unal and Van Den Brule, 2024; Hogan et al., 2005). Yet, the empirical relationships between the precipitation parameters and the observations of radar were affected by the average features of DSD that were summarized from plain areas, and are therefore not applicable in the eastern Tibetan Plateau (Protat et al., 2019). Further research is needed to accurately retrieve the profiles of DSD parameters from Ka-band radar in the eastern Tibetan Plateau and to summarize the characteristics of the vertical distribution of DSD in this region.
Due to the limited information obtained from single-frequency radar, the methods for retrieval of DSD parameters are generally chosen to fix the μ parameter of the Gamma Size Distribution (GSD) (Kumar et al., 2011) or utilize λ-μ empirical relationships of GSD to constrain the retrieval results (Huang et al., 2021), where μ and λ are shape, and slope parameters of GSD, respectively. However, these assumptions inevitably introduce errors into the retrieval results. Although the GSD can provide a detailed structure of the DSD, previous studies have indicated that the Marshall–Palmer exponential (MP) drop size distribution is sufficient to represent the size distribution of particles for cloud liquid water and precipitation (Smith, 2003). Besides, the representation of rainfall in the weather and climate models usually adopts a single or two-parameter scheme for rainfall to reduce the complexity of calculation (Jin and Baik, 2023). This article presents a retrieval method developed for Ka-band zenith-pointing radar and the characteristics of retrieved vertical profiles of DSD parameters. The retrieval method is based on optimal estimation theory, corrects the precipitation attenuation layer by layer and retrieves the N0 and Dm vertical profiles of MP distribution, and provides uncertainty estimates for the retrieval. This study primarily addresses the precipitation scenarios where the melting layer can be observed in radar LDR (Linear Depolarization Ratio) measurements. The retrieval and characteristics of DSD parameters under strong convective conditions are not included in this study. In Sect. 2, the instruments and retrieval method used in this study are introduced. Section 3 presents the validations of the forward calculation and retrieval method. The spatiotemporal characteristics of the vertical profiles of the DSD parameters and the fitted empirical relationships are given in Sect. 4.
During the 2024 summer precipitation observation experiment in the eastern Tibetan Plateau, a comprehensive study of cloud-precipitation was conducted at the Hongyuan Meteorological Bureau weather site (32.8° N, 102.5° E, 3499 m above sea level). In this study, the vertical distribution of DSD parameters of summer rainfall in the eastern Tibetan Plateau is investigated using a Ka-band zenith-pointing Doppler radar and a ground-based disdrometer deployed at the Hongyuan site. The distance between the two instruments is about 70 m.
2.1 Ground-based disdrometer
The surface DSD are collected by the PARSIVEL2 disdrometer. The measuring ranges of the disdrometer are 0.062–24.5 mm for the size of raindrops and 0.05–20.8 m s−1 for velocity, respectively. The time resolution is 60 s. According to the number of raindrops in the discrete scale intervals observed by the disdrometer n and the terminal falling velocity V, the raindrop size distribution N(D) in is written as:
Where ni,j represents the number of raindrops in the i-th size bin and the j-th velocity bin, Ai denotes the sampling area, t is the integration time, and Vi,j indicates the falling velocity of raindrops in the i-th size bin and the j-th velocity bin. The particle diameter is expressed in millimeters (mm), while the velocity is measured in meters per second (m s−1) in this study. The MP exponential drop size distribution (Smith, 2003) expressed as:
In Eq. (2), D is the maximum dimension of the particle, N0 is the concentration parameter, the mass-weighted mean diameter Dm, is determined as the ratio of the fourth to third moments of the DSD. N0 is calculated from the third and fourth moments of DSD (Smith, 2003), expressed as:
The rain rate R is defined by the fall rate and DSD as:
For Ka-band radar, the reflectivity factor Z and the Doppler radial velocity Vr are calculated from Eqs. (5) and (6).
Where the efficiency factor of scattering (Qb), backscattering section of radar (σb), and are calculated by pyQuickBeam (Haynes et al., 2007). In Eq. (6), V(D) is the final falling velocity of raindrops considering the correction term of altitude h, which is calculated from Eq. (7) of Atlas et al. (Atlas et al., 1973):
Historical observations of the disdrometer at Hongyuna site from June to August of 2021 to 2023 are used to obtain prior information on the parameters of the MP size distribution of summer rainfall in this region. Based on the observed DSD, the corresponding Z of Ka-band radar is calculated using Eq. (5). The calculated Z values are categorized into four intervals: , [10,20), [20,30), and [30,45). The log 10(N0), Dm and Rain Water Content (RWC) in each Z interval are counted separately and illustrated in Fig. 1. In the box plot used in this paper, the box indicates the Interquartile Range (IQR, 25th–75th percentiles), the horizontal line inside the box denotes the median, and the whiskers extend to the most extreme values within 1.5×IQR. Circles denote outliers beyond the whiskers. RWC is calculated by, . Approximately 113 000 samples of DSD are collected. The results show that the distribution of the log 10(N0) ranges from 1.0 to 5.6. The majority of Dm is less than 1.7 mm. The statistical results indicate that as the Z of precipitation increases, the proportion of larger raindrops of DSD rises, and the concentration of raindrops decreases. Since the RWC is related to the 3-th moment of DSD, it increases as the rain intensity increase and exceeds on average about 0.2 g m−3 at strong echoes (30–45 dBZ).
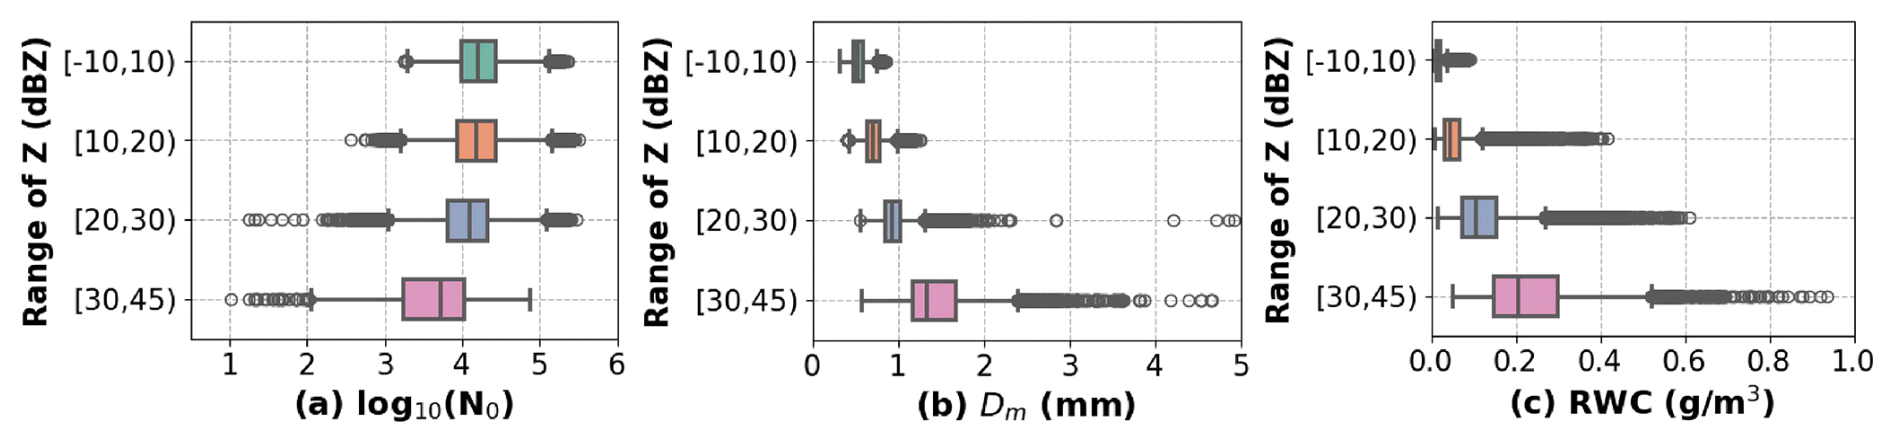
Figure 1Box plots of the parameters of MP size distribution in different Z intervals. (a) log 10(N0). (b) Dm. (c) RWC.
2.2 Ka-band zenith-pointing observation radar
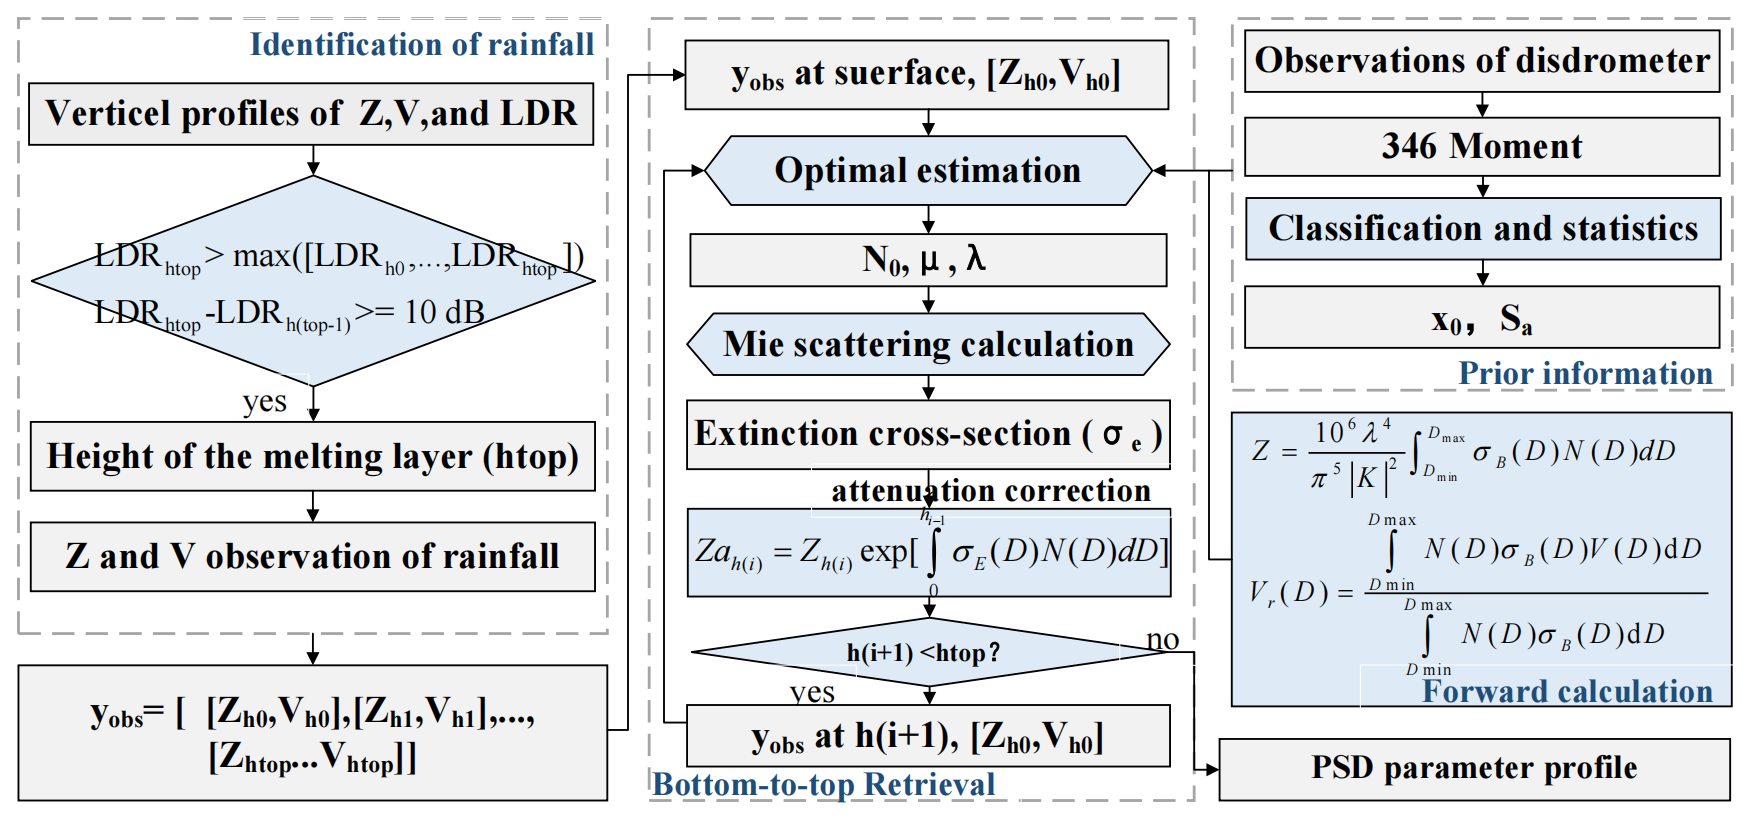
The Ka-band zenith-pointing radar operates at the frequency of 35 GHz. The observation uncertainties in Z, Vr, and LDR are 0.5 dBZ, 0.5 m s−1, and 0.5 dB, respectively. The detection range of radar is 0.12 to 20 km, with a vertical resolution of 30 m and a beam width less than 0.4°. The integration time is 60 s. To mitigate the impact of near-field uncertainties of radar observations, the seventh range gate (180–210 m) of the radar is chosen as the first effective observation at the surface, denoted as h0. The “0” of h0 refers to the index of the range gate of the effective observations of radar. When the Z measured by radar at h0, , exceeds −10 dBZ, it is identified as a precipitation scenario. The range gate of the precipitation height (htop) is determined from the bottom of the melting layer assessed by the LDR observations. The method (Thurai et al., 2016) for determining the htop is as follows:
After determining the height of the precipitation layer, the parameters of the DSD are retrieved from bottom to top. For each range gate of the radar observation, the optimal estimation method is used to retrieve log 10(N0) and Dm from Z and Vr.
The optimal estimation is a widely used physical retrieval method that iterates the maximum probability state xop of the parameters to be retrieved by combining observations, prior information, and associated uncertainties (Löhnert and Maier, 2012). The optimal estimation algorithm employed in this study is based on the publicly available code by Maahn et al. (Maahn et al., 2020). The observational vector yobs of the optimal estimation algorithm consist of the Z and Vr observed by the Ka-band zenith-pointing radar, and the state vector x comprises log 10(N0) and Dm. The first guess of xa, and a priori error covariance matrix Sa are set based on the prior information of the DSD in Hongyuan. From the precipitation cases described in Sect. 2.1, a subset of 6680 case is selected to construct the prior dataset. The dataset is obtained by stratified random sampling based on the calculated Z. This approach reduces the over representation of frequent weak precipitation samples in the prior and yields a more uniformly distributed and representative priori dataset (Boschetti et al., 2016). Then, the values of Dm are normalized since the state vector are assumed to be approximately Gaussian in optimal estimation, and statistical analysis of the dataset shows that the distribution of Dm departs from normality. After the transformation, the prior database for the retrieval is established. The mean value of log 10(N0) and Dm in the dataset is set as the first guess xa for the retrieval. The frequency distribution of log 10(N0) and normalised Dm are plotted in Fig. 2a. Sa calculated from the database are plotted in Fig. 2b. In the study, the Sa is a constant matrix, and includes correlations between N0 and Dm derived from the prior database.
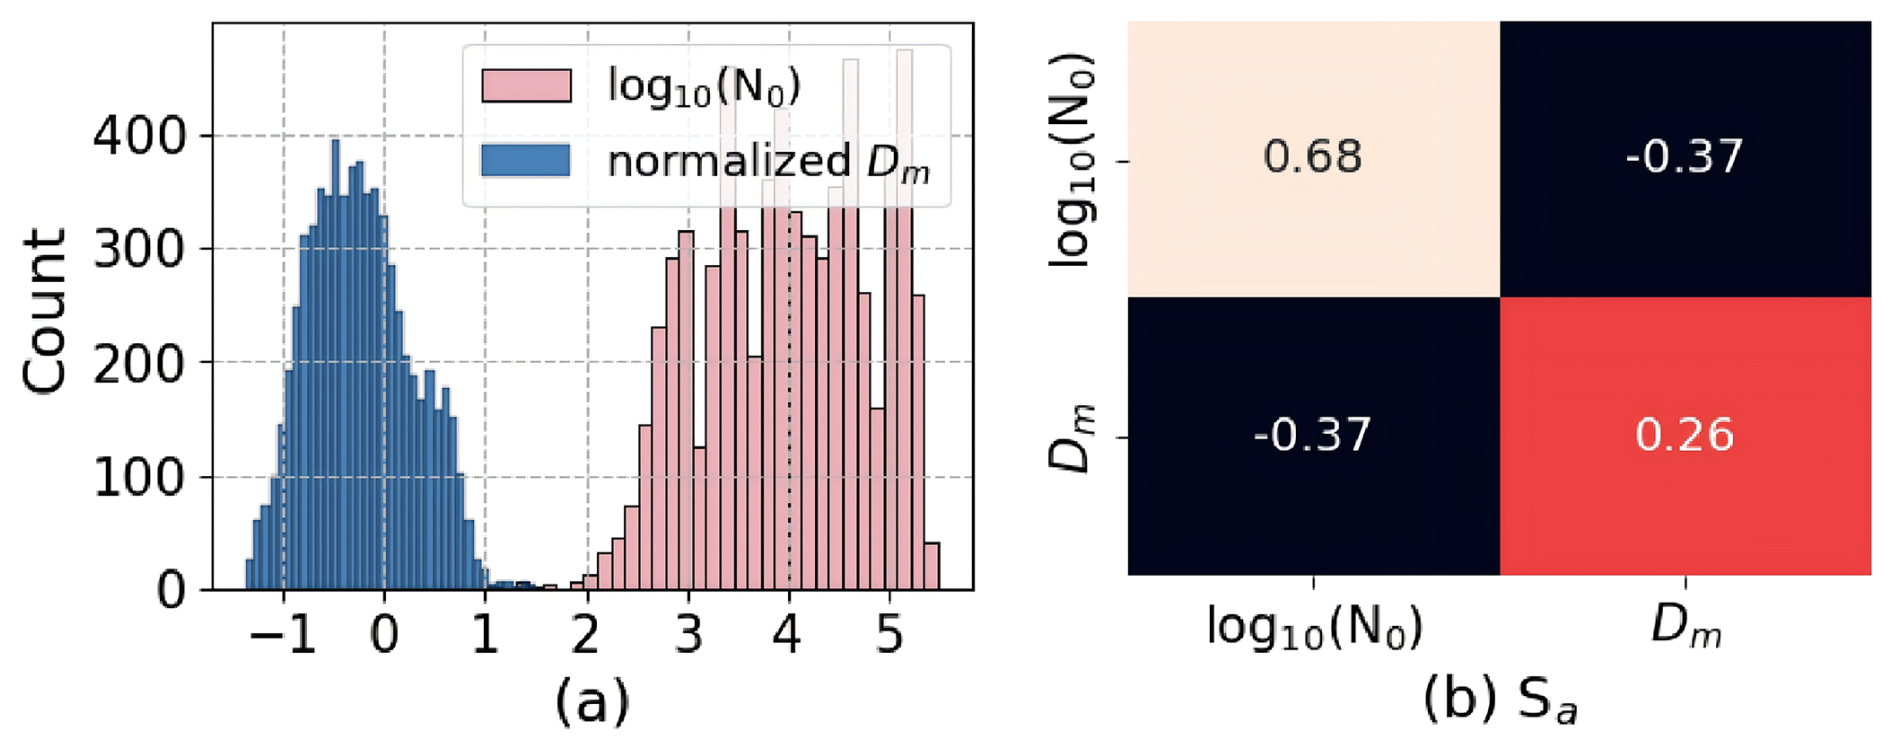
Figure 2The frequency distribution of the prior database and the heatmap of Sa used in the retrieval. (a) Frequency distribution of N0 and normalized Dm, and (b) heatmap of Sa.
The error covariance matrix Sy is set according to the observation uncertainty of Z and Vr. The measurement of Z and Vr is assumed to be uncorrelated, and the value on the diagonal of the matrix is squire of the observation uncertainty. The xa is taken as the input for Eqs. (5) and (6) to calculate the simulated observation F(xa). The Sy and Sa are then used to weight the difference of the F(xa) and yobs for updating the xa to xj+1. The subscript is the iteration index. Xj+1 is calculated by:
Where Kj represents the Jacobian matrix computed at the j-th iteration. The elements of Kj numerically computed by finite differences around the state vector at each iteration of the retrieval, the perturbation is chosen as 1 % of the state vector. The typical value of Kj indicate that the Z is sensitive to both log 10(N0) and Dm, with and on the order of 10 and 20, respectively. And Vr is almost insensitive to log 10(N0) and only affected by Dm, with and . This pattern indicates that the mainly constrains the retrieval of N0 and Dm, while Vr provides complementary sensitivity to Dm. The iteration ceases when the result of the left side of Eq. (10) falls below the predetermined threshold χ.
χ is typically set to the length of the parameters that are to be retrieved. Sj in Eq. (11) provides the uncertainty associated with the retrieved xj:
If the convergence of retrieval is achieved, the xj and Sj are the optimal solution xop and corresponding uncertainty Sop.
The retrieval process of the vertical profiles of the DSD parameters is described as follows. The temperature at is set to 287.15 K based on statistical results of temperature from the microwave radiometer at a height of 210 m in Hongyuan. Unless otherwise noted, heights throughout this paper refer to above ground level (AGL) height. The temperatures at different range gates of the radar are calculated using the temperature lapse rate. The temperature lapse rate is set to 6.5 ° km−1 (Kattel et al., 2015). The is assumed to be unaffected by the attenuation effect. The and are taken as the yobs for the optimal estimation algorithm to retrieve the log 10(N0) and Dm of the DSD at the surface. Then, the N0 and Dm at the surface are used to correct the Z of the next range gate :
where and are the attenuated and actual radar reflectivity in mm6 m−3, k is the specific attenuation in dB km−1, defined as:
Qe and σe is calculated from the drop size and temperature using the pyQuickBeam software. If the height of the following range gate, h(i+1), is less than htop, the observational vector of the next range gate is updated to . Next, the optimal estimation is used to retrieve the log 10(N0) and the Dm at h(i+1). Following this procedure, the observations of Z are corrected layer by layer, and the N0 and Dm are retrieved bottom to top. The flowchart of the retrieval method is presented in Fig. 3.
3.1 Validation of the forward calculation
The accuracy of forward calculations is crucial for the optimal estimation algorithm. The observations of the Ka-band zenith-pointing radar and the disdrometer during the field campaign are used to validate the forward calculations. The Z and Vr observed by the radar at h0 serve as the truth values, while the N(D) observed from the PARSIVAL2 disdrometer is used as the input to Eqs. (5) and (6) to calculate the simulated Z and Vr. The mean error (ME), Pearson correlation coefficient (Pearson's r), and Jensen-Shannon divergence (JSD) are employed to assess the bias between the true values and the simulated values. The ME is used to evaluate the average difference between two datasets. Pearson's r measures the linear relationship between the two datasets. The JSD quantifies the similarity in the probability distributions of two datasets (Zhang et al., 2023).
Figure 4 illustrates the true values of Z and Vr observed from the Ka-band zenith-pointing radar and simulated values from the disdrometer during the field campaign in July and August 2024. According to the assessment metrics, the true values and the simulated values of Z and Vr are in good agreement. The ME of Z and Vr is 3.48 dBZ and . The Pearson's r of Z and Vr are above 0.88. For precipitation scenarios with , the Z calculated from the ground-based disdrometer observations generally exceeds the radar measurements. For radar observations with Z≥25 dBZ, the reflectivity factors derived from disdrometer measurements are typically lower than those observed by radar. The simulations and observations for Vr less than 3 m s−1 are consistent, while for Vr exceeding 3 m s−1, the simulations tend to underestimate the values of Vr. JSD values of the simulated and observed suggest some mismatch in Z and Vr distributions. This bias is possibly due to differences in the sampling volumes of the radar and disdrometer, since the disdrometer measures the raindrop at surface and the first effective range bin of radar is at 210 m. In addtion, the wind at the surface may influence the accuracy of the measurements of the disdrometer. Furthermore, as the raindrops fall, they may deviate from the spherical shape assumption in the radar forward model, leading to discrepancy between the forward simulation and observed values.
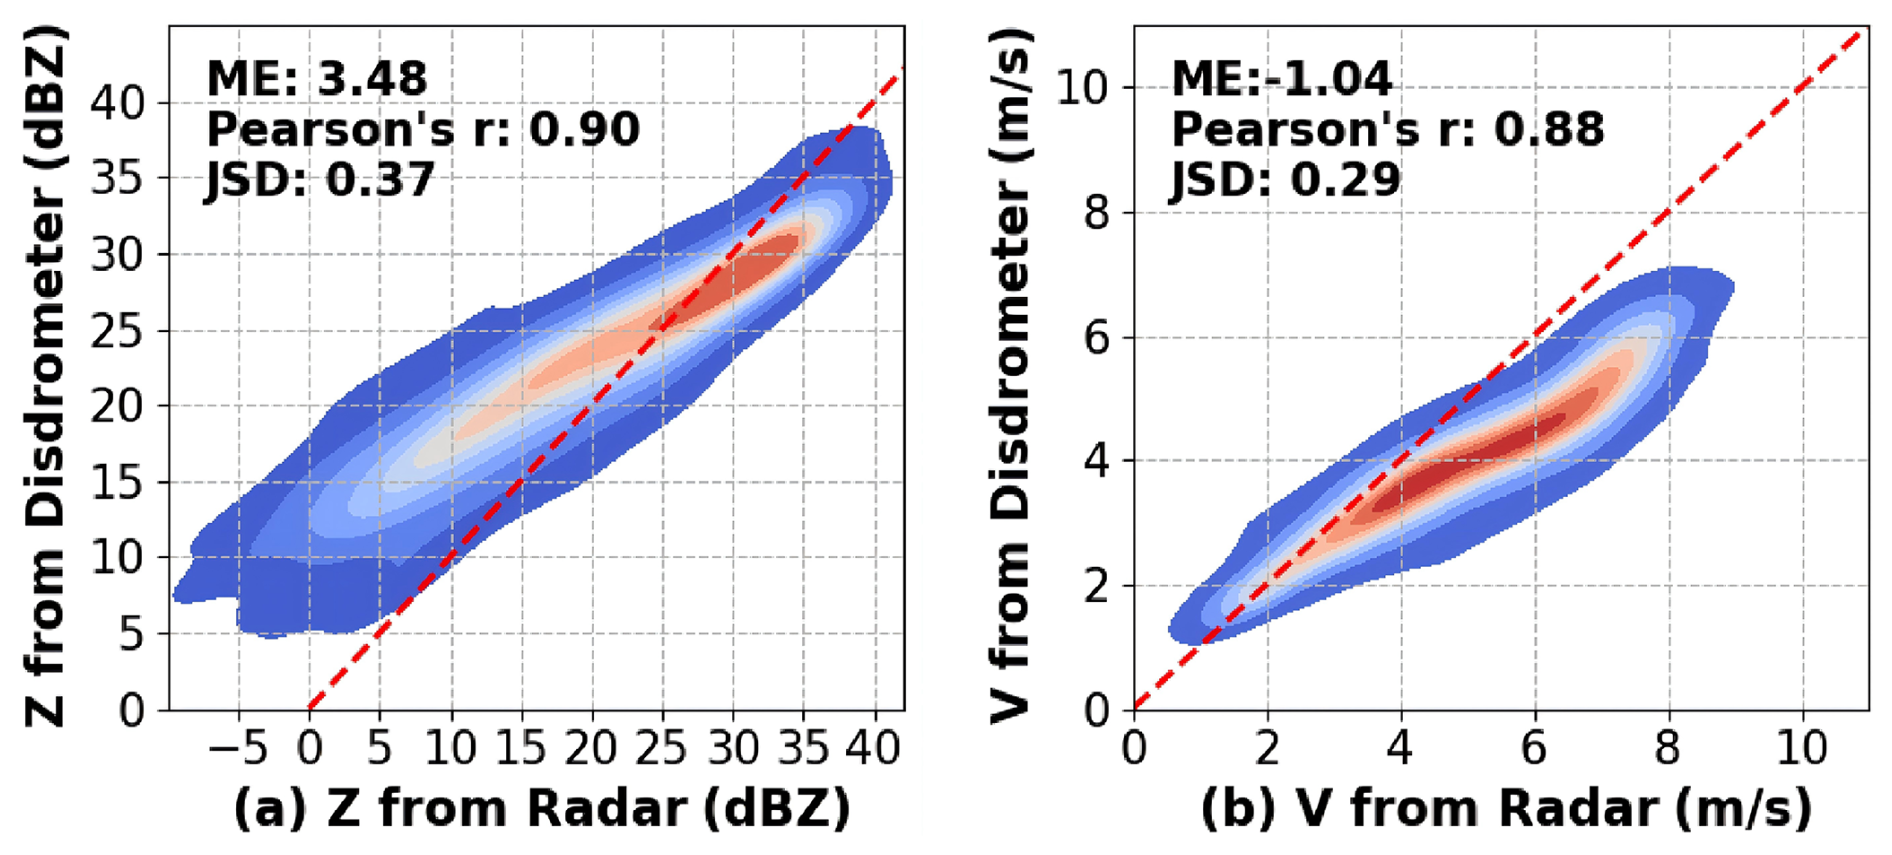
Figure 4The true values of Z and Vr observed from the Ka-band zenith-pointing radar and simulated values during the field campaign in July and August 2024. (a) Z. (b) Vr.
3.2 Validation of the optimal estimation algorithm
To validate the effectiveness of the optimal estimation algorithm, a random stratified sampling of 1800 cases of DSD is selected from the historical observations of the ground-based disdrometers. The precipitation cases were stratified according to the distribution range of N0 and Dm, and 900 cases were sampled for each of the two parameters to ensure that the validation data covered a relatively comprehensive precipitation scenario. Random noise within 0.5 dBZ and 0.5 m s−1 is added to the values of Z and Vr, which are calculated from the selected DSD cases with Eqs. (5) and (6). Then the Z and Vr are taken as the input for the optimal estimation algorithm to retrieve the log 10(N0) and Dm of DSD. The log 10(N0) and Dm derived from the selected DSD with Eq. (3) are taken as the true values of the retrievals. The final value of Sx after retrieval convergence is indicated by error bar in the figure. The comparison of the retrieved values and the true values of log 10(N0) and Dm is presented in Fig. 5. The average bias of the retrieved log 10(N0) and Dm is −0.056 and 0.015 mm, with the average uncertainties of 0.41 and 0.15 mm. The correlation between the retrieved values and the true values of log 10(N0) and Dm both exceeds 0.9. The JSD values of 0.08 and 0.16 indicate a good consistency between the distributions of the retrieved values and the true values of log 10(N0) and Dm. The source of the retrieval errors may be attributed to the random noise added to the Z and Vr. Furthermore, the errors of the retrieval are primarily observed in scenarios where the Dm values exceeded 2.5 mm and the log 10(N0) value is less than 2.6. This may be attributed to the lack of prior information in these cases.
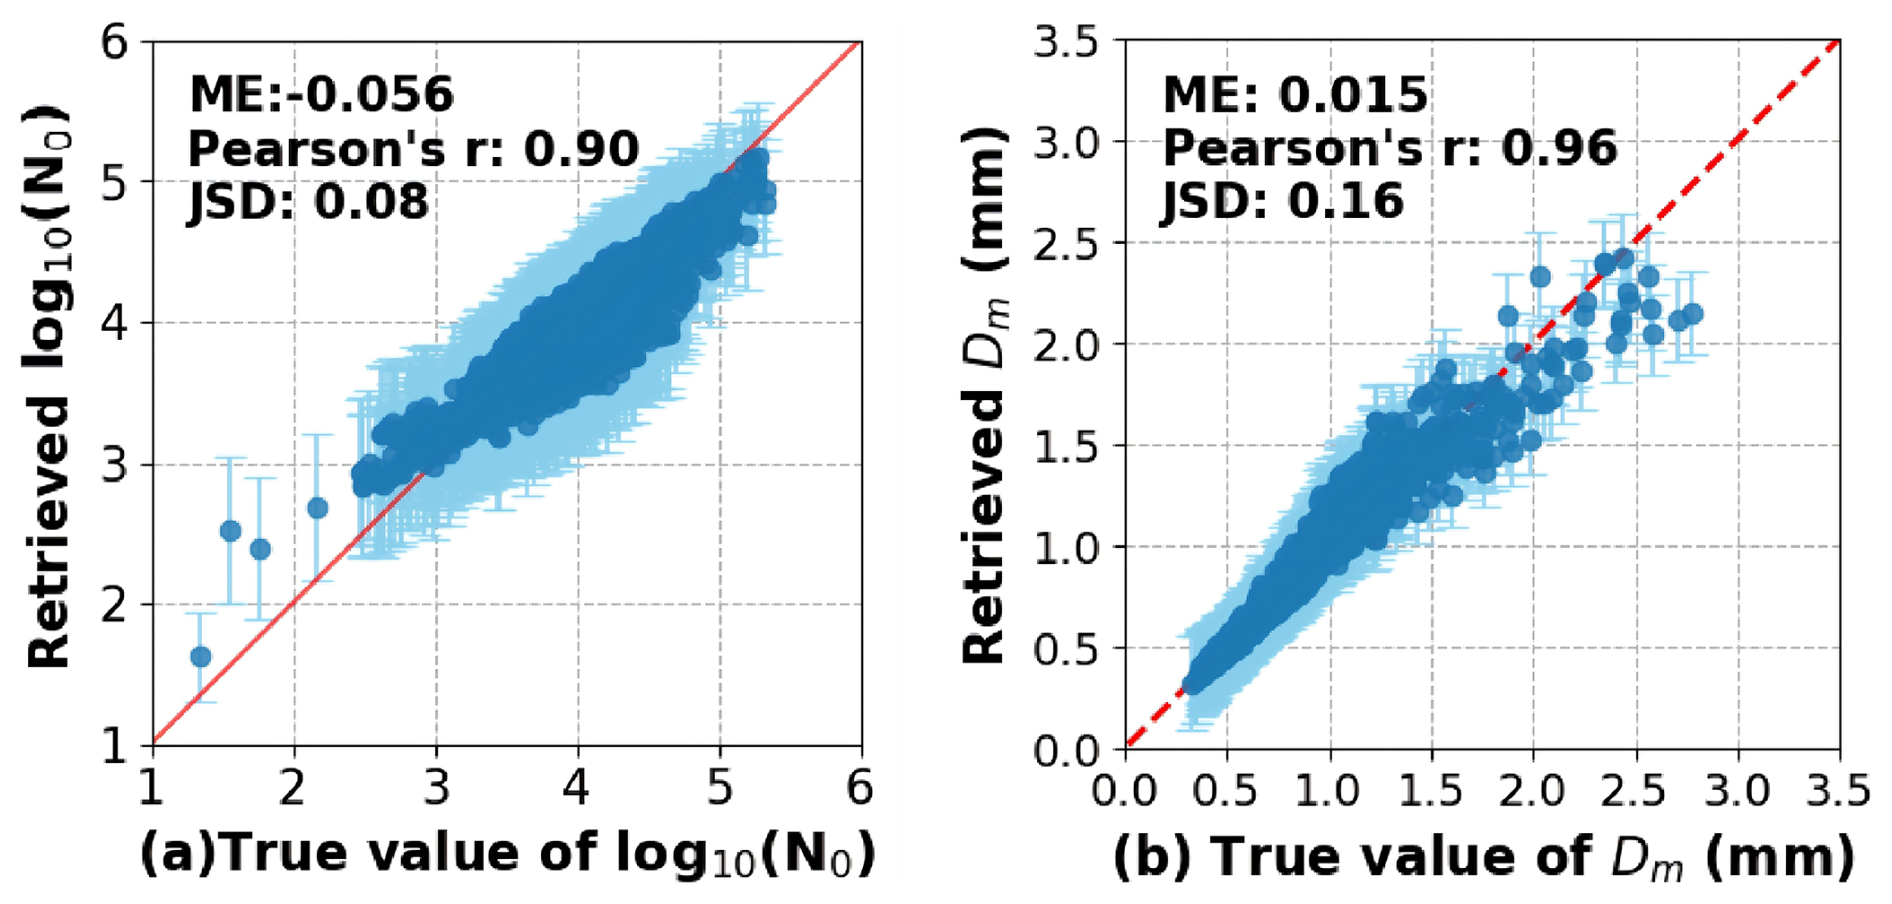
Figure 5The retrieved values and the true values of log 10(N0) and Dm. (a) log 10(N0). (b) Dm.
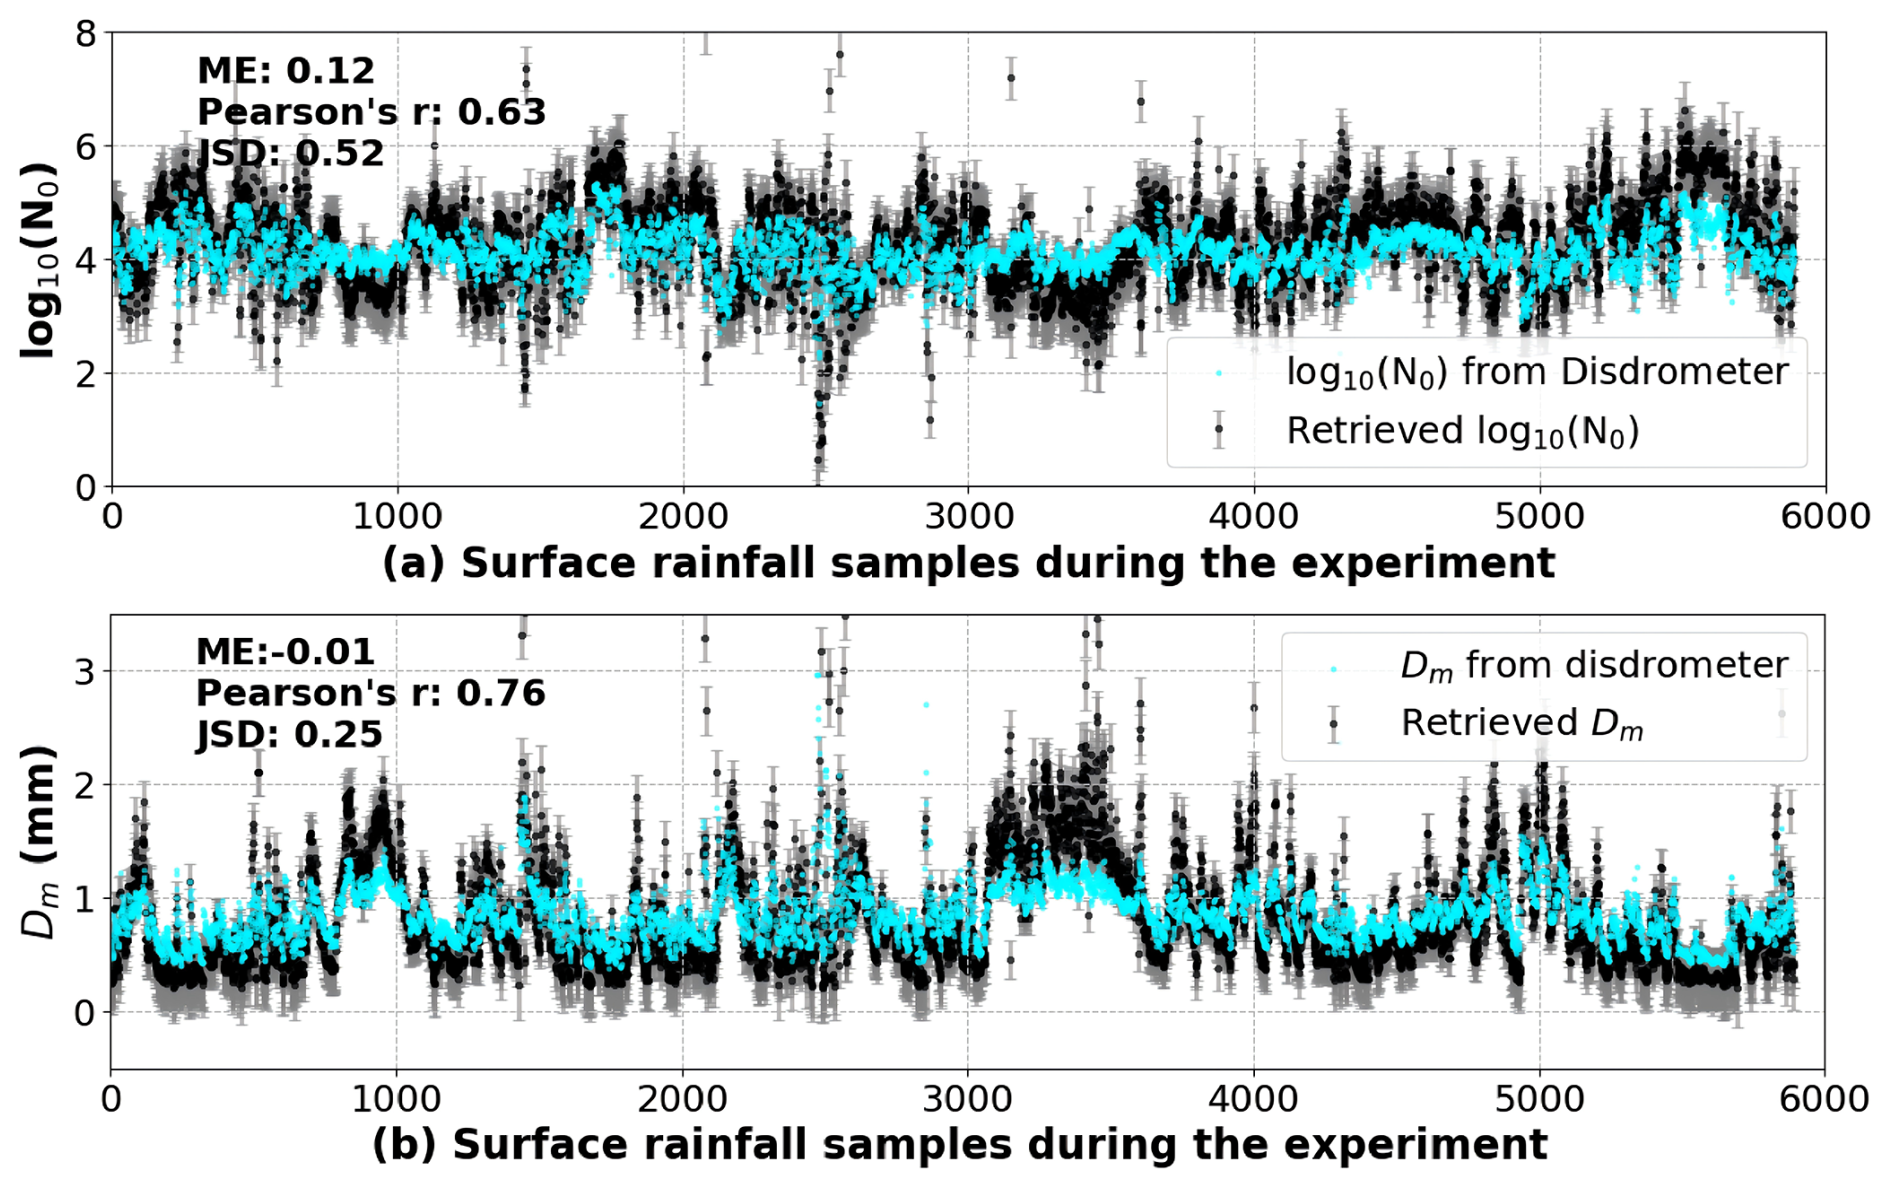
Figure 6The retrieved and observed log 10(N0) and Dm during the field campaign in July and August 2024. (a) log 10(N0). (b) Dm.
The optimal estimation algorithm is further validated with the observations from the Ka-band zenith-pointing radar and the ground-based disdrometer in Hongyuan during the field campaign in July and August 2024. The Z and Vr observed by radar at h0 are used as inputs for the optimal estimation algorithm. The log 10(N0) and Dm derived from the disdrometer are used for the comparison. Approximately 5900 effective observations of the radar and the disdrometer of precipitation are used for the validation. In Fig. 6, the retrieved values from the optimal estimation algorithm are denoted with black points, while the uncertainties of the retrieval are indicated by error bars in gray. The parameters of DSD derived from the disdrometer observations are marked with blue points. The correlation coefficients between the retrieved and the derived log 10(N0) and Dm are 0.63 and 0.76. The ME of the retrieved and the derived log 10(N0) and Dm are 0.12 and −0.01 mm, and average uncertainties are 0.41 and 0.16 mm, respectively. Most of the log 10(N0) and Dm values derived from the disdrometer are within the uncertainty range of the retrievals. The JSD values indicate that the retrieved Dm values are consistent with the distribution of the observations of the ground-based disdrometer. The bias between the retrieved and observed parameters of DSD may be attributed to the observational uncertainties and the differences in the sampling volumes of the two instruments, as well as errors introduced when fitting the DSD parameters. More importantly, based on the validation of the radar forward calculation, there is a bias between the radar observation and simulation. Physical assumptions in the scattering calculations, such as the spherical-drop approximation, may also contribute to discrepancies between the retrieved values and the surface DSD parameters.
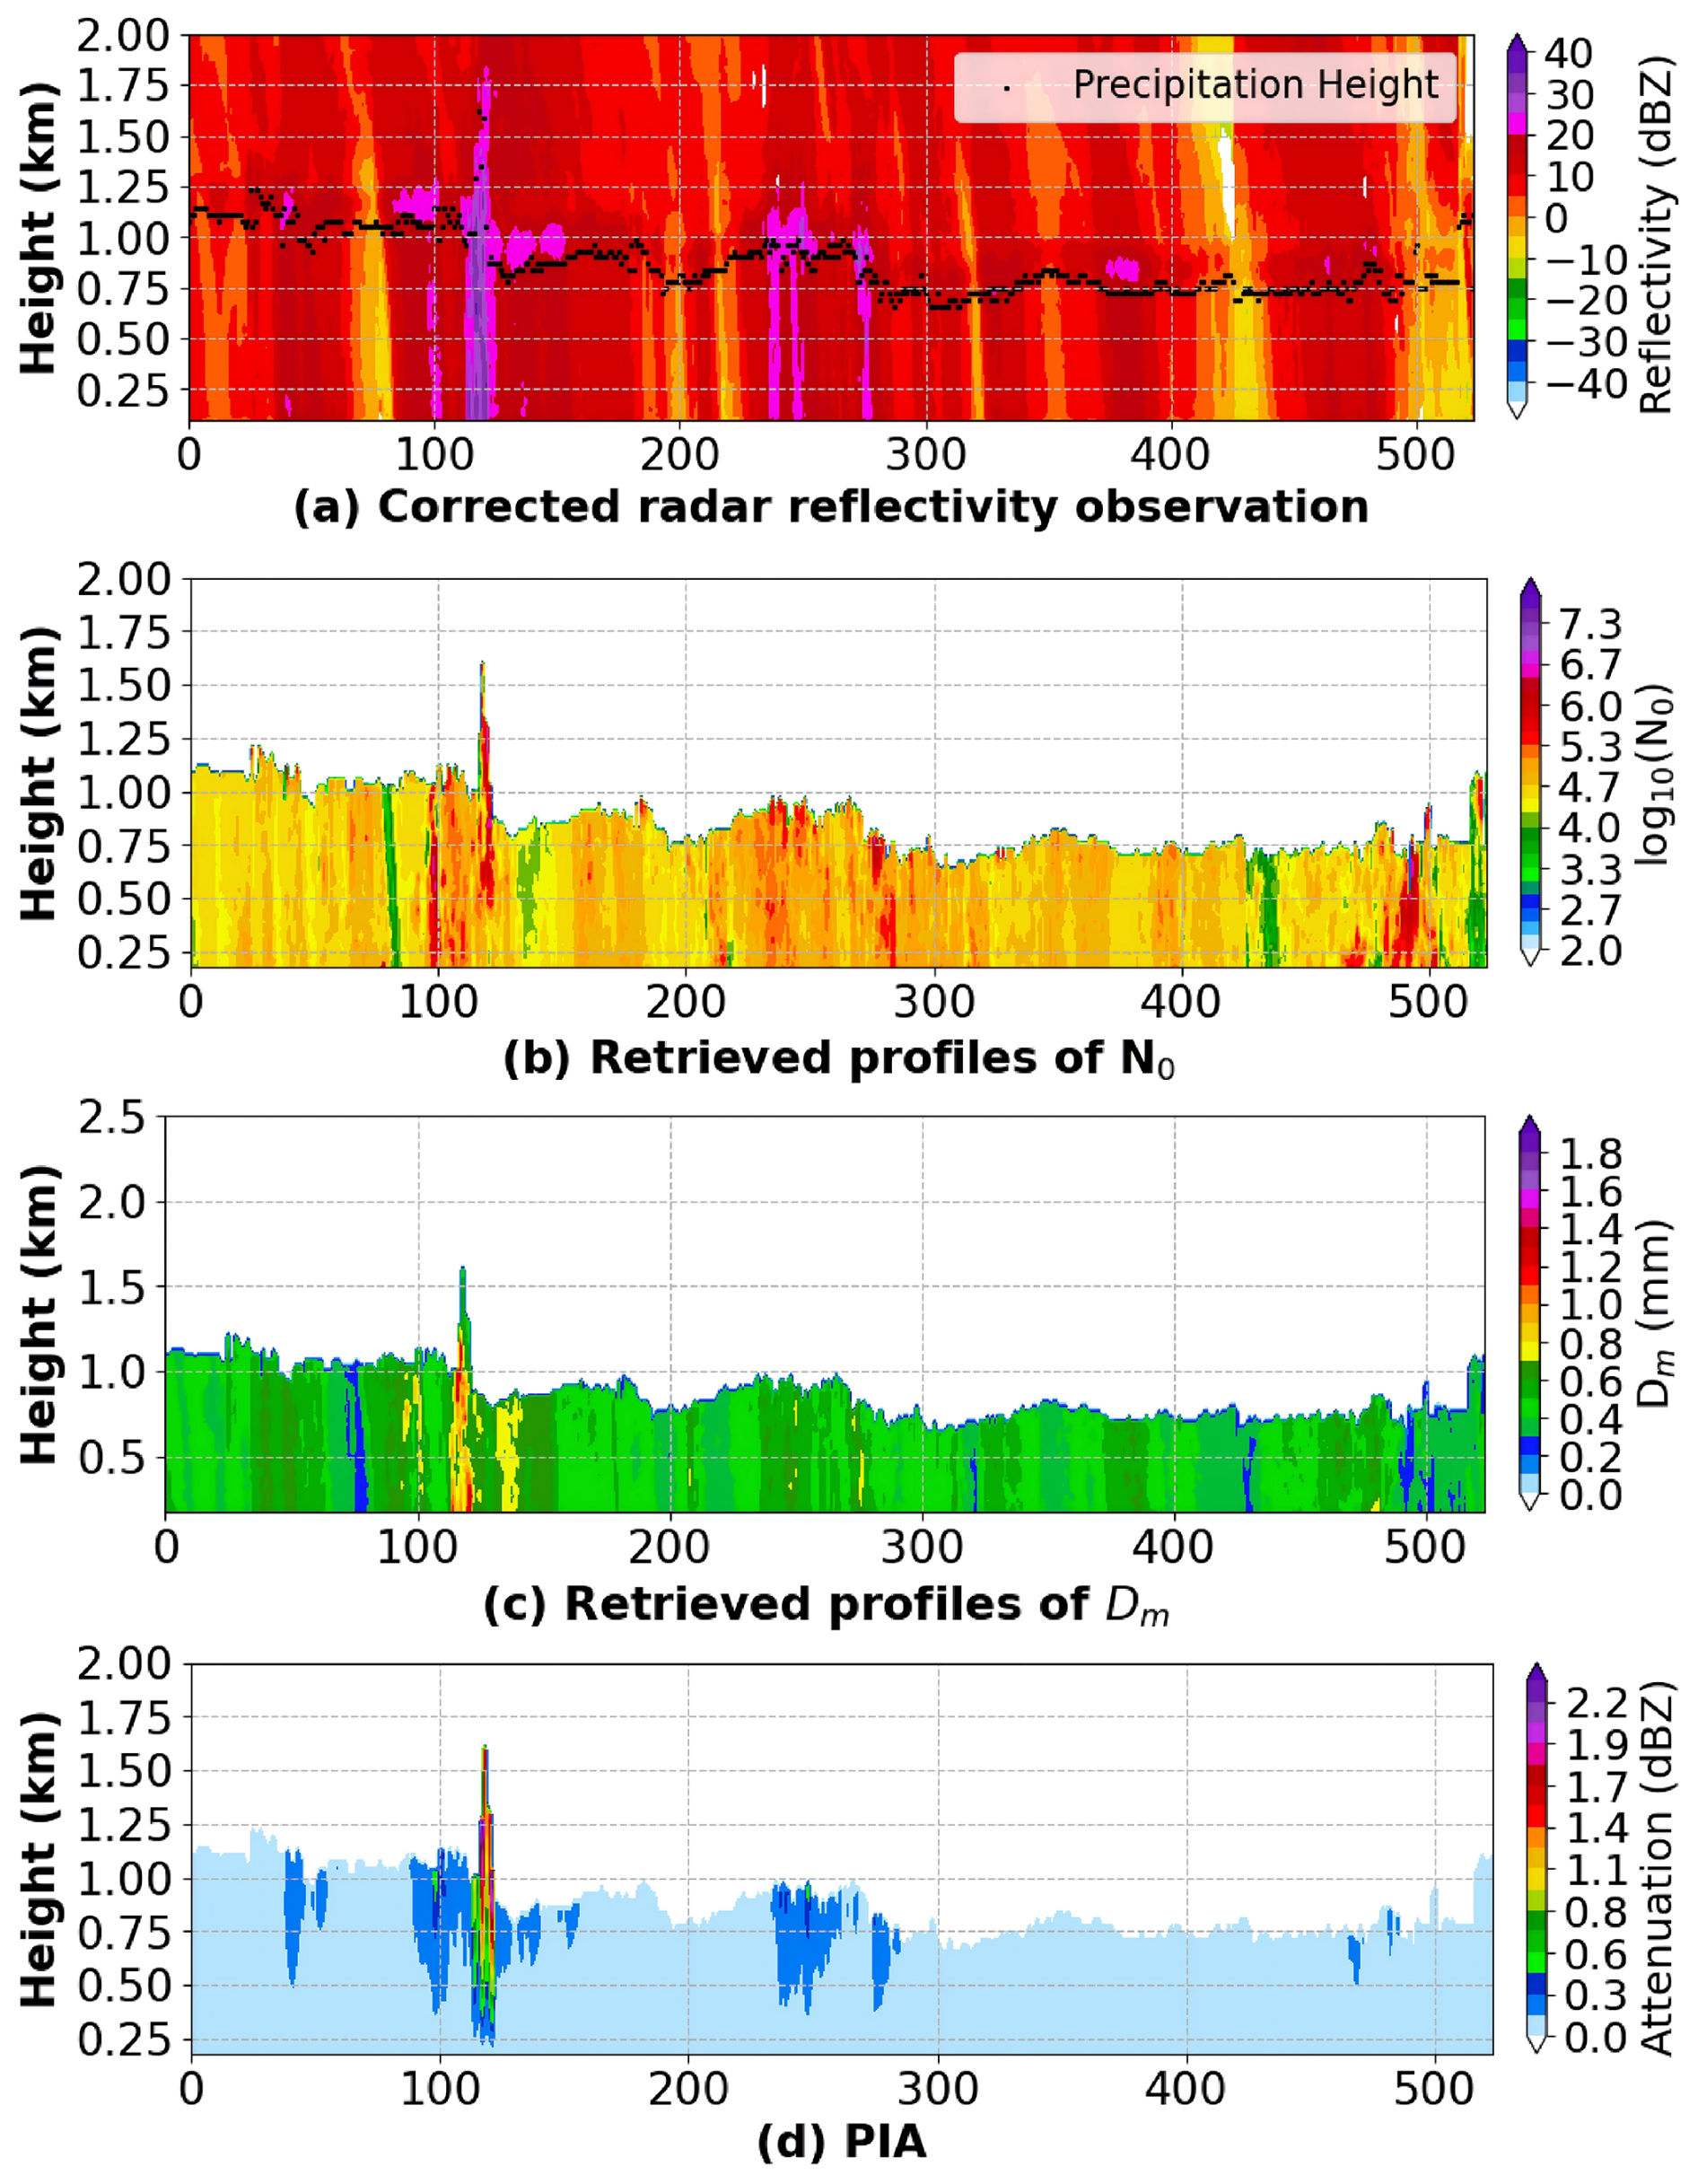
Figure 7Profiles of the attenuation-corrected Z, the retrieved profiles of DSD parameters, and PLA of the precipitation on 15 August 2024. (a) Z. (b) log 10(N0). (c) Dm and (d) PIA.
4.1 Case analysis
Figure 7 presents the attenuation-corrected profiles of Z for the precipitation on 15 August 2024, along with the retrieved vertical profiles of DSD parameters. The path-integrated attenuation (PIA) is also plotted in the figure. The precipitation events occurred from China Standard Time (CST) 00:00 to 08:12 and from CST 10:08 to 12:04, totaling 517 min. The retrieved profile of DSD parameters demonstrates a close correlation with the process of precipitation. According to the profiles of Z, the AGL height of the melting layer increased around the 110th to 120th samples of precipitation, with echo intensity exceeding 35 dBZ, indicating potential convective activity accompanying the precipitation. Based on the statistic results of lighter rain (maximum value of Z under 30 dBZ) and heavier rain (maximum value of Z exceed 30 dBZ) in this day, the retrieved profiles of log 10(N0) suggest a higher raindrop concentration in the upper levels of precipitation. At top of the precipitation layer, the mean value log 10(N0) is 5.3 for heavier rain and 4.7 for lighter rain, and the mean of Dm is 0.65 and 0.46 mm. For heavier rain, the vertical variation of the retrieved N0 and Dm is larger compared to other precipitation samples, the mean absolute value of is 0.01 for log 10(N0) and 0.002 for Dm. For lighter rain, the value of log 10(N0) and Dm is 0.009 and 0.001, respectively. Samples 480 to 500 occurred at the end of a brief rainfall in the morning. The maximum value of Z is below 20 dBZ. The retrieved profiles of log 10(N0) were generally larger than those of other precipitation samples, while the retrieved profiles of Dm indicated smaller raindrop sizes. Based on the calculated PIA and the retrieved Dm profiles, the attenuation is attributed to larger-sized raindrops, with more than 2.6 dB km−1 of attenuation observed in the upper levels of the convective precipitation.
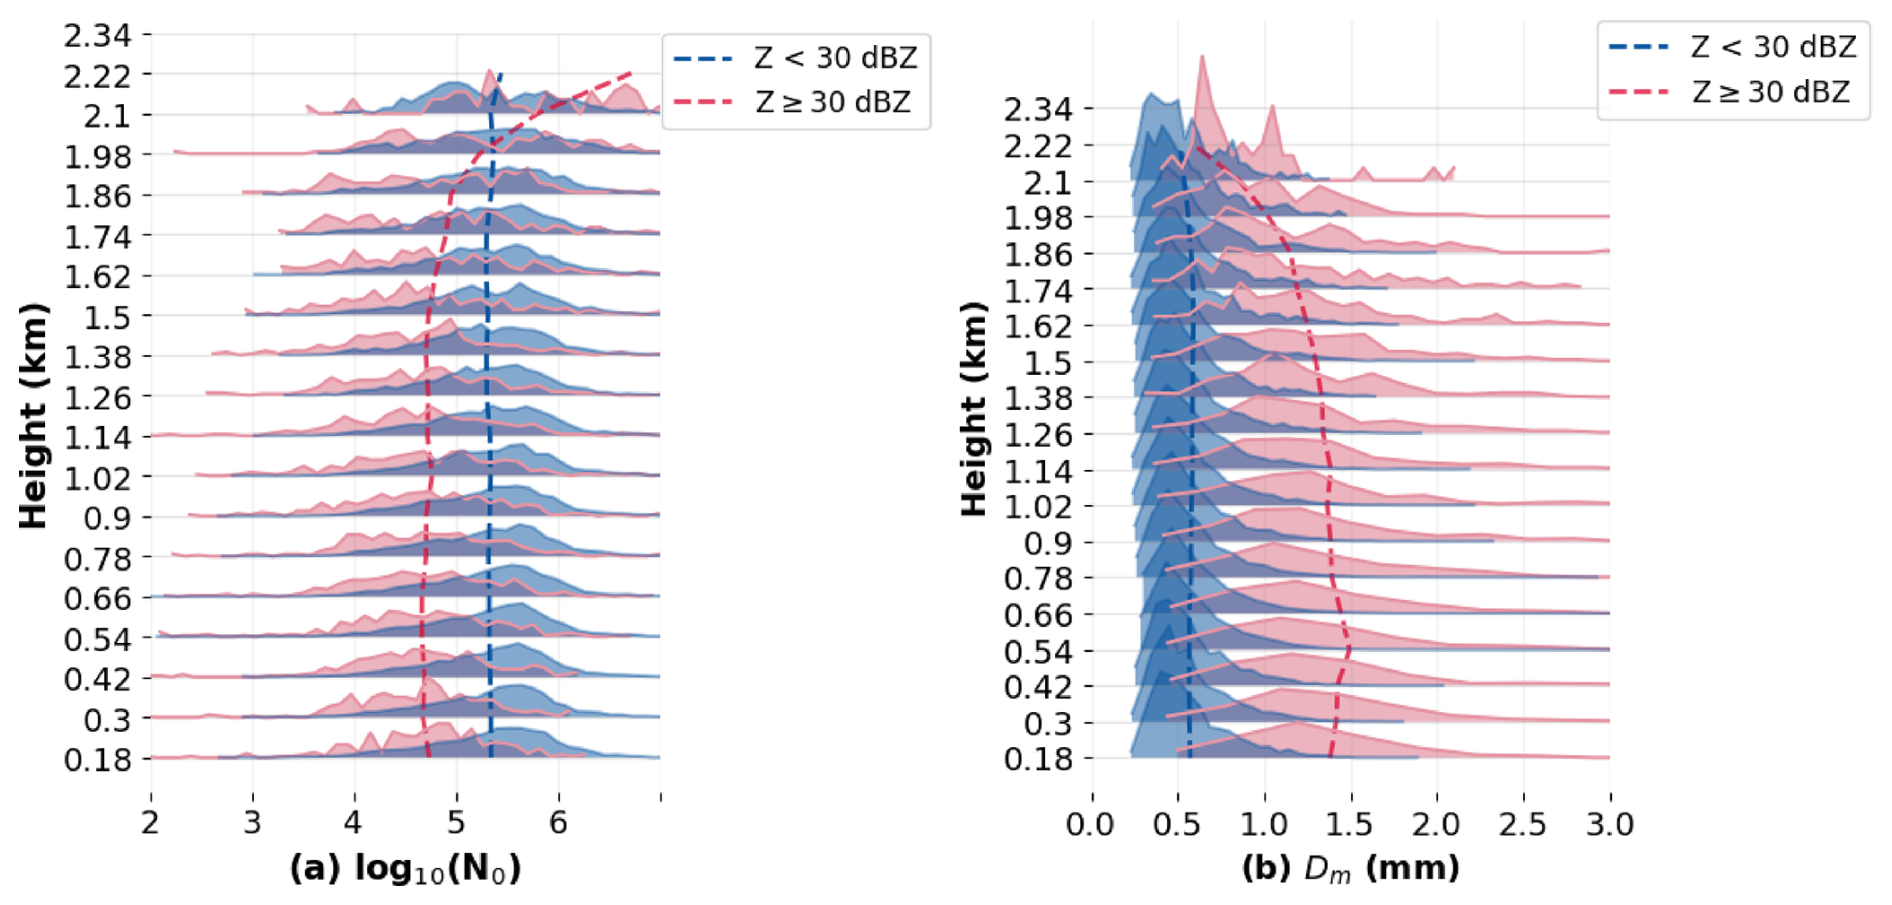
Figure 8The distribution and the mean values of DSD parameters with height during July to August 2024 at Hongyuan. (a) log 10(N0). (b) Dm.
4.2 Characteristics of the vertical profiles of DSD parameters
Figure 8 presents the distribution and the mean values of DSD parameters with height during July to August 2024 at Hongyuan. The maximum Z in the profile is used as an indicator of the heavy precipitation. If the indicator is larger than or equal to 30 dBZ, the precipitation sample is identified as heavy precipitation. As shown in Fig. 8a, the mean values of the log 10(N0) for heavy precipitation are notably higher above 2 km, indicating a larger particle concentration at higher altitudes of heavy precipitation. At altitudes below 1.9 km, the mean values of the log 10(N0) are lower than those of other lighter precipitation. This is consistent with the prior information that the particle concentration is lower in heavy precipitation. The mean values of log 10(N0) and Dm for lighter precipitation show vertical variation. According to the statistical results for the Dm parameter, the mean values of Dm for both heavy and lighter precipitation above 2 km are approximately 0.5 mm. This may suggest that raindrops begin to detach from the cloud layer (Barthazy et al., 1998). The mean Dm for heavy precipitation is generally larger than lighter precipitation, and increases as the raindrops fall, reaching a peak at around 0.5 km. This may relate to the equilibrium of coalescence and breakup effects of raindrops during their falling process (Gatlin et al., 2018).
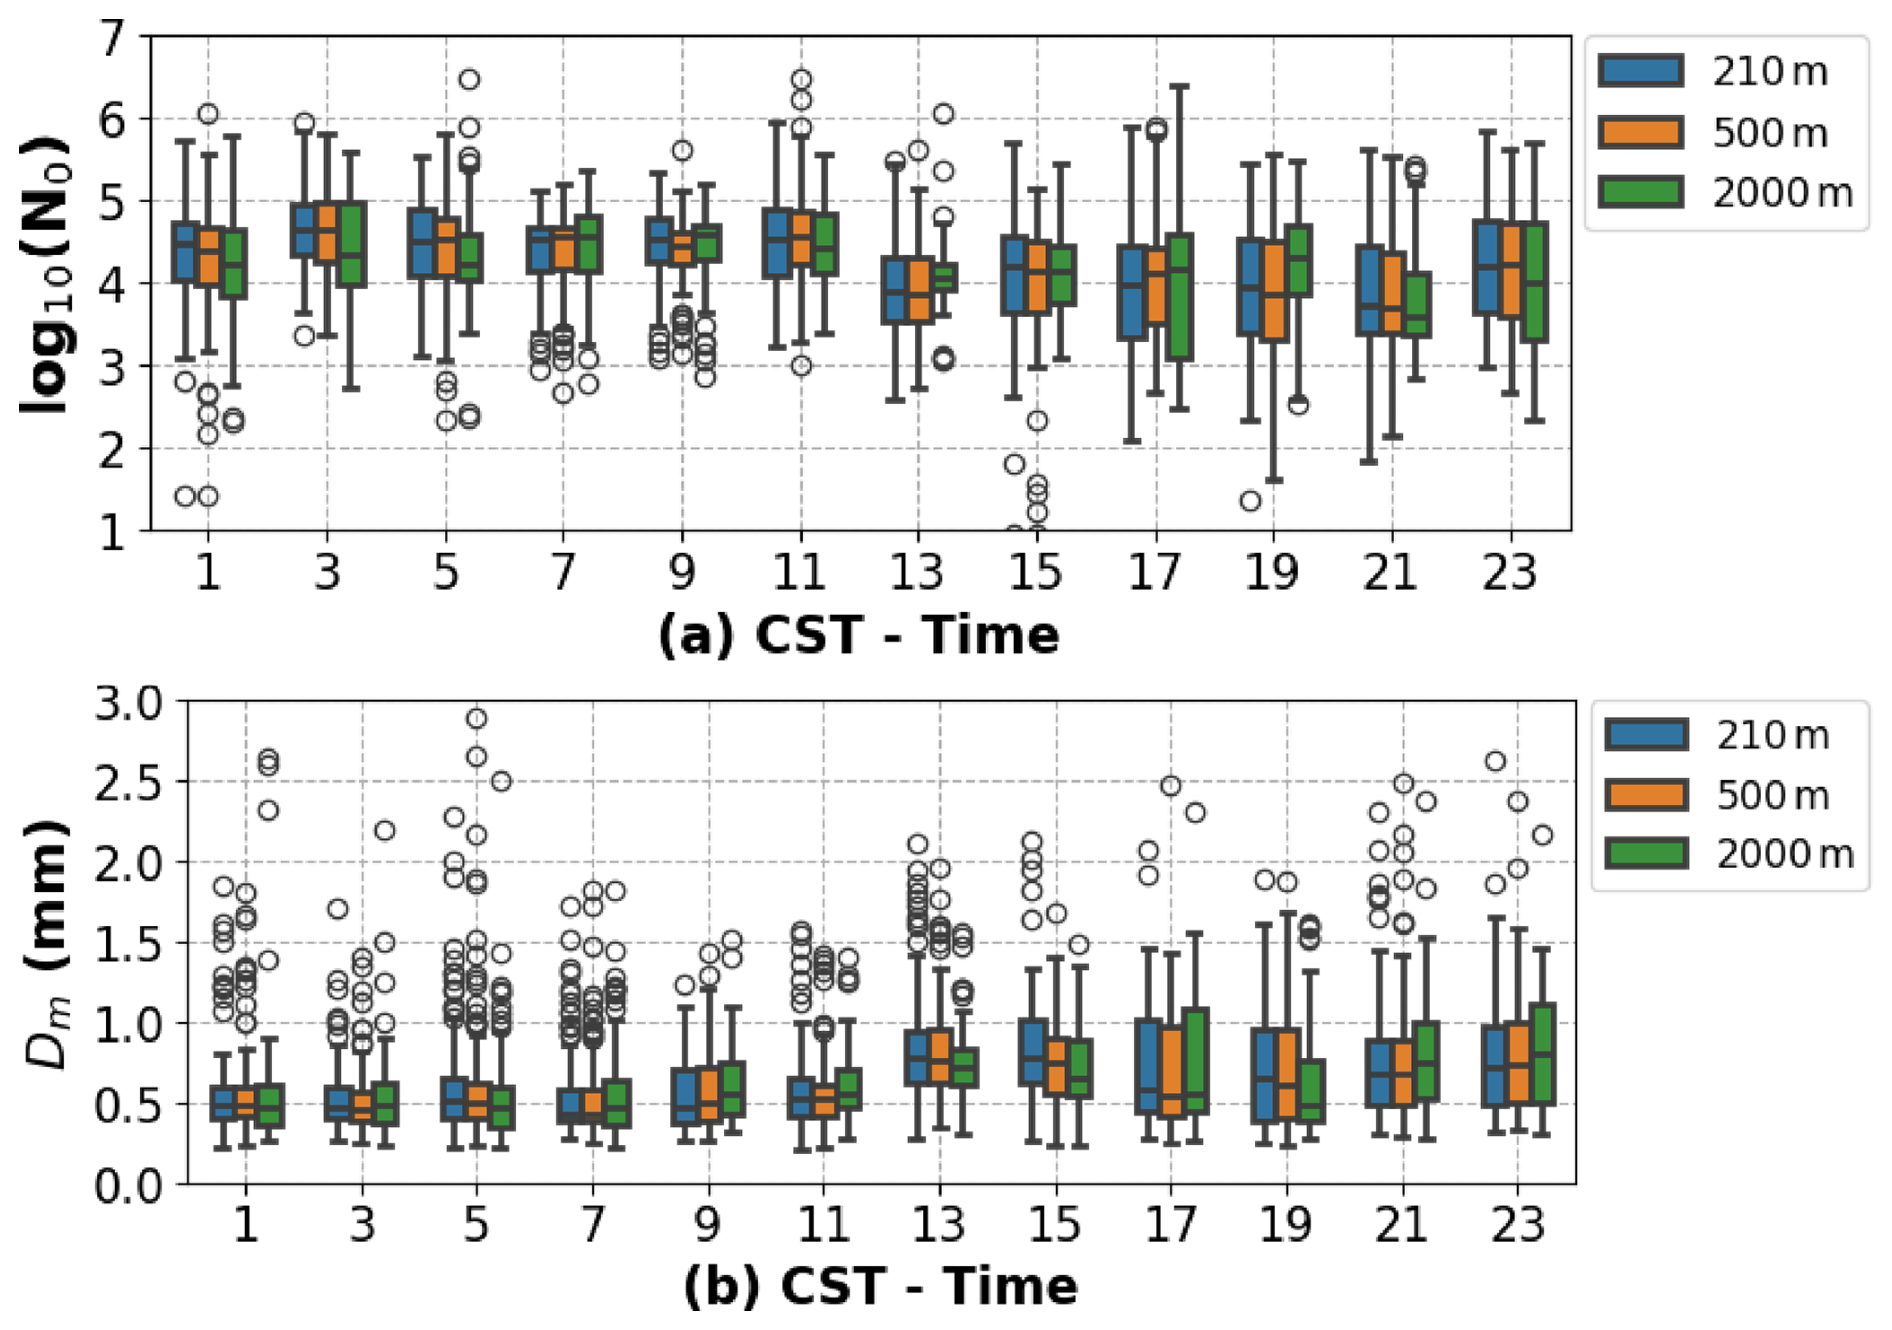
Figure 9 presents the diurnal distribution of DSD parameters at heights of 210, 500, and 2000 m. The daytime in the Hongyuan region is longer than the nighttime in summer. The sunrise occurs around 06:20 CST in the morning, and the sunset around 20:30 CST. Usually, the precipitation intensity in this area in the afternoon is higher than that after the cooling at nighttime (Liu and Yin, 2001). The broader distribution for the log 10(N0) and Dm parameters exhibits around 17:00 CST, likely associated with the convective precipitation that occurs during the afternoon. The mean value of the log 10(N0) parameter at three different heights between 12:00 and 22:00 CST is lower than other times. This may relate to prior information on the DSD, which suggests that heavy precipitation typically has lower log 10(N0) values. The Dm have larger mean values between 13:00 and 24:00 CST at three different heights, indicating that the sizes of raindrops are generally smaller during the nighttime. This is consistent with the previously summarized features of DSD of lighter precipitation.
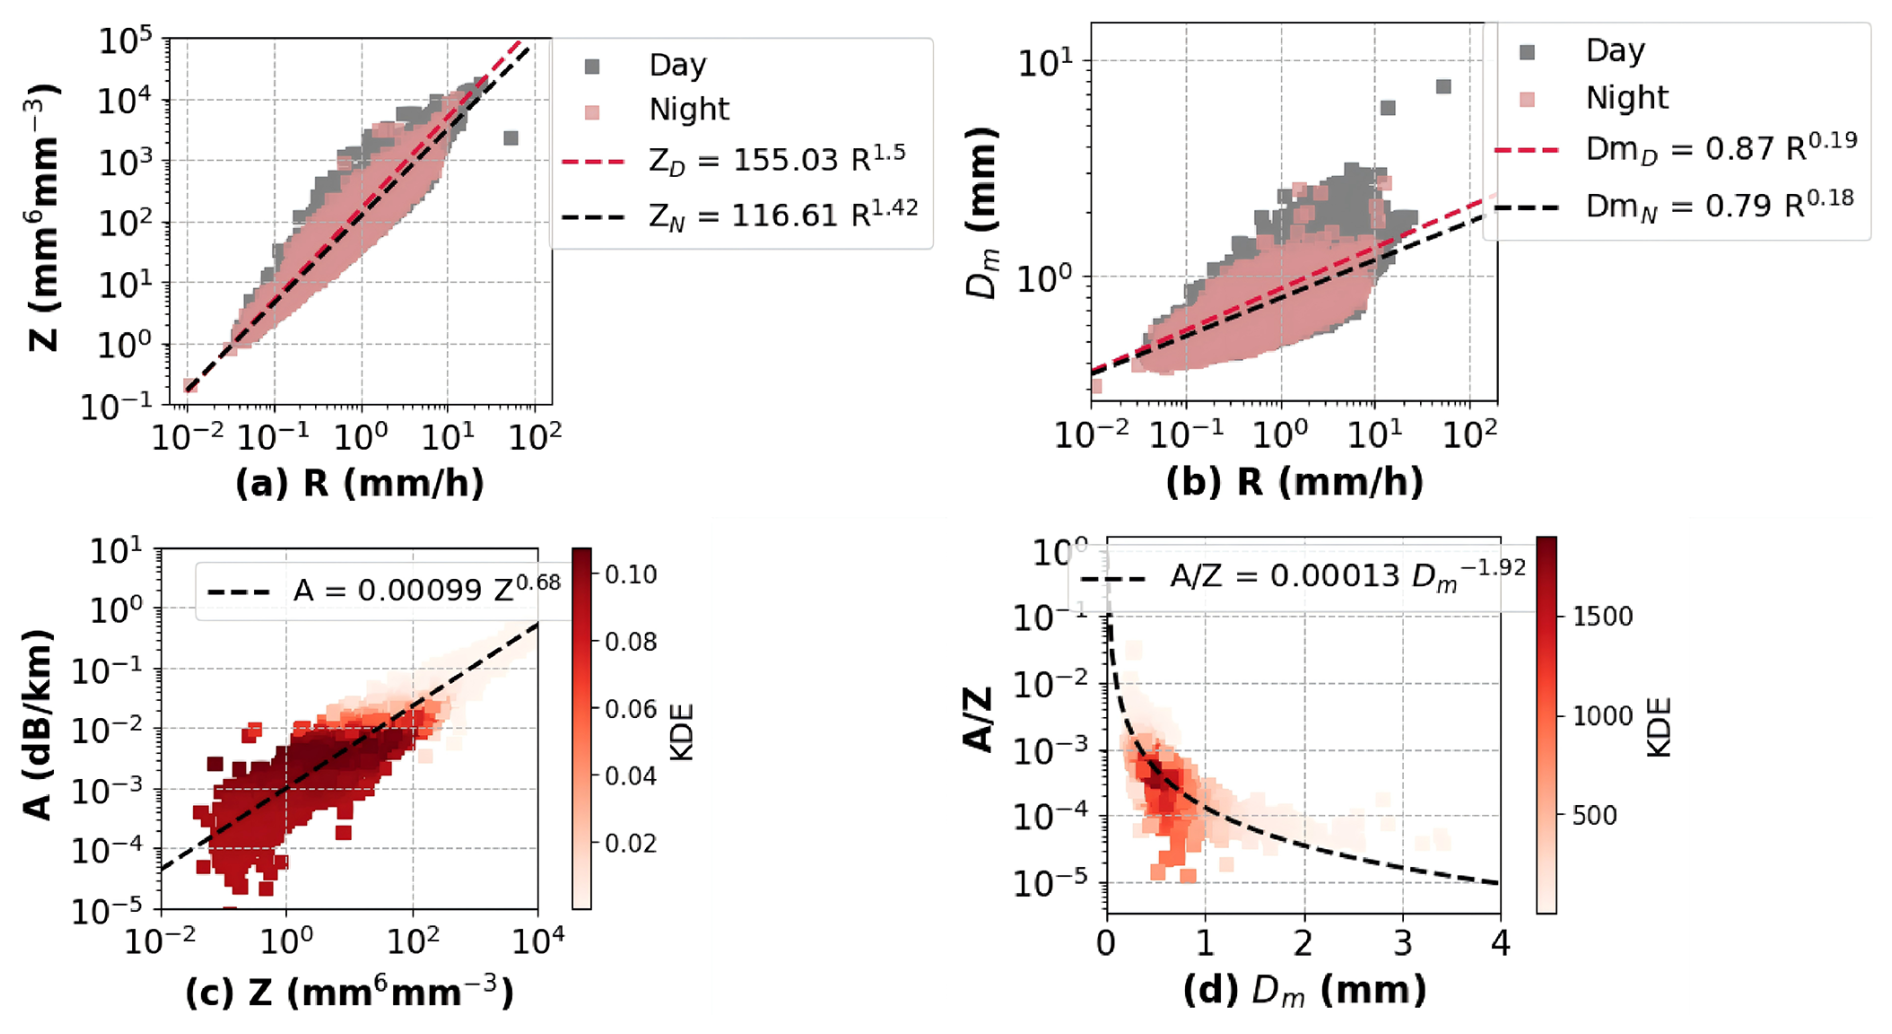
Figure 10Empirical relations for QPE and attenuation correction using Ka-band radar in the eastern Tibetan Plateau. (a) Z-R relation. (b) Dm-R relation, (c) Z-A relation. (d) Dm- relation, where A refers to the specific attenuation in dB km−1, Z in mm6 m−3.
Compared with the lower reaches of the Yangtze River and the precipitation centers in South China, the melting layer of summer rainfall in the eastern Tibetan Plateau is lower, distributed from 0.72 to 2.1 km. The mean value of Dm is approximately 0.6–1.0 mm smaller (Huo et al., 2019; Li et al., 2024). Due to the differences in the features of the DSD parameters in the eastern Tibetan Plateau, empirical relationships for Z-R and Dm-R for QPE using Ka-band radar during summer days and nights are fitted, as shown in Fig. 10a and b. According to the fitted empirical relationships, for the same value of R, the proportion of large raindrops in daytime precipitation is higher. Additionally, the Z-A relationship and the Dm- relationship that applied single-frequency Ka-band radar to retrieve the precipitation parameters are fitted, as depicted in Fig. 10c and d. The fitted coefficients of the Z-A and the Dm- relationship in the eastern Tibetan Plateau are compared with the empirical relationships obtained from the OceanRAIN database at all latitudes (Protat et al., 2019). The results indicate that for a measured Z, the specific attenuation is smaller, which is consistent with the smaller raindrop size in the eastern Tibetan Plateau.
Using observations from the Ka-band zenith-pointing Doppler radar and the ground-based disdrometer deployed in Hongyuan, the spatiotemporal characteristics of the vertical profiles of DSD parameters in the eastern Tibetan Plateau during summer are studied. A method based on optimal estimation theory is developed for retrieving the vertical profiles of DSD parameters from a Ka-band zenith-pointing radar. The method corrects the attenuation layer by layer, and retrieves the log 10(N0) and Dm of the precipitation layer from bottom to top. The uncertainty estimation for the retrieval is provided based on the optimal estimation theory. The effectiveness of the optimal estimation algorithms is demonstrated using approximately 5900 synergistic observations from the disdrometer and the Ka-band zenith-pointing radar during the field campaign in the summer of 2024. The average bias of the log 10(N0) derived from the ground-based disdrometer and the retrieved values from radar observations is 0.12, while the average bias in Dm is −0.01 mm, most of the values observed by the disdrometer falling within the uncertainty range of the retrievals.
According to the retrieved vertical profiles of DSD parameters, the heavy rainfall in this region has higher particle concentration above 2.0 km and a larger particle size at all heights on average. The mean values of Dm are approximately 0.5 mm above 2.0 km. For heavy precipitation, the particle size increases as the raindrops fall, reaching a peak at around 0.5 km. At the bottom of the heavy rainfall, the mean log 10(N0) is lower than that of lighter precipitation, which is consistent with the prior information derived from the ground-based disdrometers.
In Hongyuan, heavy precipitation primarily occurs between 13:00 and 23:00 CST. During this period, the mean value of log 10(N0) is lower, and Dm is larger. A broader distribution of the log 10(N0) and Dm is observed around 17:00 CST, likely associated with the convective precipitation that occurs during the afternoon. The precipitation after nighttime cooling generally has smaller particle sizes and higher particle number concentrations.
To enhance the accuracy of quantitative precipitation estimation and radar retrieval algorithms in the eastern Tibetan Plateau, Z-R and Dm-R relationships suitable for both daytime and nighttime conditions are fitted. In addition, to improving the accuracy of precipitation parameter retrieval using Ka-band radar in the eastern Tibetan Plateau, Z-A and the Dm- relationship are fitted. The parameter features of the fitted empirical relationships are consistent with the smaller raindrop size observed in the eastern Tibetan Plateau.
Due to the limited information provided by the single-frequency Ka-band radar, this study employed the M-P drop size distribution to avoid the errors introduced by the assumptions and empirical relationships of the GMD in the retrievals. Further evaluation is required to assess the impact of parameterizing the DSD on retrieval accuracy. The DSD characteristic of warm-rain and cold rain is an important topic, and it should be studied in future work. In addition, the retrievals performance and microphysical characteristics under intense convective conditions are not considered, and raindrops are assumed to be spherical in the radar forward model. Further research is necessary regarding retrievals assumptions in these scenarios with Ka-band zenith-pointing radar, such as the treatment of raindrop shape and DSD parameterizations in the retrieval.
Data and code are available at Zenodo: https://doi.org/10.5281/zenodo.15827786. The repository includes the processed datasets and Python scripts necessary to reproduce the figures and results presented in this paper. The raw data are available from the author upon request (penny1000@163.com).
Conceptualization, PD and XJ; methodology PD, XJ, JZ, and GG; project administration, XJ, XZ and YD; writing – original draft preparation, PD; writing – review and editing XJ, CH, LL, SL, and LB; funding acquisition, JX and YD. All the authors contributed to the discussion.
The contact author has declared that none of the authors has any competing interests.
Publisher's note: Copernicus Publications remains neutral with regard to jurisdictional claims made in the text, published maps, institutional affiliations, or any other geographical representation in this paper. The authors bear the ultimate responsibility for providing appropriate place names. Views expressed in the text are those of the authors and do not necessarily reflect the views of the publisher.
We thank our colleagues for their assistance during the field campaign.
This work has been supported by the National Key Research and Development Program of China (grant no. 2023YFC3007501), the Sichuan Science and Technology Program (grant no. 2025YFNH0006), the Sichuan Natural Science Foundation for Young Scholars (grant no. 2026NSFSC1095), the Sichuan Provincial Central Leading Local Science and Technology Development Project (grant no. 2024ZYD0175), and the Southwest China Artificial Weather Modification Capability Construction (Sichuan) Research and Experimental Project (grant no. SCIT-ZG(Z)-2024100001-2).
This paper was edited by Leonie von Terzi and reviewed by two anonymous referees.
Atlas, D., Srivastava, R., and Sekhon, R. S.: Doppler radar characteristics of precipitation at vertical incidence, Reviews of Geophysics, 11, 1–35, https://doi.org/10.1029/RG011i001p00001, 1973.
Barthazy, E., Henrich, W., and Waldvogel, A.: Size distribution of hydrometeors through the melting layer, Atmospheric Research, 47, 193–208, https://doi.org/10.1016/S0169-8095(98)00065-9, 1998.
Boschetti, L., Stehman, S. V., and Roy, D. P.: A stratified random sampling design in space and time for regional to global scale burned area product validation, Remote Sensing of Environment, 186, 465–478, https://doi.org/10.1016/j.rse.2016.09.016, 2016.
Clothiaux, E., Miller, M., Albrecht, B., Stephens, G., and Ackerman, T.: Millimeter-wavelength radars: New frontier in atmospheric cloud and precipitation research, Bulletin of the American Meteorological Society, 88, 1608–1624, https://doi.org/10.1175/BAMS-88-10-1608, 2007.
Daisley, S. E. and Aydin, K.: Relationships between rainfall rate, attenuation, and reflectivity at 14 and 35 GHz frequencies, in: IEEE International Geoscience and Remote Sensing Symposium, 2009–2011, https://doi.org/10.1109/IGARSS.2002.1026429, 2002.
Foufoula-Georgiou, E., Guilloteau, C., Nguyen, P., Aghakouchak, A., Hsu, K.-L., Busalacchi, A., Turk, F. J., Peters-Lidard, C., Oki, T., and Duan, Q.: Advancing precipitation estimation, prediction, and impact studies, Bulletin of the American Meteorological Society, 101, E1584, https://doi.org/10.1175/bams-d-20-0014.1, 2020.
Gatidis, C., Schleiss, M., and Unal, C.: Sensitivity analysis of DSD retrievals from polarimetric radar in stratiform rain based on the μ–Λ relationship, Atmos. Meas. Tech., 15, 4951–4969, https://doi.org/10.5194/amt-15-4951-2022, 2022.
Gatlin, P. N., Petersen, W. A., Knupp, K. R., and Carey, L. D.: Observed response of the raindrop size distribution to changes in the melting layer, Atmosphere, 9, 319, https://doi.org/10.3390/atmos9080319, 2018.
Giangrande, S. E., Luke, E. P., and Kollias, P.: Characterization of vertical velocity and drop size distribution parameters in widespread precipitation at ARM facilities, Journal of Applied Meteorology and Climatology, 51, 380–391, https://doi.org/10.1175/JAMC-D-10-05000.1, 2012.
Haynes, J. M., Marchand, R. T., Luo, Z., Bodas-Salcedo, A., and Stephens, G. L.: A multipurpose radar simulation package: QuickBeam, Bulletin of the American Meteorological Society, 88, 1723–1728, https://doi.org/10.1175/BAMS-88-11-1723, 2007.
Hogan, R. J., Gaussiat, N., and Illingworth, A. J.: Stratocumulus liquid water content from dual-wavelength radar, Journal of Atmospheric and Oceanic Technology, 22, 1207–1218, https://doi.org/10.1175/JTECH1768.1, 2005.
Hu, X., Yuan, W., and Yu, R.: The extraordinary rainfall over the eastern periphery of the Tibetan Plateau in August 2020, Advances in Atmospheric Sciences, 38, 2097–2107, https://doi.org/10.1007/s00376-021-1134-7, 2021.
Huang, C., Chen, S., Zhang, A., and Pang, Y.: Statistical characteristics of raindrop size distribution in monsoon season over South China Sea, Remote Sensing, 13, 2878, https://doi.org/10.3390/rs13152878, 2021.
Huo, Z., Ruan, Z., Wei, M., Ge, R., Li, F., and Ruan, Y.: Statistical characteristics of raindrop size distribution in south China summer based on the vertical structure derived from VPR-CFMCW, Atmospheric Research, 222, 47–61, https://doi.org/10.1016/j.atmosres.2019.01.022, 2019.
Jin, H. G. and Baik, J. J.: Do Double-Moment Microphysics Schemes Make Reliable Predictions on the Raindrop Number Concentration?: A Squall-Line Case Study, Journal of Geophysical Research: Atmospheres, 128, e2022JD038394, https://doi.org/10.1029/2022JD038394, 2023.
Kattel, D. B., Yao, T., Yang, W., Gao, Y., and Tian, L.: Comparison of temperature lapse rates from the northern to the southern slopes of the Himalayas, International Journal of Climatology, 35, 4431–4443, https://doi.org/10.1002/joc.4297, 2015.
Kumar, L. S., Lee, Y. H., and Ong, J. T.: Two-parameter gamma drop size distribution models for Singapore, IEEE Transactions on Geoscience and Remote Sensing, 49, 3371–3380, https://doi.org/10.1109/TGRS.2011.2124464, 2011.
Li, M., Bi, Y., Shen, Y., Wang, Y., Nima, C., Chen, T., and Lyu, D.: Microphysical Characteristics of Rainfall Based on Long-Term Observations with a 2DVD in Yangbajain, Tibet, Advances in Atmospheric Sciences, 41, 1721–1734, https://doi.org/10.1007/s00376-024-3299-3, 2024.
Li, Q., Wei, J., Yin, J., Qiao, Z., Cao, J., and Shi, Y.: Microphysical characteristics of raindrop size distribution and implications for radar rainfall estimation over the northeastern Tibetan Plateau, Journal of Geophysical Research: Atmospheres, 127, e2021JD035575, https://doi.org/10.1029/2021JD035575, 2022.
Liu, X. and Yin, Z.-Y.: Spatial and temporal variation of summer precipitation over the eastern Tibetan Plateau and the North Atlantic Oscillation, Journal of Climate, 14, 2896–2909, https://doi.org/10.1175/1520-0442(2001)014<2896:SATVOS>2.0.CO;2, 2001.
Löhnert, U. and Maier, O.: Operational profiling of temperature using ground-based microwave radiometry at Payerne: prospects and challenges, Atmos. Meas. Tech., 5, 1121–1134, https://doi.org/10.5194/amt-5-1121-2012, 2012.
Maahn, M., Turner, D. D., Löhnert, U., Posselt, D. J., Ebell, K., Mace, G. G., and Comstock, J. M.: Optimal estimation retrievals and their uncertainties: What every atmospheric scientist should know, Bulletin of the American Meteorological Society, 101, E1512–E1523, https://doi.org/10.1175/BAMS-D-19-0027.1, 2020.
Maggioni, V. and Massari, C.: Extreme hydroclimatic events and multivariate hazards in a changing environment: a remote sensing approach, Elsevier, https://doi.org/10.1016/C2017-0-02344-3, 2019.
Protat, A., Klepp, C., Louf, V., Petersen, W. A., Alexander, S. P., Barros, A., Leinonen, J., and Mace, G. G.: The latitudinal variability of oceanic rainfall properties and its implication for satellite retrievals: 1. Drop size distribution properties, Journal of Geophysical Research: Atmospheres, 124, 13291–13311, https://doi.org/10.1029/2019JD031010, 2019.
Pu, K., Liu, X., Liu, L., and Gao, T.: Water vapor retrieval using commercial microwave links based on the LSTM network, IEEE Journal of Selected Topics in Applied Earth Observations and Remote Sensing, 14, 4330–4338, https://doi.org/10.1109/JSTARS.2021.3073013, 2021.
Smith, P. L.: Raindrop size distributions: Exponential or gamma – Does the difference matter?, Journal of Applied Meteorology and Climatology, 42, 1031–1034, https://doi.org/10.1175/1520-0450(2003)042<1031:RSDEOG>2.0.CO;2, 2003.
Tapiador, F., Checa, R., and De Castro, M.: An experiment to measure the spatial variability of rain drop size distribution using sixteen laser disdrometers, Geophysical Research Letters, 37, https://doi.org/10.1029/2010GL044120, 2010.
Thomas, A., Kanawade, V. P., Chakravarty, K., and Srivastava, A. K.: Characterization of raindrop size distributions and its response to cloud microphysical properties, Atmospheric Research, 249, 105292, https://doi.org/10.1016/j.atmosres.2020.105292, 2021.
Thurai, M., Gatlin, P., and Bringi, V.: Separating stratiform and convective rain types based on the drop size distribution characteristics using 2D video disdrometer data, Atmospheric Research, 169, 416–423, https://doi.org/10.1016/j.atmosres.2015.04.011, 2016.
Tridon, F. and Battaglia, A.: Dual-frequency radar Doppler spectral retrieval of rain drop size distributions and entangled dynamics variables, Journal of Geophysical Research: Atmospheres, 120, 5585–5601, https://doi.org/10.1002/2014JD023023, 2015.
Unal, C. and van den Brule, Y.: Exploring Millimeter-Wavelength Radar Capabilities for Raindrop Size Distribution Retrieval: Estimating Mass-Weighted Mean Diameter from the Differential Backscatter Phase, Journal of Atmospheric and Oceanic Technology, 41, 583–603, https://doi.org/10.1175/JTECH-D-23-0094.1, 2024.
Williams, C. R., Beauchamp, R. M., and Chandrasekar, V.: Vertical air motions and raindrop size distributions estimated using mean Doppler velocity difference from 3 and 35 GHz vertically pointing radars, IEEE Transactions on Geoscience and Remote Sensing, 54, 6048–6060, https://doi.org/10.1109/TGRS.2016.2580526, 2016.
Xu, X., Dong, L., Zhao, Y., and Wang, Y.: Effect of the Asian Water Tower over the Qinghai-Tibet Plateau and the characteristics of atmospheric water circulation, Chinese Science Bulletin, 64, 2830–2841, https://doi.org/10.1360/TB-2019-0203, 2019.
Yang, Q., Dai, Q., Han, D., Chen, Y., and Zhang, S.: Sensitivity analysis of raindrop size distribution parameterizations in WRF rainfall simulation, Atmospheric Research, 228, 1–13, https://doi.org/10.1016/j.atmosres.2019.05.019, 2019.
You, Q., Min, J., Lin, H., Pepin, N., Sillanpää, M., and Kang, S.: Observed climatology and trend in relative humidity in the central and eastern Tibetan Plateau, Journal of Geophysical Research: Atmospheres, 120, 3610–3621, https://doi.org/10.1002/2014JD023031, 2015.
Zhang, X., Delpha, C., and Diallo, D.: Performance evaluation of Jensen–Shannon divergence-based incipient fault diagnosis: Theoretical proofs and validations, Structural Health Monitoring, 22, 1628–1646, https://doi.org/10.1177/14759217221111349, 2023.