the Creative Commons Attribution 4.0 License.
the Creative Commons Attribution 4.0 License.
 | 25 Feb 2026
Chemical ionization mass spectrometry utilizing benzene cations for measurements of volatile organic compounds and nitric oxide
Uma Puttu
Jamie R. Kamp
Xiaoyu Chen
Jhao-Hong Chen
Bingru Wang
Jing Li
Miquel A. Gonzalez-Meler
Jian Wang
We evaluate the capability of chemical ionization mass spectrometry (CIMS) using benzene cations as reagent ions (benzene CIMS) for detecting atmospheric trace gases. We characterize the ionization pathways and product ion distributions for 27 analytes spanning diverse chemical classes. To interpret the complex ion chemistry involving two reagent ions ( and ) and multiple ionization pathways (charge transfer, proton transfer, adduct formation, and hydride abstraction), we introduce a thermodynamics-based framework that classifies analytes into three categories based on their ionization energy (IE), relative to those of benzene monomer (9.24 eV) and dimer (8.69 eV). Each class exhibits distinct ionization mechanisms and product ions. Analytes with IE smaller than 8.69 eV (low IE) undergo charge transfer with both reagent ions; analytes with IE between 8.69 and 9.24 eV (mid IE) undergo charge transfer with and potential adduct formation with ; analytes with IE larger than 9.24 eV (high IE) could undergo adduct formation, proton transfer, or hydride abstraction. Analytes within each class also show similar sensitivity, enabling sensitivity estimation for compounds lacking calibration standards. In addition to volatile organic compounds (VOCs), benzene CIMS detects nitric oxide (NO) with a detection limit of 5 pptv for 1 min integration time, exceeding the performance of most commercial NOx analyzers. Field deployments in Chicago and St. Louis demonstrate good agreement with reference NO measurements. Isoprene measurements show good agreement with a co-located gas chromatography–photoionization detector (GC-PID) in St. Louis, but exhibit substantial positive bias in Chicago, likely due to interferences from anthropogenic VOCs in the polluted urban environment. These results highlight the potential of benzene CIMS for concurrent measurements of NO, VOCs, and their oxidation products using a single instrument, while also underscoring challenges in complex atmospheric conditions.
- Article
(4644 KB) - Full-text XML
-
Supplement
(4672 KB) - BibTeX
- EndNote


The chemical reactions between volatile organic compounds (VOCs) and nitrogen oxides (NOx, sum of NO and NO2) play a central role in atmospheric chemistry, as they produce air pollutants, such as ozone (O3), particulate matter, and influence the oxidizing capability of the atmosphere (Ziemann and Atkinson, 2012). These reactions are initiated by oxidation of VOCs by atmospheric oxidants such as hydroxyl radical (OH), O3, and nitrate radical (NO3), which leads to the formation of organic peroxy radicals (RO2). The subsequent fate of RO2 radicals depends strongly on the concentration of nitric oxide (NO), resulting in different oxidation products (Orlando and Tyndall, 2012).
VOCs originate from biogenic, pyrogenic, and anthropogenic sources (Guenther et al., 1995, 2012). Globally, biogenic sources dominate VOC emissions. Isoprene has an estimated emission rate of around 500 TgC yr−1, accounting for 70 % of biogenic VOCs (Guenther et al., 2006, 2012). Pyrogenic sources, including wildfires and prescribed burns, are the second-largest global source of nonmethane organic gases (Yokelson et al., 2008). The primary sources of anthropogenic emissions include vehicular emissions, industrial processes, and volatile chemical products (VCPs) (McDonald et al., 2018; Wallington et al., 2022). On the other hand, NOx is produced from fossil fuel combustion and natural sources such as soils, lightning, and open fires (Adams et al., 2019; Lasek and Lajnert, 2022). Given the importance of VOCs and NOx, extensive efforts have been made to measure them. However, their measurements are typically conducted using different instruments.
One widely used method for measuring VOCs is gas chromatography (GC), coupled with detectors such as photoionization detection, flame ionization detection, and mass spectrometry. The GC technique paired with appropriate detectors offer high sensitivity allowing for the detection of numerous VOCs with volume mixing ratios as low as 0.1 pptv (parts-per-trillion by volume). While the GC provides the necessary separation (i.e., selectivity), it provides poorly time-resolved (> 5 min) measurements. GC typically requires several minutes of sampling to collect sufficient material, followed by additional time to elute analytes through the column. This relatively slow response limits its ability to capture the rapid temporal variability of atmospheric compounds. Alternatively, chemical ionization mass spectrometry (CIMS) is widely used to detect VOCs at high temporal resolution, achieving measurement rates as rapid as 10 Hz (Bertram et al., 2011). CIMS selectively detects target species by reactions with reagent ions. Hydronium ions (H3O+) are the most widely used reagent ion for measuring VOCs (de Gouw et al., 2003; Yuan et al., 2016). However, one challenge in this technique is measurement interferences. For instance, the H3O+ ion chemistry can break some aldehydes and ketones into smaller fragments that overlap with isoprene signals, complicating its quantification (Coggon et al., 2024). Other reagent ions such as NO+, , , (CH3COCH3)H+ and have been explored to detect VOCs (Spanel and Smith, 1997; Koss et al., 2016; Dong et al., 2022; Xu et al., 2022).
NO is typically measured using chemiluminescence (CL) and laser-induced fluorescence (LIF) techniques. The CL method quantifies NO by measuring the intensity of chemiluminescence emitted when NO reacts with excess O3. This method is widely used because of its straightforward operation and linear response to a wide range of NO concentrations (Fontijn et al., 1970; Ridley and Howlett, 1974; Steffenson and Stedman, 1974; Kley and McFarland, 1980; Bollinger, 1982). Commercial NO analyzers typically have detection limits on the order of 100 pptv, limited by background noise. By reducing background count rates, research-grade instruments can further improve detection limits to 0.5–1 pptv (Ridley and Grahek, 1990). The LIF method quantifies NO by exciting NO molecules at 226 nm and detecting the emitted fluorescence as they return to their lower energy state (Bradshaw et al., 1982). Detection limits of the LIF method have improved to 1 and 0.3 pptv for a 1 and 10 s integration times, respectively. The measurement uncertainties are reduced to below 0.2 pptv (Rollins et al., 2020). One limitation of NOx analyzers based on either CL or LIF technique is that they are only capable of measuring one to three species at maximum (NO, NO2, and NOy).
Measurement of both VOCs and NO using a single instrument would be advantageous, as it provides simultaneous, co-sampled, and high time-resolution measurements of key reactive species. Here, we explore the capability of CIMS using benzene cations as reagent ions (here after referred to as benzene CIMS) for this purpose. Benzene CIMS has been previously applied to detect various VOCs, including isoprene, monoterpenes, and dimethyl sulfide (DMS) (Leibrock et al., 2003; Kim et al., 2016; Lavi et al., 2018). Some evidence in the literature suggests that benzene cations may also react with NO. For example, Sieck and Gorden (1976) reported the formation of benzene–NO clusters (C6H6NO+) at 3 mbar. Additionally, Mungall et al. (2016) observed C6H6NO+ peaks while deploying benzene CIMS in the Arctic, though they attributed these signals to impurities in the zero air, which was used as the carrier gas for reagent gas. These observations motivated us to investigate the feasibility of using benzene CIMS for the concurrent detection of VOCs and NO in the atmosphere.
Recent advances in CIMS have facilitated the broader use of benzene cations as reagent ions. Ji et al. (2020) developed a novel ion source that employed vacuum ultraviolet (VUV) light to generate benzene cations. This VUV source can also produce negative reagent ions such as I− and (Riva et al., 2024). This enables rapid switching between reagent ions of opposite polarities within a single CIMS. Because these reagent ions are sensitive to compounds with different chemical functionalities, they provide complementary detection capabilities, making a single instrument capable for characterizing complex atmospheric mixtures. While the ion chemistry of I− and has been extensively studied (Jokinen et al., 2012; Lee et al., 2014), benzene ion chemistry remains relatively unexplored. Laboratory studies have characterized benzene CIMS for detecting isoprene, monoterpenes, DMS, and ammonia (NH3) (Leibrock and Huey, 2000; Kim et al., 2016; Mungall et al., 2016; Lavi et al., 2018; Schobesberger et al., 2023), but a comprehensive evaluation of its broader measurement capabilities is still lacking. Field deployments of benzene CIMS are also limited. For example, Leibrock et al. (2003) used benzene CIMS to measure isoprene in Boulder, Colorado in 2003, and reported concentrations higher than those measured by co-located GC measurements. They attributed the difference to interferences from unidentified anthropogenic compounds. Since then, benzene CIMS has not been evaluated for quantifying isoprene in the atmosphere.
In this study, we systematically investigate benzene cation chemistry and evaluate its detection capability for a broad range of atmospheric species. In the laboratory, we characterize the product ion distribution, sensitivity, and the response of analytes to key instrument operating conditions for a number of analytes spanning several chemical functional classes. By combining these laboratory results with findings from previous studies, we develop a framework to assess detection capabilities, predict product ions, and estimate sensitivities. Finally, we deploy the benzene CIMS at two field sites to evaluate its performance under ambient conditions.
2.1 Chemical ionization mass spectrometer (CIMS)
The CIMS used in this work is a Tofwerk Vocus CI-TOF 2R equipped with an Adduct Ionization Mechanism (AIM) Ion-Molecule Reactor (IMR). Reagent ions are generated by photoionizing benzene using a VUV source (VUV lamp DC PID PKS 106, Heraeus). Ultra-high purity (UHP) nitrogen (N2) gas flows over two permeation tubes containing liquid benzene (Sigma Aldrich, ≥ 99.9 %) maintained at 80°C in a compact oven, carrying benzene vapor into the VUV source. The UV lamp emits photons at 124 and 117 nm wavelengths, corresponding to energies of 10 and 10.6 eV, respectively. These photons ionize benzene, which has an ionization energy (IE) of 9.24 eV, forming benzene monomer cations () (Reaction R1) (Ji et al., 2020; Breitenlechner et al., 2022). These ions can further react with benzene in the IMR to form benzene dimer cations () (Reaction R2). The observed mass spectrum peak ratio of / in our instrument is about 5. Larger benzene cluster ions with n≥3 likely have negligible abundance in the IMR. As shown in Table S1, the equilibrium constants for the trimer (n=3) and tetramer (n=4) formation are Pa−1 and Pa−1, respectively, which are five orders lower than that for benzene dimer formation. Using the observed = 5 and an estimated benzene partial pressure of Pa (Sect. S1.1), the estimated and are and , respectively. The estimated low abundance of larger benzene cluster ions aligns with Lavi et al. (2018) which showed under the conditions with first radio frequency (RF) only quadrupole electronics turned off, no clusters with size n≥3 were observed.
The reagent ions and react with analytes in the IMR. Sample flow is introduced into the IMR at a rate of 1.8 standard liters per minute (slpm), while reagent ions are introduced at a 45° angle to optimize intersection with the sample flow and minimize deflection. The IMR is a conical reaction chamber composed of conductive polytetrafluoroethylene, which minimizes vapor-wall interactions and suppresses turbulent eddies, thereby enhancing equilibration speed and reducing memory effects. The residence time in the IMR is approximately 10 ms (Riva et al., 2024), which is calculated based on IMR volume and volumetric flows. Further details about the IMR can be found in Riva et al. (2024). After exiting the IMR, product ions pass through a critical orifice at a flow rate of 0.5 slpm, then sequentially traverse a small-segmented quadrupole (SSQ), a big-segmented quadrupole (BSQ), a series of DC optics before entering a time-of-flight (ToF) mass analyzer. The ToF analyzer has a mass resolution () of 9000, enabling the separation of isobaric ions.
2.2 Benzene ion chemistry
The system contains two reagent ions (denoted as R+), and . Each reagent ion could have multiple reaction pathways with analytes (denoted as X), including charge transfer, adduct formation, proton transfer, and hydride abstraction. Below, we first describe each of these reaction pathways, followed by a discussion of the competition among them.
Charge transfer occurs when the IE of the analyte is lower than that of the reagent ion (Reaction R3). The IE values for and are 9.24 and 8.69 eV, respectively (Grover et al., 1987; Linstrom et al., 1997). The predominant product is the analyte molecular ion (X+). Fragmentation may also occur via dissociative charge transfer (Reaction R4), if the appearance energy (AE), which is the minimum energy required to produce a specific fragment ion from the analyte, is smaller than the IE of reagent ion (Gross, 2017).
Adduct formation () can occur through two mechanisms: analyte clustering with (Reaction R5) and ligand exchange with (Reaction R6). A critical parameter governing adduct formation is the analyte's affinity, defined as the negative of the enthalpy change for the reaction between and the analyte, analogous to proton affinity and affinity (Xu et al., 2022). If the analyte has a higher affinity than benzene (74 kJ mol−1), both reaction pathways (Reactions R5 and R6) are thermodynamically favorable and lead to the formation of . Conversely, if the analyte has a lower affinity than benzene, reaction R6 does not occur. Reaction (R5) may still proceed if exothermic, but the resulting is susceptible to ligand exchange by C6H6, forming (Reaction R7).
Proton transfer reaction occurs when the proton affinity (PA) of the analyte is higher than that of the phenyl radical (884 kJ mol−1) (Hunter and Lias, 1998), generating the protonated analyte ion XH+ (Reaction R8). Hydride abstraction reaction occurs when Reaction (R9) is exothermic, generating product ion . In addition to these four major reaction pathways, some analytes can undergo secondary ion-molecule chemistry involving O2.
2.3 Analyte classification
Due to the presence of two reagent ions and multiple reaction pathways, analyte ionization involves competing pathways that depend on the analyte's properties (e.g., IE, PA, and affinity) and the relative abundances of two reagent ions. To investigate these ionization pathways, we measured product ion distributions for 27 analytes under dry conditions. In each experiment, 10 sccm of N2 was passed over a vial containing a small amount (< 1 µL) of pure analyte, and the resulting vapor was diluted with 3 slpm of zero air from a zero air generator (Tisch Environmental, Model ZA-747-30) before entering the instrument. This procedure leads to an initial burst of analyte that temporarily depletes the reagent ions. As the analyte concentration gradually decreases, the reagent ion signal recovers. Only data collected after the reagent ion signal returned to at least 95 % of its baseline value are used in the product ion distribution analysis. Product ions were identified as those exhibiting a correlation coefficient (R2) greater than 0.95 with the primary product ion and contributing more than 1 % of its signal.
Similar competition has been studied for other reagent ions, such as NO+. By investigating the chemistry of NO+ with over 50 analytes, Koss et al. (2016) suggested that charge transfer dominates when it is thermodynamically favorable, regardless of other possible reactions. When charge transfer is not thermodynamically favorable, competition among other reaction pathways needs to be considered. Building upon this principle, we categorize analytes based on their IE relative to benzene monomer and dimer, evaluate the competitive reaction pathways within each category (Fig. 1a).
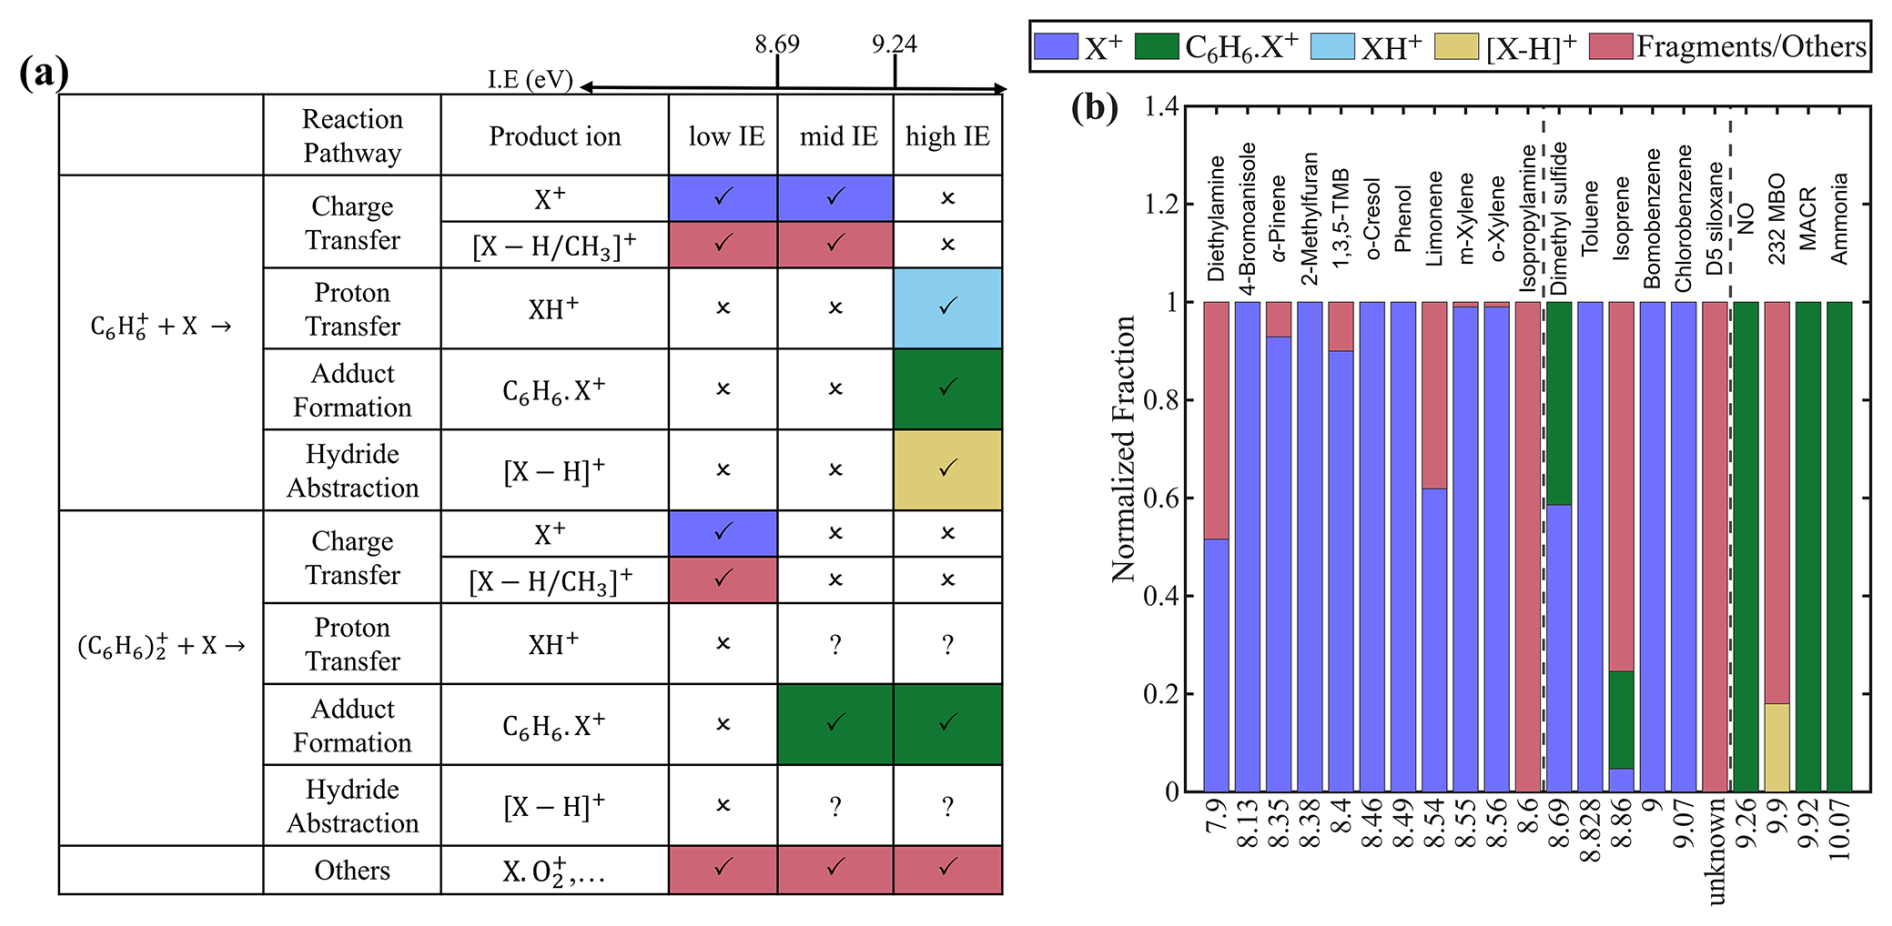
Figure 1(a) Reaction pathways between reagent ions ( and ) and analyte (X) across different analyte categories, along with the corresponding product ions. Symbols “✓”, “x”, and “?” indicate high, low, and uncertain likelihood of the reaction, respectively. (b) Product ion distributions for each analyte, sorted by ionization energy (IE). The two vertical dashed lines mark the IE of 8.69 eV (benzene dimer) and 9.24 eV (benzene monomer). The IE of D5-siloxane is unknown, but likely between benzene dimer and benzene monomer, as discussed in the text. The same product ion formed via different reagent ions or ionization pathways are shown in the same color. Fragment ions from dissociative charge transfer and other reaction pathways are also shown in the same color, as they are difficult to distinguish experimentally.
Analytes with IE smaller than those of both benzene dimer (8.69 eV) and benzene monomer (9.24 eV) are classified into “low IE”. We examine 11 analytes in this class and find that the charge transfer is the sole ionization pathway for all of them (Fig. 1b). For 8 of the 11 analytes, the charge transfer product, i.e., analyte molecular ion X+, accounts for more than 95 % of total products. In the remaining three cases (limonene, isopropylamine (IPA), and diethylamine (DEA)), additional fragment ions or are detected. These fragments arise from the dissociative charge transfer of X+ (Reaction R4), consistent with their appearance energies being lower than the IE of benzene (Table S3).
Several analytes in the low IE have PA greater than that of the phenyl radical (884 kJ mol−1), for example, IPA (923.8 kJ mol−1) and DEA (952.4 kJ mol−1). Despite the proton transfer is thermodynamically favorable for these analytes, their protonated ions (XH+) are not detected. This suggests these analytes preferentially undergo charge transfer rather than proton transfer. This observation is consistent with Allgood et al. (1990), who observed proton transfer ions only for analytes which could not undergo charge transfer (Sect. S1.2). Thus, for analytes in class low IE, charge transfer is likely the dominant ionization mechanism.
Analytes with IE between that of benzene dimer and monomer are classified into “mid IE”. Their reactions with and are different. When reacting with , charge transfer dominates, the same as those in “low IE”. In contrast, charge transfer does not occur with , as the analyte's IE exceeds that of benzene dimer. In such cases, other reaction pathways become possible. We examine six analytes in this class. For chlorobenzene, bromobenzene, and toluene, the molecular ion X+ formed via charge transfer is the sole observed product. D5 siloxane also appears to belong to this class, though its IE is not directly known. Experimental observations suggest that its IE is between 8.83 eV (toluene) and 9.24 eV (benzene), because its molecular ion is not observed when using toluene cations as reagent ions (Alton and Browne, 2020) and because a fragmentation ion () is detected with benzene cations, presumably formed via dissociative charge transfer (Reaction R4).
For DMS, both molecular ion (C2H6S+) and adduct ion (C8H12S+) are observed. The adduct formation is consistent with that the affinity of DMS (113.05 kJ mol−1 calculated by Vermeuel (2021)) is higher than that of benzene. The detection of both C2H6S+ and C8H12S+ in our study contrasts with previous studies by Mungall et al. (2016) and Schobesberger et al. (2023), who observed only C2H6S+. This discrepancy is likely due to differences in electric field strengths. Kim et al. (2016) showed that a stronger electric field can decluster C8H12S+ into C2H6S+. Because the electric fields were not specified in previous studies, direct comparisons are difficult. In our instrument, the voltage gradient between the BSQ front and the skimmer is only 1 V. Ions are transported axially by the gas flow and focused radially by the RF field, which minimizes added energy and thereby reduces declustering (Riva et al., 2024).
Isoprene exhibits a complex distribution of product ions. As shown in Fig. 2a, in addition to the adduct ion () and the charge transfer ion (), numerous oxygenated ions were observed, including C4H7O+, , , , and C5H6O+. We hypothesize the formation of these oxygenated product ions is related to O2 in the sample. To test this hypothesis, we replaced zero air with UHP N2 as the dilution gas, thereby minimizing the O2 concentration. Under N2, the dominant products are (55 %) and (36 %) (Fig. 2b). The observations in this study are not inconsistent with previous studies when differences in experimental conditions are considered. Schobesberger et al. (2023) reported as the major product ion, but used N2 as the dilution gas. Lavi et al. (2018) used zero air and also found as the dominant product, but in that case was the primary reagent ion, whereas is the major reagent ion in our study. Charge transfer reaction with is more energetic and leads to enhanced fragmentation and secondary ion chemistry compared to the adduct formation pathway of . It is also possible that O2 chemistry played a smaller role in Lavi et al. (2018), which used a Po-210 ion source instead of the VUV source used in this study.
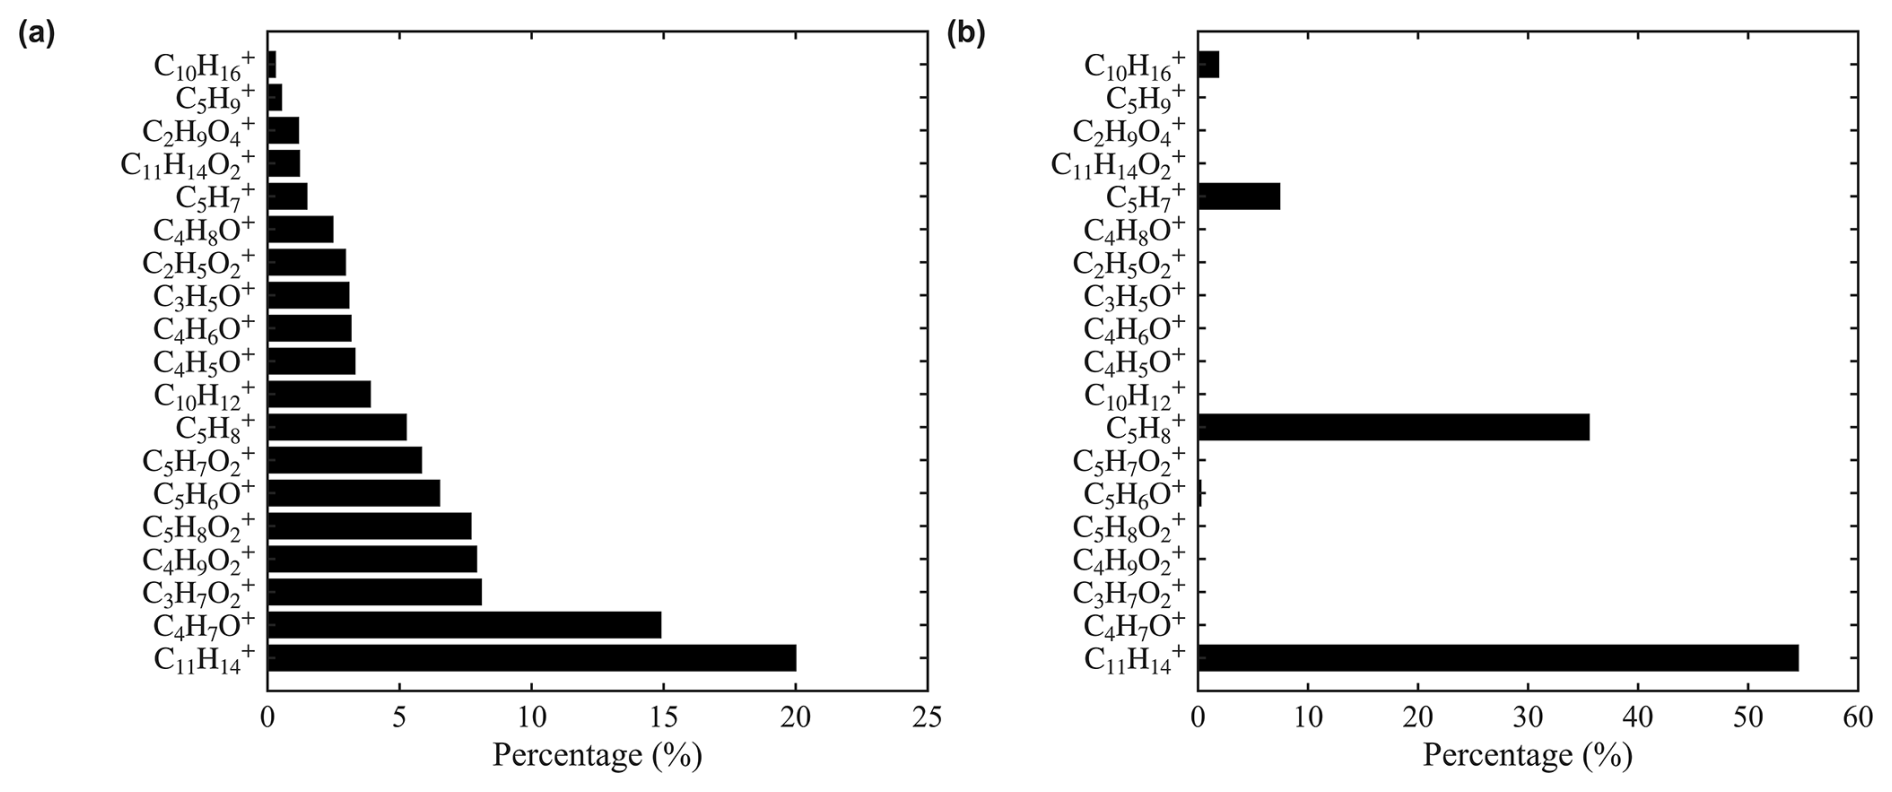
Figure 2Distribution of isoprene product ions in different dilution gases (a) zero air and (b) UHP N2 .
Regarding the O2 effect, we hypothesize that a fraction of the VUV light enters the IMR, leading to the formation of and potentially OH radicals. These species could cause complex ionization chemistry and oxidation chemistry of reactive species, thereby contributing to the observed fragmentation. For all of the compounds examined in this study, we observed the O2 effect only for isoprene and limonene. We expect that similar chemistry could also occur for other reactive species, such as butadiene and pentadiene. Further investigation of the O2 effect will be an important focus of future work.
Analytes with IE greater than that of benzene monomer are classified into “high IE”. Due to their high IE, these analytes cannot undergo charge transfer with either reagent ion. Instead, their potential ionization pathways include proton transfer, adduct formation, and hydride transfer. The dominant pathway depends on the thermodynamic properties of each analyte. For NO, NH3, and methacrolein (MACR), proton transfer is not thermodynamically favorable, as their PA are all lower than that of the phenyl radical (Table S2). Hydride abstraction is also unfavorable, because NO lacks a hydrogen atom and because the reaction enthalpies for hydride abstraction from MACR and NH3 are endothermic (Lias et al., 1988; Bargholz et al., 2013). The adduct formation becomes the favorable pathway. The reported affinities for NO and NH3 are 184 ± 21 and 78.7 kJ mol−1, respectively (Reents and Freiser, 1980; Mizuse et al., 2010), both exceeding that of benzene. This is consistent with our observation that adduct ion is the sole product ion for NO and NH3. While the affinity for MACR is not available, the observed formation of the adduct ion suggests that its affinity is also greater than that of benzene.
Another analyte in the high IE that we characterize is 2-Methyl-3-buten-2-ol (232 MBO, C5H10O). This compound is of interest because it can interfere with isoprene measurements in other techniques, such as PTR-MS (Karl et al., 2012). Since the thermodynamic properties of 232 MBO are largely unknown, we infer its ionization pathways based on the observed product ions. The dominant product ion of 232 MBO is , which accounts for 80 % of the total product ions. This observation is consistent with a previous study by Leibrock and Huey (2000), which attributed the formation of to 232 MBO dehydration followed by adduct formation with (i.e., C5H10O - H2O + ). Because this same ion () is also produced via the adduct ion formation between isoprene and , the presence of 232 MBO can interfere with isoprene quantification using in benzene CIMS. In addition to , we also detect the ion C5H9O+, which is likely formed through a hydride abstraction reaction. Adduct ion is not observed, which is consistent with its calculated affinity (73.8 kJ mol−1) slightly lower than that of benzene (Vermeuel, 2021).
We also tested six other compounds in the high IE, including hydrogen cyanide, acetaldehyde, acetonitrile, methyl ethyl ketone, acetone, and acrolein. The benzene CIMS exhibits negligible sensitivity toward these compounds. Similar behavior has been observed for methanol, ethanol, and 2-propanol, which also fall into the high IE (Leibrock and Huey, 2000). This lack of sensitivity can be attributed to their IE exceeding 9.24 eV and their PA being lower than that of the phenyl radical (884 kJ mol−1), rendering both charge transfer and proton transfer thermodynamically unfavorable. Although the affinities of these compounds are not reported, the absence of adduct ion formation suggests that their affinities are likely lower than that of benzene.
All analytes investigated in previous studies are summarized in Fig. S1, and their behavior aligns with the framework proposed here. Overall, categorizing analytes into three classes based on their IEs provides a useful framework for understanding the underlying ion chemistry and enhancing the interpretability of benzene CIMS measurements. As discussed later, analytes within the same class tend to exhibit similar sensitivity.
3.1 Absolute sensitivity
We calibrate the instrument sensitivities, expressed in counts per second per pptv (cps pptv−1), for NO, NH3, and twelve VOCs. NO is introduced using a gas cylinder (3.01 ppmv ± 2 %, Scott Air Gas LLC, USA), while the VOCs are introduced from two custom gas mixtures provided by Apel-Riemer Environmental, Inc. (Table S5). For NH3, we use a NH3 wafer device with a permeation rate of 82 ± 21 ng min−1 at 40 °C (PDWF-0140, VICI Metronics Inc.). Our reported sensitivity should be considered as a lower bound, as any NH3 loss between the permeation device and CIMS would lead to an underestimation of the true sensitivity. The calibration gases from the cylinders and the permeation tube are diluted with dry zero air. All calibrations were performed under the instrument's optimal operating conditions, as described in Sect. S2.4 where we investigate the effects of IMR temperature, pressure, and flow rate of reagent gas on analyte sensitivities. The sensitivities of the 14 analytes are listed in Table 1.
Table 1Absolute sensitivity, product ion fraction (fp), normalized sensitivity (α, β), background signal*, and detection limits (LoD, 1 s and 1 min integration times) for the analytes calibrated in this study.

* The calculation of background signal and detection limit is described in the Sect. S2.2.
In the low IE, both and serve as reagent ions, with charge transfer being the dominant ionization pathway and the molecular ion (X+) as the primary product ion. Four aromatic compounds in this class (1,3,5-trimethylbenzene (1,3,5-TMB), o-cresol, m-xylene, and o-xylene) exhibit similarly high sensitivities, ranging from 9.2 to 11.2 cps pptv−1. These values likely represent the upper limit of sensitivity near the collision limit. Limonene shows a slightly lower sensitivity of 6.7 cps pptv−1, due to fragmentation caused by dissociative charge transfer. The molecular ion constitutes 62 % of the total product ion signal. Accounting for this fragmentation, the corrected sensitivity is cps pptv−1, consistent with the sensitivity range observed for other low IE analytes. 2-Methylfuran exhibits a sensitivity of 6.9 cps pptv−1, which is lower than expected for collision-limit ionization, but the reason is unclear.
In the mid IE, analytes undergo charge transfer with to form molecular ions and may also react with to produce adduct ions. For toluene, chlorobenzene, and D5-siloxane, analytes for which only charge transfer products are observed, sensitivities range from 7.8 to 9.0 cps pptv−1. These values are slightly lower than those observed for low IE analytes, likely because only participates in charge transfer for analytes in mid IE, whereas both and contribute in the low IE. The DMS sensitivity, quantified using the charge transfer product (C2H6S+), is 4.3 cps pptv−1, lower than that of other mid IE analytes. This reduction may be attributed to mass-dependent transmission efficiency, as the of C2H6S+ is only 62. As estimated in Sect. S1.4, the transmission efficiency at 62 is 0.42, yielding a corrected sensitivity of 10.1 cps pptv−1, comparable to the others. The sensitivity of the DMS adduct ion is 3.1 cps pptv−1, which will be discussed alongside other adduct ions in high IE. For isoprene, the sensitivity based on any single product ion is low due to its complex product ion distribution (Fig. 2).
In the high IE, analytes cannot undergo charge transfer reactions; instead, other ionization pathways may occur. For the three analytes we calibrate, NO, MACR, and NH3, only adduct ions are observed. The sensitivities of NO and MACR are 3.1 and 3.3 cps pptv−1, respectively, similar to that of DMS adduct ion (3.1 cps pptv−1). NH3 exhibits a lower sensitivity of 1.6 cps pptv−1. This reduced sensitivity may arise from its lower affinity (78.7 kJ mol−1), compared with those of NO and DMS (184 and 113.1 kJ mol−1, respectively).
3.2 Normalized sensitivity
To account for variations in sensitivity due to fluctuations in ion source intensity, normalized sensitivity is typically used. This is calculated by normalizing the signal of the product ion to that of the reagent ion(s). In previous benzene CIMS studies, normalization has been performed using , , or the sum of both reagent ions (Kim et al., 2016; Lavi et al., 2018; Riva et al., 2024; Aggarwal et al., 2025). As discussed in Sect. 2.2, the relevant reagent ion(s) vary with the analyte and the ionization mechanism. Therefore, the choice of reagent ion(s) for normalization should be based on the analyte and its associated ionization pathway(s). Below, we derive a normalization method based on the example reactions shown in Reactions R10 and R11, where analyte X may react with both reagent ions to form a common product ion, P+.
Assuming that the concentrations of both analytes and reagent ions remain constant during the ionization process, the number concentration of P+ produced from both reactions is given by
Here, [] represents the number concentration in the IMR, f1 and f2 represent the yield of product ion for each reaction, k1 and k2 represent the corresponding rate constants, and Δt is the reaction time. To relate the ion concentration in the IMR to the measured ion count rate I (in cps), we introduce an efficiency factor E, which accounts for transmission through the ion optics and the detection efficiency of the electron multiplier. E is assumed constant for each ion under fixed instrument conditions. We also express the analyte concentration [X] as the product of its volume mixing ratio CX (in pptv) and the number density of air in the IMR N. Substituting into Eq. (1) gives:
Next, we consolidate constants into two parameters, α and β, defined as and . Inserting these into Eq. (2) and introducing a scaling factor of 106 for practical units (i.e., counts per million reagent ion counts), we obtain:
We can further rearrange Eq. (3) to isolate the normalized sensitivity. When is the primary reagent ion, Eq. (3) can be expressed as
Here, α is the normalized sensitivity (in ncps pptv−1), with the denominator consisting of a weighted sum of the reagent ion signals. Conversely, when is the dominant reagent ion, the expression becomes
To determine α and β, we conduct calibration experiments in which the analyte mixing ratio (CX) is held constant while the temperature of the benzene permeation tube is varied. This adjustment alters the benzene concentration in the IMR and consequently the relative abundances of the reagent ions. We then examine the response of the product ion signal () to changes in the reagent ion signals ( and ) by performing a multivariate linear regression based on Eq. (3). The fitted values of α and β for all calibrated analytes are presented in Table 1, with representative regression fits shown in Figs. S5–S7.
While the α and β values represent normalized sensitivities, they also provide insights into the underlying ion chemistry. For analytes in the low-IE class, α values range from 12.9 to 16.5 (after correcting for the product ion distribution of limonene), which are consistently larger than the corresponding β values (1.2–3.4). This likely reflects the faster charge transfer reaction with compared to . For toluene, chlorobenzene, and D5-siloxane, three analytes in the mid-IE class, their β values are either zero or significantly lower than the corresponding α values. This is consistent with negligible charge transfer between these analytes and . The rate of charge transfer is related to the difference in IE between the analyte and the reagent ion. Stone and Lin (1980) shows that the charge transfer rate with is fast and plateaus when the analyte’s IE is much lower than that of benzene, but decreases rapidly as this difference narrows. A similar trend is observed for charge transfer ions in this study as shown in Fig. S4. Lastly, for analytes that undergo adduct formation, no clear trend emerges in the α and β values. For DMS, NO and MACR, their α values are larger than β values, which are zero. In contrast, for NH3, α and β are similar, both of which are non-zero. The underlying reasons for these differing behaviors among the four analytes remain unclear.
3.3 Humidity dependence
Previous studies (Kim et al., 2016; Lavi et al., 2018) have shown that water has complex effects on reagent ion distribution and analyte sensitivity. They also observed protonated water clusters, although their formation mechanisms remain unclear. To investigate this, we sample zero air at varying humidity levels. Under dry conditions, only and are detected. As humidity increases, we observe an exponential increase in the signals of protonated water clusters (H2O)nH+ for n=3 and 4, with negligible signals for n=1, 2, or ≥ 5 (Fig. S10). No benzene–water cluster ions (i.e., ) are observed. The formation and detection of these ions results from the combined influences of benzene–water ion chemistry, declustering effects, and mass-dependent transmission efficiency. Figure 3 shows a scheme to illustrate the proposed formation mechanism of protonated water clusters and the thermodynamic properties of water clusters are summarized in Tables S7 and S8.
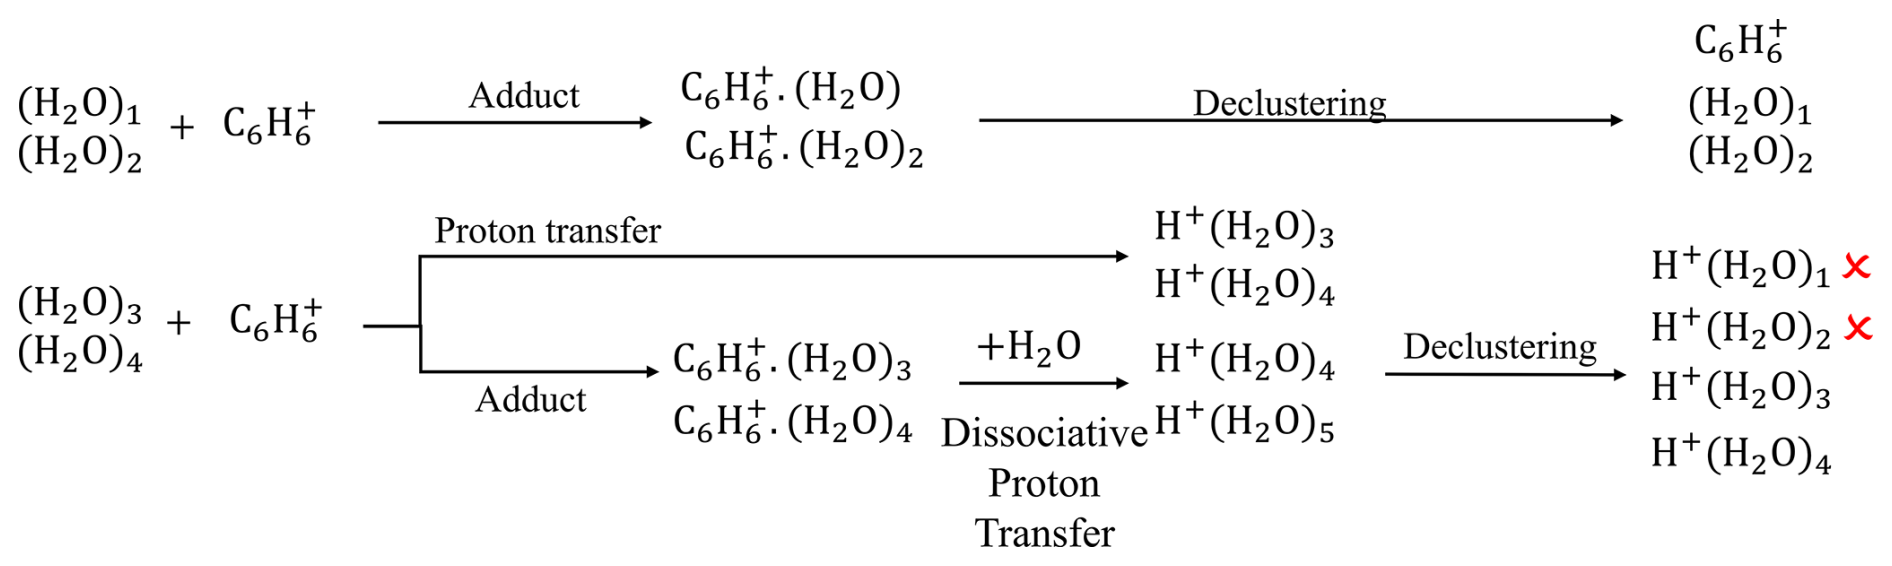
Figure 3Schematic illustration of the formation mechanisms of protonated water clusters. The mechanisms include (1) proton transfer between and water trimers or tetramers and (2) dissociative proton transfer between C6H6(H2O) (n=3 and 4) and water.
Water vapor can form clusters in the atmosphere. Assuming a water mixing ratio of 2 % (corresponding to 100 % relative humidity at 18 °C), the estimated mixing ratios of the clusters are as follows: monomer at 20 000 ppmv, dimer at 20 ppmv, trimer at 0.2 ppmv, tetramer at 0.02 ppmv (Dunn et al., 2004). Pentamer and larger clusters are not considered because of their low abundances. Based on the calibration experiment described in Sect. 3.2, we find that is the primary reagent responsible for generating protonated water clusters (Fig. S11). Thus, the following discussion focuses on the reactions between and (H2O)n (n= 1–4).
(H2O)n (n= 1–4) cannot undergo charge transfer with , as their IEs exceeds that of benzene (Table S7). The hydride abstraction is also unlikely. Proton transfer and adduct formation are possible for some water clusters. Based on their thermodynamic properties, we find that water monomer and dimer share similar ionization pathways, while water trimer and tetramer follow different pathways. Water trimer and tetramer have PA values comparable to or exceeding that of the phenyl radical, leading to the formation of (H2O)3H+ and (H2O)4H+. In addition, the affinities of water trimer and tetramer are comparable to or exceeding that of benzene, leading to the formation of adduct ions and . Regarding water monomer and dimer, they are unlikely to undergo proton transfer with because their PA values are lower than that of the phenyl radical. Their affinities are lower than benzene, but adduct ions C6H6(H2O)+ and C6H6(H2O) may still form under humid conditions, where the chemistry of water monomer and dimer overruns that of benzene in the IMR. In summary, product ions C6H6(H2O) (n= 1–4) and (H2O)nH+ (n=3 and 4) can form in the IMR.
These product ions can undergo further reactions in the IMR. The benzene–water adduct ions C6H6(H2O) (n=3 and 4) may collide with water molecules and undergo a dissociative proton transfer reaction (Ibrahim et al., 2005), resulting in the formation of (H2O)nH+ (n=4 and 5). This reaction is thermodynamically unfavorable for n=1 and 2 (Table S7). Consequently, the initially formed adduct ions are converted into C6H6(H2O) (n=1 and 2) and (H2O)nH+ (n= 3–5).
These ions may further decluster in the ion optics. The extent of declustering depends on their binding energy, but a quantitative relationship remains unknown. We qualitatively infer the extent of declustering from the voltage scanning test (Sect. S2.6). Figure S14b shows that the signals of , , and decrease by roughly 80 % when the voltage gradient between the BSQ front and the skimmer is increased by 5 V. These three ions have binding energies of 74, 73, and 85 kJ mol−1, respectively. Based on this, we infer that ions with binding energies below 70 kJ mol−1 likely undergo extensive declustering in our instrument. The adduct ions C6H6(H2O) (n=1 and 2) have binding energies of 38 and 59 kJ mol−1, respectively, indicating that they decluster in the instrument, which likely explains why they are not observed. The binding energies of (H2O)nH+ are 84, 73, and 56 kJ mol−1 for n=3, 4, and 5, respectively. Thus, (H2O)5H+ likely undergoes extensive declustering, while partial declustering is expected for n=3 and 4. This process may yield (H2O)nH+ with n=1 and 2. However, these two ions are not observed, likely due to poor transmission efficiency at low in the instrument (Fig. S2c).
Overall, the protonated water clusters (H2O)nH+ (n=3 and 4) are likely formed via two pathways: proton transfer from to water trimer and tetramer, and dissociative proton transfer from the adduct ions C6H6(H2O) (n=3 and 4). The absence of benzene–water cluster ions is attributed to their weak binding energies, leading to declustering within the instrument. The lack of detectable (H2O)nH+ ions with n=1 and 2 is likely due to low transmission efficiency at low .
We investigate the dependence of analyte sensitivity on sample humidity by diluting the calibration gas with humidified air. The humidified air is generated by flowing zero air through a frit bubbler containing HPLC-grade water. The water mixing ratio of sample is monitored using a Picarro G2401 gas concentration analyzer (Sect. S3.1). The maximum water mixing ratio of sample reached is 2.75 %, equivalent to 100 % relative humidity at 23 °C. The dependence of analyte sensitivity on sample absolute humidity is shown in Fig. 4. The majority of analytes exhibit a decreasing sensitivity with increasing humidity, with NH3 being an exception.
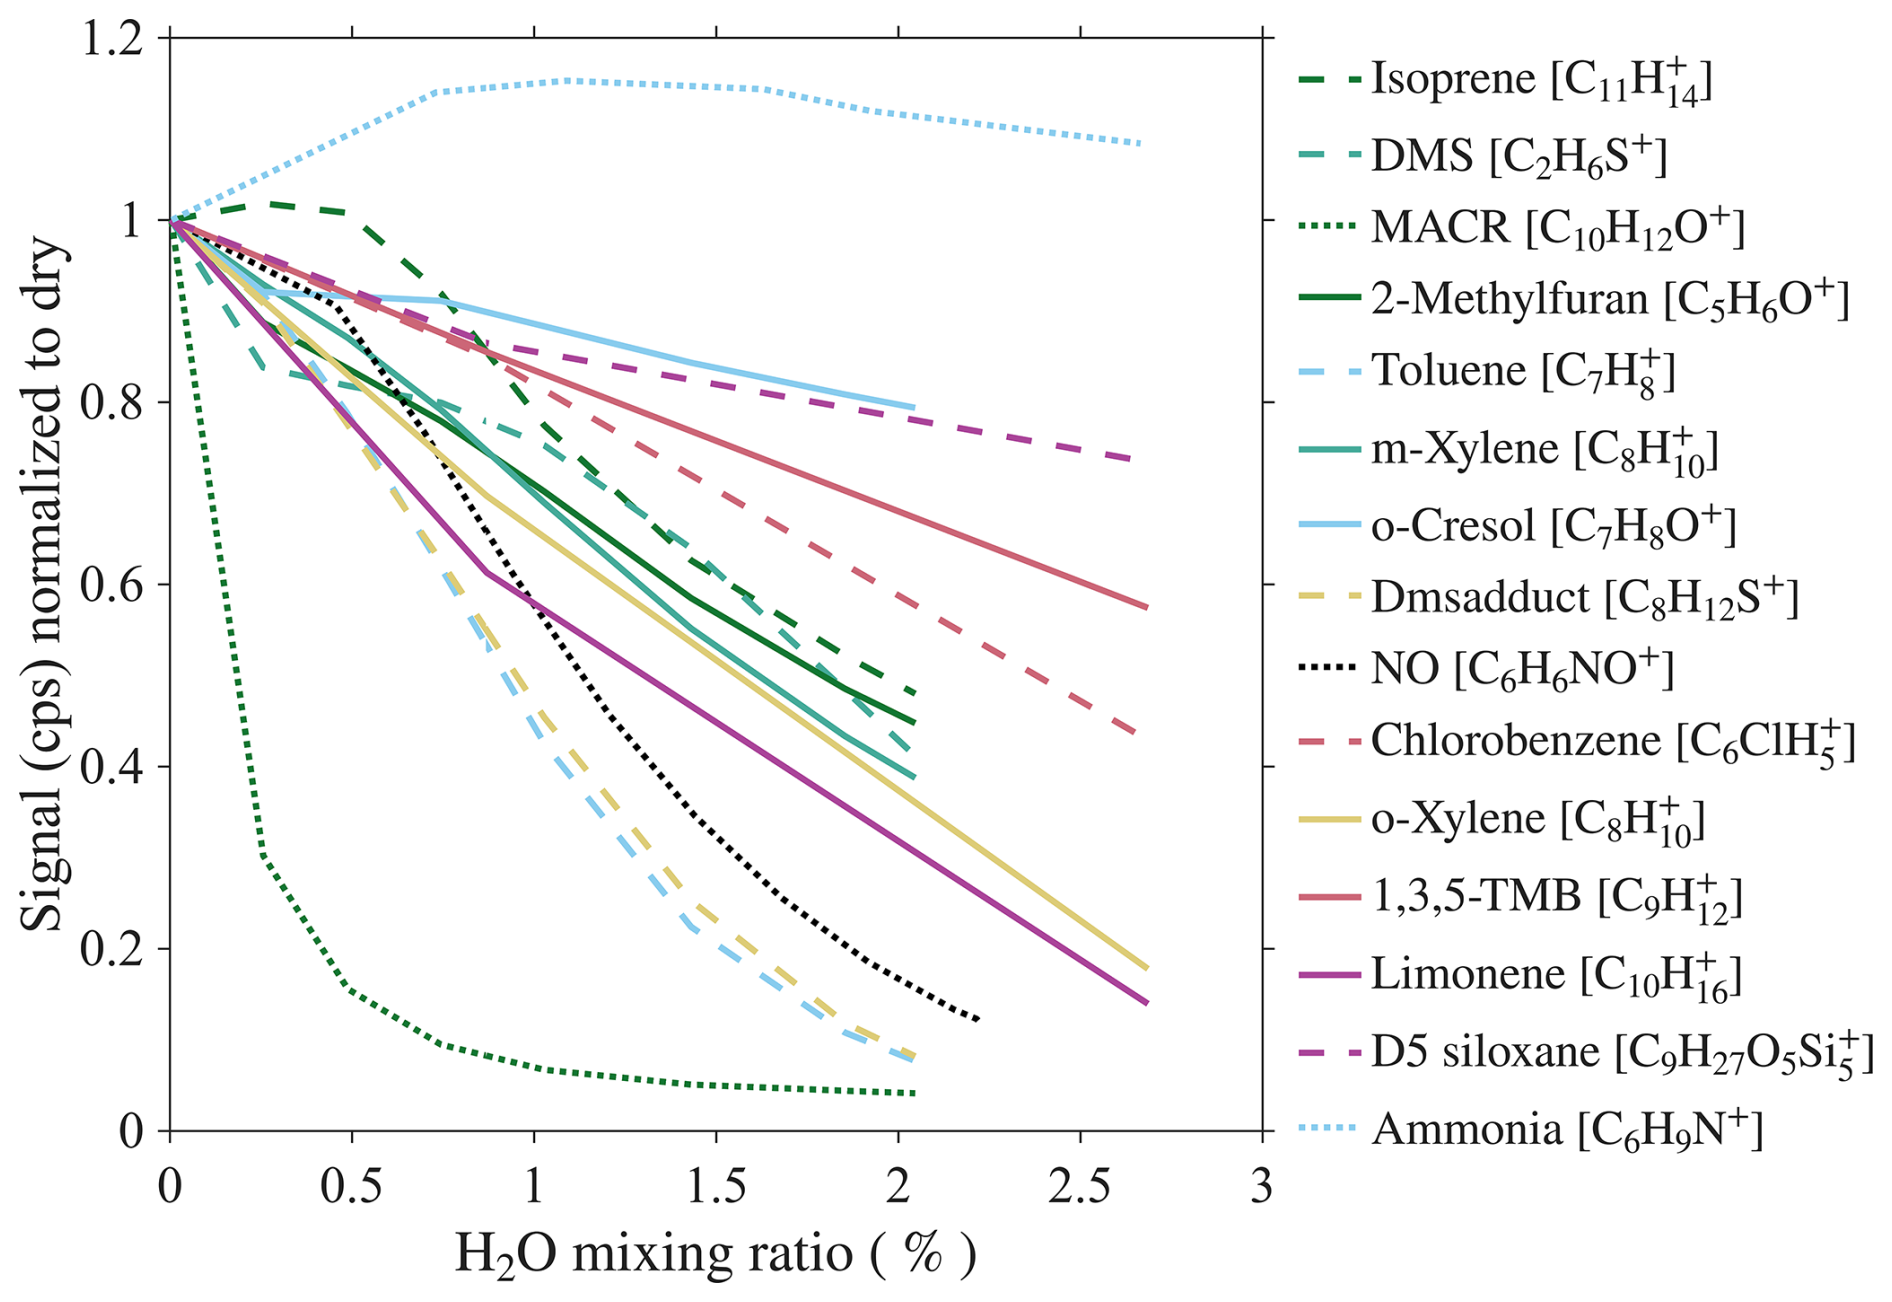
Figure 4Humidity-dependent sensitivity of analytes. Solid, dashed, and dotted lines represent analytes in low, mid, and high IE classes, respectively.
One notable finding is that water ion signals in CIMS are influenced not only by sample humidity but also by the analyte mixing ratio. In one experiment, we hold the water mixing ratio constant at 1.25 % and vary the NO mixing ratio from 3 to 15 ppbv. Despite constant water mixing ratio, the signal changes with NO mixing ratio. A similar effect is observed for VOCs (Fig. S12a) and was also reported by Lavi et al. (2018). The reason for this phenomenon is unclear, but may be explained by clustering between , analyte, and water to form weakly bound adducts C6H6X(H2O), which subsequently undergo declustering, producing (H2O)nH+ ions. As a result, higher analyte mixing ratio leads to higher water ion signals.
To correct for humidity-dependent sensitivity, the ideal approach is to directly monitor the water mixing ratio. However, in cases where it is not measured, water ion signals measured by CIMS can be used as a proxy, which is a widely adopted method in CIMS. However, this approach becomes challenging when water ion signals are influenced not only by sample humidity but also by the analyte mixing ratio. To address this, we develop an interpolation-based correction method. This method begins with calibration experiments covering a wide range of mixing ratios of analyte and water. These conditions are obtained through two sets of experiments: in the first, water mixing ratio is varied while the analyte mixing ratio is held constant; in the second, the analyte mixing ratio is varied while water mixing ratio is kept constant. Using the resulting calibration data, we plot the analyte product ion signal as a function of the water ion signal, color-coded by the analyte mixing ratio. The dataset is then interpolated into a two-dimensional surface, referred to as the calibration contour, using MATLAB’s natural neighbor interpolation method (Fig. 5b). Finally, this calibration contour allows us to infer the analyte mixing ratio in ambient measurements based on observed signals of analyte product ion and water ion. The performance of this correction method will be evaluated using ambient data as discussed in Sect. 4.
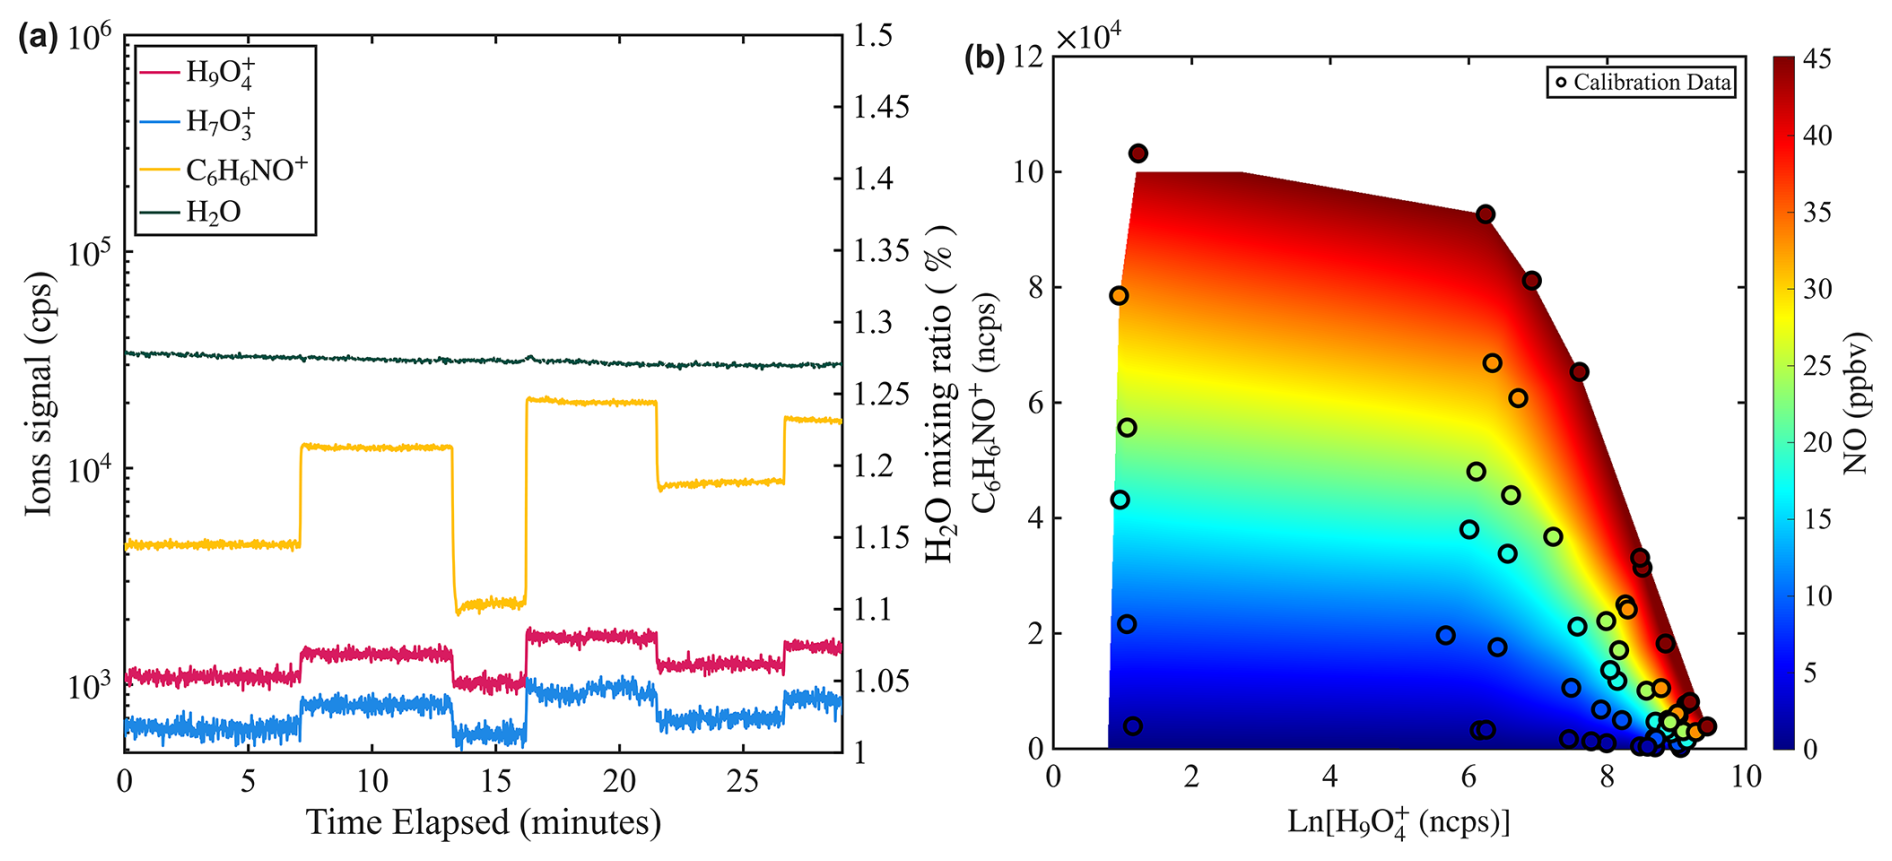
Figure 5(a) Time series of water mixing ratio and signals of NO (C6H6NO+) and water (e.g., and ) during a calibration experiment where water mixing ratio is held constant while NO mixing ratio is varied from 3 to 15 ppbv. The water mixing ratio is measured by a PICARRO G2401 gas concentration analyzer. (b) Two-dimensional calibration contour interpolated from calibration points obtained in the humidity-dependent calibration of NO.
We deployed the benzene CIMS instrument for one week each in Chicago, IL (July 2024) and St. Louis, MO (August 2024) to evaluate its performance. The Chicago site is located on the University of Illinois Chicago campus, approximately 0.3 km from Interstate 90 and 2.5 km from downtown Chicago. The St. Louis site is located on the Washington University in St. Louis campus, adjacent to a major roadway (Skinker Boulevard, 2 lanes in each direction) and a large forested park (Forest park). These two locations offer diverse testing environments for the instrument. We compared the isoprene and NO measured by CIMS to co-located reference measurements. NO was measured with a Thermo Scientific Model 42i x analyzer at a 1 min time resolution, while isoprene was measured with a gas chromatograph with photoionization detection (GC-PID, SRI model 8610C) at a 25 min resolution (Sect. S3.2).
4.1 Measurements of NO
Figures 6a and 7a show the time series of NO mixing ratios measured by both the benzene CIMS and the NOx analyzer at the St. Louis and Chicago sites, respectively. The average NO mixing ratio was higher in Chicago (2.1 ppbv) than in St. Louis (0.6 ppbv), due to heavier traffic near the Chicago site. At both locations, NO exhibited a clear morning rush hour peak (Figs. 6c and 7c). The benzene CIMS measurements agreed well with those from the NOx analyzer in St. Louis (Fig. 6), with an R2 value of 0.92 and a slope of 0.97. The comparison was slightly weaker in Chicago, where the scatter plot was more dispersed (Fig. 7b), but the overall agreement remained strong, with an R2 of 0.92 and a slope of 0.92. Data points are color-coded by the natural logarithm of the signal, a proxy for sample humidity. No systematic dependence of measurement differences on Ln() is observed, supporting the effectiveness of the interpolation-based humidity correction method described in Sect. 3.3.
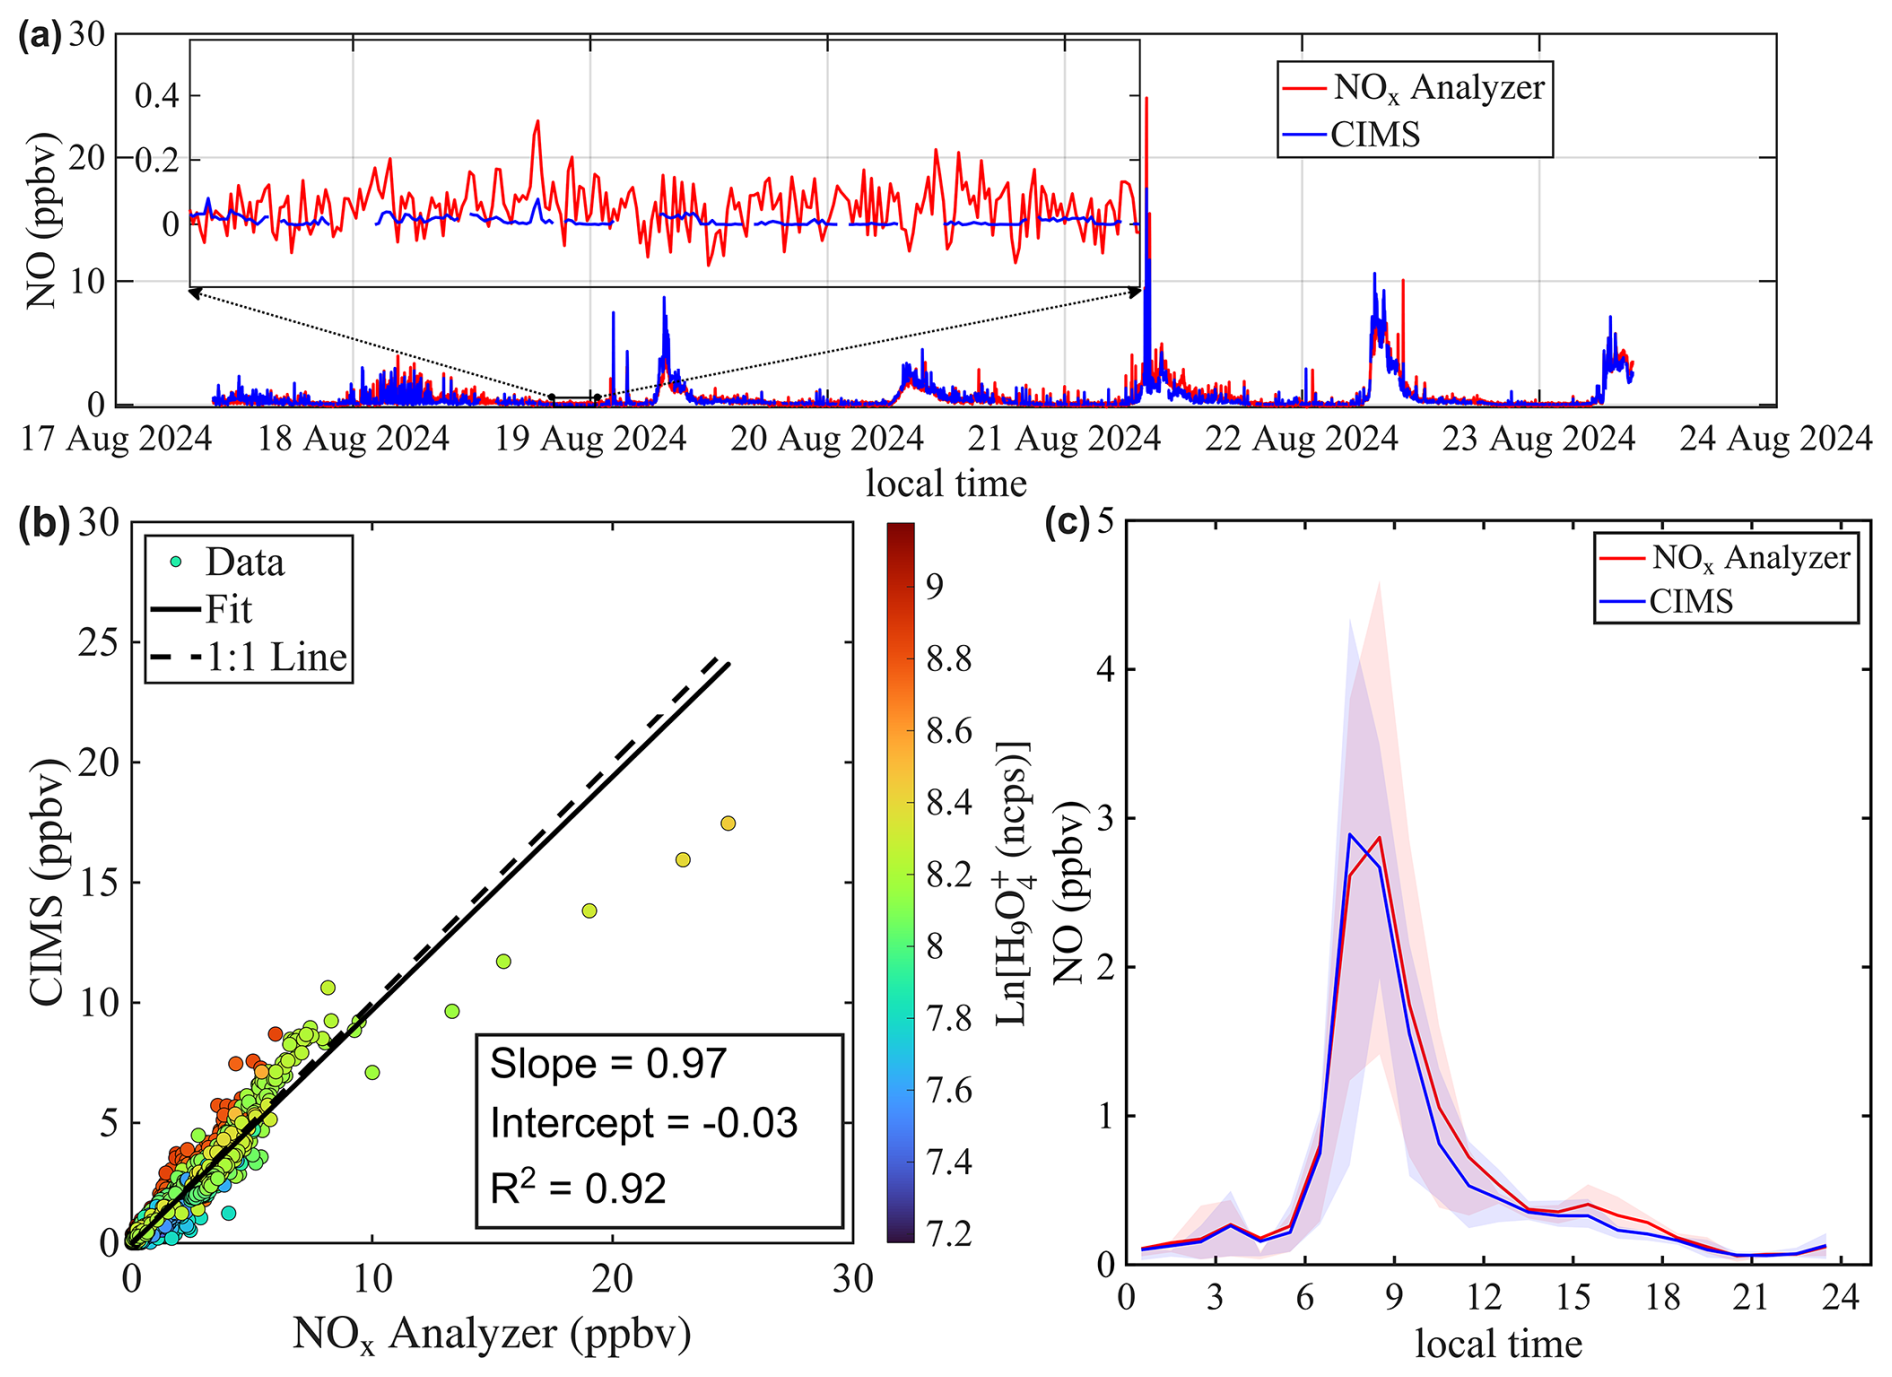
Figure 6Intercomparison of NO mixing ratios measured by benzene CIMS and NOx analyzer. The 1 Hz CIMS data are averaged to 1 min resolution to match that of the NOx analyzer. (a) Time series of NO during ambient sampling in St. Louis. (b) Scatter plot comparing NO measurements from the two instruments. Data points are colored by the natural log signal of the water tetramer ion. (c) Diurnal trend of NO mixing ratio represented by the median value. Shaded areas represent the 25th and 75th quartiles.
The inset in Fig. 6a zooms in on a period with low NO mixing ratio. It shows that the signal-to-noise ratio of the benzene CIMS clearly exceeds that of the commercial NOx analyzer. Table 2 compares the performance of the benzene CIMS with four CL NOx analyzers (Thermo 42i, Teledyne API T200U, AECOM Serinus 40, and Ecophysics CLD 780 TR), one research-grade CL analyzer (Ridley and Grahek, 1990), and one LIF NO analyzer (Rollins et al., 2020). The LIF instrument demonstrates the best overall performance, with the highest precision, lowest zero noise, and lowest detection limit. The benzene CIMS, research-grade CL analyzer, and Ecophysics CLD 780 TR show comparable performance, with single-pptv-level detection limits. In contrast, the other three commercial NOx analyzers exhibit higher zero noise and detection limits, typically in the tens to hundreds of pptv range.
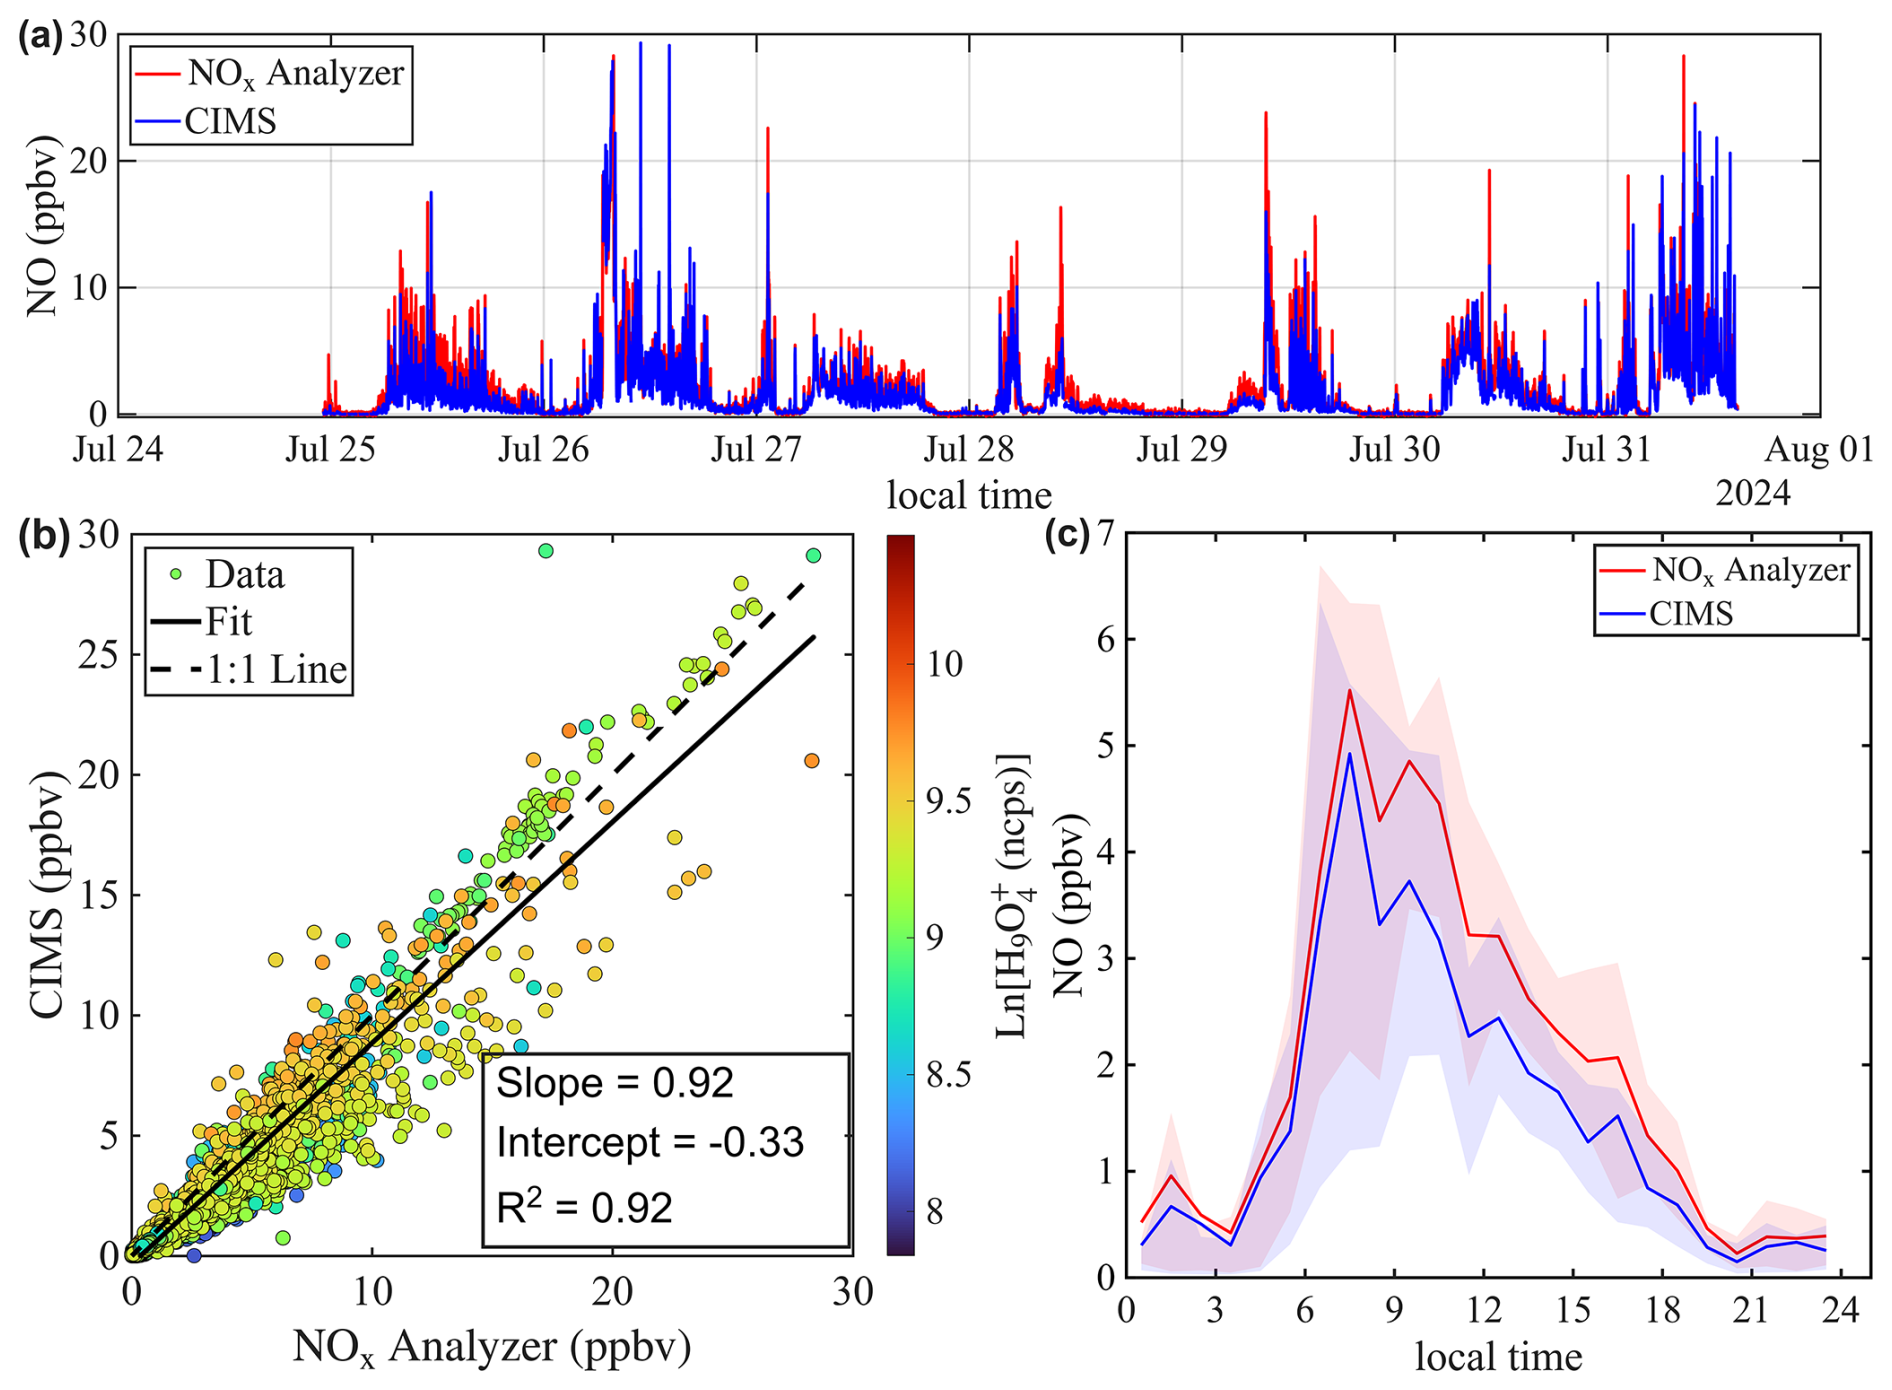
Table 2Specifications of the benzene CIMS, CL, and LIF instruments used for NO measurement. Information for the LIF and the research grade CL instruments are from Rollins et al. (2020) and Ridley and Grahek (1990), respectively. Information for commercial instruments is sourced from product brochures. The precision, zero noise, and detection limits correspond to 1 minute integration time. Precision is calculated using normalized adjacent differences, and detection limits are defined as 3 standard deviations (σ) of the background signal. Further details on the calculation of precision and detection limits are provided in Sect. S2.2.

4.2 Measurements of Isoprene
As shown in Fig. 2, isoprene exhibits a complex distribution of product ions in the benzene CIMS. For quantification, we select the adduct ion , which represents the largest fraction (about 20 %) of the total product ion signal. Several oxygenated product ions, including C4H7O+ and , contribute a notable portion of the overall signal. However, quantifying isoprene based on these oxygenated ions poses challenges due to potential interferences from oxygenated volatile organic compounds (OVOCs) present in ambient air.
Figure 8a shows the time series of isoprene mixing ratios in St. Louis. Overall, the benzene CIMS measurements agree well with those from the GC-PID, yielding a linear regression of and an R2 of 0.99. Closer inspection of the time series reveals that the CIMS-reported isoprene was slightly lower than the GC-PID on the first day of measurements but became slightly higher during the latter part of the campaign. This shift may contribute to the slope deviating from unity and the non-zero intercept. This shift could be caused by drift in instrument sensitivity or potential interferences in the CIMS measurement. However, calibrations were not performed frequently enough to evaluate the stability of CIMS and GC-PID sensitivities. The diurnal trend of isoprene (Fig. 8c) accentuates the period when CIMS reported higher values.
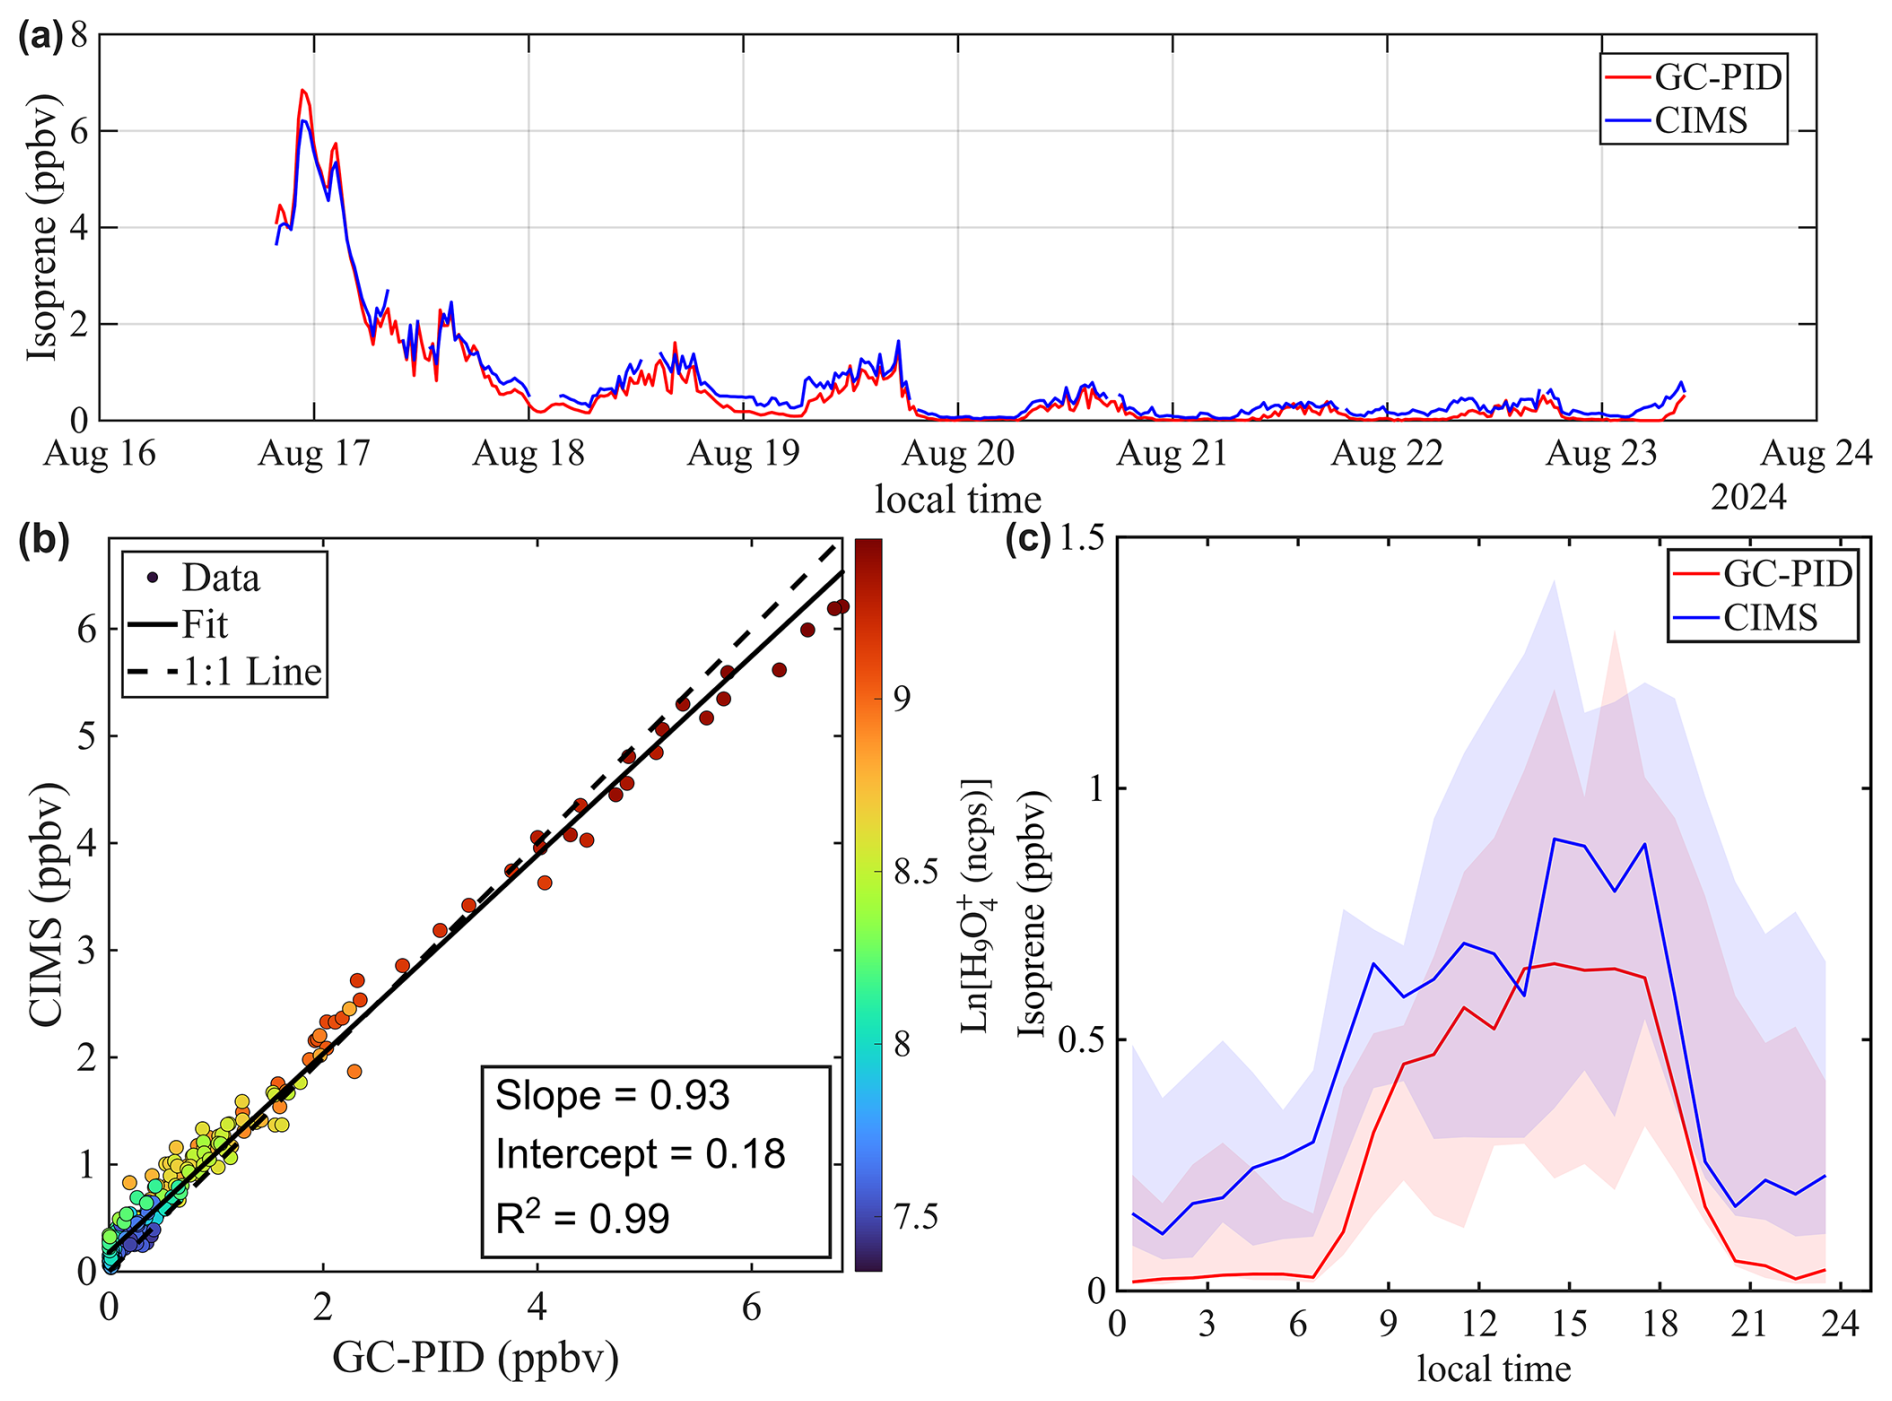
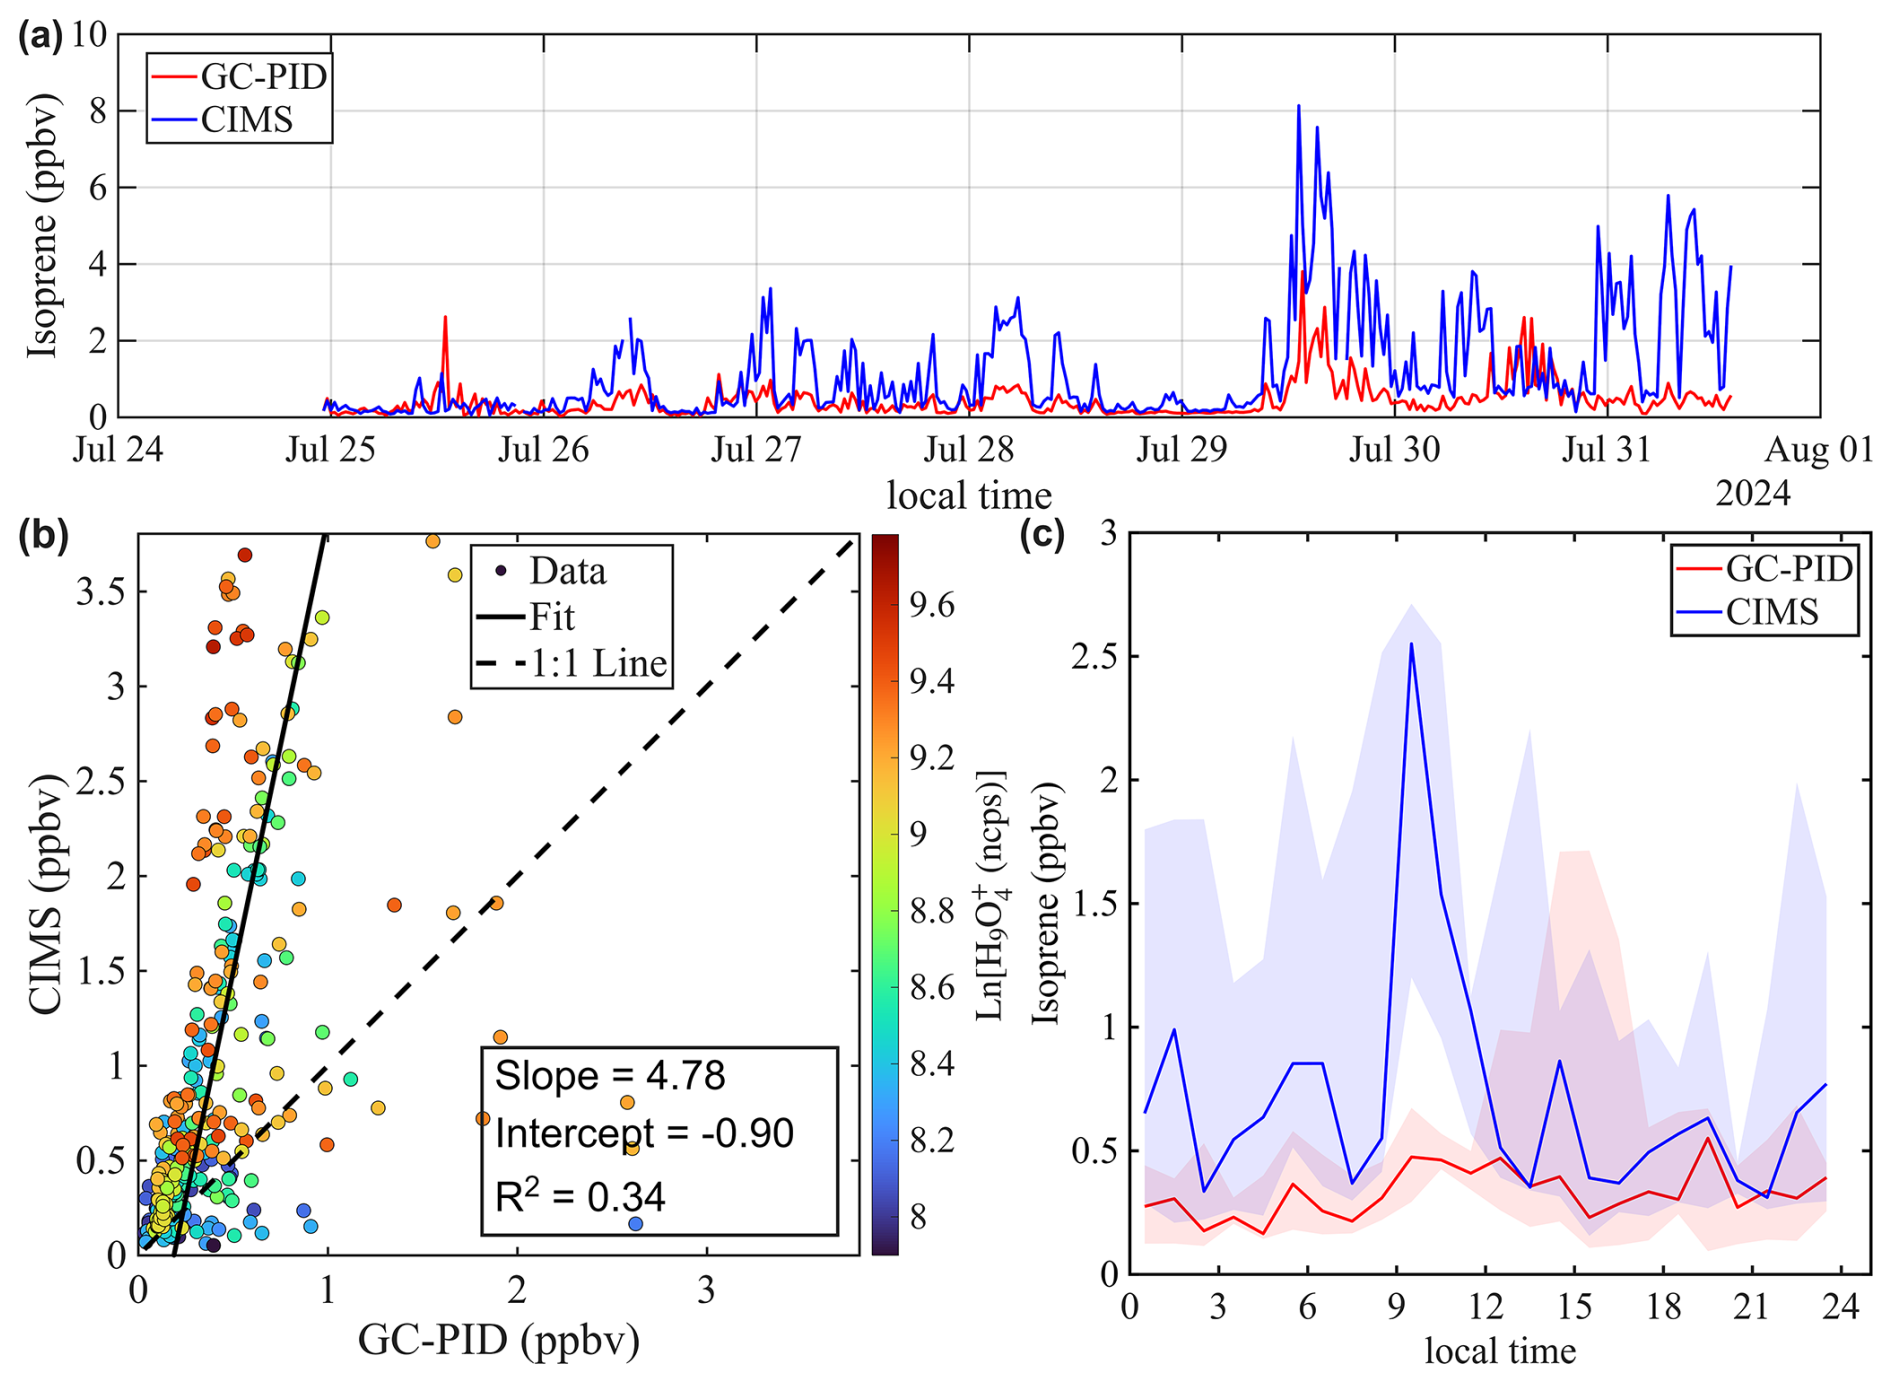
Figure 8Intercomparison of Isoprene mixing ratios measured by benzene CIMS and GC-PID. The 1 Hz CIMS data are averaged to 10 min sample collection period of GC-PID. (a) Time series of isoprene during ambient sampling in St. Louis. (b) Scatter plot comparing isoprene measurements from the two instruments. Data points are colored by the natural log signal of the water tetramer ion. (c) Diurnal trend of isoprene mixing ratio represented by the median value. Shaded areas represent the 25th and 75th quartiles.
The agreement between the CIMS and GC-PID measurements is worse in Chicago compared to St. Louis. As shown in Fig. 9a, isoprene mixing ratios measured by CIMS are generally higher than those measured by the GC-PID, and the correlation between the two instruments is weak (R2=0.34). This observation is consistent with findings from Leibrock et al. (2003), which reported that CIMS-measured isoprene levels in Boulder, CO were frequently higher than those measured by GC. That discrepancy was attributed to interferences from anthropogenic emissions from the Denver metropolitan area. A similar explanation likely applies here, as the Chicago site is located in a polluted urban area where CIMS measurements could be influenced by anthropogenic emissions such as 1,3-pentadiene, an isomer of isoprene. Taken together, the results from Leibrock et al. (2003) and this study highlight the challenges of using benzene CIMS to measure isoprene in polluted environments.
4.3 Measurements of other analytes
The benzene CIMS detected nearly 500 ions above the detection limit in both St. Louis and Chicago. Figure 10 presents a mass defect plot based on the St. Louis dataset, illustrating the instrument's measurement capabilities. In this plot, each ion is represented by a symbol denoting its chemical family. We classify the detected ions into two groups based on whether their degree of unsaturation is an integer: (1) adduct and charge transfer ions (integer values) and (2) proton transfer and hydride abstraction ions. Further classification of ionization pathways based solely on ion formula is challenging, as a given molecular formula may correspond to multiple ionization pathways. For example, C7H8O+ may arise from charge transfer of cresol or from adduct formation with formaldehyde. Although such ambiguities exist, ionization pathways can be inferred using prior knowledge of analyte properties or laboratory experiments. In this case, C7H8O+ is likely the charge transfer of cresol, as benzene CIMS is not sensitive to formaldehyde based on laboratory experiments. Among all detected ions, adduct and charge transfer ions account for 49 %, with the remainder consisting of proton transfer and hydride abstraction ions. Within the adduct/charge transfer category, 65 % of the ions are CxHyO and 26 % are CxH. Within proton transfer/hydride abstraction category, 64 % are CxHyO and 17 % are CxH.
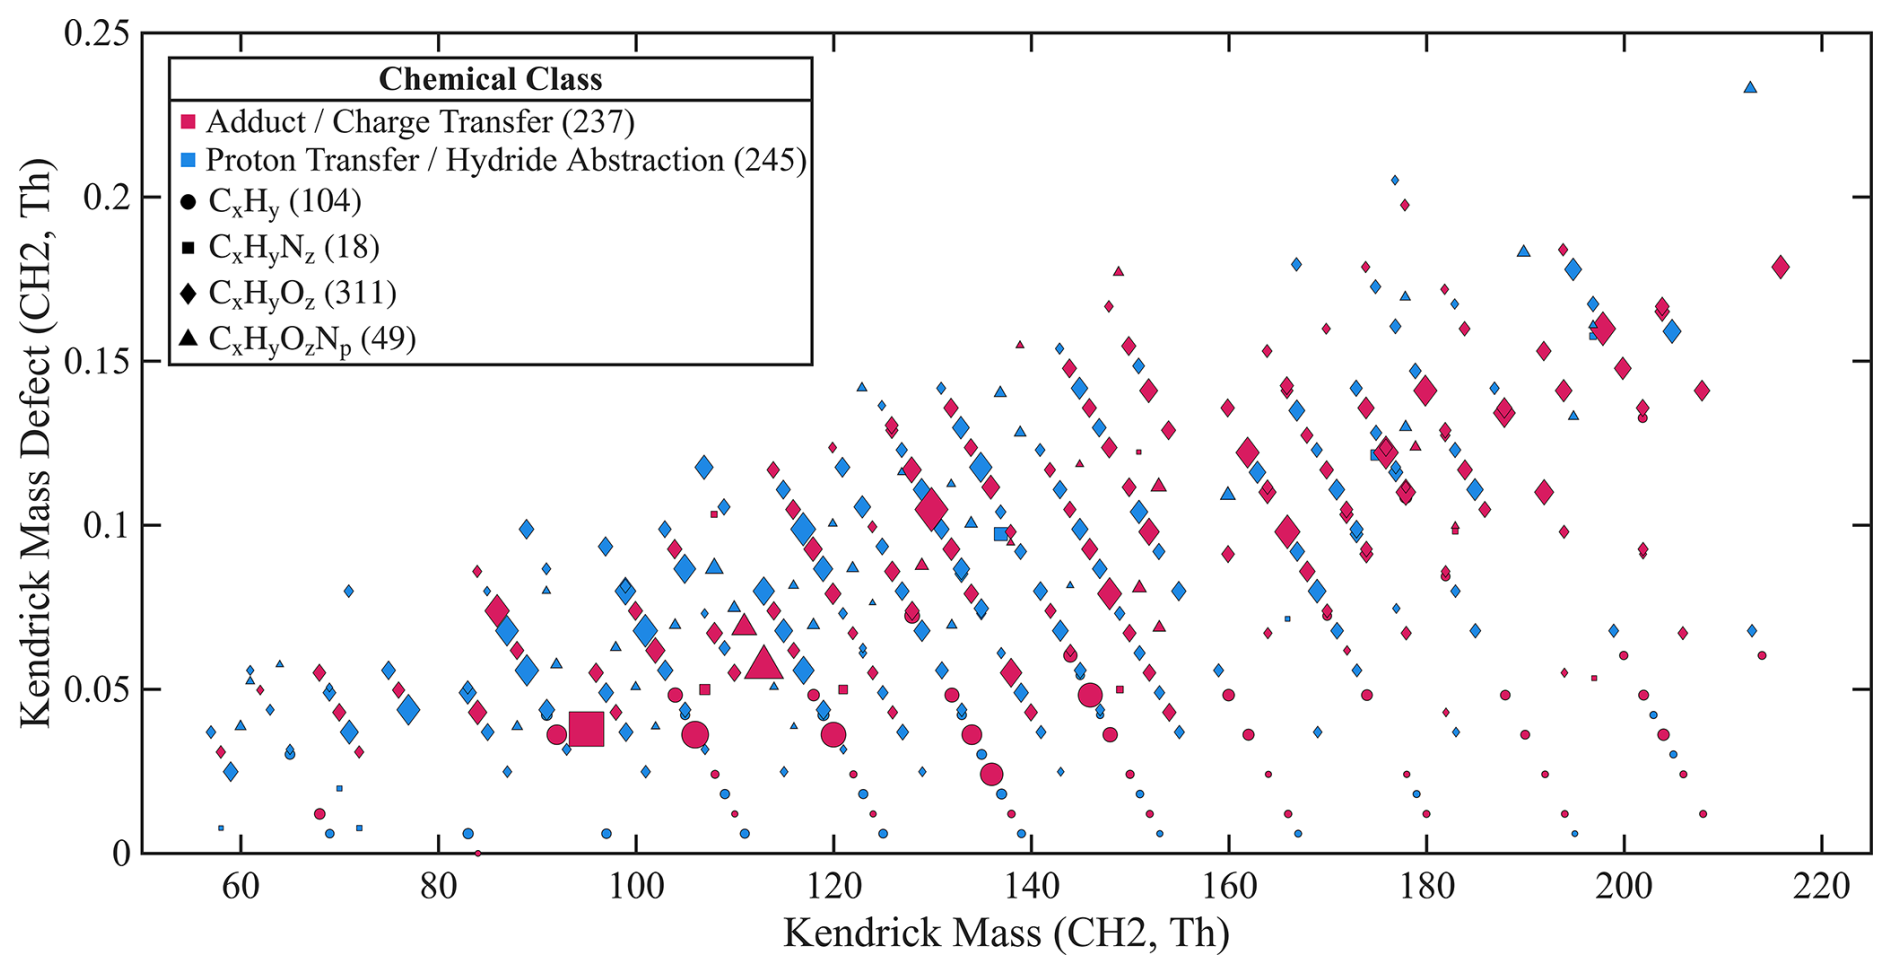
Figure 10Mass defect plot using CH2 as the reference unit, based on the St. Louis dataset. Each point represents an individual ion, with symbol shape denoting its chemical family and color indicating its ionization pathway. Products from proton transfer and hydride abstraction are grouped together, as they cannot be distinguished. The number of ions corresponding to each chemical family and ionization pathway is provided in parentheses in the legend. Symbol size is scaled to the square root of the campaign-averaged signal. A total of 482 ions with signals above the detection limit are shown. Note that a single analyte may contribute to multiple product ions.
Within the oxygenated compounds, we observe ions corresponding to known isoprene oxidation products. These include C10H12O+, likely representing adduct ions of MACR and methyl vinyl ketone (MVK), corresponding to charge transfer ions of isoprene epoxydiol (IEPOX) and isoprene hydroxy hydroperoxides (ISOPOOHs), and corresponding to charge transfer ions of isoprene hydroxycarbonyls. The time series and diurnal patterns of these ions are presented in Fig. 11. Further identification and speciation of these ions will require complementary approaches, including thermodynamic property calculations, GC for isomer separation, and laboratory isoprene oxidation experiments.
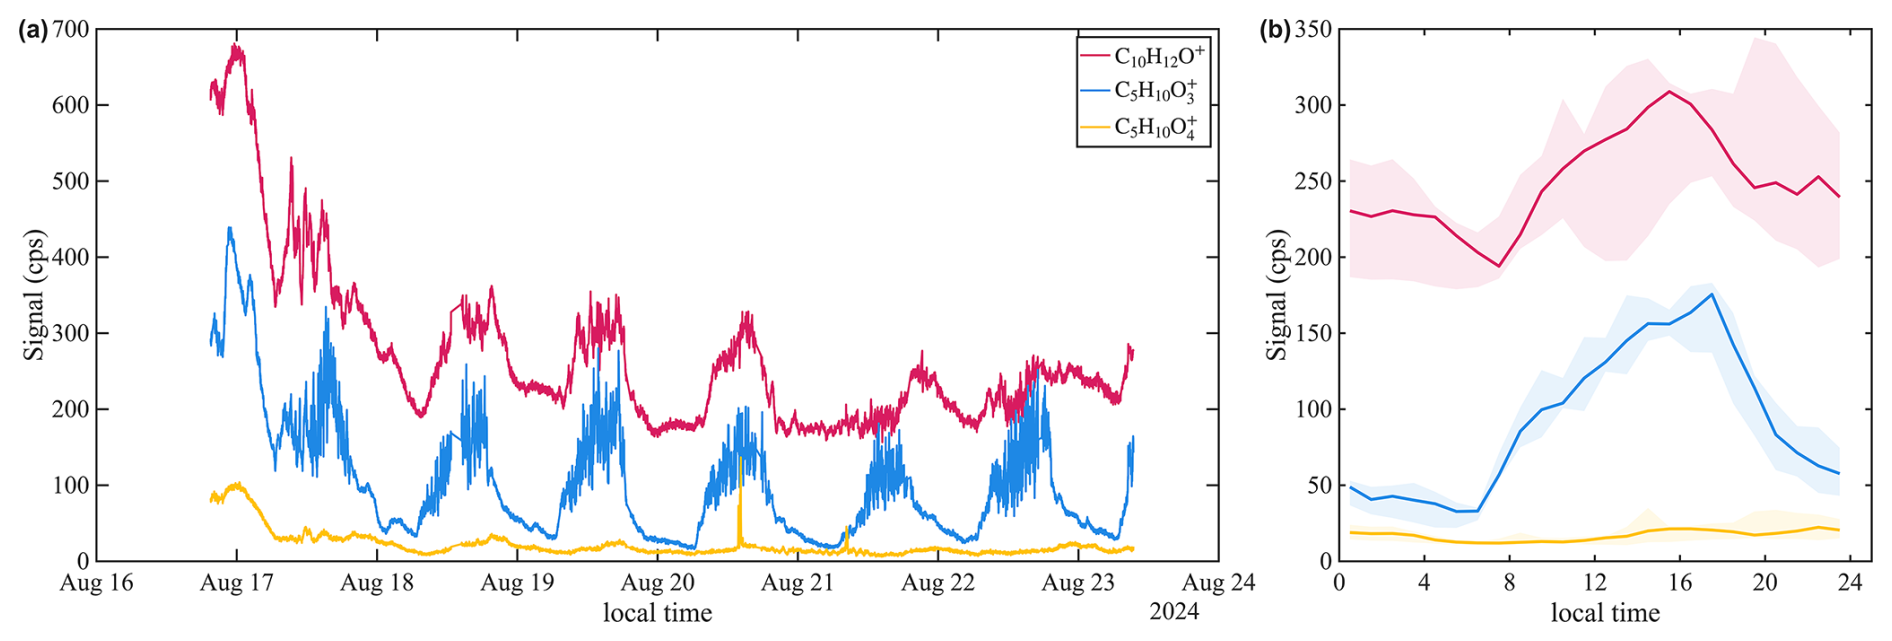
Figure 11(a) Time series and (b) diurnal trends of potential isoprene oxidation products detected by benzene CIMS in St. Louis.
In this study, we characterize the performance of a CIMS using benzene cations as reagent ions through laboratory calibrations and ambient measurements. While previous studies have examined the performance of benzene CIMS for specific analytes, this work provides a systematic evaluation of its capability to detect a broad range of atmospheric species.
The ion chemistry of benzene cations is complex due to the presence of two reagent ions and multiple competing ionization pathways. Fundamentally, the competition between these ionization pathways is governed by key thermodynamic properties of the analytes, including ionization energy, proton affinity, affinity, and hydride abstraction potential. To help interpret this complexity, we introduce a framework that enables qualitative prediction of an analyte’s ion chemistry. In this framework, analytes are categorized into three classes based on their IEs. Analytes within the same class tend to exhibit similar ionization mechanisms and sensitivities.
For analytes in the low IE class, those with IE lower than those of both the benzene monomer and dimer, the dominant ionization pathway is charge transfer with both reagent ions, resulting in the molecular ion as the primary product ion. Fragmentation of the molecular ion may occur if the appearance energy of a fragment ion is lower than the ionization energy of the reagent ion. Analytes in this class exhibit the highest absolute sensitivities among all classes, typically ranging from 9.2 to 11.2 cps pptv−1, which likely represents the collision-limit sensitivity. Apparent deviations from this range may arise due to reduced transmission efficiency or fragmentation of the molecular ion.
For analytes in the mid IE class, those with IE higher than that of the benzene dimer but lower than that of the benzene monomer, the ionization pathways depend on the reagent ion. These analytes can undergo charge transfer with to form molecular ions, or they may undergo ligand exchange reactions with to form adduct ions, if their affinity exceeds that of benzene. Consequently, the product ion distribution is highly sensitive to the relative abundance of and , which likely explains the variability in product ion distrbutions for the same analyte (e.g., isoprene and DMS) between this study and previous studies. For analytes where the molecular ion is the dominant product (e.g., toluene, D5-siloxane, and chlorobenzene), absolute sensitivities range from 7.8 to 9.0 cps pptv−1. These values are slightly lower than those of low IE analytes, likely because only contributes to charge transfer in the mid IE, whereas both and contribute in the low IE.
For analytes in the high IE class, those with IE greater than both the benzene monomer and dimer, charge transfer with either reagent ion does not occur. Instead, other ionization pathways such as proton transfer, adduct formation, and hydride abstraction may occur, depending on the thermodynamic properties of the analytes. Adduct formation is possible if the analyte has a higher affinity than benzene. The absolute sensitivities for adduct ions fall within a narrow range (1.6–3.3 cps pptv−1) for the four analytes examined here (DMS, NO, MACR, and NH3). Hydride abstraction may also occur (e.g., for 232-MBO), but the lack of relevant thermodynamic data limits further evaluation of this pathway.
The proposed framework provides a useful tool for diagnosing measurement capability, predicting ionization pathways and product ions, and constraining the sensitivity, provided their key thermodynamic properties are known. For example, benzene CIMS is unlikely to be sensitive to analytes with IE larger than benzene, PA smaller than phenyl radical, and affinity smaller than benzene. For analytes with IE smaller than benzene dimer (i.e., low IE), charge transfer is likely the predominant ionization pathway. Their absolute sensitivities can be estimated at roughly 10 ± 2 cps pptv−1, assuming minimal fragmentation and high transmission efficiency. This framework also informs strategies to optimize instrument sensitivity for specific analytes. For instance, a higher abundance of should be targeted for analytes with α values greater than β, as is typical for low IE species. If reducing fragmentation is a priority, the abundance of in the IMR should be maximized, which has softer ionization chemistry than .
We acknowledge that the proposed framework has uncertainties and limitations that can be addressed in future work. First, calibrating a broader range of analytes will test the robustness of the framework and help refine uncertainties in absolute sensitivity, as well as in the α and β values. One important group currently underrepresented is oxygenated VOCs, including oxidation products of VOCs. They are highly relevant but challenging to study due to two key issues: the lack of authentic standards and the complexity of these compounds as mixtures. Second, improving the framework will require better knowledge of key thermodynamic properties of analytes. While proton affinity is well-characterized for many compounds, data for affinity and the reaction enthalpy of hydride abstraction are scarce. Theoretical calculations offer an efficient means to obtain these values. Third, special cases such as the effects of O2 on the isoprene product ions deserve further attention. Finally, as instrument conditions (especially declustering that dissociate adduct ions) influence ion chemistry and complicates the product interpretation, caution is required when applying this framework to other instrumental setups.
The benzene CIMS is capable of concurrent detection of NO, VOCs, and their oxidation products. This offers significant advantages by reducing instrumentation complexity and cost while providing collocated, time-resolved measurements of key reactive species. It achieves a detection limit of 5 pptv for NO for 1 min integration time, outperforming most commercial NOx analyzers. For many VOCs, the absolute sensitivities and detection limits are comparable to those achieved with state-of-the-art VOCUS PTR reactors. We deployed the benzene CIMS at two sites with contrasting conditions. Isoprene measurements showed good agreement with the GC-PID in St. Louis, but not in Chicago. While many studies have evaluated the instrument’s ability to detect isoprene in laboratory settings, field validation remains limited. Our results highlight potential challenges in measuring isoprene in urban environments, where interference from anthropogenic compounds may be significant. NO measurements from the benzene CIMS showed good agreement with co-located NOx analyzers at both sites. However, due to the limited precision of commercial NOx analyzers, we are unable to rigorously assess the accuracy of the CIMS at low NO concentrations. Future comparisons with more precise instruments would be valuable for evaluating CIMS precision under low-NO conditions. Additionally, better characterizing or mitigating the instrument's humidity-dependent sensitivity would further improve measurement accuracy. For example, using an external water vapor measurement rather than water ion signals measured by the CIMS could remove the influence of analyte concentration on the humidity-dependent sensitivity correction. Operating at lower IMR pressure or introducing dry dilution gas could also mitigate humidity dependence. Taking NO as an example, diluting an ambient sample with a 2 % water mixing ratio by a factor of 4 to reduce the water mixing ratio to 0.5 % could increase the sensitivity by a factor of 8 (Fig. 4), thereby compensating for the decrease in absolute sensitivity due to dilution. These approaches will be the focus of our future work.
The field campaign sampling data is available on https://doi.org/10.15485/2547039 (Chen et al., 2025).
The supplement related to this article is available online at https://doi.org/10.5194/amt-19-1421-2026-supplement.
UP and LX designed the research, UP operated the CIMS and PICARRO, JRK operated the GC-PID, XC operated the NOx analyzer, BW provided dataset for calculating transmission efficiency and JHC, JL, MAG, and JW provided critical support for the field depolyment. All authors commented on the paper.
The contact author has declared that none of the authors has any competing interests.
Publisher's note: Copernicus Publications remains neutral with regard to jurisdictional claims made in the text, published maps, institutional affiliations, or any other geographical representation in this paper. The authors bear the ultimate responsibility for providing appropriate place names. Views expressed in the text are those of the authors and do not necessarily reflect the views of the publisher.
We thank Jenna Ditto for sharing the VOC cylinder. We thank Max Berkelhammer from University of Illinois, Chicago for his coordination of the ground site. We thank Rohan Mishra and John Cavin for useful discussions on the thermodynamics.
This work is supported by the U.S. Department of Energy, Office of Science, Office of Biological and Environmental Research, 85 through the Urban Integrated Field Laboratories CROCUS project under Award Numbers DE-SC0023253 and DE-SC0023226.
This paper was edited by Fred Stroh and reviewed by Greg Huey and one anonymous referee.
Adams, C., McLinden, C. A., Shephard, M. W., Dickson, N., Dammers, E., Chen, J., Makar, P., Cady-Pereira, K. E., Tam, N., Kharol, S. K., Lamsal, L. N., and Krotkov, N. A.: Satellite-derived emissions of carbon monoxide, ammonia, and nitrogen dioxide from the 2016 Horse River wildfire in the Fort McMurray area, Atmos. Chem. Phys., 19, 2577–2599, https://doi.org/10.5194/acp-19-2577-2019, 2019. a
Aggarwal, S., Bansal, P., Wang, Y., Jorga, S., Macgregor, G., Rohner, U., Bannan, T., Salter, M., Zieger, P., Mohr, C., and Lopez-Hilfiker, F.: Identifying key parameters that affect sensitivity of flow tube chemical ionization mass spectrometers, Atmos. Meas. Tech., 18, 4227–4247, https://doi.org/10.5194/amt-18-4227-2025, 2025. a
Allgood, C., Lin, Y., Ma, Y.-C., and Munson, B.: Benzene as a selective chemical ionization reagent gas, Organic Mass Spectrometry, 25, 497–502, https://doi.org/10.1002/oms.1210251003, 1990. a
Alton, M. W. and Browne, E. C.: Atmospheric Chemistry of Volatile Methyl Siloxanes: Kinetics and Products of Oxidation by OH Radicals and Cl Atoms, Environ. Sci. Technol., 54, 5992–5999, https://doi.org/10.1021/acs.est.0c01368, 2020. a
Bargholz, A., Oswald, R., and Botschwina, P.: Spectroscopic and thermochemical properties of the c-C6H7 radical: A high-level theoretical study, The Journal of Chemical Physics, 138, 014307, https://doi.org/10.1063/1.4773015, 2013. a
Bertram, T. H., Kimmel, J. R., Crisp, T. A., Ryder, O. S., Yatavelli, R. L. N., Thornton, J. A., Cubison, M. J., Gonin, M., and Worsnop, D. R.: A field-deployable, chemical ionization time-of-flight mass spectrometer, Atmos. Meas. Tech., 4, 1471–1479, https://doi.org/10.5194/amt-4-1471-2011, 2011. a
Bollinger, M. J.: Chemiluminescent Measurements of the Oxides of Nitrogen in the Clean Troposphere and Atmospheric Chemistry Implications (colorado), PhD, University of Colorado at Boulder, United States – Colorado, ISBN 9798204613607, https://www.proquest.com/docview/303219726/abstract/66731B15575D41CCPQ/1 (last access: 21 August 2025), 1982. a
Bradshaw, J. D., Rodgers, M. O., and Davis, D. D.: Single photon laser-induced fluorescence detection of NO and SO2 for atmospheric conditions of composition and pressure, Appl. Opt., 21, 2493–2500, https://doi.org/10.1364/AO.21.002493, 1982. a
Breitenlechner, M., Novak, G. A., Neuman, J. A., Rollins, A. W., and Veres, P. R.: A versatile vacuum ultraviolet ion source for reduced pressure bipolar chemical ionization mass spectrometry, Atmos. Meas. Tech., 15, 1159–1169, https://doi.org/10.5194/amt-15-1159-2022, 2022. a
Chen, X., Puttu, U., Xu, L., and Wang, J.: CROCUS Air Quality Dataset from the University of Illinois Chicago (UIC), Community Research on Climate and Urban Science Urban Integrated Field Laboratory (CROCUS UIFL), ESS-DIVE repository [data set], https://doi.org/10.15485/2547039, 2025. a
Coggon, M. M., Stockwell, C. E., Claflin, M. S., Pfannerstill, E. Y., Xu, L., Gilman, J. B., Marcantonio, J., Cao, C., Bates, K., Gkatzelis, G. I., Lamplugh, A., Katz, E. F., Arata, C., Apel, E. C., Hornbrook, R. S., Piel, F., Majluf, F., Blake, D. R., Wisthaler, A., Canagaratna, M., Lerner, B. M., Goldstein, A. H., Mak, J. E., and Warneke, C.: Identifying and correcting interferences to PTR-ToF-MS measurements of isoprene and other urban volatile organic compounds, Atmos. Meas. Tech., 17, 801–825, https://doi.org/10.5194/amt-17-801-2024, 2024. a
de Gouw, J., Warneke, C., Karl, T., Eerdekens, G., van der Veen, C., and Fall, R.: Sensitivity and specificity of atmospheric trace gas detection by proton-transfer-reaction mass spectrometry, International Journal of Mass Spectrometry, 223–224, 365–382, https://doi.org/10.1016/S1387-3806(02)00926-0, 2003. a
Dong, F., Li, H., Liu, B., Liu, R., and Hou, K.: Protonated acetone ion chemical ionization time-of-flight mass spectrometry for real-time measurement of atmospheric ammonia, Journal of Environmental Sciences, 114, 66–74, https://doi.org/10.1016/j.jes.2021.07.023, 2022. a
Dunn, M. E., Pokon, E. K., and Shields, G. C.: Thermodynamics of Forming Water Clusters at Various Temperatures and Pressures by Gaussian-2, Gaussian-3, Complete Basis Set-QB3, and Complete Basis Set-APNO Model Chemistries; Implications for Atmospheric Chemistry, J. Am. Chem. Soc., 126, 2647–2653, https://doi.org/10.1021/ja038928p, 2004. a
Fontijn, A., Sabadell, A. J., and Ronco, R. J.: Homogeneous chemiluminescent measurement of nitric oxide with ozone. Implications for continuous selective monitoring of gaseous air pollutants, Anal. Chem., 42, 575–579, https://doi.org/10.1021/ac60288a034, 1970. a
Gross, J. H.: Mass Spectrometry, Springer International Publishing, Cham, ISBN 978-3-319-54397-0 978-3-319-54398-7, https://doi.org/10.1007/978-3-319-54398-7, 2017. a
Grover, J. R., Walters, E. A., and Hui, E. T.: Dissociation energies of the benzene dimer and dimer cation, J. Phys. Chem., 91, 3233–3237, https://doi.org/10.1021/j100296a026, 1987. a
Guenther, A., Hewitt, C. N., Erickson, D., Fall, R., Geron, C., Graedel, T., Harley, P., Klinger, L., Lerdau, M., Mckay, W. A., Pierce, T., Scholes, B., Steinbrecher, R., Tallamraju, R., Taylor, J., and Zimmerman, P.: A global model of natural volatile organic compound emissions, Journal of Geophysical Research: Atmospheres, 100, 8873–8892, https://doi.org/10.1029/94JD02950, 1995. a
uenther, A., Karl, T., Harley, P., Wiedinmyer, C., Palmer, P. I., and Geron, C.: Estimates of global terrestrial isoprene emissions using MEGAN (Model of Emissions of Gases and Aerosols from Nature), Atmos. Chem. Phys., 6, 3181–3210, https://doi.org/10.5194/acp-6-3181-2006, 2006. a
Guenther, A. B., Jiang, X., Heald, C. L., Sakulyanontvittaya, T., Duhl, T., Emmons, L. K., and Wang, X.: The Model of Emissions of Gases and Aerosols from Nature version 2.1 (MEGAN2.1): an extended and updated framework for modeling biogenic emissions, Geosci. Model Dev., 5, 1471–1492, https://doi.org/10.5194/gmd-5-1471-2012, 2012. a, b
Hunter, E. P. L. and Lias, S. G.: Evaluated Gas Phase Basicities and Proton Affinities of Molecules: An Update, Journal of Physical and Chemical Reference Data, 27, 413–656, https://doi.org/10.1063/1.556018, 1998. a
Ibrahim, Y. M., Meot-Ner, M., Alshraeh, E. H., El-Shall, M. S., and Scheiner, S.: Stepwise Hydration of Ionized Aromatics. Energies, Structures of the Hydrated Benzene Cation, and the Mechanism of Deprotonation Reactions, J. Am. Chem. Soc., 127, 7053–7064, https://doi.org/10.1021/ja050477g, 2005. a
Ji, Y., Huey, L. G., Tanner, D. J., Lee, Y. R., Veres, P. R., Neuman, J. A., Wang, Y., and Wang, X.: A vacuum ultraviolet ion source (VUV-IS) for iodide–chemical ionization mass spectrometry: a substitute for radioactive ion sources, Atmos. Meas. Tech., 13, 3683–3696, https://doi.org/10.5194/amt-13-3683-2020, 2020. a, b
Jokinen, T., Sipilä, M., Junninen, H., Ehn, M., Lönn, G., Hakala, J., Petäjä, T., Mauldin III, R. L., Kulmala, M., and Worsnop, D. R.: Atmospheric sulphuric acid and neutral cluster measurements using CI-APi-TOF, Atmos. Chem. Phys., 12, 4117–4125, https://doi.org/10.5194/acp-12-4117-2012, 2012. a
Karl, T., Hansel, A., Cappellin, L., Kaser, L., Herdlinger-Blatt, I., and Jud, W.: Selective measurements of isoprene and 2-methyl-3-buten-2-ol based on NO+ ionization mass spectrometry, Atmos. Chem. Phys., 12, 11877–11884, https://doi.org/10.5194/acp-12-11877-2012, 2012. a
Kim, M. J., Zoerb, M. C., Campbell, N. R., Zimmermann, K. J., Blomquist, B. W., Huebert, B. J., and Bertram, T. H.: Revisiting benzene cluster cations for the chemical ionization of dimethyl sulfide and select volatile organic compounds, Atmos. Meas. Tech., 9, 1473–1484, https://doi.org/10.5194/amt-9-1473-2016, 2016. a, b, c, d, e
Kley, D. and McFarland, M.: Chemiluminescence detector for NO and NO2, Atmos. Technol., (United States), 12, https://www.osti.gov/biblio/6457230 (last access: 21 August 2025), 1980. a
Koss, A. R., Warneke, C., Yuan, B., Coggon, M. M., Veres, P. R., and de Gouw, J. A.: Evaluation of NO+ reagent ion chemistry for online measurements of atmospheric volatile organic compounds, Atmos. Meas. Tech., 9, 2909–2925, https://doi.org/10.5194/amt-9-2909-2016, 2016. a, b
Lasek, J. A. and Lajnert, R.: On the Issues of NOx as Greenhouse Gases: An Ongoing Discussion..., Applied Sciences, 12, 10429, https://doi.org/10.3390/app122010429, 2022. a
Lavi, A., Vermeuel, M. P., Novak, G. A., and Bertram, T. H.: The sensitivity of benzene cluster cation chemical ionization mass spectrometry to select biogenic terpenes, Atmos. Meas. Tech., 11, 3251–3262, https://doi.org/10.5194/amt-11-3251-2018, 2018. a, b, c, d, e, f, g, h
Lee, B. H., Lopez-Hilfiker, F. D., Mohr, C., Kurtén, T., Worsnop, D. R., and Thornton, J. A.: An Iodide-Adduct High-Resolution Time-of-Flight Chemical-Ionization Mass Spectrometer: Application to Atmospheric Inorganic and Organic Compounds, Environ. Sci. Technol., 48, 6309–6317, https://doi.org/10.1021/es500362a, 2014. a
Leibrock, E. and Huey, L. G.: Ion chemistry for the detection of isoprene and other volatile organic compounds in ambient air, Geophysical Research Letters, 27, 1719–1722, https://doi.org/10.1029/1999GL010804, 2000. a, b, c
Leibrock, E., Huey, L. G., Goldan, P. D., Kuster, W. C., Williams, E., and Fehsenfeld, F. C.: Ground-based intercomparison of two isoprene measurement techniques, Atmos. Chem. Phys., 3, 67–72, https://doi.org/10.5194/acp-3-67-2003, 2003. a, b, c, d
Lias, S. G., American Chemical Society, American Institute of Physics, USA, and United States (Eds.): Gas-phase ion and neutral thermochemistry, no. 17,1 in Journal of physical and chemical reference data Supplement, American Chemical Soc. [u.a.], Washington, DC, ISBN 9780883185629, 1988. a
Linstrom, P. J., Mallard, W. G., and National Institute of Standards and Technology (U.S.): NIST chemistry webbook, NIST standard reference database; 69, National Institute of Standards and Technology, Gaithersburg MD, 20899, http://webbook.nist.gov/chemistry/ (last access: 21 August 2025), 1997. a
McDonald, B. C., de Gouw, J. A., Gilman, J. B., Jathar, S. H., Akherati, A., Cappa, C. D., Jimenez, J. L., Lee-Taylor, J., Hayes, P. L., McKeen, S. A., Cui, Y. Y., Kim, S.-W., Gentner, D. R., Isaacman-VanWertz, G., Goldstein, A. H., Harley, R. A., Frost, G. J., Roberts, J. M., Ryerson, T. B., and Trainer, M.: Volatile chemical products emerging as largest petrochemical source of urban organic emissions, Science, 359, 760–764, https://doi.org/10.1126/science.aaq0524, 2018. a
Mizuse, K., Hasegawa, H., Mikami, N., and Fujii, A.: Infrared and Electronic Spectroscopy of Benzene−Ammonia Cluster Radical Cations [C6 H6 (NH3 )1,2 ]+: Observation of Isolated and Microsolvated σ-Complexes, J. Phys. Chem. A, 114, 11060–11069, https://doi.org/10.1021/jp1009466, 2010. a
Mungall, E. L., Croft, B., Lizotte, M., Thomas, J. L., Murphy, J. G., Levasseur, M., Martin, R. V., Wentzell, J. J. B., Liggio, J., and Abbatt, J. P. D.: Dimethyl sulfide in the summertime Arctic atmosphere: measurements and source sensitivity simulations, Atmos. Chem. Phys., 16, 6665–6680, https://doi.org/10.5194/acp-16-6665-2016, 2016. a, b, c
Orlando, J. J. and Tyndall, G. S.: Laboratory studies of organic peroxy radical chemistry: an overview with emphasis on recent issues of atmospheric significance, Chem. Soc. Rev., 41, 6294–6317, https://doi.org/10.1039/C2CS35166H, 2012. a
Reents, W. D. J. and Freiser, B. S.: Gas-phase nitrosation of benzene. Implications for solution electrophilic aromatic substitution reactions, J. Am. Chem. Soc., 102, 271–276, https://doi.org/10.1021/ja00521a043, 1980. a
Ridley, B. A. and Grahek, F. E.: A Small, Low Flow, High Sensitivity Reaction Vessel for NO Chemiluminescence Detectors, Journal of Atmospheric and Oceanic Technology, 7, 307–311, https://doi.org/10.1175/1520-0426(1990)007<0307:ASLFHS>2.0.CO;2, 1990. a, b, c
Ridley, B. A. and Howlett, L. C.: An instrument for nitric oxide measurements in the stratosphere, Review of Scientific Instruments, 45, 742–746, https://doi.org/10.1063/1.1686726, 1974. a
Riva, M., Pospisilova, V., Frege, C., Perrier, S., Bansal, P., Jorga, S., Sturm, P., Thornton, J. A., Rohner, U., and Lopez-Hilfiker, F.: Evaluation of a reduced-pressure chemical ion reactor utilizing adduct ionization for the detection of gaseous organic and inorganic species, Atmos. Meas. Tech., 17, 5887–5901, https://doi.org/10.5194/amt-17-5887-2024, 2024. a, b, c, d, e
Rollins, A. W., Rickly, P. S., Gao, R.-S., Ryerson, T. B., Brown, S. S., Peischl, J., and Bourgeois, I.: Single-photon laser-induced fluorescence detection of nitric oxide at sub-parts-per-trillion mixing ratios, Atmos. Meas. Tech., 13, 2425–2439, https://doi.org/10.5194/amt-13-2425-2020, 2020. a, b, c
Schobesberger, S., D'Ambro, E. L., Vettikkat, L., Lee, B. H., Peng, Q., Bell, D. M., Shilling, J. E., Shrivastava, M., Pekour, M., Fast, J., and Thornton, J. A.: Airborne flux measurements of ammonia over the southern Great Plains using chemical ionization mass spectrometry, Atmos. Meas. Tech., 16, 247–271, https://doi.org/10.5194/amt-16-247-2023, 2023. a, b, c
Sieck, L. W. and Gorden, R.: Formation of dimeric parent cations in aromatic hydrocarbons, International Journal of Mass Spectrometry and Ion Physics, 19, 269–286, https://doi.org/10.1016/0020-7381(76)80011-3, 1976. a
Spanel, P. and Smith, D.: SIFT studies of the reactions of H3O+, NO+ and O with a series of alcohols, International Journal of Mass Spectrometry and Ion Processes, 167–168, 375–388, https://doi.org/10.1016/S0168-1176(97)00085-2, 1997. a
Steffenson, D. M. and Stedman, D. H.: Optimization of the operating parameters of chemiluminescent nitric oxide detectors, Anal. Chem., 46, 1704–1709, https://doi.org/10.1021/ac60348a042, 1974. a
Stone, J. A. and Lin, M. S.: The formation and reactions of aromatic dimer cations in a high pressure photoionization source, Can. J. Chem., 58, 1666–1672, https://doi.org/10.1139/v80-266, 1980. a
Vermeuel, M. P.: The Influence of Complex Meteorology and Surface Heterogeneity on Oxidation in the Troposphere, PhD, The University of Wisconsin – Madison, United States – Wisconsin, ISBN 9798597065342, https://www.proquest.com/dissertations-theses/influence-complex-meteorology-surface/docview/2511403096/se-2?accountid=15159, 2021. a, b
Wallington, T. J., Anderson, J. E., Dolan, R. H., and Winkler, S. L.: Vehicle emissions and urban air quality: 60 years of progress, Atmosphere, 13, 650, https://doi.org/10.3390/atmos13050650, 2022. a
Xu, L., Coggon, M. M., Stockwell, C. E., Gilman, J. B., Robinson, M. A., Breitenlechner, M., Lamplugh, A., Crounse, J. D., Wennberg, P. O., Neuman, J. A., Novak, G. A., Veres, P. R., Brown, S. S., and Warneke, C.: Chemical ionization mass spectrometry utilizing ammonium ions (NH CIMS) for measurements of organic compounds in the atmosphere, Atmos. Meas. Tech., 15, 7353–7373, https://doi.org/10.5194/amt-15-7353-2022, 2022. a, b
Yokelson, R. J., Christian, T. J., Karl, T. G., and Guenther, A.: The tropical forest and fire emissions experiment: laboratory fire measurements and synthesis of campaign data, Atmos. Chem. Phys., 8, 3509–3527, https://doi.org/10.5194/acp-8-3509-2008, 2008. a
Yuan, B., Koss, A., Warneke, C., Gilman, J. B., Lerner, B. M., Stark, H., and de Gouw, J. A.: A high-resolution time-of-flight chemical ionization mass spectrometer utilizing hydronium ions (H3O+ ToF-CIMS) for measurements of volatile organic compounds in the atmosphere, Atmos. Meas. Tech., 9, 2735–2752, https://doi.org/10.5194/amt-9-2735-2016, 2016. a
Ziemann, P. J. and Atkinson, R.: Kinetics, products, and mechanisms of secondary organic aerosol formation, Chem. Soc. Rev., 41, 6582–6605, https://doi.org/10.1039/C2CS35122F, 2012. a