the Creative Commons Attribution 4.0 License.
the Creative Commons Attribution 4.0 License.
 | 04 Mar 2026
Hygroscopic enhancement of suburban aerosol light scattering measured using a single-nephelometer system in Central Europe
Jakub Ondráček
Naděžda Zíková
Petr Roztočil
Petr Vodička
Roman Prokeš
Ivan Holoubek
Vladimír Ždímal
Most atmospheric aerosol particles are hygroscopic, meaning they absorb water from the surrounding air, altering their size, shape, overall chemistry, refractive index, and thus light-scattering properties – an effect with important implications for Earth's radiative balance. The scattering enhancement factor, f(RH), and backscattering enhancement factor, f(RH)bsp, quantify the increase in light scattering under elevated relative humidity (RH). These parameters are typically measured using two nephelometers operating under dry (RH<40 %) and humidified (RH>80 %) conditions, a method prone to inter-instrument uncertainties. This study presents a single-nephelometer system that reduces measurement uncertainty associated with inter-instrument comparison and enables the study of aerosol hygroscopic behavior in the inadequately represented European urban environment. The system was deployed at a suburban site in Prague, Suchdol, Czech Republic, from November 2022 to August 2023. Results revealed low aerosol hygroscopicity, likely due to a well-mixed aerosol population dominated by black and brown carbon. Both enhancement factors peaked in spring, coinciding with the enhanced formation of secondary aerosols and particle growth, which modified aerosol size distributions and hygroscopicity. Low hygroscopic enhancement values in summer reflected a composition shift toward black carbon-dominated aerosols from traffic emissions, with particle growth being disrupted, potentially due to the structural compaction of black carbon aggregates under high RH. While f(RH) and f(RH)bsp generally increased with decreasing concentrations of light-absorbing particles, organic carbon, particularly its most volatile fractions, significantly enhanced aerosol hygroscopicity in the urban environment. Despite overall low aerosol hygroscopicity, increased RH significantly influenced aerosol climate-relevant optical properties.
- Article
(5129 KB) - Full-text XML
-
Supplement
(1661 KB) - BibTeX
- EndNote


Atmospheric aerosols play a critical role in the Earth's energy budget through direct aerosol-radiation interactions (ARI) by the scattering and absorption of short- and long-wave radiation and indirect aerosol-cloud interactions (ACI) by changes in the microphysical and radiative properties of clouds, respectively (Boucher, 2015; IPCC, 2023). The Sixth Assessment Report of the IPCC estimated the total aerosol effective radiative forcing (ERF) to be −1.1 [−1.7 to −0.4] W m−2 over 1750–2019 (Foster et al., 2023). Despite growing research on the aerosol radiative effects (e.g., Toll et al., 2019; Williams et al., 2022; Zhang et al., 2025, and references herein), aerosol ERF remains the most significant uncertainty in climate models due to the high spatial and temporal variability of aerosol properties, limited understanding of pre-industrial aerosol conditions, and the indirect aerosol-induced changes in the atmosphere (Carslaw et al., 2017; Kahn et al., 2023; Watson-Parris and Smith, 2022).
Hygroscopicity, defined as the ability of aerosol particles to attract and absorb moisture from the surrounding environment, critically alters particle size, shape, and refractive index (Burgos et al., 2019; Titos et al., 2021) and impacts the angular distribution of scattered light and thus aerosol optical properties (Fierz-Schmidhauser et al., 2010; Zieger et al., 2015). Since the globally measured long-term in situ aerosol measurements are standardized below 40 % relative humidity (RH) (WMO/GAW, 2016), these “dry” conditions do not reflect the real atmosphere, leading to an inadequate understanding of aerosol water uptake, which contributes to significant uncertainties affecting aerosol climate effects (Burgos et al., 2020; Myhre et al., 2013; Ray et al., 2024).
The light scattering enhancement due to humidity can be expressed by the light scattering enhancement factor f(RH) as in Eq. (1):
where σsp (RH, λ) and σsp (RHdry, λ) denote total scattering coefficients under elevated RH conditions and dry conditions measured at the same wavelength λ, respectively (Covert et al., 1972). A similar formulation applies for backscattering, f(RH)bsp (Titos et al., 2021).
Several approaches to investigate f(RH) have been proposed. Tandem-humidified nephelometer systems occurred in the 1960s and have undergone substantial innovations since then (Pilat and Charlson, 1966). These systems consist of one nephelometer measuring under dry conditions and a second nephelometer measuring a humidified aerosol sample. Two main instrumental set-ups were identified in the 26 tandem-humidified nephelometer measurements from ground-based sites worldwide (Burgos et al., 2019). The “NOAA design” directs aerosol through a first dry and later humidified nephelometer (e.g., Doherty, 2005; Liu and Li, 2018), while the “PSI design” splits the aerosol into parallel dry and humidified paths (e.g., Zieger et al., 2015, 2014). Both systems used an RH scanning regime (20 % to 95 % RH) for the humified nephelometer (Titos et al., 2016).
Müller et al. (2011) showed that after correction for angular truncation errors, the total scattering coefficients σsp and backscattering coefficients σbsp at 450, 525 and 635 nm measured by the Ecotech Aurora 3000 against the referenced integrating nephelometer TSI 3563 in laboratory conditions differ by 2 %–5 % and 1 %–11 %, respectively. The discrepancies observed in total scattering were consistent with the calibration uncertainties. The experimental set-ups comprising two or more instruments could introduce additional uncertainty to the resulting data, considering different sampling lines for nephelometers, non-symmetrical apparatus, or the critical measurement part under highly humid conditions (Anderson et al., 1996).
Thus, this study presents a single-nephelometer system to partially reduce uncertainties in the f(RH) estimation arising from the comparison of two instruments and to investigate ambient aerosol particles' light scattering hygroscopic behavior at the suburban site. Orozco et al. (2016) examined aerosol hygroscopicity using a dryer-humidifier system coupled to a TSI 3563 nephelometer in urban/suburban environments in North America. However, to the best of our knowledge, only one study has specifically investigated aerosol light-scattering enhancement in a European urban/suburban environment (Titos et al., 2014). Therefore, this study provides a unique insight into f(RH) and light-scattering enhancement of aerosols in a European suburban context using a single-nephelometer approach. Moreover, the presented approach enabled the reliable measurement of hygroscopic changes in the aerosol light backscattering f(RH)bsp, inadequately represented in the literature.
2.1 Description of the site
The instrumentation set-up was developed and tested at the Institute of Chemical Process Fundamentals (ICPF) of the Czech Academy of Sciences in Prague, Czech Republic. The ICPF also runs a Suchdol atmospheric station located on the institute campus ( N, E, 277 m a.s.l., Fig. 1). The station is a suburban site and an Aerosol In Situ National Facility (AIS NF) of the ACTRIS ERIC (Aerosols, Clouds, and Trace gases Research InfraStructure, European Research Infrastructure Consortium; https://www.actris.eu/, last access: 25 May 2025). The aerosol instruments are positioned within the sampling container, with the sampling heads situated approximately 4 m above the ground.
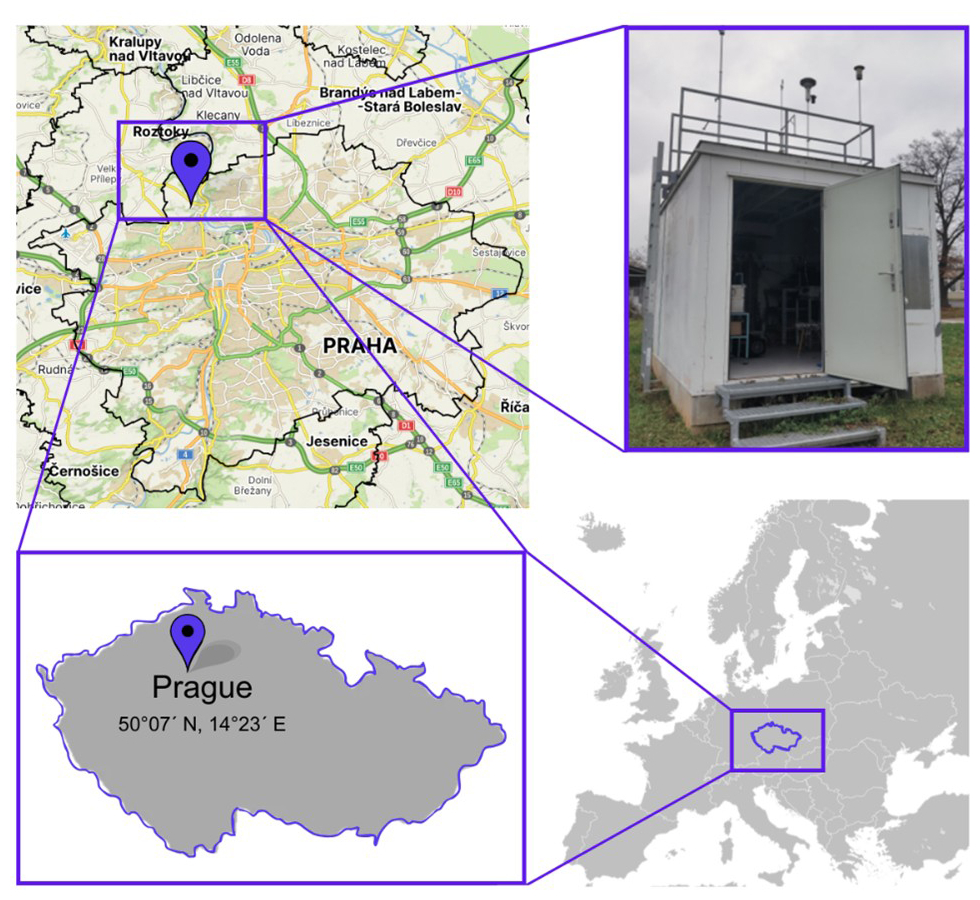
Figure 1Location of Suchdol ACTRIS ERIC AIS NF site within Prague, Czech Republic. Map source: © Seznam.cz, a.s.
The station is located at the periphery of the plateau above the capital, Prague (1.37 million citizens in 2025), 5 km from the city center. The site is surrounded by residential housing, utilizing gas as the primary energy source for heating (80 %), while the remainder utilizes electricity (16 %), community heating (2 %), or burns solid and liquid fuels (less than 2 %) (Czech statistical office, 2024). The nearest road is situated at a distance of 250 m (10 000–15 000 cars per day, Vodička et al., 2013), but no major road is located within 1 km of the site. The Václav Havel airport is situated 9 km SW of the site. The agricultural fields are located within a 2 km radius to the west. The predominant wind direction at the site is from the WSW (mainly summer and winter), with a notable influence of SE during winter and NW during spring (Fig. S1 in the Supplement). The measurement campaign was conducted from 15 November 2022, to 19 August 2023.
2.2 The single-nephelometer instrumentation
Aerosol particles were sampled through a PM10 sampling head (Leckel, GmbH) and subsequently dried by a custom-built Nafion dryer (MD-700-24, Permapure) to achieve the RH level below 40 % (Fig. 2, No. 1). The total aerosol flow of 10 L min−1 was divided equally between two parallel sampling lines: a dry sampling line (5 L min−1) and a humidified sampling line (5 L min−1). The dry sample was passed through the sampling system to the integrating nephelometer (TSI 3563) without additional adjustments. The other line led to the second Nafion membrane (MD-700-24, Permapure), functioning as a water exchange medium, facilitating counter-current mass transfer between humidified particle-free air and the aerosol sample (Fig. 2, No. 3). This humidification process aimed to achieve a sample RH≥80 %.
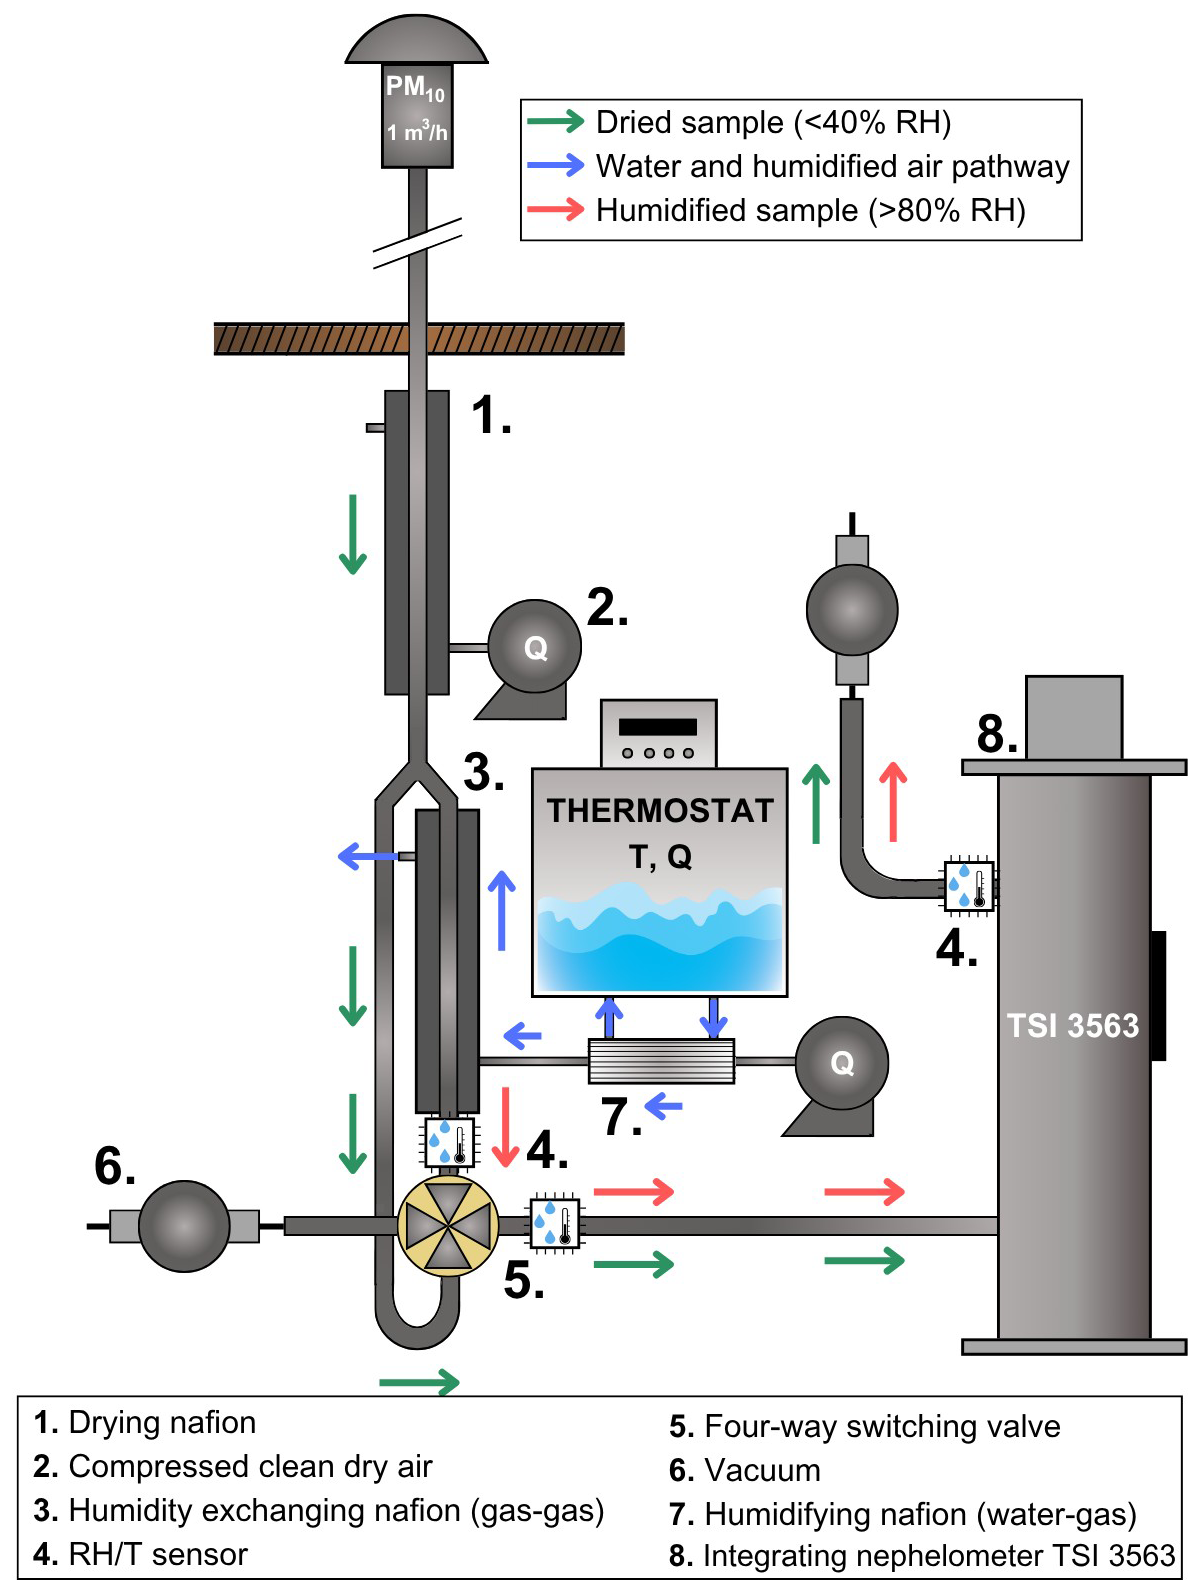
Figure 2A design of the single-nephelometer set-up system for studying aerosol hygroscopic behavior.
Humid particle-free air was produced in the closed circulation system (Fig. 2, blue arrows). Demineralized water, heated in a controlled manner by the thermostat (up to 33 °C), was directed to the bundle Nafion membrane (FC100, Permapure) (Fig. 2, No. 7), where mass transfer between water (in channels) and the dry particle-free air (outside the channels) occurred. The excessive water was later returned to the thermostat, and the humid particle-free air flowed into the humidity-exchanging Nafion membrane (Fig. 2, No. 3). The temperature of the demineralized water and the flow rate of the humid particle-free air were regulated to achieve the desired RH level in the humidity-exchanging Nafion. An RH/T sensor (HYT939, Innovative Sensor Technology, AG) was installed before the switching valve to control the RH in the humidified sample. Since the RH sensor inside the measurement cell was not sufficiently accurate, additional RH/T sensors were positioned immediately in front of the inlet and after the outlet of the instrument (Fig. 2, No. 4) to control the RH dynamics and to calculate the dew point temperature Tdew, which was used to estimate the real RH of the sample (see Sect. 2.4 Data treatment). All RH/T sensors were calibrated against a standard thermometer (F250 MKII, Automatic System Laboratories) and a dew point mirror (CMH2, Alpha Moisture Systems) at the beginning of the campaign.
Every 60 min, the four-way switching valve (Fig. 2, No. 5) automatically directed either the dry or the humidified sample to the TSI 3563 integrating nephelometer (Fig. 2, No. 8). First, a 10 min conditioning period was initiated to reach the target RH of the sample, followed by a 50 min measurement period as determined and optimized by pilot testing. During the dry sample measurement, the automatic switching valve allowed the dry sample to flow directly to the nephelometer, and the humidified sample was directed to the exhaust (Fig. 2, No. 6). And vice versa, when the humidified aerosol sample was sampled to the nephelometer, the dry sample was discarded.
The thermostat temperature and the flow rate of the humidified particle-free air were checked regularly to ensure proper humidification of the sample and to prevent condensation inside the instrument. All parts sensitive to changes in RH (humidity-exchanging Nafion, tubing within the closed humidity circuit, and inlet tubing to the nephelometer) were insulated to prevent heat losses and water condensation.
Upon reaching the nephelometer measuring cell, a dry or humidified aerosol sample was illuminated with a halogen lamp at an angle range of 7–170°. The scattered light passed through three band-pass filters and was detected in photomultiplier tubes (PMT) at 450, 550, and 700 nm wavelengths. The resulting total scattering and backscattering coefficients (σsp and σbsp) with a time resolution of 1 min.
The nephelometer was calibrated twice a day with particle-free air and fully calibrated every 2–3 months with CO2 as the high-span gas and particle-free air as the low-span gas, always in the dry measurement regime. The continuous dry measurement was performed approximately once a month (overnight) to avoid water condensation inside the instrument.
Particle losses in the Nafion membranes and the 4-way valve are not expected to significantly influence the reported scattering measurements, as diffusional losses affect optically negligible ultrafine particles and inertial losses primarily affect coarse particles that are scarce in urban air. Urban aerosol scattering is dominated by accumulation-mode particles (<1 µm) (Held et al., 2008; Wu and Boor, 2021), for which calculated valve losses are minimal.
While this approach reduces uncertainties in the f(RH) estimation arising from the comparison of two instruments, it should be noted that such a measurement approach relies on the reduced time resolution compared to the dual nephelometer setups (1 h intervals), which may introduce additional uncertainty on short timescales, e.g., the influence of episodic extreme pollution events. This limitation was partly addressed in the Chapter Data treatment. Moreover, another limitation of this setup originates from a lack of parallel measurement of dry and wet aerosol properties, which rules out the hygroscopic scanning, humidogram analyses, and the precise recalculation of f(RH) at the given RH. The statistical overview of RH and temperature during the measurement campaign for both humidified and dry mode are shown in Table S2 in the Supplement.
2.3 Auxiliary measurements
The Mobility Particle Size Spectrometer (MPSS) measured the aerosol particle number concentration with a time resolution of 5 min, using a custom-built Differential Mobility Analyzer (DMA, both TROPOS, Germany), positive high-voltage power supply, and Condensational Particle Counter (CPC 3772, TSI). The MPSS ranged from 10 to 800 nm, 32 size channels per decade, with data further subdivided into size modes: 8–100 nm, 100–200 nm, 200–500 nm, and particles above 500 nm for the analysis. An additional total count CPC (3750, TSI) measured the total particle number concentration of particles larger with dp(50) at 10 nm.
Elemental and organic carbon (EC and OC) concentrations were measured from November 2022 to July 2023 using a semi-online field analyzer from Sunset Laboratory Inc. (USA) (Bauer et al., 2009). The analyzer was connected to a PM1 (November–December 2022) and PM2.5 (rest of the period) inlet with a flow rate of 8 L min−1. Samples were collected at 2 h intervals on a quartz fiber filter and analyzed according to the shortened EUSAAR2 protocol (Cavalli et al., 2010). Each measurement was corrected for charring, and the RTCalc726 software automatically determined the split point between EC and OC using a linear fit of laser and temperature corrections. OC was divided into fractions based on temperature. The most volatile fractions, OC1 and OC2, volatilize at 200 and 300 °C and are commonly present in fresh vehicle exhaust, biomass burning, and coal combustion (Shen et al., 2025; Vodička et al., 2015). OC3 and OC4 subfractions volatilize at 450 and 650 °C and represent less volatile fractions of OC with higher molecular weights and are associated with chemical aging and the products of photochemical reactions (Aswini et al., 2019; Shen et al., 2025). The instrument was equipped with a parallel carbon plate denuder to eliminate volatile organic compounds and prevent positive bias in OC measurements. Instrument blanks were recorded daily at midnight.
A dual-spot multiwavelength aethalometer (Model AE33, Magee Scientific, USA, 2018) continuously measured light attenuation by particles at seven wavelengths (370, 470, 520, 590, 660, 880, and 950 nm). The dual-spot technology enables real-time compensation for filter loading. Particles were sampled through the PM10 sampling head (Leckel GmbH) at a flow rate of 5 L min−1, dried in a custom-made Nafion dryer (TROPOS, Leipzig, Germany), and deposited onto tetrafluoroethylene (TFE) coated glass filter tape. Light transmission through the deposited sample is measured and compared to the blank filter tape spot as a reference, converting the optical absorbance into an equivalent black carbon concentration (eBC, µg m−3) data. The data was automatically corrected by the multi-scattering correction factor C (1.39 for the recommended filter tape M8060). Furthermore, the wavelength-dependent mass absorption cross-section (MAC) factors were used for the eBC conversion to the absorption coefficients σap (Drinovec et al., 2015; Müller and Fiebig, 2021; Savadkoohi et al., 2025). The wavelength-dependent MAC values were adopted from the AE33 manual (e.g., MAC=7.77 m2 g−1 for 880 nm) (Magee Scientific, 2018). The σap values were additionally standardized to STP conditions (273.15 K, 1013.25 hPa) and divided by the harmonization factor H∗ (1.76 for the recommended filter tape M8060), which compensates for the differences between the predefined multi-scattering correction factor C and corrections in the Aethalometer firmware set by the manufacturer (Müller and Fiebig, 2021; Savadkoohi et al., 2024, 2025).
Ambient temperature (T), RH, wind speed (WS), wind direction (WD), global solar radiation (GLRD), and ozone (O3) concentration were measured hourly in the Czech Hydrometeorological Institute container located next to the ACTRIS AIS container with all the aerosol instruments.
2.4 Data treatment
2.4.1 Humidified nephelometer system
Four subsystems working simultaneously were needed to obtain valid datasets from the measurements: nephelometer measurement, automatic switching between dry and humid measurements, humidification of the sample, and RH/T sensors.
The TSI 3563 integrating nephelometer data set was processed according to the EMEP Standard Operating Procedure. The raw σsp and σbsp data at all wavelengths were validated (removal of invalid, missing, and calibration data). Values below the limit of detection LOD (0.3 Mm−1 for TSI 3563) were replaced by values, corrected for a truncation error according to Anderson and Ogren (1998), and standardized to STP conditions (273.15 K, 1013.25 hPa).
The automatic four-way switching valve was controlled using a custom-made LabVIEW program. The resulting data set was paired with the nephelometer data set to identify dry and humidified measurements.
All datasets produced by the RH/T sensors regulating the thermostat temperature and the flow of humidified particle-free air to achieve the desired RH of the sample were also recorded using a custom-made LabVIEW program.
Temperature and RH data from all three sensors were corrected using calibration curves derived from comparing with the referenced thermometer and the dew point mirror. The real RH of the sample was derived by assuming that the dew point temperatures in front of and behind the cell are similar (Ren et al., 2021). The approximated Magnus-Tetens formula (Alduchov and Eskridge, 1997) was used to calculate the dew point temperatures of both and from the mean Tdew, the saturation vapor pressure, psat, at Tdew was calculated as in Eq. (2):
where a, b, and c are empirical constants derived from the experimental data: a=6.112 hPa, b=17.67, and c=243.51 (b and c are dimensionless); Tdew in °C.
A similar approach was used to calculate the saturation vapor pressure at the temperature in the measuring cell, Tcell – pcell.
The final RH of the sample in the measuring cell, RHcell, was calculated as follows in Eq. (3):
The RHcell dataset was later combined with the nephelometer and switching valve data. The RHcell data, along with the valve position dataset, were used to separate the data into dry (RH≤40 %) and humidified (RH≥80 %) datasets. They were also used to separate the conditioning periods, which occurred when switching between dry and humidified modes to reach RH equilibrium in the measurement cell from the actual measurement periods (Fig. 3). Data corresponding to the range of , including the conditioning periods, was discarded (approx. 15 % of the raw data). The dry and humidified datasets of aerosol light scattering properties were averaged hourly. The enhancement factors f(RH) and f(RH)bsp were calculated to obtain information about light scattering enhancement due to hygroscopicity. In this study, f(RH) was calculated based on “humid-centered” and “dry-centered” intervals to avoid the influence of possible extreme pollution events at the site (Fig. 3). The humid-centered interval was calculated by dividing the average humidified σsp value by the mean of two lateral 1 h averaged dry σsp (Fig. 3, gray). The dry-centered interval was calculated by dividing the average of two lateral 1 h averaged humidified σsp by the 1 h averaged dry σsp value (Fig. 3, ochre). Extreme and invalid values were inspected and discarded if necessary. The data coverage of the entire measurement campaign, including individual seasons, as well as the variability of RH and temperature under humid and dry conditions, can be found in Tables S1 and S2 and Fig. S1 in the Supplement.
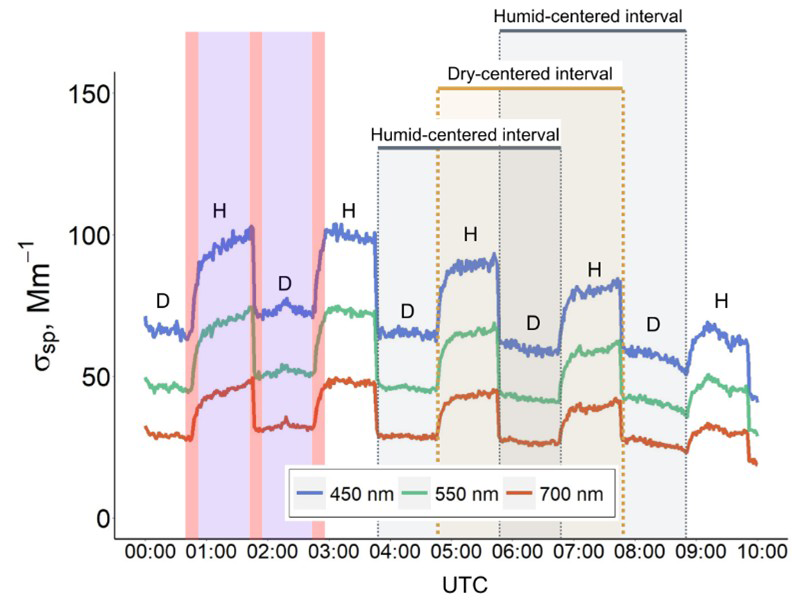
Figure 3The example of f(RH) calculation from a single-nephelometer measurement on 12 December 2022. The D and H symbols indicate “dry” and “humid” measuring intervals of σsp. The orange intervals on the left represent the preconditioning periods, while the purple intervals represent the actual measurements.
2.4.2 Relationship between aerosol scattering and absorption
To describe the spectral dependence of light scattering, the Scattering Ångström Exponent SAE was calculated as (Clarke and Kapustin, 2010):
where λ1 and λ2 are the wavelengths of light at which σsp was measured. SAE contains information about aerosol size: SAE values <1 indicate the predominance of particles in the coarse mode, while SAE values ≥2 indicate a predominance of the aerosol fine mode (Seinfeld and Pandis, 2006).
In addition to SAE, ΔSAE was defined (Perrone et al., 2018) in Eq. (5):
where SAE450−550 is calculated from 450 and 550 nm and SAE550−700 from 550 and 700 nm wavelength pair, respectively. ΔSAE provides insight into the relative contribution of fine and coarse mode particles and whether the particle size distribution is mono-, bi-, or multimodal. Positive ΔSAE values indicate the presence of two distinct modes – a fine mode and a coarser one – while negative ΔSAE values suggest the dominance of a single fine particle mode (Perrone et al., 2018).
The Absorption Ångström Exponent (AAE), which describes a spectral dependence of light absorption, was calculated analogously from σap (Mbengue et al., 2021). AAE can provide information on chemical composition: AAE values <1 could indicate BC core or non-absorbing coating particles, AAE values around 1 are classified as BC aerosol, while AAE values around 2 and higher indicate light absorption in ultraviolet and blue spectral regions, suggesting the presence of organic carbon – brown carbon BrC in this study – or mineral dust (Cappa et al., 2016).
To estimate the dominant aerosol type at the site, we used the AAE vs. SAE plot from Cappa et al. (2016), which can estimate the potential aerosol type without direct information on the chemical composition. For the aerosol type assessment in this study, the AAE was calculated at 520–660 nm and the SAE at 450–550 nm. The AAE vs. SAE plots were additionally color-coded with the Single Scattering Albedo (SSA), the ratio of the aerosol light scattering, and the total aerosol light extinction (light scattering plus absorption) at the predefined wavelength λ defined in Eq. (6):
Sites predominantly influenced by aerosol scattering (clean marine or remote Arctic sites) exhibit SSA values close to 1, while anthropogenically influenced sites exhibit significantly lower SSA (Pandolfi et al., 2018). In this study, also the humidified equivalent of SSA was calculated from dry measurements of σap (RH<40 %) and humidified σsp (RH>80 %).
The asymmetry factor g describes the angular distribution of the scattered light and is defined as the average cosine of the angle between the incident light and the scattered beam θ, weighted by the probability of scattering for each possible angle. Based on the Henyey-Greenstein approximation (Andrews et al., 2006; Wiscombie and Grams, 1976):
where b is the hemispheric backscattering ratio. g ranged from −1 for completely back-scattered light to 1 for completely forward-scattered light and is one of the essential inputs for the radiative transfer models.
The hemispheric backscattering ratio b denotes the fraction of light scattered back to the upper hemisphere of the particle and the total scattered light and can be measured directly from the optical instrument without knowledge of the scattering phase function (ranging from 0 to 1) calculated following Eq. (8):
g and b are particularly useful for distinguishing aerosol types and assessing their radiative impacts, as backscattering plays a critical role in determining the cooling efficiency of atmospheric particles.
2.4.3 Back trajectory analysis
The dry optical properties data were paired with a cluster analysis of back trajectories calculated using the HYSPLIT_4 model from the NOAA Air Resources Laboratory to understand the sources of distinct aerosol types better. The global data assimilation system (GDAS) at 1°×1° resolution (Draxler and Hess, 1998; HYSPLIT model, 2025; Stein et al., 2015) was used as meteorology input, and 72 h air mass back trajectories arriving at 200 m a.g.l. were calculated every 6 h. The number of clusters was estimated based on total spatial variance.
3.1 Light scattering properties
The overall median value of dry σsp at 550 nm (text refers to the overall measurement at λ=550 nm unless stated otherwise) was 28.45 Mm−1 at the studied site, corresponding to the range of values observed at urban and suburban sites: 14.83 Mm−1 at SIRTA (FR), 47.39 Mm−1 in Athens (GR), 39.83 Mm−1 in Lecce (IT), 18.04 and 43.14 Mm−1 in Madrid and Granada (ES) (Donateo et al., 2020; Pandolfi et al., 2018).
The dry SAE450−700 value of 1.65, together with a positive median dry ΔSAE (Table 1), indicated a predominantly fine-mode aerosol population, with spectral curvature suggesting the presence of a secondary mode associated with larger particles, likely from aging or mixing processes, similarly to Athens and Granada (SAE450−700 of 1.6 and 1.69), while in Lecce, the fine particle mode dominated (SAE450−700 of 1.84) (Donateo et al., 2020; Pandolfi et al., 2018). The dry b (0.161) and g (0.521) were also typical for urban/suburban environments, suggesting a slightly stronger cooling potential of the aerosol population compared to other sites.
Table 1The statistics of light scattering properties in the PM10 fraction at different wavelengths. P25, P75, and P50 denote the 25th and 75th percentiles and median, respectively. All variables except f(RH) and f(RH)bsp were measured and calculated at RH<40 %, and all variables except σsp and σbsp are dimensionless.
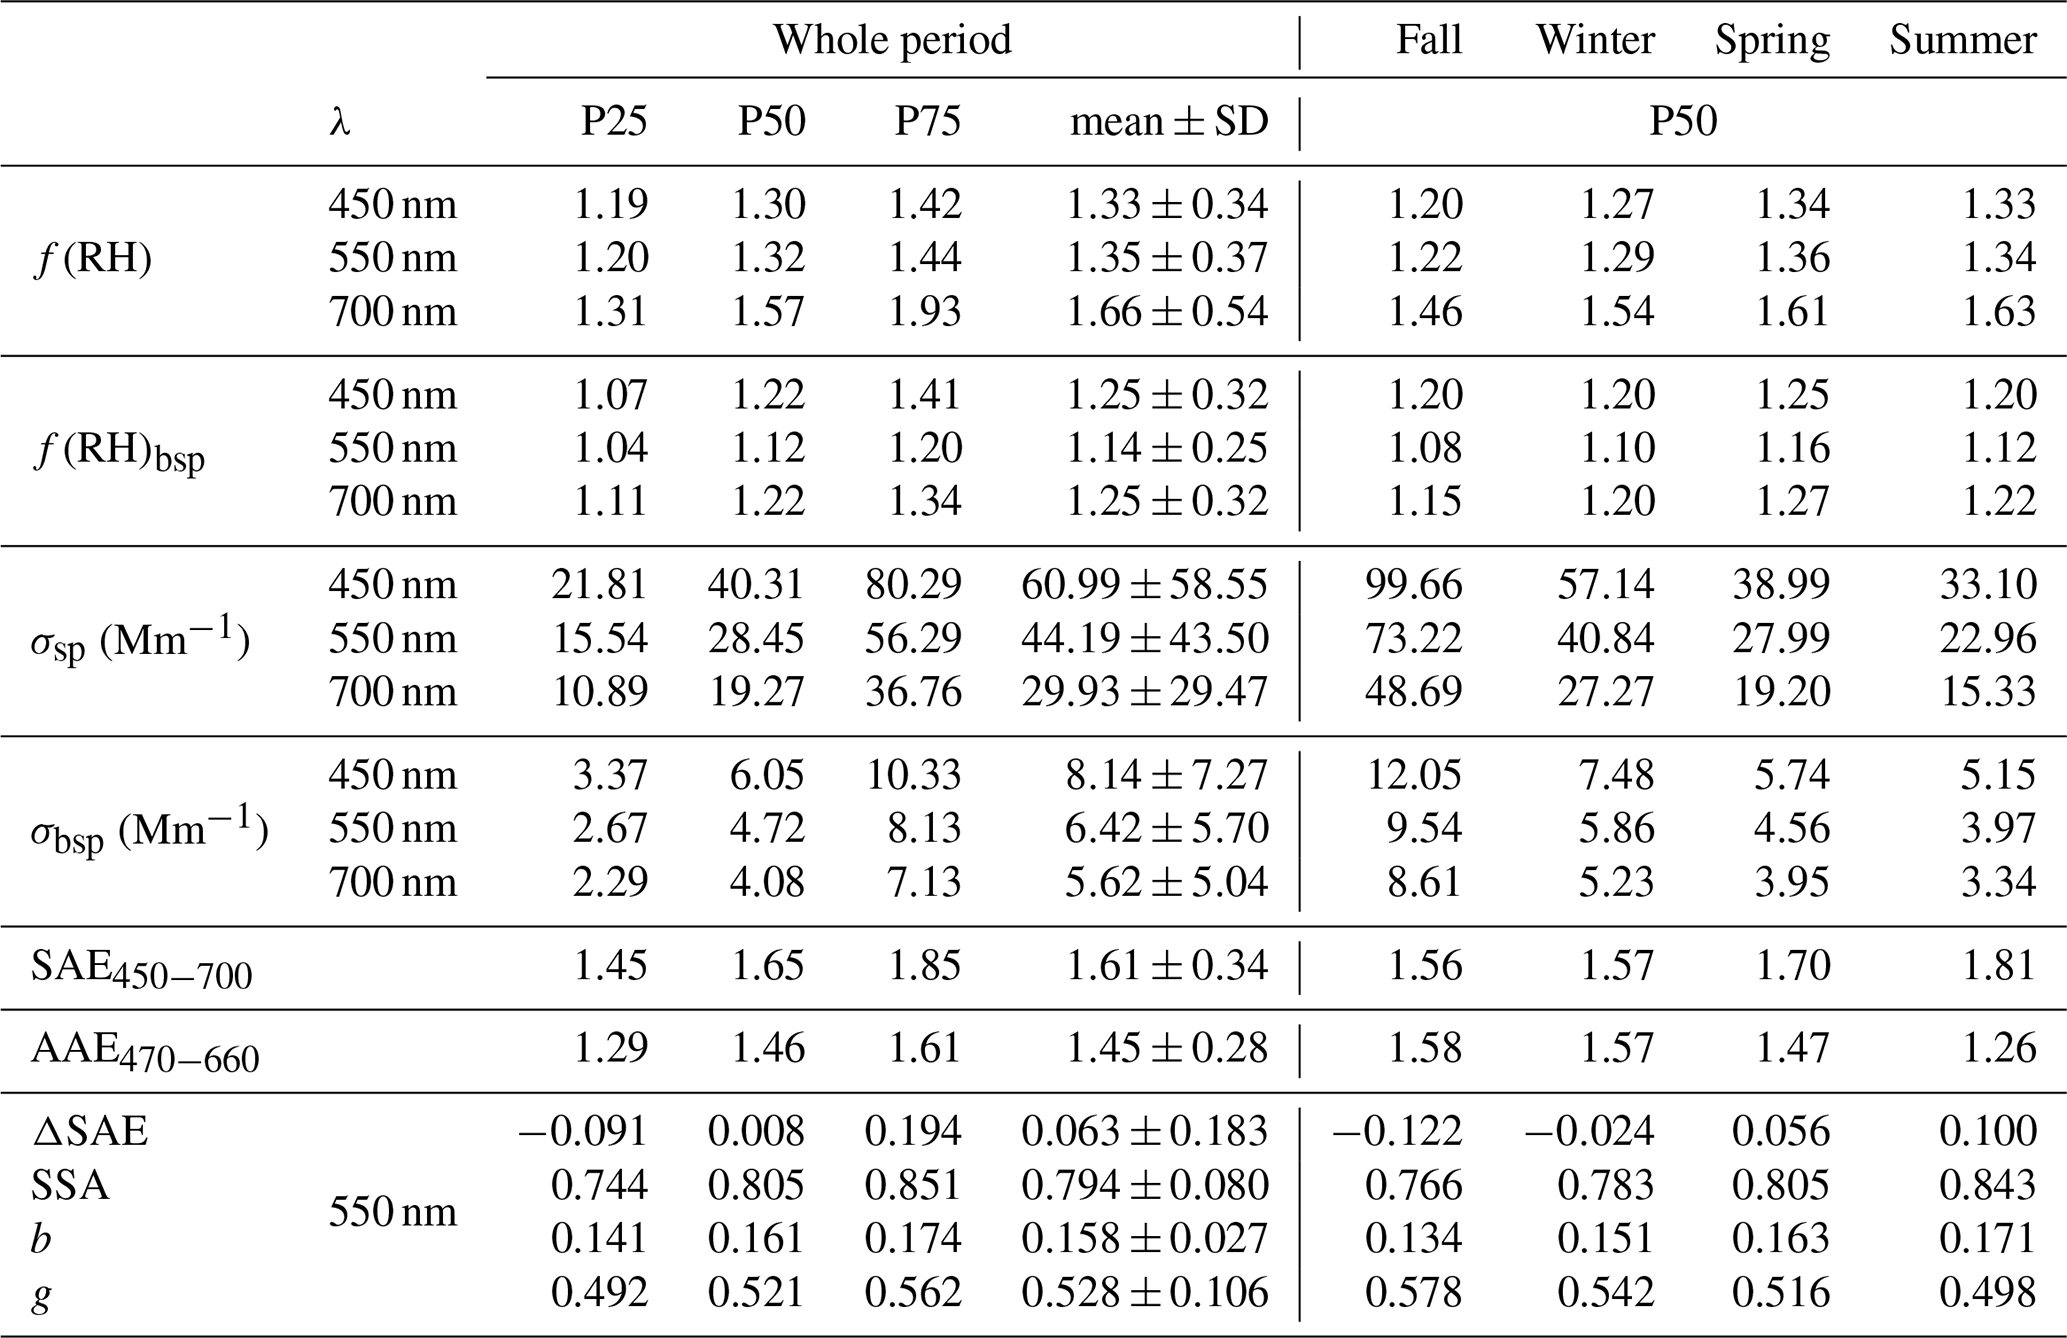
However, a relatively low median value of SSA550 (0.805) implies a substantial influence of absorbing aerosol species in the aerosol population. The median AAE470−660 value of 1.46 suggests a relatively balanced contribution of black carbon (BC) and brown carbon (BrC) to aerosol absorption, with a stronger influence of BC in summer (AAE470−660 of 1.26), likely due to the increased presence of traffic emissions. In contrast, elevated AAE values in fall (1.58) and winter (1.57) suggest an increased contribution of BrC from biomass burning, possibly related to residential heating.
3.2 f(RH) and f(RH)bsp
The overall low enhancement factors f(RH) and f(RH)bsp of 1.32 and 1.12 suggest the influence of low-hygroscopic carbonaceous aerosol species from local combustion, traffic sources, and their aged derivatives. This result is consistent with the lower range of f(RH) values observed at urban and suburban sites, for example, average values ranging between 1.32 and 1.74 in a suburban area of Beijing in autumn (Ren et al., 2021), 1.30 near Manacapuru city in Brazil, a site influenced by industrial activities with soot, high-sulfur oil emissions, and biomass burning (Burgos et al., 2019), or 1.5 ± 0.2 in winter in Granada (Titos et al., 2014).
The f(RH)bsp mimicked the behavior of the f(RH) during the whole year, with the highest correlation in winter (Fig. 4). Compared to Titos et al. (2021), our mean f(RH) and f(RH)bsp values (gray point in Fig. 4) fall into the low enhancement category of urban sites. Despite the strong linear relationship, f(RH)bsp does not precisely mirror f(RH) and slightly varies mainly between colder (fall and winter) and warmer (spring and summer) seasons. As aerosol ERF depends on the hemispheric backscattering ratio b, models relying solely on assumed f(RH) can lead to inaccurate outcomes (Haywood and Shine, 1995; Hegg et al., 1996; Titos et al., 2021). Such regressions can be beneficial given the scarcity of f(RH)bsp measurements for modeling enhancement for specific site types. Titos et al. (2021) performed a fit across several environments (Arctic, marine, rural, and urban) and found the fit equation of , R2=0.69 for the Shouxian rural site in China. Parameters retrieved from our weighted bivariate fit of f(RH)bsp vs. the f(RH) can be found in Table S3 in the Supplement. These regression parameters describe the co-variation between f(RH)bsp and f(RH), whereas magnitude differences between the two enhancement factors are quantified below using median values.
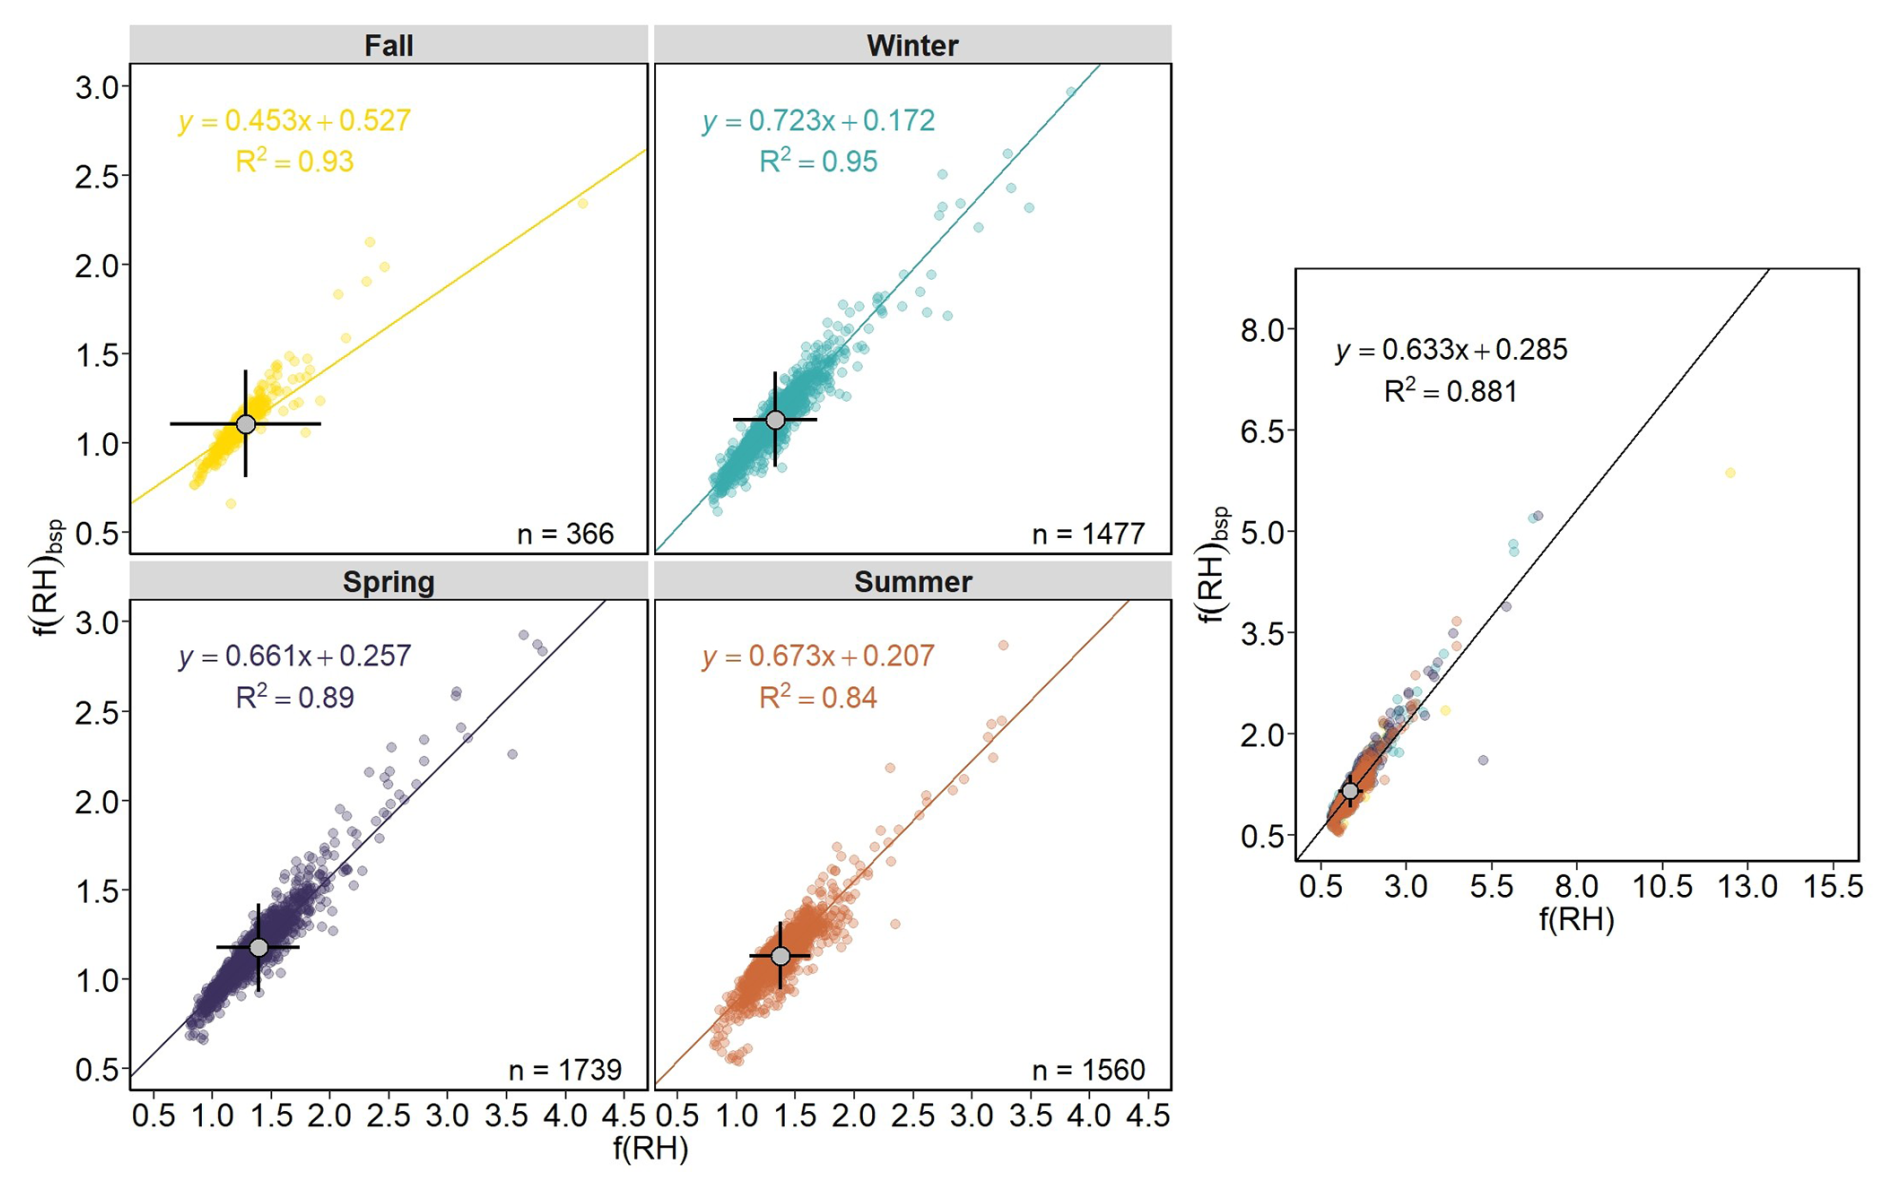
Figure 4The weighted bivariate fit of f(RH)bsp vs. the f(RH) at λ=550 nm for individual seasons (left). The grey point represents the overall f(RH) and f(RH)bsp mean value with error bars. The right plot demonstrates the weighted bivariate fit for the whole dataset.
The f(RH) depends on RH, the particle size, chemical composition, and light wavelength. Its spectral dependence is crucial for radiative forcing estimates (Fierz-Schmidhauser et al., 2010; Kiehl and Briegleb, 1993; Titos et al., 2021). At the studied site, the f(RH) increases with wavelength in most cases and seasons except summer (frequency distributions centered around 0, Fig. S3 in the Supplement), aligning well with results from urban sites (Titos et al., 2021) but showing lower values compared to marine or Arctic environments. Occasionally, an opposite behavior with a decrease f(RH) with increasing wavelength was observed, linked to dust episodes and particle size shift (Carrico et al., 2003; Fierz-Schmidhauser et al., 2010).
Based on Mie's theory, Hegg et al. (1996) proposed that f(RH)bsp should be approximately 25 % lower than f(RH) for typical atmospheric aerosols. Our observations support this, showing consistently smaller f(RH)bsp than f(RH) across all wavelengths. On average, f(RH)bsp was lower by 6 %, 15 %, and 22 % at 450, 550, and 700 nm, respectively, with the largest differences observed in summer reaching 10 %, 16 %, and 25 %. The relative difference between f(RH) and f(RH)bsp increases with wavelength, suggesting a spectral sensitivity of backscattering to humidification, likely due to particle size and composition effects on the angular distribution of scattered light. These findings highlight the need for wavelength- and season-specific correction factors when using f(RH) to estimate aerosol backscattering or when interpreting satellite data sensitive to the backscattered light.
The probability density functions of f(RH) and f(RH)bsp for different wavelengths can be found in Fig. S4 in the Supplement.
Seasonal variability
The lowest f(RH) and f(RH)bsp values were observed in the fall, with a monthly minimum in November (1.22 and 1.07, Fig. 5). Both peaked in spring, with a monthly maximum in May (1.40 and 1.19). The increase from autumn to spring was interrupted in March when both f(RH) and f(RH)bsp dropped to 1.22 and 1.08, probably due to March being a transitional period between winter and spring in the Northern Hemisphere. Although this anomaly has not been fully understood yet, CAMS reanalysis by Flemming et al. (2017) also identified irregular springtime atmospheric patterns over the Northern Hemisphere, while Suchánková et al. (2025) observed a steep increase in dry σsp and σbsp, and ultrafine and fine particle number concentration at an urban site in France. After peaking in May, both f(RH) and f(RH)bsp gradually decreased towards August (1.34 and 1.12). The seasonal variation is consistent with results reported at the urban site in Granada (Titos et al., 2014).
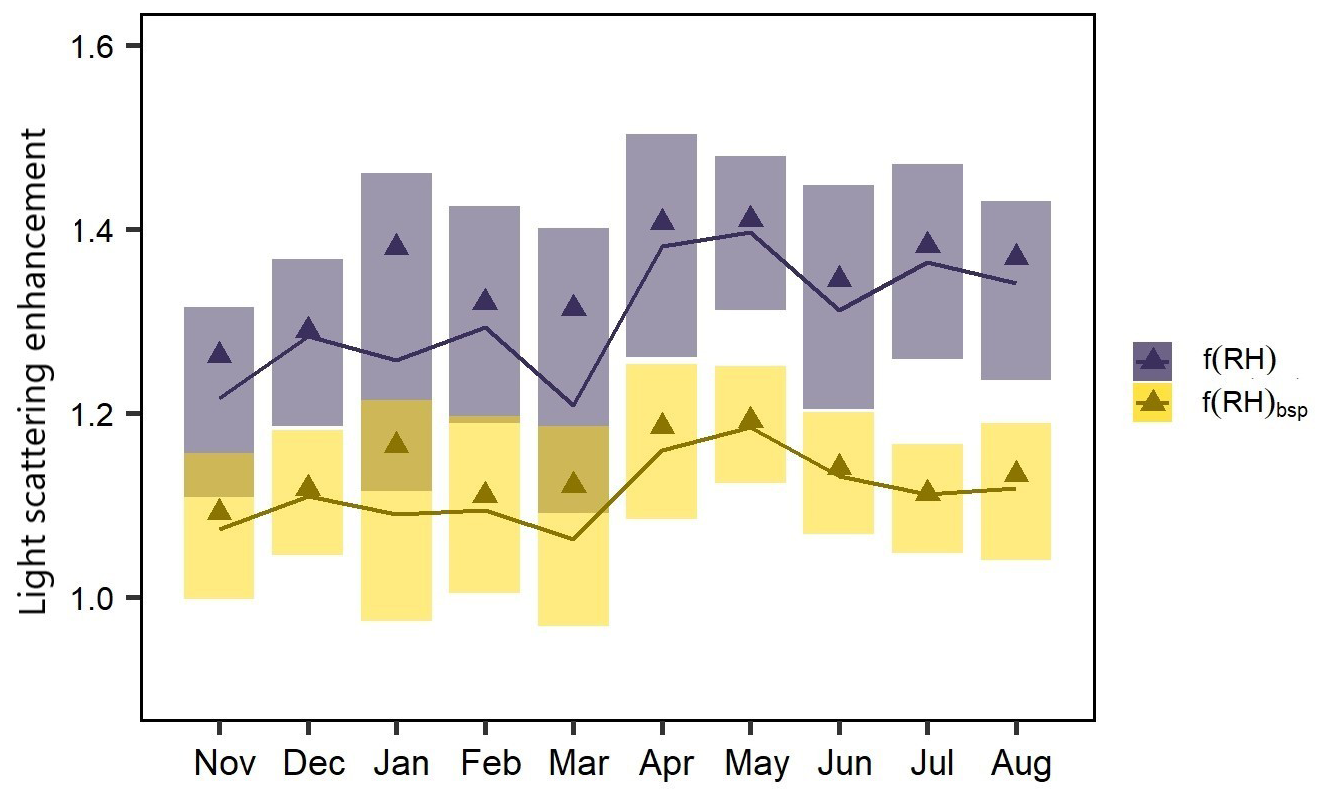
Figure 5The monthly variation of the f(RH) and the f(RH)bsp measured at 550 nm. The lines with shaded areas depict the median with the interquartile range, and the triangles represent mean values.
Lower values of f(RH) and f(RH)bsp in fall and winter suggest the prevalence of low-hygroscopic aerosol species, such as carbonaceous particles from combustion and traffic sources. In summer and spring, the enhancement is influenced by hygroscopic SOA. Although SSA550 peaks in summer, likely due to highly hygroscopic secondary organic and inorganic aerosols (sulfates and nitrates), the strongest correlation between and SSA550 is in spring (). Sulfates and nitrates amplify aerosol hygroscopicity more effectively than organic matter, especially compared to the less hygroscopic organic species prominent in summer. This seasonal contrast highlights the key role of inorganic species like sulfate and nitrate in controlling aerosol optical properties through their impact on hygroscopic growth. During spring, the aerosol composition is relatively homogeneous, dominated by aged, regionally transported aerosols with intermediate hygroscopicity, resulting in stronger and more predictable correlations between enhancement factors and SSA550. While both spring and summer can include biogenic organics and aged urban particles, the chemical composition in summer is more variable, leading to less consistent hygroscopic behavior and the weakest seasonal correlations with SSA550 (R=0.16 for both f(RH) and f(RH)bsp).
The temporal variation of f(RH) did not show any consistent connection to SAE450−700 (Fig. S5a in the Supplement). The SAE450−700 values rise from colder months to warmer months, suggesting the presence of smaller particles from the NPF or the traffic. Compared to winter, the enhanced mixing and higher dilution due to the higher planetary boundary layer height (PBLH) in spring and summer also prevent particle growth due to condensation. This statement was supported by the analysis of particle number size distribution (PNSD), with Dp below 200 nm primarily present in the photooxidatively active time of the year. At the same time, larger particles occurred mainly in colder seasons (Fig. S6 in the Supplement). However, the nephelometer does not precisely measure the ultrafine particle sizes due to its geometry and principle of operation, possibly distorting the direct relationship between the light scattering enhancement and PNSD.
Our results suggest that variations in aerosol chemical composition may play a more important role in modulating light scattering enhancement than particle size alone. The temporal evolution of f(RH) and the ratio , color-coded by dry SAE450−700 (Fig. S5a and b), shows pronounced seasonal variability in particle size, while only weak co-variability of SAE450−700 with increasing hygroscopic enhancement. Higher SAE450−700 values, predominantly observed in spring and summer, indicate a dominance of fine particles, consistent with an enhanced influence of NPF, whereas the remaining seasons reflect a mixture of fine and coarser particles typical of urban aerosol. Although smaller particles generally exhibit higher dry backscattering fractions, hygroscopic growth can modify particle size and the scattering phase function, leading to a comparatively weaker enhancement of backscattering than total scattering (Fig. S5b). This interpretation is further supported by seasonal changes in particle number size distributions (Fig. S6), which indicate shifts in dominant size modes, reflecting changes in aerosol sources over the year. It should be noted that this interpretation is based on indirect proxies for aerosol composition and size, as no direct chemical analysis is available, and particle size distributions are limited to PM1, while hygroscopic scattering measurements represent PM10.
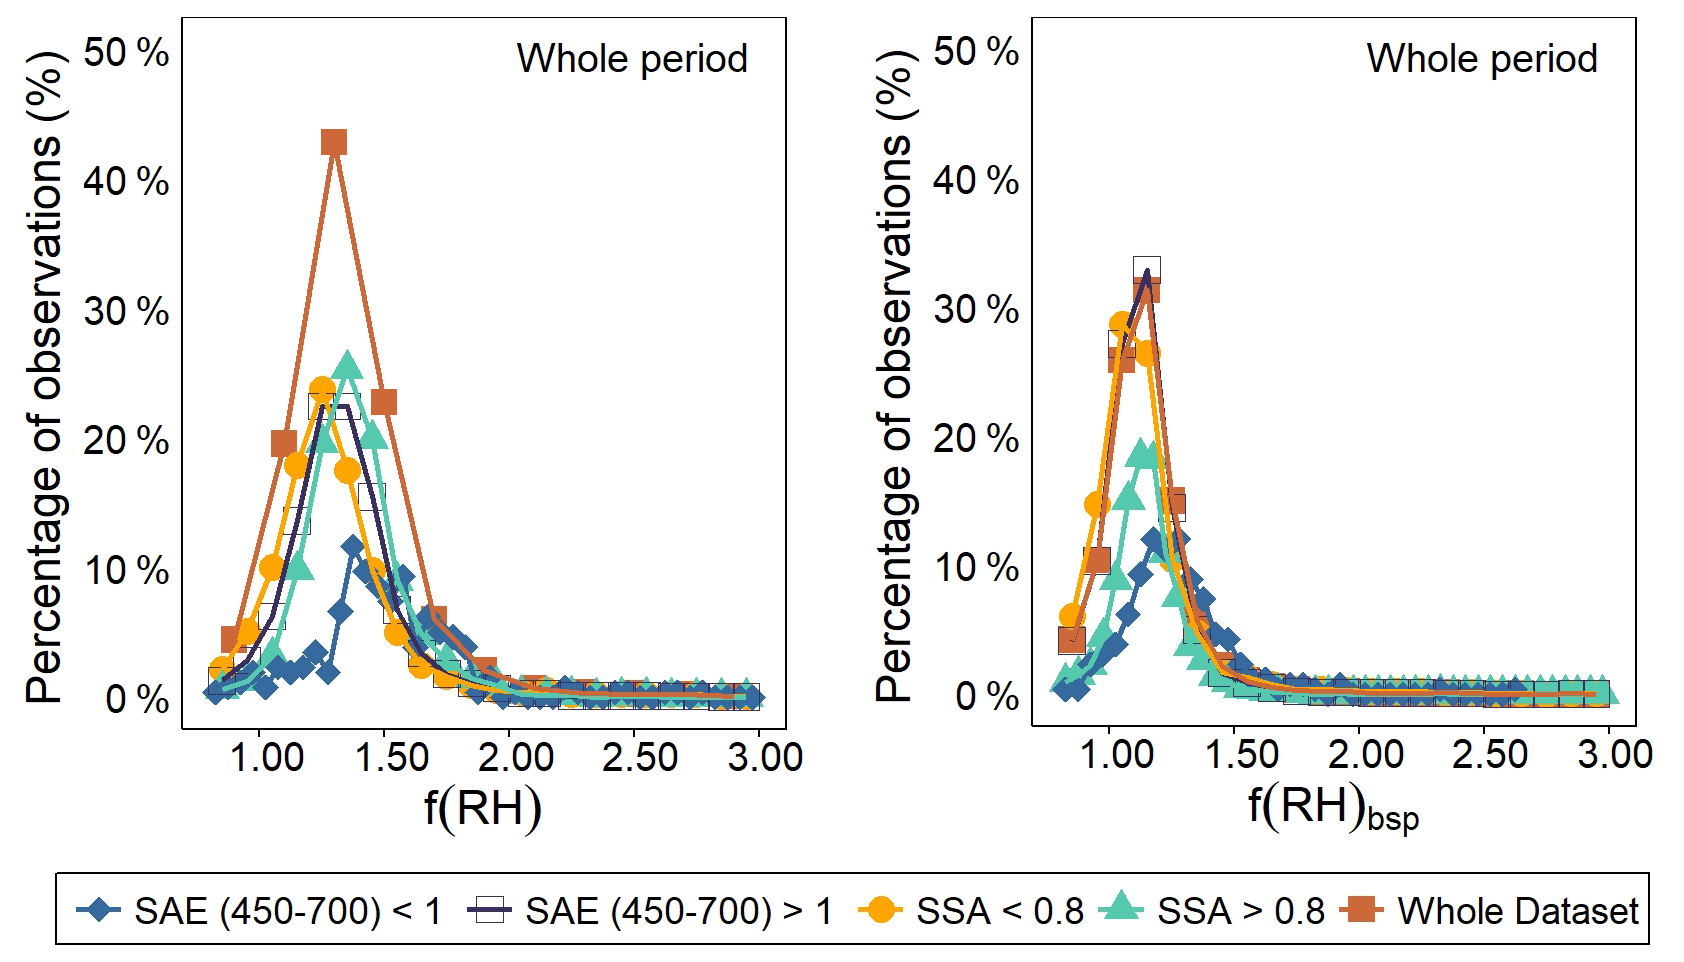
Figure 6Frequency distribution of f(RH) (left) and f(RH)bsp (right) calculated at 550 nm during the whole measurement campaign. The distributions are color and symbol-coded based on SAE450−700 and SSA550 values.
3.3 Light scattering enhancement vs. other aerosol-intensive optical properties
Understanding the relationship between light scattering enhancement and other aerosol optical properties can help improve the characterization of aerosol types and their radiative impacts.
mirrored the frequency distribution of both f(RH) and f(RH)bsp (Fig. 6). A slight shift towards more hygroscopic behavior was observed for in f(RH)bsp. In contrast, SSA550<0.8 exhibits a slight shift to the left for both f(RH) and f(RH)bsp, indicating an overall significant decreasing effect of absorbing aerosol species on aerosol light scattering enhancement, consistent with the finding of Titos et al. (2014).
In winter and spring, particles with showed slightly more hygroscopic behavior both for f(RH) and f(RH)bsp, possibly due to the internal mixtures of sulfates and nitrates or the presence of mineral dust. Particles characterized with SSA550<0.8 consistently showed lower f(RH) and f(RH)bsp values. In spring and summer, the frequency distribution of SSA550>0.8 mimicked the whole dataset distribution, implying a higher share of light-scattering aerosols (Fig. S7 in the Supplement).
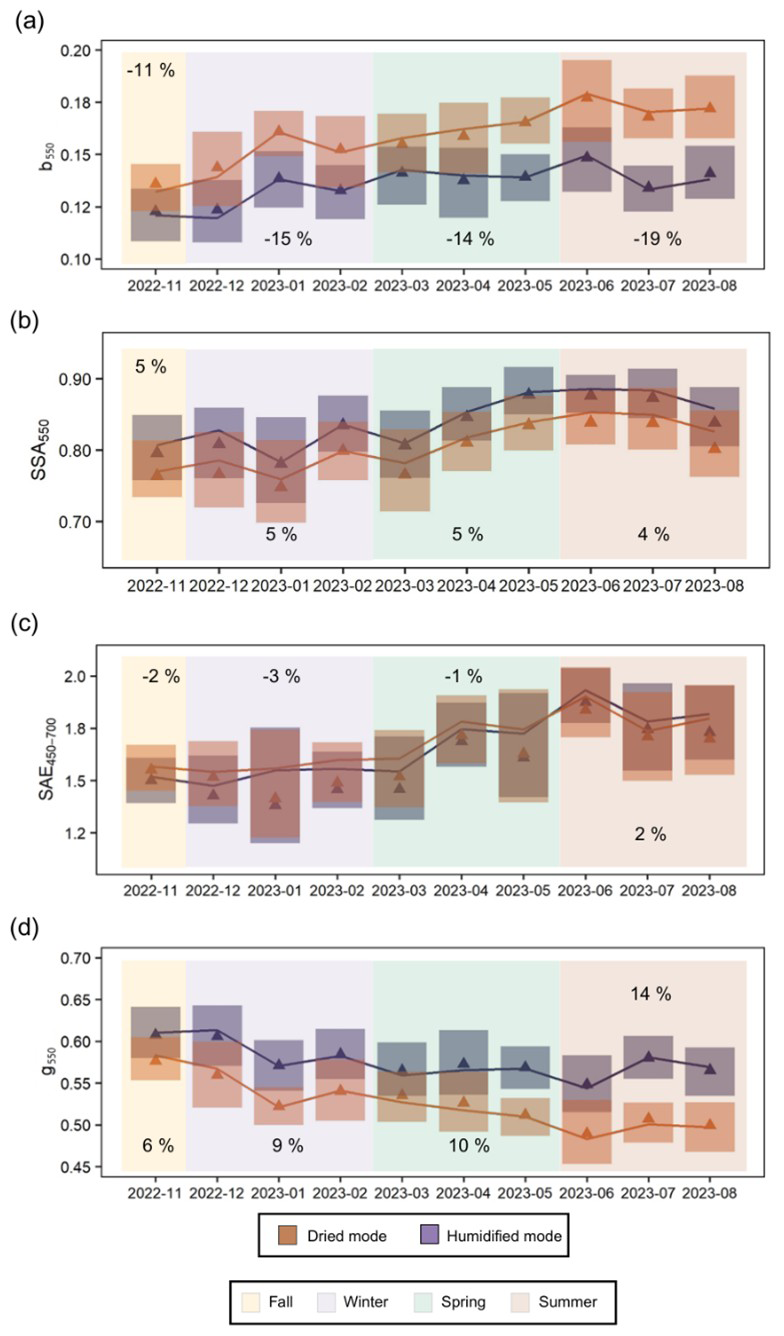
Figure 7The monthly variation of b550 (a), SSA550 (b), SAE450−700 (c), and g550 (d) at dried and humidified conditions in individual seasons (colored background). A percentage value in each season shows a relative change between humidified and dried median values for the respective season. The lines with shaded areas depict the median and the interquartile range, and the triangles represent respective mean values.
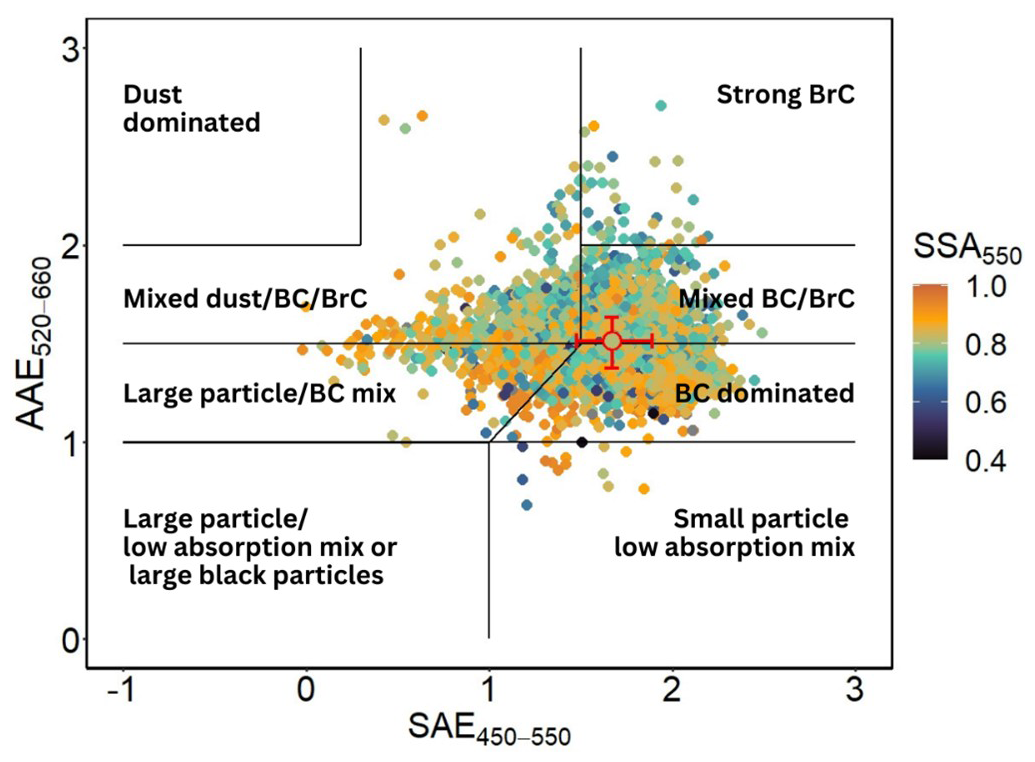
Figure 8AAE520−660 vs. SAE450−550 hourly means from the whole campaign, color-coded with SSA550 overlaid with the aerosol characterization matrix adopted from Cappa et al. (2016) and Cazorla et al. (2013). The red circle with red error bars estimated the median AAE520−660–SAE450−550 point with interquartile ranges.
Dry SSA550 was lower for less hygroscopic particles (f(RH)<1.5) than for more hygroscopic ones (f(RH)>1.5), 0.708 vs. 0.742 (Fig. S8a in the Supplement), confirming the adverse effect of absorbing components on hygroscopicity. Across all seasons, the SSA increased with RH (Fig. 7b), while b550 showed the opposite behavior (Fig. 7a), as expected, given their inverse relationship. This relationship was more pronounced under humidified conditions than dried ones (Fig. S8b) (Burgos et al., 2020; Titos et al., 2021). As particles take up water and grow, the total scattering increases with a predominance of the forward light scattering over backscattering.
The asymmetry factor g550 also increased with RH, confirming stronger forward than backward scattering with enhanced RH (Fig. 7d). The SAE450−700 decreased with increasing RH, indicating particle size growth in all seasons except summer (Fig. 7c). During summer, an atypical behavior of the SAE450−700 was observed, with dry particles appearing optically larger (lower SAE) than the humidified ones. This is likely linked to the dominance of BC-rich aerosols, which are weakly hygroscopic and maintain large agglomerated structures in the dry state. Such structures may compact upon humidification, reducing optical growth and increasing SAE. This behavior contrasts with highly hygroscopic sulfate- or nitrate-rich aerosol regimes, where humidification leads to particle growth and lower SAE values.
Comparing our site with those reported by Titos et al. (2021) we found the lowest f(RH), similar to urban (e.g., Manacapuru, Brazil, and Nainital, India), desert (Niamey, Niger), and some rural (e.g., Hyytiälä, Finland) environments. Interestingly, the SSA550 at our site was the lowest, indicating a strong presence of absorbing aerosols such as black carbon or other combustion-related species (Fig. S5c). This confirms the role of local or regional combustion sources in shaping aerosol optical properties.
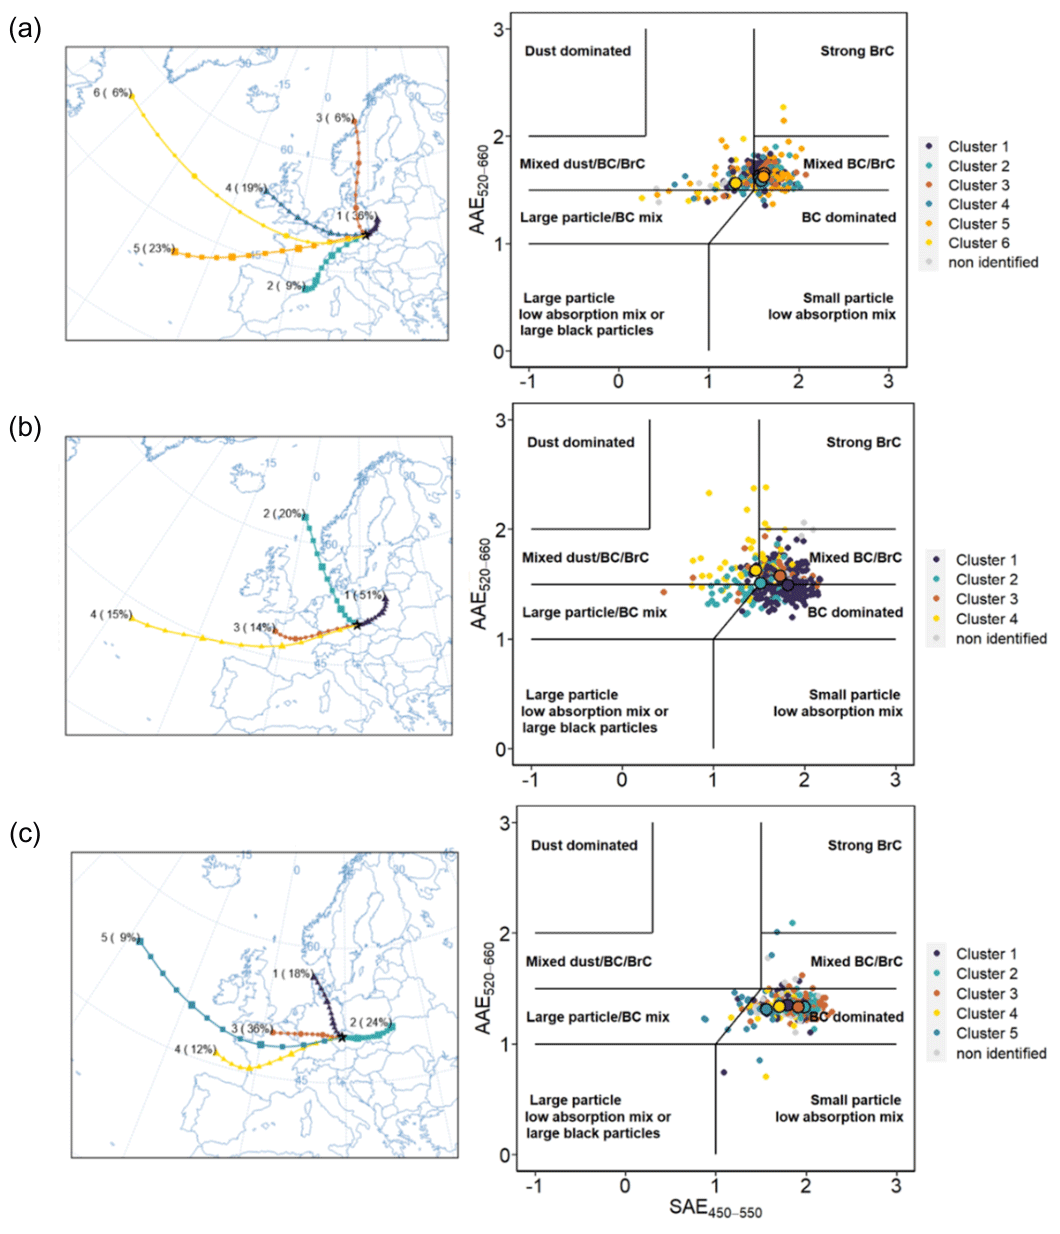
Figure 9The 72 h air mass back trajectories paired with AAE520−660 vs. SAE450−550 for winter (a), spring (b), and summer (c). The plots are color-coded by trajectory cluster number, with cluster medians indicated by black circles and the percentage contribution of each cluster provided. The fall was not taken into consideration due to the limited data.
3.4 The estimation of chemical composition from optical properties
Due to the lack of direct measurement of chemical composition at the site, we used the approach introduced by Cappa et al. (2016), using AAE520−660, SAE450−550, and SSA550 to estimate the aerosol chemical composition. Aerosol at the station was found mainly in the fine fraction, dominated by BC in a mixture with BrC (Fig. 8), in agreement with the low f(RH) and f(RH)bsp at the site. The site was also influenced by BC and BrC in a mixture with dust, probably coming from the road dust, although unexamined Saharan dust episodes may have contributed. These mixtures included large, poorly absorbing coated particles and locally emitted sulfates and nitrates in the fine size mode, which highly scatter but weakly absorb the incoming light.
SSA550 values were equally distributed among the plot regions, except for the highest values in the aerosol mixture of sea salt, dust, and low-absorbing coated particles with BC and BrC. Such aerosol was typically connected with air masses coming from Poland and Eastern Europe (Fig. 9). High concentrations of the mixture with BrC were observed in fall, winter, and spring, predominantly due to biomass burning. Consequently, the median AAE520−660 vs. SAE450−550 point fell into the Mixed/BC/BrC” plot region. In contrast, the BC aerosol mixture started to dominate in spring and summer (Fig. S9 in the Supplement).
Although multiple wintertime clusters originated from the marine regions, only Cluster 6 (Fig. 9a) shifted towards dust/large low-absorbing particle aerosol mixture, indicating the influence of fossil fuel/biomass burning sources during this season. In spring, the air masses of Clusters 2 and 4 originated from the Norwegian Sea and Atlantic Ocean (Fig. 9b) and featured hygroscopic sea salt mixtures. In summer, the BC-dominated aerosol prevailed (Fig. 9c); however, marine clusters (Clusters 1, 4, and 5) shifted towards larger aerosol sizes, suggesting aerosol-aged mixtures influencing the ability to scatter and absorb radiation.
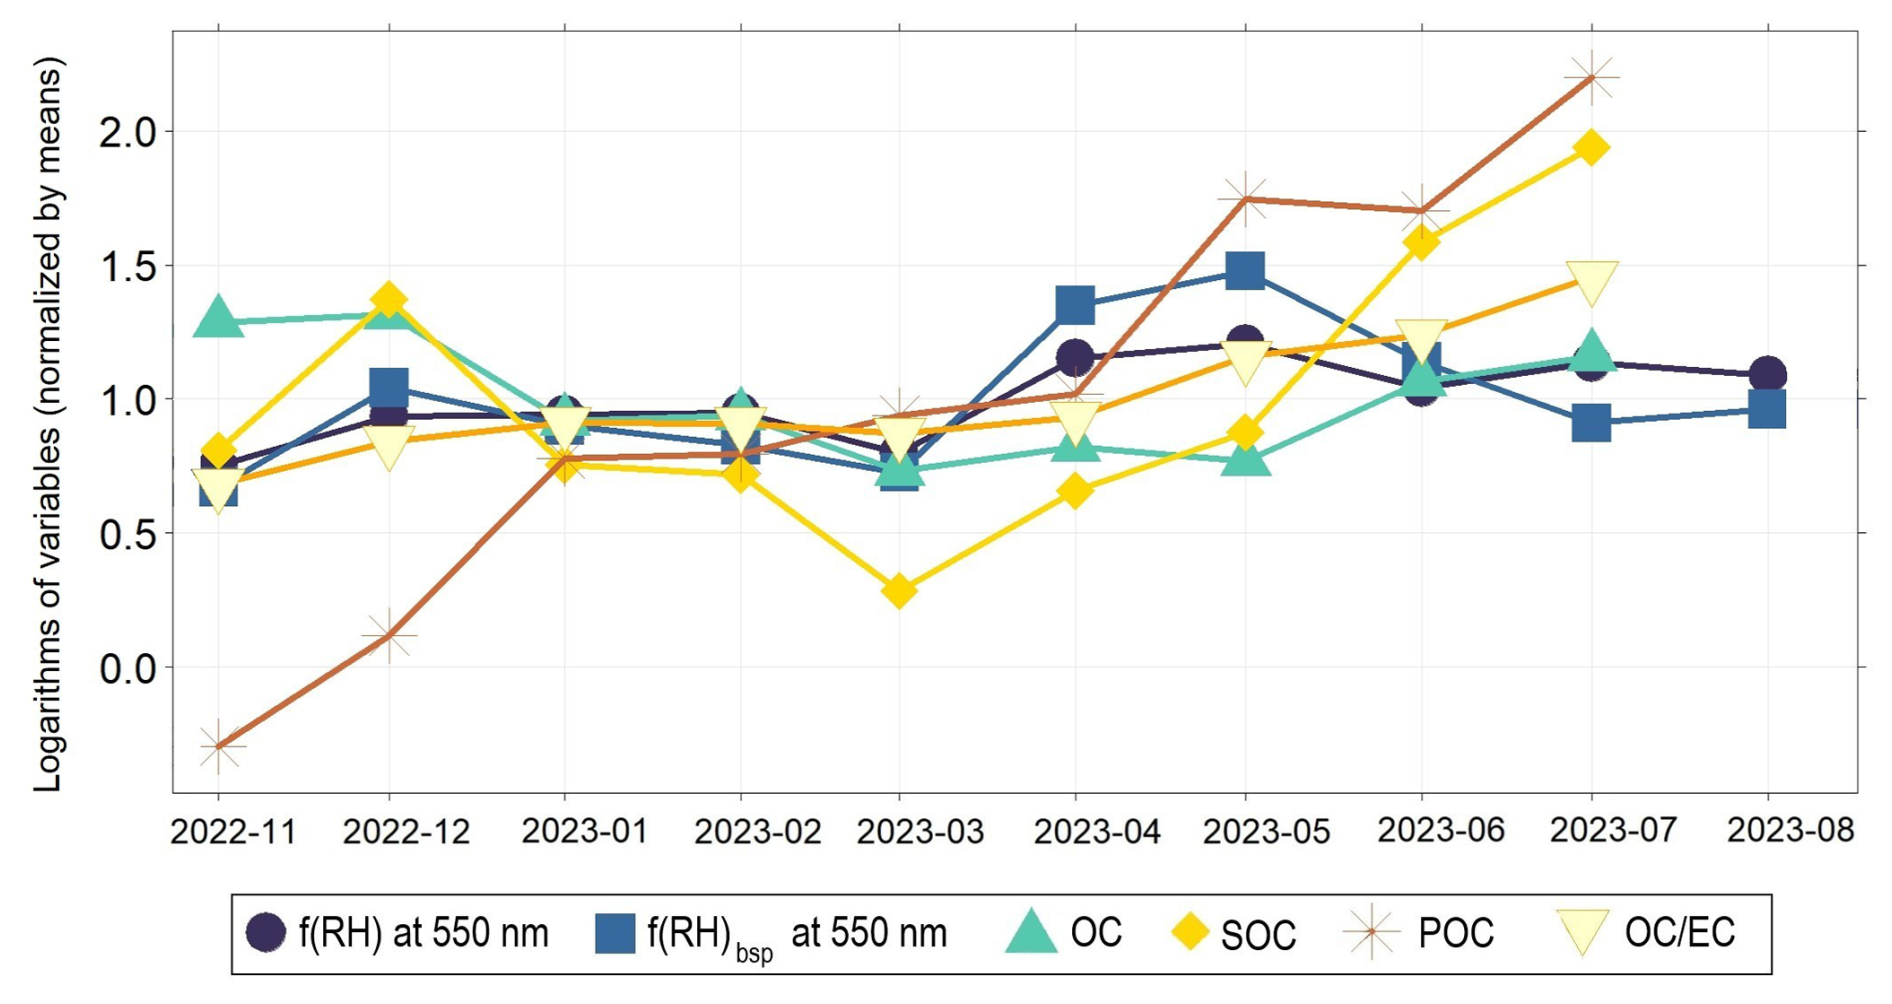
Figure 10Temporal variation of logarithmic median values of f(RH) and f(RH)bsp, OC, SOC, POC, and OCEC. Each series was divided by its mean value to compensate for different numeric scales.
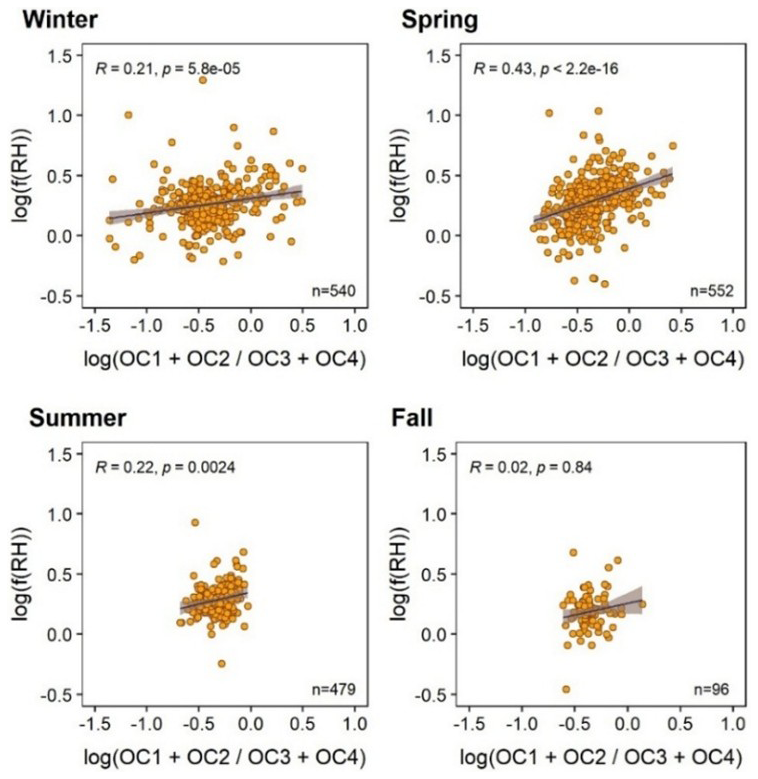
Figure 11Seasonal Spearman correlations between the f(RH) and the log-transformed ratio of more volatile OC fractions (OC1+OC2) and less volatile OC fractions (OC3+OC4). The values in the bottom right corner indicate the number of observations, and the values in the upper left corner indicate the Spearman correlation coefficient R and the respective p-values.
Consistent with previous hygroscopic studies, aerosol hygroscopic changes are often negatively correlated with the organic mass fraction, reflecting the low hygroscopicity of ambient organic aerosol compared to strongly hygroscopic inorganic salts (mainly sulphates and nitrates) (Andrews et al., 2021; Kang et al., 2025; Massoli et al., 2009; Pöhlker et al., 2023). We note that direct measurements of inorganic aerosol components were not available at the Suchdol site, and therefore their contributions to f(RH) variability cannot be quantified in this study. Nevertheless, a substantial fraction of the variability in f(RH) is likely controlled by variations in the inorganic fraction, and correlations between f(RH) and organic metrics can partly reflect this co-variability. Separating OC into primary (POC) and secondary (SOC) fractions allows investigation of differences in effective hygroscopicity within the organic aerosol itself. To further explore variability in optical hygroscopicity beyond total organic mass, semi-online OCEC measurements were used to calculate the concentrations of secondary (SOC) and primary (POC) organic carbon, following the method of Mbengue et al. (2021). The concentrations of OC, POC, SOC, and the ratio of organic and elemental carbon (OCEC) remained stable during winter and increased in spring, mirroring the behavior of f(RH) until May (Fig. 10). However, carbonaceous components rose from late spring into summer while mainly f(RH)bsp decreased, suggesting a seasonal decoupling of SOC and aerosol hygroscopicity. This may be due to the higher fraction of POC (Liu and Wang, 2010), the formation of less hygroscopic SOA from biogenic precursors (Huang et al., 2019), and the evaporation of semi-volatile organics at higher temperatures, reducing their contribution to water uptake and f(RH) (Thomsen et al., 2024).
Elemental carbon (EC) showed negative Spearman correlations with f(RH) and f(RH)bsp ( and −0.17), as expected. OC showed a moderate negative correlation with f(RH), yet the OCEC ratio correlated positively with f(RH) and f(RH)bsp, especially during spring (R=0.31). This indicates that the relative abundance of organic carbon, rather than its absolute concentration, enhances hygroscopicity (Table S4 in the Supplement). The SOCOC ratio seasonal behavior followed the OCEC seasonality, emphasizing the role of SOA in aerosol hygroscopic growth.
The four OC subfractions distinguished by the thermo-optical method further clarified this behavior. Surprisingly, the sum of more volatile OC1 and OC2 positively correlates with f(RH). In contrast, the sum of less volatile OC3 and OC4 showed negative correlations, implying higher hygroscopicity of fresher, more volatile OC subfractions (Fig. 11). This aligns with field studies of “smoke” particles by Chan et al. (2005), showing that levoglucosan from biomass burning or urban pollution can “age” into simpler dicarboxylic acids, such as succinic acid, which is less hygroscopic than the original substance, causing aged biomass burning aerosols to be less hygroscopic than the fresh ones. However, the hygroscopicity of the mentioned organic compounds highly depends on their mixing state and the additional components in the mixture (Maskey et al., 2014).
A key factor influencing this trend may be Humic-Like Substances (HULIS), typically associated with OC3 and OC4. HULIS are low in volatility and hygroscopicity (Kristensen et al., 2012) and are primarily emitted from biomass burning, residential heating, and traffic. Their presence may suppress water uptake and light scattering (Dinar et al., 2008). Urban HULIS tend to absorb light more and decrease SSA than rural sources (Tang et al., 2020). HULIS often exist in the glassy or semi-solid state, preventing diffusion of water molecules in their structure and decreasing their hygroscopicity (Koop et al., 2011), and further, aging can enhance viscosity via oligomerization, reducing hygroscopicity even more (Song et al., 2016).
The highest correlation between f(RH), f(RH)bsp, and ratio was found in spring (R=0.43 and 0.28) despite stronger photochemical activity during summer (Fig. 11). This counterintuitive result suggests that spring conditions preserve more water-uptake-efficient OC1 and OC2 in the particulate phase, while intense summer photochemistry and higher temperatures drive oxidation and oligomerization of organic compounds, transforming initially hygroscopic semi-volatile organics (OC1+OC2) into more aged, less hygroscopic fractions (OC3+OC4), and promote volatile organics evaporation, reducing the relative contribution of fresh OC to the particulate phase.
This work presented a cost-effective approach to investigate aerosol hygroscopicity using a single-nephelometer set-up with an automatically controlled switching valve alternating between humidified and dried sample branches. This design reduced uncertainties associated with dual-instrument configurations while allowing for investigation of light backscattering changes with elevated RH. After testing and calibrations, the system was installed at the suburban site, Suchdol in Prague, Czech Republic, from November 2022 to August 2023 to fill the knowledge gap related to the optical hygroscopic behavior of aerosol at European urban/suburban sites, particularly regarding light scattering under increased relative humidity (RH).
The light total scattering enhancement factor f(RH) and the light backscattering enhancement factor f(RH)bsp were derived from the humidified and dried measurement of the light total scattering (σsp) and backscattering (σbsp) coefficients at 450, 550, and 700 nm. These enhancement factors were analyzed in relation to climate-relevant aerosol optical properties, including the Scattering/Absorption Ångström Exponent SAE/AAE, hemispheric backscattering ratio b, asymmetry factor g, and Single Scattering Albedo SSA, as well as estimated chemical composition, particle number size distributions (PNSD), meteorological parameters, and back trajectory analysis.
The measured f(RH) and f(RH)bsp at 550 nm (1.32 and 1.12) were among the lowest reported in comparable studies, together with one of the lowest SSA550 values. This indicates a dominance of low-hygroscopic aerosol species originating from local combustion and traffic emissions. Seasonal and wavelength-dependent differences in the relationship between f(RH)bsp and f(RH) highlight the need for aerosol-type-specific parametrizations in radiative models. Peaks in both enhancement factors were detected in spring, coinciding with increased contributions of more hygroscopic aerosol components and enhanced photochemical activity. Increasing f(RH) and f(RH)bsp were associated with decreasing hemispheric backscattering ratios and increasing asymmetry factors and SSA, indicating enhanced total scattering and stronger forward scattering due to hygroscopic growth. In contrast, during summer, SAE450−700 increased with RH, suggesting particle shrinkage, likely linked to the dominance of low-hygroscopic black carbon (BC) emissions, which is prone to structural compaction upon humidification.
Chemical composition was found to exert a stronger control on light scattering enhancement than particle number size distribution. BC-dominated aerosol prevailed in summer, while other seasons were characterized by mixed aerosol populations containing BC, brown carbon (BrC), and episodic dust or marine influences. Both f(RH) and f(RH)bsp showed positive correlations with OCEC and SOCOC ratios. More volatile organic fractions exhibited stronger associations with the light scattering enhancement than less volatile fractions, particularly in the spring, underscoring the important role of secondary organic carbon in modulating aerosol hygroscopicity in carbon-dominated urban environments.
In summary, the single-nephelometer system proved suitable for long-term ambient aerosol characterization. The main limitations of the approach are reduced time resolution and the absence of simultaneous dry and wet measurements required for detailed humidogram analysis. Nevertheless, this study contributes valuable observations to the global dataset by characterizing environments where low f(RH), low SSA, and relatively high SAE coexist – conditions that remain underrepresented in current aerosol–climate literature.
Datasets including f(RH) and f(RH)bsp, original relative humidity and temperature variation within humidified single-nephelometer set-up system, concentration of carbonaceous aerosol species, particle size number concentration, meteorological parameters, dry and humidified aerosol optical properties, NPF categorization, and air mass back-trajectory cluster identification are available at https://doi.org/10.17632/8ds98t2f3x.1 (Suchánková, 2025).
The supplement related to this article is available online at https://doi.org/10.5194/amt-19-1611-2026-supplement.
LS, JO, PR and VŽ designed the methodology of the work and created the study conceptualization. Additionally, LS was responsible for data curation, formal analysis, investigation, validation, software, visualization, and writing of the original draft. JO was responsible for software, resources, investigation, and writing – review and editing. NZ contributed to data curation, formal analysis and writing – review and editing. PR was additionally responsible for software. PV was responsible for data curation and writing – review and editing. RP was responsible for project administration, funding andministration and writing – review and editing. IH contributed to supervision. VŽ was responsible for project administration, supervision, resources and writing – review and editing.
The contact author has declared that none of the authors has any competing interests.
Publisher's note: Copernicus Publications remains neutral with regard to jurisdictional claims made in the text, published maps, institutional affiliations, or any other geographical representation in this paper. The authors bear the ultimate responsibility for providing appropriate place names. Views expressed in the text are those of the authors and do not necessarily reflect the views of the publisher.
This work was supported by the Ministry of Education, Youth and Sports of the CR within the Large Research Infrastructure ACTRIS Czech Republic (LM2023030) and CzeCOS (LM2023048). The authors thank the RECETOX RI (No. LM2023069) for the supportive background. This work was supported by the European Union's Horizon 2020 research and innovation program under grant agreement No. 857560 (CETOCOEN Excellence). This publication reflects only the author's view, and the European Commission is not responsible for any use that may be made of the information it contains. Authors acknowledge support from AdAgriF – Advanced methods of greenhouse gases emission reduction and sequestration in agriculture and forest landscape for climate change mitigation (CZ.02.01.01/00/22_008/0004635).
This research has been supported by the Ministerstvo Školství, Mládeže a Tělovýchovy (grant nos. LM2023030, LM2023048, and CZ.02.01.01/00/22_008/0004635) and the RECETOX Přírodovědecké Fakulty Masarykovy Univerzity (grant no. LM2023069), and the EU Horizon 2020 (grant no. 857560). This publication reflects only the author's view, and the European Commission is not responsible for any use that may be made of the information it contains.
This paper was edited by Anthony Bucholtz and reviewed by two anonymous referees.
Alduchov, O. A. and Eskridge, R. E.: Magnus-Tetens formula, Asheville, 21 pp., https://doi.org/10.2172/548871, 1997.
Anderson, T. L. and Ogren, J. A.: Determining Aerosol Radiative Properties Using the TSI 3563 Integrating Nephelometer, Aerosol Sci. Tech., 29, 57–69, https://doi.org/10.1080/02786829808965551, 1998.
Anderson, T. L., Covert, D. S., Marshall, S., Laucks, M. L., Charlson, R. J., Waggoner, A. P., Ogren, J. A., Caldow, R., Holm, R. L., Quant, F. R., Sem, G. J., Wiendensholer, A., Ahlquist, N. A., and Bates, T. S.: Performance Characteristics of a High-Sensitivity, Three-Wavelength, Total Scatter/Backscatter Nephelometer, J. Atmos. Ocean. Tech., 13, 967–986, https://doi.org/10.1175/1520-0426(1996)013<0967:PCOAHS>2.0.CO;2, 1996.
Andrews, E., Sheridan, P. J., Fiebig, M., McComiskey, A., Ogren, J. A., Arnott, P., Covert, D., Elleman, R., Gasparini, R., Collins, D., Jonsson, H., Schmid, B., and Wang, J.: Comparison of methods for deriving aerosol asymmetry parameter, J. Geophys. Res.-Atmos., 111, D05S04, https://doi.org/10.1029/2004JD005734, 2006.
Andrews, E., Zieger, P., Titos, G., and Burgos, M.: Evaluation and improvement of the parameterization of aerosol hygroscopicity in global climate models using in-situ surface measurements, Final Report, https://doi.org/10.2172/1706478, 2021.
Aswini, A. R., Hegde, P., Nair, P. R., and Aryasree, S.: Seasonal changes in carbonaceous aerosols over a tropical coastal location in response to meteorological processes, Sci. Total Environ., 656, 1261–1279, https://doi.org/10.1016/J.SCITOTENV.2018.11.366, 2019.
Bauer, J. J., Yu, X.-Y., Cary, R., Laulainen, N., and Berkowitz, C.: Characterization of the sunset semi-continuous carbon aerosol analyzer, J. Air Waste Manage., 59, 826–833, https://doi.org/10.3155/1047-3289.59.7.826, 2009.
Boucher, O.: Atmospheric Aerosols, in: Atmospheric Aerosols, Springer Netherlands, Dordrecht, 9–24, https://doi.org/10.1007/978-94-017-9649-1_2, 2015.
Burgos, M. A., Andrews, E., Titos, G., Alados-Arboledas, L., Baltensperger, U., Day, D., Jefferson, A., Kalivitis, N., Mihalopoulos, N., Sherman, J., Sun, J., Weingartner, E., and Zieger, P.: A global view on the effect of water uptake on aerosol particle light scattering, Sci. Data, 6, 1–19, https://doi.org/10.1038/s41597-019-0158-7, 2019.
Burgos, M. A., Andrews, E., Titos, G., Benedetti, A., Bian, H., Buchard, V., Curci, G., Kipling, Z., Kirkevåg, A., Kokkola, H., Laakso, A., Letertre-Danczak, J., Lund, M. T., Matsui, H., Myhre, G., Randles, C., Schulz, M., van Noije, T., Zhang, K., Alados-Arboledas, L., Baltensperger, U., Jefferson, A., Sherman, J., Sun, J., Weingartner, E., and Zieger, P.: A global model–measurement evaluation of particle light scattering coefficients at elevated relative humidity, Atmos. Chem. Phys., 20, 10231–10258, https://doi.org/10.5194/acp-20-10231-2020, 2020.
Cappa, C. D., Kolesar, K. R., Zhang, X., Atkinson, D. B., Pekour, M. S., Zaveri, R. A., Zelenyuk, A., and Zhang, Q.: Understanding the optical properties of ambient sub- and supermicron particulate matter: results from the CARES 2010 field study in northern California, Atmos. Chem. Phys., 16, 6511–6535, https://doi.org/10.5194/acp-16-6511-2016, 2016.
Carrico, C. M., Kus, P., Rood, M. J., Quinn, P. K., Bates, T. S., Carrico, C., Kus, P., Rood, M. J., Quinn, P. K., and Bates, T. S.: Mixtures of pollution, dust, sea salt, and volcanic aerosol during ACE-Asia: Radiative properties as a function of relative humidity, J. Geophys. Res.-Atmos., 108, 8650, https://doi.org/10.1029/2003JD003405, 2003.
Carslaw, K. S., Gordon, H., Hamilton, D. S., Johnson, J. S., Regayre, L. A., Yoshioka, M., and Pringle, K. J.: Aerosols in the Pre-industrial Atmosphere, Curr. Clim. Chang. Reports, 31, 1–15, https://doi.org/10.1007/S40641-017-0061-2, 2017.
Cavalli, F., Viana, M., Yttri, K. E., Genberg, J., and Putaud, J.-P.: Toward a standardised thermal-optical protocol for measuring atmospheric organic and elemental carbon: the EUSAAR protocol, Atmos. Meas. Tech., 3, 79–89, https://doi.org/10.5194/amt-3-79-2010, 2010.
Cazorla, A., Bahadur, R., Suski, K. J., Cahill, J. F., Chand, D., Schmid, B., Ramanathan, V., and Prather, K. A.: Relating aerosol absorption due to soot, organic carbon, and dust to emission sources determined from in-situ chemical measurements, Atmos. Chem. Phys., 13, 9337–9350, https://doi.org/10.5194/acp-13-9337-2013, 2013.
Chan, M. N., Choi, M. Y., Ng, N. L., and Chan, C. K.: Hygroscopicity of water-soluble organic compounds in atmospheric aerosols: Amino acids and biomass burning derived organic species, Environ. Sci. Technol., 39, 1555–1562, https://doi.org/10.1021/ES049584L, 2005.
Czech statistical office: Population and Housing Census, https://geodata.csu.gov.cz/as/atlas/?xmax=2194777.485518976&ymax=6694180.788553198&xmin=1255519.2819509797&ymin=6135884.7339584185&wkid=102100 (last access: 13 December 2024), 2024.
Clarke, A. and Kapustin, V.: Hemispheric aerosol vertical profiles: Anthropogenic impacts on optical depth and cloud nuclei, Science, 329, 1488–1492, https://doi.org/10.1126/science.1188838, 2010.
Covert, D. S., Charlson, R. J., and Ahlquist, N. C.: A Study of the Relationship of Chemical Composition and Humidity to Light Scattering by Aerosols, J. Appl. Meteorol., 11, 968–976, https://doi.org/10.1175/1520-0450(1972)011<0968:asotro>2.0.co;2, 1972.
Dinar, E., Abo Riziq, A., Spindler, C., Erlick, C., Kiss, G., and Rudich, Y.: The complex refractive index of atmospheric and model humic-like substances (HULIS) retrieved by a cavity ring down aerosol spectrometer (CRD-AS), Faraday Discuss., 137, 279–295, https://doi.org/10.1039/B703111D, 2008.
Doherty, S. J.: A comparison and summary of aerosol optical properties as observed in situ from aircraft, ship, and land during ACE-Asia, J. Geophys. Res., 110, D04201, https://doi.org/10.1029/2004JD004964, 2005.
Donateo, A., Lo Feudo, T., Marinoni, A., Calidonna, C. R., Contini, D., and Bonasoni, P.: Long-term observations of aerosol optical properties at three GAW regional sites in the Central Mediterranean, Atmos. Res., 241, 104976, https://doi.org/10.1016/j.atmosres.2020.104976, 2020.
Draxler, R. R. and Hess, G. D.: An overview of the HYSPLIT_4 modelling system for trajectories, dispersion and deposition, Aust. Meteorol. Mag., 47, 295–308, https://doi.org/10.1071/ES98032, 1998.
Drinovec, L., Močnik, G., Zotter, P., Prévôt, A. S. H., Ruckstuhl, C., Coz, E., Rupakheti, M., Sciare, J., Müller, T., Wiedensohler, A., and Hansen, A. D. A.: The “dual-spot” Aethalometer: an improved measurement of aerosol black carbon with real-time loading compensation, Atmos. Meas. Tech., 8, 1965–1979, https://doi.org/10.5194/amt-8-1965-2015, 2015.
Fierz-Schmidhauser, R., Zieger, P., Gysel, M., Kammermann, L., DeCarlo, P. F., Baltensperger, U., and Weingartner, E.: Measured and predicted aerosol light scattering enhancement factors at the high alpine site Jungfraujoch, Atmos. Chem. Phys., 10, 2319–2333, https://doi.org/10.5194/acp-10-2319-2010, 2010.
Flemming, J., Benedetti, A., Inness, A., Engelen, R. J., Jones, L., Huijnen, V., Remy, S., Parrington, M., Suttie, M., Bozzo, A., Peuch, V.-H., Akritidis, D., and Katragkou, E.: The CAMS interim Reanalysis of Carbon Monoxide, Ozone and Aerosol for 2003–2015, Atmos. Chem. Phys., 17, 1945–1983, https://doi.org/10.5194/acp-17-1945-2017, 2017.
Foster, P., Storelvmo, T., Armour, K., Collins, W., Dufresne, J. L., Frame, D., Lunt, D. J., Mauritsen, T., Palmer, M. D., Watanabe, M., Wild, M., and Zhang, H.: The Earth's Energy Budget, Climate Feedbacks, and Climate Sensitivity, in: Climate Change 2021: The Physical Science Basis. Contribution of Working Group I to the Sixth Assessment Report of the Intergovernmental Panel on Climate Change, Climate Change 2021 – The Physical Science Basis, Cambridge University Press, 923–1054, https://doi.org/10.1017/9781009157896.009, 2023.
Haywood, J. M. and Shine, K. P.: The effect of anthropogenic sulfate and soot aerosol on the clear sky planetary radiation budget, Geophys. Res. Lett., 22, 603–606, https://doi.org/10.1029/95GL00075, 1995.
Hegg, D. A., Covert, D. S., Rood, M. J., and Hobbs, P. V.: Measurements of aerosol optical properties in marine air, J. Geophys. Res.-Atmos., 101, 12893–12903, https://doi.org/10.1029/96JD00751, 1996.
Held, A., Zerrath, A., McKeon, U., Fehrenbach, T., Niessner, R., Plass-Dülmer, C., Kaminski, U., Berresheim, H., and Pöschl, U.: Aerosol size distributions measured in urban, rural and high-alpine air with an electrical low pressure impactor (ELPI), Atmos. Environ., 42, 8502–8512, https://doi.org/10.1016/j.atmosenv.2008.06.015, 2008.
Huang, W., Saathoff, H., Shen, X., Ramisetty, R., Leisner, T., and Mohr, C.: Seasonal characteristics of organic aerosol chemical composition and volatility in Stuttgart, Germany, Atmos. Chem. Phys., 19, 11687–11700, https://doi.org/10.5194/acp-19-11687-2019, 2019.
HYSPLIT model: https://www.ready.noaa.gov/HYSPLIT.php (last access: 13 June 2025).
IPCC: Climate Change 2021: The Physical Science Basis. Contribution of Working Group I to the Sixth Assessment Report of the Intergovernmental Panel on Climate Change, edited by: Masson-Delmotte, V., Zhai, P., Pirani, A., Connors, S. L., Péan, C., Berger, S., Caus, N., Chen, Y., Goldfarb, L., Gomis, M. I., Huang, M., Leitzell, K., Lonnoy, E., Matthews, J. B. R., Maycock, T. K., Waterfield, T., Yelekçi, O., Yu, R., and Zhou, B., Cambridge University Press, Cambridge, United Kingdom and New York, NY, USA, 3949 pp., https://doi.org/10.1017/9781009157896, 2023.
Kahn, R. A., Andrews, E., Brock, C. A., Chin, M., Feingold, G., Gettelman, A., Levy, R. C., Murphy, D. M., Nenes, A., Pierce, J. R., Popp, T., Redemann, J., Sayer, A. M., da Silva, A. M., Sogacheva, L., and Stier, P.: Reducing Aerosol Forcing Uncertainty by Combining Models With Satellite and Within-The-Atmosphere Observations: A Three-Way Street, Rev. Geophys., 61, https://doi.org/10.1029/2022RG000796, 2023.
Kang, H., Jung, C. H., Lee, B. Y., Krejci, R., Heslin-Rees, D., Aas, W., and Yoon, Y. J.: Aerosol hygroscopicity influenced by seasonal chemical composition variations in the Arctic region, J. Aerosol Sci., 186, 106551, https://doi.org/10.1016/j.jaerosci.2025.106551, 2025.
Kiehl, J. T. and Briegleb, B. P.: The Relative Roles of Sulfate Aerosols and Greenhouse Gases in Climate Forcing, Science, 260, 311–314, https://doi.org/10.1126/SCIENCE.260.5106.311, 1993.
Koop, T., Bookhold, J., Shiraiwa, M., and Pöschl, U.: Glass transition and phase state of organic compounds: dependency on molecular properties and implications for secondary organic aerosols in the atmosphere, Phys. Chem. Chem. Phys., 13, 19238–19255, https://doi.org/10.1039/C1CP22617G, 2011.
Kristensen, T. B., Wex, H., Nekat, B., Njgaard, J. K., Van Pinxteren, D., Lowenthal, D. H., Mazzoleni, L. R., Dieckmann, K., Bender Koch, C., Mentel, T. F., Herrmann, H., Gannet Hallar, A., Stratmann, F., and Bilde, M.: Hygroscopic growth and CCN activity of HULIS from different environments, J. Geophys. Res.-Atmos., 117, 22203, https://doi.org/10.1029/2012JD018249, 2012.
Liu, J. and Li, Z.: Significant Underestimation in the Optically Based Estimation of the Aerosol First Indirect Effect Induced by the Aerosol Swelling Effect, Geophys. Res. Lett., 45, 5690–5699, https://doi.org/10.1029/2018GL077679, 2018.
Liu, X. and Wang, J.: How important is organic aerosol hygroscopicity to aerosol indirect forcing?, https://doi.org/10.1088/1748-9326/5/4/044010, 2010.
Magee Scientific: User's manual for Aethalometer® Model AE33, 149, https://aerosolmageesci.com/products/aethalometer-ae33/ (last access: 10 June 2025) 2018.
Maskey, S., Chong, K. Y., Kim, G., Kim, J. S., Ali, A., and Park, K.: Effect of mixing structure on the hygroscopic behavior of ultrafine ammonium sulfate particles mixed with succinic acid and levoglucosan, Particuology, 13, 27–34, https://doi.org/10.1016/J.PARTIC.2013.08.004, 2014.
Massoli, P., Bates, T. S., Quinn, P. K., Lack, D. A., Baynard, T., Lerner, B. M., Tucker, S. C., Brioude, J., Stohl, A., and Williams, E. J.: Aerosol optical and hygroscopic properties during TexAQS-GoMACCS 2006 and their impact on aerosol direct radiative forcing, J. Geophys. Res.-Atmos., 114, 0–07, https://doi.org/10.1029/2008JD011604, 2009.
Mbengue, S., Zikova, N., Schwarz, J., Vodička, P., Šmejkalová, A. H., and Holoubek, I.: Mass absorption cross-section and absorption enhancement from long term black and elemental carbon measurements: A rural background station in Central Europe, Sci. Total Environ., 794, 1–14, https://doi.org/10.1016/j.scitotenv.2021.148365, 2021.
Müller, T. and Fiebig, M.: ACTRIS In Situ Aerosol: Guidelines for Manual QC of AE33 absorption photometer data, 9 pp., 2021.
Müller, T., Laborde, M., Kassell, G., and Wiedensohler, A.: Design and performance of a three-wavelength LED-based total scatter and backscatter integrating nephelometer, Atmos. Meas. Tech., 4, 1291–1303, https://doi.org/10.5194/amt-4-1291-2011, 2011.
Myhre, G., Shindell, D., Bréon, F.-M., Collins, W., Fuglestvedt, J., Huang, J., Koch, D., Lamarque, J.-F., Lee, D., Mendoza, B., Nakajima, T., Robock, A., Stephens, T., Takemura, T., and Zhang, H.: Anthropogenic and natural radiative forcing, in: Climate Change 2013 the Physical Science Basis: Working Group I Contribution to the Fifth Assessment Report of the Intergovernmental Panel on Climate Change, vol. 9781107057, edited by: Stocker, T. F., Qin, D. G.-K. P., Tignor, M., Allen, S. K., Boschung, J., Nauels, A., Xia, Y., Bex, V., and Midgley, P. M., Cambridge University Press, Cambridge, United Kingdom and New York, NY, USA, 659–740, https://doi.org/10.1017/CBO9781107415324.018, 2013.
Orozco, D., Beyersdorf, A. J., Ziemba, L. D., Berkoff, T., Zhang, Q., Delgado, R., Hennigan, C. J., Thornhill, K. L., Young, D. E., Parworth, C., Kim, H., and Hoff, R. M.: Hygrosopicity measurements of aerosol particles in the San Joaquin Valley, CA, Baltimore, MD, and Golden, CO, J. Geophys. Res.-Atmos., 121, 7344–7359, https://doi.org/10.1002/2015JD023971, 2016.
Pandolfi, M., Alados-Arboledas, L., Alastuey, A., Andrade, M., Angelov, C., Artiñano, B., Backman, J., Baltensperger, U., Bonasoni, P., Bukowiecki, N., Collaud Coen, M., Conil, S., Coz, E., Crenn, V., Dudoitis, V., Ealo, M., Eleftheriadis, K., Favez, O., Fetfatzis, P., Fiebig, M., Flentje, H., Ginot, P., Gysel, M., Henzing, B., Hoffer, A., Holubova Smejkalova, A., Kalapov, I., Kalivitis, N., Kouvarakis, G., Kristensson, A., Kulmala, M., Lihavainen, H., Lunder, C., Luoma, K., Lyamani, H., Marinoni, A., Mihalopoulos, N., Moerman, M., Nicolas, J., O'Dowd, C., Petäjä, T., Petit, J.-E., Pichon, J. M., Prokopciuk, N., Putaud, J.-P., Rodríguez, S., Sciare, J., Sellegri, K., Swietlicki, E., Titos, G., Tuch, T., Tunved, P., Ulevicius, V., Vaishya, A., Vana, M., Virkkula, A., Vratolis, S., Weingartner, E., Wiedensohler, A., and Laj, P.: A European aerosol phenomenology – 6: scattering properties of atmospheric aerosol particles from 28 ACTRIS sites, Atmos. Chem. Phys., 18, 7877–7911, https://doi.org/10.5194/acp-18-7877-2018, 2018.
Perrone, M. R., Romano, S., Genga, A., and Paladini, F.: Integration of optical and chemical parameters to improve the particulate matter characterization, Atmos. Res., 205, 93–106, https://doi.org/10.1016/j.atmosres.2018.02.015, 2018.
Pilat, M. J. and Charlson, R. J.: Theoretical and optical stud- ies of humidity effects on the size distribution of a hygroscopic aerosol, J. Rech. Atmosphériques, 2, 165–170, 1966.
Pöhlker, M. L., Pöhlker, C., Quaas, J., Mülmenstädt, J., Pozzer, A., Andreae, M. O., Artaxo, P., Block, K., Coe, H., Ervens, B., Gallimore, P., Gaston, C. J., Gunthe, S. S., Henning, S., Herrmann, H., Krüger, O. O., McFiggans, G., Poulain, L., Raj, S. S., Reyes-Villegas, E., Royer, H. M., Walter, D., Wang, Y., and Pöschl, U.: Global organic and inorganic aerosol hygroscopicity and its effect on radiative forcing, Nat. Commun., 14, 6139, https://doi.org/10.1038/s41467-023-41695-8, 2023.
Ray, A., Bhowmik, M., Hazra, A., and Pandithurai, G.: The influence of aerosol hygroscopicity on clouds and precipitation over Western Ghats, India, Q. J. Roy. Meteor. Soc., 150, 1473–1488, https://doi.org/10.1002/QJ.4654, 2024.
Ren, R., Li, Z., Yan, P., Wang, Y., Wu, H., Cribb, M., Wang, W., Jin, X., Li, Y., and Zhang, D.: Measurement report: The effect of aerosol chemical composition on light scattering due to the hygroscopic swelling effect, Atmos. Chem. Phys., 21, 9977–9994, https://doi.org/10.5194/acp-21-9977-2021, 2021.
Savadkoohi, M., Pandolfi, M., Favez, O., Putaud, J. P., Eleftheriadis, K., Fiebig, M., Hopke, P. K., Laj, P., Wiedensohler, A., Alados-Arboledas, L., Bastian, S., Chazeau, B., María, Á. C., Colombi, C., Costabile, F., Green, D. C., Hueglin, C., Liakakou, E., Luoma, K., Listrani, S., Mihalopoulos, N., Marchand, N., Močnik, G., Niemi, J. V., Ondráček, J., Petit, J. E., Rattigan, O. V., Reche, C., Timonen, H., Titos, G., Tremper, A. H., Vratolis, S., Vodička, P., Funes, E. Y., Zíková, N., Harrison, R. M., Petäjä, T., Alastuey, A., and Querol, X.: Recommendations for reporting equivalent black carbon (eBC) mass concentrations based on long-term pan-European in-situ observations, Environ. Int., 185, 108553, https://doi.org/10.1016/J.ENVINT.2024.108553, 2024.
Savadkoohi, M., Gherras, M., Favez, O., Petit, J. E., Rovira, J., Chen, G. I., Via, M., Platt, S., Aurela, M., Chazeau, B., de Brito, J. F., Riffault, V., Eleftheriadis, K., Flentje, H., Gysel-Beer, M., Hueglin, C., Rigler, M., Gregorič, A., Ivančič, M., Keernik, H., Maasikmets, M., Liakakou, E., Stavroulas, I., Luoma, K., Marchand, N., Mihalopoulos, N., Petäjä, T., Prevot, A. S. H., Daellenbach, K. R., Vodička, P., Timonen, H., Tobler, A., Vasilescu, J., Dandocsi, A., Mbengue, S., Vratolis, S., Zografou, O., Chauvigné, A., Hopke, P. K., Querol, X., Alastuey, A., and Pandolfi, M.: Addressing the advantages and limitations of using Aethalometer data to determine the optimal absorption Ångström exponents (AAEs) values for eBC source apportionment, Atmos. Environ., 349, https://doi.org/10.1016/j.atmosenv.2025.121121, 2025.
Seinfeld, J. H. and Pandis, S. N.: Atmospheric chemistry and physics, 2nd edn., John Wiley & Sons, Ltd, New Jersey, 1203 pp., https://doi.org/10.1007/978-3-662-04540-4_16, 2006.
Shen, Y., Zhi, G., Zhang, Y., Jin, W., Kong, Y., Li, Z., and Zhang, H.: An investigative review of the expanded capabilities of thermal/optical techniques for measuring carbonaceous aerosols and beyond, Environ. Pollut., 364, 125363, https://doi.org/10.1016/J.ENVPOL.2024.125363, 2025.
Song, M., Liu, P. F., Hanna, S. J., Zaveri, R. A., Potter, K., You, Y., Martin, S. T., and Bertram, A. K.: Relative humidity-dependent viscosity of secondary organic material from toluene photo-oxidation and possible implications for organic particulate matter over megacities, Atmos. Chem. Phys., 16, 8817–8830, https://doi.org/10.5194/acp-16-8817-2016, 2016.
Stein, A. F., Draxler, R. R., Rolph, G. D., Stunder, B. J. B., Cohen, M. D., and Ngan, F.: NOAA's HYSPLIT atmospheric transport and dispersion modeling system, B. Am. Meteorol. Soc., 96, 2059–2077, https://doi.org/10.1175/BAMS-D-14-00110.1, 2015.
Suchánková, L.: “Humidified single-nephelometer set-up system datasets”, Mendeley Data [data set], V1, https://doi.org/10.17632/8ds98t2f3x.1, 2025.
Suchánková, L., Crumeyrolle, S., Bourrianne, E., Prokeš, R., Holoubek, I., Ždímal, V., and Chiapello, I.: An insight into recent PM1 aerosol light scattering properties and particle number concentration variabilities at the suburban site ATOLL in Northern France, Sci. Total Environ., 959, 178190, https://doi.org/10.1016/J.SCITOTENV.2024.178190, 2025.
Tang, J., Li, J., Mo, Y., Safaei Khorram, M., Chen, Y., Tang, J., Zhang, Y., Song, J., and Zhang, G.: Light absorption and emissions inventory of humic-like substances from simulated rainforest biomass burning in Southeast Asia, Environ. Pollut., 262, https://doi.org/10.1016/J.ENVPOL.2020.114266, 2020.
Thomsen, D., Iversen, E. M., Skønager, J. T., Luo, Y., Li, L., Roldin, P., Priestley, M., Pedersen, H. B., Hallquist, M., Ehn, M., Bilde, M., and Glasius, M.: The effect of temperature and relative humidity on secondary organic aerosol formation from ozonolysis of Δ3-carene, Environ. Sci. Atmos., 4, 88–103, https://doi.org/10.1039/D3EA00128H, 2024.
Titos, G., Lyamani, H., Cazorla, A., Sorribas, M., Foyo-Moreno, I., Wiedensohler, A., and Alados-Arboledas, L.: Study of the relative humidity dependence of aerosol light-scattering in southern Spain, Tellus B, 66, 24536, https://doi.org/10.3402/tellusb.v66.24536, 2014.
Titos, G., Cazorla, A., Zieger, P., Andrews, E., Lyamani, H., Granados-Muñoz, M. J., Olmo, F. J., and Alados-Arboledas, L.: Effect of hygroscopic growth on the aerosol light-scattering coefficient: A review of measurements, techniques and error sources, Atmos. Environ., 141, 494–507, https://doi.org/10.1016/j.atmosenv.2016.07.021, 2016.
Titos, G., Burgos, M. A., Zieger, P., Alados-Arboledas, L., Baltensperger, U., Jefferson, A., Sherman, J., Weingartner, E., Henzing, B., Luoma, K., O'Dowd, C., Wiedensohler, A., and Andrews, E.: A global study of hygroscopicity-driven light-scattering enhancement in the context of other in situ aerosol optical properties, Atmos. Chem. Phys., 21, 13031–13050, https://doi.org/10.5194/acp-21-13031-2021, 2021.
Toll, V., Christensen, M., Quaas, J., and Bellouin, N.: Weak average liquid-cloud-water response to anthropogenic aerosols, Nature, 572, 51–55, https://doi.org/10.1038/s41586-019-1423-9, 2019.
Vodička, P., Schwarz, J., and Ždímal, V.: Analysis of one year's OC/EC data at a Prague suburban site with 2-h time resolution, Atmos. Environ., 77, 865–872, https://doi.org/10.1016/j.atmosenv.2013.06.013, 2013.
Vodička, P., Schwarz, J., Cusack, M., and Ždímal, V.: Detailed comparison of OC/EC aerosol at an urban and a rural Czech background site during summer and winter, Sci. Total Environ., 518–519, 424–433, https://doi.org/10.1016/j.scitotenv.2015.03.029, 2015.
Watson-Parris, D. and Smith, C. J.: Large uncertainty in future warming due to aerosol forcing, Nat. Clim. Change, 12, 1111–1113, https://doi.org/10.1038/s41558-022-01516-0, 2022.
Williams, A. I. L., Stier, P., Dagan, G., and Watson-Parris, D.: Strong control of effective radiative forcing by the spatial pattern of absorbing aerosol, Nat. Clim. Change, 12, 735–742, https://doi.org/10.1038/s41558-022-01415-4, 2022.
Wiscombie, W. J. and Grams, G. W.: Backscattered fraction in two-stream approximations, J. Atmos. Sci., 33, 2440–2451, https://doi.org/10.1175/1520-0469(1976)033<2440:tbfits>2.0.co;2, 1976.
WMO/GAW: WMO/GAW Aerosol Measurement Procedures, Guidelines and Recommendations (2nd Edition) | Climate & Clean Air Coalition, Genewa, 103 pp., ISBN 978-92-63-11177-7, 2016.
Wu, T. and Boor, B. E.: Urban aerosol size distributions: a global perspective, Atmos. Chem. Phys., 21, 8883–8914, https://doi.org/10.5194/acp-21-8883-2021, 2021.
Zhang, J., Chen, Y. S., Gryspeerdt, E., Yamaguchi, T., and Feingold, G.: Radiative forcing from the 2020 shipping fuel regulation is large but hard to detect, Commun. Earth Environ., 61, 1–11, https://doi.org/10.1038/s43247-024-01911-9, 2025.
Zieger, P., Fierz-Schmidhauser, R., Poulain, L., Müller, T., Birmili, W., Spindler, G., Wiedensohler, A., Baltensperger, U., and Weingartner, E.: Influence of water uptake on the aerosol particle light scattering coefficients of the Central European aerosol, Tellus B, 66, https://doi.org/10.3402/TELLUSB.V66.22716, 2014.
Zieger, P., Aalto, P. P., Aaltonen, V., Äijälä, M., Backman, J., Hong, J., Komppula, M., Krejci, R., Laborde, M., Lampilahti, J., de Leeuw, G., Pfüller, A., Rosati, B., Tesche, M., Tunved, P., Väänänen, R., and Petäjä, T.: Low hygroscopic scattering enhancement of boreal aerosol and the implications for a columnar optical closure study, Atmos. Chem. Phys., 15, 7247–7267, https://doi.org/10.5194/acp-15-7247-2015, 2015.