the Creative Commons Attribution 4.0 License.
the Creative Commons Attribution 4.0 License.
 | 10 Mar 2026
Monitoring and quantifying wind turbine clutter in DWD weather radar measurements
Annette M. Boehm
Patrick Tracksdorf
Wind turbine clutter (WTC) is a serious threat to radar measurements from polarimetric weather radar. In Germany, wind turbines can now be built within the 5–15 km range of a weather radar in order to support and further increase the production of green energy. In order to protect the remaining 5 km radius from further wind turbine expansion, WTC is monitored and the consequences on radar data quality are quantified. There are currently no filter methods that can reliably separate wind turbine clutter from desired weather information. It is shown, that a dynamic WTC detection algorithm on the signal processor level performs well in over 80 % of the time if the rotor speed of the wind turbine is larger than 5 rpm (i.e. wind turbine is running). The dynamic WTC detection algorithm fails in situations where, presumably, the static clutter contribution from the wind turbine tower is too large. This is assessed for the first time by using wind turbine operator data from two wind turbines at a distance of about 10 km from a radar system, which are provided in real-time to the Deutscher Wetterdienst (DWD). For the DWD radar system Ummendorf, persistent WTC occupies 5 % of the area in the 5 km radius (approx. 4 km2), and 3 % in the 5–15 km radius (approx. 18 km2). WTC is found up to an antenna elevation of 3.5° within the 5 km radius, and 1.5° with the 5–15 km radius. Using wind measurements from a synoptic weather station near the radar system Ummendorf, a wind turbine (WT) detection probability between 60 % and 80 % can be deduced for the WTs at around the 5 km radius. We show that polarimetric radar measurements are more sensitive to WTC. Especially the areal coverage of the disturbance is larger than that observed for radar reflectivity. Also, the vertical extent of WTC on polarimetric moments, illustrated by the depolarisation ratio (DR), is clearly present at 3.5° antenna elevation, and less so in radar reflectivity.
A wind park at the 5 km range from the radar system Ummendorf is used to quantify the beam blockage by WTs statistically. Though the data are noisy, a 0.5 dB blockage can be estimated for this particular wind park. This is significant, as the overall accuracy of the radar reflectivity has to be within ±1 dB, meaning 50 % of the radar reflectivity error budget is consumed by this particular wind park. Further, the radar looses sensitivity in measuring precipitation, in particular at long ranges. Static beam-blockage corrections are not applicable to WTC. We conclude, that the 5 km radius must be kept free from WT expansion.
- Article
(18898 KB) - Full-text XML
- BibTeX
- EndNote


Radar measurements are one of the most important data sources for a wide range of applications (Fabry, 2015). They are the backbone for nowcasting products, which provide reliable warnings to the public in severe weather situations and they are the only data source to provide quantitative areal information on the precipitation amount and type, which is an essential information for hydrological and flood warning applications. Radar measurements are also assimilated into numerical weather prediction models. The weather radar network operated by the Deutscher Wetterdienst (DWD) consists of 17 state-of-the-art C-band polarimetric (“dualpol”) weather radar systems. Details about these systems are given in Frech et al. (2017).
Wind turbine clutter (WTC) poses a significant problem to the quality of weather radar measurements and radar based (warning) products. The World Meteorological Organisation (WMO) issued a recommendation for the protection of weather radar measurements from the influence of wind turbines (WMO, 2010). It states, among other things (Annex VI, p. 59, WMO, 2010): No wind turbines shall be installed within a 5 km radius of a weather radar system. At less than 5 km range, beam blockage will become significant. In the 5–20 km range, which is referred to as the “moderate impact zone”, a detailed examination is recommended in order to avoid or minimise a negative effect on the measured radar data.
Since 2024, the previously restricted 5–15 km radius around radars in Germany is essentially opened for potential installations of wind turbines as part of the national transition to renewable energy. Up to 2024, the development of wind turbines in general was limited as much as possible up to a range of 15 km from the radar. This was in particular the case, when the radar beam during the operational scanning would have been, even partially, blocked by a proposed wind turbine installation. This was assessed in often time-consuming legal procedures for every proposed WT installation. Generally, it is accepted by courts, that wind turbines have a negative impact on radar data quality. But it is questioned whether warning products are affected in such a way, that warnings become erroneous beyond an acceptable level. This refers to falsely classified warnings (see e.g. Seltmann and Böhme, 2017).
The assessment of WTC has to not only consider the effect of single wind turbines but also that of wind farms (Isom et al., 2009). The impact on radar data is not only confined to the main radar beam. Scattering of radar side-lobe emissions may affect a much larger area than just the geometric dimensions of a wind turbine. While the effect of single wind turbines may be mitigated using undisturbed surrounding radar measurements that are not affected by a wind turbine, wind farms that cover larger areas will inevitably cause data sectors without valid radar measurements. The consequence of this has to be assessed on the performance of warning algorithms. It has to be stressed that such an assessment is only valid for the particular radar warning product of interest. A generalisation of the result identified for a particular warning product to other radar based products is typically not possible.
In order to monitor and quantify the existing and future WTC situation in the vicinity of weather radars, a monitoring framework has been developed for the DWD weather radar network. An algorithm to dynamically detect WTC based on the analysis of Doppler spectra has been implemented in the radar signal processor in 2021 (Gerhards and Tracksdorf, 2021). This algorithm makes use of characteristic signatures in raw in-phase and quadrature-phase (I&Q) data and corresponding power spectra as was shown in Norin (2015).
WTC can be identified using fuzzy logic classifiers based on polarimetric moments (Ośródka and Szturc, 2022; Tang et al., 2020). The contaminated range bins are commonly thresholded. Undisturbed range bins from the surrounding measurements of a sweep are sometimes used to fill in the resulting gaps (Tang et al., 2020) or measurements from higher undisturbed antenna elevation are used (Ośródka and Szturc, 2022). This assumes that the precipitation field is homogeneous, which is often a fair assumption for stratiform rain events, but is not that simple for convective events. Furthermore, those approaches may work well for a small number of wind turbines, but won't work for large wind farms with a larger number of wind turbines where the underlying assumptions (homogeneity of the precipitation field) will be violated.
A reliable filter to separate the weather signal from wind turbine clutter is not available yet for operational weather radars. For radar reflectivity a possible approach has been presented in Norin (2017). There, a so-called natural neighbour interpolation was used to recover the weather signal in the I&Q data (Norin, 2017). An operationally usable implementation for Doppler and especially polarimetric moments is not available yet. There have been dedicated radar measurement campaigns to study typical signatures in radar moments (Lainer et al., 2021; Gabella et al., 2023). An analytical backscatter model for a wind turbine has been introduced in Angulo et al. (2015) and measurements of a wind turbine radar cross section using an unmanned aerial system are presented in Bredemeyer et al. (2019). The effect of WTC on polarimetric moments and the subsequent impact on a hydrometeor classification scheme has been investigated in Frech and Seltmann (2017).
In this paper we introduce an operational wind turbine clutter detection algorithm which is operating on the signal processor level (Sect. 2.1). We then validate this detection algorithm using wind turbine operator data from two wind turbines in about 10 km distance from a radar system (Sect. 2.2 and 2.3). Using the Ummendorf radar site, which has 225 wind turbines in the 15 km range, we quantify the persistence of wind turbine clutter in the operational weather radar data (Sects. 3 and 4). The main findings are summarised in the conclusion, where we also give an outlook on the next steps.
2.1 Algorithm
In this section we introduce the algorithm used to dynamically detect wind turbine clutter (WTC) in the measurements from the C-band weather radar systems of DWD's weather radar network. The algorithm development was initialised and accompanied by DWD and has been presented and discussed in Gerhards and Tracksdorf (2021). Beside the main requirement to achieve a robust WTC detection up to a distance of 25 km for the operational DWD scan strategy (Seltmann et al., 2013), there were further requirements that the algorithm could run on the hardware currently used for the signal processor (ENIGMA, details in Frech et al., 2017) and that there would be no negative impact on the existing processing. A “simple” approach, by detecting rotor blade movement in the measurements, was considered not promising (with regard to robust operational use with a defined scan strategy) because the echoes from wind turbines fluctuate extremely (due to varying rotation speed, orientation, etc.). The approach of a more or less static WTC map was not pursued, because of the strong fluctuations of the echoes originating from wind turbines. A somehow “extended spectral clutter filter” will not be successful either, as the moving rotor-blades of a running wind turbine will, in general, add a signal on all Doppler-components, being visible as enhanced noise floor in the Doppler-spectra (“Doppler noise”). Also, a simple “polarimetric” approach, by investigating intensity differences between two receive polarisations proved not usable so far, since no assessable differences were observed (at least for the radar systems and scan strategy used by DWD). Taking into account the aforementioned requirements and “basic findings”, a detailed data analysis led to an algorithm based on the real-time evaluation of raw in-phase and quadrature-phase (I&Q) data. A key prerequisite for the algorithm is, that the spatial resolution of the required I&Q data is as high as possible, even if this means spatial oversampling (“range oversampling”). For the DWD C-band weather radar network, I&Q data with a high spatial resolution of 25 m is only available in the radar signal processor, which means that the algorithm had to be implemented in the radar signal processor at early processing steps (before output moment creation and any “range aggregation”; the length of the processed range bin available to the user is 250 m). The algorithm was implemented as follows:
-
First, we use the discovered property that rotating wind turbines lead to an enhanced noise floor in the Doppler-spectra (“Doppler noise”). For each (25 m) range gate, an estimate of the Doppler noise according to Wilfong et al. (2014) is calculated and output as the derived moment “Non Coherent Power” (NCPH and NCPV). In the derived moment NCP, the wind turbines are already clearly visible. However, “strong fixed targets” such as towers (including non rotating wind turbines) and power lines and weather targets with a broad spectral width are also visible in the derived moment NCP and we need a robust solution to distinguish these sources.
-
For a “strong fixed target” a strong peak at “Doppler zero velocity” can be expected, which may be approximately 50 dB or more above the noise floor. For a wind turbine having an enhanced noise floor in the Doppler-spectra, a less prominent peak at “Doppler zero velocity” is expected. To utilise this for our algorithm, a “clutter ratio” (CRH and CRV) can be estimated by determining the ratio of the three central DFT components (around Doppler zero velocity) to the estimated noise for each (25 m) range gate. As a consequence, weather situations with a large spectral width cannot be addressed here.
-
With the knowledge that wind turbines are isolated objects, we now perform a “peak search” on the previously derived NCPH for each radar ray. For the “peak search”, again it is most important that the NCPH is available with the highest possible raw data resolution (ideally with a range oversampling, for the DWD radar systems a range (over)sampling of 25 m is available). With a pulse length of 1 µs (typical for DWD radar systems) it is expected that the wind turbine will be “visible” in approximately five or even more successive 25 m range gates and thus will be easily detectable.
-
We then separate the detected peaks into “strong fixed targets” and “WTC” by applying thresholds (see Table 1) to the previously estimated CRH. If the estimated CRH is high (> 40 dB), and in addition NCPH is high (> 10 dB), then the target is more likely a strong fixed target. If the measured CRH is lower (< 40 dB), then it is more likely WTC. Since the information “strong fixed target” represents valuable additional insight, we definitely keep it for possible future filtering.
-
Each local maximum found in this way is further extended so that all (25 m) range gates up to the previous and the following minimum are marked. For the weather situations with a large spectral width, the assumption is that they cover larger areas with more or less homogeneous echo intensity and therefore will not be identified by the peak search.
-
Finally, the dynamic detections are stored for further processing and or filtering steps. Nothing is filtered at this stage.
-
As an optional step the detections may be used to populate a so called “confidence map”, which opens up the possibility to introduce a (configurable) stabilisation. Since a valid “confidence map” requires continuous updating, the question arises as to how this can and should be handled in operational settings. Therefore, the confidence map is not currently used for DWD radar systems.
Table 1Parameters for the algorithm used to dynamically detect WTC in the measurements from the DWD C-band weather radar systems.
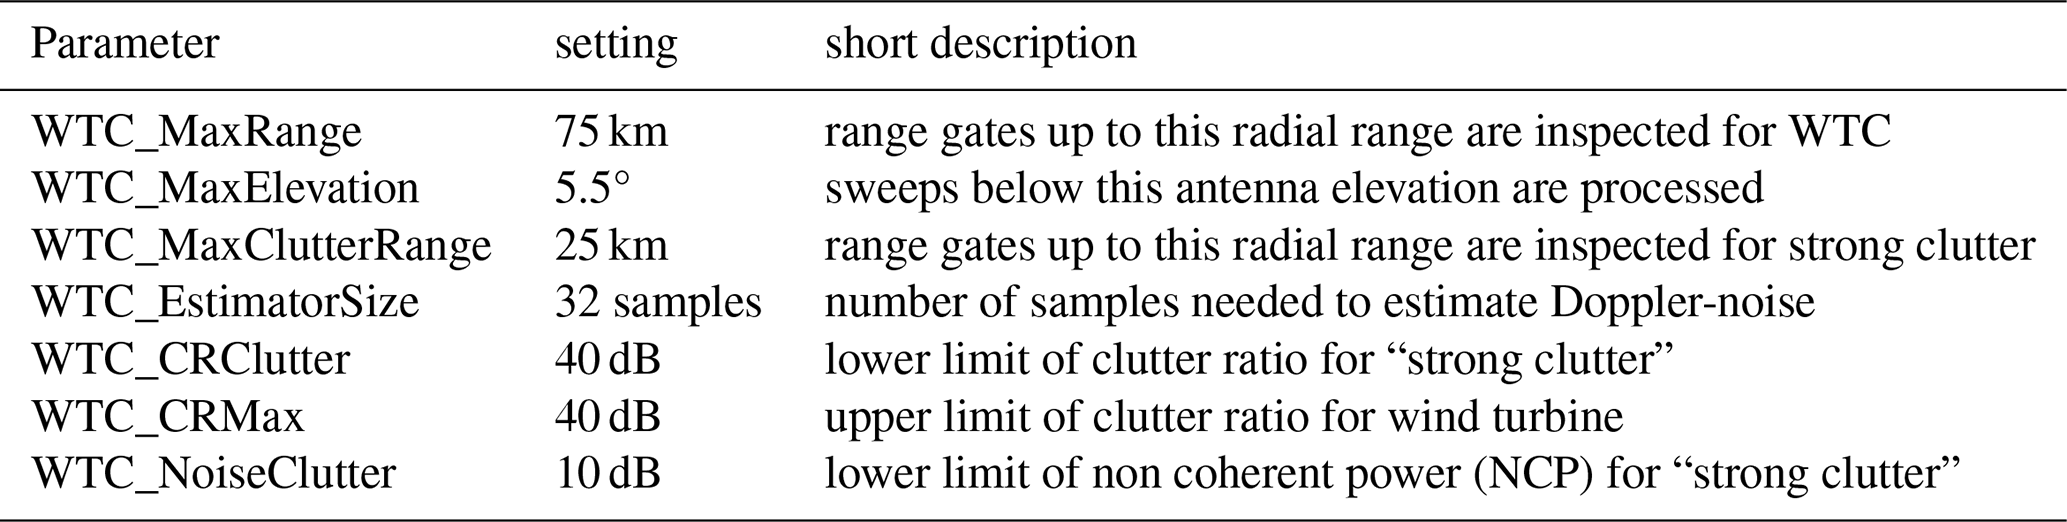
The developed algorithm requires only a few parameters that must be adapted to the underlying radar system and the scanning strategy used. For the DWD C-band weather radar systems the setting are listed in Table 1. The algorithm has been implemented in the signal processor of all DWD weather radar systems in 2021.
2.2 Validation
In Germany, new WT projects are now permitted at a distance of 5–15 km from a weather radar system to further support the increase the green energy production. If there are WTs developed within that range, developers are asked to provide the operational state and basic meteorological measurements (wind speed and wind direction, temperature) at nacelle level. In this section, we use data from two wind turbines at a distance of about 9.5 km from the radar system Türkheim (TUR) to perform an initial validation of the WTC algorithm (Fig. 1). Coordinates and height information of the radars Türkheim and Ummendorf (see next sections) are shown in Table 2. The location of the two wind turbines TUR2 and TUR3 relative to the radar are summarized in Table 3.
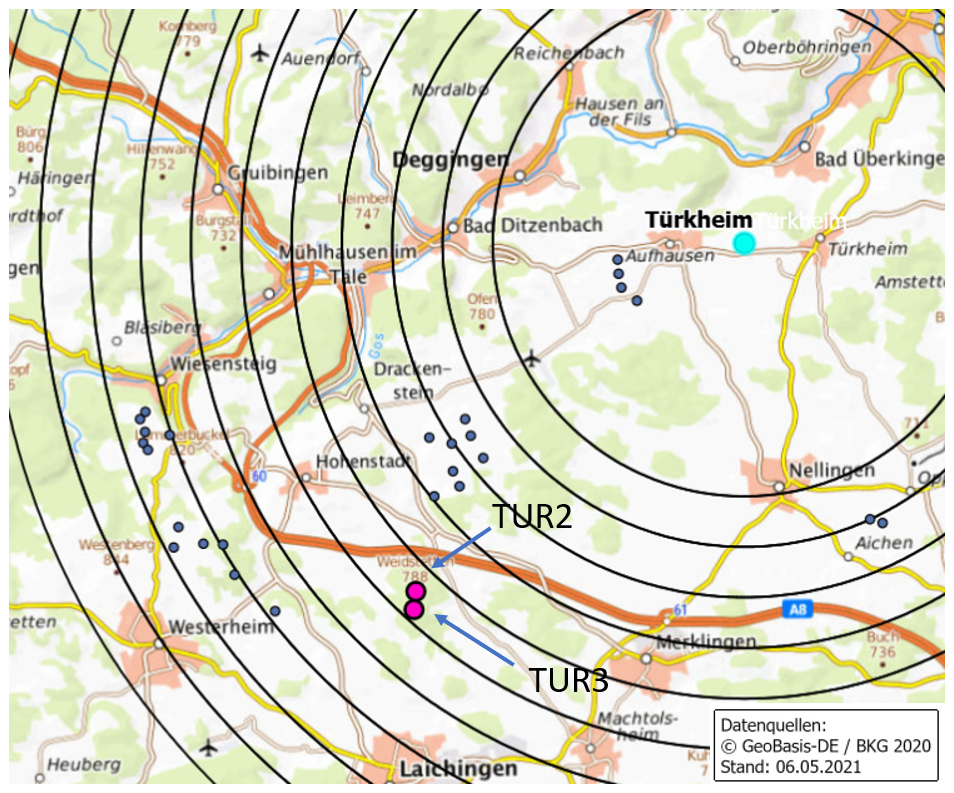
Figure 1The location of the two wind turbines (marked with TUR2 and TUR3) approximately 10 km from the radar Türkheim. Also shown are the location of other wind turbines (small dots). The 5–15 km radii are shown in 1 km steps. Map display and presentation graphics: © BKG (2020) dl-de/by-2-0 (BKG, 2020).
Table 2Radar location and height information for the radars Türkheim (TUR) and Ummendorf (UMD) of the German C-band weather rader network. We operate dualpol radars with 500 kW magnetron transmitters. A pulse length of 0.8 µs is used for the data shown here. The half-power beam width is 0.9° and the antenna has a gain of about 45 dB.
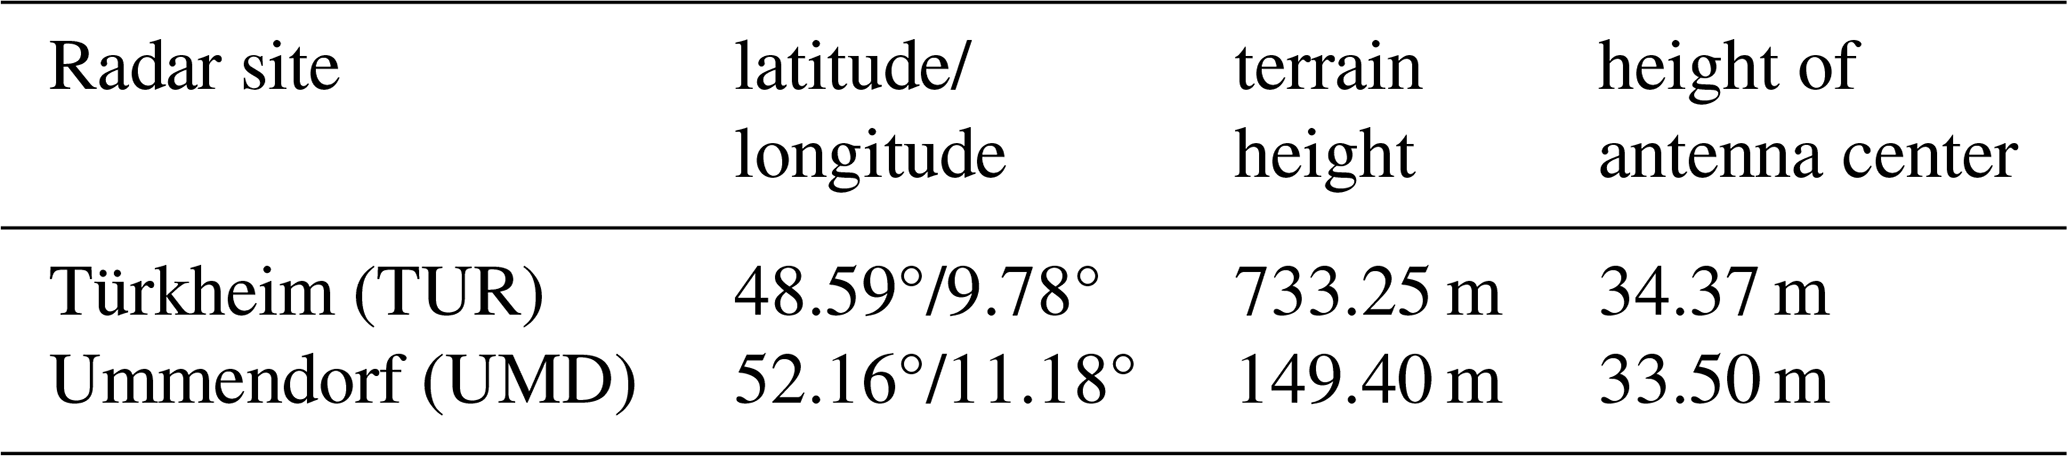
Table 3Wind turbine location and height information of TUR2 and TUR3 (see Fig. 1).
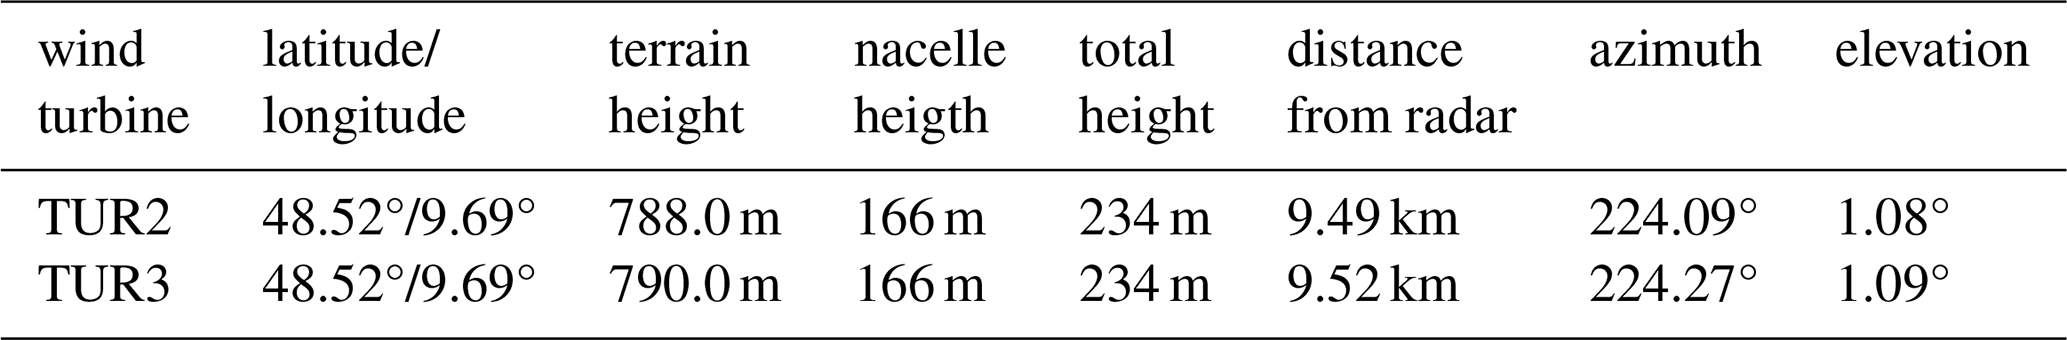
The nacelle is seen by the radar at an antenna elevation of about 1°. The main beam has a width of about 150 m at this distance (with a 0.9° half power beam width of the antenna). The corresponding geometry is shown in more detail in Fig. 2. The figure shows the diameter of the radar beam at the location of the wind turbine for two different radar antenna elevation angles. The plot on the left side represents the scenario with an antenna elevation of 1.1° (terrain following precipitation scan). The plot on the right side shows the scenario with an antenna elevation of 1.5° (volume-scan). The mast of the wind turbine is 166 m high and the rotor blades have a radius of 68 m resulting in an overall height of 234 m. We analyse here radar volume data from antenna elevation 1.5°. For those data, antenna speed is 16° s−1 and a staggered PRF with 600/800 Hz is parameterised to achieve a unambiguous velocity range of ±32 m s−1 (data from 3.5° antenna elevation are parameterised the same way). Pulse length is 0.8 µs. Results from data from 1.1° are very similar to the 1.5° antenna elevation results.
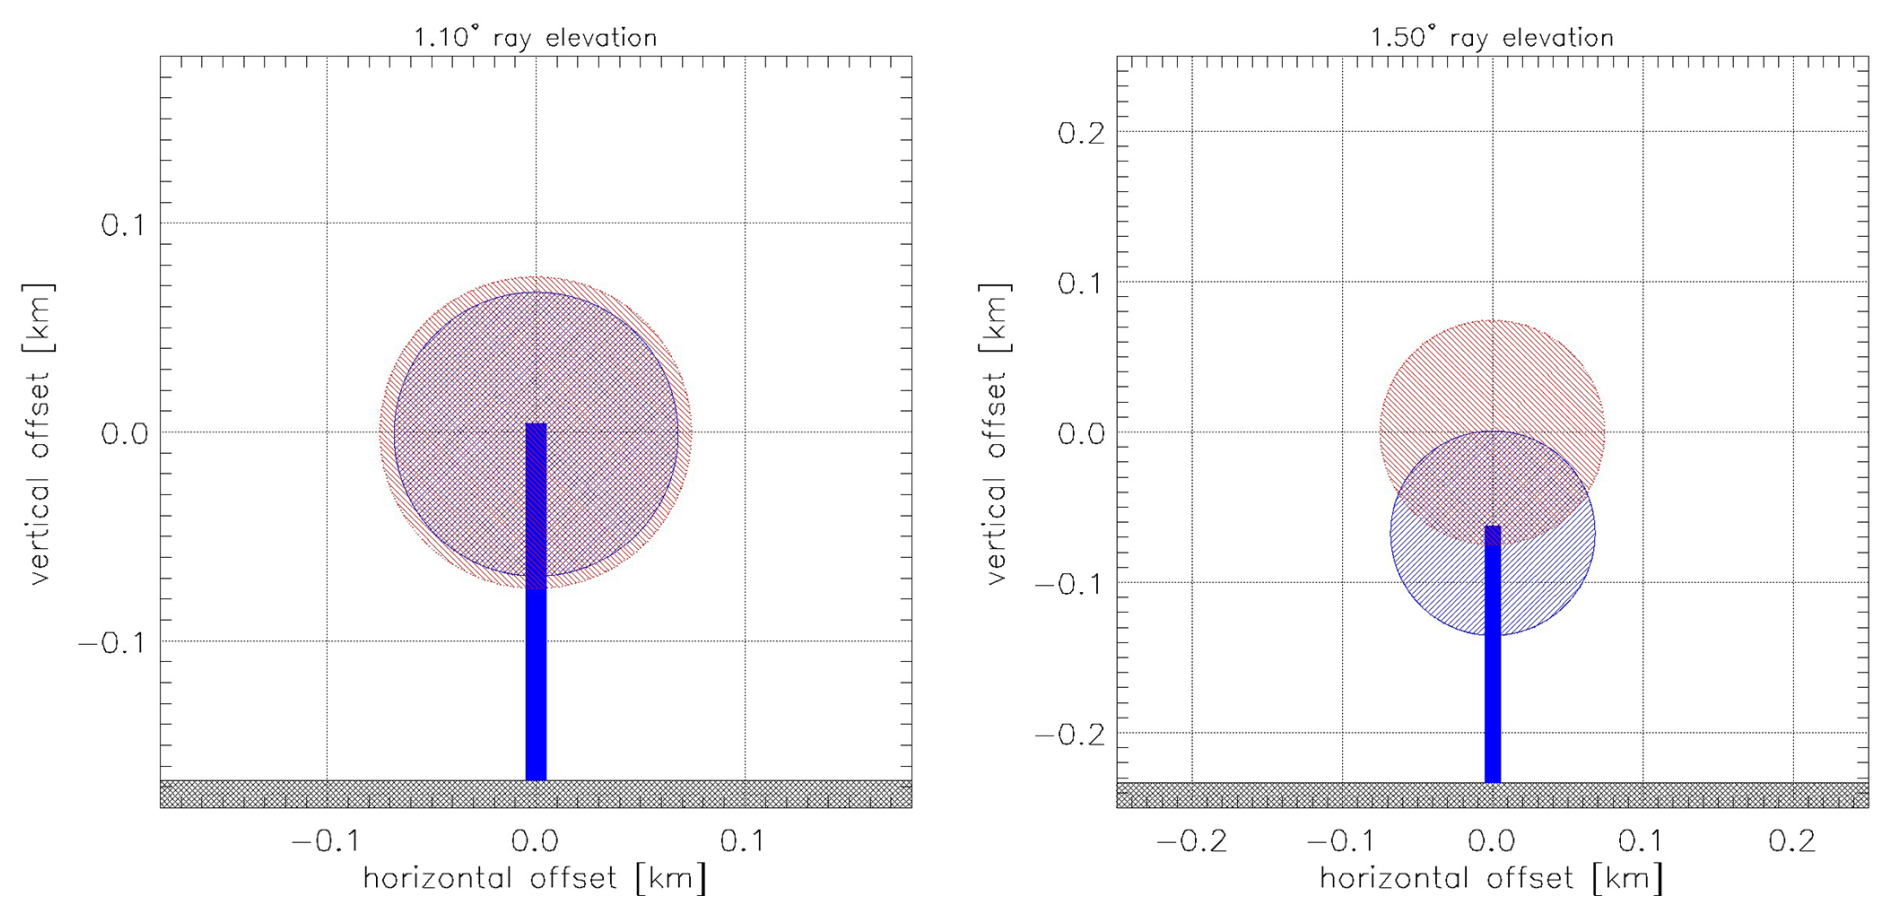
Figure 2Cross section of the radar-beam (red) at the wind turbine TUR2 (blue) as seen from the radar system for an antenna elevation of 1.1° (left) and 1.5° (right). Please note: The axes of the two plots are slightly different.
The WTs are in operation since May 2025. In the following analysis we consider data from 1 June until 10 September 2025. A data set comprising of at least one year of the typical meteorological situations would provide a more reliable validation. However, this shorter time period already shows valuable insights into the performance and limitations of the detection algorithm. Through the DWD data quality monitoring, we can already observe a persistent wind turbine clutter signal from these two wind turbines (Fig. 3; azimuth 224° at a range of about 9.5 km).
The following wind turbine data is available in near real-time at a 10 min resolution: wind speed (m s−1) and wind direction (°) at nacelle height, nacelle direction (°), temperature at nacelle height (K), rotor speed (rpm) and the operational state of wind turbine (online, offline, brake, startup, shutdown). At the location of the two wind turbines, respectively, we extract the following information from the sweeps at 0.5 and 1.5° antenna elevation and store them: the wind turbine clutter flag (true or false), Clutter Ratio from the horizontal and vertical channel (CRH and CRV), Non Coherent Power from the horizontal and vertical channel (NCPH and NCPV), Clutter Correction Value from the horizontal and vertical channel (CCORH and CCORV), uncorrected Radar Reflectivity from the horizontal and vertical channel (TH and TV), uncorrected Correlation Coefficient (URHOHV) and the uncorrected Differential Ratio (UDR). Where “uncorrected” means that no clutter filtering was applied to the received signal. This information is also stored as an average from a 3-by-3 range bin area around each WT, but excluding the WT range bin. The clutter correction value for each polarisation channel CCORH, CCORH are standard output of the signal processor. They quantify the static clutter power from the Doppler power spectra. By definition, CCOR values are negative.

Figure 42-D frequency distribution of clutter power (CCORH, upper left panel), clutter ratio (CRH, upper right panel) and non-coherent power (NCPH, lower panel center) with respect to the rotation speed of the wind turbine (10 min average). Radar data are from a range bin that contains one of the WT with operation parameters available in near-realtime. The 40 dB threshold of CRH used to classify a WT is also shown.
We expect the detection of WTC by the detection algorithm if the wind turbine is in operation and the blades are rotating. A 2-D frequency distributions of the clutter power CCOR and the clutter ratio CR for the horizontal polarisation H is shown in Fig. 4 for the wind turbine TUR3. The clutter power is estimated by the Doppler spectrum clutter filter of the radar signal processor as the power at the 0 m s−1 spectral line. Large negative numbers define strong clutter power. A clutter power of -50 dB is considered to be large and is at the same time a good indicator for a very good coherency of the magnetron transmitter.
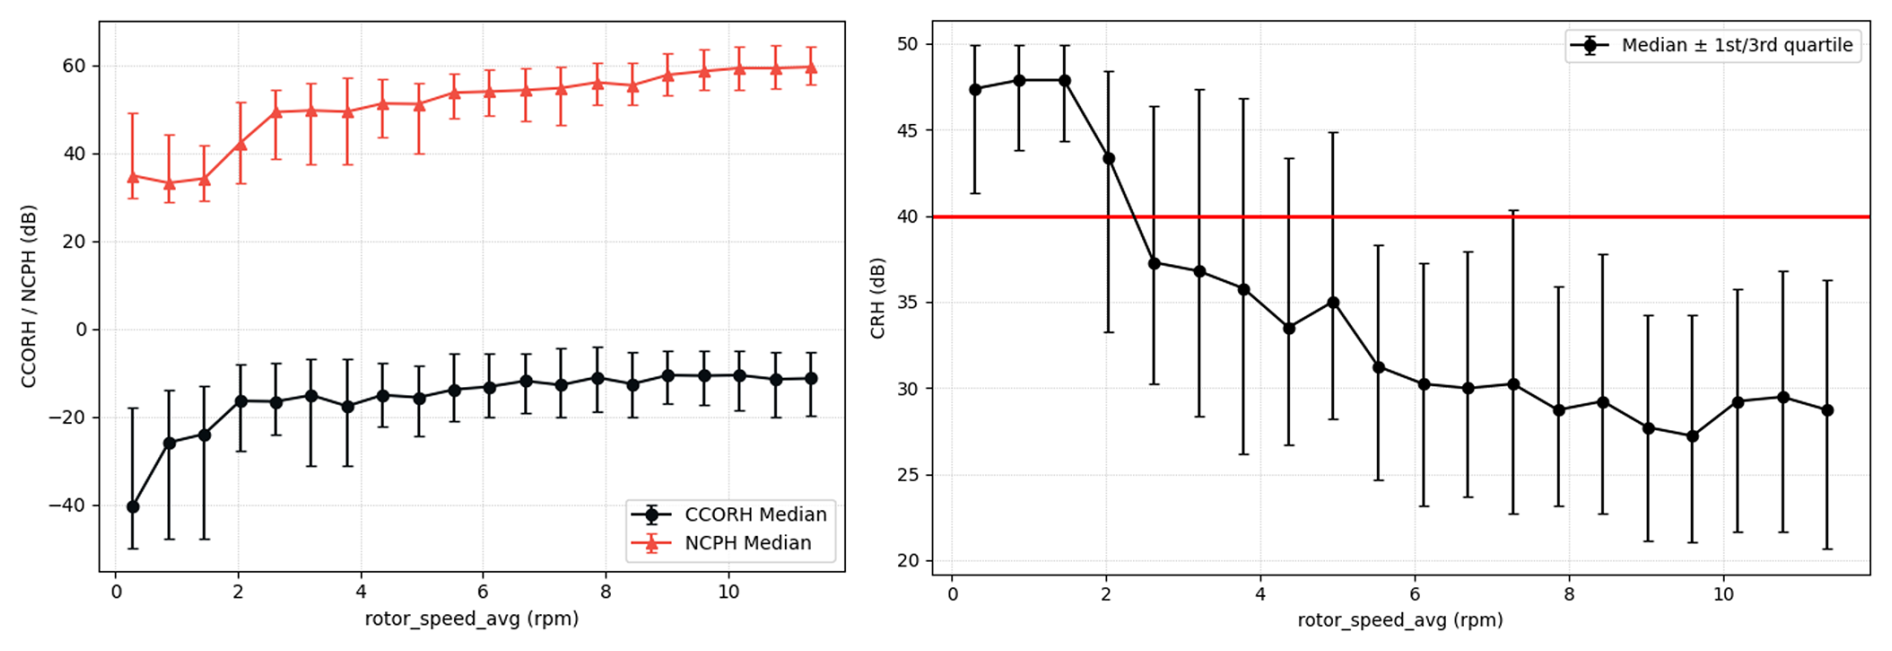
Figure 5Median, first and third quartile of CCORH, NCPH and CRH as a function of rotation speed based on the data shown in Fig. 4.
The 2-D distribution of CCORH shows a peak near −50 dB for a rotation speed smaller than 1 rpm. The WT more or less appears as a classic non-moving clutter target. Consistent with that are low values of non-coherent power (peak around 30 dB). Starting at about 5 rpm, the coherent clutter power is predominantly between −25 and 0 dB. This is associated with the increase of non-coherent power. The median CCORH is around −15 dB, increasing up to −10 dB (Fig. 5). NCPH increases up to 60 dB for a rotation speed larger 10 rpm. The final decision whether a range bin is classified as wind turbine clutter is based upon the CRH. The median CRH is below 40 dB with a rotation speed of 2 rpm. But the spread is large indicating the wind turbine clutter signal most likely co-exists with a strong static clutter signal from the WT tower, which is weakly decreasing with increasing rotation speed between 2 to about 6 rpm and then remains at a fairly constant level (Fig. 6). For the data set we have analysed so far, 10 % to 40 % of range bins are not classified as a wind turbine clutter target depending on the rotor speed. If the rotor speed is above 6 rpm, the WT detection probability is near 90 % (Fig. 7). Figure 6 shows CCOR and NCPH as a function of rotor speed if there is no WTC detected by the algorithm. It corroborates the conclusion, that the static clutter level is too large so that a clear separation from WTC with this algorithm is not possible even though the non-coherent power NCPH is large. The median clutter power is near −30 dB for a rotor speed > 1 rpm. This is a strong clutter signal. The clutter threshold to separate clutter from a meteorological echo is −15 dB, so that a range bin containing WTC and a strong static clutter signal will be detected most of the time.
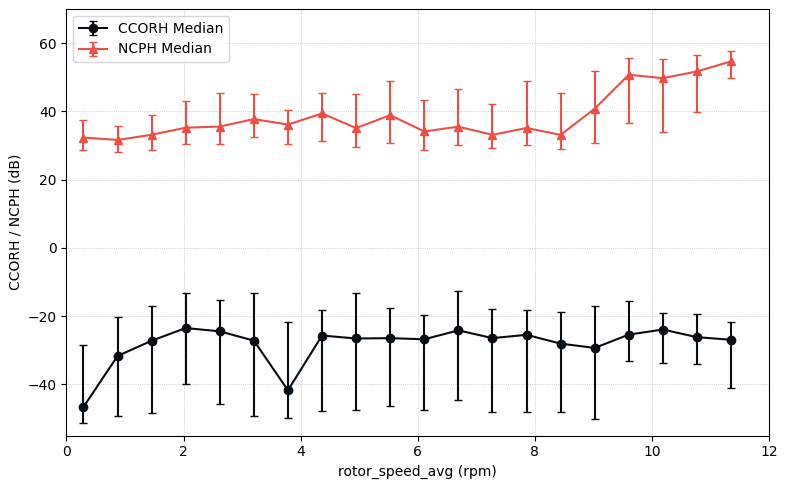
Figure 6Median, first and third quartile of CCORH and NCPH for the cases where the WTC flag is zero (no wind turbine clutter detected) as a function of rotation speed for the data shown in Fig. 4.
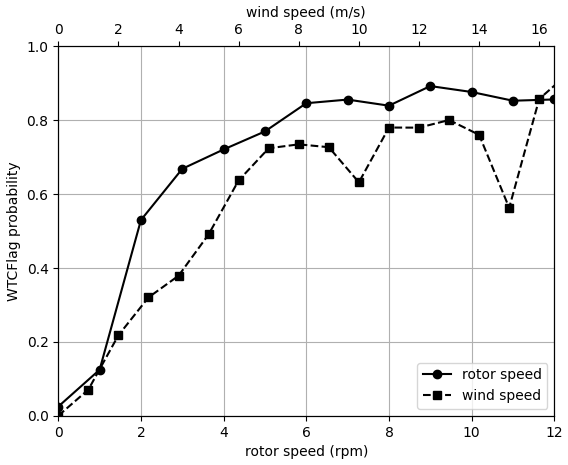
Figure 7WTC detection probability as a function of rotor speed and wind speed measured at the nacelle level.
We also show the WTC detection probability as a function of the wind speed measured at the nacelle level in Fig. 7. The WTC detection probability is always lower if the wind speed is taken as a reference. Wind speed is a great proxy for the rotor speed of a wind turbine, if we can assure that the wind turbine is in operation. However, even in good wind conditions, turbines might be shut down due to maintenance, feed-in restrictions or site-specific risks to safety and wildlife. Hence, it is expected that the detection probability is lower when analysed according to wind speed than rotor speed, since it also includes the downtime of the wind turbine. This clearly highlights the benefit of wind turbine operator data for a better identification of WTC and the verification of the algorithm. The good performance of the existing WTC detection algorithm can also be deduced from Fig. 3. There we show the persistent WTC detections compared to the WT locations. Most of the WT in line of sight of the radar produce a persistent WTC signal. There are no WTC detections in areas without WTs (the WTC at range 12 km and azimuth 60° relates to WT which are not listed in the official site data base). A satellite based product (see Fig. 8) shows the presence of WT. Overall, the WTC detection algorithm obviously is not sensitive to static clutter signals.

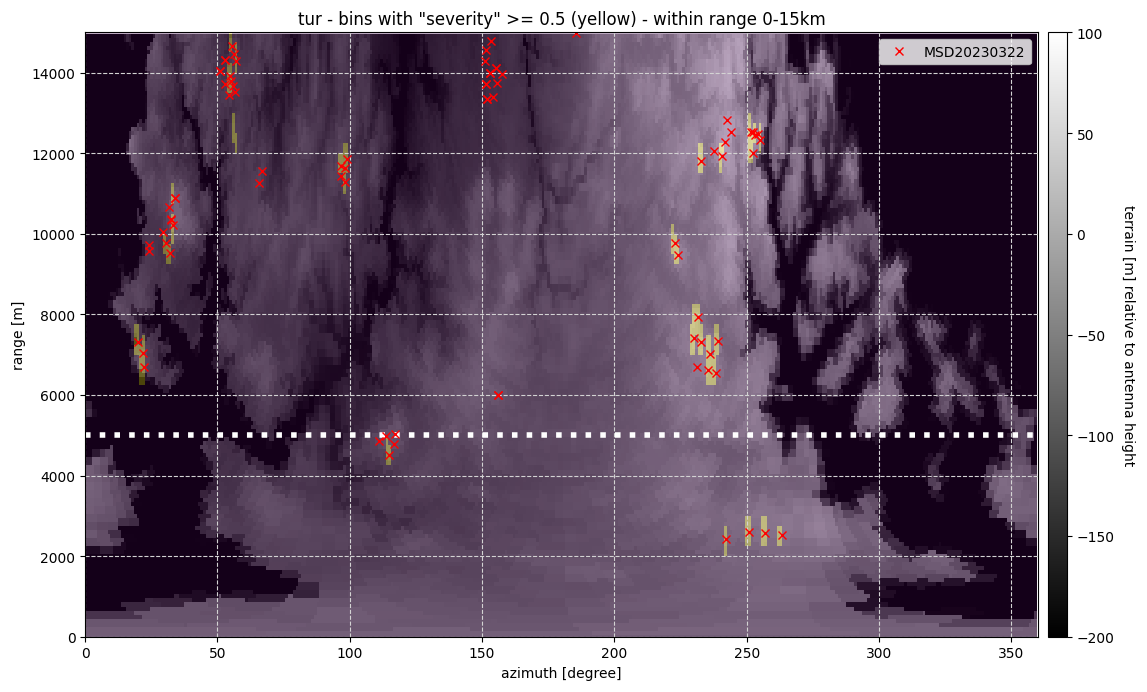
Figure 8B-plot representation of WTC severity based on WTC detections between 1 and 20 January 2025 observed at an 0.5° antenna elevation. Shown are results up to range of 15 km. Red crosses denote the location of wind turbines (229 in total) from a database of the federal state. The black circles are WT location (225 in total) based on a satellite product (Wehner et al., 2025). Only radar range bins with WTC detected in more than 50 % of time are shown in light yellow (WTC severity large, > 0.5). The relative height of the respective locations of WT with respect to the radar antenna height is shown as background for reference using a digital elevation model (BKG, 2025).
2.3 Monitoring
The wind turbine clutter detection is running in the signal processor at every DWD radar site since 2021. As soon as a sweep is acquired at the radar site, it is sent to the DWD headquarters in Offenbach and processed there. This is done for all 17 operational radar sites. First, all sweep data are quality controlled (Werner and Steinert, 2012b). Non-meteorological echoes are removed and Zh and ZDR are corrected for attenuation before radar products are computed. During quality control all detected WTC range bins along with a selection of radar moments (see Sect. 2.2) are stored in an InfluxDB database. This is done for sweeps of the volume scan at an antenna elevation of 0.5, 1.5, 2.5., 3.5, 4.5. 5.5° and the terrain following precipitation scan. Extracting and storing the WTC detections allows us to monitor and quantify trends of WTC in radar data primarily in a range of 15 km around a radar site.
Ultimately, this approach may provide DWD with objective arguments that clearly demonstrate the necessity to mitigate negative effects on radar data and products. It has to be shown whether compensating measurements or a regulation of WT development in the vicinity of weather radars are the right way for such mitigation efforts.
There are about 225 WT in up to range of 15 km of the radar Ummendorf. We therefore use this site to quantify the effect of WT on radar data using our WTC detection algorithm. We define WTC severity the following way: a “WTC severity” of 1 means that WTC is detected 100 % of the time in the range bin within the predefined time interval. We consider a WTC severity of > 0.5 as a persistent WTC signal. It is expected that WTC severity for a given time interval will always be < 1 due to the wind turbine operation mode and the wind conditions.
A rigorous validation of the WTC detection algorithm like in the previous section is not possible since we do not have information about the operational state of the wind turbines when the radar scans in the direction of a wind park. In order to demonstrate the capability of the WTC detection algorithm in absence of wind turbine operational data we compare the detection counts with WT positions that are publicly available and which are provided by the federal states in Germany and a satellite data derived WT data set (Fig. 8). In particular the two wind parks around the 5 km range (100 and 200° azimuth) are responsible for persistent WTC. The agreement between the satellite product and the persistent WTC signal is better than the WT location provided by the federal state (e.g. the circles matching the WTC pixels at 200° azimuth, at a range of about 3.5 km). Apparently, the database of the federal state is not up-to-date for this example. There is a wind park at about 280° azimuth and in a range between 12 and 14 km, for which we do not observe a persistent WTC signal. The reason for this is that those WTs are not in line-of-sight of the radar as indicated by the orography in Fig. 8.
The area occupied by WTC in the radar data within the 5 km range is about 4.5 km2 or about 5 % of the area. In the 5–15 km range, the total area with WTC is 18 km2 (3 % of the area).
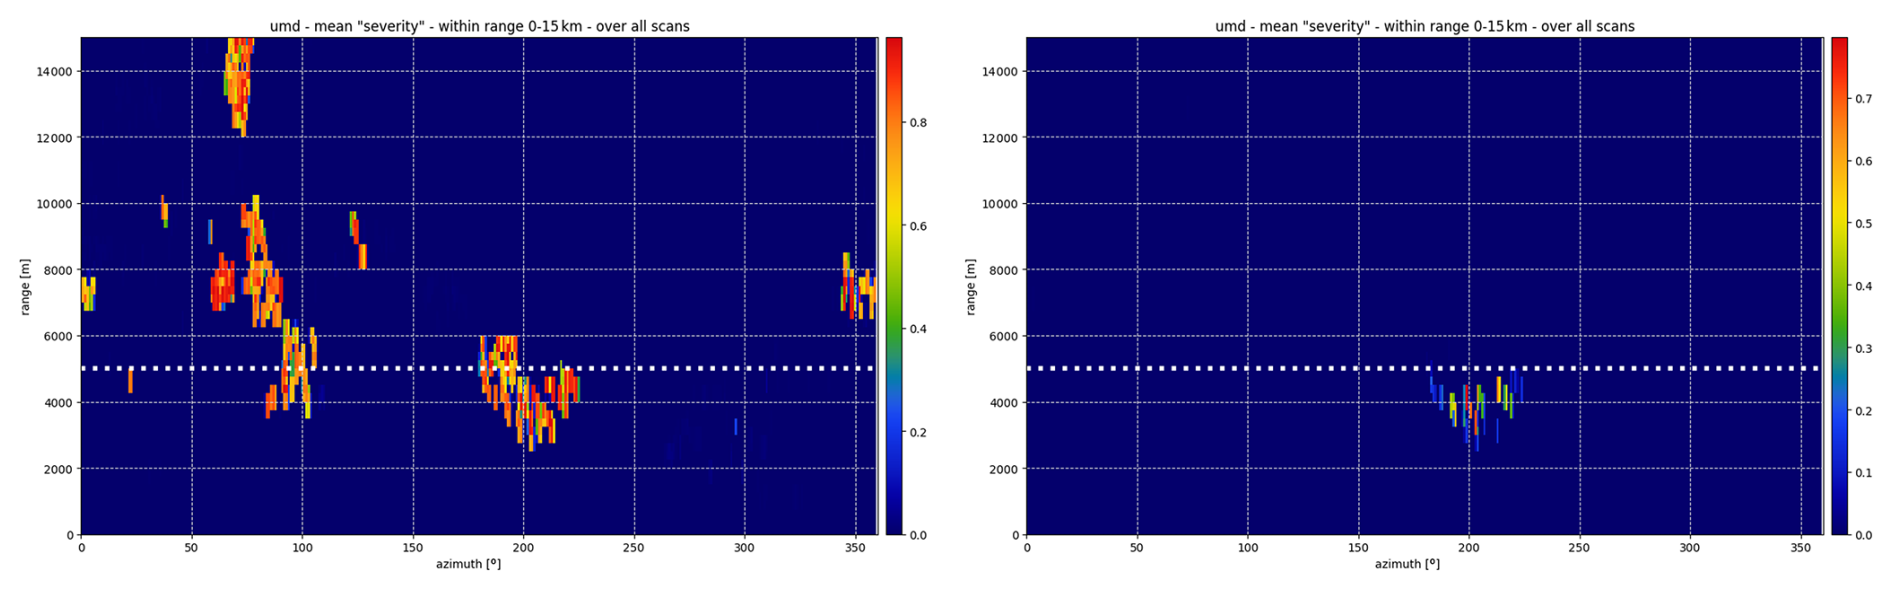
Figure 9A comparison of the WTC severity for the lowest antenna elevation (left panel) and the 2.5° antenna elevation (right panel). Please note the different color legends for the WTC severity.
Those results refer to sweeps at 0.5° antenna elevation. The WTC signal is decreasing with higher antenna elevation. Within the 5 km range, WTC is seen up to an antenna elevation of 3.5° (see Fig. 9), and between 5–15 km up to an antenna elevation of 1.5°.
3.1 Impacts at and around the WT locations
It is known, that the negative impacts on the radar measurements caused by wind turbines is not only confined to the immediate location of the WT itself. The effective volume disturbed by the WT is determined by backscatter contributions from side lobes and multi-path effects. In Figs. 10 and 13, an example of a stratiform precipitation event on 30 May 2024 is shown for the radar Ummendorf. The radar sector is chosen such that it includes a wind park and an undisturbed area within the stratiform rain event. Furthermore, we have chosen an antenna elevation of 1.5 and 3.5°. We show the uncorrected radar reflectivity (TH, dBZ), the uncorrected depolarisation ratio (UDR, dB) and the radar reflectivity (Zh) after quality control. Here again, “uncorrected” means no clutter filter is applied. We chose an antenna elevation of 3.5° because no persistent WTC signal could be found in TH for this wind park. The depolarisation ratio (DR, dB) (Ryzhkov et al., 2017) is a standard output from DWD's radar signal processor since 2022. The depolarisation ratio is not directly measured, since we operate our radars in STAR mode, but is deduced from STAR linear polarisation measurements (Melnikov and Matrosov, 2013). In applications DR serves as a good discriminator between clutter and meteorological echoes (Kilambi et al., 2018; Michelson et al., 2020). Small (large negative DR) values are expected in stratiform rain with small spherical rain drops (−20 dB or smaller). A threshold of UDR = −12 dB may be used to separate a non-meteorological echo from a meteorological echo (Kilambi et al., 2018; Michelson et al., 2020). In addition, we also show the corresponding differential reflectivity UZDR and the cross correlation coefficient URHOHV (Fig. 11).
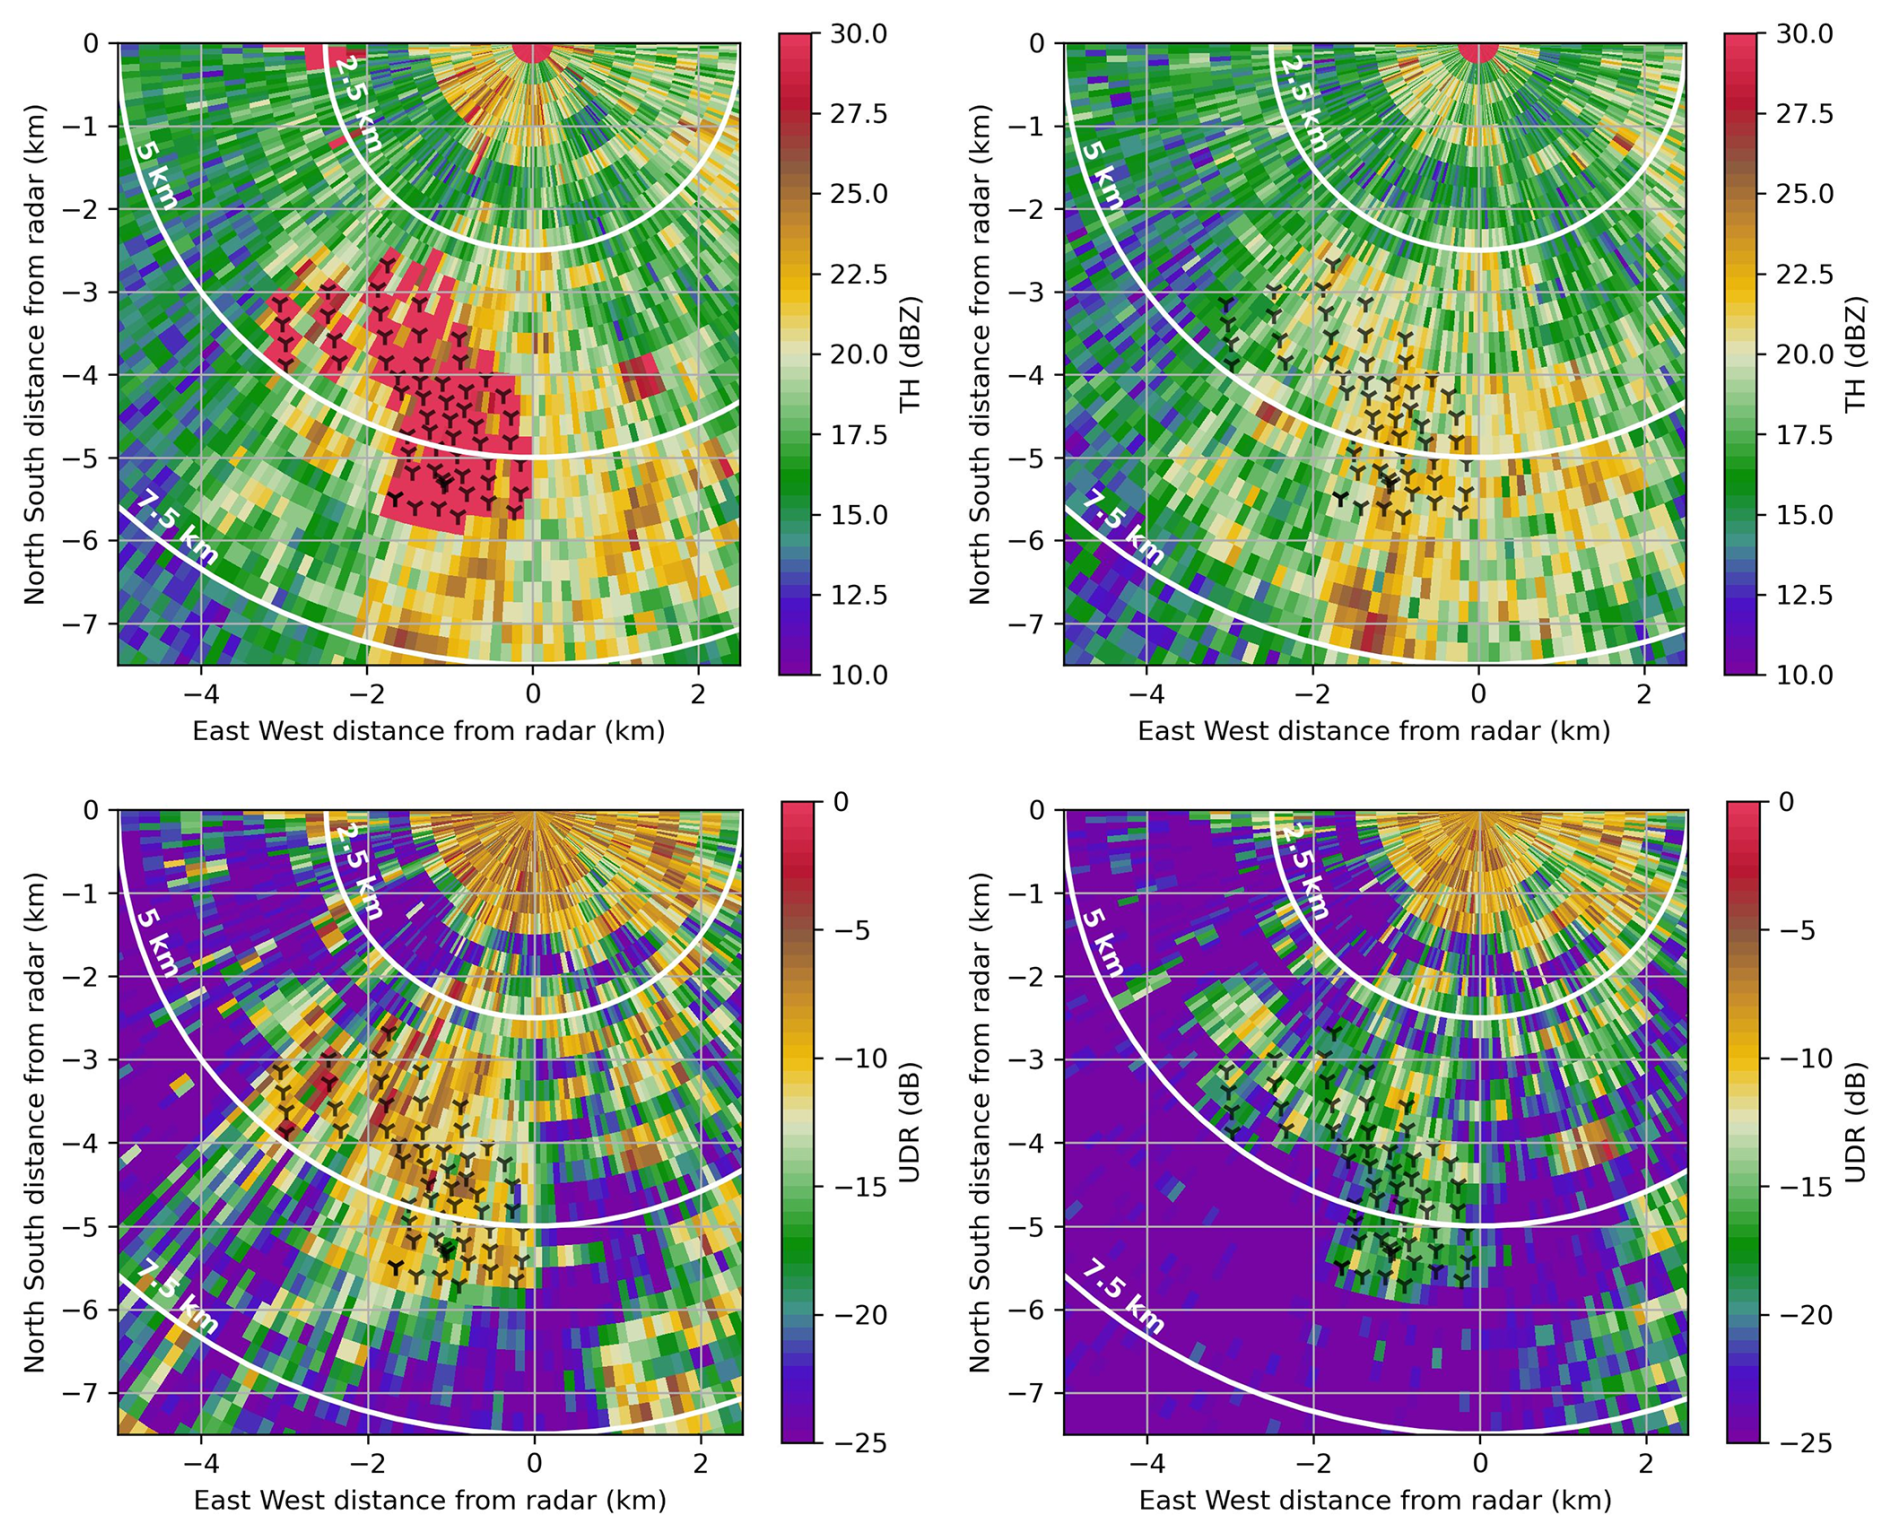
Figure 10Uncorrected radar reflectivity (TH) in the area of a wind farm. Left panel shows data from 1.5° antenna elevation, and the right panel data from 3.5° antenna elevation (top row). The uncorrected depolarisation ratio (UDR) is shown in the bottom row. Data are taken from a stratiform rain event 30 May 2024. WT locations are denoted by crosses. All uncorrected reflectivity values larger 30 dBZ are colour coded in red.
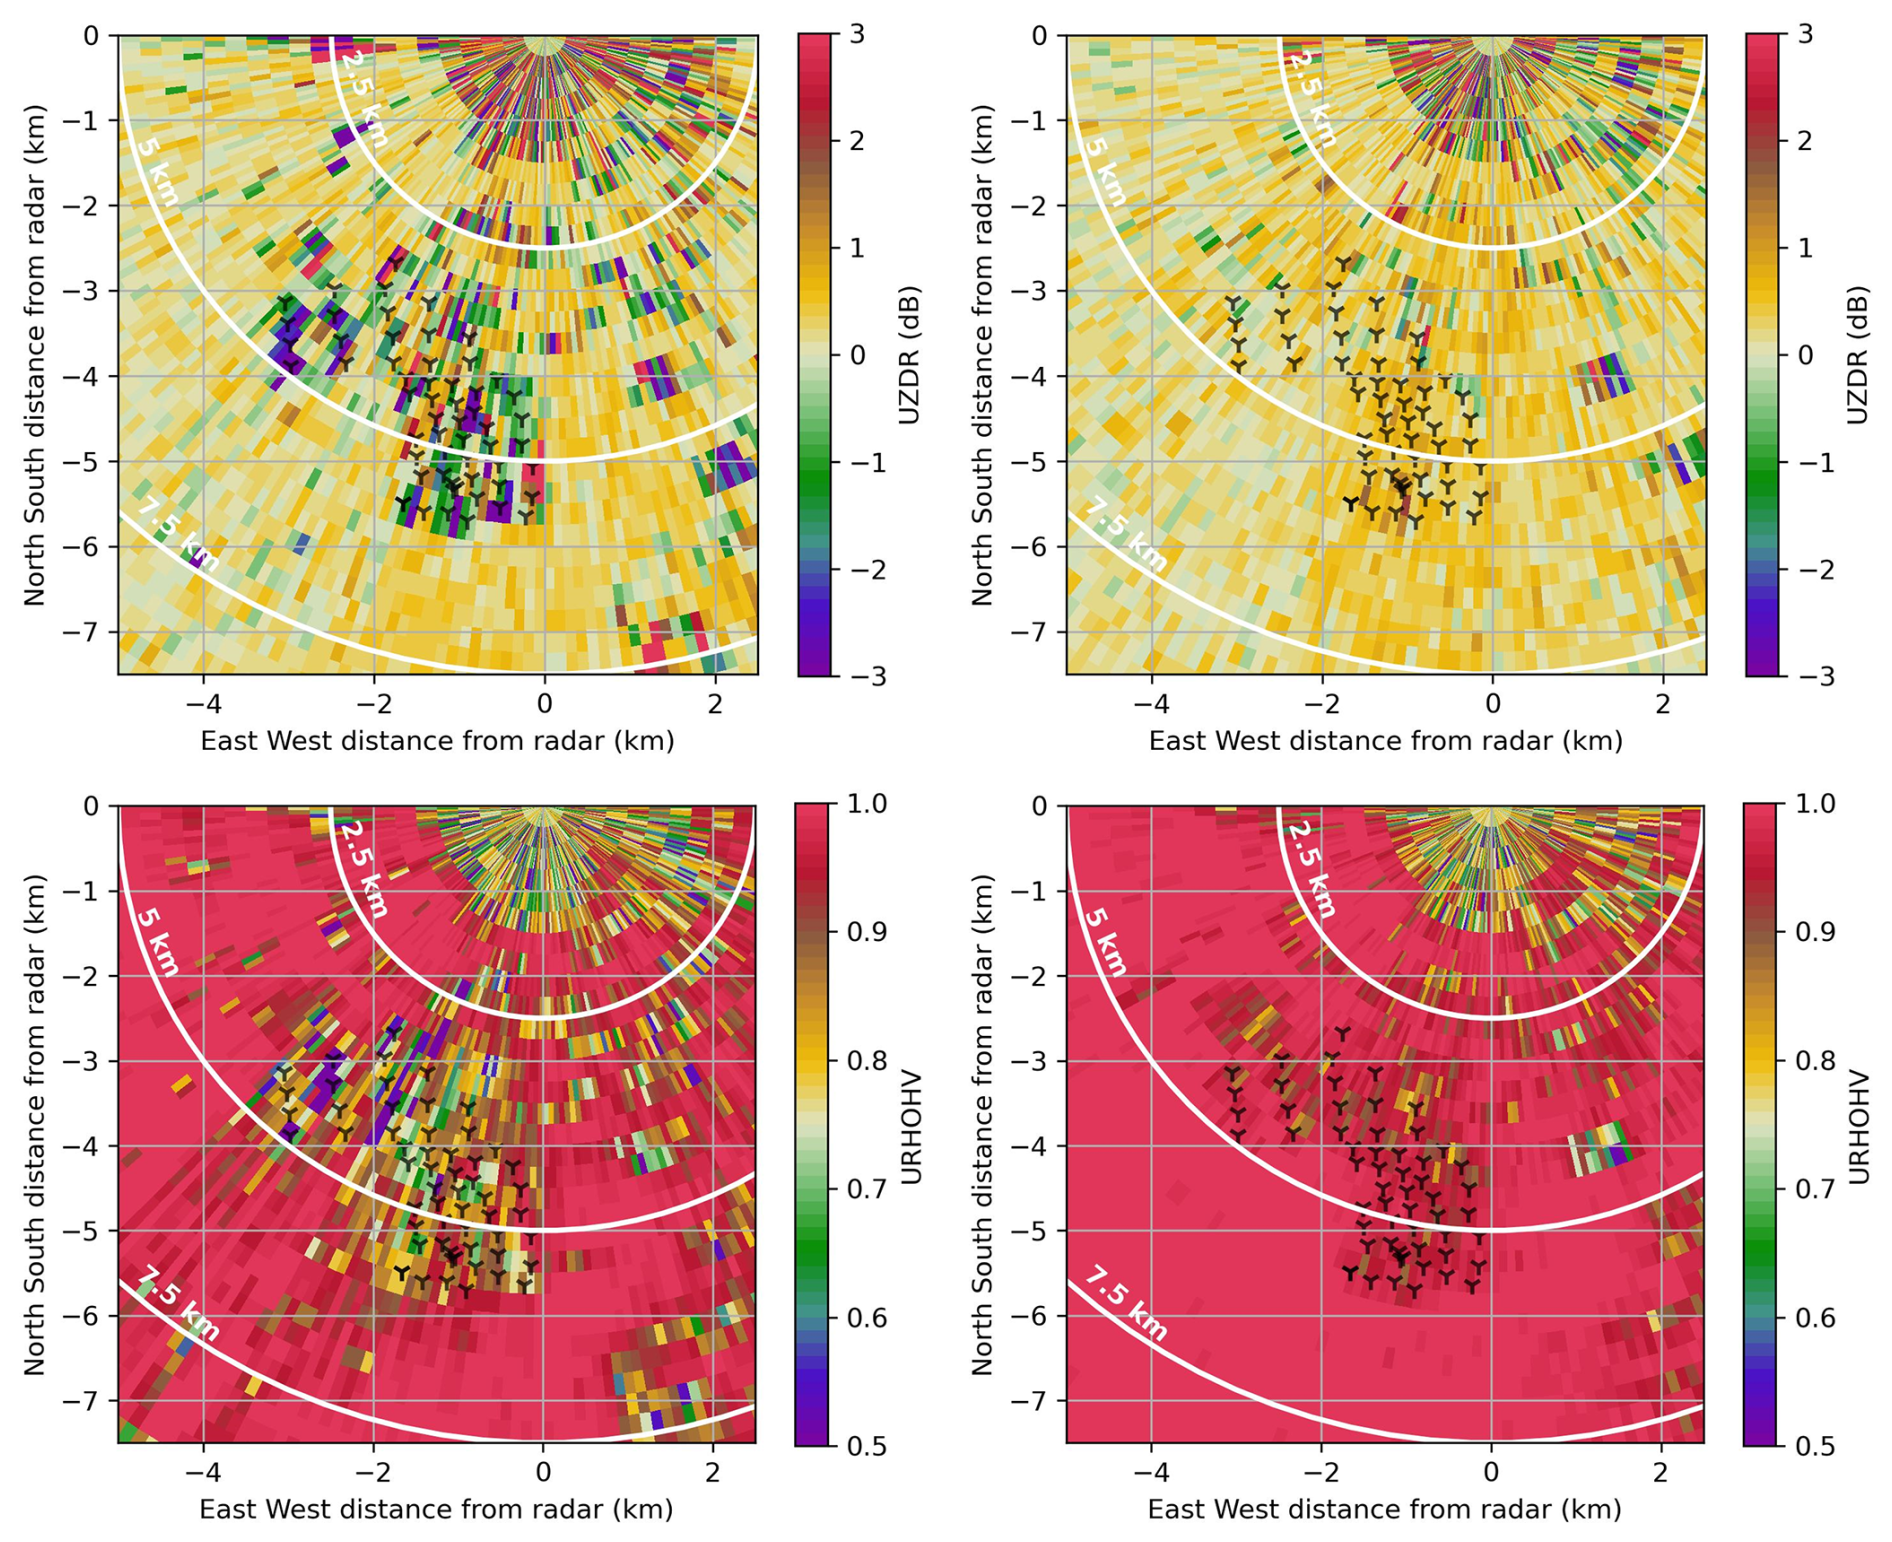
Figure 11Uncorrected differential reflectivity (UZDR) in the area of a wind farm. Left panel shows data from 1.5° antenna elevation, and the right panel data from 3.5° antenna elevation (top row). The cross correlation coefficient URHOHV (uncorrected, no clutter filter applied) is shown in the bottom row. See also Fig. 10.
At 1.5° antenna elevation, large TH values (TH > 30 dBZ) are found mainly in range bins with wind turbines. At 3.5° antenna elevation, the signal power and the variability over the wind turbine area is comparable to the surrounding precipitation field. For UDR, high values > −12 dB are found near wind turbines, but also in other regions. Clearly, at 1.5° antenna elevation clutter contributions outside the wind park are present in the data. In radial direction, there is a spread of wind turbine clutter. This appears due to multi-path scattering within the wind park. Clutter-free stratiform precipitation areas (UDR values as low as −25 dB) cover a small area. At 3.5° antenna elevation, there is no apparent influence in TH from the wind park. A clear signal is found however in UDR (between −10 and −15 dB). Same is true for UZDR and URHOHV (Fig. 11). This shows, that polarimetric data are more affected by WTC than just the power based moments. More importantly, the resulting volume where dualpol data are affected is substantially larger. This is in line with the study of Friedrich et al. (2009). They show for different clutter types that polarimetric moments are much more sensitive to clutter. The backscatter contribution on phase and power from the side lobes is responsible for this.

Figure 12Unfolded radial Doppler velocity VRADH (m s−1) wind farm. Left panel shows data from 1.5° antenna elevation, and the right panel data from 3.5° antenna elevation (top row). The spectral width (m s−1) is shown in the bottom row. See also Fig. 10. White rangebins are thresholded if the signal quality index (SQI) is lower than 0.25.
The radial Doppler velocity VRADH and the spectral width are shown in Fig. 12. Multipath effects are visible in the Doppler velocity at 1.5° antenna elevation, but the affected areas appear comparable to that of TH (Fig. 10). At 3.5° antenna elevation the impact of the wind farm is significantly less visible such that only a few range bins show erroneous Doppler velocities. For the spectral width (Fig. 12, lower panel) the area affected by the wind farm at 1.5° antenna elevation is larger than that of the Doppler velocity. The area affected is comparable to that of UDR. At 3.5° antenna elevation, the wind farm is clearly seen in spectral width. The surrounding range bins have values on the order of 1 m s−1, whereas in the presence of WTs values of 2 m s−1 or larger are present.
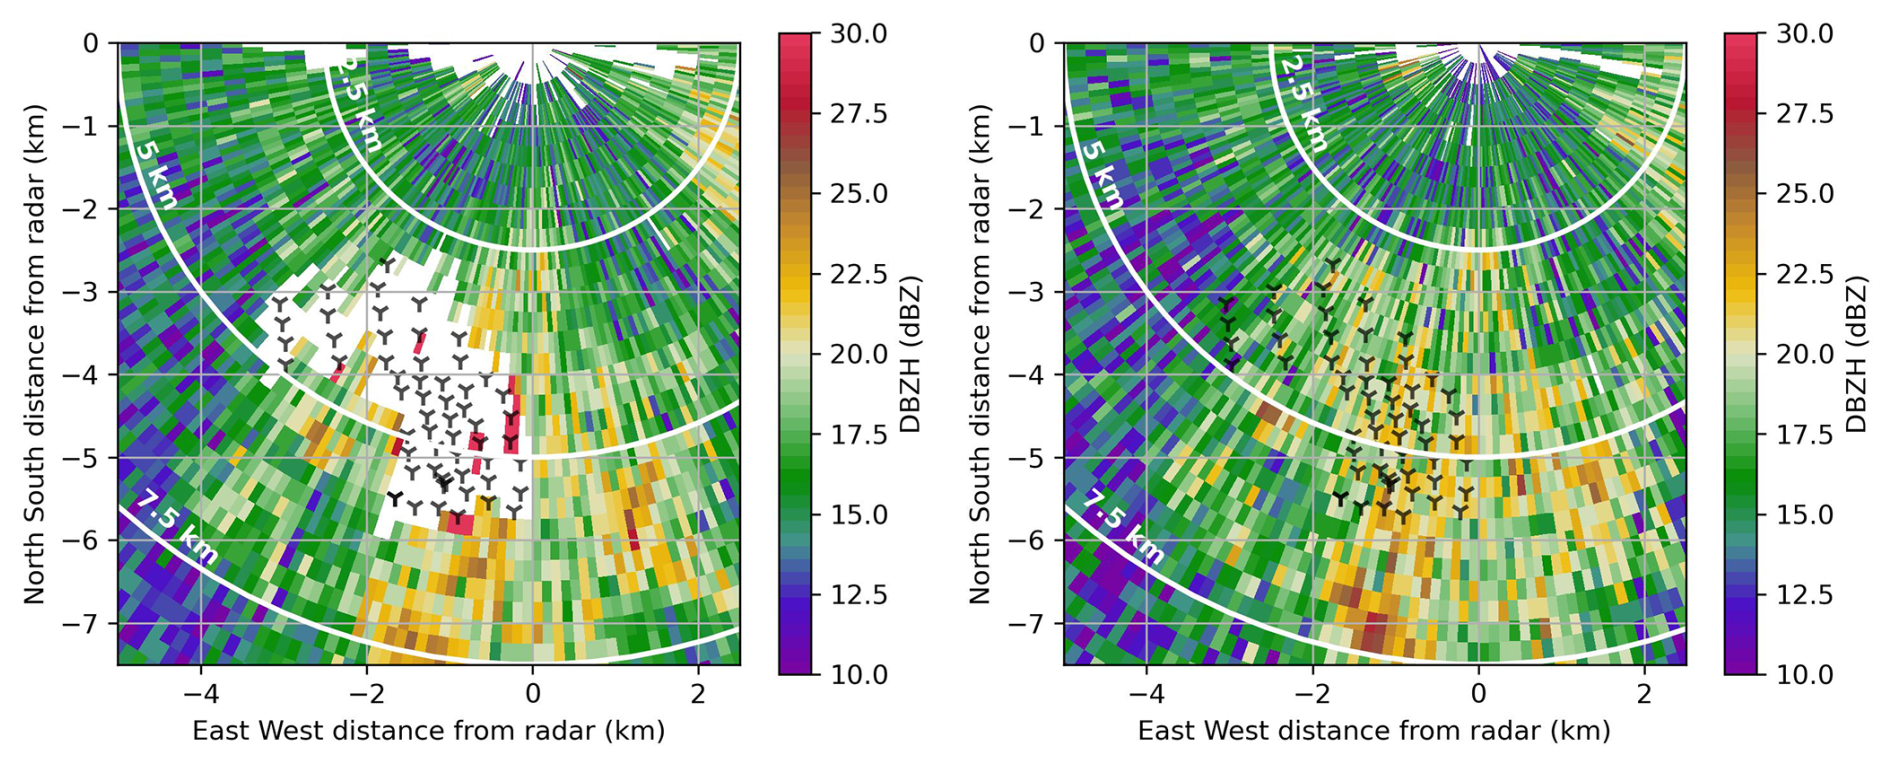
Figure 13The radar reflectivity after quality control (Zh) in the area of a wind farm. Left panel shows data from 1.5° antenna elevation, and the right panel data from 3.5° antenna elevation (top row). See also Fig. 10. White rangebins are thresholded if the signal quality index (SQI) is lower than 0.25.
Figure 13 shows how the operational DWD radar data quality control deals with the wind park at 1.5 and 3.5° antenna elevation. The current quality control (Werner and Steinert, 2012a), which does not make use of the WTC flag, nicely identifies WTC and thresholds the wind park area. Clutter power and the texture of differential phase already provide a clear enough signal to identify WTC. At 3.5° antenna elevation, the operational quality control does not lead to thresholded radar range bins. Since dualpol moments are affected at 3.5°, an impact on products based on dualpol data has to be expected.
The WT impact on radar moments at around the 5 km range from a weather radar has been shown in the previous section. An important result is that the dualpol data are more sensitive to the presence of WT than the radar reflectivity. In particular the vertical extent in which dualpol data are affected is significantly larger.
In 2010, the World Meteorological Organisation issued a recommendation for the protection of weather radar measurements from the influence of wind turbines (WMO, 2010) (Annex VI, p. 59). No wind turbine shall be installed within a 5 km radius. In the 5–20 km range, which is referred to as the “moderate impact zone”, a detailed examination is recommended in order to avoid or minimise the negative effect on the radar data. At the 5 km range, beam blockage will become significant. Assuming a standard WT turbine geometry, the WT scattering crossection to the main beam of a radar can cause a beam blockage of 1 dB (see e.g. Argemí et al., 2012).
Beam blockage corrections can be applied for stationary clutter targets to some extent, but provide only a constant offset correction which accounts for the loss due to beam blockage. However, any beam blockage will lead to a loss of sensitivity. This can affect the detection of (weak) precipitation at ranges further away from the radar. There are meteorological situations (e.g. freezing rain associated with small reflectivity values) where this loss of information can affect the warning process.
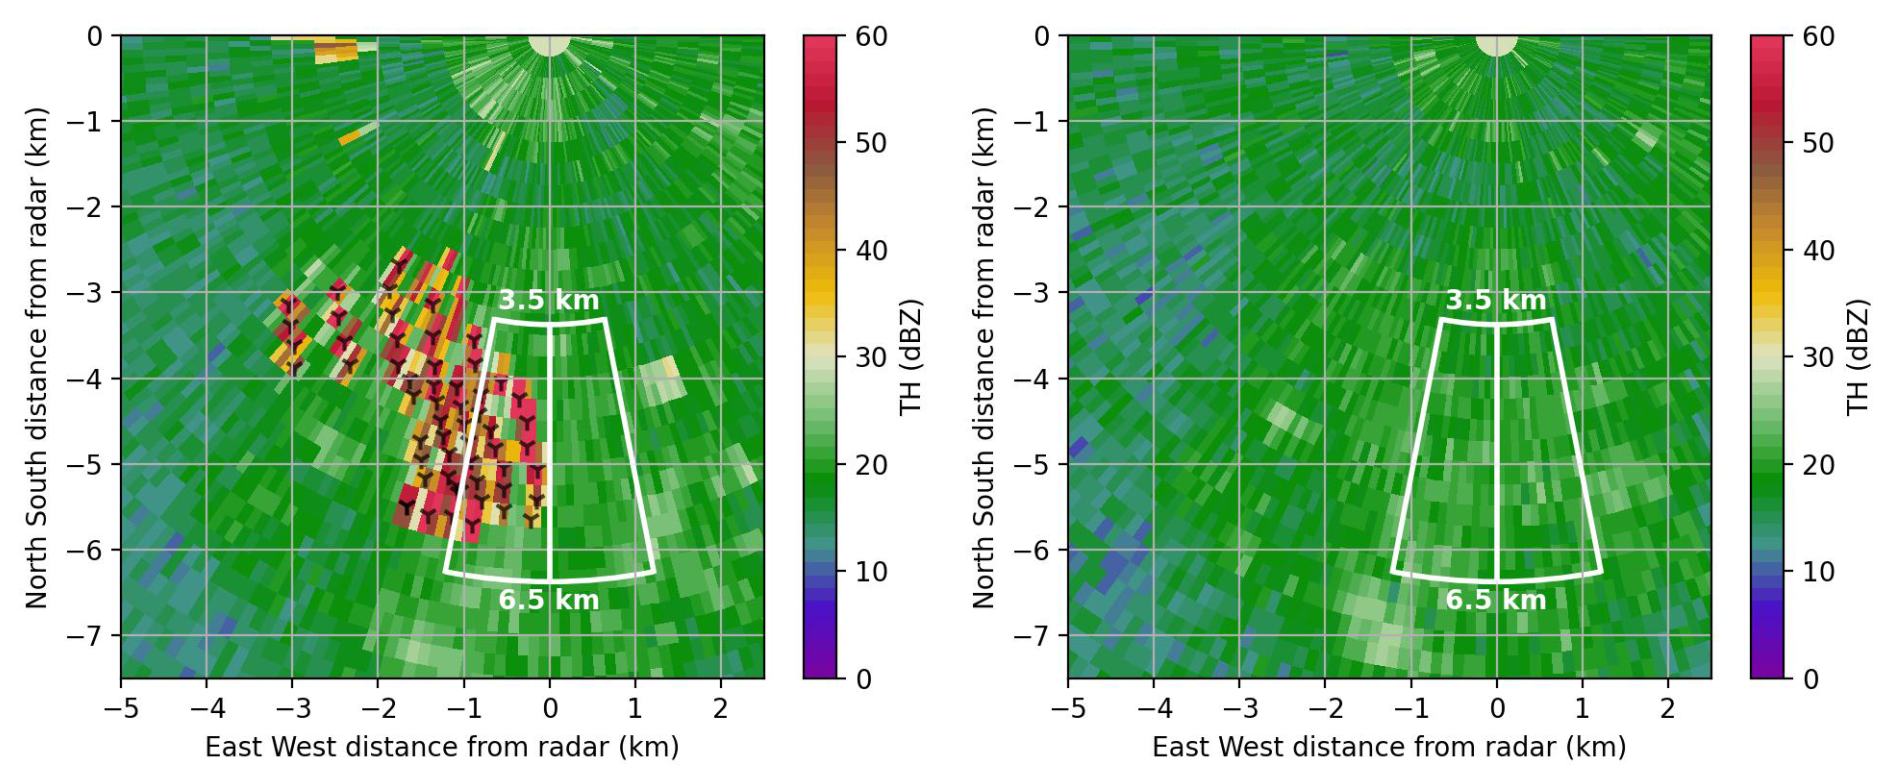
Figure 14Illustrating graph showing the chosen sectors to quantify beam blockage: a sector with wind turbines and an adjacent wind-turbine free sector. Left panel shows data from 1.5° antenna elevation, and the right panel data from 3.5° antenna elevation.
To quantify beam blockage from a single case study is difficult as the natural variability in the precipitation field adds too much noise to any blockage effect. Hence, we apply a statistical approach to the data of two warm seasons, analysing the reflectivity field around the wind park located south-west of the Ummendorf radar at a range of about 5 km. The wind park consists of 57 wind turbines, with rather small turbines. The median nacelle height of these turbines is 70 m, the median rotor diameter is 60 m. We expect a beam blockage effect at lower antenna elevation for azimuths with wind turbines close to the radar, but no beam blockage effect at higher antenna elevation and at WT-free azimuths. To test this hypothesis, we analyse two sectors, one containing WTs (180–190°), and an adjacent sector without WTs (170–180°), and two different antenna elevation angles (1.5 and 3.5°) (Fig. 14). The wind park sector contains 15 wind turbines. At 1.5° antenna elevation, the main beam covers the entire turbine blade area for 6 of those 15 turbines, and only the upper part of the blade area without the nacelle for the remaining 9 turbines. At 3.5° antenna elevation, the main beam is well above the blade area of all turbines.
We identified precipitation cases where the following conditions were met: (1) Both sectors must be fully covered with precipitation. (2) Only precipitation with mean uncorrected reflectivity values between 15 dBZ < TH < 40 dBZ in the WT-free sector are considered; in doing so, drizzle and convective precipitation are excluded. No attenuation correction is applied (since we exclude convection). (3) ρhv>0.95 in the WT-free sector. This eliminates possible clutter pixels.
For each sector and elevation angle, we compute a simple difference of the mean reflectivity values at the ranges of 6.5 and 3.5 km, i.e. behind and ahead of the radial location of the wind park. The analysis was carried out for the two warm seasons 2021 and 2022 (1 April to 30 September). In total 1923 sweeps met the aforementioned criteria. A histogram of the differences of the respective reflectivities (Fig. 15) shows, that although the spread is quite large, the distributions appears to be normal distributions and the corresponding median reflectivity differences corroborate our expectations. At 3.5° antenna elevation, the reflectivity difference is nearly identical (−0.32 dB). At 1.5° antenna elevation, the difference in the sector without wind turbines is −0.45 dB, similar to the difference we find at 3.5°. In the sector with wind turbines, the difference at 1.5° is −0.95 dB which is 0.5 dB larger than the difference in the sector without wind turbines, and 0.63 dB larger than at the antenna elevation of 3.5°. This difference is attributed to beam blockage. We tested the robustness of the results by computing the reflectivity differences for various subsets of the data, stratifying it for example by year or by radar reflectivity mean values. The absolute numbers of the results vary based on the selection of the data. However, in all cases, the reflectivity differences at 3.5° antenna elevation were very similar for both sectors, and there was always a clear difference of at least 0.3 dB between the two sectors at 1.5° antenna elevation.
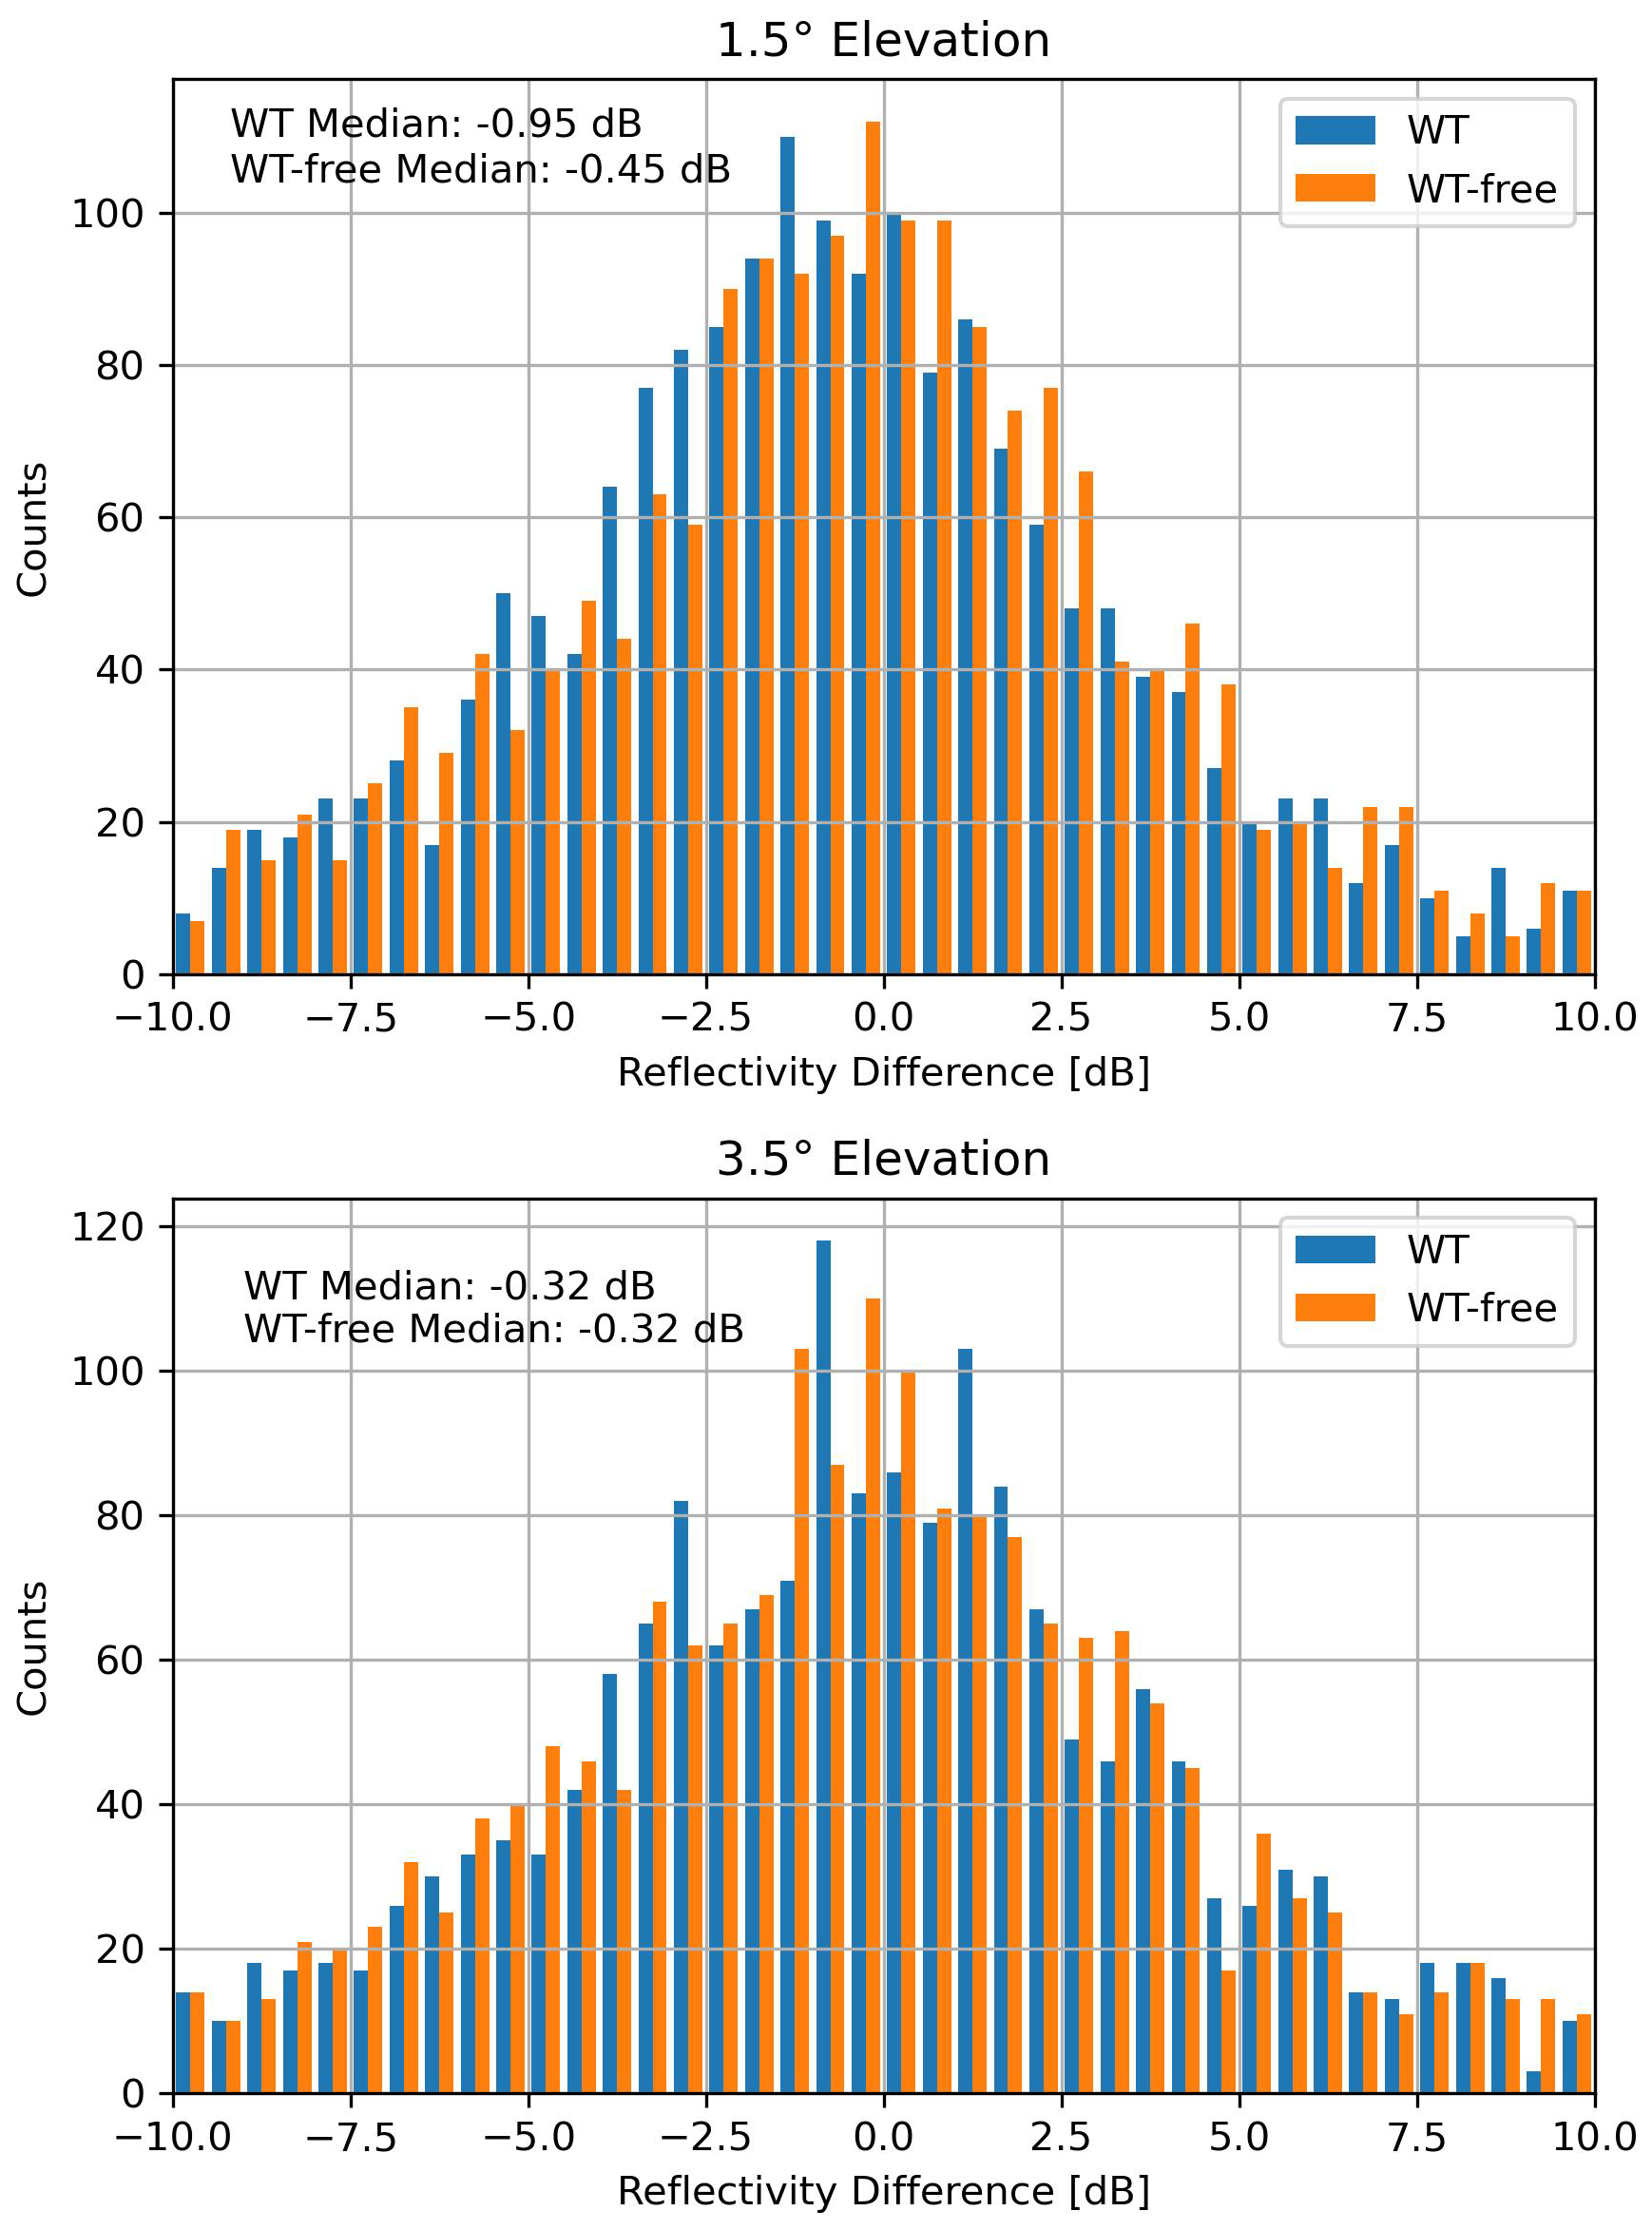
Figure 15Statistical evaluation of beam blockage for two warm seasons. Histograms of the differences of the reflectivities behind and ahead of the radial location of the wind park (6.5 and 3.5 km) for a sector with wind turbines (WT, blue) and a wind-turbine free sector (WT free, orange). Top panel shows data from 1.5° antenna elevation, and the bottom panel data from 3.5° antenna elevation.
Data from another wind park, with only one line of wind turbines support these findings from the wind park southwest of the Ummendorf radar. This second wind park consists of one line of four wind turbines, located approximately 2.5 km west of radar Türkheim (Fig. 1). The analysis was again carried out for the two warm seasons of 2021 and 2022, resulting in 1229 sweeps that met the selection criteria. Even though only one line of turbines blocks the radar beam, the beam blockage effect is evident in the reflectivity differences. At an antenna elevation angle of 3.5°, the sector with wind turbines and the adjacent sector without wind turbines show differences of −0.24 and −0.30 dB, respectively. Whereas the reflectivity difference at 1.5° antenna elevation in the sector with wind turbines is −0.55 dB, which is more than 0.25 dB higher than at 3.5° antenna elevation, and 0.16 dB higher than in the sector without wind turbines at 1.5°.
Weather radars are designed and operated to measure the radar reflectivity with an accuracy of 1 dB (Frech et al., 2017). It is already a challenge to achieve this on a radar system level. Additional errors due to beam blockage from WTs can lead to errors larger 1 dB which must be avoided. Increased errors will introduce additional bias to e.g. quantitative precipitation estimates. Based on the examples showed here, further installations of WT in the 5 km radius must be avoided.
With the effort to increase Germany's production of the renewable energy, more and more wind turbines will be built within the 5–15 km radius of all weather radar of the DWD weather radar network. Wind turbine clutter poses a serious threat to the radar data quality because Doppler clutter filters do not work. This is due to the backscatter signal from the moving rotor blades of wind turbines, which spreads power across the entire velocity spectrum. As a first step to identify wind turbine disturbances in radar data, DWD has implemented a dynamic wind turbine clutter detection algorithm in the radar signal processor. The algorithm runs operationally on every signal processor of the radar network. This detection algorithm is validated using wind turbine operator data of two wind turbines at a distance of about 10 km from the radar Türkheim. This constitutes the first operational wind turbine operator data provided to DWD. The data has been available since May 2025. A detection probability near 90 % is found for wind turbine clutter if the rotation speed of the rotor blades is larger than 5 rpm. If the algorithm fails to detect WTC even though the blades are rotating, it may be attributed to a strong static clutter signal from the wind turbine tower. The median clutter power is close to −30 dB, which is larger than the clutter threshold of −15 dB that is used to separate a weather echo from a non-meteorological echo. Since we just recently obtained the wind turbine operator data, this result will be verified in the future for a longer period of time.
We systematically monitor the wind turbine clutter situation for every radar. We showed results from radar Ummendorf where we have numerous wind parks in the 15 km range and wind turbines as close as 3 km to the radar. Those wind parks produce a persistent wind turbine clutter signal. For some wind turbines the clutter signal is present close to a 100 % of the time. For a wind park around the 5 km range, the clutter signal is present even at 2.5° antenna elevation.
We investigate the magnitude and area of the impact of WTC on radar reflectivity and the depolarisation ratio for a case study with stratiform precipitation for a specific wind park at the 5 km radius of radar Ummendorf. The WTC effect on radar reflectivity is mainly confined to the range bins containing the WTs. In contrast, the WT disturbance on DR covers a significantly larger area. This is shown in data taken at a 1.5° antenna elevation. Furthermore, we find a significant WT signal in DR at 3.5° antenna elevation. With a DR between −20 and −30 dB in the stratiform rain, an increase in DR to values between −20 and −10 dB is found. This effect is not visible in radar reflectivity. However, there might be an effect on the order of ±1 dB which cannot be separated from the meteorological signal, considering the overall variability of Z for this case. The results suggest, that the volume impacted by WTC for dualpol moments is significantly larger than that for radar reflectivity. The effect of the wind farm on Doppler velocity for this example is comparable to that of the radar reflectivity. Spectral width however appears much more sensitive to the presence of WT. The area of impact is comparable to that of DR.
To conclude, our current, dynamic WTC detection algorithm works well for radar reflectivity, but is missing the larger impact volume for dualpol and Doppler moments. This needs to be addressed in the further development of that algorithm.
A statistical analysis was carried out to quantify the beam blockage effect caused by a wind park by using data from close to 2000 sweeps with wide-spread precipitation, excluding convective situations. The beam blockage was quantified using a reference volume close to the wind park for the same precipitation events. By analysing this large data set, a clear beam blockage signal could be found even with the underlying natural spatial variability of precipitation. We found 0.5 dB beam blockage for this specific wind park of relatively small wind turbines, which is considered to be significant considering the overall requirement to measure radar reflectivity with an accuracy of ±1 dB. Because of the dynamic nature of WTC, static beam blockage corrections are not applicable. Beam blockage leads to reduced sensitivity of weather radars when it comes to measuring weak precipitation signals at far ranges (beyond 120 km). Beam blockage due to a wind park at a range of 5 km will increase with the expected repowering of WTs in the future (WT with tower heights of 300 m and “tower base diameters” of approx. 20 m are already being built).
The main conclusions and recommendations of this study are:
-
The WTC detection algorithm performs well given the variable clutter characteristics of a wind turbine
-
The WTC detection algorithm needs to be adapted for polarimetric moments, because those are much more sensitive to WTC, and, in particular, a much larger atmospheric volume is impacted by WTC.
-
The beam blockage results suggest, that wind turbine development in the 5 km radius must be avoided.
-
Wind turbine operator data are extremely helpful to improve and validate WTC detection algorithms and radar data quality control in the presence of wind turbines.
In this work we primarily focused on the detection of WTC. Correcting radar data using a filter on the IQ data level or by using compensating measurements to (partially) fill WTC contaminated radar range bins will be further investigated in the Wivaldi Wind Turbine Clutter Experiment and Analysis (WICLEAN) project, that started in 2025. There, dedicated measurements with a X-band radar using the two wind turbines in the Wivaldi research wind park (Wildmann et al., 2022) of the German Aerospace Center (DLR, Deutsches Zentrum für Luft- und Raumfahrt e.V.) will be used to further develop mitigation approaches for polarimetric weather radars. This includes an improved detection algorithm, a filter to separate the weather signal from the WT clutter signal, and to employ additional meteorological measurements (like, among others, rain gauge measurements and wind measurements) to add possible compensation in areas where the weather signal from radar measurements cannot be recovered.
Python code used for the analysis are available upon request. Parts of our analysis used the very useful Py-ART package (https://doi.org/10.6084/m9.figshare.2202553.v1, Helmus and Collis, 2016a, b).
Radar data used in this work, that is not available through http://opendata.dwd.de (last access: 23 February 2026) can be provided upon request.
MF wrote the body of the text and carried out the analysis to validate the WT detection algorithm using WT data. AB carried out the analysis on radar data quality and beam blockage and wrote the beam blockage section, and contributed to the text and prepared some of the figures. PT wrote the description of the WT detection algorithm and contributed to text and provided figures.
The contact author has declared that none of the authors has any competing interests.
Publisher's note: Copernicus Publications remains neutral with regard to jurisdictional claims made in the text, published maps, institutional affiliations, or any other geographical representation in this paper. The authors bear the ultimate responsibility for providing appropriate place names. Views expressed in the text are those of the authors and do not necessarily reflect the views of the publisher.
Special thanks go to the operator of the two wind turbines near the Ummendorf radar system for providing the wind turbine operator data.
This research has been supported by the Federal Ministry for Economic Affairs and Energy (BMWE) on the basis of a decision by the German Bundestag: project WICLEAN, Wivaldi Wind Turbine Clutter Experiment and Analysis (grant no. 03EE2074A, https://enargus.de/detail/?id=295872265, last access: 23 February 2026).
This paper was edited by Gianfranco Vulpiani and reviewed by Norman Donaldson and two anonymous referees.
Angulo, I., Grande, O., Jenn, D., Guerra, D., and de la Vega, D.: Estimating reflectivity values from wind turbines for analyzing the potential impact on weather radar services, Atmos. Meas. Tech., 8, 2183–2193, https://doi.org/10.5194/amt-8-2183-2015, 2015. a
Argemí, O., Pineda, N., Rigo, T., Bech, J., Fabregas, X., and Belmonte, A.: Wind turbine impact evolution and beam blockage analysis on the Weather Radar Network of the Meteorological Service of Catalonia, in: Proceedings of the 7th European Conference on Radar in Meteorology and Hydrology (ERAD 2012), Toulouse, France, 1–7, http://www.meteo.fr/cic/meetings/2012/ERAD/extended_abs/NET_013_ext_abs.pdf (last access: 23 February 2026), 2012. a
Bredemeyer, J., Schubert, K., Werner, J., Schrader, T., and Mihalachi, M.: Comparison of principles for measuring the reflectivity values from wind turbines, in: 2019 20th International Radar Symposium (IRS), Ulm, Germany, 1–10, https://doi.org/10.23919/IRS.2019.8768171, 2019. a
Bundesamt für Kartographie und Geodäsie (BKG): Digitale Geodaten TopPlusOpen, https://www.bkg.bund.de (last access: 23 February 2026), 2020. a
Bundesamt für Kartographie und Geodäsie (BKG): Digitale Geodaten, Digitales Geländemodell Gitterweite 200 m (DGM200), https://www.bkg.bund.de (last access: 23 February 2026), 2025. a, b
Fabry, F.: Radar Meteorology: Principles and Practice, Cambridge University Press, ISBN 9781108460392, https://doi.org/10.1017/CBO9781107707405, 2015. a
Frech, M., and Seltmann, J.: Assessment Wind Turbine Repowering on Radar Data Quality, 38th Conference on Radar Meteorology, AMS, https://ams.confex.com/ams/38RADAR/mediafile/Manuscript/Paper320487/ams_radar2017_frech_seltmann_WEA_4.pdf (last access: 23 February 2026), 2017. a
Frech, M., Hagen, M., and Mammen, T.: Monitoring the Absolute Calibration of a Polarimetric Weather Radar, J. Atmos. Ocean. Tech., 34, 599–615, https://doi.org/10.1175/JTECH-D-16-0076.1, 2017. a, b, c
Friedrich, K., Germann, U., and Tabary, P.: Influence of Ground Clutter Contamination on Polarimetric Radar Parameters, J. Atmos. Ocean. Tech., 26, 251–269, https://doi.org/10.1175/2008JTECHA1092.1, 2009. a
Gabella, M., Lainer, M., Wolfensberger, D., and Grazioli, J.: On the polarimetric backscatter by a still or quasi-still wind turbine, Atmos. Meas. Tech., 16, 4409–4422, https://doi.org/10.5194/amt-16-4409-2023, 2023. a
Gerhards, S. and Tracksdorf, P.: Wind Turbine Clutter detection in real-time Weather Radar Signals, developments for the DWD C-Band Weather Radar Network, in: 3rd Weather Radar Calibration and Monitoring Workshop, http://www.meteo.fr/cic/meetings/2021/wxrcalmon/ (last access: 23 February 2026), 2021. a, b
Helmus, J. and Collis, S.: pyart-1.6.0.zip, figshare [code], https://doi.org/10.6084/m9.figshare.2202553.v1, 2016a. a
Helmus, J. J. and Collis, S. M.: The Python ARM Radar Toolkit (Py-ART), a Library for Working with Weather Radar Data in the Python Programming Language, Journal of Open Research Software, 4, e25, https://doi.org/10.5334/jors.119, 2016b. a
Isom, B. M., Palmer, R. D., Secrest, G. S., Rhoton, R. D., Saxion, D., Allmon, T. L., Reed, J., Crum, T., and Vogt, R.: Detailed Observations of Wind Turbine Clutter with Scanning Weather Radars, J. Atmos. Ocean. Tech., 26, 894–910, https://doi.org/10.1175/2008JTECHA1136.1, 2009. a
Kilambi, A., Fabry, F., and Meunier, V.: A Simple and Effective Method for Separating Meteorological from Nonmeteorological Targets Using Dual-Polarization Data, J. Atmos. Ocean. Tech., 35, 1415–1424, https://doi.org/10.1175/JTECH-D-17-0175.1, 2018. a, b
Lainer, M., Figueras i Ventura, J., Schauwecker, Z., Gabella, M., F.-Bolaños, M., Pauli, R., and Grazioli, J.: Insights into wind turbine reflectivity and radar cross-section (RCS) and their variability using X-band weather radar observations, Atmos. Meas. Tech., 14, 3541–3560, https://doi.org/10.5194/amt-14-3541-2021, 2021. a
Melnikov, V. and Matrosov, S. Y.: Estimations of aspect ratios of ice cloud particles with the WSR-88D radar, in: 36rd AMS Conf. on Radar Meteorology, Breckenridge, CO, AMS, https://ams.confex.com/ams/36Radar/webprogram/Paper228291.html (last access: 23 February 2026), 2013. a
Michelson, D., Hansen, B., Jacques, D., Lemay, F., and Rodriguez, P.: Monitoring the impacts of weather radar data quality control for quantitative application at the continental scale, Meteorological Applications, 27, e1929, https://doi.org/10.1002/met.1929, 2020. a, b
Norin, L.: A quantitative analysis of the impact of wind turbines on operational Doppler weather radar data, Atmos. Meas. Tech., 8, 593–609, https://doi.org/10.5194/amt-8-593-2015, 2015. a
Norin, L.: Wind turbine impact on operational weather radar I/Q data: characterisation and filtering, Atmos. Meas. Tech., 10, 1739–1753, https://doi.org/10.5194/amt-10-1739-2017, 2017. a, b
Ośródka, K. and Szturc, J.: Improvement in algorithms for quality control of weather radar data (RADVOL-QC system), Atmos. Meas. Tech., 15, 261–277, https://doi.org/10.5194/amt-15-261-2022, 2022. a, b
Ryzhkov, A., Matrosov, S. Y., Melnikov, V., Zrnic, D., Zhang, P., Cao, Q., Knight, M., Simmer, C., and Troemel, S.: Estimation of Depolarization Ratio Using Weather Radars with Simultaneous Transmission/Reception, Journal of Applied Meteorology and Climatology, 56, 1797–1816, https://doi.org/10.1175/JAMC-D-16-0098.1, 2017. a
Seltmann, J. and Böhme, T.: Wind Turbine Issues in Germany, in: 38th Conference on Radar Meteorology, AMS, https://ams.confex.com/ams/38RADAR/mediafile/Manuscript/Paper320410/2017_AMS_38Radar_Chicago_Seltmann-Boehme.pdf (last access: 23 February 2026), 2017. a
Seltmann, J. E., Hohmann, T., Frech, M., and Tracksdorf, P.: DWD's new operational scan strategy, in: 36rd AMS Conf. on Radar Meteorology, Breckenridge, CO, https://ams.confex.com/ams/36Radar/webprogram/Paper229003.html (last access: 23 February 2026), 2013. a
Tang, L., Zhang, J., Simpson, M., Arthur, A., Grams, H., Wang, Y., and Langston, C.: Updates on the Radar Data Quality Control in the MRMS Quantitative Precipitation Estimation System, J. Atmos. Ocean. Tech., 37, 1521–1537, https://doi.org/10.1175/JTECH-D-19-0165.1, 2020. a, b
Wehner, C., Albert, J., Siegismund, J., Zschache, J., Röhl, S., and Gärtner, P.: Remote sensing derived onshore wind turbine locations for Germany, Zenodo [data set], https://doi.org/10.5281/zenodo.15835057, 2025. a
Werner, M. and Steinert, J.: New quality assurance algorithms for the DWD polarimetric C-band weather radar network, in: 7th Europ. Conf. On Radar in Meteor. and Hydrol., NET403, http://www.meteo.fr/cic/meetings/2012/ERAD/extended_abs/NET_403_ext_abs.pdf (last access: 23 February 2026), 2012a. a
Werner, M. and Steinert, J.: New quality assurance algorithms for the DWD polarimetric C-band weather radar network, in: 7th Europ. Conf. On Radar in Meteor. and Hydrol., NET403, http://www.meteo.fr/cic/meetings/2012/ERAD/extended_abs/NET_403_ext_abs.pdf (last access: 23 February 2026), 2012b. a
Wildmann, N., Hagen, M., and Gerz, T.: Enhanced resource assessment and atmospheric monitoring of the research wind farm WiValdi, Journal of Physics: Conference Series, 2265, 022029, https://doi.org/10.1088/1742-6596/2265/2/022029, 2022. a
Wilfong, T. L., Lau, E. M., Weber, B. L., Merritt, D. A., and McLaughlin, S. A.: Median filter effects on radar wind profiler spectral noise statistics, J. Atmos. Ocean. Tech., 31, 2088–2093, 2014. a
WMO: Commission for Instruments and Methods of Observation – Fifteenth session, Tech. Rep. WMO-No. 1064, World Meteorological Organization (WMO), https://library.wmo.int/idurl/4/32298 (last access: 23 February 2026), 2010. a, b, c