the Creative Commons Attribution 4.0 License.
the Creative Commons Attribution 4.0 License.
 | 18 Mar 2026
Open Path Incoherent Broadband Cavity Enhanced Absorption Spectrometer for in situ measurement of nitrogen oxides, iodine oxide, and glyoxal in the atmosphere
Filip Pastierovič
Nicolas Caillon
Joel Savarino
In this work we report a compact, low-cost instrument based on Open Path – Incoherent BroadBand Cavity Enhanced Absorption Spectroscopy (OP-IBBCEAS) at 445 nm for the detection of iodine oxide (IO), nitrogen oxide (NO2) and glyoxal (CHOCHO) in the atmosphere. We provide a comparison between OP-IBBCEAS and the closed-path setup on which our instrument is based, previously described in Barbero et al. (2020). The OP system achieved a noise-equivalent absorption sensitivity (NEAS) of per spectral element, only 3 times higher than the closed-path system. Automated performance of regular measurements without absorbance ensures good long-term accuracy of the system. The OP-IBBCEAS is robust and simple to install in the field, allowing quantitative measurements of NO2, CHOCHO, and IO with precisions of ±150, ±150, and ±7 ppt (pmol mol−1, 2σ) in 50 s of measurement.
- Article
(6130 KB) - Full-text XML
-
Supplement
(2262 KB) - BibTeX
- EndNote


The detection and quantification of trace gases in the atmosphere is important for understanding the chemical processes that influence air quality, climate change, Earth's radiative balance, and past climate reconstructions. Reactive species such as nitrogen oxides (NOx = NO and NO2), nitrate radical (NO3), hydroxyl, hydroperoxy and peroxy radicals (HO, HO2, RO2) and halogen oxide radicals (XO, X = I, Br, Cl) are the main actors controlling the concentrations of the other species and working as chemical “detergents”. They have significant impacts on ozone chemistry, atmospheric oxidative capacity and secondary aerosol formation, all of which have implications for both regional air quality and global climate processes (Beynon and Williams, 1976). In polar regions and in the marine boundary layer, halogen-containing compounds are released by biogenic and photochemical processes. The highly reactive IO radical is produced through reactions involving iodine released from sea salt and organic compounds and, in combination with other halogen oxides, participates in ozone-destroying cycles, thereby impacting regional and global ozone budgets (Saiz-Lopez et al., 2015; Simpson et al., 2015; Gómez Martín et al., 2020). Similarly, NO2 is a central component of atmospheric photochemistry. Alongside volatile organic compounds (VOCs), NO2 is a precursor to photochemical formation of tropospheric ozone. This ground-level ozone is a major component of urban smog and poses risks to human, vegetation, and ecosystems healths. Beyond ozone formation, NO2 contributes to atmospheric oxidative capacity, participating in the formation of nitric acid and nitrate aerosols, which are significant components of atmospheric aerosol (Romer Present et al., 2020). Glyoxal (CHOCHO) is the smallest α-dicarbonyl. It is an important intermediate in the oxidation of volatile organic compounds and contributes significantly to the secondary organic aerosols (Volkamer et al., 2007). CHOCHO is not a reactive species, so can be measured in a closed-path configuration, however the presence of a particle filter in the inlet line may lead to an underestimation of its concentration in the atmosphere, as highlighted by this work.
Traditional measurement techniques for reactive species, particularly OH, HO2, RO2 and XO, are often been limited by sensitivity, spatial resolution, and the interference of surrounding gases (Kukui et al., 2008; Ryan et al., 2018). A further challenge is provided by the high reactivity of analyte species, and the difficulty to consistent analyte transport them into a measurement cell. Open-path configurations are generally preferred, because they avoid the sample transport problem, yet they pose other challenges related to the degradation of sensitive instrumental parts which are exposed to environmental conditions. Open-path measurements can be performed with long-path differential optical absorption spectroscopy (LP-DOAS) where the measurement is integrated over few kilometres of optical path (Nasse et al., 2019), Multi-Axis Differential Optical Absorption Spectroscopy (MAX-DOAS) (Hönninger et al., 2004), which collects scattered sunlight at multiple angles, providing vertical profiles of trace gases, or by in situ instruments which provide sufficient sensitivity to detect the target species using compact optical cavities (Grilli et al., 2012). MAX-DOAS is simple to build and install in the field. It is highly sensitive to absorbing gases in the lowest few kilometres of the atmosphere, but the data treatment is challenging since it requires combining measurements with a radiative transfer model calculations to retrieve the vertical profiles. Unlike DOAS approaches, cavity-based instruments provide local measurements and are insensitive to meteorological conditions (clouds, foggy weather, rain, snow, etc.). They are also simpler to install than LP-DOAS spectrometers because there is no need to align the beam with a distant retroreflector element.
Incoherent Broadband Cavity-Enhanced Absorption Spectroscopy (IBBCEAS) is a highly sensitive, robust, cavity-enhanced absorption technique that utilizes low-cost broadband radiation to detect multiple species with high precision. The open-path configuration eliminates the need for sampling lines, avoiding losses and artifacts associated with wall interactions and secondary formation of reactive components (Wang and Lu, 2019). The technique allows high spatial and temporal resolution measurements, making it suitable for field applications in various environments, including urban areas and regions with moderate aerosol levels (Wang and Lu, 2019). Thanks to its broadband character, IBBCEAS can simultaneously monitor multiple species, including HONO, NO2, NO3, SO2, H2O, IO, I2, BrO, Br2, O3, formaldehyde (CH2O) and nitrophenols (Wang et al., 2023). OP-IBBCEAS has been reported to detect HONO and NO2 with detection limits of 430 ppt and 1 ppb, respectively (acquisition time 90 s), (Wu et al., 2012), and more recently with detection limits of 26 and 76 ppt, respectively (integration time 60 s) (Dixneuf et al., 2022). Likewise, measurements of the NO3 have been made with detection limits of 36 ppt (within 10 min acquisition time), (Suhail et al., 2019), and 3 ppt in 30 s were reported with an effective absorption length of ∼5 km (Fanhao et al., 2022).
While OP-IBBCEAS can operate in the presence of aerosols, strong particulate matter (PM) loading can reduce sensitivity (Wang and Lu, 2019). In some cases, corrections for non-Beer–Lambert may be required, such as for instance the one described in Wang et al. (2023), attempting to correct the effect of strong water vapour absorption lines on the NO3 absorption spectrum. The compact, cost-effective nature of OP-IBBCEAS makes it promising for widespread field deployments. Future developments may focus on improving the technique's robustness under strong PM loading, miniaturization and integration with other sensing technologies for comprehensive environmental monitoring (Wu et al., 2012).
In this work, we present a novel open-path IBBCEAS instrument designed for simultaneous measurement of IO, NO2 and CHOCHO. The open-path design minimizes sampling artifacts and allows for real-time measurements directly in the atmosphere, making it ideal for monitoring highly reactive and short-lived species in dynamic environments. The inlet line and the measurement cell are made of non-reactive material,so quantitative NO2 measurements can also be made in the closed cavity. Therefore, the effort for open-path measurements provided in this work is motivated by the detection of IO and can be extended to other reactive species (BrO, ClO, OH, HO2, RO2, OIO, OBrO, OClO, etc.).
The IBBCEAS technique injects incoherent broad-band light into a high-finesse optical cavity for trace gas detection. The components used for this OP-IBBCEAS system are the same as those described in Barbero et al. (2020). The instrument uses a high-power LED (Luminus SBT70) centred at 445 nm with 19 nm FWHM (full width at half maximum) producing ∼1 W of optical power cooled with a Peltier module (Adaptive ET-161-12-08-E) and a fan–heat-sink assembly. A photodiode is placed perpendicular to the beam trajectory in the proximity of the collimating lens for monitoring the LED intensity over time. The light from the LED is injected into a 50 cm long high-finesse optical cavity composed of two high-reflectivity mirrors (maximum reflectivity at 450 nm >99.990 % ± 0.01 %; Layertec 109281; the reflextivity curve is provided in Barbero et al., 2020). The radiation transmitted from the resonator is then focused on a bundle of seven optical fibres with 100 µm core diameter (Avantes FCRL-7UV100-2-SMA-FC) and sent to a spectrometer (Avantes AvaSpec-ULS2048L) composed of a diffraction grating (2400 lines mm−1), a 2048 pixel charge-coupled device (CCD) and a 100 µm entrance slit. The resolution of the spectrometer was 0.54 ± 0.20 nm. In Barbero et al. (2020) the instrument was used in a closed-path configuration and was mounted in a 19 in., 3U (5.25 in.) rack-mount case. In this current work, the optical part of the instrument, which was mounted on a Z-shaped 8 mm thick aluminium board, was displaced in a second rack-mount case of the same size (Figs. 1 and 2). The board was fixed on the rack using cylindrical dampers (Paulstra). Underneath the board, four 5 W heating bands and one PT100 sensor were glued, and a RKC module (RKC Instrument RF100) was used to regulate its temperature to minimize mechanical drift of the optical system due to ambient temperature fluctuations. A 16 mm inner diameter tube that on the closed-path setup was used to flush the cavity with the air to be analysed was now mounted on a translation stage (Zaber, 001-X-LHM025A-KX13AF) for automatically displacing the tube in and out of the light beam. This allows to regularly inject zero air to measure the transmission from the cavity without the presence of absorption (I0). One of the two cavity mirror mounts was made to be moved in and out along the axes of the cavity to switch between close path (CP) and OP configuration. In the case of the OP, the inner space between the two mirror mounts was a few millimetres larger than the tube. The gas connection was modified to use the diaphragm pump (KNF N 816 AV.12DC-B) to push the air through a filtering system (TEKRAN 90-25360-00 Analyzer Zero Air Filter). A total air flow of 4 L min−1 STP was used for flushing the two cavity mirrors (with ∼1.3 L min−1 on each mirror) and the 48 cm long cavity tube with an inlet flow of ∼1.3 L min−1 at the center of the tube. The mirror's holders are designed so that the purge length extends for ∼1 cm beyond the mirrors. The optical box has a 70 cm2 aperture at the front, and air circulation is ensured by the fan system used for dissipating the heating of the LED assembly with an airflow capacity of ∼600 L min−1. Sample air flow is therefore much higher than the zero air flow, minimizing the dilution of the sample flow provided by zero air flow. The rack was then placed in a plastic box () with two aeration grids placed in front of the apertures at the front and back of the rack (Fig. 2). The plastic box protects the instrument from bad weather conditions. At the air inlet and outlet, a plastic rainproof ventilation grid with a plastic insect mesh net was installed, allowing the instrument to be left outside for long-term deployment. The two compartments can be installed 2 m apart, allowing the electronic-gas compartment to be kept inside a shelter while leaving the optical compartment outside.
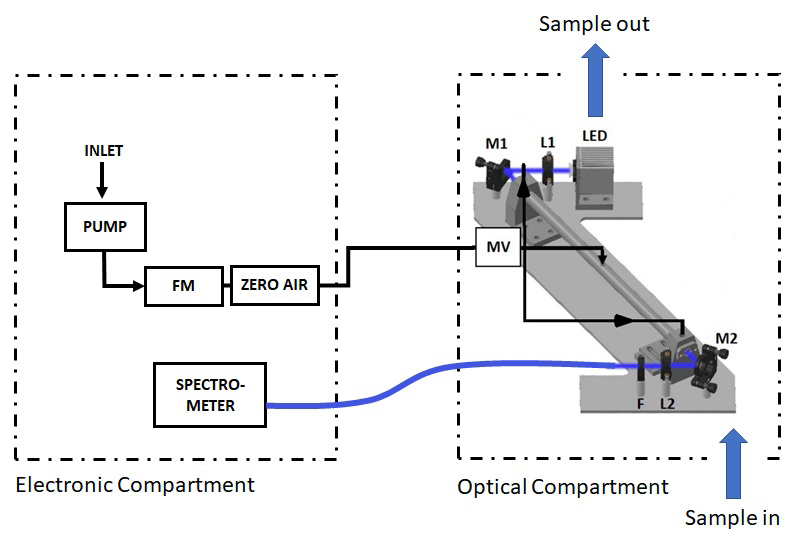
Figure 1The OP-IBBCEAS setup. The optical components are separated from the rest of the setup, allowing the latter to be placed in a protected place while the optical part is exposed to external environmental conditions. The air coming from a diaphragm pump is pushed through a flow meter, FM and a Zero Air generator. A manual valve, MV, is used to control the flow. The flow is then split into three parts: one going to the centre of the cell tube and the other two used for purging the HR mirrors, where the zero air is utilised to facilitate the cleaning of the surface of the mirrors by blowing in front of them. The cell tube is mounted on a motorized translation stage for regularly acquiring spectra in absence of the absorbance. Details about the rest of the electronic components can be found in Barbero et al. (2020).
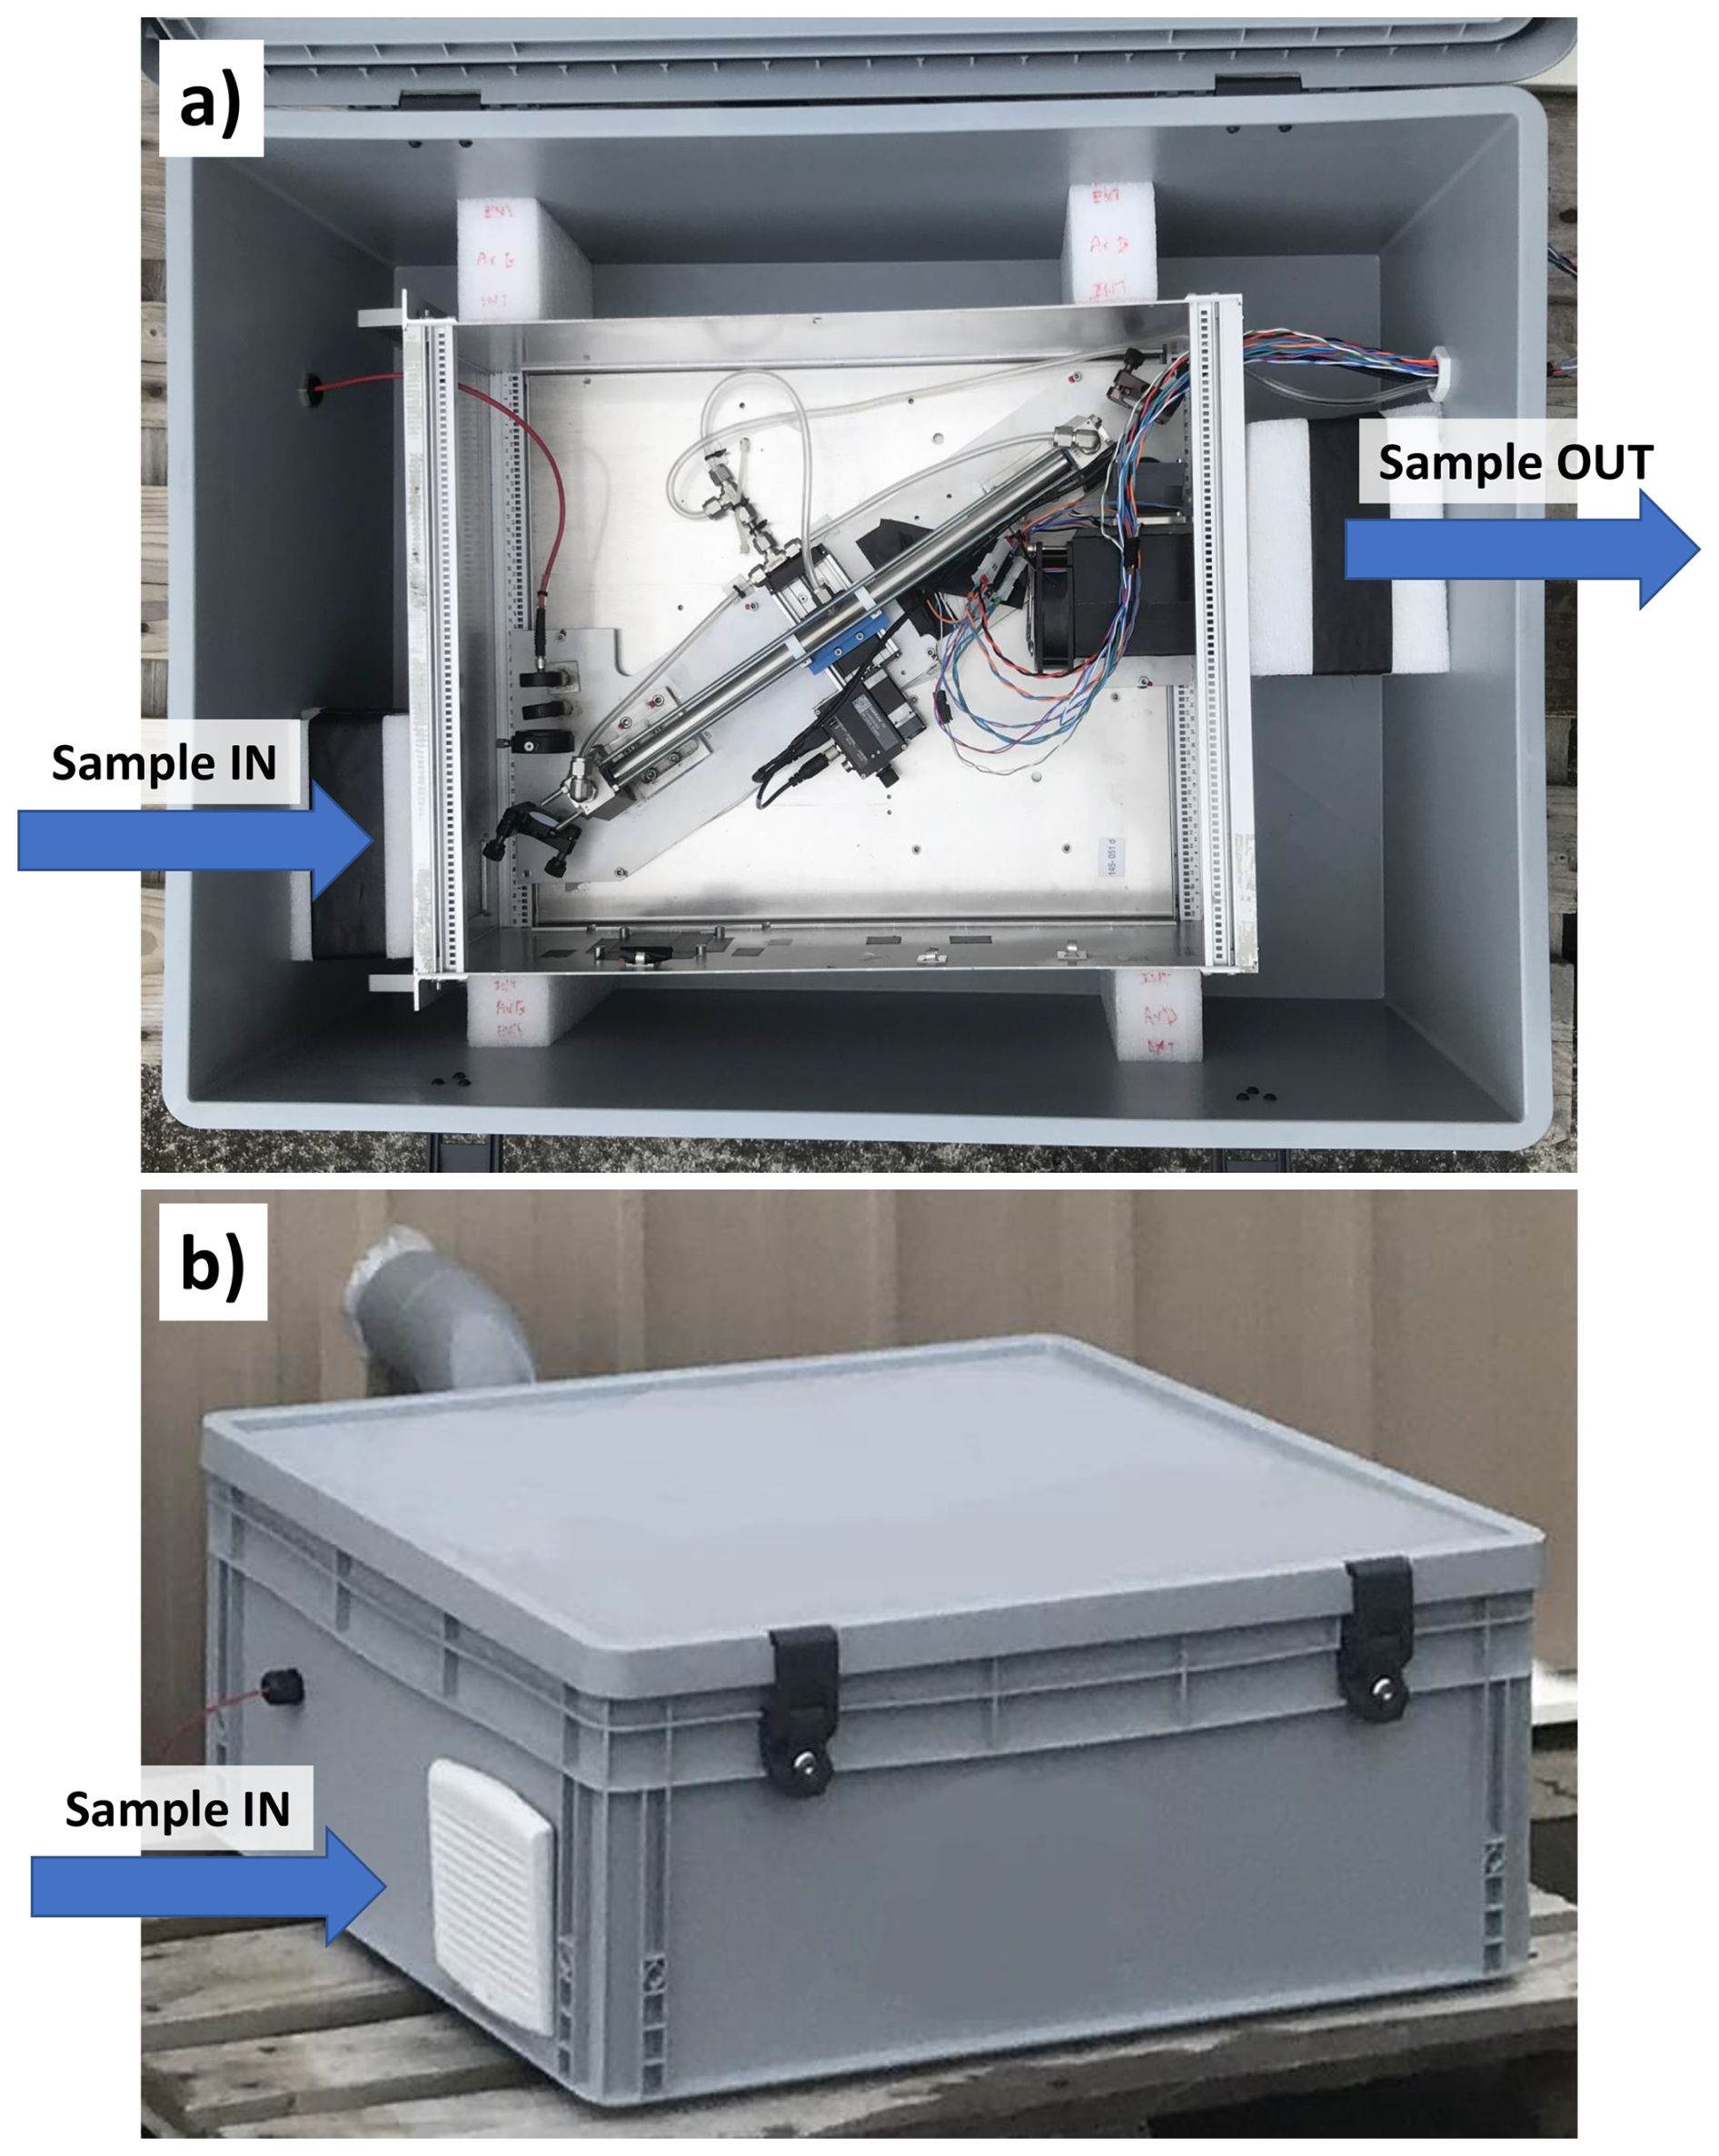
Figure 2Pictures of the optical compartment. (a) View inside the plastic box. The internal rack has a cover that was removed for the picture. (b) The plastic box installed and ready for outdoor air measurements.
For testing the performance of the OP-IBBCEAS instrument, the second IBB-CEAS configured in CP mode was used. The latter was calibrated using a laboratory system (FlexStreamTM Gas Standards Generator, KINTEK Analytical, Inc.) based on a permeation tube of NO2 (KIN-TEK ELSRT2W) which delivers known concentrations of NO2. A calibration curve between 0 and 50 ppb of NO2 was performed as described in Barbero et al. (2020). The OP system was first calibrated in CP configuration and then compared to the CP-IBBCEAS on indoor air measurements. All the errors reported in this work are expressed as 2σ.
In Fig. 3 we reported a typical spectrum recorded with the OP system during indoor and outdoor deployment. The signals (Sp), fits, baselines (Bsln) and Residuals (Sp-Fit) of the fit are reported for the two cases. For indoor measurement, a baseline described by a polynomial of order 4 was sufficient to provide a flat residual, while for outdoor measurement, the order was increased to 8. This is due to the strong broadband structure that appears on the baseline related to the extinction of light from aerosol particles. At present, it is difficult to assess the contribution of aerosol particles in a quantitative way due to the wide variety of particle types to be taken into account. The fit results provided a concentration of ∼11 ppb of NO2 in both cases. The spectra were obtained by averaging 200 spectra, for an acquisition time (tint) of 24 s (50 s in total for acquiring I0 and I signals) reaching a minimum absorption coefficient (αmin, corresponding to the standard deviation of the residuals) of and cm−1, for indoor and outdoor measurement respectively. For outdoor measurements this corresponds to a figure of merit expressed as noise-equivalent absorption sensitivity (NEAS) or of per spectral element (M). M is equal to the number of pixels used for the fit, which is M=800 for our system.
The αmin was deduced for different time averages. The results are shown in the log-log plot of Fig. 4, where the dots are the data and the dashed line indicates the trend in the case of a pure white-noise regime. Different from the CP performances reported in Barbero et al. (2020), here the αmin values deviate from the white-noise regime even at short time averages. This may be due to a combination of factors, and in particular: (i) to the lower stability of the system that was placed outside and exposed to meteorological changes; (ii) to the effect of the turbulence flow due to the open path configuration; and (iii) to the changes in atmospheric composition. From this analysis, one can see that the optimum integration time is ∼200 spectra (24 s), and further integrating over time does not lead to a consistent reduction of the residuals.
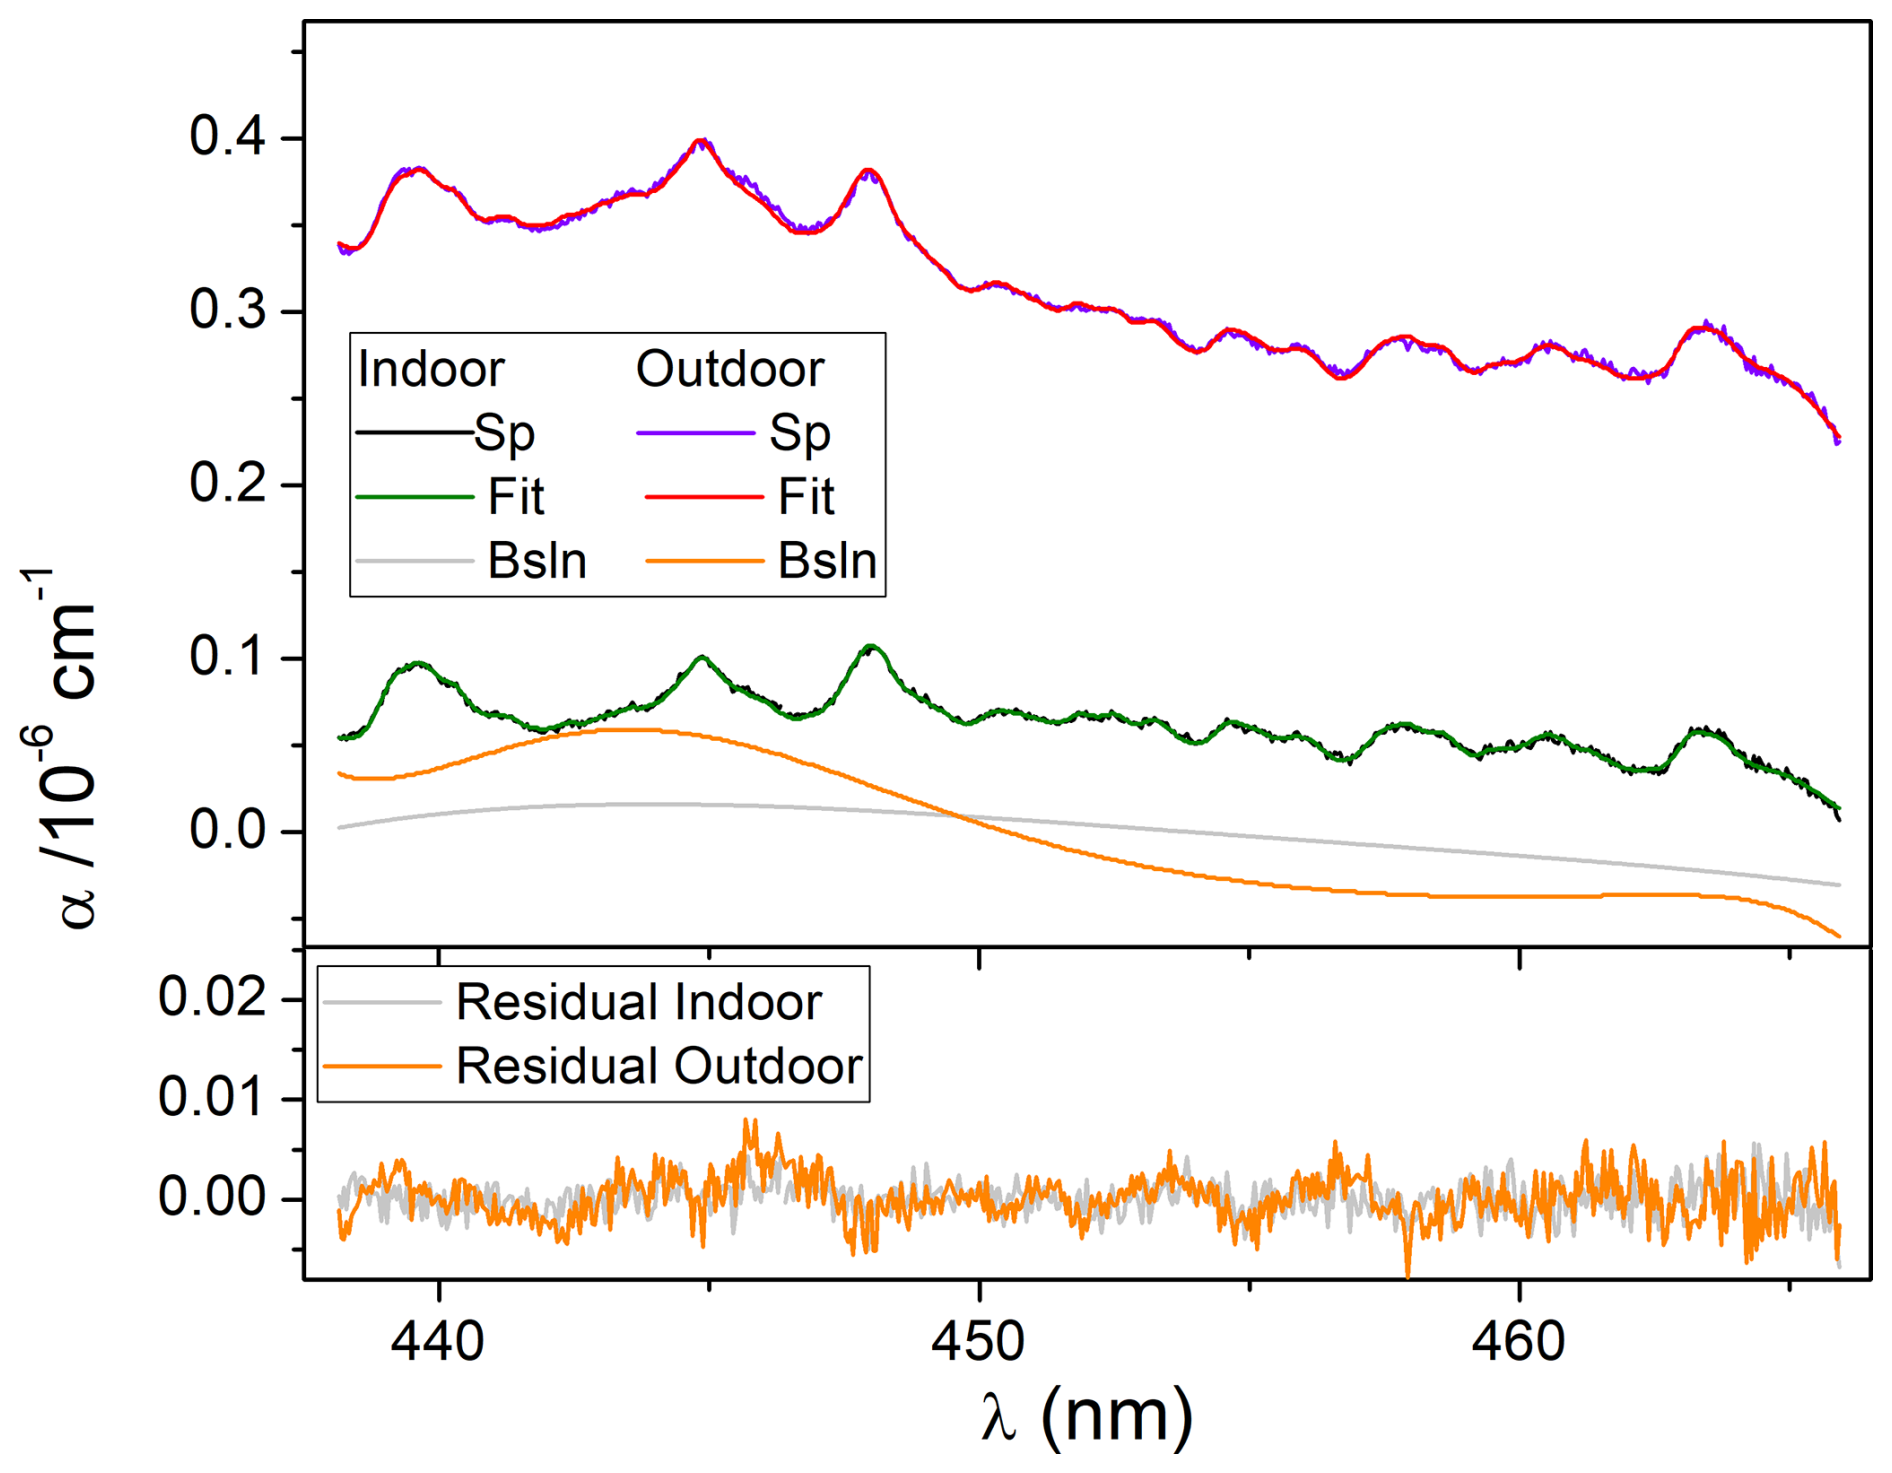
Figure 3An example of the absorption spectra recorded with the OP-IBBCEAS instrument for indoor and outdoor measurements. The signal (in black and purple) and the fit (in green and red) are reported in the top panel together with the respective baselines (in grey and orange) described with a polynomial of order 4 and 8 for the indoor and outdoor case, respectively. At the bottom, the residuals of the fit (in grey and orange) were reported. The fit results provided a concentration of ∼11 ppb of NO2 in both cases. CHOCHO, O3 and H2O absorption were also fitted. The spectra were obtained by averaging 200 spectra, for an acquisition time of 24 s (50 s in total for acquiring I0 and I signals) reaching a minimum absorption coefficient of and cm−1, respectively.
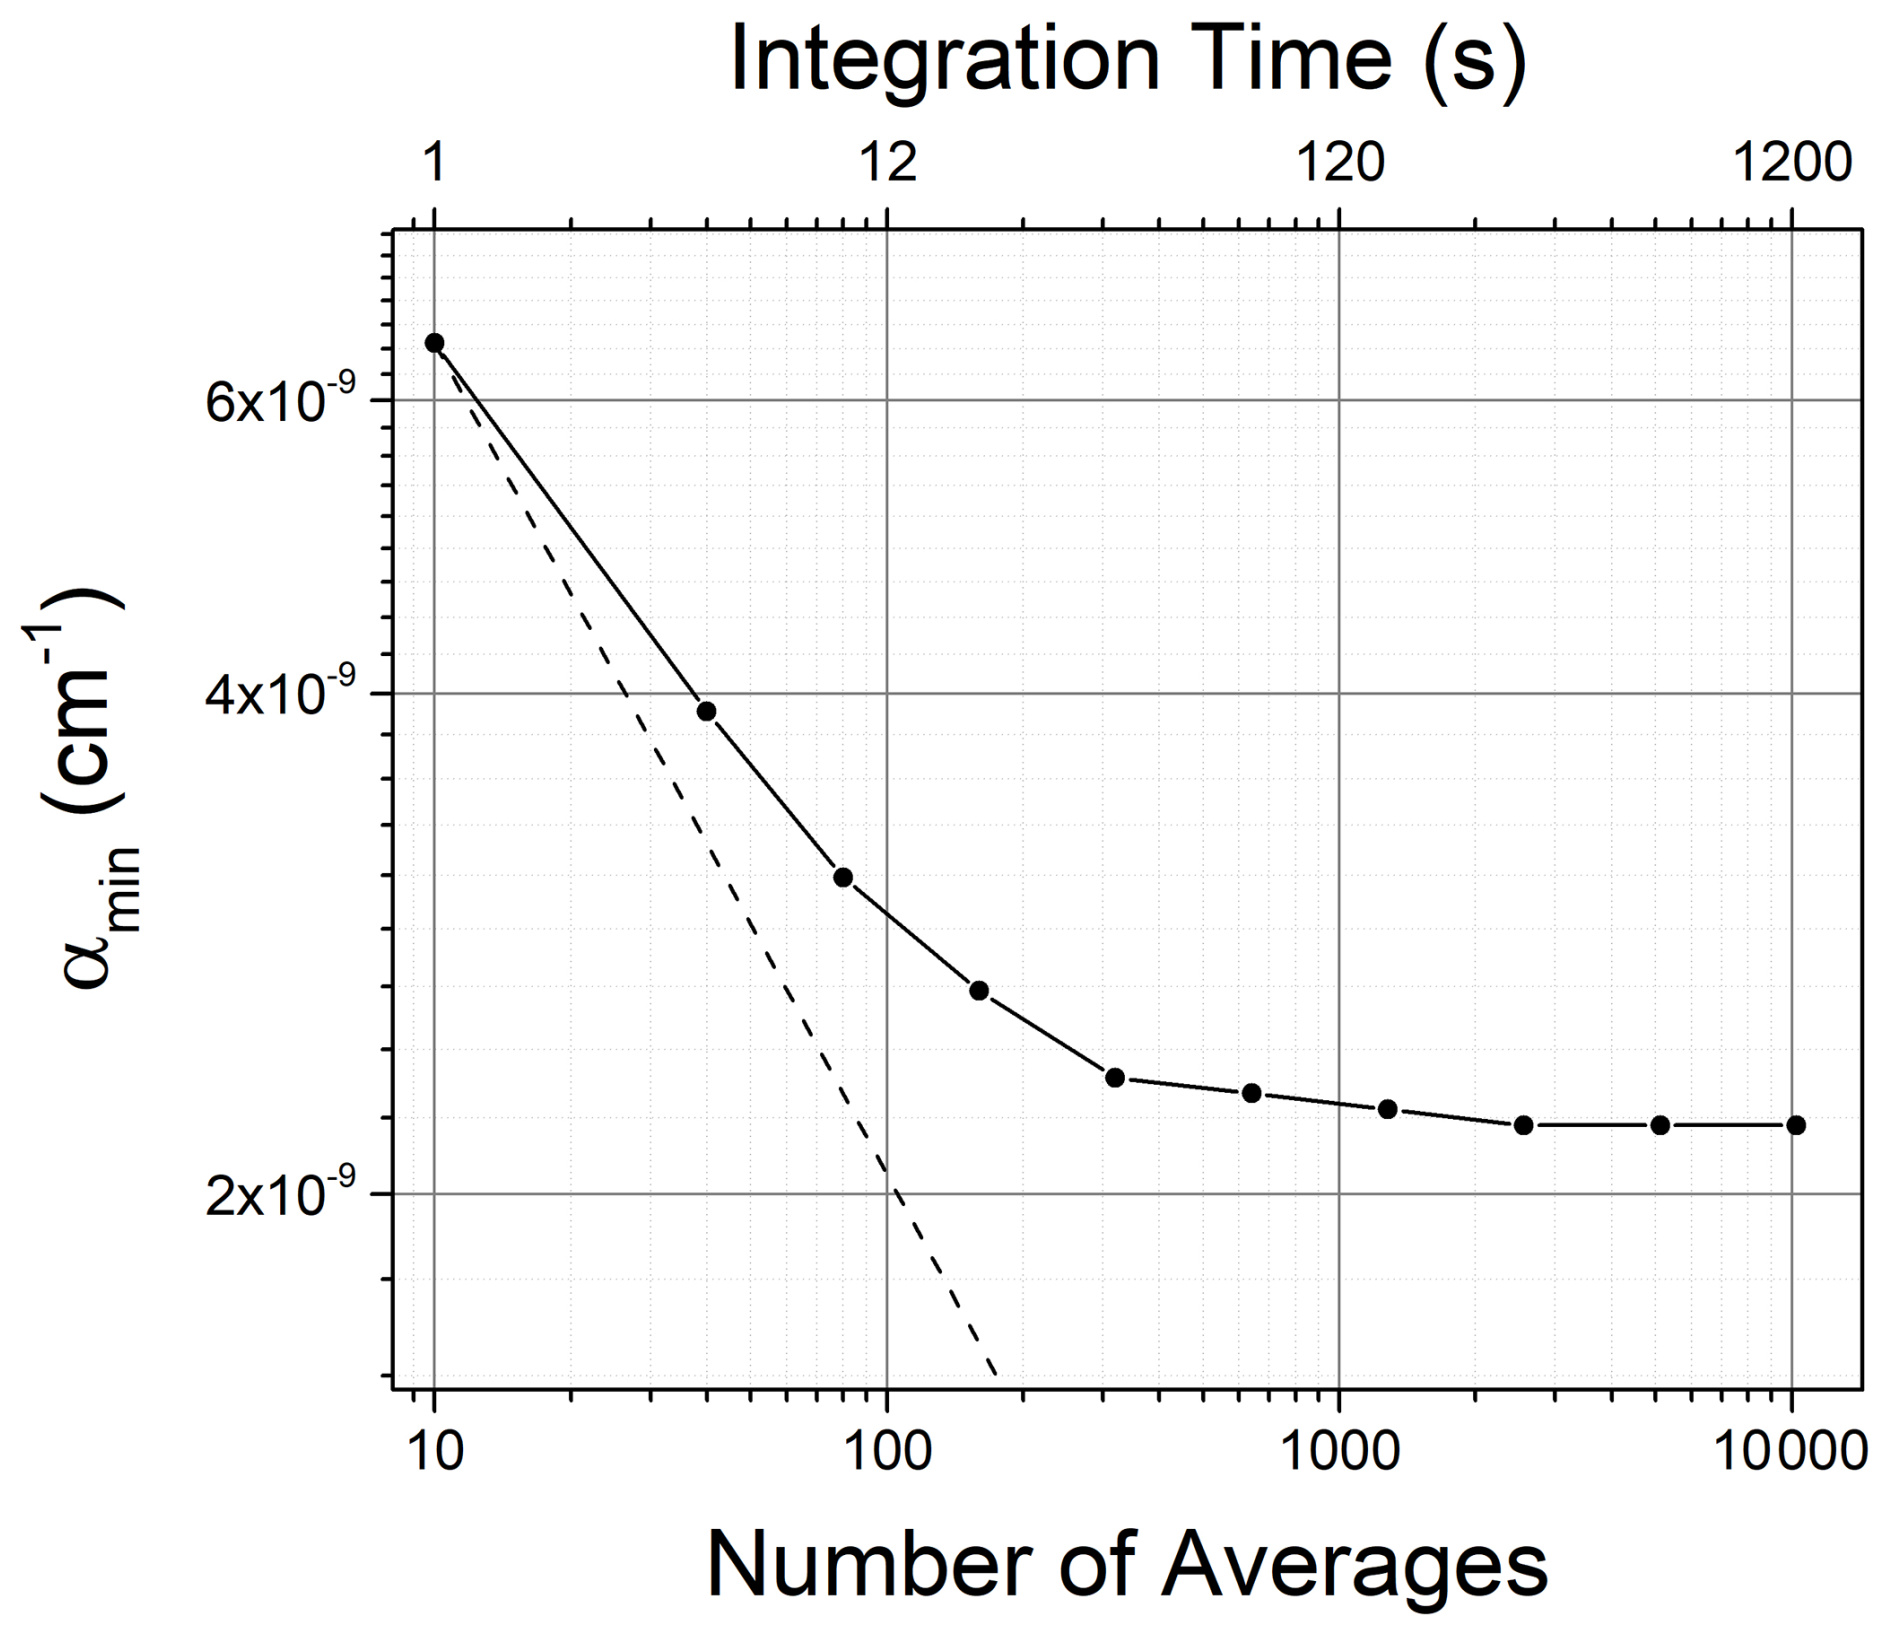
Figure 4The minimum absorption coefficient αmin versus the number of spectral averages for the OP-IBBCEAS instrument. For these measurements, the instrument was installed in a pristine location to test the instrument in background conditions where NO2 concentrations during the measurement period were ∼0.55 ppb. Absorption spectra were averaged for different integration times, and αmin was calculated from the standard deviation of the residual.
A comparison of the measurements between the OP and the twin CP system was first conducted for indoor air. Both instruments were installed side-by-side in the laboratory with the inlet line of the CP system, a 2.5 m long in. PFA tube equipped with a particle filter (Whatman®PTFE membrane filters – TE 38, 5 µm, 47 mm) placed as close as possible to the inlet aperture of the OP system. NO2, IO and CHOCHO signals were monitored over 24 consecutive days and the results are reported in Fig. 5. Good correlation between NO2 measurements was observed with a slope of 0.9593 ± 0.0014 (R2=0.9957, Fig. 6). After the indoor comparison, the optical compartment of the OP instrument was moved outside, on the first-floor balcony of the IGE laboratory in Grenoble ( N, E, Saint Martin D'Hères, France). The gas inlet of the CP instrument was placed again as close as possible to the inlet aperture of the OP system. Ten days of consecutive measurements were performed, and the results of the comparison are reported in Fig. 5. Both instruments well captured the morning and evening peaks of NO2 related to urban traffic. A discrepancy in the peak height was sometimes observed, particularly prior 8 October at 12:00 am (CET), but overall the two datasets showed a good correlation (R2=0.90) with a slope of 0.8928 ± 0.005 R2=0.9886 (or 0.8717 ± 0.009, R2=0.9131 if considering only data after 8 October at 12:00 am, Fig. 6). IO signal ranged around zero for both instruments, with a mean of −0.09 ± 1.78 ppt for the CP and −0.29 ± 8.8 for the OP, with a degradation of the detection limit by a factor of 5 while operating in open-path conditions. Mean values of −37.6 ± 108 and 388 ± 380 ppt for CHOCHO for the CP and OP system were respectively observed during outdoor measurements. The reason for this difference is so far not well understood, but it could be due to the presence of the particle filter at the inlet line of the CP system, leading to an underestimation of the concentrations of CHOCHO. Correlation of CHOCHO and IO to the variation in NO2 for outdoor measurements can be found in the Supplement. Although the presence of IO is not expected in such an urban area, the CHOCHO measurements were averaged over the ten days of observation, and a diurnal cycle with an amplitude of 100 ppt was observed (see the Supplement).
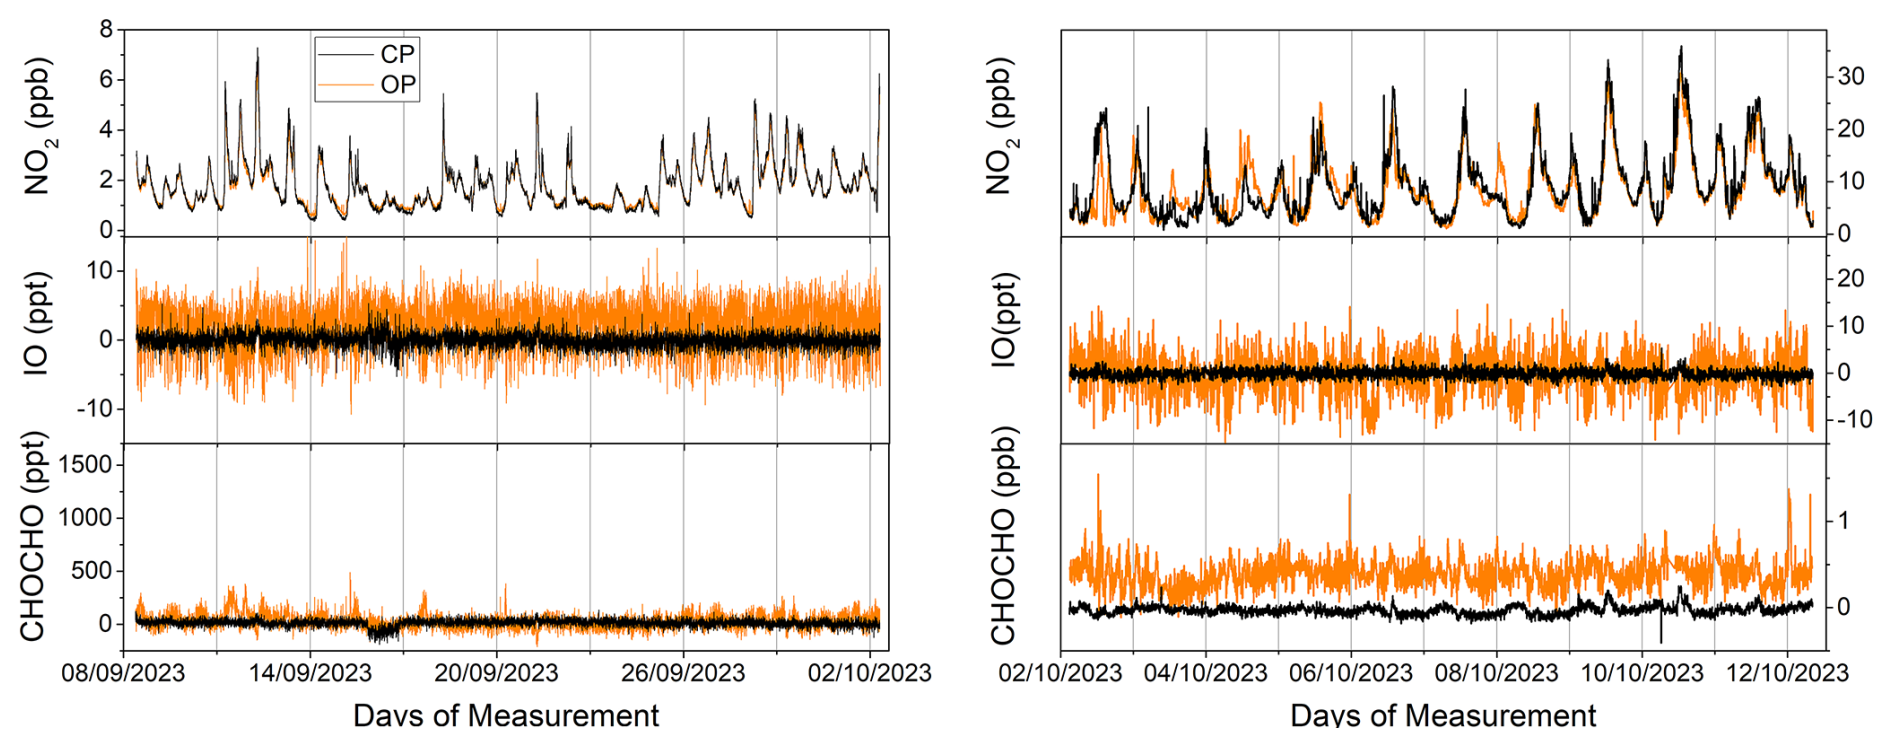
Figure 5Left: 24 d comparison between close-path and open-path indoor air measurements using the two IBBCEAS instruments. The sample inlet of the close-path system was placed as close as possible to one of the open-path instruments. Mean values are −0.06 ± 1.96 and 2.26 ± 6.83 ppt for IO and −12.2 ± 67 and 29.7 ± 144 ppt (2σ) for CHOCHO for the CP and OP system, respectively. Right: 10 d comparison between close-path and open-path outdoor measurements conducted in Grenoble using the two IBB-CEAS instruments. The sample inlet of the close-path system was placed close to the open-path instrument. Mean values are −0.09 ± 1.78 and −0.29 ± 8.8 ppt for the IO and −37.6 ± 108 and 388 ± 380 ppt (2σ) for CHOCHO for the CP and OP system, respectively.
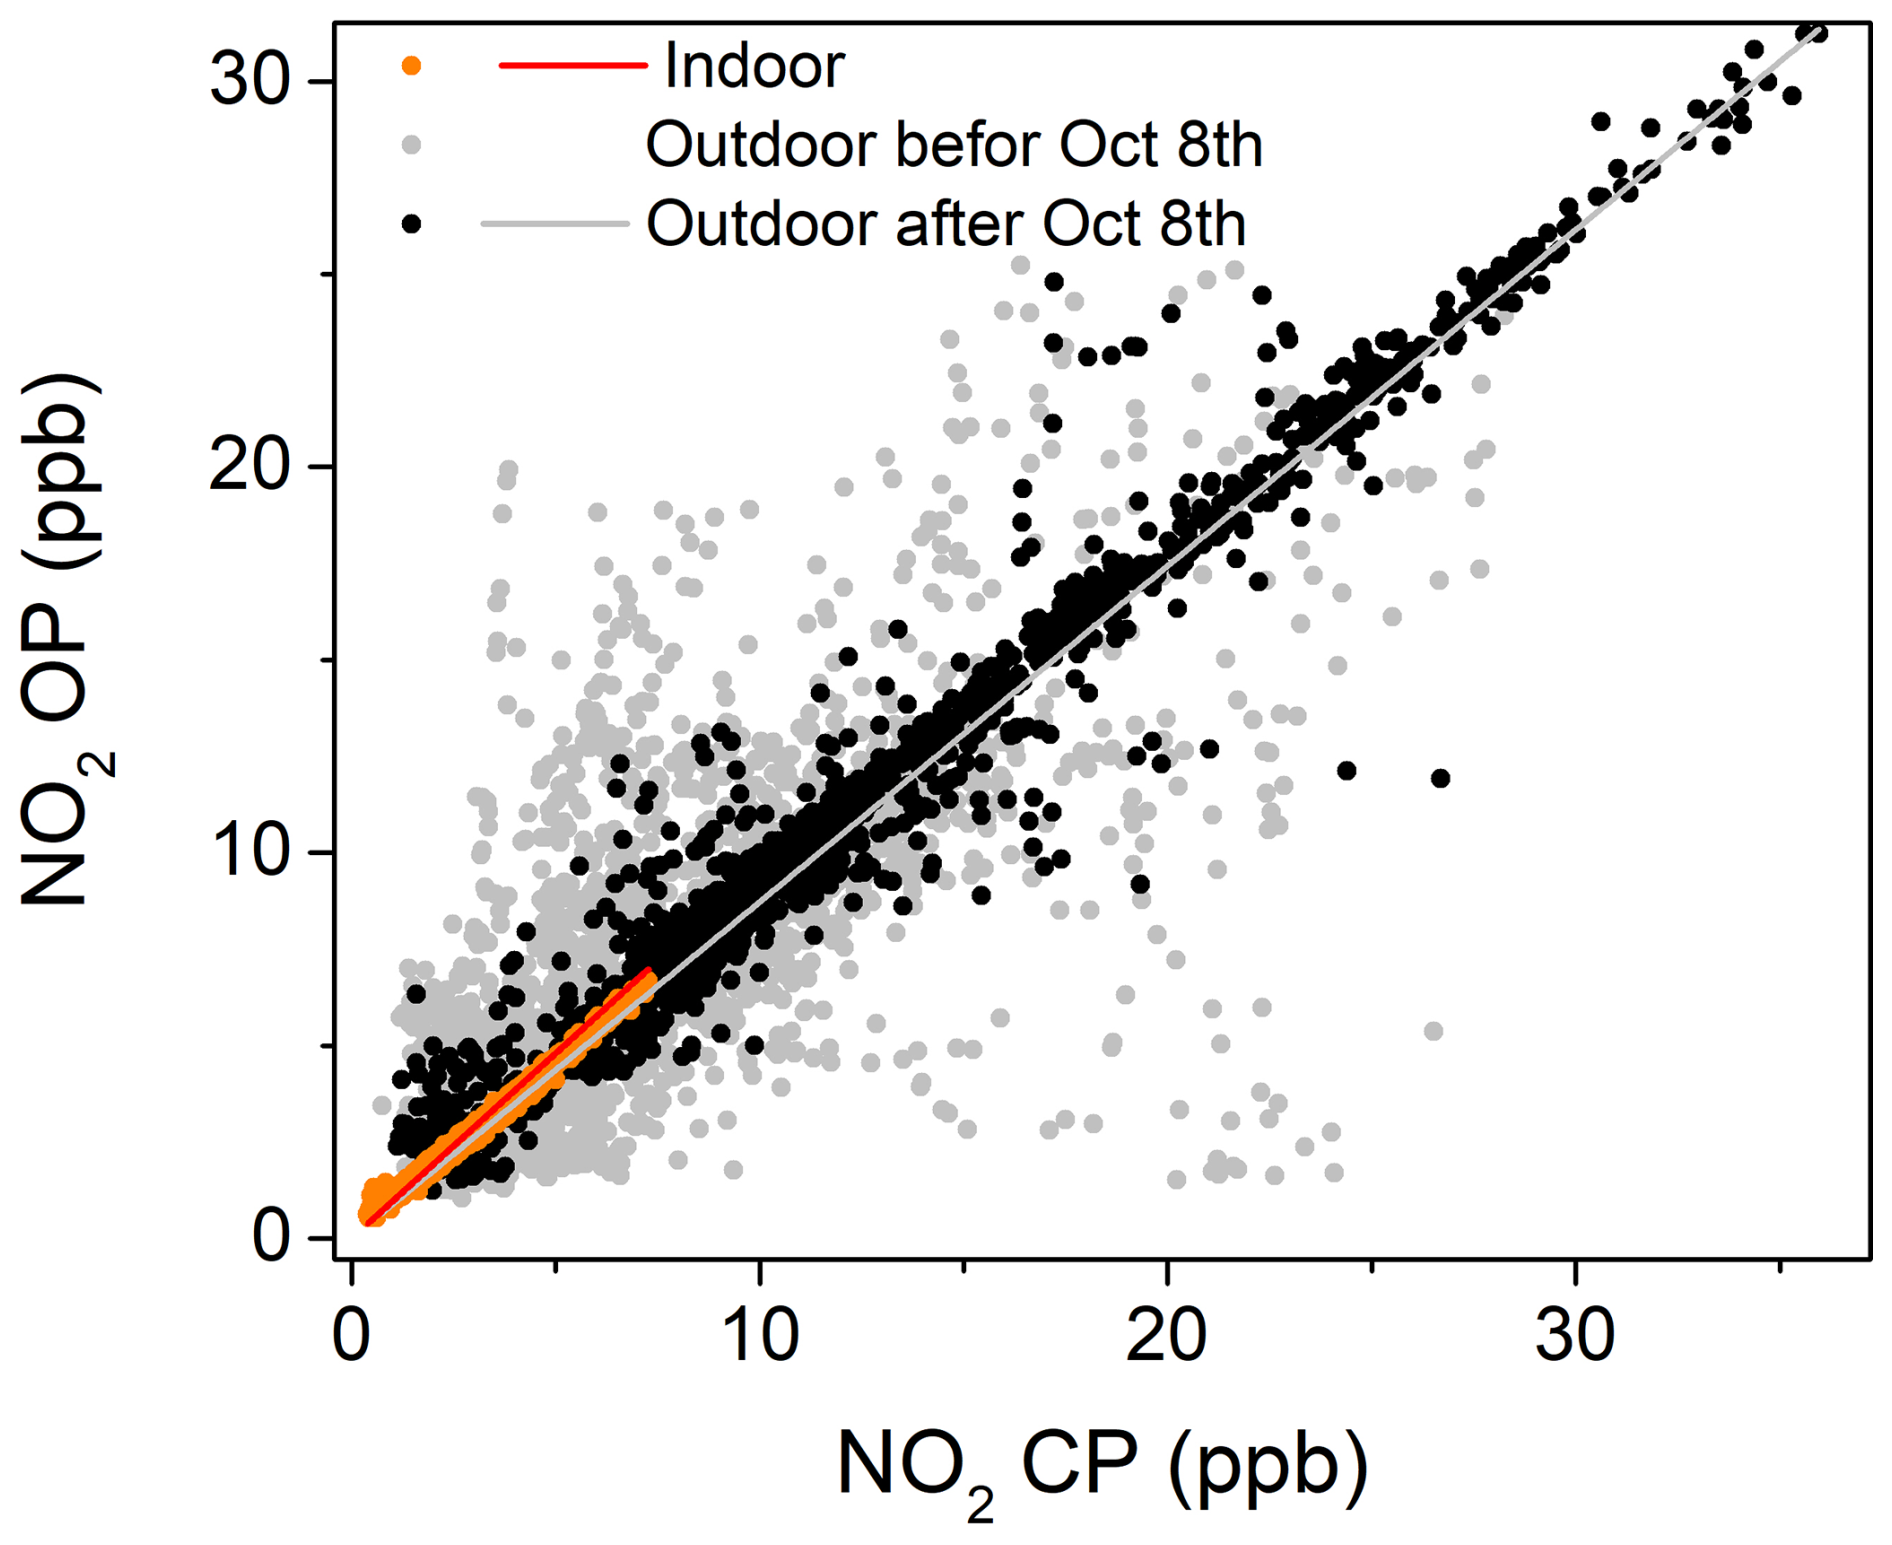
Figure 6Linear correlations between the NO2 measured by the OP and the CP were obtained for both indoor and outdoor measurements. Due to the sometimes observed discrepancy in the peak height, particularly prior to 8 October at 12:00 am, the dataset was separated in two, prior 8 October at 12:00 am (grey) with more scattered data and after (in black) for outdoor measurement. The latter was used for the linear regression, with slopes of 0.9593 ± 0.0014 (R2=0.9957) and 0.8928 ± 0.005 (R2=0.9886) obtained for indoor and outdoor measurements, respectively. Both intercepts were forced to zero.
Due to the absorption of CHOCHO during outdoor measurements, the detection limit for the OP system was estimated using the indoor data. We estimated a precision of ±7 ppt and ±150 (pmol mol−1, 2σ) in 50 s of measurement for IO and CHOCHO respectively. The small degradation in the precision of the IO to ±8.8 ppt during the outdoor measurement can be explained by the presence of higher levels of NO2. The precision on the NO2 can be extrapolated to ±150 ppt in 50 s using the estimation for the CP reported in Barbero et al. (2020).
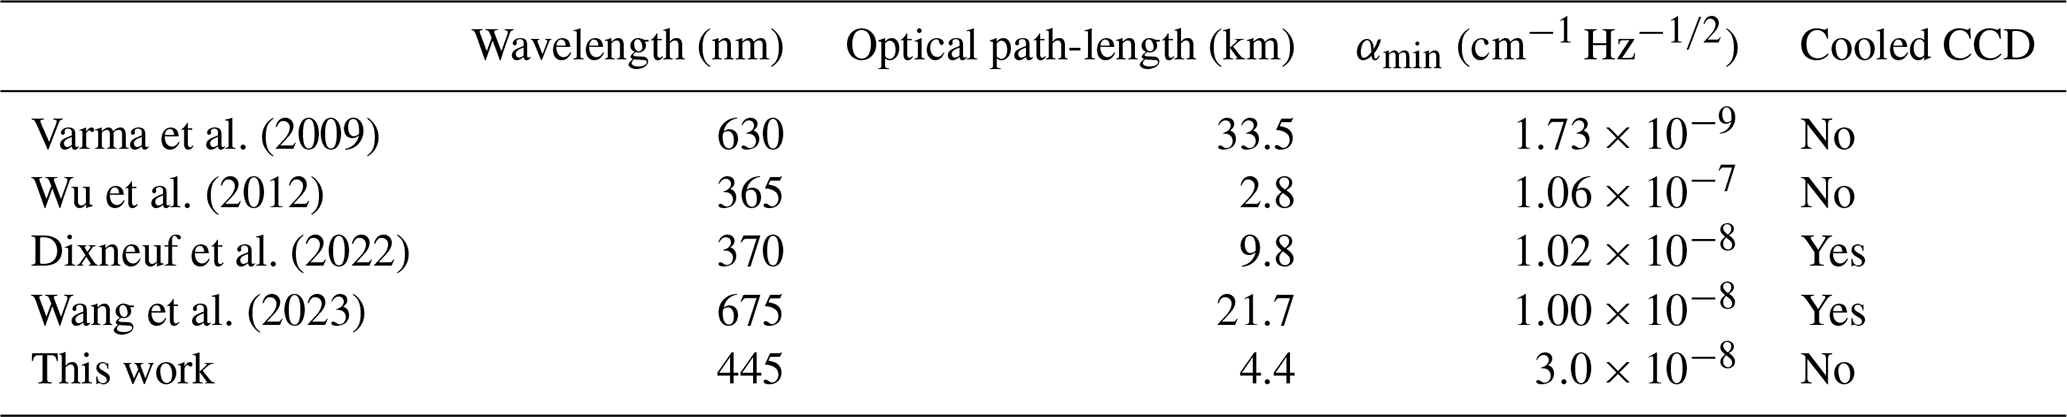
The detection limit of our system, with an effective optical path-length of 4.4 km optical path-length and an uncooled charge-coupled device (CCD) detector, was comparable with other recent developments. In the present study, a comparative analysis is presented with other open-path instruments. The characteristic performance of the existing OP-IBBCEAS for NO2 measurements is summarised in Table 1. For the purpose of comparison, the αmin is used, which corresponds to the standard deviation (1σ) of the residual of the fit. In order to have comparable values, the αmin is normalized by the integration time according to the following formula: , where tint denotes the acquisition time of I0 and I. By normalizing as well for the effective optical path-length we can see that the techniques reported in Table 1 range between and , and our system provides a value of , which is below the average value. Depending on the acquisition time for a single acquisition, the cooling of the CCD chip may have a beneficial effect on the signal-to-noise ratio. The uncooled Avantes spectrometer used in this work for an exposure time of <200 ms (as the case in this work) has a dark noise of only 0.04 % of the signal, but it reaches 1 % at 10 s exposure, becoming a non-negligible source of noise. In this case, using a cooled CCD camera can reduce the dark noise by a factor of 10. The effective path length used in the comparison is defined as , where is the cavity finesse.
Varma et al. (2009)Wu et al. (2012)Dixneuf et al. (2022)Wang et al. (2023)Table 1Comparison of the performance of OP-IBBCEAS techniques reported in the literature.
The cleanliness of the cavity mirrors is regularly monitored by the instrument. The average spectral intensity as well as the LED intensity are acquired every time the instrument records a spectrum in the absence of absorbance (I0) and compared to the values stored during the latest calibration of the instrument. By monitoring both signals is possible to discriminate between a decrease in intensity of the LED source or a dirtiness of the cavity mirrors (leading to more intra-cavity losses and so to a lower transmission). During the 36 d of indoor and outdoor measurement reported in Fig. 7 (Fig. 5 for the concentration records), the I0 intensity signal (black) varied by few per cent, while the LED intensity (orange) varied 40 times less. This means that the variability observed at the cavity transmission does not depend on the performance of the LED. At the beginning of the experiment, the transmitted intensity was 5 % higher than during the instrument calibration. Furthermore, one can observe the sudden decrease by 2 % while installing the instrument outside, as well as the thermal effects on the mechanical stress of the instrument during the outdoor deployment, with an amplitude of the diurnal cycle of the spectrum intensity of 1 %–2 %. From this data monitoring we could confirm that during the 10 d continuous outdoor measurements, the open-path instrument did not experience degradation due to a possible dirtiness of the cavity mirrors. With this monitoring, the operator can have an idea of the properties of the cavity mirrors, and decide when is time to interrupt the measurement to clean them. In the context of a injection of light into a resonator composed of two identical mirrors of reflectivity R, the ratio between the light intensity at the output of the cavity, denoted here as Iout, and the injected intensity, denoted here as Iin, is expressed through the following equation (Grilli, 2009):
where A is the absorption inside the cavity. In our case, we are monitoring the change in intensity in the absence of absorption, so Eq. (1) can be simplified as follows:
So, for high reflective mirrors (R→1) we can say that the relative change in intensity is directly proportional to (1−R) which is the inverse of the enhancement factor on the effective optical path-length (Leff) provided by a resonator of length L:
Mechanical instabilities play an important role here. A small misalignment of the cavity may lead to a change in the relative intensity of the light transmitted even if the mirror's reflectivity did not change. Therefore, the operator must regularly assess the relative variation in intensity over time from the moment the instrument is installed. The frequency of this monitoring should be adapted to the quality of the air in the environment, with weekly monitoring in urban areas and monthly in more remote environments.
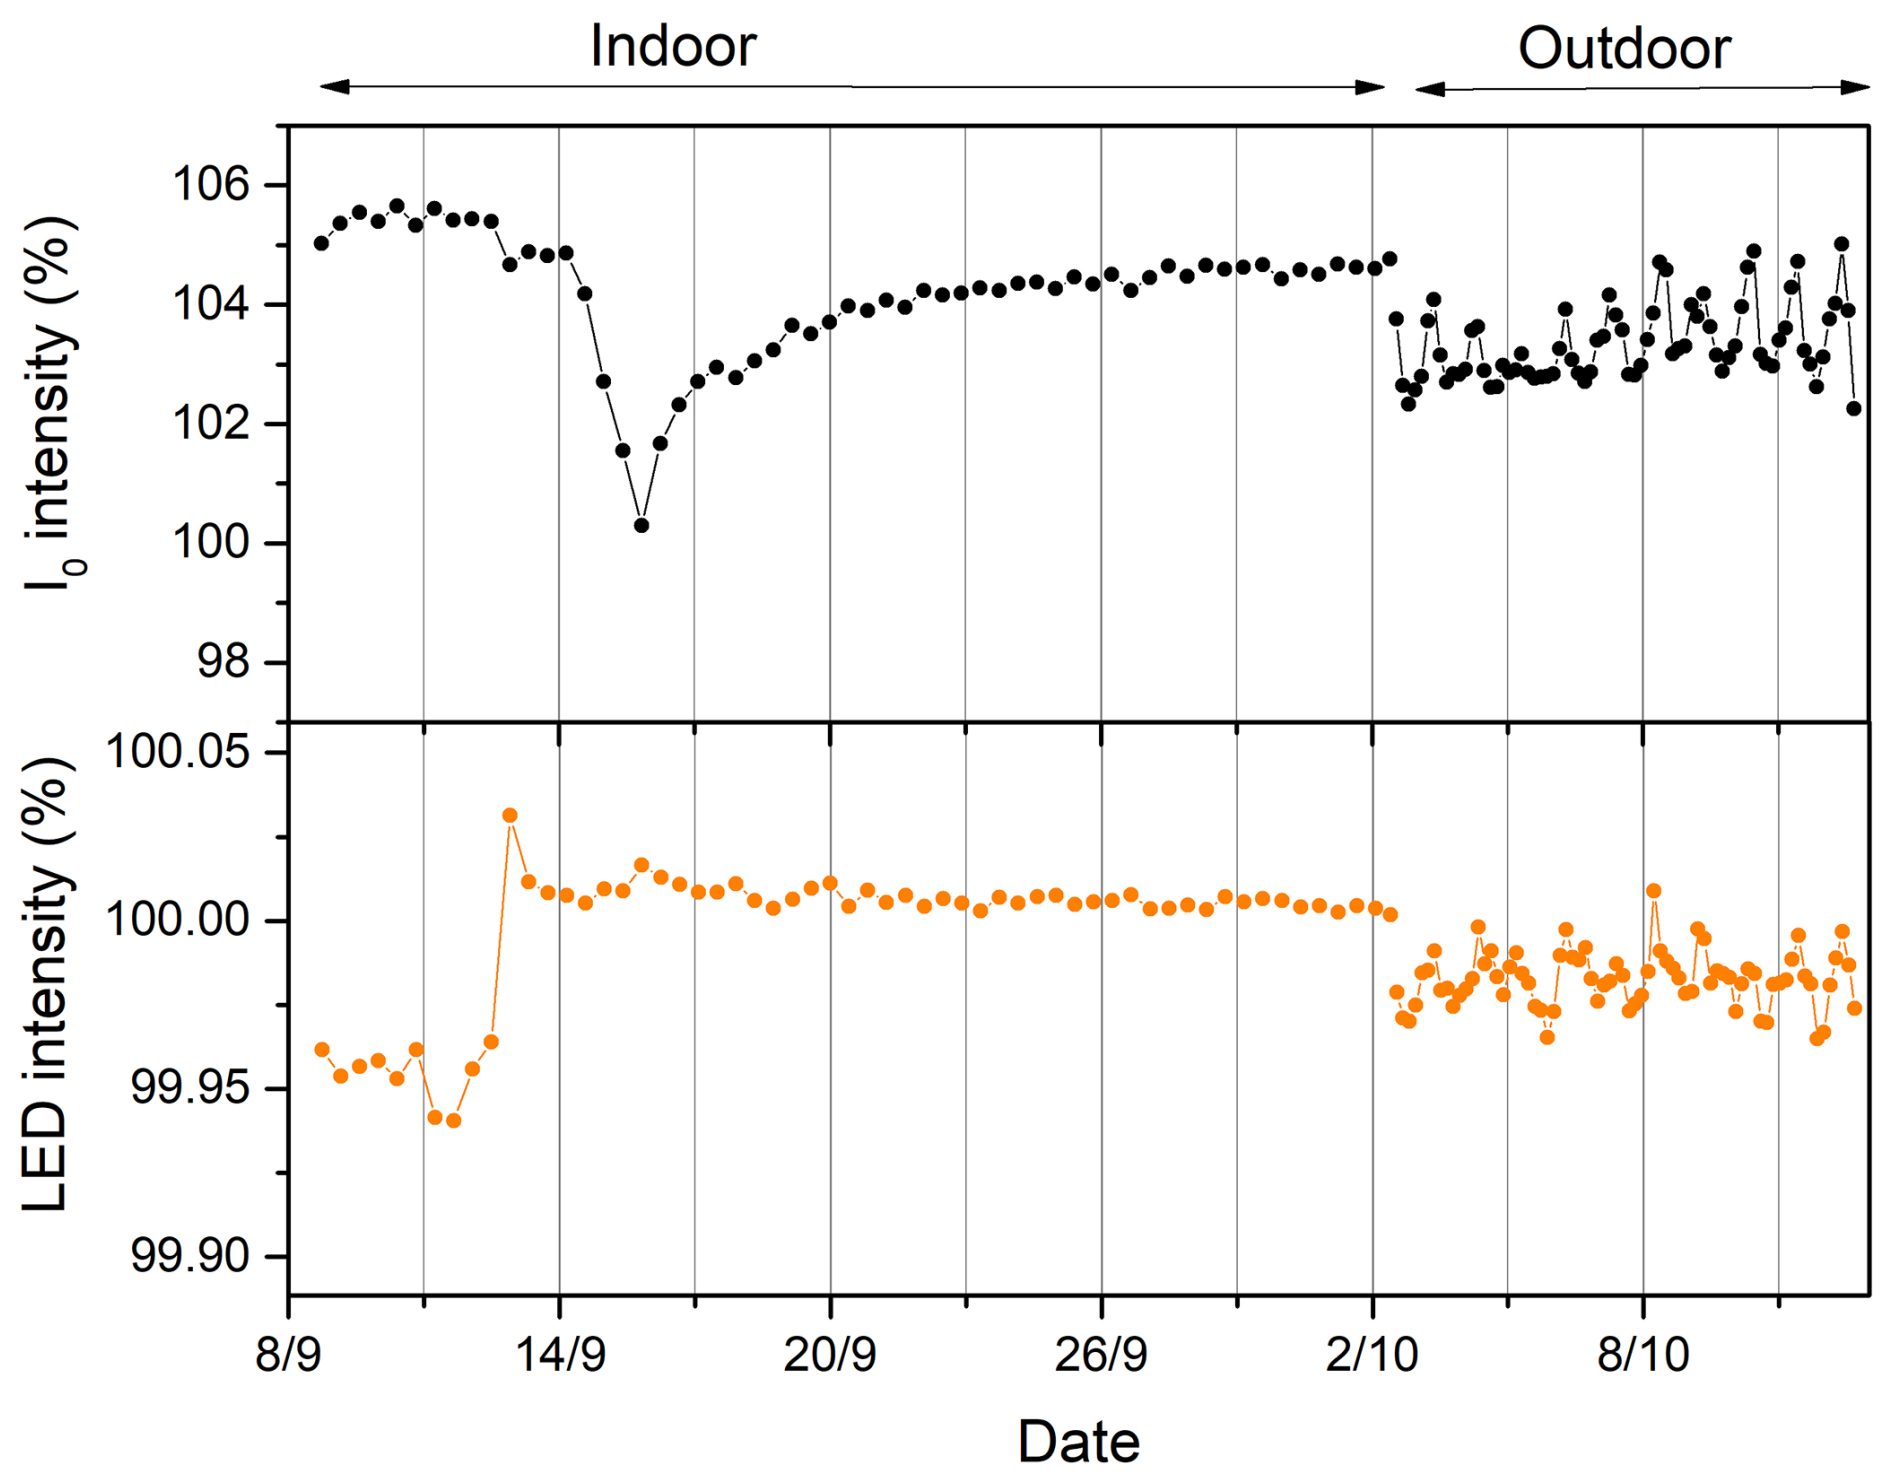
Figure 7Average spectrum intensity (top) and LED intensity (bottom) recorded during I0 measurements for indoor and outdoor measurements and expressed as a percentage with respect to the values registered during the calibration of the instrument prior the measurements.
In this work, we reported the development of an open-path IBB-CEAS (Incoherent Broad-Band Cavity Enhanced Absorption Spectroscopy) system for simultaneous measurement of NO2, IO and CHOCHO. The instrument is equipped with an automated system allowing to regularly acquire spectra in the absence of absorption. By purging the cavity mirrors with filtered dry air, we proved a continuous operation for up to 10 d without observing a degradation of the mirror reflectivity. We compared the performance between the closed-path (CP) and open-path (OP) configurations and compared the instrument during long-term indoor and outdoor surveys. The system is light (∼20 kg for the two racks), compact, robust and easy to install in the field, with a power consumption of <300 W. A similar development can be used in the future to measure other atmospheric interest radicals such as the other XO and OXO molecules, but also HO, HO2 and RO2 using different light sources in the UV, Visible and infrared region and with the respective high-reflective mirrors and optical spectrometers.
The code underlying the data processing and analysis presented in this manuscript is not publicly available. It was developed in-house by our research group and is protected under institutional intellectual property regulations. As a result, the source code cannot be distributed. A description of the algorithms and processing steps is provided in the article, and additional information can be made available upon request to the corresponding author, within the limits permitted by institutional policy.
The data used in this study are available from the corresponding author upon request.
The supplement related to this article is available online at https://doi.org/10.5194/amt-19-1943-2026-supplement.
The development was ideated by RG and conducted by FP and RG under the supervision of RG. Data analysis were conducted by FP and RG. NC contributed to the deployment of the system. JS is the leader of the CAPOXI 35–75 project. The paper was written by FP and RG, with contributions from all authors.
The contact author has declared that none of the authors has any competing interests.
Publisher's note: Copernicus Publications remains neutral with regard to jurisdictional claims made in the text, published maps, institutional affiliations, or any other geographical representation in this paper. The authors bear the ultimate responsibility for providing appropriate place names. Views expressed in the text are those of the authors and do not necessarily reflect the views of the publisher.
The authors would like to thank Jack Saville, Guillaume Méjean and Peter Čermák for carefully reading and checking the manuscript.
This work was supported by the French Polar Institute (IPEV) through programs 1177 (CAPOXI 35-75), by the Agence nationale de la Recherche (ANR-23-CE04-0014), by the Scientific Grant Agency of the Slovak Republic VEGA 1/0710/24 and by Comenius University Grants 2025, project UK/1367/2025.
This paper was edited by Keding Lu and reviewed by two anonymous referees.
Barbero, A., Blouzon, C., Savarino, J., Caillon, N., Dommergue, A., and Grilli, R.: A compact incoherent broadband cavity-enhanced absorption spectrometer for trace detection of nitrogen oxides, iodine oxide and glyoxal at levels below parts per billion for field applications, Atmos. Meas. Tech., 13, 4317–4331, https://doi.org/10.5194/amt-13-4317-2020, 2020. a, b, c, d, e, f, g
Beynon, W. and Williams, E.: The long term variation in the ionospheric winter absorption anomaly, Journal of Atmospheric and Terrestrial Physics, 38, 423–429, https://doi.org/10.1016/0021-9169(76)90069-6, 1976. a
Dixneuf, S., Ruth, A. A., Häseler, R., Brauers, T., Rohrer, F., and Dorn, H.-P.: Detection of nitrous acid in the atmospheric simulation chamber SAPHIR using open-path incoherent broadband cavity-enhanced absorption spectroscopy and extractive long-path absorption photometry, Atmos. Meas. Tech., 15, 945–964, https://doi.org/10.5194/amt-15-945-2022, 2022. a, b
Fanhao, M., Min, Q., Wu, F., Jun, D., Ke, T., Helu, Z., Dou, S., Zhitang, L., and Pinhua, X.: Measurements of atmospheric HONO and NO2 utilizing an open-path broadband cavity enhanced absorption spectroscopy based on an iterative algorithm, Acta Physica Sinica, https://doi.org/10.7498/aps.71.20220150, 2022. a
Gómez Martín, J. C., Lewis, T. R., Blitz, M. A., Plane, J. M., Kumar, M., Francisco, J. S., and Saiz-Lopez, A.: A gas-to-particle conversion mechanism helps to explain atmospheric particle formation through clustering of iodine oxides, Nature Communications, 11, 4521, https://doi.org/10.1038/s41467-020-18252-8, 2020. a
Grilli, R.: Methods for trace gas detection using difference frequency generation, PhD thesis, University of Bristol, https://shorturl.at/i02mv (last access: 9 October 2025), 2009. a
Grilli, R., Méjean, G., Kassi, S., Ventrillard, I., Abd-Alrahman, C., and Romanini, D.: Frequency comb based spectrometer for in situ and real time measurements of IO, BrO, NO2, and H2CO at pptv and ppqv levels, Environmental Science & Technology, 46, 10704–10710, https://doi.org/10.1021/es301785h, 2012. a
Hönninger, G., von Friedeburg, C., and Platt, U.: Multi axis differential optical absorption spectroscopy (MAX-DOAS), Atmos. Chem. Phys., 4, 231–254, https://doi.org/10.5194/acp-4-231-2004, 2004. a
Kukui, A., Ancellet, G., and Le Bras, G.: Chemical ionisation mass spectrometer for measurements of OH and Peroxy radical concentrations in moderately polluted atmospheres, Journal of Atmospheric Chemistry, 61, 133–154, https://doi.org/10.1007/s10874-009-9130-9, 2008. a
Nasse, J.-M., Eger, P. G., Pöhler, D., Schmitt, S., Frieß, U., and Platt, U.: Recent improvements of long-path DOAS measurements: impact on accuracy and stability of short-term and automated long-term observations, Atmos. Meas. Tech., 12, 4149–4169, https://doi.org/10.5194/amt-12-4149-2019, 2019. a
Romer Present, P. S., Zare, A., and Cohen, R. C.: The changing role of organic nitrates in the removal and transport of NOx, Atmos. Chem. Phys., 20, 267–279, https://doi.org/10.5194/acp-20-267-2020, 2020. a
Ryan, R. G., Rhodes, S., Tully, M., Wilson, S., Jones, N., Frieß, U., and Schofield, R.: Daytime HONO, NO2 and aerosol distributions from MAX-DOAS observations in Melbourne, Atmos. Chem. Phys., 18, 13969–13985, https://doi.org/10.5194/acp-18-13969-2018, 2018. a
Saiz-Lopez, A., Blaszczak-Boxe, C. S., and Carpenter, L. J.: A mechanism for biologically induced iodine emissions from sea ice, Atmos. Chem. Phys., 15, 9731–9746, https://doi.org/10.5194/acp-15-9731-2015, 2015. a
Simpson, W. R., Brown, S. S., Saiz-Lopez, A., Thornton, J. A., and von Glasow, R.: Tropospheric halogen chemistry: Sources, cycling, and impacts, Chemical Reviews, 115, 4035–4062, https://doi.org/10.1021/cr5006638, 2015. a
Suhail, K., Suhail, K., George, M., Chandran, S., Chandran, S., Varma, R., Venables, D., Wang, M., and Chen, J.: Open path incoherent broadband cavity-enhanced measurements of NO3 radical and aerosol extinction in the North China Plain, Spectrochimica Acta. Part A, Molecular and Biomolecular Spectroscopy, 208, 24–31, https://doi.org/10.1016/j.saa.2018.09.023, 2019. a
Varma, R. M., Venables, D. S., Ruth, A. A., Heitmann, U., Schlosser, E., and Dixneuf, S.: Long optical cavities for open-path monitoring of atmospheric trace gases and aerosol extinction, Applied Optics, 48, B159–B171, https://doi.org/10.1364/AO.48.00B159, 2009. a
Volkamer, R., San Martini, F., Molina, L. T., Salcedo, D., Jimenez, J. L., and Molina, M. J.: A missing sink for gas-phase glyoxal in Mexico City: Formation of secondary organic aerosol, Geophysical Research Letters, 34, https://doi.org/10.1029/2007GL030752, 2007. a
Wang, H. and Lu, K.: Monitoring Ambient Nitrate Radical by Open Path Cavity Enhanced Absorption Spectroscopy, Analytical Chemistry, https://doi.org/10.1021/acs.analchem.9b01971, 2019. a, b, c
Wang, M., Lou, S., Hu, W., Wang, H., Wang, X., Fan, F., Varma, R., Venables, D., and Chen, J.: Intercomparison of NO3 under Humid Conditions with Open-Path and Extractive IBBCEAS in an Atmospheric Reaction Chamber, Remote. Sens., 15, 739, https://doi.org/10.3390/rs15030739, 2023. a, b, c
Wu, T., Wu, T., Chen, W., Fertein, E., Cazier, F., Dewaele, D., and Gao, X.: Development of an open-path incoherent broadband cavity-enhanced spectroscopy based instrument for simultaneous measurement of HONO and NO2 in ambient air, Applied Physics B, 106, 501–509, https://doi.org/10.1007/S00340-011-4818-3, 2012. a, b, c