the Creative Commons Attribution 4.0 License.
the Creative Commons Attribution 4.0 License.
 | 01 Apr 2026
Contribution of the 2DVD to the investigation of cloud microphysics during the MOSAiC and Cloudlab/PolarCAP campaigns
Tom Gaudek
Cristofer Jimenez
Kevin Ohneiser
Christopher Fuchs
Jan Henneberger
Johannes Bühl
Andi Klamt
Albert Ansmann
Ronny Engelmann
In this study, the particle maximum diameter is introduced and evaluated as a new variable of the two-dimensional video disdrometer (2DVD). Vertically resolved remote-sensing measurements meanwhile allow to retrieve the microphysical properties of precipitation. However, opportunities for a direct evaluation of those retrievals are still lacking. One possible approach is the ground-based observation of precipitation particles with in-situ sensors such as the 2DVD. In this context, the suitability of the 2DVD for contributing to cloud microphysics studies is being assessed. First, the retrieval of the particle maximum diameter as a new parameter is described, followed by an explanation about the procedure of the determination of dominant particle shapes done in this study. The capabilities of the 2DVD are demonstrated by means of measurements performed in a pre-alpine region of Switzerland which show that the instrument could detect signatures from cloud seeding experiments. Moreover, ice crystal number concentration and, for the first time, mean maximum diameter derived from the remote-sensing based LIRAS-ice retrieval are evaluated against ground-based in-situ measurements from the 2DVD. In the frame of a case study from the Multidisciplinary drifting Observatory for the Study of Arctic Climate (MOSAiC) expedition in 2019, LIRAS-ice and 2DVD data were found to agree well during suitable meteorological conditions that allow to relate surface observations to the higher-level remote sensing measurements. This study shows that the maximum diameter from 2DVD observations enhances the instrument's capability to contribute to precipitation-related research.
- Article
(9833 KB) - Full-text XML
- BibTeX
- EndNote


Cloud-microphysical processes remain a present-day object of investigation in atmospheric research (IPCC, 2021). The formation, development, and dissipation of clouds is influenced by the presence of aerosol particles (aerosol-cloud-interaction, ACI; Lohmann and Feichter, 2005; Forster et al., 2021), especially at mid-latitudes (Kanitz et al., 2011; Radenz et al., 2021). In air masses which are saturated with respect to liquid water, aerosol particles may act as cloud condensation nuclei inducing cloud droplet formation. For temperatures below 0 °C, some types of aerosol particles may additionally act as ice-nucleating particles initiating heterogeneous ice formation if the air is saturated with respect to ice (Hoose and Möhler, 2012; Kanji et al., 2017). Below approximately −37 °C, this process may be accompanied by homogeneous freezing which does not require solid-state aerosol particles as nuclei (Kärcher, 2002). However, cloud formation does not only depend on aerosol particles but also on dynamics and interactions between the water species themselves (Guichard and Couvreux, 2017). Particularly in mixed-phase-clouds (MPC), a variety of different hydrometeor types may occur simultaneously and interact with each other (Morrison et al., 2011). The Wegener-Bergeron-Findeisen process (Wegener, 1911; Bergeron, 1935; Findeisen, 1938) is one example for such interactions and dominates cloud evolution in the mid-latitudes (Boucher et al., 2013). This process allows ice crystals to grow at the expense of liquid water. Therefore, MPC are not in a thermodynamic equilibrium and to remain persistent, certain conditions are required (Morrison et al., 2011). For the investigation of cloud processes, the shape of ice crystals may hold important information about the processes involved in the microphysical evolution of the precipitation (Pasquier et al., 2023). When pristine ice crystals are growing, the resulting shape and size depend on the temperature and the supersaturation of the ambient air with respect to ice (Bailey and Hallett, 2009). Therefore, the shape and size of ice crystals are important quantities for the investigation of cloud microphysical processes and thus need to be detected.
Clouds and ACI can be investigated in the field, for example, with aimed remote-sensing measurements. For this purpose, a synergy of various instruments with different advantages is often necessary to investigate the current atmospheric conditions and to detect atmospheric processes more accurately. On the one hand, cloud radars are suitable for observing precipitation and clouds containing ice particles (Kollias et al., 2007). Aerosol particles and small liquid-water cloud droplets, on the other hand, can be better observed with lidar (Jimenez et al., 2020). Remote sensors with polarisation capability can help to further identify predominant particle types, because mainly the hydrometeor shape determines which fraction of the incoming polarised radiation is depolarised when scattered back towards the sensor (Myagkov et al., 2016). If instruments are operated that are able to measure Doppler velocities, vertical wind information may additionally help to understand the impact of dynamics on the cloud system. By means of retrieval techniques, cloud properties such as the ice crystal number concentration (ICNC; e.g. Bühl et al., 2019) or the dominant crystal shape (e.g. Myagkov et al., 2016) can be retrieved. To specifically investigate clouds and ACI under certain environmental conditions, an excellent opportunity is offered by cloud seeding experiments such as the ones conducted in the frame of the CLOUDLAB project led by ETH Zürich (Henneberger et al., 2023). By releasing aerosols into clouds, the cloud properties (i.e. concentrations of cloud water and cloud ice) are changed and this transformation can be observed with extensive remote-sensing and in-situ measurements.
In-situ measurements of ground precipitation can be very valuable for the investigation of cloud-microphysical processes for different reasons. On the one hand, they may deliver missing puzzle pieces for closure studies. On the other hand, they can be used to evaluate remote-sensing retrievals by comparing measured and retrieved or assumed quantities of precipitation properties like particle size distribution (PSD) or dominant particle shape. For precipitation research, a number of in-situ sensors which observe falling hydrometeors in at least two dimensions were used in recent studies. Examples include the Two-Dimensional Video Disdrometer (2DVD; Ansmann et al., 2025), the Precipitation Imaging Package (PIP; Vogl et al., 2022), the Multi-Angle Snowflake Camera (MASC; Leinonen et al., 2021), or the Video In Situ Snowfall Sensor (VISSS; Maahn et al., 2024). The 2DVD proved advantageous for campaign deployment, for example, due to the easy instrument setup and data analysis compared to other measurement systems. Although the device was originally designed to measure liquid-droplet properties (Kruger and Krajewski, 2002), 2DVD research focused especially during the last two decades on solid or mixed-phase precipitation. Studies were undertaken, for example, about more suitable matching algorithms (Hanesch, 1999; Huang et al., 2010; Grazioli et al., 2014; Bernauer et al., 2015; Helms et al., 2022) or automatized particle classification (Grazioli et al., 2014; Gavrilov et al., 2015; Lee et al., 2015; Bernauer et al., 2016). The determination of dominant precipitation particle type and shape is in particular helpful for comparing and evaluating remote-sensing-based retrievals as well as model simulations of cloud and precipitation parameters (Trömel et al., 2021). A comprehensive 2DVD-related literature review can be found in a recent Master's thesis (Gaudek, 2024). One shortcoming of the 2DVD is that the manufacturers software only delivers the volume-equivalent diameter and the volume itself as size-related variables. However, the particle size has been defined in the past in very different ways. Just in 2DVD studies, various definitions of the diameter such as equivalent sphere diameter (e.g. Lee et al., 2015), maximum diameter (“maximum value of width and height seen in both cameras”; Bernauer et al., 2015), or area diameter (defined by the area with smallest circumscribed ellipse; Huang et al., 2015) were used. From a physical perspective, the maximum dimension is the distance between the two outermost points of the particle. This problem will be tackled in this work by introducing the maximum Feret diameter dmax as a new variable that can be calculated from 2DVD measurement data. Moreover, the contribution of the 2DVD to the investigation of cloud microphysical processes is evaluated in this work in different ways.
In this paper, data from two measurement campaigns are used. The campaigns and operated instruments are presented in Sect. 2 with a special focus on the 2DVD. In Sect. 3, dmax as a new 2DVD variable is introduced, the 2DVD's ability to distinguish different particle shapes is tested, and the remote-sensing retrieval LIRAS-ice (LIdar RAdar Synergy – retrieval of ICE microphysical properties) is explained. In Sect. 4, results of the 2DVD calibration, outcomes of the distinction of different particle shapes by the 2DVD, measurement results from cloud seeding experiments, and findings from the combined LIRAS-ice retrieval and 2DVD measurements are presented. The results are discussed in Sect. 5. A summary and conclusions are given in Sect. 6.
2.1 Cloudlab and PolarCAP
One part of the data which are analysed in this work was collected during a measurement campaign at Rapier-Platz near Eriswil, Switzerland (47.0705° N, 7.8729° E, 921 m above sea level) from December 2022 to March 2023. Rapier-Platz is located in the pre-alpine Swiss middleland between the Jura and the Alps mountains. One typical meteorological scenario during wintertime is characterised by below-zero temperatures and the presence of steady winds from north-east called Bise (Wanner and Furger, 1990), often accompanied by supercooled stratus clouds which are suitable as natural cloud laboratory. The observations were conducted within the framework of the two collaborating research projects Cloudlab of ETH Zürich (Henneberger et al., 2023) and PolarCAP (Polarimetric Radar Signatures of Ice Formation Pathways from Controlled Aerosol Perturbations; Ohneiser et al., 2025) of Leibniz Institute for Tropospheric Research (TROPOS). Cloudlab in general aims at a better understanding of cloud physics, the investigation of stratus formation and dissipation, and the validation and improvement of the cloud microphysics scheme of the icosahedric nonhydrostatic (ICON) weather forecast model (Zängl et al., 2014; Omanovic et al., 2024, 2025). In order to achieve these goals, a variety of field measurements, laboratory experiments, and modelling studies were conducted. More specifically, seeding experiments in mixed-phase stratus clouds by means of uncrewed aerial vehicles (Miller et al., 2024a), accompanied by remote sensing and in-situ observations provided new insights in cloud microphysical processes (Miller et al., 2024b; Ramelli et al., 2024; Fuchs et al., 2025). Those observations were complemented by extensive, mainly remote-sensing-based measurements with the Leipzig Aerosol and Cloud Remote Observations System (LACROS; Bühl et al., 2013; Myagkov et al., 2016; Radenz et al., 2021; Teisseire et al., 2024; Ohneiser et al., 2025) in the frame of PolarCAP. Figure 1 shows the setup of LACROS during the Cloudlab campaign. An overview of all LACROS instruments which are relevant for this study is given in Table 1. Besides the support of Cloudlab with field observations and expertise, the PolarCAP aimed on the investigation of MPC development as well as the evaluation of MPC retrievals based on remote sensing. For the characterisation of MPCs, cloud-Doppler radar and (Doppler) lidar techniques were applied and Cloudlab in-situ measurements and seeding experiments were used. Moreover, simulations with numerical cloud-resolving models were conducted. Due to the variety of instruments, the measurement location and its duration, the presented field campaign offered a unique opportunity to compare precipitation measurements of several remote sensing and in-situ instruments. In particular, the performance of the 2DVD under different conditions was evaluated in this work. Simultaneous measurements with the holographic in-situ sonde HOLIMO of ETH Zürich (Sect. 2.4) and remote-sensing instruments such as the 35 and 94 GHz cloud Doppler radar contribute to the 2DVD studies.
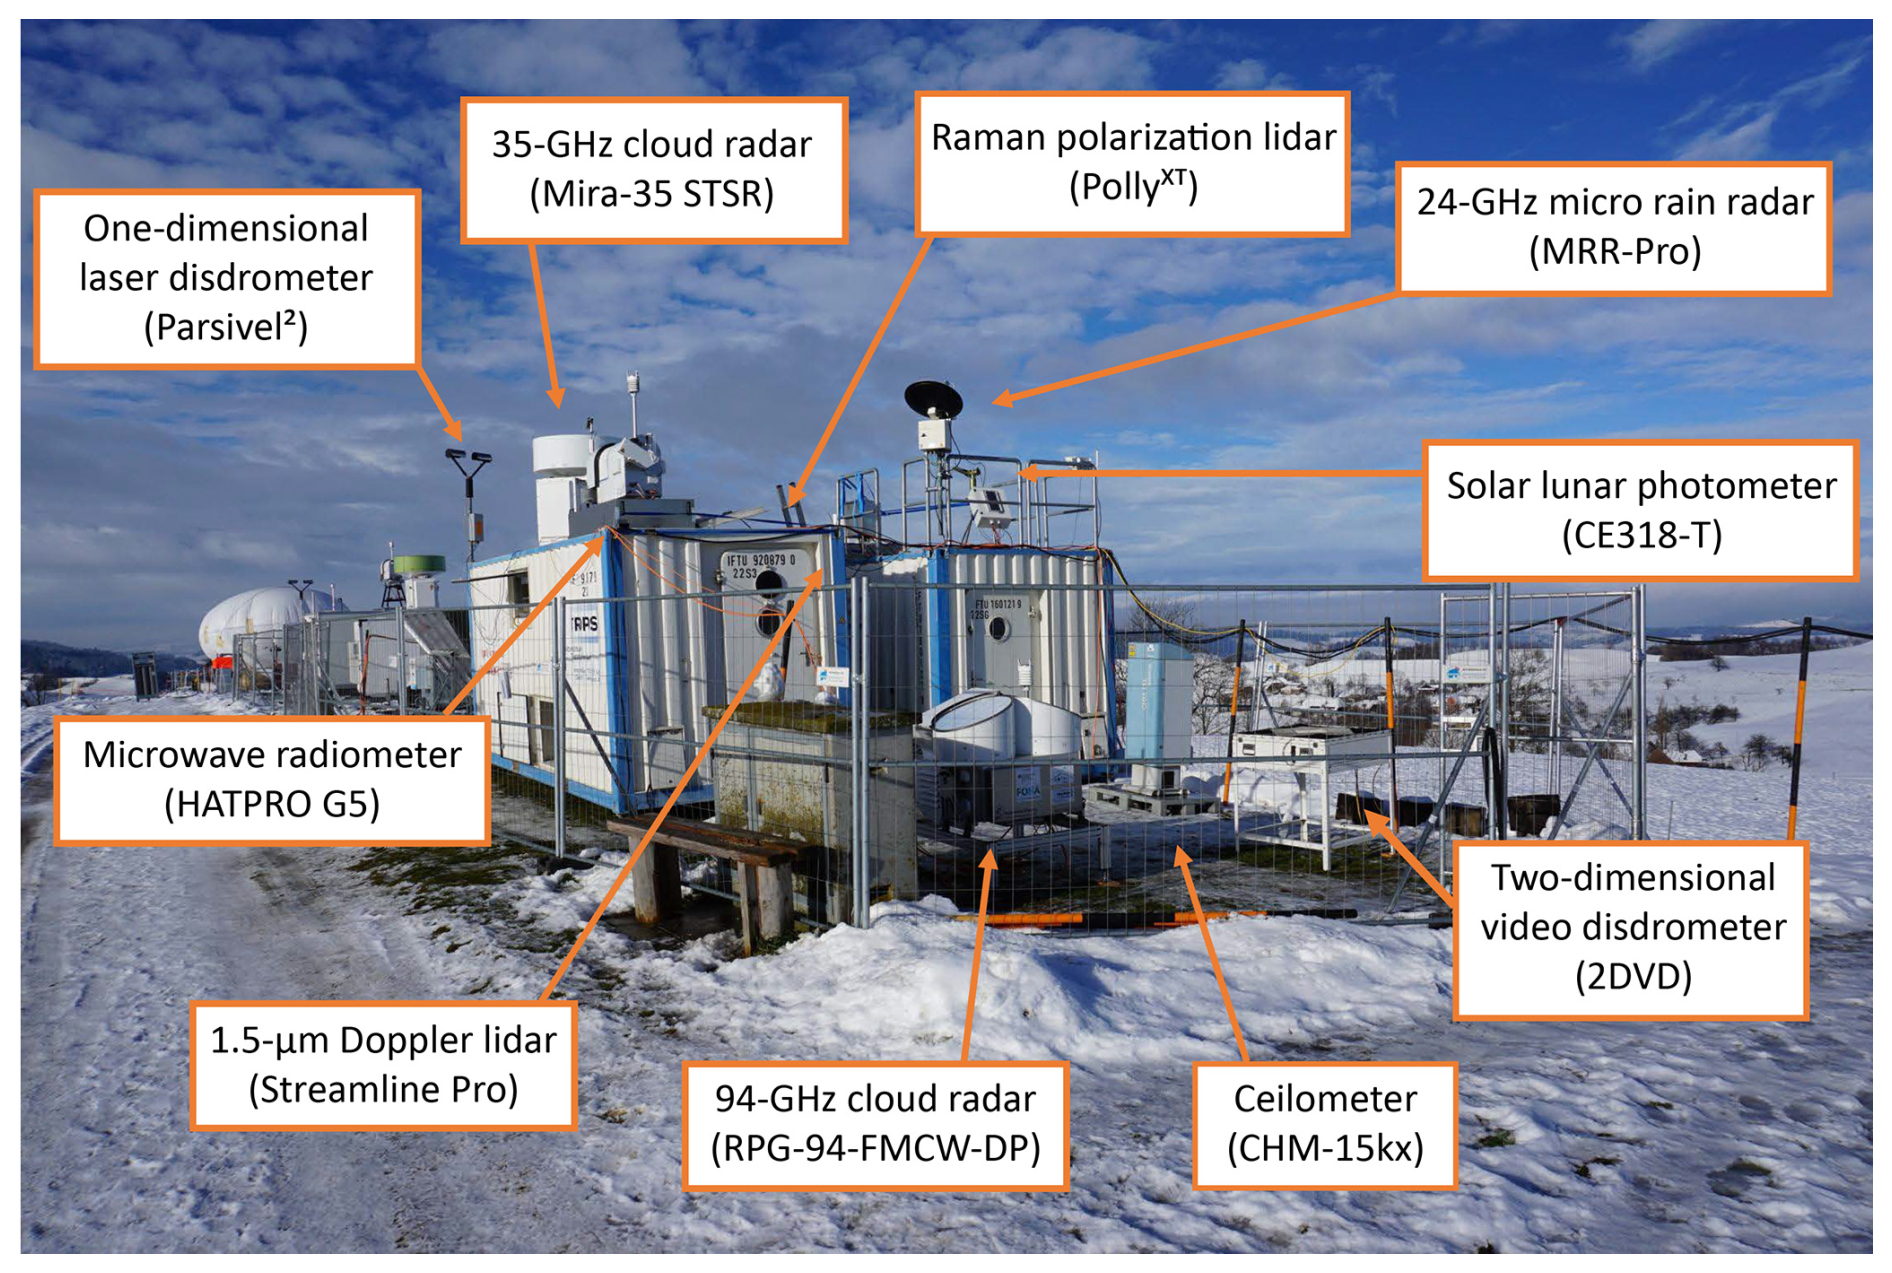
Figure 1Setup of LACROS at Rapier-Platz, Switzerland, including instrument designations. Further instruments of ETH Zürich and METEK GmbH can be seen on the left in the background.
2.2 MOSAiC
For the results presented in Sect. 4.4, 2DVD and remote sensing data from the Multidisciplinary drifting Observatory for the Study of Arctic Climate (MOSAiC) expedition (Shupe et al., 2020, 2022) were used. During the campaign, which took place from September 2019 until October 2020, the German research vessel Polarstern drifted, for the most time frozen in the sea ice, for the whole winter period in the high Arctic to enable the investigation of the central Arctic as a hotspot of global climate change. Onboard was the meteorological mobile research platform OCEANET (Griesche et al., 2020; Engelmann et al., 2021; Ohneiser et al., 2021; Jimenez et al., 2025), which, as LACROS, housed a Raman lidar PollyXT as well as the 2DVD. Moreover, a 35 GHz Doppler cloud radar (Ka-band ARM Zenith Radar, KAZR) was deployed next to OCEANET on the Atmospheric Radiation Measurement (ARM) mobile facility 1 (AMF-1) of the US Department of Energy (ARM, 2025) aboard Polarstern. Data of those instruments were used for the case study presented in Sect. 4.4. On 10 November 2019, for which the measurement data have been analysed, Polarstern was approximately located at 85.8° N, 116.1° E.
Table 1Overview of the instrumentation which is relevant for this study. The superscripts indicate the platform of each instrument and therefore its measurement location.
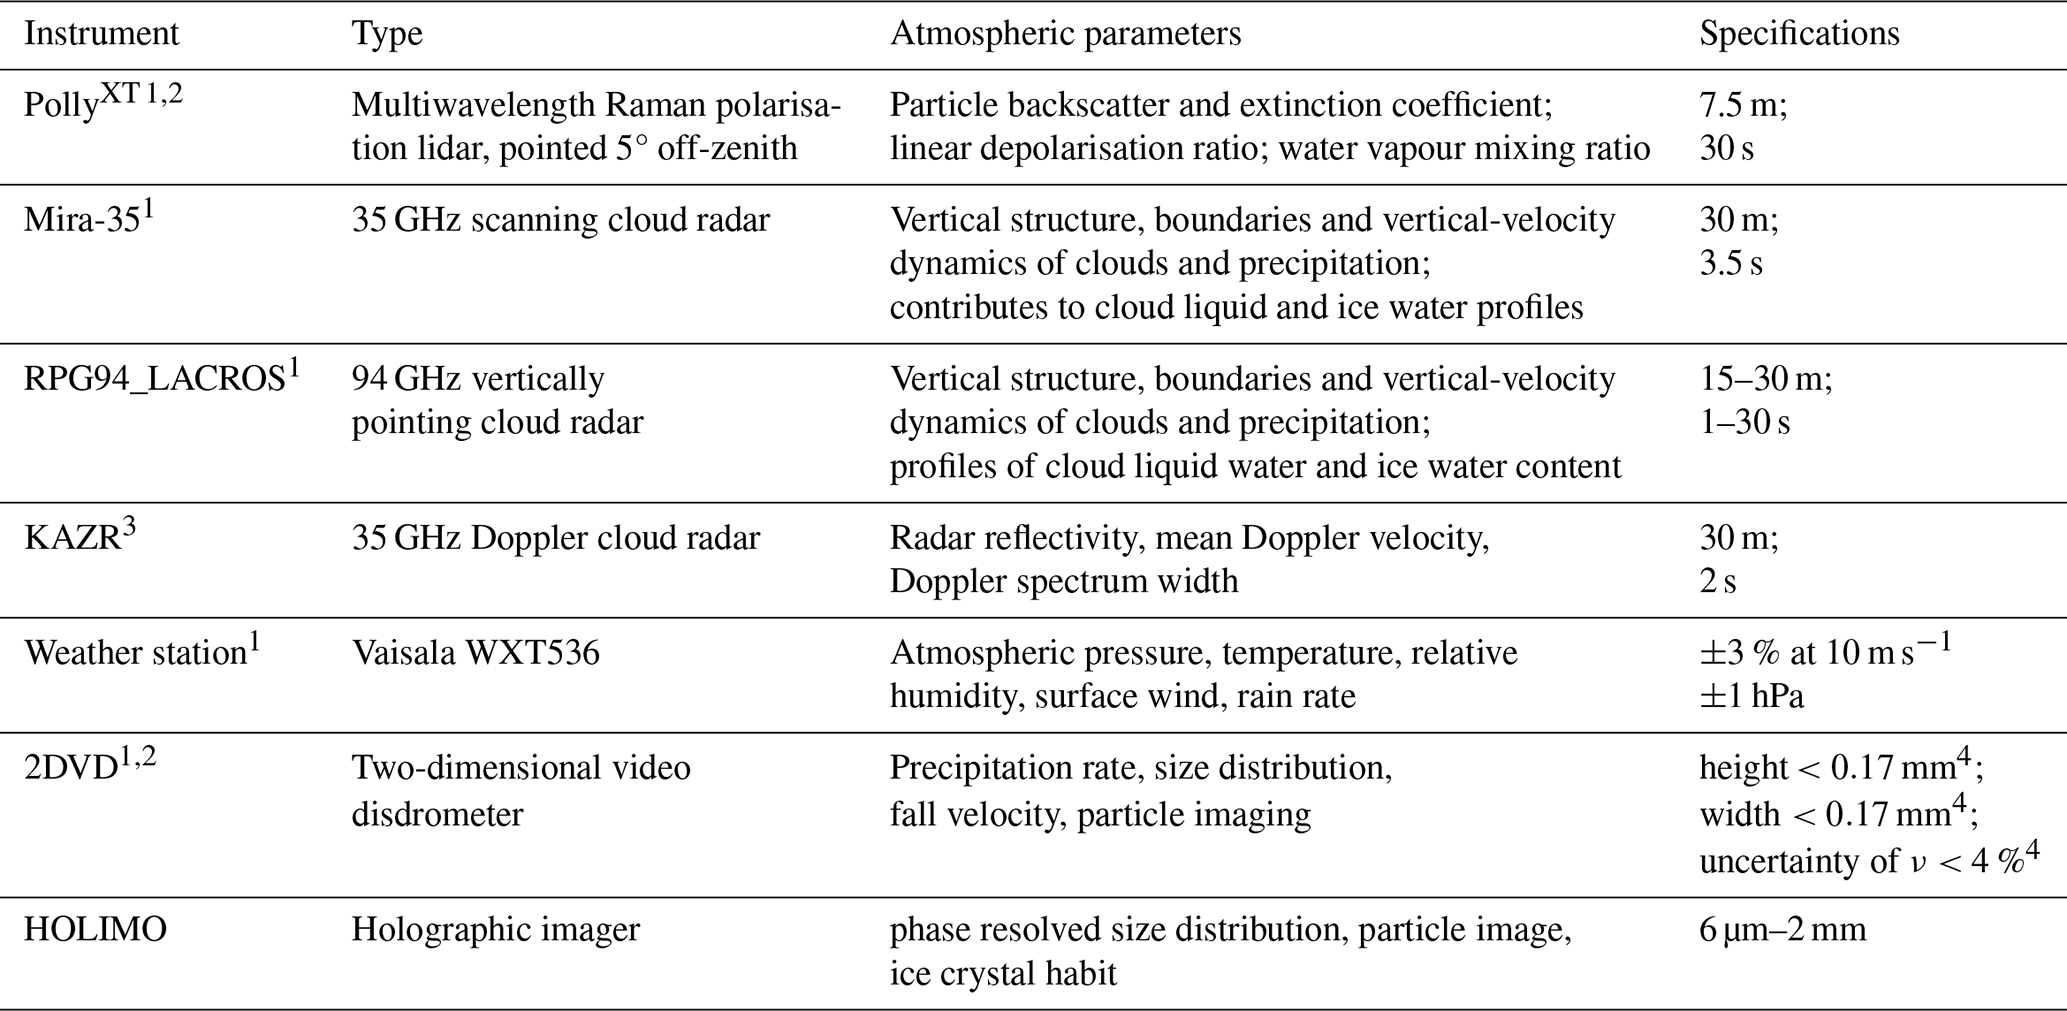
The instruments were either part of the mobile platform LACROS 1, OCEANET 2, or AMF-1 3, except for the holographic imager HOLIMO (Ramelli et al., 2020) which was deployed separately by ETH Zürich (see Sect. 2.4). 4 at ν<10 m s−1.
2.3 Two-dimensional video disdrometer (2DVD)
The 2DVD is a ground-based precipitation gauge which detects single precipitation particles within a certain measuring area. Originally designed to measure rain drop size distributions, the first instruments of this kind operated since 1996 (Schönhuber et al., 2007). The investigation of solid hydrometeors with such devices has been subject of research in recent years (e.g. Bernauer et al., 2015; Raupach et al., 2017; Zhang et al., 2021). The instrument which was operated during PolarCAP was developed by Joanneum Research, Graz, Austria. Table 1 shows the specifications of the 2DVD. It should be mentioned that the horizontal wind measured by the weather station mounted on the HATPRO G5 on the container roof during PolarCAP/Cloudlab, and by the ultrasonic anemometer positioned next to the 2DVD during MOSAiC, did not exceed 10 m s−1 during any 2DVD measurements presented in this work, unless otherwise stated.
2.3.1 Measurement principle and data processing
The schematic setup of the 2DVD is shown in Fig. 3. Two high-power lamps (halogen or LED) each continuously emit light which is reflected by a mirror onto a Fresnel lens. There, the light is diverged and travels through a slit plate so that an illuminated horizontal plane is created by each lamp. Those two planes have a height difference of around 6 mm. The area where the two sheets overlap is the so-called virtual measuring area and has a size of about 10 cm × 10 cm. After travelling through another slit plate, the light is then reflected by another mirror towards the respective line camera.
Regarding precipitation measurements, the instrument design is advantageous for further reasons. The virtual measuring area is much smaller than the opening of the housing (25 cm × 25 cm) so that possible splashes of droplets hitting the housing will have minimal impact on the measurements. Moreover, the lid is heated which avoids snow accumulation on the instrument that could otherwise interfere with measurements.
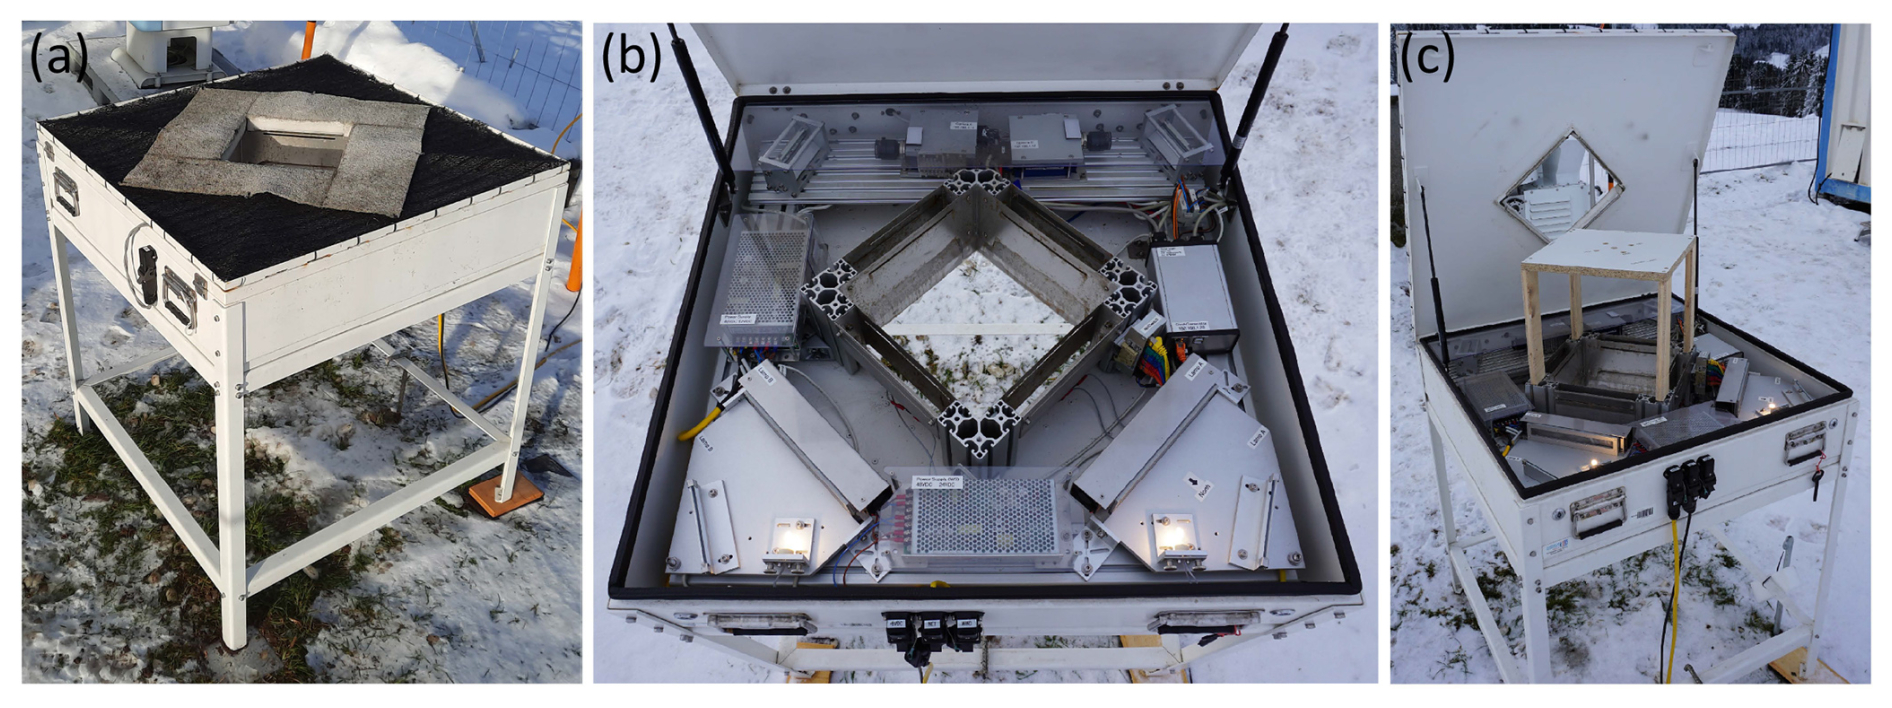
Figure 2The 2DVD at the measurement site (a) in operating mode, (b) with open lid, and (c) during the calibration with calibration pattern.
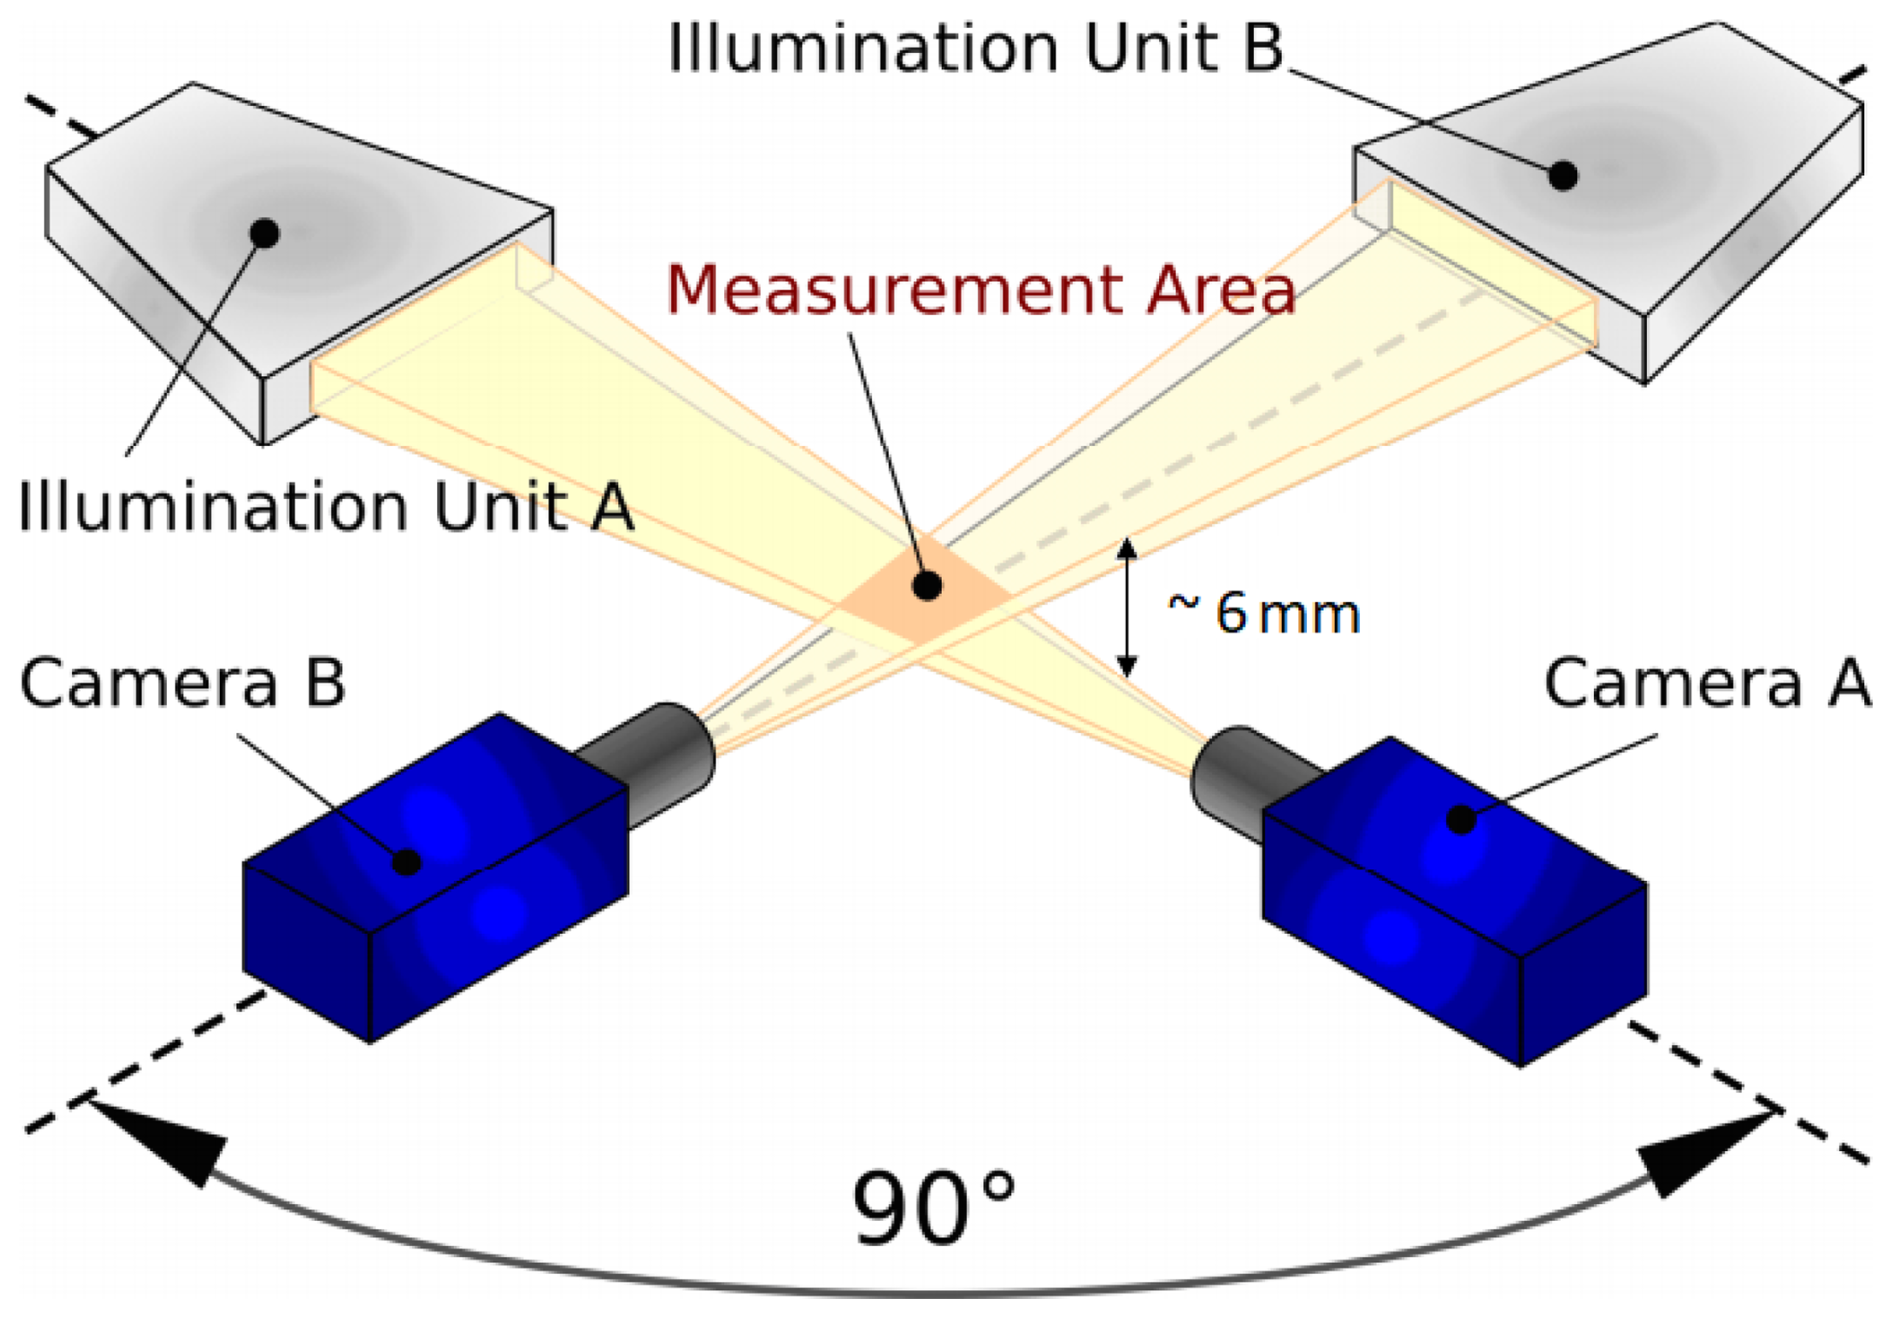
Figure 3Measurement principle of the 2DVD. The illuminated planes are horizontally aligned with a vertical distance of around 6 mm while the respective camera perspectives differ by 90°. The measuring area is around 10 cm × 10 cm in size (adapted from Schönhuber et al., 2016).
If a hydrometeor falls through the virtual measuring area, its shape automatically gets reconstructed. In a first step, this is done for the video signal of each camera separately. The photo detectors of each line camera generate an electronic signal at incident light. This signal is continuously compared against a threshold level. If the measured value is below this threshold, the corresponding pixel is recognised as shaded. By assembling the shaded pixels of consecutive time steps, a two-dimensional particle shape is finally reconstructed.
In a second step, a matching algorithm is applied to merge the information for the same particle from both cameras. For this purpose, there are several criteria that a pair of images must fulfil. A time period is defined in which a particle needs to reach the lower light plane after it entered the upper light plane of the instrument. This time frame should be adapted to the relationship between particle size and fall velocity. In case of liquid droplets, this relation is well-known (e.g. Atlas et al., 1973). For solid and mixed-phase hydrometeors, terminal velocities of particles of the same size can vary much more, depending on the particle type, shape, and, if applicable, the degree of riming (Locatelli and Hobbs, 1974; Barthazy and Schefold, 2006). Thus, the time period to fall from the upper to the lower light plane should be set more broad in case of solid or mixed-phase precipitation. Moreover, droplets show regular symmetries which can be assumed by the matching algorithm. Solid particles, on the other hand, may appear with much more complex shapes. Matching algorithms for solid or mixed-phase precipitation have been continuously developed during the last years (Hanesch, 1999; Huang et al., 2010; Grazioli et al., 2014; Bernauer et al., 2015). For those reasons, the 2DVD's manufacturer provides two different matching algorithms for liquid and solid or mixed-phase precipitation, measurements presented in this work have been processed with the algorithm for solid and mixed-phase precipitation. After the application of such an algorithm, single hydrometeors are identified and information about their properties are retrieved (see Sect. 2.3.3). Particles that are only seen in one camera or whose information of both cameras could not be merged are not further processed.
2.3.2 Calibration procedure
In order to calibrate the 2DVD, the following three main steps have to be performed. In a first step, the video levels of the live signals need to be adjusted so that the signal of each pixel is between two threshold values. The signal adjustment is done by aligning the optical elements of the 2DVD such as the lamps and mirrors. Once the signals are within the right intensity range, the distance of the two light planes needs to be measured precisely in a second step. For this purpose, steel spheres with a diameter of 10 mm are dropped through each hole of a calibration pattern (Fig. 2c). With this measurement as an input, a programme then calculates the plane distance for every corner of the virtual measuring area. The resulting values need to be adjusted in a configuration file before further measurements are taken. Eventually, correction factors included in the configuration file need to be evaluated. Therefore, a set of calibration steel spheres of 10 different diameters ranging from 0.5 to 10 mm are part of the 2DVD equipment. Ideally, more than 100 spheres of each diameter must be dropped by hand through the virtual measuring area. If the measured diameters are in good agreement with the given diameters of the spheres, the calibration is finished. If the agreement is poor over a series of repetitions of the calibration, the manufacturer of the 2DVD, Joanneum Research, can provide correction factors adapted to the taken measurements.
2.3.3 Standard 2DVD deliverables
By means of software which was delivered from the 2DVDs manufacturer, a set of parameters is determined for each single hydrometeor:
- a.
The equivalent spherical diameter deq (mm) equals the diameter of a sphere with the same volume as the respective hydrometeor.
- b.
The vertical velocity ν (m s−1) is determined by the time required by the hydrometeor to fall from the upper to the lower light sheet.
- c.
The particle volume V (mm3) is calculated by splitting the hydrometeor into horizontal slices whereas each slice is assumed to have an area of an ellipse and the height of one line. V is the sum of all slice volumes (Kruger and Krajewski, 2002).
- d.
The effective measuring area Aeff (mm2) is defined as the part of the virtual measuring area in which a hydrometeor with a certain size could have been detected. Between the detected particle and the borders of the virtual measuring area, there must be at least one non-shadowed pixel which reduces Aeff the more the larger the particle is.
- e.
The oblateness O (without unit) is defined as the ratio of particle height and particle width. The manufacturers software calculates O from information of both cameras A and B as follows:
widthA and widthB represent the width of the widest scan line of the respective camera (Kruger and Krajewski, 2002). O is an important shape parameter which can be helpful for the detection of different ice crystal shapes. However, for solid particles, the applied method to calculate O can be highly error-prone, especially at significant horizontal winds which may let falling hydrometeors appear skewed in the camera images.
2.3.4 Precipitation properties
From the parameters of single particles, precipitation properties can be calculated. The following features were used for precipitation characterisation in this work:
- a.
Particle number concentration
The particle number concentration (N) describes the number of detected hydrometeors per unit of air volume:
with M as number of particles during a time period Δt (s) and Aeff,j (mm2) and νj (m s−1) as effective measuring area and vertical velocity, respectively, of particle j.
- b.
Precipitation rate R
The 2DVD is an advantageous instrument to determine precipitation rates under different weather conditions because hydrometeors of various types can be well observed. R of the 2DVD for liquid precipitation is calculated as follows:
with the integration time interval Δt (s) and the effective measuring area Aeff,j (mm2) and volume Vj (mm3) of each particle j. In case of solid precipitation, the liquid equivalent volume Veq,j of particles must be taken into account for the calculation of R. For this purpose, the particle bulk density ρs of ice crystals needs to be determined as the actual particle volume largely prone to be overestimated by Vj, especially for larger particles and complex crystal structures (Brandes et al., 2007). Zhang et al. (2021) experimentally derived the following formula which estimates ρs from the median equivolumetric diameter deq,0:
We additionally capped ρs at 0.917g cm−3, the density of ice. For Veq,j, this yields
with and eventually
The relation between deq,0 and ρs was also investigated in other studies (e.g. Brandes et al., 2007) with noticeably varying results and should therefore only be understood as an approximate number which helps to estimate R. In this study, deq,0 and thus ρs were calculated at one minute intervals for a sufficiently high resolution.
Precipitation can also be analysed by establishing time series of particle properties such as deq, V, O, or ν. For example, trends in precipitation evolution may become visible. Particularly with regard to the Cloudlab/PolarCAP campaign, cloud seeding signatures on the ground may be detected.
Moreover, the relation of variables mentioned in Sect. 2.3.3 to each other often indicates different particle types. Especially investigating the relationship between the diameter and oblateness O or the diameter and vertical velocity ν has proven to be particularly effective for precipitation analysis.
2.4 HOLIMO
The HOLographic Imager for Microscopic Objects (HOLIMO) is a holographic imager developed by ETH Zürich (Ramelli et al., 2021). With this instrument, cloud particles with diameters between 6 µm and around 2 mm within a well defined sample volume of 12 cm3 can be imaged two-dimensionally. From the observations, the size spectrum and concentrations of cloud particles as well as the water content of clouds can be calculated. Moreover, for observed solid hydrometeors, different particle types such as large rimed particles, columnar crystals, or irregular particles can be distinguished from each other (Zhang et al., 2024). HOLIMO can either be operated on the ground or attached to slowly moving aircraft, such as helikites or ropeways. The instrument is compatible with the tethered balloon system HoloBalloon (Ramelli et al., 2020) which operated during the PolarCAP/Cloudlab campaign. This system allows the in-situ measurement of vertical profiles up to 1 km above the ground which enables detailed cloud characterisation. Furthermore, it may observe the changes of cloud particle properties during seeding experiments. Ground-based HOLIMO measurements next to the 2DVD enable the complementary detection of particles below the 2DVD's minimum resolution.
3.1 Maximum Feret diameter from 2DVD observations
Because the hydrometeors detected by the 2DVD are observed from only two perspectives, the derivation of the longest extent of a particle is challenging. Whereas the 3D reconstruction of droplets detected by a 2DVD is meanwhile well investigated (Schönhuber et al., 2016; Zheng et al., 2023), a 3D reconstruction of ice crystals remains challenging, especially if they are complexly shaped. Instruments which have a higher spatial resolution and more than two cameras such as the MASC can reliably reconstruct solid precipitation particles much better (e.g. Kleinkort et al., 2017). For that reason we decided to refrain from a 3D reconstruction.
The longest distance between two points of a geometrical two-dimensional shape is defined as the Feret diameter. For each hydrometeor detected by the 2DVD, two images in the form of binary pixel information exist for the two camera perspectives. For each image, the Feret diameter is calculated and the larger of the two Feret diameters is defined as dmax in this study. The so called minimum Feret diameter (or minimum Feret width), on the other hand, describes the minimum distance between two parallel tangents that can be drawn around the outline of each 2D image of the particle. The smaller of the two Feret diameters (dmax,2), as well as the minimum Feret diameters from each perspective (dmin and dmin,2), are additional variables retrieved by a newly developed algorithm, which is briefly described below. The introduced variables are illustrated on an exemplary dendrite in Fig. 4.
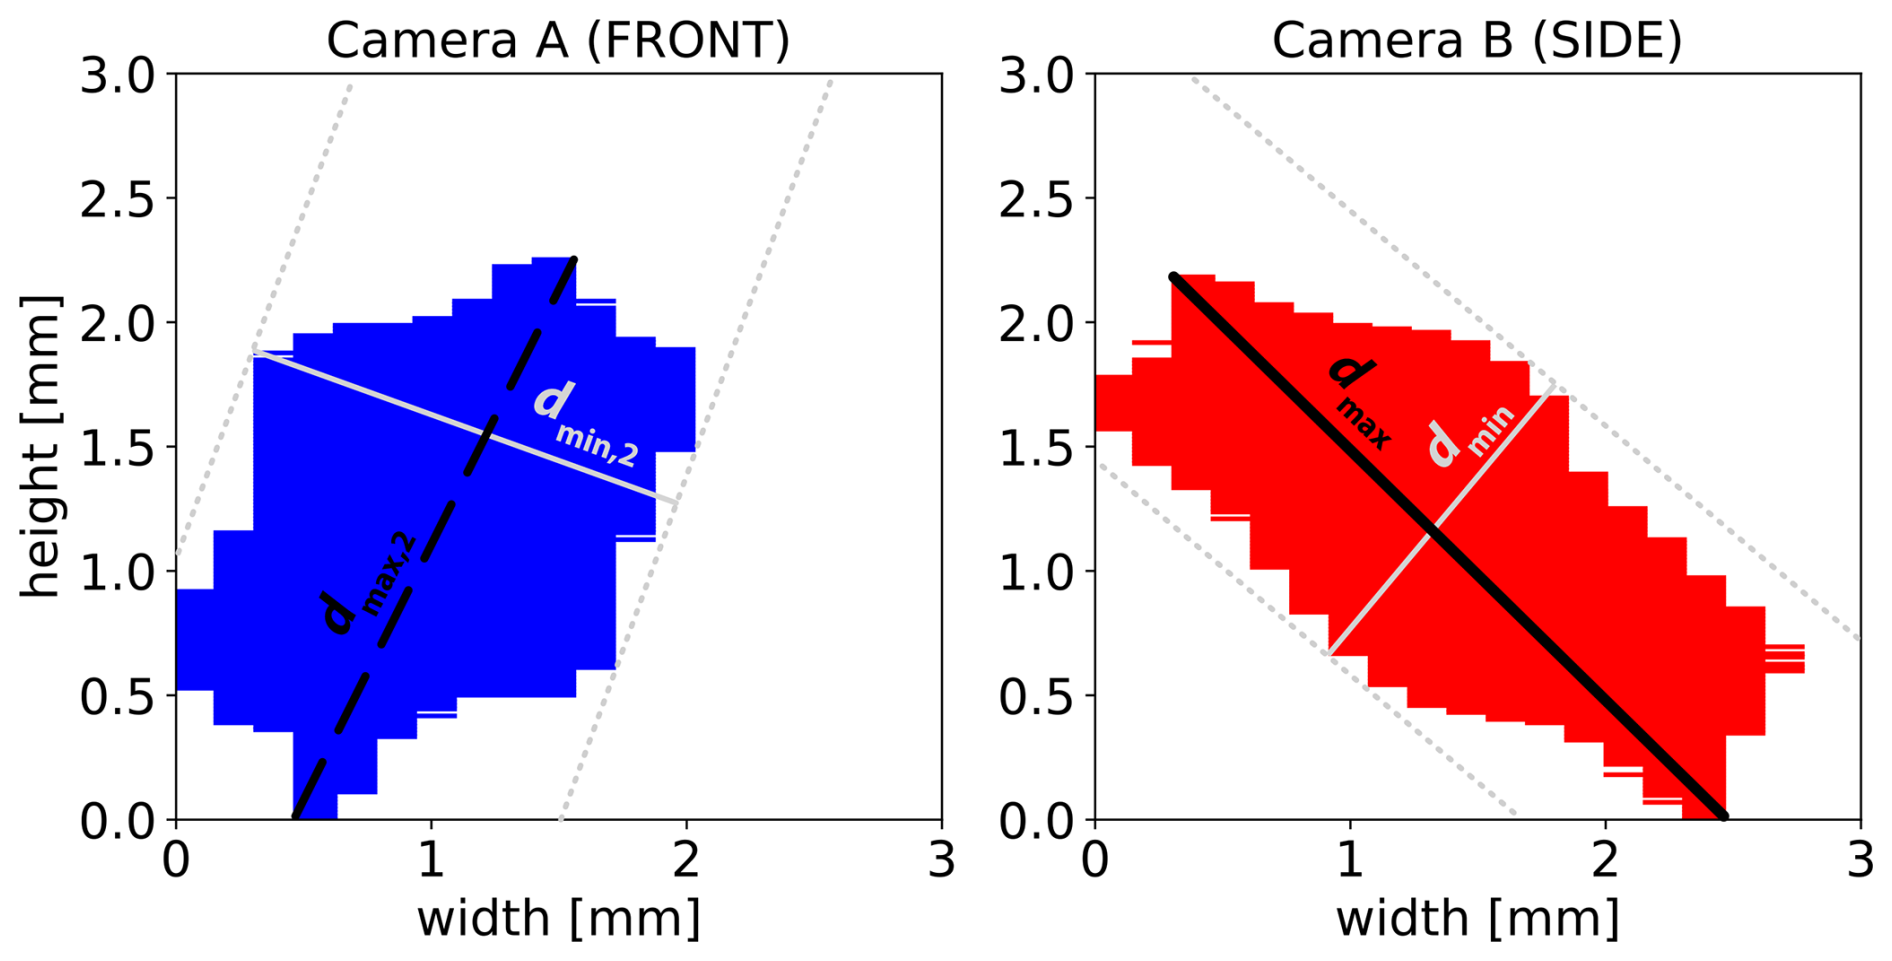
Figure 4Visualisation of dmax (thick black line) for a dendrite-like particle. Thinner lines indicate further retrievable variables. For the particle visualisation, an own programme was written (Gaudek and Klamt, 2025).
Due to varying positions in the measurement area and varying fall velocities, the pixel width and height can vary across hydrometeors but are constant within each binary image. The pixel width is usually many times larger than the pixel height. For the calculation of the Feret diameter for each camera perspective, an original two-dimensional binary pixel array is first obtained from an ASO (ASCII Standard Output) file generated by software of the 2DVD's manufacturer. From this input pixel array, a new binary array is created in which the pixel height remains unchanged, while the new pixel width equals the pixel height, resulting in square pixels. These square pixels allow an efficient calculation of the Feret diameter using the Python feret module (Feret, 2022).
The accuracy of dmax mainly depends on the particle orientation relative to the camera perspectives. The largest possible difference between dmax and the actual maximum extent of a particle occurs when a very thin and narrow particle such as a needle is aligned horizontally and in a way that the maximum diameter is oriented at 45° to both camera angles. Then the particle is seen from both cameras with a width w and the true maximum particle extent d equals . Thus, the accuracy of dmax can be calculated by which equals 70.7 %. Since the 2DVD can fully capture the particle height while particle orientation and shape vary, the accuracy of dmax is typically higher than this. Another uncertainty source is the fact that camera pixels do not need to be fully blocked by the hydrometeor in order to be defined as “shaded”, only the voltage thresholds need to be met. This means that partially blocked pixels are often defined as “shaded” but as the Feret diameter method accounts for the outermost pixel edge, this effect can lead to an overestimation of dmax. However, the underestimation due to particle orientation relative to the camera perspectives and the overestimation due to partially covered pixels reduce the discrepancy of dmax from the true maximum extent. Due to the dependency on particle shape, orientation, and horizontal wind speed, the quantification of a potential mean accuracy of dmax is challenging.
dmax has some advantages over the previously used deq. On the one hand, the maximum diameter of precipitating hydrometeors can be retrieved from other in-situ instruments such as the Video In-Situ Snowfall Sensor (VISSS, Maahn et al., 2024) which would allow a better instrument comparability. But also remote-sensing-based retrievals (e.g. Bühl et al., 2019) allow the determination of particle diameters, for which reason dmax is better suited when it comes to closure studies, for example. The combination of maximum and minimum Feret diameter would further allow the definition of a new aspect-ratio-like particle property which is not as sensitive to the canting angle as O (see Sect. 2.3.3).
3.2 Identification of dominant particle shapes in 2DVD data
In this work, dominant ice crystal shapes were identified by investigating relationships between dmax and ν or O. In theory, column-like particles should have a higher ν than plate-like particles or dendrites of the same maximum dimension, for example (Mitchell, 1996). However, Bühl (2015) showed with the experimental-based method of Heymsfield and Westbrook (2010) that the differences in ν of particles in the categories “rimed long columns”, “aggregates mixture”, and “hexagonal plates” in the size range of 1–2 mm do not exceed 0.1 m s−1. Especially the degree of riming as well as small-scale wind effects might impact the retrieved ν from the 2DVD. For some particle types such as columns, plate like crystals, or dendrites it is also challenging to assign specific ranges for typical O values as wobbling and horizontal winds affect the orientation in the 2DVD measurement area. Nevertheless, different particle types can usually be identified as separate clusters in the corresponding diagrams. The examination of recreated two-dimensional binary images of randomly selected particles from each cluster eventually reveals the respective dominant particle type. However, this method is limited to hydrometeors which appear as more than only five to six horizontal pixels in the 2DVD data. In case of very small particles which diameters below 1 mm, clusters might still be identifiable but the respective shape cannot be examined unequivocally. Former studies have shown, that automated particle typing from 2DVD data can work well, depending on the given particle classes (Grazioli et al., 2014; Gavrilov et al., 2015; Lee et al., 2015; Bernauer et al., 2016).
3.3 Ice crystal number concentration and size from remote sensing
Examining the ice crystal size and number concentration (ICNC) in clouds or for precipitating particles without in-situ measurements is challenging. However, Bühl et al. (2019) demonstrated that the ICNC can be derived by means of synergistic observations from lidar and cloud Doppler radar. For the development of their retrieval, Bühl et al. (2019) used data of a PollyXT Raman lidar, a 35 GHz cloud radar, and a radar wind profiler (RWP), albeit the usage of the RWP is optional. The basic principle of this method can be explained as follows. For each height bin, the Doppler spectrum of radar reflectivity factor is determined from the cloud radar measurements while the optical extinction coefficient of the ice particles is derived from the lidar observations. In the next step, an algorithm retrieves the ice crystal size distribution which best resembles the observed radar Doppler spectrum of radar reflectivity factor and lidar optical extinction coefficient. Thus, an important constraint arises from the dominant crystal shape, which determines the mass- and area-size relationships required to compute the radar and lidar properties. This dominant crystal shape has to be presumed in advance. The mean crystal size is derived from the radar/lidar ratio and by scaling the size distribution to the particle extinction coefficient, the ICNC can eventually be computed. As the described method makes use of lidar-radar-synergy for deriving ice particle properties, it is hereafter referred to as LIRAS-ice in this work.
For the successful application of LIRAS-ice, a number of meteorological and technical conditions must be met. First of all, both cloud radar and lidar measurements need to be available. The snow protection window of the lidar must not be significantly covered by snow as this would attenuate the laser beam and the backscattered radiation. Moreover, liquid droplets strongly attenuate the lidar backscatter signal and thus, the laser beam cannot sufficiently penetrate liquid or mixed-phase clouds. Therefore, no low clouds that contain liquid droplets should be present.
While it was already applied to long-term observations of mixed-phase and ice clouds (Jimenez et al., 2025), the LIRAS-ice approach has only partly been evaluated against in-situ observations (Ansmann et al., 2025). In this work, for the first time, retrieved mean maximum diameter and ICNC have both been compared with dmax and N from the 2DVD, respectively. The LIRAS-ice-retrieved maximum diameter is defined as the maximum distance between two points in the ice crystal from the zenith-pointing perspective and can therefore be directly compared to dmax from the 2DVD. For this study, the Raman lidar PollyXT and of the KAZR cloud radar which were operated during the MOSAiC campaign provide the observational basis (see Table 1). The vertical and temporal sampling intervals of the retrieved variables equal those of the processed cloud radar data which are approximately 30 m and 30 s, respectively. The determination of uncertainty for the retrieved ICNC is complex and based on a number of assumptions, for example, about particle type, size distribution and mass- or velocity-size relationships. Further uncertainties of Z and E additionally propagate into the final ICNC uncertainty. According to Jimenez et al. (2025), the ICNC uncertainty, considering lidar and radar measurement errors as well as model errors, is about a factor of 2–3.
For LIRAS-ice, the dominant shape observed by the 2DVD was used. Furthermore, the retrieval was executed for the same case with several other assumed shapes for a more comprehensive evaluation. The search for time periods which are suitable for conducting such case studies requires additional criteria besides those for a successful LIRAS-ice application. Only time periods were considered for which only one specific ice crystal shape could be identified by the 2DVD. Therefore, precipitation particles were required to be larger than a minimum dmax of approximately 1 mm, depending on the shape. For those reasons, the choice of suitable time periods was very much limited. One exemplary case study which best met the requirements is presented in this work.
4.1 Calibration of the 2DVD
The 2DVD was calibrated following the procedure described in Sect. 2.3.2. To obtain accurate results, data points which represent spheres which either cling together or which were only partly detected were filtered out. To evaluate dmax, the dataset of the measured calibration spheres was used and dmax, deq, and dc values were compared to the actual diameters of the steel spheres. The result of the calibration experiment is presented in Fig. 5. The 10 different size classes of the calibration spheres can be well identified. In case of spheres with diameters of 2 mm and larger, deq underestimated the true diameter by 0 %–3 %, dmax overestimated the true diameter by 3 %–5 %, and dc overestimated the true diameter by around 3 %. “Outliers” are visible at some sizes which likely result from the spheres with the largest horizontal motion. In general, the results are adequate and do not contradict the usage of the investigated variables for this study. As the difference between the arithmetic mean values of dmax and the true diameters are fluctuating between 3 %–5 %, we decided to not apply a specific correction factor to the further investigated 2DVD dmax data but to consider 5 % as uncertainty for the dmax retrieval.
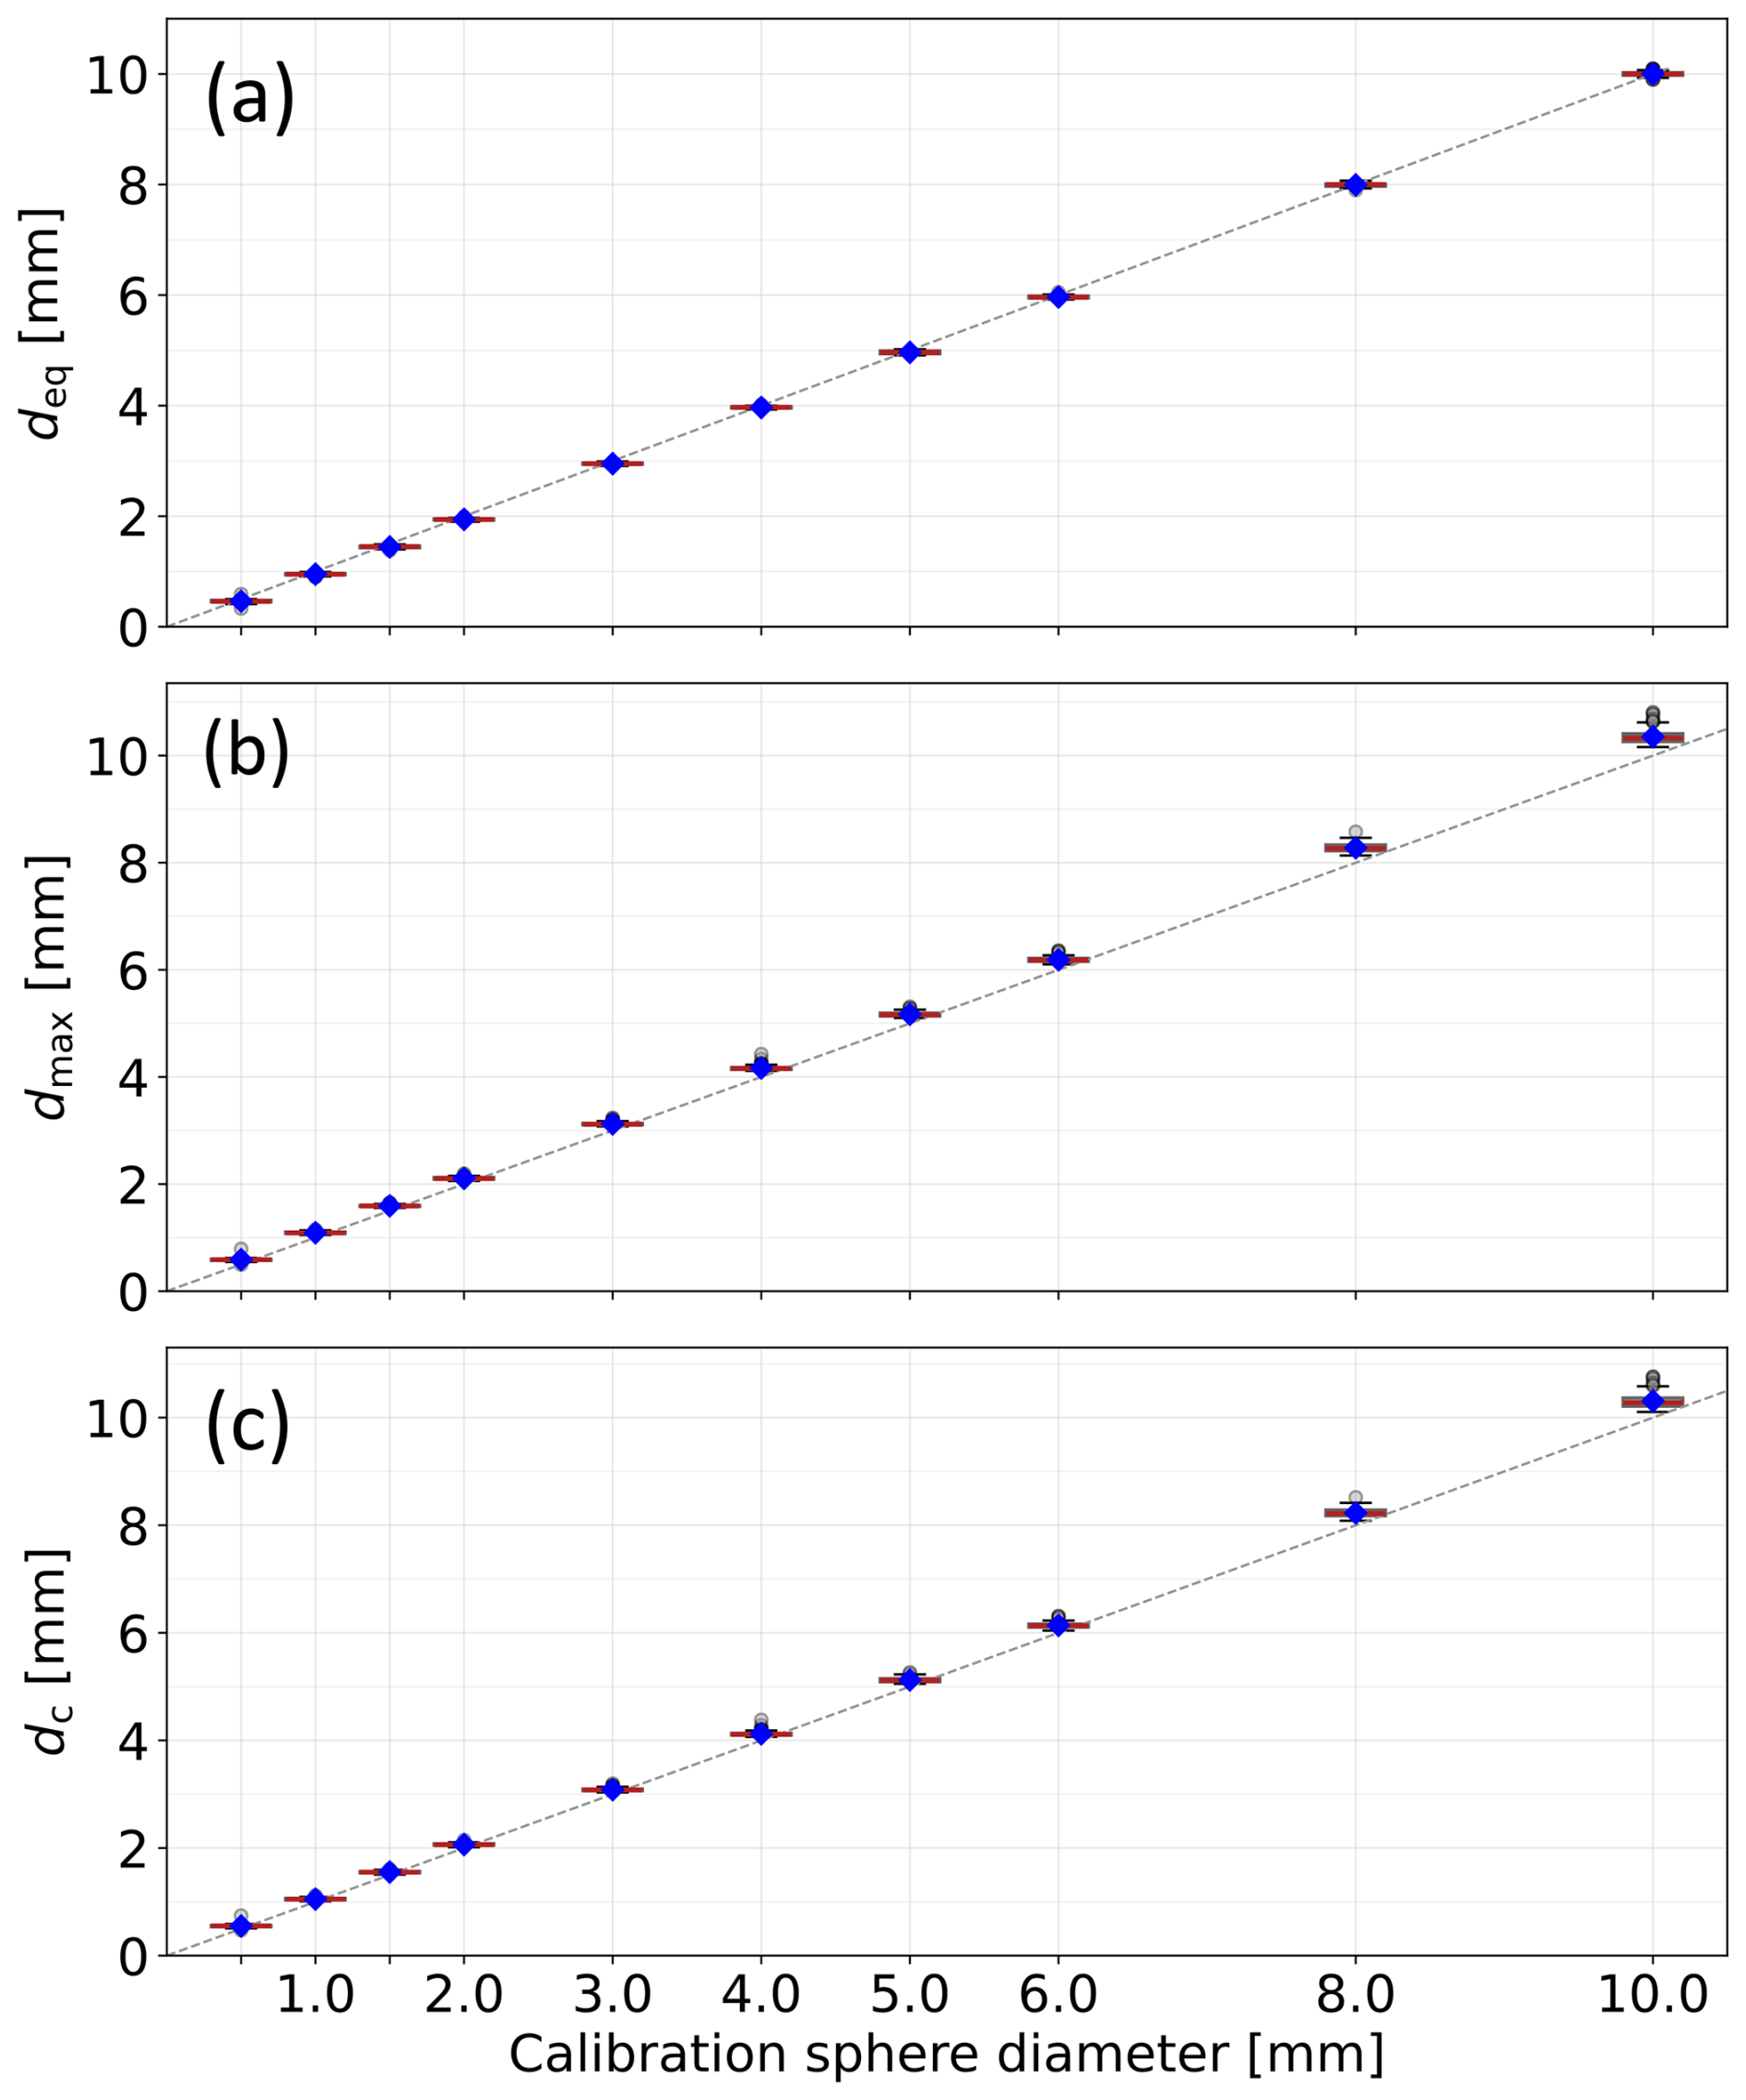
Figure 5Comparison of measured particle diameters with the calibration sphere diameters. The boxplots show distributions of (a) equivalent diameter deq, (b) maximum Feret diameter dmax, and (c) the circumscribing sphere diameter dc. The boxes indicate the 25th to 75th percentile, blue diamond markers show the mean values, the orange horizontal lines represent the arithmetic mean, and the dashed lines show the 1:1 relationship.
4.2 Detection of ice crystal shapes
On 17 January 2023 during the Cloudlab campaign in Eriswil, the holographic imager HOLIMO was operated on the ground next to the 2DVD at Rapier-Platz (Fig. 6). An occlusion front over the station led to a stratiform precipitation system, which is visible in the time–height cross-section of the radar reflectivity (Fig. 7) with ground temperatures clearly below 0 °C. Solid precipitation with different ice crystal shapes at different times was observed by eye and recorded in an educated-eye protocol. Between 14:07 and 14:11 UTC, a “large number of dendrites” was reported. For that time period, 2DVD and HOLIMO data are analysed below.
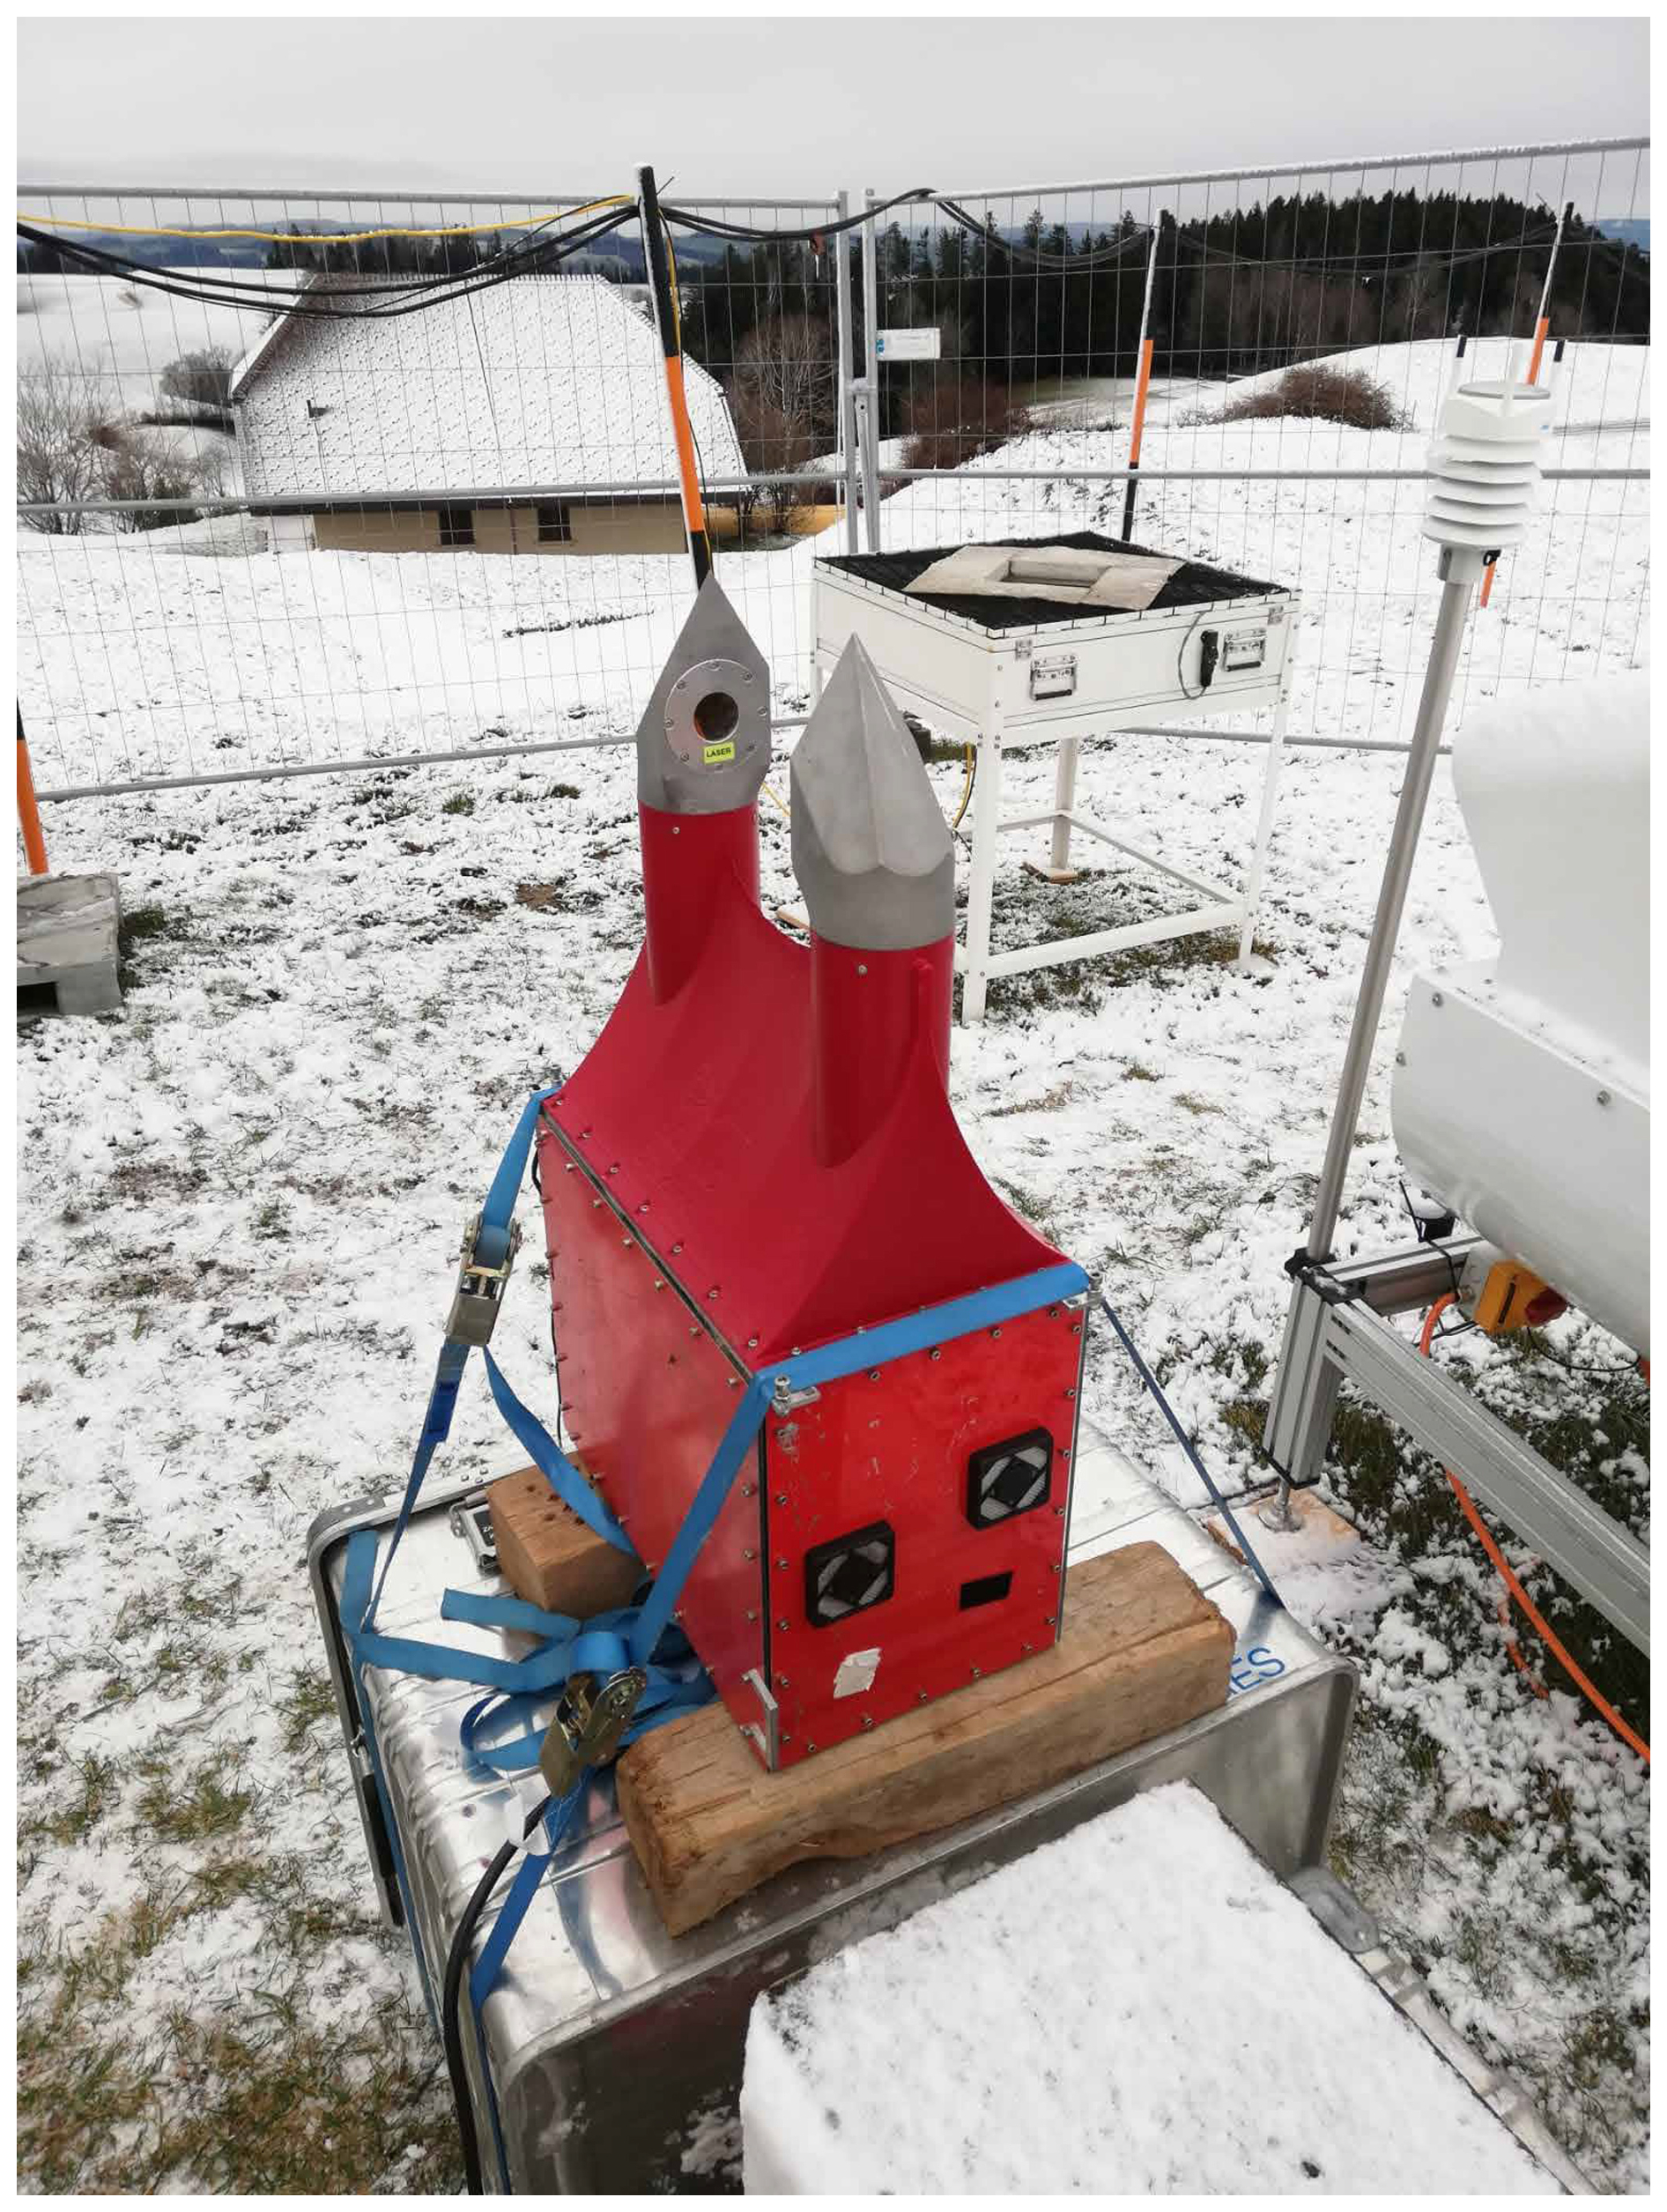
Figure 6HOLIMO (red in the foreground) is operating next to the 2DVD at Rapier-Platz on 17 January 2023.
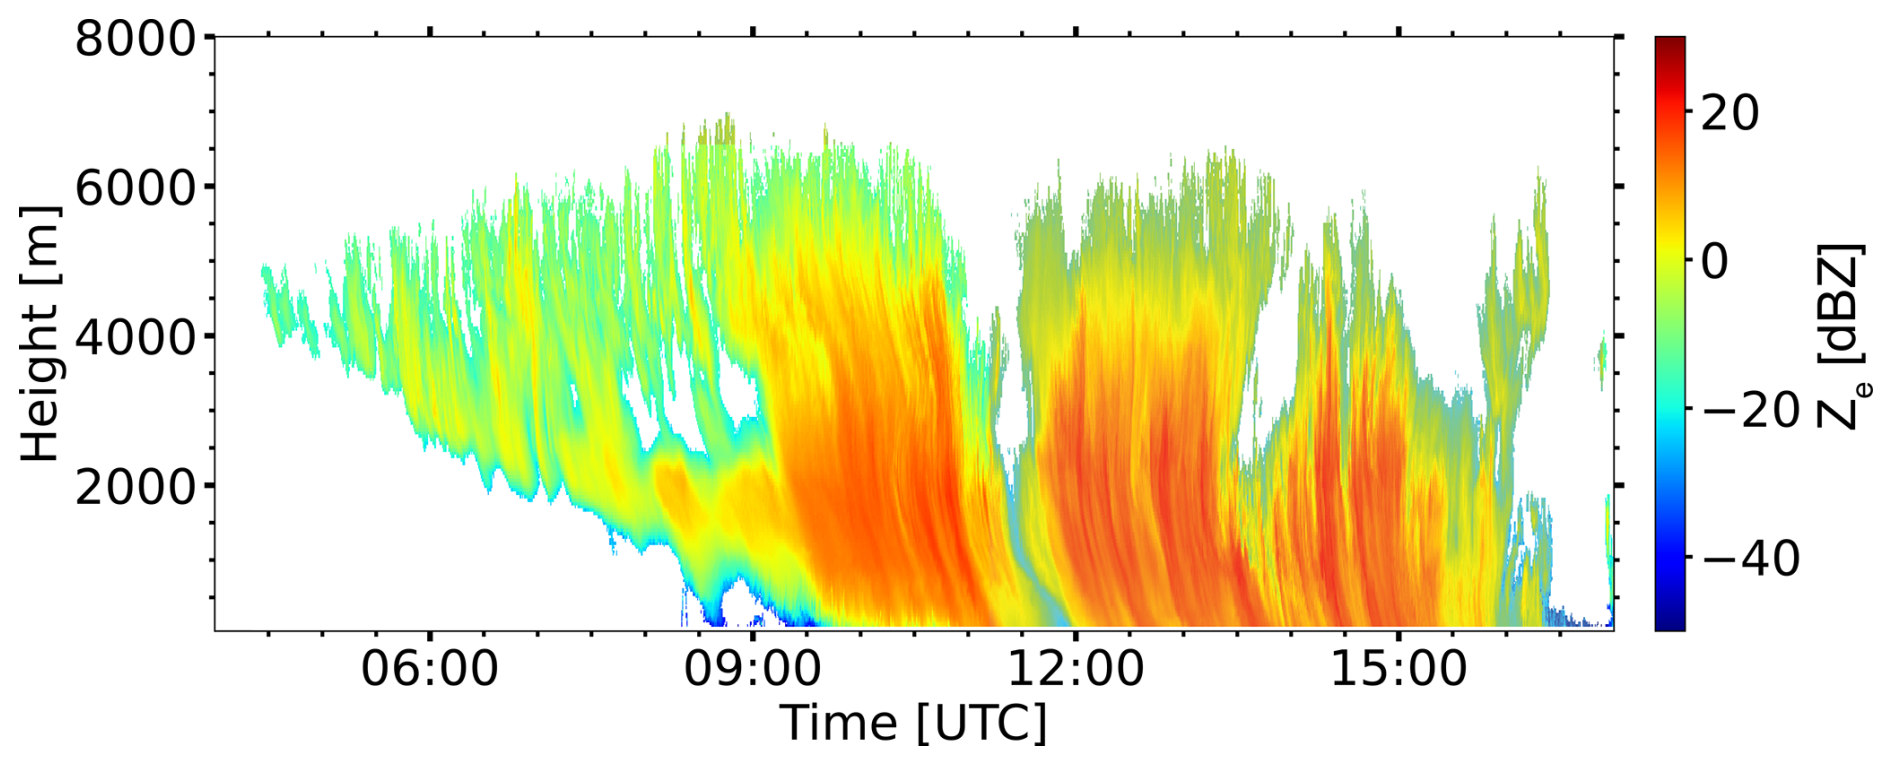
Figure 794 GHz RPG_LACROS radar reflectivity factor on 17 January 2023 above Rapier-Platz near Eriswil, Switzerland. An offset of 20 dB compared to the 35 GHz Mira cloud radar was added. The offset occurred due to a malfunction of the RPG radar blower, followed by accumulating snow on the radome causing attenuation. The MIRA cloud radar, on the other hand, only measured intermittently during the relevant time period for which reason RPG radar data are shown.
The 2DVD O and ν were compared to dmax in order to identify clusters which may represent different particle types (Fig. 8a and b). The detected particles can be separated into O≤0.6, meaning significantly smaller height than width, and O>0.6. If O exceeded 2, shapes were often found to be unrealistic due to long vertical edges. This phenomenon was also seen, for example, by Grazioli et al. (2014) who suggested that particles linger in the virtual measurement area for an unusual long time span. If O≤0.6, hydrometeors were also found to fall more slowly on average. Characteristic examples from the two clusters show that many particles with O≤0.6 have vertical extents of only a few pixels while reaching horizontal lengths of up to several millimetres (Fig. 8d). Therefore, their majority can be assumed to represent columnar crystals or needles. Due to the low ν it is possible that further particle types, such as small horizontally oriented dendrites, are also contained in this cluster. For particles with O>0.6, a clear shape cannot be assigned to the smaller particles as they appear only as a few pixels in the binary images. But if diameters were larger than approximately 1.5 mm, dendrites, plate-like crystals, columns, and also aggregated particles could be identified.
HOLIMO images shown in Fig. 8c prove the presence of columns and aggregates. Additionally, a certain degree of riming was observed on some crystals. Some particles should be classified as irregularly shaped. However, the major disagreement with the 2DVD findings is that dendrites and plate-like crystals could not be observed. At this point, it should be mentioned again that the probability that HOLIMO fully detects a particle decreases with increasing particle size.
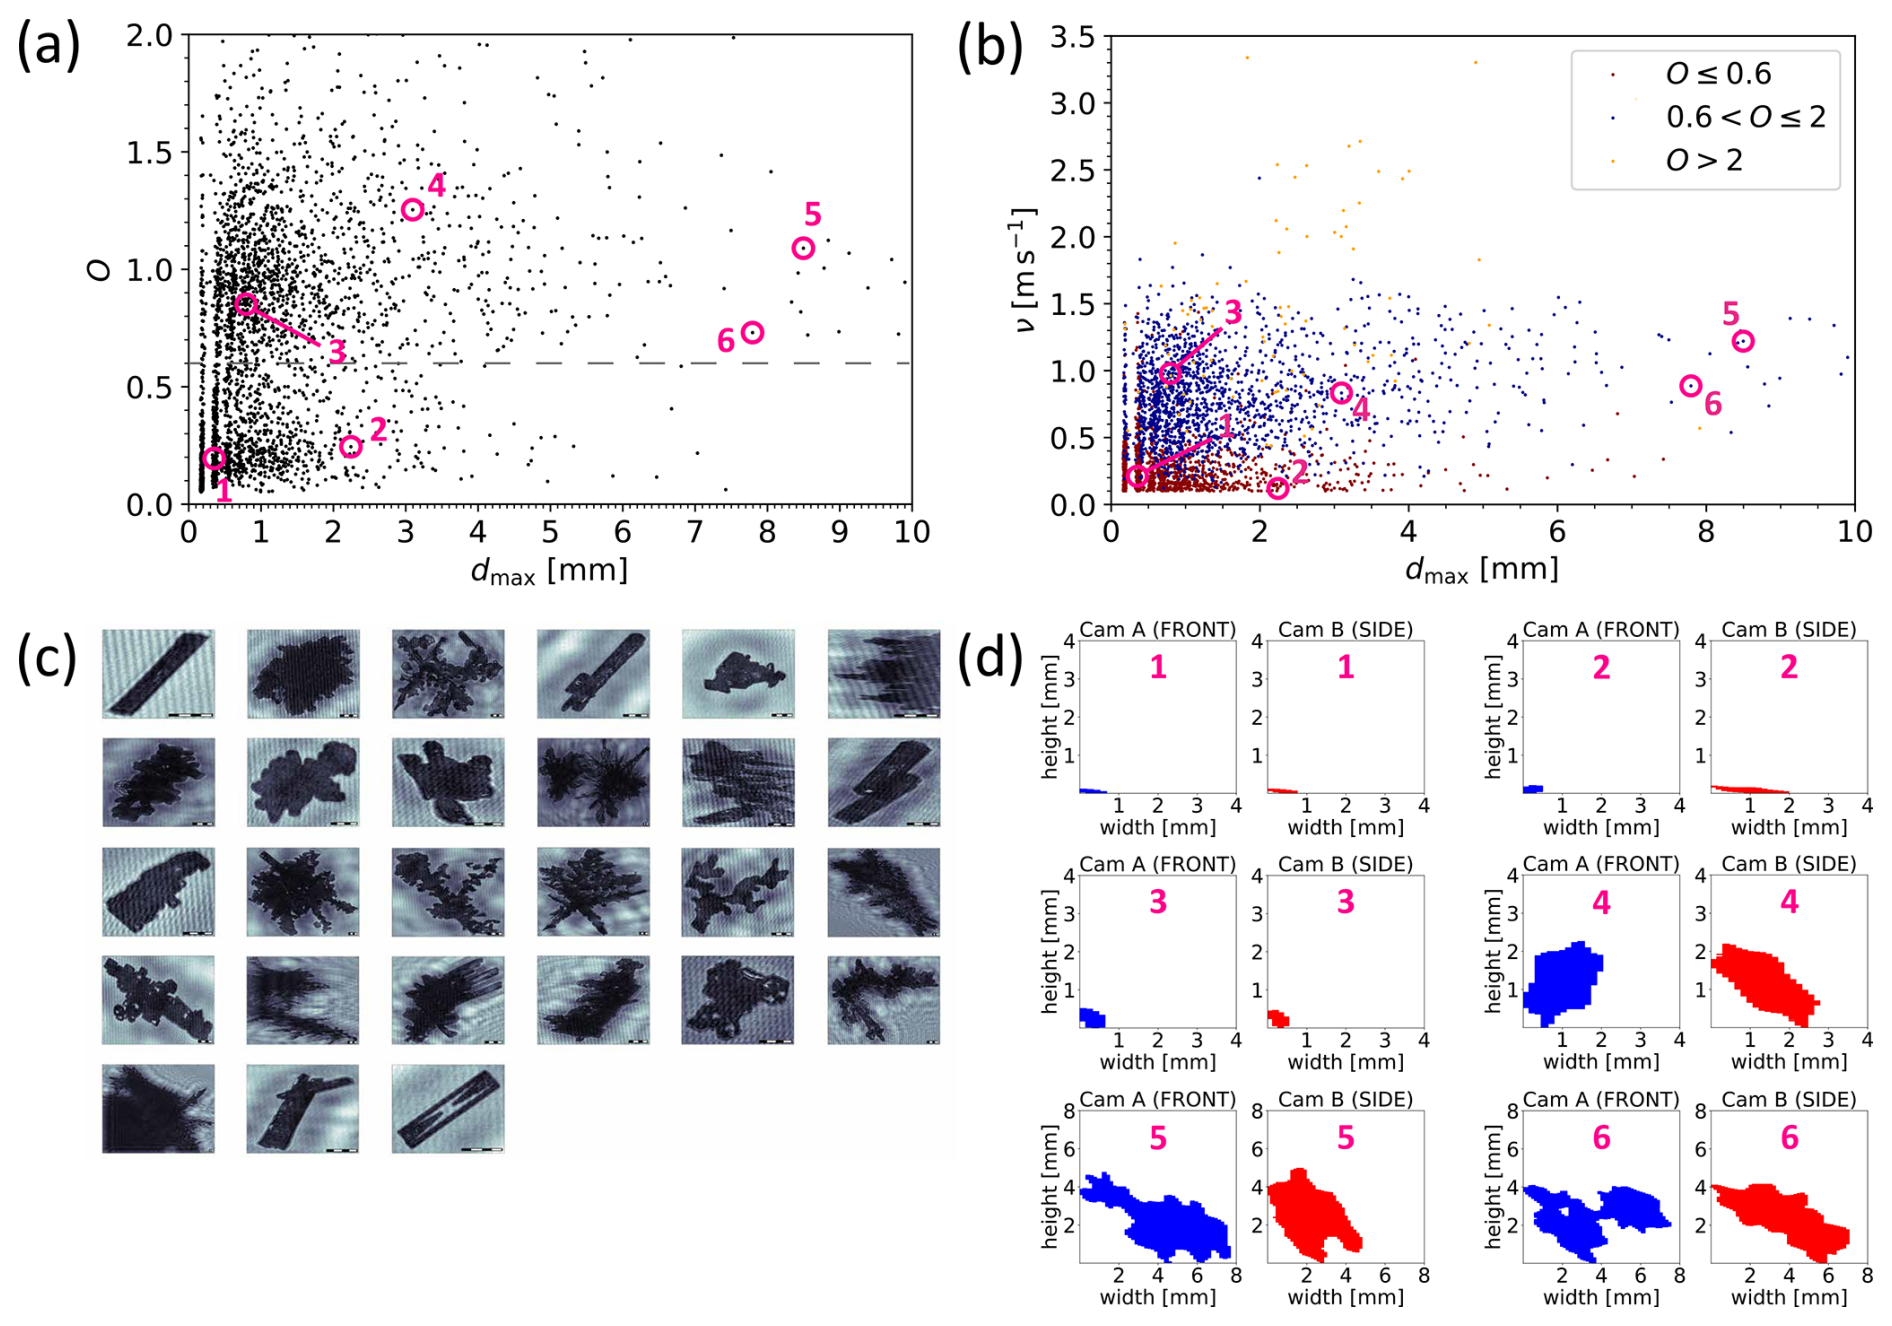
Figure 82DVD measurements on 17 January 2023 from 14:07 to 14:11 UTC including (a) O versus dmax including dashed line indicating O=0.6, (b) ν versus dmax, (c) all detected particles by HOLIMO during that time period, and (d) single characteristic hydrometeors. The blue numbers indicate the same hydrometeor in (a), (b), and (d). Particles 5 and 6 in (d) have a different scale than the other particles. The scale in the lower right corner in (c) corresponds to 100 µm with 25 µm subdivision.
4.3 Detection of cloud-seeding-induced precipitation particles
For a better understanding of cloud-microphysical processes, seeding experiments were conducted in the frame of Cloudlab and PolarCAP. During such experiments, a drone carrying seeding flares flies into a MPC. When the flares are combusted, silver iodide particles are generated and may initiate ice crystal nucleation (Henneberger et al., 2023). At temperatures already slightly below freezing, the ice particles then grow and start to precipitate. If the seeding location in the cloud was chosen accordingly, HOLIMO attached to the helikite (Ramelli et al., 2020) can observe the formed cloud-ice crystals, remote-sensing instruments can monitor potential changes in cloud properties, and in-situ instruments on the ground might even detect precipitation particles, if they reached the ground at the measurement site. The latter was the case on 25 January 2023 during two seeding experiments starting at 18:55 and 19:48 UTC. The RPG_LACROS effective reflectivity factor (Ze) and linear depolarisation ratio (LDR) from 16:00 to 21:00 UTC are shown in Fig. 9a and b. The presence of a typical low-level stratiform Bise cloud offered excellent synoptic conditions for seeding experiments. The cloud mainly consisted of supercooled liquid water droplets, but at times, ice formation was initiated at the cloud top which led to the growth of precipitation-sized ice crystals on the expense of the surrounding liquid water droplets. The presence of the larger ice crystals caused an increase of radar reflectivity and LDR. Such patterns are clearly visible for several minutes after each of the two seeding events.
During the afternoon and evening on 25 January 2023, the 2DVD N shows two sudden increases (Fig. 9c), each only for two or three minutes, around 15 minutes after the start of each seeding event. The times of increased N are identical with those of increased reflectivity and LDR, which suggests that the formation of corresponding particles detected by the 2DVD was initiated by the aerosols of the burning flares.
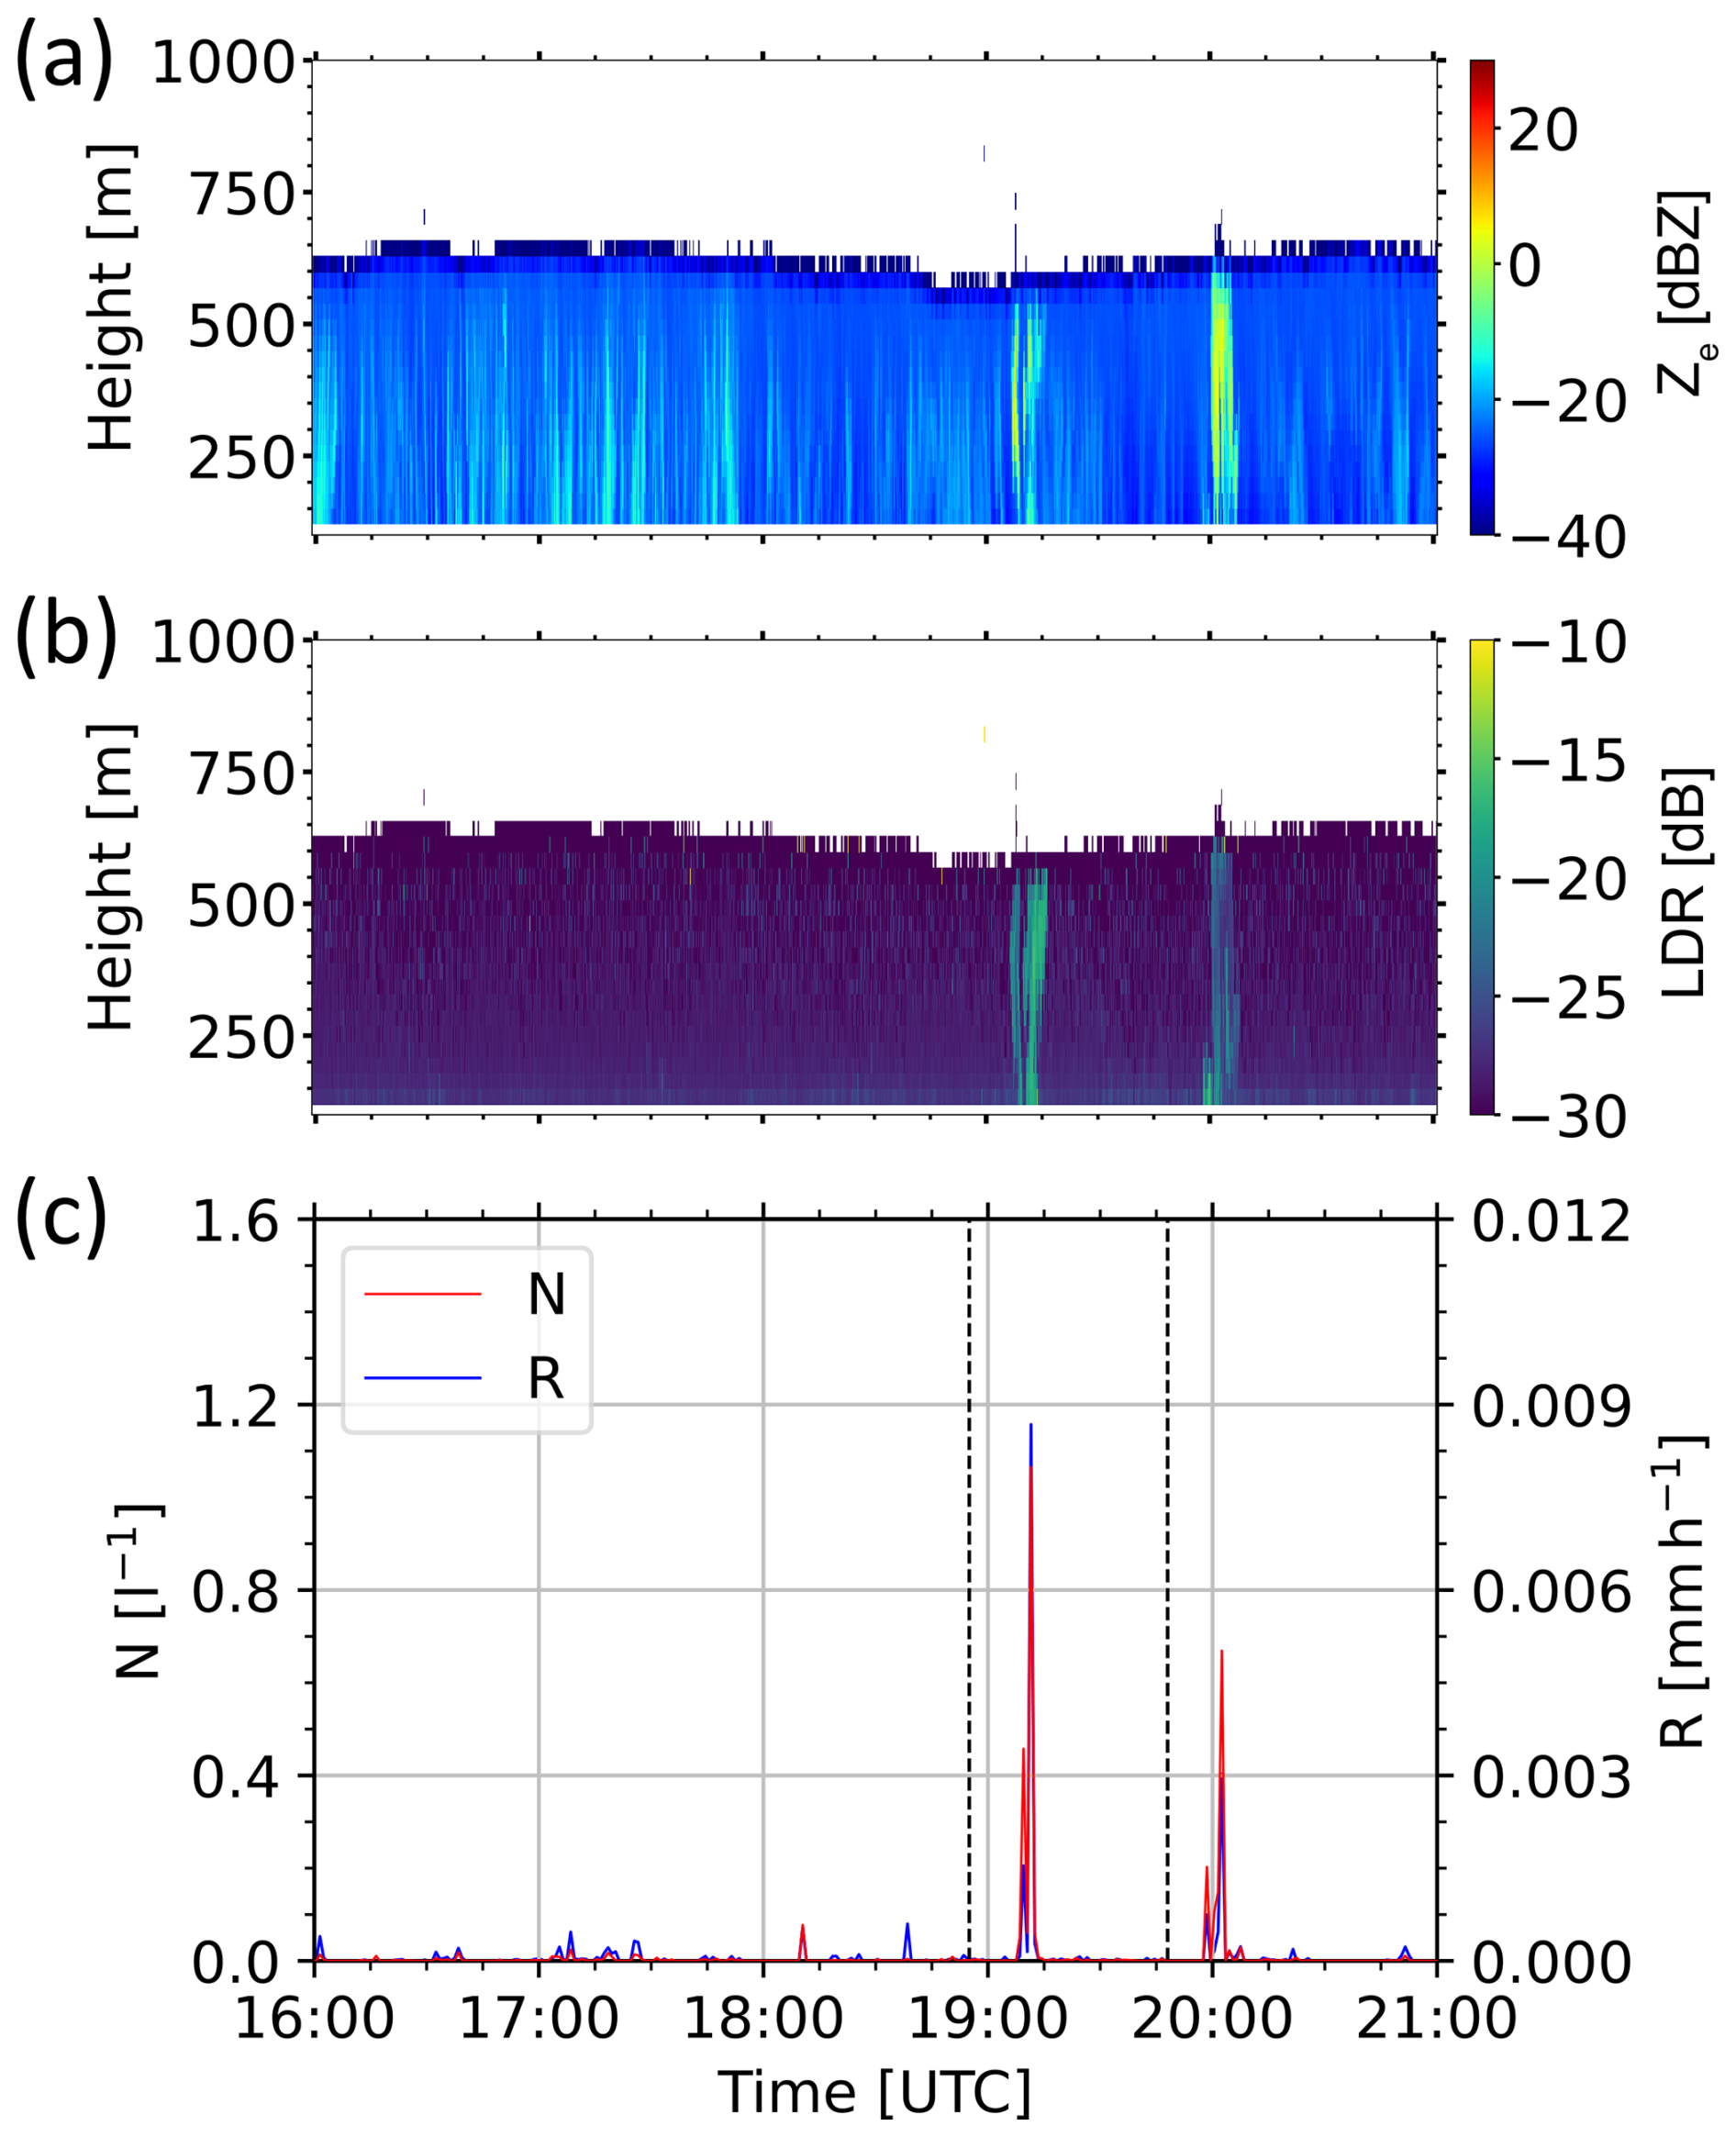
Figure 9(a) 94 GHz RPG_LACROS radar reflectivity factor Ze, (b) LDR, and (c) 2DVD N and R from 16:00 to 21:00 UTC on 25 January 2023. The height refers to the distance above ground level. The vertical dashed lines indicate artificial cloud seeding events. Changing cloud and precipitation properties were observed some minutes after seeding.
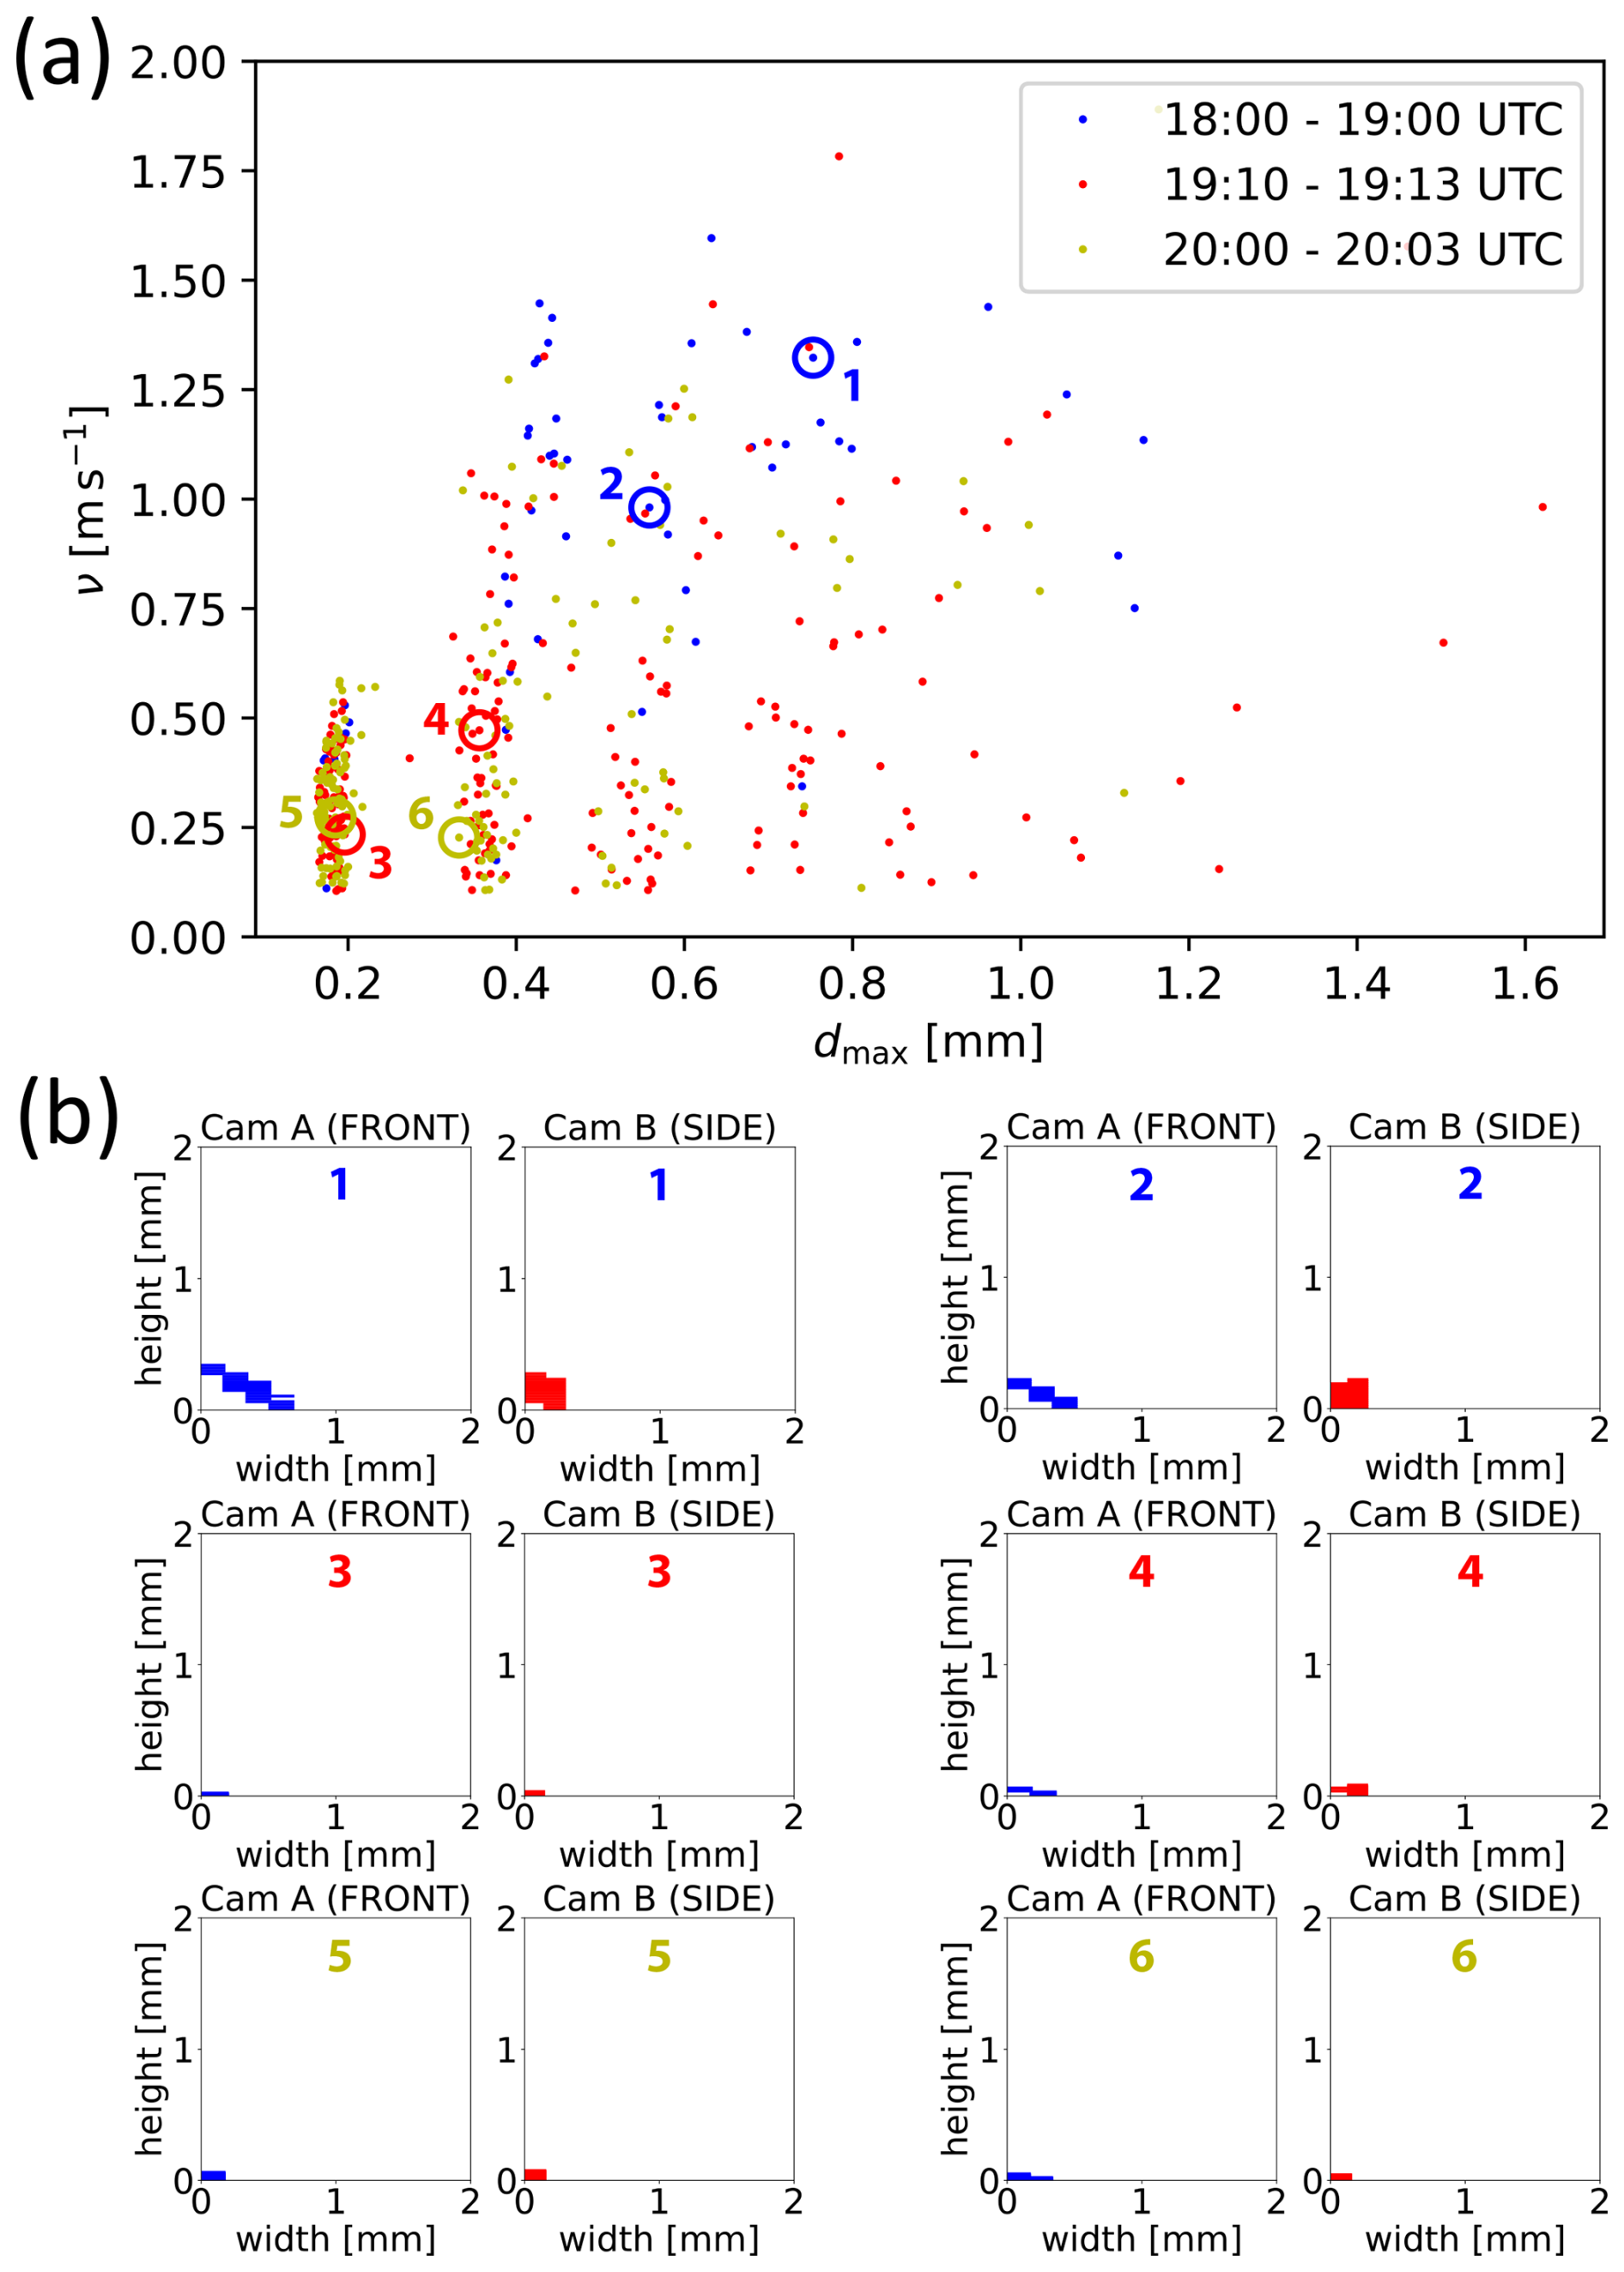
To analyse the precipitation induced by the seeding events, three time periods are investigated with a focus on detected particle shapes. The first period was chosen from 18:00 to 19:00 UTC for a background reference to get information about hydrometeors precipitating without seeding impact. The second period from 19:10 to 19:13 UTC and the third period from 20:00 to 20:03 UTC cover the peaks in R after each seeding event. During the first (60-min) period, the 2DVD detected only 51 particles. During the periods two and three (three minutes each), 235 and 176 particles were detected, respectively, which indicates the seeding impact on the precipitation.
The relation of ν and dmax for each particle of all three periods is shown in Fig. 10, including 2DVD images of characteristic hydrometeors. Most of the particles that were observed during period one before the seeding events varied in dmax from 0.2 to 0.3 mm and in ν from 0.75 to 1.5 m s−1. Characteristic hydrometeors for that period indicate columns as the major particle type which were partly rimed to some extent. This accounts for periods two and three as well, which is supported by LDR values of up to around −15 dB. Further, a temperature sensor attached to the seeding drone measured −5 °C during each flare combustion, which is a suitable environment for column and needle formation (Bailey and Hallett, 2009). However, the particles were much smaller with dmax mostly below 0.2 mm and ν<0.5 m s−1 which may be due to a shorter residence time in the cloud. Particles observed in the first period could be larger because they might have stayed longer in the cloud due to turbulence, which also results in stronger riming and thus higher ν. The 2DVD results have again revealed that from the instruments measurements, one can distinguish between different ice crystal shapes and thus, the 2DVD can contribute to the investigation of aerosol-cloud-interaction if precipitating hydrometeors reach the ground. The ground-measurement of individual particles produced by the seeding also constitute an important constraint for the interpretation of the seeding studies, as they provide information about the growth rate of the ice crystals and the evolution of ice crystal size distribution in general (e.g. Ramelli et al., 2024).
4.4 2DVD application to a microphysical retrieval: the 10 November 2019 MOSAiC case study
The lidar-radar retrieval LIRAS-ice, introduced by Bühl et al. (2019), allows the height-resolved determination of ice crystal number concentration from ice or mixed-phase clouds without the necessity of in-situ measurements. Ansmann et al. (2025) and Jimenez et al. (2025) applied the method in the frame of MOSAiC case studies in order to investigate smoke-cirrus interaction and the longevity of Arctic MPCs, respectively. In this section, LIRAS-ice is evaluated against the 2DVD as a ground-based precipitation sensor by means of comparing LIRAS-ice ICNC and mean particle diameter with 2DVD N and mean dmax, respectively.
To find comparable data, several meteorological requirements which are described in Sect. 3.3 need to be fulfilled. On 10 November 2019 between 11:00 and 15:00 UTC, a precipitation system passed over the research vessel Polarstern offering ideal meteorological conditions. Ze values of up to 10 dBZ indicate that moderate precipitation took place during the whole time period (Fig. 11a). Below 2000 m above the research vessel, temperatures measured by radiosonde ranged between −24 and −30 °C and dropped to −40 °C at the top of the highest-reaching cloud layers at around 4000 m (Maturilli et al., 2021). During almost the whole period, the 2DVD detected snowfall at the surface. Two-dimensional cross-sections of characteristic hydrometeors are additionally shown in Fig. 11a. Those particles were arbitrarily chosen from all detected hydrometeors with dmax>1 mm and appear as linear branches merging in the centre, allowing an interpretation as bullet rosettes.
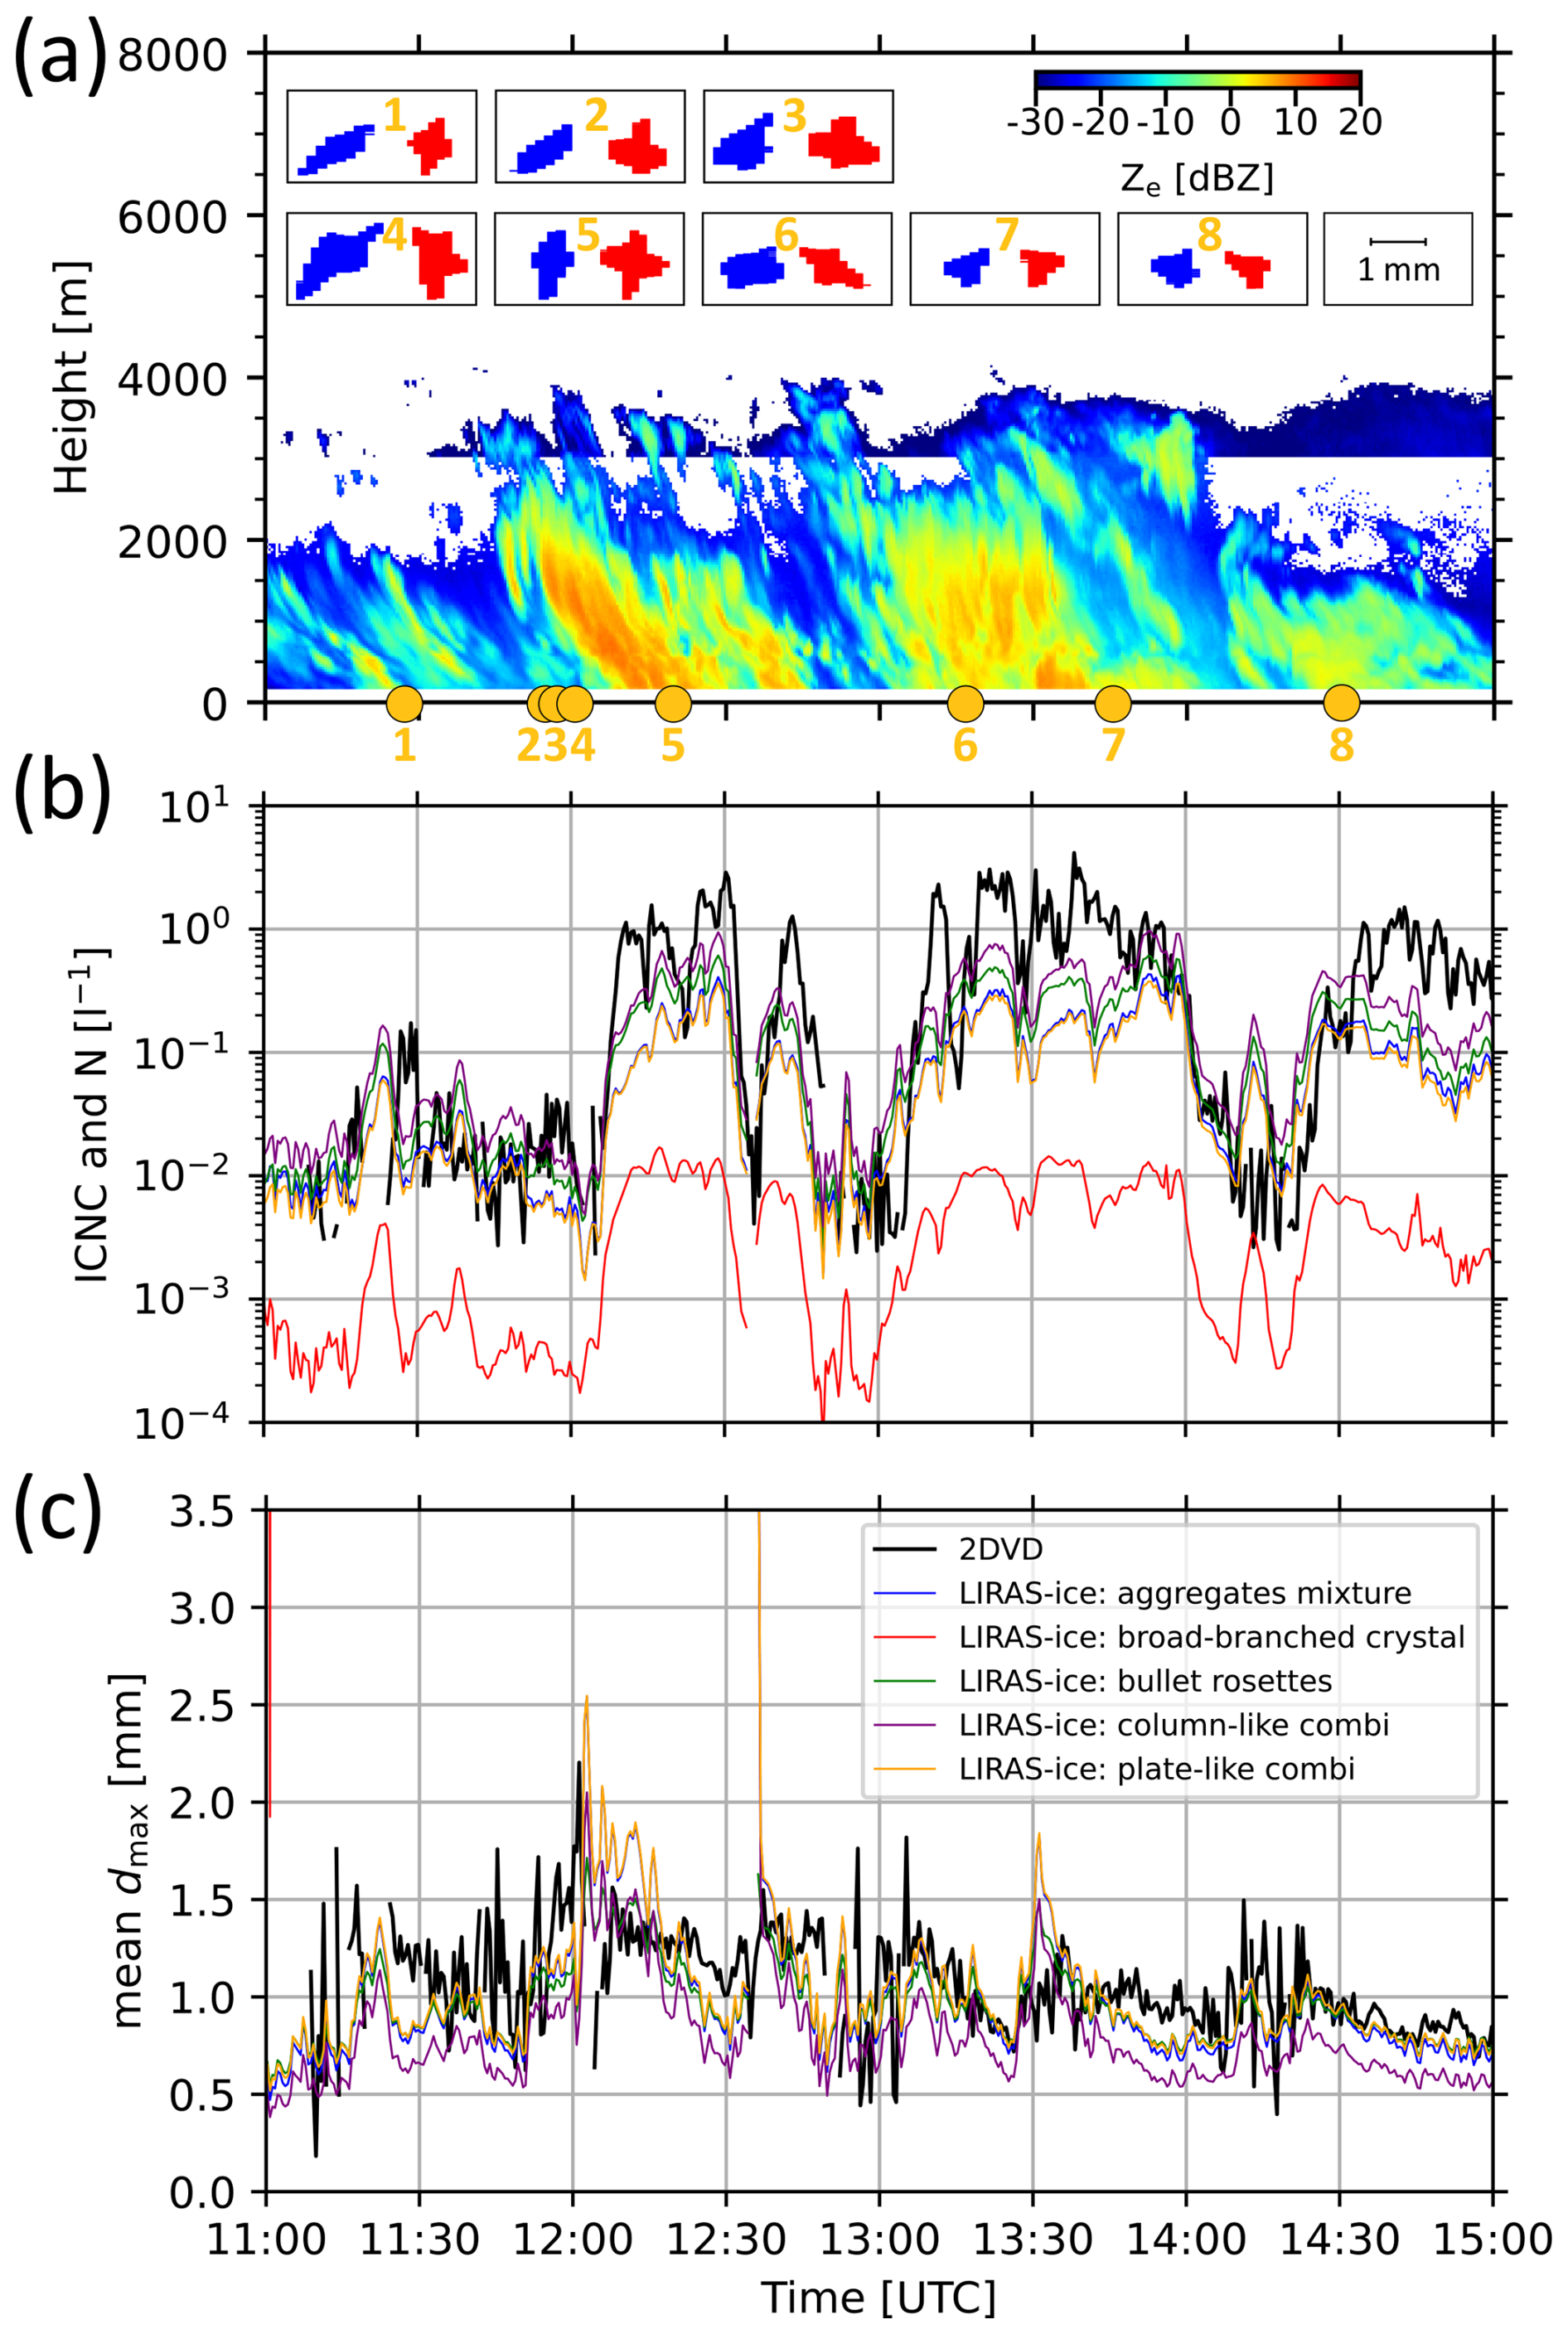
Figure 11LIRAS-ice versus 2DVD results of measurements during MOSAiC in the Arctic Ocean on 10 November 2019 including different shape assumptions for LIRAS ice. The 2DVD mainly detected bullet rosettes. The figure includes (a) KAZR reflectivity factor and example 2DVD particles with front view (blue) and side view (red), (b) LIRAS-ice ICNC and 2DVD N time series, and (c) LIRAS-ice and 2DVD mean dmax time series.
Figure 11b shows 30 s mean values of LIRAS-ice ICNC and 2DVD N. 30 s mean maximum diameters from both methods are presented in Fig. 11c. All LIRAS-ice results represent the height average from the lowest height bin, starting at around 180 m, to 400 m for each time point in order to mitigate measurement noise. The ICNC derived under the assumption of bullet rosettes and 2DVD N agree within the given the LIRAS-ice ICNC uncertainty, i.e. a factor of 2–3 (Jimenez et al., 2025), for a substantial fraction of the time. Considering that the precipitation properties can still change between ground and a few hundred meters above, the two variables generally agree well. The same accounts for the LIRAS-ice mean maximum diameter and dmax from the 2DVD. The diameters show good agreement in the time series, particularly when bullet rosettes are assumed for LIRAS-ice.
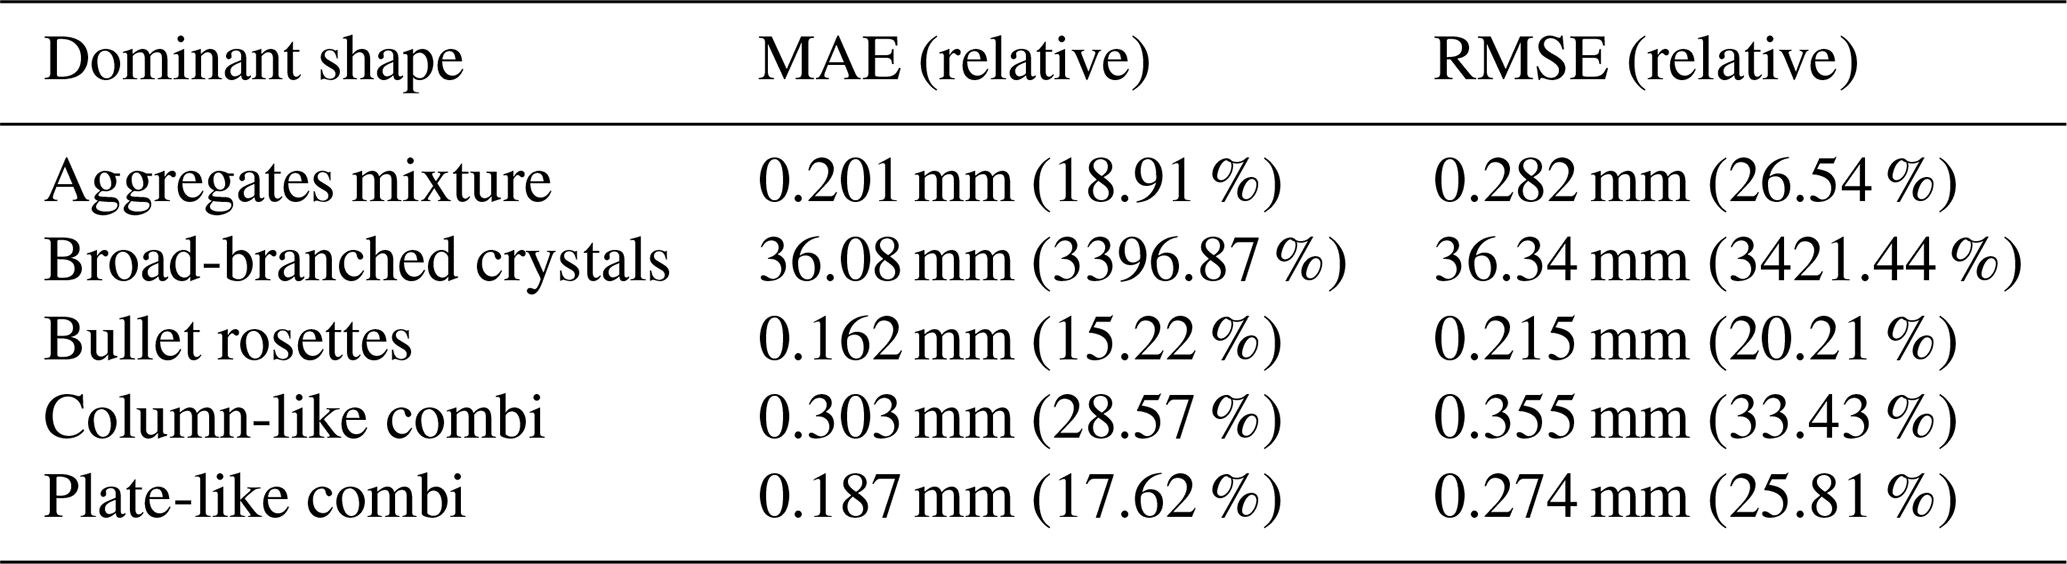
Due to the time span required for the particles to fall from the analysed LIRAS-ice height range to the ground, a temporal cross-correlation between ICNC and N was investigated. The highest correlation was found if the 2DVD N values are shifted 60 s backwards. This value can be considered plausible given the presence of vertical wind shear (Maturilli et al., 2021). Further, the two-minute rolling mean was calculated for both the 2DVD and LIRAS-ice data. Rolling means of mean maximum diameter and temporally shifted dmax were then analysed (Fig. 12) and statistically compared using Mean Absolute Error (MAE) and Root Mean Square Error (RMSE, Table 2). Assuming bullet rosettes for LIRAS-ice yielded the lowest MAE and RMSE, with 15 % and 20 %, respectively, indicating moderate to good agreement with the 2DVD observations. This is supported by a slope of 0.89 for the linear regression through the origin (Fig. 12). The assumed shapes “aggregates mixture” and “plate-like combi” also produced comparably small statistical errors and regression slopes close to 1. LIRAS-ice results with the other tested shapes were found to agree worse with the 2DVD observations.
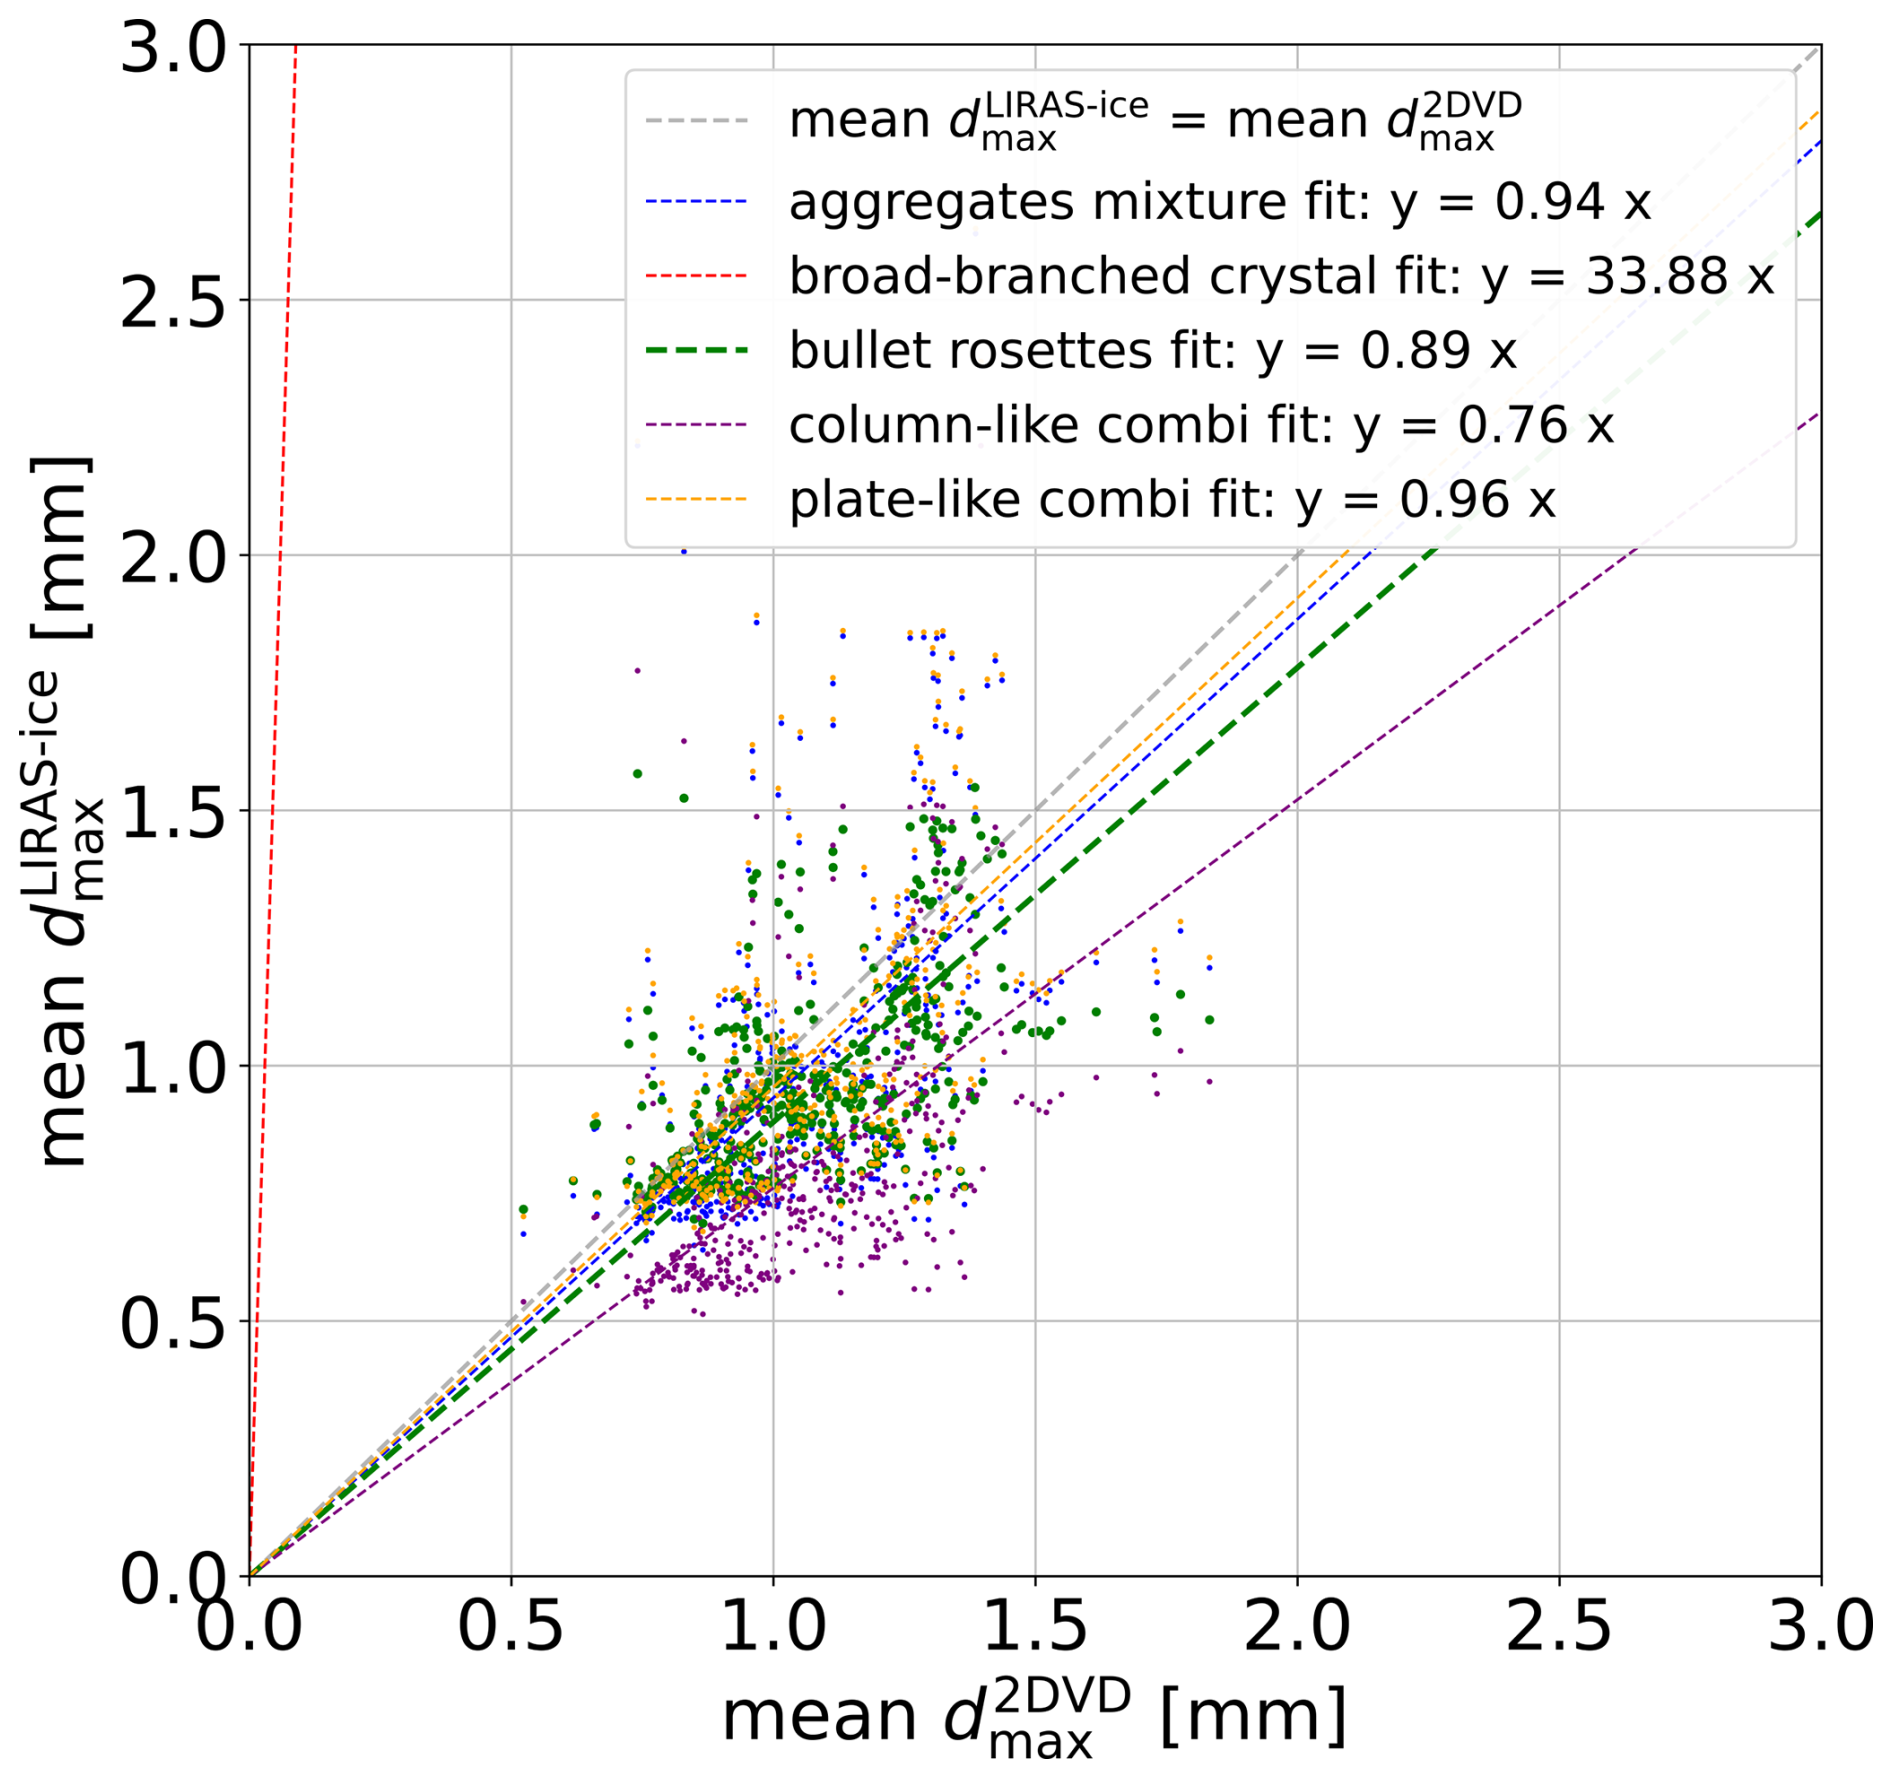
Figure 12Mean maximum diameters of LIRAS-ice versus 2DVD (see Fig. 11c) including linear regression through the coordinate origin. 2DVD data were shifted by −60 s (cross-correlation) and the two-minute rolling mean was applied to both datasets.
Table 2Mean Absolute Error (MAE) and Root Mean Square Error (RMSE) for 2DVD versus LIRAS-ice mean dmax with different assumed shapes. The average mean dmax of the 2DVD values is 1.062 mm and was used to calculate the relative errors.
The results presented above have shown that dmax is a useful parameter for the 2DVD data analysis. In the following, some aspects of the findings from this study are discussed.
The application of the 2DVD dmax retrieval to the calibration-sphere dataset revealed, on the one hand, a good agreement between all tested variables with the actual sphere sizes. On the other hand, a slight overestimation of the sphere sizes by dmax of 3 %–5 % in average could be observed. Some “outliers” were present at some sizes which mainly represent spheres which had a horizontal motion component when entering the measurement area. Those particles appear skewed in the 2DVD data and an increased dmax or dc could be observed. For this reason, windless conditions are necessary to obtain best possible calibration results.
The method to determine dominant particle shapes from 2DVD observations during a certain time period described in Sect. 3.2 works mostly well. Typically, clusters representing different particle species can be identified in respective diagrams as the example presented in Sect. 4.2 shows. However, in case of particles smaller than 1–1.5 mm, depending on the particle type, shapes can usually not be identified reliably. Bullet rosettes and column-like crystals could be identified if dmax exceeded 1 mm, but dendrites were only recognisable as such if dmax was larger than 1.5 to 2 mm.
During the cloud seeding experiments presented in this study, the 2DVD delivered reliable information about the ground precipitation and allowed the determination of columnar crystals as dominant particle shape. These columnar crystals agree with the radar-based high LDR values in the cloud shortly after each seeding event took place. However, the columnar shape of the particles might have been advantageous for shape determination as other types are difficult to identify in case of such small particles.
The comparison of LIRAS-ice and 2DVD results of the MOSAiC case study showed that the different methods generally agree. ICNC and N values agree within the LIRAS-ice uncertainty for a substantial portion of time. On the one hand, this agreement demonstrates the strong performance of LIRAS-ice in determining ICNC and mean maximum diameter under ideal meteorological conditions. On the other hand, the 2DVD dmax was useful and proved reliable for examining precipitation properties on the ground.
The LIRAS-ice height range for such a comparison was not easy to chose. Falling ice crystals can change their morphology (e.g. grow, sublimate, aggregate, disaggregate), for which reason the lowest possible height level would be advantageous. However, considering only one height bin would result in too strong temporal fluctuation of ICNC and maximum diameter. Furthermore, both lidar and radar measurements are inaccurate at low heights for different reasons. In the lowest height range over the lidar, the outgoing radiation and the measurement volume are not fully overlapping. This so-called overlap effect determines the backscatter signal. In case of stationary radar, the data quality can decrease towards the ground for different reasons such as near-field effects and beam geometry. Therefore, the choice of a height range of 180 to 400 m for averaging the LIRAS-ice results is well justified.
Radio soundings from that day revealed that the vertical wind shear at the lowest few hundred meters varied with time (Maturilli et al., 2021). Thus, the temporal shift of 60 s resulting from the cross-correlation represents the average from 11:00 to 15:00 UTC. For shorter periods, different temporal shifts between LIRAS-ice and 2DVD data might lead to higher correlations which means that the statistical results for the whole period are biased by the varying vertical wind shear.
In this work, the particle maximum diameter dmax was introduced as a new 2DVD parameter in order to make measurements better comparable to precipitation data by other instruments. Up to now, deq was the standard 2DVD parameter for the description of the particle size but as it is related to the particle volume V, it can be highly biased depending on particle shape or alignment relative to the cameras. Hence, dmax represents the larger of the two particle maximum extents seen from the two camera perspectives. For this study, the retrieval was applied to 2DVD data of two measurement campaigns. During the PolarCAP/Cloudlab winter campaign 2022/2023 near Eriswil, Switzerland, 2DVD measurements were accompanied by extensive remote sensing and further in-situ observations with the ultimate goal to conduct artificial cloud seeding experiments. On the one hand, the setting allowed the comparison of 2DVD data with simultaneously taken in-situ ground measurements by the holographic imager HOLIMO. The data analysis showed that particle shapes can be well identified if diameters are larger than 1–1.5 mm, depending on the shape. On the other hand, seeding-induced ice crystals could be captured by the 2DVD which again proved its ability to reliably contribute to precipitation-related studies. The second campaign, the MOSAiC expedition in the Central Arctic in winter 2019/2020, facilitated combined 2DVD and remote sensing observations as well. The dataset of 10 November 2019 was used to evaluate the remote-sensing-based LIRAS-ice retrieval with ground-based in-situ snowfall observations. During the investigated time period, the 2DVD mainly detected bullet rosettes. When LIRAS-ice used this particle type as input, statistical errors were indeed the lowest among all tested ice crystal shapes. The good agreement of LIRAS-ice ICNC and mean maximum diameter with the 2DVD N and mean dmax, respectively, demonstrate the applicability of the maximum diameter retrieval introduced in this study.
The main conclusion of this study is that the new variable dmax valuably expands 2DVD data analysis capabilities as demonstrated in the frame of different observational settings in this work. The strong agreement with remote sensing observations supports including the instrument in future studies to enhance information on precipitation particle shape, size and number. Due to the 2DVD's particle typing and sizing capability, conclusions about the polarimetric properties and the valid scattering regime (such as Rayleigh or Mie) of precipitation systems can be drawn (von Terzi et al., 2025; Myagkov et al., 2025). Therefore, the instrument's potential for evaluating further remote sensing retrievals, in which for example polarimetric radar observations are included (e.g. Myagkov et al., 2016), should be highlighted in this context. For subsequent studies, we suggest to further evaluate and, if necessary, refine dmax. The calibration dataset has shown that the relative difference of the steel spheres' actual diameters and dmax is larger for sphere diameters <2 mm. Horizontal wind impacts dmax so that calibration datasets and wind speed in combination with an appropriate skewness correction could potentially be used for dmax correction. Moreover, well-defined non-spherical particles could additionally be used in the future and may improve the calibration outcome. Furthermore, dmax should be used for automated particle typing as was done with other variables in previous studies (Grazioli et al., 2014; Gavrilov et al., 2015; Lee et al., 2015; Bernauer et al., 2016). Automated particle typing would improve the 2DVD data analysis by enabling comprehensive remote sensing retrieval evaluation and comparison, and it would make the instrument even more attractive for further cloud and precipitation research.
The python script which generates netCDF files containing the 2DVD particle maximum diameter can be found in https://doi.org/10.5281/zenodo.16894362 (Gaudek et al., 2025a). The python code for 2DVD particle visualisation is available in https://doi.org/10.5281/zenodo.17869321 (Gaudek and Klamt, 2025). The code of the LIRAS-ice retrieveal is available upon request from the corresponding author of the article of https://doi.org/10.5194/acp-25-12955-2025 (Jimenez et al., 2025). All measurement data of the 2DVD, as well as the radar data used within the PolarCAP/Cloudlab case studies are available in https://doi.org/10.5281/zenodo.16676550 (Gaudek et al., 2025b). The Polly lidar level 0 data used in the MOSAiC case study are in the PollyNet database (http://polly.tropos.de/, Polly, 2025), MOSAiC cloud radar data were taken from the ARM database (ARM, 2025; ARM-MOSAiC, 2025). MOSAiC radiosonde data are available via https://doi.org/10.1594/PANGAEA.928656 (Maturilli et al., 2021).
TG wrote the paper and developed the dmax algorithm with support from AK and JB. AA and CJ were involved in the design of and discussion about the MOASiC case study. LIRAS-ice was developed and applied by JB and CJ, respectively. CF and JH conducted the HOLIMO measurements and provided the final HOLIMO data. TG, KO, and PS conducted the PolarCAP measurements. RE was responsible for the MOSAiC measurements. PS supervised this study.
The contact author has declared that none of the authors has any competing interests.
Publisher's note: Copernicus Publications remains neutral with regard to jurisdictional claims made in the text, published maps, institutional affiliations, or any other geographical representation in this paper. The authors bear the ultimate responsibility for providing appropriate place names. Views expressed in the text are those of the authors and do not necessarily reflect the views of the publisher.
This article is part of the special issue “Fusion of radar polarimetry and numerical atmospheric modelling towards an improved understanding of cloud and precipitation processes (ACP/AMT/GMD inter-journal SI)”. It is not associated with a conference.
We would like to thank everyone who participated in the planning and execution of the Cloudlab/PolarCAP and MOSAiC campaigns, thus enabling the valuable datasets. We also thank Joanneum Research, the manufacturer of the 2DVD, for their kind support with the 2DVD data processing.
Funding for this study was provided by the European Union's Horizon Europe project CleanCloud (grant no. 101137639), by the Deutsche Forschungsgemeinschaft (DFG, German Research Foundation) within the priority programme SPP 2115 PROM (project no. 408027490) (PolarCAP) and TRR172 (project no. 268020496), and by European Research Council (ERC) under the European Union's Horizon 2020 research and innovation programme (grant no. 101021272 CLOUDLAB). The MOSAiC programme was funded by the German Federal Ministry for Education and Research (BMBF) through financing the Alfred Wegener Institut Helmholtz Zentrum fürPolar und Meeresforschung (AWI) and the Polarstern expedition PS122 (grant no. N-2014-H-060_Dethloff). Analysis of the MOSAiC data was funded by BMBF project SCiAMO (grant no. MOSAIC-FKZ 03F0915A).
This paper was edited by Ulrich Löhnert and reviewed by two anonymous referees.
Ansmann, A., Jimenez, C., Roschke, J., Bühl, J., Ohneiser, K., Engelmann, R., Radenz, M., Griesche, H., Hofer, J., Althausen, D., Knopf, D. A., Dahlke, S., Gaudek, T., Seifert, P., and Wandinger, U.: Impact of wildfire smoke on Arctic cirrus formation – Part 1: Analysis of MOSAiC 2019–2020 observations, Atmospheric Chemistry and Physics, 25, 4847–4866, https://doi.org/10.5194/acp-25-4847-2025, 2025. a, b, c
ARM: Atmospheric Radiation Measurement (ARM) Mobile Facility Homepage, U.S. Department of Energy ARM User Facility, https://www.arm.gov/capabilities/observatories/amf (last access: 25 July 2025), 2025. a, b
ARM-MOSAiC: Atmospheric Radiation Measurement (ARM) user facility, 2019, updated hourly, Ka ARM Zenith Radar (KAZR-CFRGE), 2019-10-11 to 2020-09-20, ARM Mobile Facility (MOS) MOSAIC (Drifting Obs – Study of Arctic Climate), AMF2 (M1), ARM Data Center, https://doi.org/10.5439/1498936, 2025. a
Atlas, D., Srivastava, R. C., and Sekhon, R. S.: Doppler radar characteristics of precipitation at vertical incidence, Reviews of Geophysics, 11, 1–35, https://doi.org/10.1029/rg011i001p00001, 1973. a
Bailey, M. P. and Hallett, J.: A Comprehensive Habit Diagram for Atmospheric Ice Crystals: Confirmation from the Laboratory, AIRS II, and Other Field Studies, Journal of the Atmospheric Sciences, 66, 2888–2899, https://doi.org/10.1175/2009jas2883.1, 2009. a
Barthazy, E. and Schefold, R.: Fall velocity of snowflakes of different riming degree and crystal types, Atmospheric Research, 82, 391–398, https://doi.org/10.1016/j.atmosres.2005.12.009, 2006. a
Bergeron, T.: On the physics of clouds and precipitation, Proces Verbaux de l’Association de Météorologie, International Union of Geodesy and Geophysics, 1935. a
Bernauer, F., Hürkamp, K., Rühm, W., and Tschiersch, J.: On the consistency of 2-D video disdrometers in measuring microphysical parameters of solid precipitation, Atmospheric Measurement Techniques, 8, 3251–3261, https://doi.org/10.5194/amt-8-3251-2015, 2015. a, b, c, d
Bernauer, F., Hürkamp, K., Rühm, W., and Tschiersch, J.: Snow event classification with a 2D video disdrometer – A decision tree approach, Atmospheric Research, 172–173, 186–195, https://doi.org/10.1016/j.atmosres.2016.01.001, 2016. a, b, c
Boucher, O., Randall, D., Artaxo, P., Bretherton, C., Feingold, G., Forster, P., Kerminen, V.-M., Kondo, Y., Liao, H., Lohmann, U., Rasch, P., Satheesh, S. K., Sherwood, S., Stevens, B., and Zhang, X. Y.: Clouds and aerosols, in: Climate Change 2013: The Physical Science Basis. Contribution of Working Group I to the Fifth Assessment Report of the Intergovernmental Panel on Climate Change, pp. 571–657, Cambridge University Press, Cambridge, UK, https://doi.org/10.1017/CBO9781107415324.016, 2013. a
Brandes, E. A., Ikeda, K., Zhang, G., Schönhuber, M., and Rasmussen, R. M.: A Statistical and Physical Description of Hydrometeor Distributions in Colorado Snowstorms Using a Video Disdrometer, Journal of Applied Meteorology and Climatology, 46, 634–650, https://doi.org/10.1175/jam2489.1, 2007. a, b
Bühl, J.: Combined lidar and radar observations of vertical motions and heterogeneous ice formation in mixed-phase layered clouds, Ph.D. thesis, Leipzig University, Leipzig, Germany, https://nbn-resolving.org/urn:nbn:de:bsz:15-qucosa-171998 (last access: 18 March 2026), 2015. a
Bühl, J., Seifert, P., Wandinger, U., Baars, H., Kanitz, T., Schmidt, J., Myagkov, A., Engelmann, R., Skupin, A., Heese, B., Klepel, A., Althausen, D., and Ansmann, A.: LACROS: the Leipzig Aerosol and Cloud Remote Observations System, in: SPIE Proceedings, edited by: Comeron, A., Kassianov, E. I., Schäfer, K., Stein, K., and Gonglewski, J. D., SPIE, https://doi.org/10.1117/12.2030911, 2013. a
Bühl, J., Seifert, P., Radenz, M., Baars, H., and Ansmann, A.: Ice crystal number concentration from lidar, cloud radar and radar wind profiler measurements, Atmospheric Measurement Techniques, 12, 6601–6617, https://doi.org/10.5194/amt-12-6601-2019, 2019. a, b, c, d, e
Engelmann, R., Ansmann, A., Ohneiser, K., Griesche, H., Radenz, M., Hofer, J., Althausen, D., Dahlke, S., Maturilli, M., Veselovskii, I., Jimenez, C., Wiesen, R., Baars, H., Bühl, J., Gebauer, H., Haarig, M., Seifert, P., Wandinger, U., and Macke, A.: Wildfire smoke, Arctic haze, and aerosol effects on mixed-phase and cirrus clouds over the North Pole region during MOSAiC: an introduction, Atmospheric Chemistry and Physics, 21, 13397–13423, https://doi.org/10.5194/acp-21-13397-2021, 2021. a
Feret: A Python Module to Calculate the Feret Diameter of Binary Images, version 1.3.1, Python Package Index (PyPI), https://pypi.org/project/feret/ (last access: 20 August 2025), 2022. a
Findeisen, W.: Kolloid-meteorologische Vorgänge bei Niederschlags-bildung, Meteorologische Zeitung, 55, 121–133, 1938. a
Forster, P., Storelvmo, T., Armour, K., Collins, W., Dufresne, J.-L., Frame, D., Lunt, D. J., Mauritsen, T., Palmer, M. D., Watanabe, M., Wild, M., and Zhang, H.: The Earth’s Energy Budget, Climate Feedbacks, and Climate Sensitivity, pp. 923–1054, Cambridge University Press, Cambridge, United Kingdom and New York, NY, USA, https://doi.org/10.1017/9781009157896.009, 2021. a
Fuchs, C., Ramelli, F., Miller, A. J., Omanovic, N., Spirig, R., Zhang, H., Seifert, P., Ohneiser, K., Lohmann, U., and Henneberger, J.: Quantifying ice crystal growth rates in natural clouds from glaciogenic cloud seeding experiments, Atmospheric Chemistry and Physics, 25, 12177–12196, https://doi.org/10.5194/acp-25-12177-2025, 2025. a
Gaudek, T.: Co-located observations of liquid and ice precipitation hydrometeors with a two-dimensional video disdrometer, a holographic cloud in-situ sonde, and active remote sensing, Master's thesis, Leipzig University, https://nbn-resolving.org/urn:nbn:de:bsz:15-qucosa2-941957 (last access: 18 March 2026), 2024. a
Gaudek, T. and Klamt, A.: Python software: Plotting two-dimensional images of particles measured by a 2DVD, Zenodo [code], https://doi.org/10.5281/zenodo.17869321, 2025. a, b
Gaudek, T., Klamt, A., and Seifert, P.: Python software: Two-dimensional video disdrometer (2DVD): Calculating the maximum Feret diameter for each detected hydrometeor, Zenodo [code], https://doi.org/10.5281/zenodo.16894362, 2025a. a
Gaudek, T., Seifert, P., and Ohneiser, K.: Dataset: 2DVD and radar data for the AMT publication “Contribution of the 2DVD to the investigation of cloud microphysics during the MOSAiC and Cloudlab/PolarCAP campaigns”, Zenodo [data set], https://doi.org/10.5281/zenodo.16676550, 2025b. a
Gavrilov, S., Kubo, M., Tran, V. A., Ngo, D. L., Nguyen, N. G., Nguyen, L. A. T., Lumbanraja, F. R., Phan, D., and Satou, K.: Feature Analysis and Classification of Particle Data from Two-Dimensional Video Disdrometer, Advances in Remote Sensing, 04, 1–14, https://doi.org/10.4236/ars.2015.41001, 2015. a, b, c
Grazioli, J., Tuia, D., Monhart, S., Schneebeli, M., Raupach, T., and Berne, A.: Hydrometeor classification from two-dimensional video disdrometer data, Atmospheric Measurement Techniques, 7, 2869–2882, https://doi.org/10.5194/amt-7-2869-2014, 2014. a, b, c, d, e, f
Griesche, H. J., Seifert, P., Ansmann, A., Baars, H., Barrientos Velasco, C., Bühl, J., Engelmann, R., Radenz, M., Zhenping, Y., and Macke, A.: Application of the shipborne remote sensing supersite OCEANET for profiling of Arctic aerosols and clouds during Polarstern cruise PS106, Atmospheric Measurement Techniques, 13, 5335–5358, https://doi.org/10.5194/amt-13-5335-2020, 2020. a
Guichard, F. and Couvreux, F.: A short review of numerical cloud-resolving models, Tellus A: Dynamic Meteorology and Oceanography, 69, 1373578, https://doi.org/10.1080/16000870.2017.1373578, 2017. a
Hanesch, M.: Fall velocity and shape of snowflakes, Ph.D. thesis, ETH Zürich, https://doi.org/10.3929/ETHZ-A-003837623, 1999. a, b
Helms, C. N., Munchak, S. J., Tokay, A., and Pettersen, C.: A comparative evaluation of snowflake particle shape estimation techniques used by the Precipitation Imaging Package (PIP), Multi-Angle Snowflake Camera (MASC), and Two-Dimensional Video Disdrometer (2DVD), Atmospheric Measurement Techniques, 15, 6545–6561, https://doi.org/10.5194/amt-15-6545-2022, 2022. a
Henneberger, J., Ramelli, F., Spirig, R., Omanovic, N., Miller, A. J., Fuchs, C., Zhang, H., Bühl, J., Hervo, M., Kanji, Z. A., Ohneiser, K., Radenz, M., Rösch, M., Seifert, P., and Lohmann, U.: Seeding of Supercooled Low Stratus Clouds with a UAV to Study Microphysical Ice Processes: An Introduction to the CLOUDLAB Project, Bulletin of the American Meteorological Society, 104, E1962–E1979, https://doi.org/10.1175/bams-d-22-0178.1, 2023. a, b, c
Heymsfield, A. J. and Westbrook, C. D.: Advances in the Estimation of Ice Particle Fall Speeds Using Laboratory and Field Measurements, Journal of the Atmospheric Sciences, 67, 2469–2482, https://doi.org/10.1175/2010jas3379.1, 2010. a
Hoose, C. and Möhler, O.: Heterogeneous ice nucleation on atmospheric aerosols: a review of results from laboratory experiments, Atmospheric Chemistry and Physics, 12, 9817–9854, https://doi.org/10.5194/acp-12-9817-2012, 2012. a
Huang, G.-J., Bringi, V. N., Cifelli, R., Hudak, D., and Petersen, W. A.: A Methodology to Derive Radar Reflectivity–Liquid Equivalent Snow Rate Relations Using C-Band Radar and a 2D Video Disdrometer, Journal of Atmospheric and Oceanic Technology, 27, 637–651, https://doi.org/10.1175/2009jtecha1284.1, 2010. a, b
Huang, G.-J., Bringi, V. N., Moisseev, D., Petersen, W. A., Bliven, L., and Hudak, D.: Use of 2D-video disdrometer to derive mean density–size and Ze–SR relations: Four snow cases from the light precipitation validation experiment, Atmospheric Research, 153, 34–48, https://doi.org/10.1016/j.atmosres.2014.07.013, 2015. a
IPCC: Climate Change 2021 – The Physical Science Basis: Working Group I Contribution to the Sixth Assessment Report of the Intergovernmental Panel on Climate Change, Cambridge University Press, ISBN 9781009157896, https://doi.org/10.1017/9781009157896, 2021. a
Jimenez, C., Ansmann, A., Engelmann, R., Donovan, D., Malinka, A., Seifert, P., Wiesen, R., Radenz, M., Yin, Z., Bühl, J., Schmidt, J., Barja, B., and Wandinger, U.: The dual-field-of-view polarization lidar technique: a new concept in monitoring aerosol effects in liquid-water clouds – case studies, Atmospheric Chemistry and Physics, 20, 15265–15284, https://doi.org/10.5194/acp-20-15265-2020, 2020. a
Jimenez, C., Ansmann, A., Ohneiser, K., Griesche, H., Engelmann, R., Radenz, M., Hofer, J., Althausen, D., Knopf, D. A., Dahlke, S., Bühl, J., Baars, H., Seifert, P., and Wandinger, U.: MOSAiC studies of long-lasting mixed-phase cloud events and analysis of the liquid-phase properties of Arctic clouds, Atmospheric Chemistry and Physics, 25, 12955–12981, https://doi.org/10.5194/acp-25-12955-2025, 2025. a, b, c, d, e, f
Kanitz, T., Seifert, P., Ansmann, A., Engelmann, R., Althausen, D., Casiccia, C., and Rohwer, E. G.: Contrasting the impact of aerosols at northern and southern midlatitudes on heterogeneous ice formation, Geophysical Research Letters, 38, L17802, https://doi.org/10.1029/2011gl048532, 2011. a
Kanji, Z. A., Ladino, L. A., Wex, H., Boose, Y., Burkert-Kohn, M., Cziczo, D. J., and Krämer, M.: Overview of Ice Nucleating Particles, Meteorological Monographs, 58, 1.1–1.33, https://doi.org/10.1175/amsmonographs-d-16-0006.1, 2017. a
Kärcher, B.: A parameterization of cirrus cloud formation: Homogeneous freezing of supercooled aerosols, Journal of Geophysical Research, 107, https://doi.org/10.1029/2001jd000470, 2002. a
Kleinkort, C., Huang, G.-J., Bringi, V. N., and Notaroš, B. M.: Visual Hull Method for Realistic 3D Particle Shape Reconstruction Based on High-Resolution Photographs of Snowflakes in Free Fall from Multiple Views, Journal of Atmospheric and Oceanic Technology, 34, 679–702, https://doi.org/10.1175/jtech-d-16-0099.1, 2017. a
Kollias, P., Clothiaux, E. E., Miller, M. A., Albrecht, B. A., Stephens, G. L., and Ackerman, T. P.: Millimeter-Wavelength Radars: New Frontier in Atmospheric Cloud and Precipitation Research, Bulletin of the American Meteorological Society, 88, 1608–1624, https://doi.org/10.1175/bams-88-10-1608, 2007. a
Kruger, A. and Krajewski, W. F.: Two-Dimensional Video Disdrometer: A Description, Journal of Atmospheric and Oceanic Technology, 19, 602–617, https://doi.org/10.1175/1520-0426(2002)019<0602:tdvdad>2.0.co;2, 2002. a, b, c
Lee, J.-E., Jung, S.-H., Park, H.-M., Kwon, S., Lin, P.-L., and Lee, G.: Classification of precipitation types using fall velocity-diameter relationships from 2D-video distrometer measurements, Advances in Atmospheric Sciences, 32, 1277–1290, https://doi.org/10.1007/s00376-015-4234-4, 2015. a, b, c, d
Leinonen, J., Grazioli, J., and Berne, A.: Reconstruction of the mass and geometry of snowfall particles from multi-angle snowflake camera (MASC) images, Atmospheric Measurement Techniques, 14, 6851–6866, https://doi.org/10.5194/amt-14-6851-2021, 2021. a
Locatelli, J. D. and Hobbs, P. V.: Fall speeds and masses of solid precipitation particles, Journal of Geophysical Research, 79, 2185–2197, https://doi.org/10.1029/jc079i015p02185, 1974. a
Lohmann, U. and Feichter, J.: Global indirect aerosol effects: a review, Atmospheric Chemistry and Physics, 5, 715–737, https://doi.org/10.5194/acp-5-715-2005, 2005. a
Maahn, M., Moisseev, D., Steinke, I., Maherndl, N., and Shupe, M. D.: Introducing the Video In Situ Snowfall Sensor (VISSS), Atmospheric Measurement Techniques, 17, 899–919, https://doi.org/10.5194/amt-17-899-2024, 2024. a, b
Maturilli, M., Holdridge, D. J., Dahlke, S., Graeser, J., Sommerfeld, A., Jaiser, R., Deckelmann, H., and Schulz, A.: Initial radiosonde data from 2019-10 to 2020-09 during project MOSAiC, Pangaea [data set], https://doi.org/10.1594/PANGAEA.928656, 2021. a, b, c, d
Miller, A. J., Fuchs, C., Ramelli, F., Zhang, H., Omanovic, N., Spirig, R., Marcolli, C., Kanji, Z. A., Lohmann, U., and Henneberger, J.: Quantified ice-nucleating ability of AgI-containing seeding particles in natural clouds, Atmospheric Chemistry and Physics, 25, 5387–5407, https://doi.org/10.5194/acp-25-5387-2025, 2025a. a
Miller, A. J., Ramelli, F., Fuchs, C., Omanovic, N., Spirig, R., Zhang, H., Lohmann, U., Kanji, Z. A., and Henneberger, J.: Two new multirotor uncrewed aerial vehicles (UAVs) for glaciogenic cloud seeding and aerosol measurements within the CLOUDLAB project, Atmospheric Measurement Techniques, 17, 601–625, https://doi.org/10.5194/amt-17-601-2024, 2024b. a
Mitchell, D. L.: Use of Mass- and Area-Dimensional Power Laws for Determining Precipitation Particle Terminal Velocities, Journal of the Atmospheric Sciences, 53, 1710–1723, https://doi.org/10.1175/1520-0469(1996)053<1710:uomaad>2.0.co;2, 1996. a
Morrison, H., de Boer, G., Feingold, G., Harrington, J., Shupe, M. D., and Sulia, K.: Resilience of persistent Arctic mixed-phase clouds, Nature Geoscience, 5, 11–17, https://doi.org/10.1038/ngeo1332, 2011. a, b
Myagkov, A., Seifert, P., Wandinger, U., Bühl, J., and Engelmann, R.: Relationship between temperature and apparent shape of pristine ice crystals derived from polarimetric cloud radar observations during the ACCEPT campaign, Atmospheric Measurement Techniques, 9, 3739–3754, https://doi.org/10.5194/amt-9-3739-2016, 2016. a, b, c, d
Myagkov, A., Nomokonova, T., and Frech, M.: Empirical model for backscattering polarimetric variables in rain at W-band: motivation and implications, Atmospheric Measurement Techniques, 18, 1621–1640, https://doi.org/10.5194/amt-18-1621-2025, 2025. a
Ohneiser, K., Ansmann, A., Chudnovsky, A., Engelmann, R., Ritter, C., Veselovskii, I., Baars, H., Gebauer, H., Griesche, H., Radenz, M., Hofer, J., Althausen, D., Dahlke, S., and Maturilli, M.: The unexpected smoke layer in the High Arctic winter stratosphere during MOSAiC 2019–2020 , Atmospheric Chemistry and Physics, 21, 15783–15808, https://doi.org/10.5194/acp-21-15783-2021, 2021. a
Ohneiser, K., Seifert, P., Schimmel, W., Senf, F., Gaudek, T., Radenz, M., Teisseire, A., Ettrichrätz, V., Vogl, T., Maherndl, N., Pfeifer, N., Henneberger, J., Miller, A. J., Omanovic, N., Fuchs, C., Zhang, H., Ramelli, F., Spirig, R., Kötsche, A., Kalesse-Los, H., Maahn, M., Corden, H., Berne, A., Hajipour, M., Griesche, H., Hofer, J., Engelmann, R., Skupin, A., Ansmann, A., and Baars, H.: Impact of seeder-feeder cloud interaction on precipitation formation: a case study based on extensive remote-sensing, in-situ and model data, EGUsphere [preprint], https://doi.org/10.5194/egusphere-2025-2482, 2025. a, b
Omanovic, N., Ferrachat, S., Fuchs, C., Henneberger, J., Miller, A. J., Ohneiser, K., Ramelli, F., Seifert, P., Spirig, R., Zhang, H., and Lohmann, U.: Evaluating the Wegener-Bergeron-Findeisen process in ICON in large-eddy mode with in situ observations from the CLOUDLAB project, EGUsphere [preprint], https://doi.org/10.5194/egusphere-2023-3029, 2024. a
Omanovic, N., Ferrachat, S., Fuchs, C., Ramelli, F., Henneberger, J., Miller, A. J., Spirig, R., Zhang, H., and Lohmann, U.: Chasing Ice Crystals: Interlinking Cloud Microphysics and Dynamics in Cloud Seeding Plumes With Lagrangian Trajectories, Journal of Advances in Modeling Earth Systems, 17, https://doi.org/10.1029/2025ms005016, 2025. a
Pasquier, J. T., Henneberger, J., Korolev, A., Ramelli, F., Wieder, J., Lauber, A., Li, G., David, R. O., Carlsen, T., Gierens, R., Maturilli, M., and Lohmann, U.: Understanding the History of Two Complex Ice Crystal Habits Deduced From a Holographic Imager, Geophysical Research Letters, 50, https://doi.org/10.1029/2022gl100247, 2023. a
Polly: PollyNET lidar data base, Leibniz Institute for Tropospheric Research (TROPOS), http://polly.tropos.de/ (last access: 25 July 2025), 2025. a
Radenz, M., Bühl, J., Seifert, P., Baars, H., Engelmann, R., Barja González, B., Mamouri, R.-E., Zamorano, F., and Ansmann, A.: Hemispheric contrasts in ice formation in stratiform mixed-phase clouds: disentangling the role of aerosol and dynamics with ground-based remote sensing, Atmospheric Chemistry and Physics, 21, 17969–17994, https://doi.org/10.5194/acp-21-17969-2021, 2021. a, b
Ramelli, F., Beck, A., Henneberger, J., and Lohmann, U.: Using a holographic imager on a tethered balloon system for microphysical observations of boundary layer clouds, Atmospheric Measurement Techniques, 13, 925–939, https://doi.org/10.5194/amt-13-925-2020, 2020. a, b, c
Ramelli, F., Henneberger, J., David, R. O., Bühl, J., Radenz, M., Seifert, P., Wieder, J., Lauber, A., Pasquier, J. T., Engelmann, R., Mignani, C., Hervo, M., and Lohmann, U.: Microphysical investigation of the seeder and feeder region of an Alpine mixed-phase cloud, Atmospheric Chemistry and Physics, 21, 6681–6706, https://doi.org/10.5194/acp-21-6681-2021, 2021. a
Ramelli, F., Henneberger, J., Fuchs, C., Miller, A. J., Omanovic, N., Spirig, R., Zhang, H., David, R. O., Ohneiser, K., Seifert, P., and Lohmann, U.: Repurposing weather modification for cloud research showcased by ice crystal growth, PNAS Nexus, 3, https://doi.org/10.1093/pnasnexus/pgae402, 2024. a, b
Raupach, T. H., Gires, A., Tchiguirinskaia, I., Schertzer, D., and Berne, A.: Multifractal Analysis of Snowfall Recorded Using a 2D Video Disdrometer, Journal of Hydrometeorology, 18, 2453–2468, https://doi.org/10.1175/jhm-d-16-0224.1, 2017. a
Schönhuber, M., Lammer, G., and Randeu, W. L.: One decade of imaging precipitation measurement by 2D-video-distrometer, Adv. Geosci., 10, 85–90, https://doi.org/10.5194/adgeo-10-85-2007, 2007. a
Schönhuber, M., Schwinzerl, M., and Lammer, G.: 3D Reconstruction of 2DVD-measured Raindrops for Precise Prediction of Propagation Parameters, in: 2016 10th European Conference on Antennas and Propagation (EuCAP), IEEE, https://doi.org/10.1109/eucap.2016.7481929, 2016. a, b
Shupe, M. D., Rex, M., Dethloff, K., Damm, E., Fong, A. A., Gradinger, R., Heuzé, C., Loose, B., Makarov, A., Maslowski, W., Nicolaus, M., Perovich, D., Rabe, B., Rinke, A., Sokolov, V., and Sommerfeld, A.: The MOSAiC Expedition: A Year Drifting with the Arctic Sea Ice, Arctic Report Card 2020, https://doi.org/10.25923/9G3V-XH92, 2020. a
Shupe, M. D., Rex, M., Blomquist, B., Persson, P. O. G., Schmale, J., Uttal, T., Althausen, D., Angot, H., Archer, S., Bariteau, L., Beck, I., Bilberry, J., Bucci, S., Buck, C., Boyer, M., Brasseur, Z., Brooks, I. M., Calmer, R., Cassano, J., Castro, V., Chu, D., Costa, D., Cox, C. J., Creamean, J., Crewell, S., Dahlke, S., Damm, E., de Boer, G., Deckelmann, H., Dethloff, K., Dütsch, M., Ebell, K., Ehrlich, A., Ellis, J., Engelmann, R., Fong, A. A., Frey, M. M., Gallagher, M. R., Ganzeveld, L., Gradinger, R., Graeser, J., Greenamyer, V., Griesche, H., Griffiths, S., Hamilton, J., Heinemann, G., Helmig, D., Herber, A., Heuzé, C., Hofer, J., Houchens, T., Howard, D., Inoue, J., Jacobi, H.-W., Jaiser, R., Jokinen, T., Jourdan, O., Jozef, G., King, W., Kirchgaessner, A., Klingebiel, M., Krassovski, M., Krumpen, T., Lampert, A., Landing, W., Laurila, T., Lawrence, D., Lonardi, M., Loose, B., Lüpkes, C., Maahn, M., Macke, A., Maslowski, W., Marsay, C., Maturilli, M., Mech, M., Morris, S., Moser, M., Nicolaus, M., Ortega, P., Osborn, J., Pätzold, F., Perovich, D. K., Petäjä, T., Pilz, C., Pirazzini, R., Posman, K., Powers, H., Pratt, K. A., Preußer, A., Quéléver, L., Radenz, M., Rabe, B., Rinke, A., Sachs, T., Schulz, A., Siebert, H., Silva, T., Solomon, A., Sommerfeld, A., Spreen, G., Stephens, M., Stohl, A., Svensson, G., Uin, J., Viegas, J., Voigt, C., von der Gathen, P., Wehner, B., Welker, J. M., Wendisch, M., Werner, M., Xie, Z., and Yue, F.: Overview of the MOSAiC expedition: Atmosphere, Elementa: Science of the Anthropocene, 10, https://doi.org/10.1525/elementa.2021.00060, 2022. a
Teisseire, A., Seifert, P., Myagkov, A., Bühl, J., and Radenz, M.: Determination of the vertical distribution of in-cloud particle shape using SLDR-mode 35 GHz scanning cloud radar, Atmospheric Measurement Techniques, 17, 999–1016, https://doi.org/10.5194/amt-17-999-2024, 2024. a
Trömel, S., Simmer, C., Blahak, U., Blanke, A., Doktorowski, S., Ewald, F., Frech, M., Gergely, M., Hagen, M., Janjic, T., Kalesse-Los, H., Kneifel, S., Knote, C., Mendrok, J., Moser, M., Köcher, G., Mühlbauer, K., Myagkov, A., Pejcic, V., Seifert, P., Shrestha, P., Teisseire, A., von Terzi, L., Tetoni, E., Vogl, T., Voigt, C., Zeng, Y., Zinner, T., and Quaas, J.: Overview: Fusion of radar polarimetry and numerical atmospheric modelling towards an improved understanding of cloud and precipitation processes, Atmospheric Chemistry and Physics, 21, 17291–17314, https://doi.org/10.5194/acp-21-17291-2021, 2021. a
Vogl, T., Maahn, M., Kneifel, S., Schimmel, W., Moisseev, D., and Kalesse-Los, H.: Using artificial neural networks to predict riming from Doppler cloud radar observations, Atmospheric Measurement Techniques, 15, 365–381, https://doi.org/10.5194/amt-15-365-2022, 2022. a
von Terzi, L., Ori, D., and Kneifel, S.: A Microwave Scattering Database of Oriented Ice and Snow Particles: Supporting Habit-Dependent Growth Models and Radar Applications (McRadar 1.0.0), EGUsphere [preprint], https://doi.org/10.5194/egusphere-2025-3910, 2025. a
Wanner, H. and Furger, M.: The Bise–Climatology of a regional wind north of the Alps, Meteorology and Atmospheric Physics, 43, 105–115, https://doi.org/10.1007/bf01028113, 1990. a
Wegener, A.: Thermodynamik der atmosphäre, Barth, J. A., 1911. a
Zängl, G., Reinert, D., Rípodas, P., and Baldauf, M.: The ICON (ICOsahedral Non-hydrostatic) modelling framework of DWD and MPI-M: Description of the non-hydrostatic dynamical core, Quarterly Journal of the Royal Meteorological Society, 141, 563–579, https://doi.org/10.1002/qj.2378, 2014. a
Zhang, H., Li, X., Ramelli, F., David, R. O., Pasquier, J., and Henneberger, J.: IceDetectNet: a rotated object detection algorithm for classifying components of aggregated ice crystals with a multi-label classification scheme, Atmospheric Measurement Techniques, 17, 7109–7128, https://doi.org/10.5194/amt-17-7109-2024, 2024. a
Zhang, Y., Zheng, H., Zhang, L., Huang, Y., Liu, X., and Wu, Z.: Assessing the Effect of Riming on Snow Microphysics: The First Observational Study in East China, Journal of Geophysical Research: Atmospheres, 126, https://doi.org/10.1029/2020jd033763, 2021. a, b
Zheng, H., Zhang, Y., Li, H., Wu, Z., and Zhou, Z.: Revisiting Raindrop Axis Ratios Based on 3D Oblate Spheroidal Reconstruction: 2D Video Disdrometer Observations During Tropical Cyclone Passages, Geophysical Research Letters, 50, https://doi.org/10.1029/2023gl103281, 2023. a