the Creative Commons Attribution 4.0 License.
the Creative Commons Attribution 4.0 License.
 | 10 Apr 2026
Simultaneous measurements of near-surface CO2 and NO2 to monitor the fossil-fuel combustion-derived CO2 in the Greater Tokyo Area
Hitoshi Irie
Masataka Nomoto
Yoshikazu Kamiya
Yukio Terao
Year-round continuous measurements of near-surface carbon dioxide (CO2) concentrations using in-situ trace gas analyzers were conducted simultaneously with nitrogen dioxide (NO2) measurements by International Air Quality and SKY Research Remote Sensing Network (A-SKY) Multi-Axis Differential Optical Absorption Spectroscopy (MAX-DOAS) at Chiba (35.625° N, 140.104° E, 60 m above sea level), located within the Greater Tokyo Area, Japan, during 2024. These simultaneous measurements revealed that CO2 concentrations were low on days when near-surface NO2 concentrations were markedly reduced. Furthermore, the CO2 enhancement relative to the baseline concentration determined based on such low-NO2-concentration days ([ΔCO2]N) was positively correlated with NO2 and black carbon concentrations. This finding indicates that [ΔCO2]N is useful in observing the increase in fossil-fuel combustion-derived CO2 within the Greater Tokyo Area. By employing this relatively simple method, CO2 concentrations in megacities such as the Grater Tokyo Area can be monitored with high accuracy and precision, contributing to more effective emission mitigation strategies.
- Article
(4409 KB) - Full-text XML
- BibTeX
- EndNote


The escalating climate crisis underscores the urgent need for precise monitoring of greenhouse gas emissions, particularly carbon dioxide (CO2), which remains the dominant anthropogenic driver of global warming (e.g., IPCC, 2021). Megacities – urban agglomerations with populations exceeding ten million – are disproportionately responsible for global CO2 emissions due to concentrated energy consumption, transportation, and industrial activity. Establishing robust monitoring frameworks in megacities is thus essential to bridge local action with global climate goals, ensuring that mitigation strategies are evidence-based, transparent, and effective. Effective mitigation of fossil-fuel CO2 emissions requires continuous monitoring of atmospheric CO2 concentrations. However, globally, only a limited number of megacity sites conduct continuous measurements of CO2 concentrations near the surface (e.g., Li et al., 2026).
The Greater Tokyo Area, which is sometimes conventionally referred to as the Tokyo megacity, is one of the world's largest metropolitan areas, with a population exceeding 37 million as of 2018 (UNPD, 2018). The Greater Tokyo Area comprises Tokyo and its surrounding major cities, including Yokohama, Kawasaki, Saitama, and Chiba, along with their connected suburban districts. The primary sources of anthropogenic CO2 emissions in Tokyo are power generation, automobile transportation, and industry (Long and Yoshida, 2018). Large point sources, such as power plants and steelworks, are located along the Tokyo Bay Area. In residential areas, fossil fuel-related CO2 emissions arise from household gas consumption and traffic exhaust (Hirano et al., 2015). Sugawara et al. (2021) investigated anthropogenic CO2 emission changes in an urban area of Tokyo during the COVID-19 pandemic and found that the CO2 emissions decreased by 20 % during the COVID-19 state of emergency compared to the same period during the past few years, mainly due to a decrease in car traffic. On the other hand, Shirai et al. (2012) analyzed aircraft CO2 data over the Tokyo metropolitan region and found strong influences of fossil fuel CO2 originating from the Asian continent. Therefore, it is necessary to account for the significant contribution from the Asian continent, to evaluate or estimate emissions from the Greater Tokyo Area.
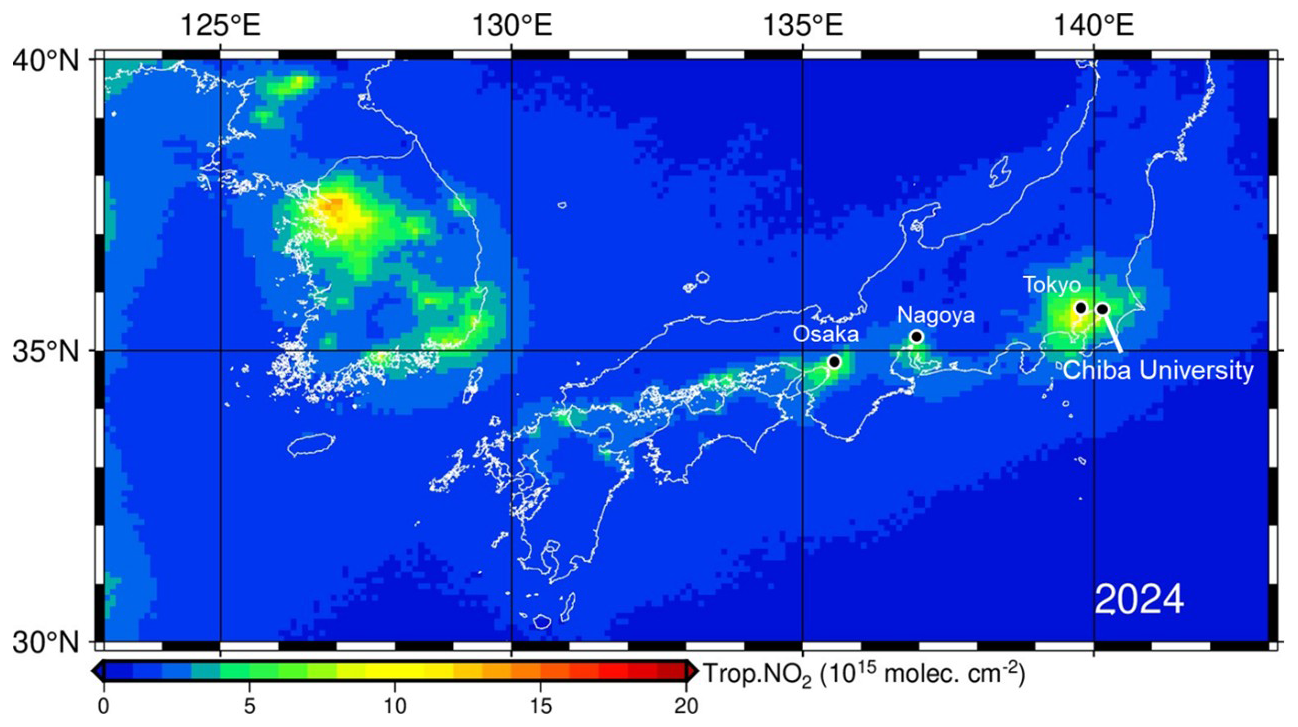
Figure 1Location of Chiba University. Observations were conducted at the Chiba University Atmospheric Environment Observation Supersite, located on the Nishi-Chiba campus of Chiba University. The colors show the annual mean tropospheric NO2 column concentration for 2024, retrieved from the Tropospheric Ozone Monitoring Instrument (TROPOMI) aboard Sentinel-5 Precursor (S5P) satellite (Verhoelst et al., 2021).
To constrain anthropogenic emissions of CO2 from the Tokyo Bay Area, Pisso et al. (2019) employed a Lagrangian inverse model together with data from in-situ aircraft CO2 observations by the Comprehensive Observation Network for TRace gases by AIrLiner (CONTRAIL), the Tsukuba tall tower of the Meteorological Research Institute (MRI) of the Japan Meteorological Agency, and surface sites from the World Data Center for Greenhouse Gases (WDCGG). As one of their conclusions, the challenges in estimating regional CO2 fluxes from atmospheric observations were highlighted. Bisht et al. (2025) performed regional model simulations (WRF-GHG) with an improved resolution of 1×1 km2 and found that point-source CO2 emission and vertical distributions of CO2 were better captured and represented. Yamada et al. (2025) conducted global high-resolution simulations of atmospheric CO2 using flux data derived from global inverse analysis. Their simulations reproduced CO2 variations at remote sites around Japan. Application of tagged tracers in the simulations revealed that variations in CO2 concentrations at approximately 250 m above ground level from the Tokyo Skytree (35.71° N, 139.81° E) strongly depend on fluxes from the southwestern part of Tokyo, including the western Tokyo Bay Area where large power plants are located. Based on the results, Yamada et al. (2025) argued the necessity of CO2 observations that can capture emissions from the east coast of Tokyo Bay Area.
Here, the present study focuses on the Chiba University Atmospheric Environment Observation Supersite (35.625° N, 140.104° E, 60 m above sea level) (Fig. 1), which is a key site in the international observation networks; International Air Quality and Sky Research Remote Sensing (A-SKY) network (e.g., Irie et al., 2021; Mizobuchi et al., 2025) and skyradiometer network (SKYNET) (e.g., Nakajima et al., 2020; Irie and Nakajima, 2022). Chiba is one of the key cities consisting of the Grater Tokyo Area, being located east of Tokyo, and lying downstream of major sources of air pollution (Fig. 1). From the satellite-retrieved tropospheric nitrogen dioxide (NO2) data in Fig. 1, it is also evident that the Greater Tokyo Area is isolated from other major urban areas such as Nagoya and Osaka. At this important site, we conducted year-round continuous measurements of near-surface CO2 concentrations using in-situ trace gas analyzers and ground-based remote sensing using the A-SKY Multi-Axis Differential Optical Absorption Spectroscopy (A-SKY/MAX-DOAS). From these simultaneous measurements, an attempt was made to clarify the usefulness of simultaneous measurements of CO2 and NO2 measurement for simple and accurate monitoring of fossil-fuel combustion-derived CO2 concentrations in the Greater Tokyo Area.
In the Chiba University Atmospheric Environment Observation Supersite, which is located east of Tokyo (Fig. 1), we conducted year-round continuous measurements of near-surface CO2 concentrations using two different in-situ trace gas analyzer instruments in 2024. One is the LI-7810 trace gas analyzer (LI-COR, Inc.), which employs a high-precision single-frequency laser and uses Optical Feedback-Cavity Enhanced Absorption Spectroscopy (OF-CEAS) – a technique that combines Cavity-Enhanced Absorption Spectroscopy (CEAS) with Optical Feedback (OF) from a V-shaped optical cavity (Morville et al., 2014; Romanini et al., 2014). While the LI-7810 is optimized for precise methane (CH4) measurements, it also provides concurrent measurements of CO2 and water vapor (H2O). Since the LI-7810 detects inherently weak CO2 absorption signals that overlap with those of H2O, the occurrence of drift, including H2O-related interference, is anticipated. It should be noted that the LI-7810 outputs CO2 concentration data for dry air. The other is the G4301 Cavity Ring-Down Spectrometer analyzer (Picarro, Inc.). On the rooftop of the same building, at 60 m above sea level, these two trace gas analyzers were operated simultaneously, each using its own inlet to conduct measurements independently. Measurements using the G4301 were calibrated regularly using three working standard gases that were further calibrated against the National Institute for Environmental Studies (NIES) CO2 standard scale (Machida et al., 2011). Air samples for the G4301 were dehumidified by passing through a Nafion dryer. On the other hand, the observations using the LI-7810 were conducted without performing regular calibrations and without dehumidifying the sampled air. This approach was adopted to explore whether useful automated long-term measurements could be achieved with lower effort.
Simultaneously with the trace gas analyzers, we conducted measurements using the MAX-DOAS technique. Its principle is based on the DOAS method (e.g., Platt and Stutz, 2008), which derives trace gas concentrations using Lambert–Beer's law by exploiting the characteristic absorption spectral structures of target species contained in hyperspectral measurements with high wavelength resolution. The measured hyperspectra include not only absorption features of trace gases but also influences from Rayleigh and Mie scattering. These lower-frequency (smooth wavelength-dependent) structures are approximated and removed using polynomials. This enables the identification of absorptions as weak as 0.1 % and allows highly precise retrieval of trace gas concentrations.
MAX-DOAS is a passive DOAS technique enhanced with multiple low-elevation angle measurements. Despite its relatively simple instrumentation, MAX-DOAS achieves precise retrievals by combining hyperspectral measurements at multiple elevation angles with high-accuracy wavelength calibration using Fraunhofer lines, radiative transfer modeling that accounts for atmospheric sphericity, and nonlinear inversion solved via the Levenberg–Marquardt method based on Bayes' theorem (e.g., Irie et al., 2011). This enables simultaneous retrieval of vertical distribution information of aerosols and trace gases in the lower troposphere.
At Chiba, four A-SKY/MAX-DOAS systems were operated simultaneously, each directed toward a different azimuth angle: north (13° W), west (95° W), east (118° E), and south (175° E) (Irie et al., 2021; Mizobuchi et al., 2025). Each system consists mainly of a high-resolution ultraviolet–visible spectrometer (Maya2000Pro, Ocean Insight; 2048 detector channels, spectral resolution 0.2–0.4 nm), a telescope unit (manufactured by Prede Co., Ltd.), and optical fibers. Hyperspectral measurements obtained with this system are analyzed using our algorithm called the Japanese MAX-DOAS profile retrieval algorithm, version 2 (JM2) (Irie et al., 2008, 2011, 2015, 2019, 2021). JM2 simultaneously retrieves vertical profiles and tropospheric columns of eight components: NO2, H2O, formaldehyde, glyoxal, sulfur dioxide, ozone, and aerosol extinction coefficients at two wavelengths. Based on nearly two decades of experience with MAX-DOAS, we adopt elevation angles of 2, 3, 4, 6, 8, and 70° as standard. Instead of 90, 70° is used as the reference angle, which stabilizes the signal range across all elevation angles while maintaining constant spectrometer integration time. In the vertical profile retrieval, the elevation angle settings were fully accounted in the radiative transfer calculations used to compute the differential air mass factors (e.g., Irie et al., 2011, 2015, 2019). Low elevation angles are set below 10°, which minimizes potential systematic errors from oxygen collision complexes (O4; O2–O2), reduces sensitivity to high-altitude retrievals (thus suppressing cloud interference), and enhances sensitivity to lower altitudes (Irie et al., 2015). Our unique MAX-DOAS observations are conducted within the framework of the international A-SKY ground-based remote sensing network (Irie et al., 2021) and are referred to as A-SKY/MAX-DOAS to distinguish them from other MAX-DOAS observations (e.g., Mizobuchi et al., 2025).
To enhance the spatial representativeness around Chiba, which is located in an urban area, the average of the observations from these four azimuth directions was used in the analysis described below. Indeed, the obtained aerosol optical properties and trace gas concentration data have high spatial representativeness, extending several kilometers or longer in the horizontal direction, as recent studies by Damiani et al. (2021, 2022) showed a clear positive correlation between fine-mode aerosol absorption optical depth in the 0–1 km altitude range derived from these observations and black carbon (BC) mass concentrations measured using a Black Carbon Monitor (BCM3130; Kanomax Japan). BCM3130 was developed initially as Continuous Soot Monitoring System (COSMOS) by Miyazaki et al. (2008) and Kondo et al. (2009). The correlation ensures the spatial representativeness of the measured BC mass concentrations. At this well-characterized observation site, we conducted continuous measurements of CO2 concentrations using trace gas analyzers of LI-7810 and G4301 together with A-SKY/MAX-DOAS.
Figure 2a and b show the time series of CO2 concentrations measured using LI-7810 and G4301 at the Chiba University Atmospheric Environment Supersite in 2024. Hourly averages are plotted. As mentioned above, while the G4301 was calibrated with standard gases, the LI-7810 data are uncalibrated raw data. Nevertheless, both datasets exhibit variations between 420 and 600 ppmv, and within this relatively wide concentration range, both instruments exhibited approximately the same temporal variations. However, when their difference was analyzed, it was found that the difference varied gradually on a seasonal timescale (Fig. 2c). Over the course of 2024, the mean difference (± standard deviation) was ppmv. In addition, the differences spanned a relatively wide range from −16.9 to 26.5 ppmv. A pronounced difference of 26.5 ppmv occurred at 01:00 LT on 3 December (a day number of 338). At that time, the G4301 indicated 448.5 ppmv, whereas the LI-7810 measured 470.0 ppmv. The standard deviation of the 1 min values within that hour was as high as 12.5 ppmv (∼2.8 %). This may have resulted from measuring a high-CO2-concentration plume with relatively low spatial representativeness, particularly in urban atmospheres, due to imperfect coincidence of sampling location or timing. Thus, the complete removal of possible influence of an unexpected, highly localized emission source is challenging for monitoring of urban atmospheres.
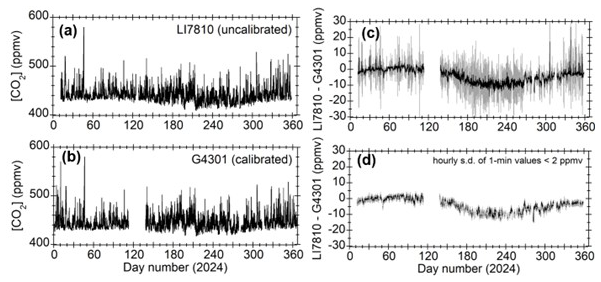
Figure 2Time series plots of CO2 concentrations measured using (a) G4301 and (b) LI-7810 at the Chiba University Atmospheric Environment Observation Supersite in 2024. Hourly averages are shown. Note that the G4301 was calibrated with standard gases and dehumidified, whereas the LI-7810 data are uncalibrated raw values. (c) Differences between LI-7810 and G4301 CO2 concentrations. The gray shading indicates the 1σ standard deviation of the 1 min values within each hour for LI-7810. (d) Differences between LI-7810 and G4301 CO2 concentrations plotted only for hours in which the standard deviation was ≤2 ppmv.
To characterize these features further, a histogram of the standard deviations of the 1 min values within each hour was examined for each of the LI-7810 and G4301 datasets (Fig. 3). The total numbers of hourly data points over the year were 8092 and 7036, respectively. Of these, nearly half had standard deviations of ≤2 ppmv. Conversely, the remaining half showed variations ≥2 ppmv, and in some cases exhibited very large fluctuations of up to ∼30 ppmv. Based on these results, data with hourly standard deviations ≥2 ppmv were excluded to remove short-term large fluctuations (Fig. 2d), while it is difficult to uniquely determine the threshold. As a result, over the year 2024, the mean difference (± standard deviation) became ppmv, smaller than the mean before exclusion. Consequently, the gradual seasonal-scale variation in the differences between the two instruments became more clearly evident (Fig. 2d).
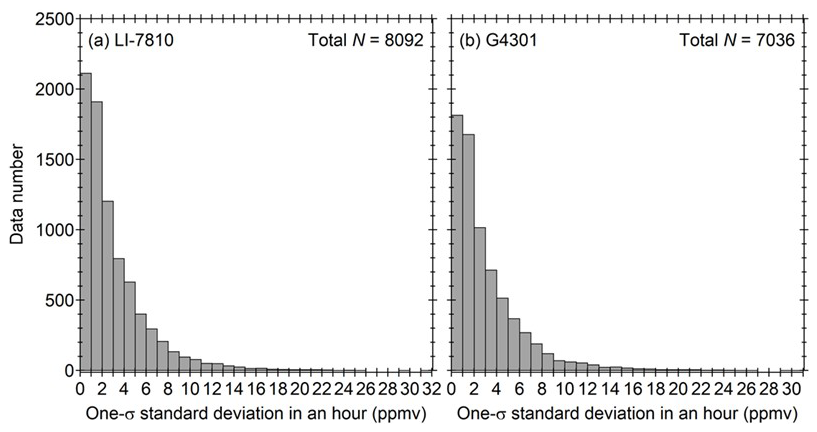
Figure 3Histograms of the 1σ standard deviations of 1 min CO2 concentration data within each hour, measured by (a) LI-7810 and (b) G4301 at the Chiba University Atmospheric Environment Supersite in 2024. The total numbers of hourly data points of LI-7810 and G4301 for the year were 8092 and 7036, respectively.
To investigate the factors causing temporal variations on this seasonal scale, we examined the relationship with H2O concentration data simultaneously derived with CO2 and CH4 by the LI-7810. Figure 4 shows not only the difference in CO2 concentration measured by the LI-7810 and G4301, but also the time series of H2O concentration derived concurrently with CO2 by the LI-7810. As is immediately apparent, larger absolute differences in CO2 concentration correspond to higher H2O concentrations, indicating a significant negative bias in the uncalibrated LI-7810 data due to the interference by H2O. It should be noted, however, that only data with a 1σ standard deviation of the 1 min values within one hour less than 2 ppmv are plotted in Fig. 4. As the histogram (Fig. 3) shows, fluctuations exceeding 10 ppmv within an hour can occur regardless of H2O concentration. In such cases, the relative importance of interference due to H2O becomes smaller.
To quantitatively understand this relationship, their correlations were analyzed (Fig. 5). As expected, a clear anti-correlation was seen. From the slope of the regression line, we quantitatively estimated that a 1 % increase in H2O concentration corresponds to a negative bias of 3.6 ppmv in the CO2 concentration. This regression line may be useful for applying a single bias-correction equation over the one-year period of 2024 and for analyses conducted on an annual timescale. However, it remains uncertain whether the H2O interference introduces a bias in CO2 concentration that consistently follows a linear relationship, and whether this works on seasonal timescales as well. In fact, although both the H2O concentrations in January and December 2024 indicate approximately 0.5 %, the CO2 concentration differences between the LI-7810 and G4301 differ by several ppmv (Fig. 4). We also found that the two groups appeared in different seasons: one corresponding to the period from April to August when H2O and temperature increase, and another corresponding to the period from September to December when they decrease. Comparing these groups, the slopes of the regression lines were similar, but the intercepts differed. The difference appears to be related to temperature and/or LI-7810 instrumental drift.
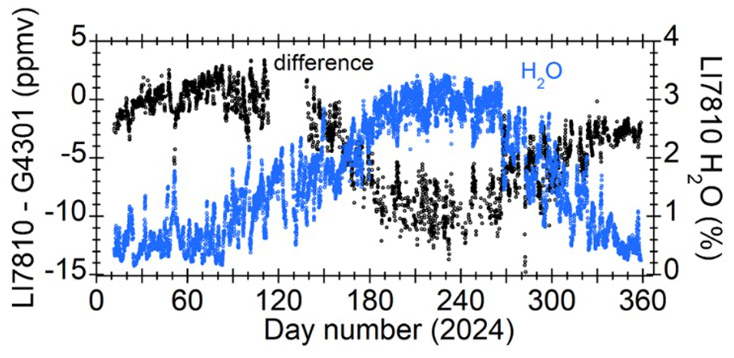
Figure 4Time series of the difference in CO2 concentration measured using the uncalibrated LI-7810 and the calibrated G4301 at the Chiba University Atmospheric Environment Supersite in 2024. Hourly averages are shown. Only differences for which the 1 h standard deviation of the 1 min data is ≤2 ppmv are plotted. The blue line indicates the time series of H2O concentration simultaneously derived with CO2 by the LI-7810.
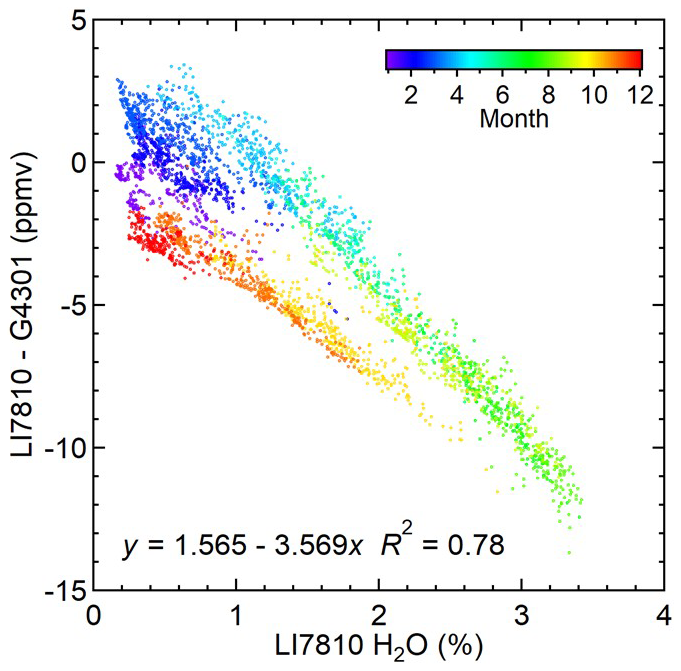
Figure 5Correlations of the difference in CO2 concentration measured using the uncalibrated LI-7810 and the calibrated G4301 with LI-7810 H2O concentration data. Month is indicated by color. The regression line and its equation are also shown.
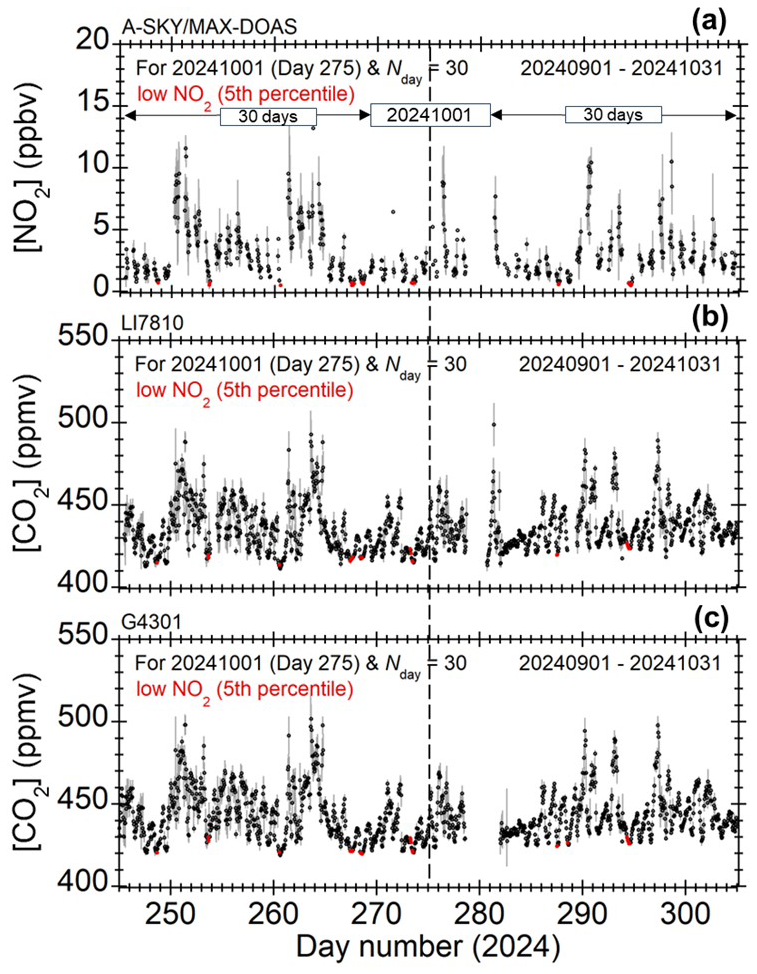
Figure 6Time series of (a) NO2 concentrations at 0–1 km altitude observed with A-SKY/MAX-DOAS and (b) LI-7810- and (c) G4301-measured CO2 concentrations at the Chiba University Atmospheric Environment Monitoring Supersite from noon on 1 September to noon on 31 October 2024. Hourly averages are plotted. This period corresponds to ±30 d (Nday=30) from noon on 1 October 2024. To estimate the expected CO2 concentration [CO]N at noon on 1 October 2024 when NO2 concentrations are not elevated, the 5th percentile of NO2 data within the ±N day period was calculated. Values below the 5th percentile are shown in red in the panel (a). The CO2 concentration data measured at those identified times are shown in red in the panels b and c. For each of LI-7810 and G4301, the average of these CO2 data was used to estimate [CO]N at noon on 1 October 2024.
Given these difficulties, an attempt was made to derive a baseline concentration ([CO2*]N) by utilizing simultaneous A-SKY/MAX-DOAS observations of NO2 concentration. Here, the brackets “[]” denote concentration. Figure 6a presents time series of NO2 concentrations at 0–1 km altitude, retrieved from A-SKY/MAX-DOAS observations, together with CO2 concentrations measured by LI-7810, covering the period from noon on 1 September to noon on 31 October 2024. This period corresponds to ±30 d (Nday=30) from noon on 1 October 2024. To estimate the expected baseline CO2 concentration [CO]N at noon on 1 October 2024 when NO2 concentrations are not elevated, the 5th percentile of NO2 data within the ±Nday period was calculated. Values below the 5th percentile are shown in red in Fig. 6a. The CO2 concentration data measured at those identified times are shown in red in Fig. 6b and c. The average of these CO2 data was used to estimate [CO]N at noon on 1 October 2024.
For the calibrated G4301, this [CO]N is considered to represent the CO2 concentration determined by factors other than local influences (primarily advection to the site), and is expected to exhibit gradual temporal variations on a seasonal timescale. In contrast, for the uncalibrated LI-7810, in addition to seasonal variations, instrumental drift is also expected to contribute. Regarding this drift, the primary timescale to be removed is the gradual seasonal-scale variation indicated by the difference between LI-7810 and G4301. Therefore, in this estimation, Nday was set to 45 d, corresponding to half of three months. However, additional variations on timescales shorter than seasonal are also anticipated. To investigate this, [CO]N was also estimated with Nday set to 30 and 10 d.
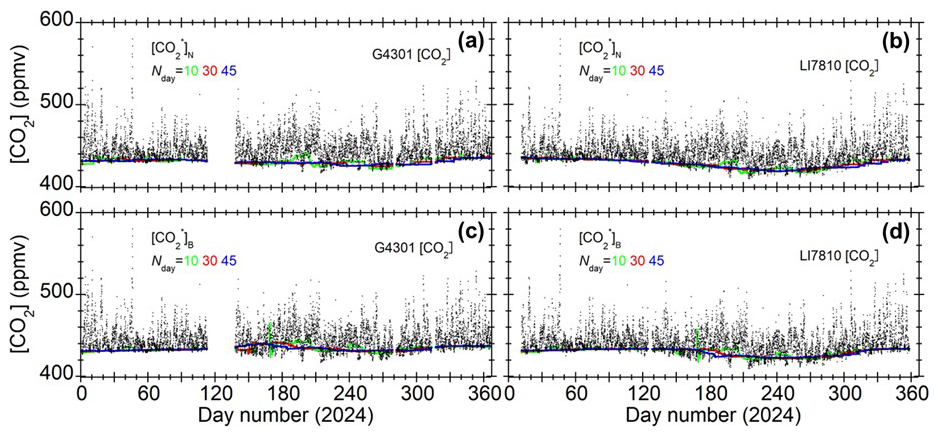
Figure 7Time series of CO2 concentrations ([CO2]) measured using (a, c) G4301 and (b, d) LI-7810. One-hour averages are plotted. As described in the text, the G4301 data are calibrated with standard gases and dehumidified, whereas the LI-7810 data are uncorrected raw data. In panels a and b, the expected CO2 concentration ([CO]N) when NO2 concentrations are not elevated is also shown, derived from simultaneous observations with A-SKY/MAX-DOAS. The green, red, and blue lines represent [CO]N estimated with Nday set to 10, 30, and 45, respectively. Panels c and d are similar, but show the expected CO2 concentration when BC concentrations are not elevated ([CO]B), based on simultaneous observations with COSMOS.
When Nday=10 was used, [CO]N exhibited short-term fluctuations as well, likely due to insufficient number of data used for accurate estimations (Fig. 7). This suggested that an Nday longer than 10 d is more appropriate. On the other hand, comparison of [CO]N time variations with Nday set to 30 and 45 d showed that both produced similar gradual seasonal-scale changes. Thus, setting Nday to 30 d was found to be sufficient. This does not preclude the use of 45 d, but since shorter timescales can also be captured, a smaller Nday is preferable.
Similarly to [CO]N, we also estimated [CO]B, the expected CO2 concentration during periods when BC concentrations measured simultaneously by COSMOS were notably low (Fig. 7). As shown, [CO]B also exhibited gradual seasonal-scale variations, supporting the [CO]N estimation. However, detailed analysis revealed that [CO]B was approximately 5 ppmv higher than [CO]N. This indicates that CO2 concentration increases can occur even when BC concentrations are very low. Such differences between [CO]B and [CO]N are interpreted, at least partly, by regulated BC emissions as a result of transitions such as from diesel to gasoline vehicles, or from coal-fired to natural gas-fired power generation.
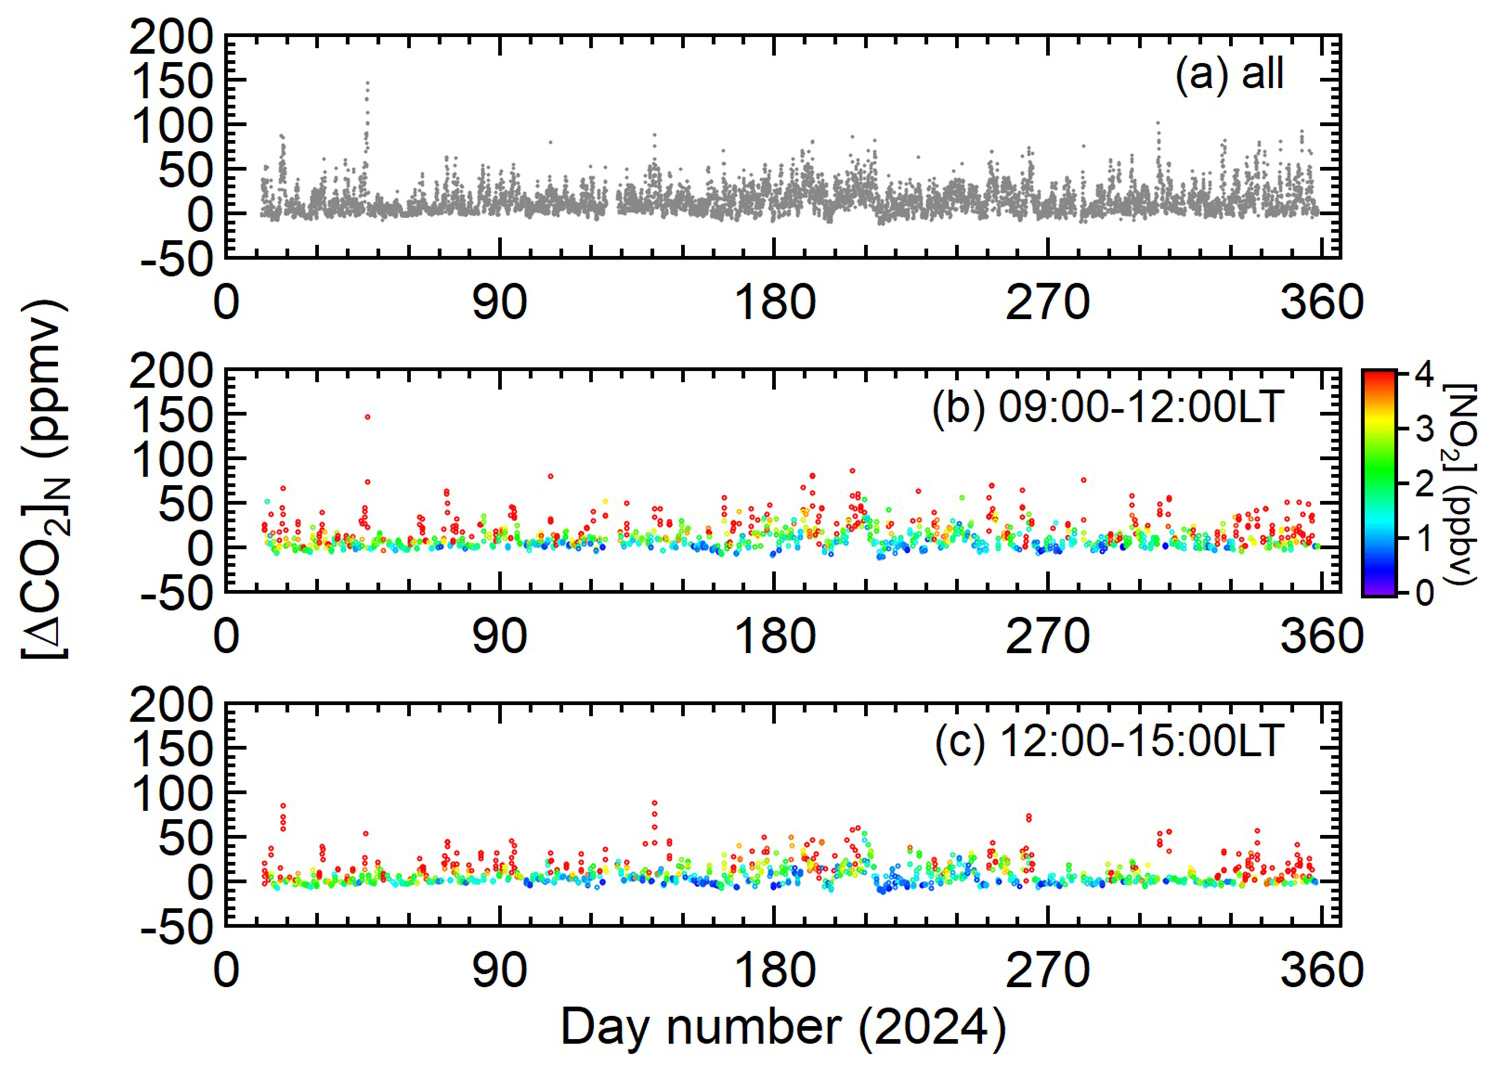
Figure 8Time series of the CO2 concentration increase ([ΔCO2]N) obtained by combining LI-7810 and A-SKY/MAX-DOAS measurements. (a) All hourly values are plotted. To improve clarity by minimizing the influence of the diurnal variation pattern of NO2, (b) the time series of [ΔCO2]N for local times of 09:00–12:00 and (c) for 12:00–15:00 are shown separately. The simultaneously measured NO2 concentrations are indicated by color.
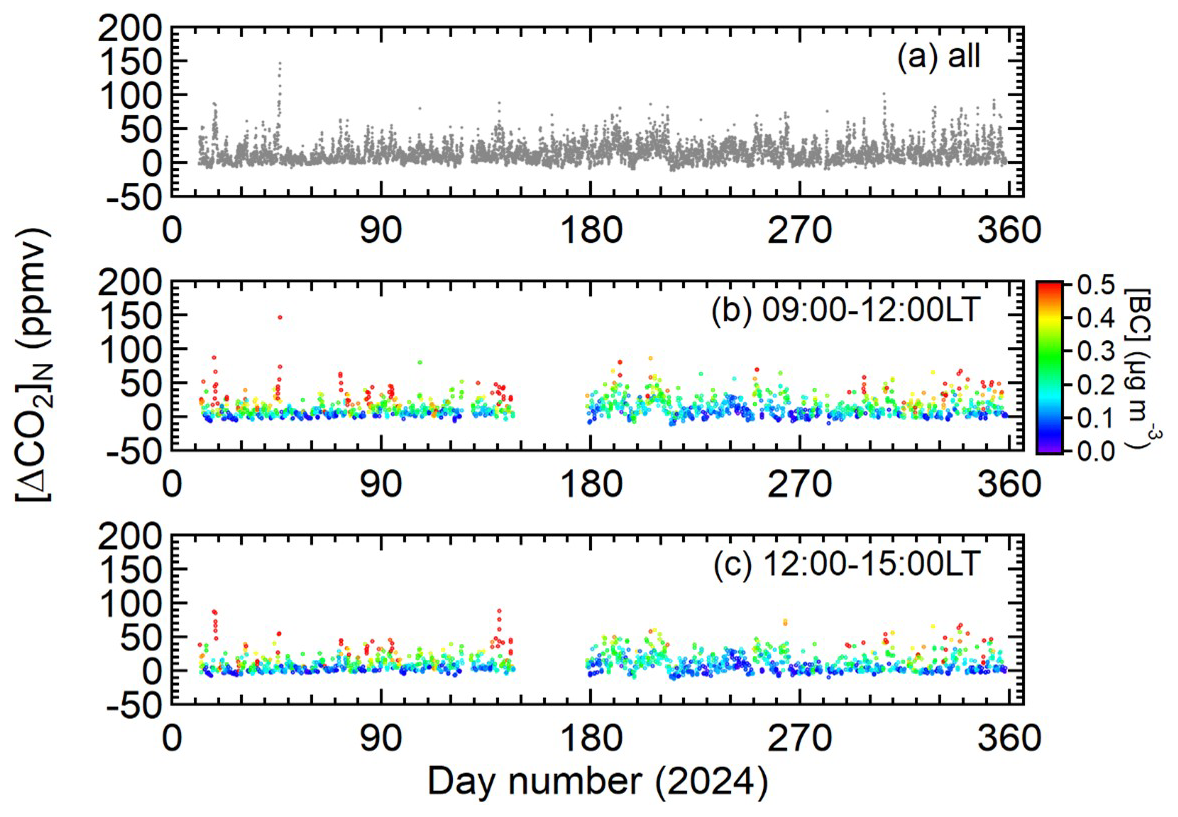
Figure 8 shows a time series of the increase in CO2 concentration [ΔCO2]N, defined as [CO2] minus [CO]N. The [ΔCO2]N values were obtained by combining LI-7810 and A-SKY/MAX-DOAS measurements. The estimated increase [ΔCO2]N reached 147±2 ppmv at 09:00 on 15 February (Day 46). At this time, the A-SKY/MAX-DOAS NO2 data reached 14±4 ppbv, and the BC concentration also reached 1.9±0.1 µg m3. As this example illustrates, the Figs. 8 and 9 clearly show that when [ΔCO2]N is high, NO2 and BC concentrations also tend to be elevated. The same features were also seen in the [ΔCO2]N values obtained by combining G4301 and A-SKY/MAX-DOAS (not shown to avoid redundancy).
To confirm the tendency, the correlation between [ΔCO2]N and [NO2] and the correlation between [ΔCO2]N and [BC] were analyzed (Fig. 10). Both exhibit clear positive correlations, indicating that the primary factors driving the increase in [ΔCO2]N are common with those responsible for increases in [NO2] and [BC]. In particular, the tight positive correlation with NO2 (R2=0.97 for LI-7810 and R2=0.94 for G4301), which has a relatively short photochemical lifetime, suggests that the increase in [ΔCO2]N is mainly attributable to fossil-fuel combustion sources in the vicinity of the observation site. Thus, [ΔCO2]N observed in Chiba is considered to be closely linked to fossil-fuel CO2 emissions in the urban atmosphere around Chiba, making it highly promising for monitoring purposes.
It should be noted that, in the present study, CO2 enhancements were estimated by defining the baseline using NO2, not by using the [ΔCO2]N–[NO2] or [ΔCO2]N–[BC] correlations. The slope of these correlations or the ratios (i.e., [ΔCO2] [NO2] and [ΔCO2] [BC]) may reflect differences in emission sources, meteorological conditions, photochemical processes, and the influence of vegetation. For example, air masses with a high [ΔCO2] [NO2] ratio are likely associated with emissions from thermal power plants, whereas those with a low ratio are indicative of emissions from automobiles. Such detailed analyses, however, are beyond the scope of this study and will be investigated elsewhere. The regression line for the [ΔCO2]N–[NO2] correlation shows an intercept close to zero (Fig. 10a), supporting the validity of the background concentration subtraction. Positive intercepts of the regression lines for the [ΔCO2]N–[BC] correlations as seen in Fig. 10b are considered to have caused by regulated BC emissions as a result of transitions such as from diesel to gasoline vehicles, or from coal-fired to natural gas-fired power generation, as mentioned earlier. The data point with the highest BC concentration may have influenced the intercept of the regression line. To assess this effect, we excluded the highest-BC data point and found that the intercept remained positive, although it decreased from ∼5 to ∼2 ppmv.
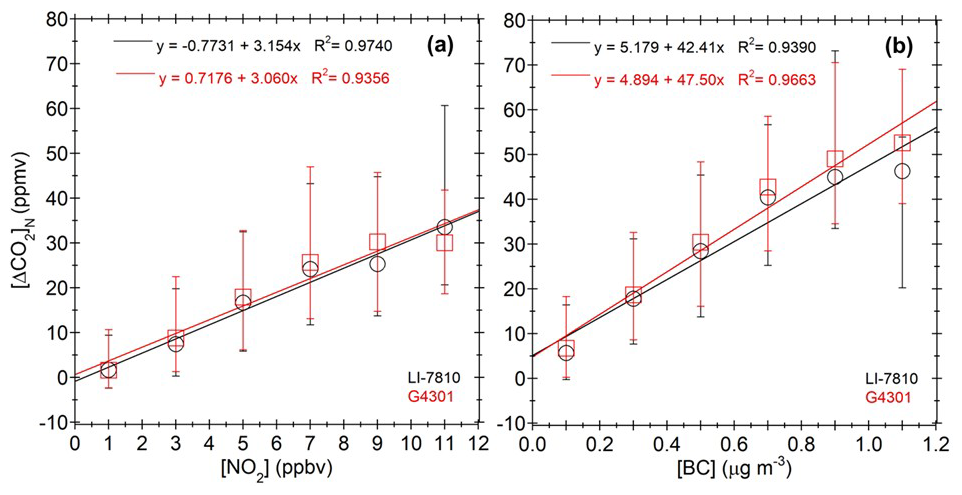
Figure 10(a) Correlation between [ΔCO2]N and A-SKY/MAX-DOAS NO2 data. (b) Correlation between [ΔCO2]N and COSMOS BC data. In each plot, the median values are shown for bins of 2 ppbv (for NO2) and 0.2 µg m3 (for BC). LI-7810 and G4301 data are shown in black and red, respectively. Error bars represent the range encompassing 67 % of the data points.
To evaluate the accuracy and precision of the [ΔCO2]N estimate, we examined the correlation of [ΔCO2]N values derived from CO2 measurements with LI-7810 and G4301 (Fig. 11). As shown in the figure, the regression line of this correlation exhibited a very high coefficient of determination (R2=0.98), a slope close to unity (0.97), and an intercept nearly equal to zero (−0.90 ppmv). It should be noted that the LI-7810 observations were conducted without performing regular calibrations and without dehumidifying the sampled air. Nevertheless, the [ΔCO2]N values obtained from both instruments agreed remarkably well. This indicates that simultaneous measurements of CO2 with A-SKY/MAX-DOAS NO2 enable highly accurate and precise estimation of [ΔCO2]N.
Another noteworthy aspect concerns the error analysis. Figure 11 also shows error bars representing the uncertainty of [ΔCO2]N. The uncertainty is considered to originate from (1) hourly fluctuations in CO2 concentration, (2) the magnitude of variability in CO2 values measured when the NO2 concentration was below its 5th percentile, and (3) drift on time scales shorter than Nday (including interference effects of water vapor). Despite these characteristics, [ΔCO2]N values derived from LI-7810 and G4301 both exhibited nearly the same magnitude of error (Fig. 11). Although the error in LI-7810 [ΔCO2]N due to the drift was evidently larger than that of G4301, the overall error magnitude was nearly identical, suggesting that the contribution of the drift was relatively small, and that the other factors 1 and 2 were the dominant sources of uncertainty. This is also supported by the fact that the mean difference (±1σ standard deviation) between LI-7810 [ΔCO2]N and G4301 [ΔCO2]N was ppmv, which is very small, and the mean error was within the range of the 1σ standard deviation. Thus, even when CO2 measurements from an uncalibrated gas analyzer were used, we found that simultaneous measurements with NO2 provide a simple and accurate means of monitoring fossil-fuel combustion-derived CO2 concentrations in the Greater Tokyo Area.
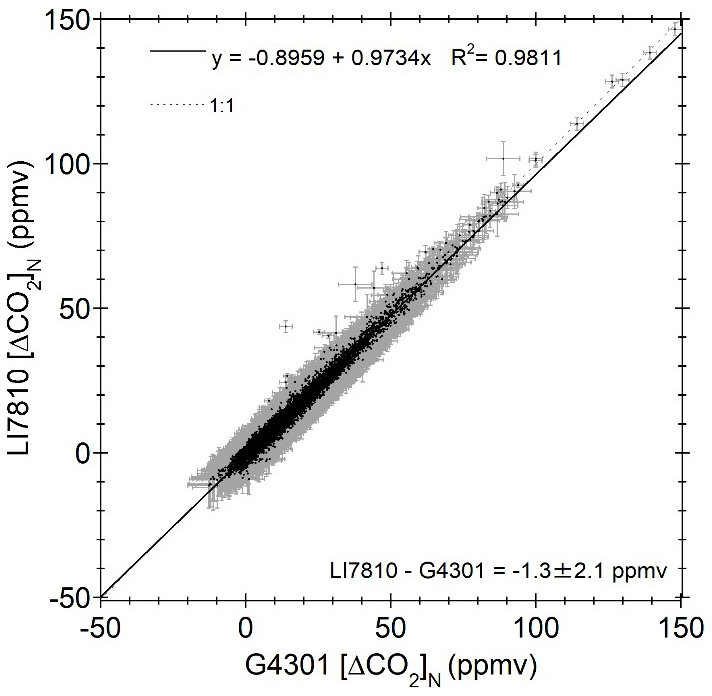
Figure 11Correlation between [ΔCO2]N values estimated from LI-7810 and G4301 CO2 data using simultaneous A-SKY/MAX-DOAS NO2 observations. Hourly values are plotted. Gray error bars indicate the uncertainty in [ΔCO2]N. The uncertainty is considered to include (1) hourly fluctuations in CO2 concentration, (2) the uncertainty in estimating [CO]N, and (3) drift on time scales shorter than Nday (including interference effects of water vapor). The 1:1 relationship is shown by the dotted line.
To clarify the usefulness of simultaneous near-surface CO2 and NO2 measurements for simple and accurate monitoring of fossil-fuel combustion-derived CO2 in the Greater Tokyo Area, year-round continuous measurements of near-surface CO2 concentrations using LI-7810 and G4301 trace gas analyzers were conducted simultaneously with NO2 measurements by A-SKY/MAX-DOAS at Chiba, located within the Greater Tokyo Area, during 2024. These simultaneous measurements revealed that CO2 concentrations were low on days when near-surface NO2 concentrations were also low. Furthermore, the [ΔCO2]N values estimated based on such low-NO2-concentration days was positively correlated with NO2 and BC concentrations. This finding indicates that [ΔCO2]N captures the increase in fossil-fuel combustion-derived CO2 within the Greater Tokyo Area. Interestingly, the correlation of [ΔCO2]N values derived from LI-7810 and G4301 showed a very high coefficient of determination (R2=0.98), a slope close to unity (0.97), and an intercept nearly equal to zero (−0.90 ppmv), although the LI-7810 observations were conducted without performing regular calibrations and without dehumidifying the sampled air. By employing this relatively simple method, fossil-fuel combustion-derived CO2 concentrations in megacities such as the Greater Tokyo Area can be monitored with high accuracy and precision, contributing to more effective emission mitigation strategies.
The LI-7810 and MAX-DOAS data are available upon request to the corresponding author (hitoshi.irie@chiba-u.jp). The G4301 data are available upon request to Yukio Terao (yterao@nies.go.jp).
HI, MN, and YK designed the present study, performed observation and analysis, and wrote the paper, with support from all the authors. YT performed the G4301 measurement and participated in the discussion of results. All authors have read and agreed to the published version of the manuscript.
The contact author has declared that none of the authors has any competing interests.
Publisher's note: Copernicus Publications remains neutral with regard to jurisdictional claims made in the text, published maps, institutional affiliations, or any other geographical representation in this paper. The authors bear the ultimate responsibility for providing appropriate place names. Views expressed in the text are those of the authors and do not necessarily reflect the views of the publisher.
This article is part of the special issue “SKYNET – the international network for aerosol, clouds, and solar radiation studies and their applications (AMT/ACP inter-journal SI)”. It does not belong to a conference.
We thank Ms. Miho Ohama and Ms. Megumi Uehara for their technical assistance in the continuous operation of the instruments. The measurements using G4301 were supported by Dr. Toshinobu Machida and Dr. Motoki Sasakawa for the NIES09 CO2 scale. We acknowledge the free use of TROPOMI tropospheric NO2 column data from https://www.temis.nl/ (last access: 1 December 2025).
This research was supported by JSPS KAKENHI (grant nos. 20H04320 and 22H05004), the JAXA 4th research announcement on the Earth Observations, and the Virtual Laboratory (VL) project by the Ministry of Education, Culture, Sports, Science and Technology (MEXT), Japan. The measurements using G4301 were supported by the Environment Research and Technology Development Fund (grant nos. JPMEERF21S20810 and JPMEERF24S12202) of the Environmental Restoration and Conservation Agency, provided by the Ministry of the Environment of Japan.
This paper was edited by Teruyuki Nakajima and reviewed by two anonymous referees.
Bisht, J. S. H., Patra, P. K., Takigawa, M., Kanaya, Y., Yamaguchi, M., Machida, T., and Tanimoto, H.: High-resolution simulation of CO2 using WRF-GHG over the Kanto region in Japan, J. Geophys. Res.-Atmos., 130, e2025JD043589, https://doi.org/10.1029/2025JD043589, 2025.
Damiani, A., Irie, H., Yamaguchi, K., Hoque, H. M. S., Nakayama, T., Matsumi, Y., Kondo, T., and Da Silva, A.: Variabilities in PM2.5 and black carbon surface concentrations reproduced by aerosol optical properties estimated by sky radiometer and MAX-DOAS instruments, Remote Sens., 13, 3163, https://doi.org/10.3390/rs13163163, 2021.
Damiani, A., Irie, H., Belikov, D. A., Kaizuka, S., Hoque, H. M. S., and Cordero, R. R.: Peculiar COVID-19 effects in the Greater Tokyo Area revealed by spatiotemporal variabilities of tropospheric gases and light-absorbing aerosols, Atmos. Chem. Phys., 22, 12705–12726, https://doi.org/10.5194/acp-22-12705-2022, 2022.
Hirano, T., Sugawara, H., Murayama, S., and Kondo, H.: Diurnal variation of CO2 flux in an urban area of Tokyo, SOLA, 11, 100–103, https://doi.org/10.2151/sola.2015-024, 2015.
IPCC (Intergovernmental Panel on Climate Change): Climate Change 2021: The Physical Science Basis, Cambridge University Press, Cambridge, https://doi.org/10.1017/9781009157896, 2021.
Irie, H.: International air quality and sky research remote sensing network (A-SKY), Its development and satellite atmosphere product validation, J. Remote Sens. Soc. JPN, 41, 575–581, https://doi.org/10.11440/rssj.41.575, 2021.
Irie, H. and Nakajima, T.: SKYNET, in: Handbook of Air Quality and Climate Change, edited by: Akimoto, H. and Tanimoto, H., Springer Nature, Singapore, https://doi.org/10.1007/978-981-15-2527-8_52-1, 2022.
Irie, H., Kanaya, Y., Akimoto, H., Iwabuchi, H., Shimizu, A., and Aoki, K.: First retrieval of tropospheric aerosol profiles using MAX-DOAS and comparison with lidar and sky radiometer measurements, Atmos. Chem. Phys., 8, 341–350, https://doi.org/10.5194/acp-8-341-2008, 2008.
Irie, H., Takashima, H., Kanaya, Y., Boersma, K. F., Gast, L., Wittrock, F., Brunner, D., Zhou, Y., and Van Roozendael, M.: Eight-component retrievals from ground-based MAX-DOAS observations, Atmos. Meas. Tech., 4, 1027–1044, https://doi.org/10.5194/amt-4-1027-2011, 2011.
Irie, H., Nakayama, T., Shimizu, A., Yamazaki, A., Nagai, T., Uchiyama, A., Zaizen, Y., Kagamitani, S., and Matsumi, Y.: Evaluation of MAX-DOAS aerosol retrievals by coincident observations using CRDS, lidar, and sky radiometer inTsukuba, Japan, Atmos. Meas. Tech., 8, 2775–2788, https://doi.org/10.5194/amt-8-2775-2015, 2015.
Irie, H., Hoque, H. M. S., Damiani, A., Okamoto, H., Fatmi, A. M., Khatri, P., Takamura, T., and Jarupongsakul, T.: Simultaneous observations by sky radiometer and MAX-DOAS for characterization of biomass burning plumes in central Thailand in January–April 2016, Atmos. Meas. Tech., 12, 599–606, https://doi.org/10.5194/amt-12-599-2019, 2019.
Irie, H., Yonekawa, D., Damiani, A., Hoque, H. M. S., Sudo, K., and Itahashi, S.: Continuous multi-component MAX-DOAS observations for the planetary boundary layer ozone variation analysis at Chiba and Tsukuba, Japan from 2013 to 2019, Prog. Earth Planet. Sci., 8, 31, https://doi.org/10.1186/s40645-021-00424-9, 2021.
Kondo, Y., Sahu, L., Kuwata, M., Miyazaki, Y., Takegawa, N., Moteki, N., Imaru, J., Han, S., Nakayama, T., Kim Oanh, N. T., Hu, M., Kim, Y. J., and Kita, K.: Stabilization of the mass absorption cross section of black carbon for filter-based absorption photometry by the use of a heated inlet, Aerosol Sci. Technol., 43, 741–756, https://doi.org/10.1080/02786820902889879, 2009.
Li, J., Li, P., Han, P., Cheng, Z., Li, J., Zhang, T., Chen, D., Zheng, Y., Zeng, N., and Zhang, G.: Advances in the design of urban CO2 emission monitoring networks: a review, Carbon Res., 5, 3, https://doi.org/10.1007/s44246-025-00239-z, 2026.
Long, Y. and Yoshida, Y.: Quantifying city-scale emission responsibility based on input-output analysis – insight from Tokyo, Japan, Appl. Energy, 218, 349–360, 2018.
Machida, T., Tohjima, Y., Katsumata, K., and Mukai, H.: A new CO2 calibration scale based on gravimetric one-step dilution cylinders in National Institute for Environmental Studies – NIES 09 CO2 Scale, in: Report of the 15th WMO/IAEA Meeting of Experts on Carbon Dioxide, Other Greenhouse Gases and Related Tracers Measurement Techniques, edited by: Brand, W. A., Jena, Germany, 7–10 September 2009, WMO/GAW Report No. 194, 165–169, 2011.
Miyazaki, Y., Kondo, Y., Sahu, L. K., Imaru, J., Fukushima, N., and Kano, M.: Performance of a newly designed continuous soot monitoring system (COSMOS), J. Environ. Monit., 10, 1109–1240, https://doi.org/10.1039/B806957C, 2008.
Mizobuchi, S., Irie, H., and Shimizu, S.: Long-term continuous observations of horizontal inhomogeneity in water vapor concentration in the lower atmosphere using A-SKY/MAX-DOAS, Prog. Earth Planet. Sci., 12, 52, https://doi.org/10.1186/s40645-025-00724-4, 2025.
Morville, J., Romanini, D., and Kerstel, E.: Cavity Enhanced Absorption Spectroscopy with Optical Feedback, in: Cavity-Enhanced Spectroscopy and Sensing, Vol. 179, edited by: Gagliardi, G. and Loock, H.-P., Springer Berlin Heidelberg, Berlin, Heidelberg, 163–209, https://doi.org/10.1007/978-3-642-40003-2_5, 2014.
Nakajima, T., Campanelli, M., Che, H., Estellés, V., Irie, H., Kim, S.-W., Kim, J., Liu, D., Nishizawa, T., Pandithurai, G., Soni, V. K., Thana, B., Tugjsurn, N.-U., Aoki, K., Go, S., Hashimoto, M., Higurashi, A., Kazadzis, S., Khatri, P., Kouremeti, N., Kudo, R., Marenco, F., Momoi, M., Ningombam, S. S., Ryder, C. L., Uchiyama, A., and Yamazaki, A.: An overview of and issues with sky radiometer technology and SKYNET, Atmos. Meas. Tech., 13, 4195–4218, https://doi.org/10.5194/amt-13-4195-2020, 2020.
Pisso, I., Patra, P., Takigawa, M., Machida, T., Matsueda, H., and Sawa, Y.: Assessing Lagrangian inverse modelling of urban anthropogenic CO2 fluxes using in situ aircraft and ground-based measurements in the Tokyo area, Carbon Balance Manage., 14, 6, https://doi.org/10.1186/s13021-019-0118-8, 2019.
Platt, U. and Stutz, J.: Differential Optical Absorption spectroscopy, Principles and Applications, XV, 597 pp., 272 illus., 29 in color, Physics of Earth and Space Environments, Springer, Berlin, Germany, ISBN 978-3-540-21193-8, 2008.
Romanini, D., Ventrillard, I., Méjean, G., Morville, J., and Kerstel, E.: Introduction to Cavity Enhanced Absorption Spectroscopy, in: Cavity-Enhanced Spectroscopy and Sensing, Vol. 179, edited by: Gagliardi, G. and Loock, H.-P., Springer Berlin Heidelberg, Berlin, Heidelberg, 1–60, https://doi.org/10.1007/978-3-642-40003-2_1, 2014.
Shirai, T., Machida, T., Matsueda, H., Sawa, Y., Niwa, Y., Maksyutov, S., and Higuchi, K.: Relative contribution of transport/surface flux to the seasonal vertical synoptic CO2 variability in the troposphere over Narita, Tellus B, 64, 19138, https://doi.org/10.3402/tellusb.v64i0.19138, 2012.
Sugawara, H., Ishidoya, S., Terao, Y., Takane, Y., Kikegawa, Y., and Nakajima, K.: Anthropogenic CO2 emissions changes in an urban area of Tokyo, Japan, due to the COVID-19 pandemic: A case study during the state of emergency in April–May 2020, Geophys. Res. Lett., 48, e2021GL092600, https://doi.org/10.1029/2021GL092600, 2021.
UNDP (United Nations Population Division): The World's cities in 2018: data booklet, The 2018 Revision Rep., United Nations, https://doi.org/10.18356/c93f4dc6-en, 2018.
Verhoelst, T., Compernolle, S., Pinardi, G., Lambert, J.-C., Eskes, H. J., Eichmann, K.-U., Fjæraa, A. M., Granville, J., Niemeijer, S., Cede, A., Tiefengraber, M., Hendrick, F., Pazmiño, A., Bais, A., Bazureau, A., Boersma, K. F., Bognar, K., Dehn, A., Donner, S., Elokhov, A., Gebetsberger, M., Goutail, F., Grutter de la Mora, M., Gruzdev, A., Gratsea, M., Hansen, G. H., Irie, H., Jepsen, N., Kanaya, Y., Karagkiozidis, D., Kivi, R., Kreher, K., Levelt, P. F., Liu, C., Müller, M., Navarro Comas, M., Piters, A. J. M., Pommereau, J.-P., Portafaix, T., Prados-Roman, C., Puentedura, O., Querel, R., Remmers, J., Richter, A., Rimmer, J., Rivera Cárdenas, C., Saavedra de Miguel, L., Sinyakov, V. P., Stremme, W., Strong, K., Van Roozendael, M., Veefkind, J. P., Wagner, T., Wittrock, F., Yela González, M., and Zehner, C.: Ground-based validation of the Copernicus Sentinel-5P TROPOMI NO2 measurements with the NDACC ZSL-DOAS, MAX-DOAS and Pandonia global networks, Atmos. Meas. Tech., 14, 481–510, https://doi.org/10.5194/amt-14-481-2021, 2021.
Yamada, K., Niwa, Y., Terao, Y., Tohjima, Y., Tsuboi, K., Ishijima, K., and Murayama, S.: Estimation of CO2 fluxes from Tokyo using a global model and tower observation, J. Meteor. Soc. JPN, 103, 67–85, https://doi.org/10.2151/jmsj.2025-004, 2025.