the Creative Commons Attribution 4.0 License.
the Creative Commons Attribution 4.0 License.
 | 17 Apr 2026
Leveraging machine learning to enhance aerosol classification using Single-Particle Mass Spectrometry
Jose A. Perez Chavez
Maria A. Zawadowicz
Joseph Wilkins
Christopher Blaszczak-Boxe
Advancing automated classification of atmospheric aerosols from Single-Particle Mass Spectrometry (SPMS) data remains challenging due to overlapping ion signatures, compositional diversity, and limited labeled data. This study evaluates supervised and semi-supervised learning frameworks to enhance aerosol identification by jointly leveraging labeled and unlabeled spectra. Four models were compared: a supervised Support Vector Machine (SVM), a self-training SVM, a stacked autoencoder classifier, and a stacked autoencoder trained using a temporal-ensembling Mean Teacher approach. All models achieved high and stable accuracies (90.0 %–91.1 %), surpassing previous results on the same dataset (87 %) and matching the performance of state-of-the-art deep learning methods. Despite small global metric differences (≤ 1 %), semi-supervised variants yielded up to 5 %–10 % improvements for compositionally rare particle types – such as soot (0.77 % of spectra, F1-score: 0.93–0.97) and hazelnut pollen (0.98 % of spectra, F1-score: 0.97–1.00) – equating to roughly ∼ 187 additional correctly classified spectra. These gains are scientifically significant, as such rare particles exert disproportionate influence on radiative absorption and ice nucleation processes; their improved detection reduces modeled uncertainties in aerosol absorption optical depth and mixed-phase cloud ice nucleation rates. The models' residual misclassifications (≈ 9 %) largely arise from true spectral overlap among chemically adjacent species (e.g., Na- vs. K-feldspar, coated vs. uncoated feldspars), reflecting physical compositional continuity rather than algorithmic error. Collectively, these findings demonstrate that leveraging unlabeled data to learn robust spectral representations and refine classification enhances both fidelity and interpretability, bridging data-driven analysis with aerosol–climate process understanding.
- Article
(2920 KB) - Full-text XML
- BibTeX
- EndNote


Understanding the composition of atmospheric aerosols is essential for evaluating their impact on climate, environment, and human health (Seinfeld and Pandis, 2016). Aerosols, tiny solid or liquid particles suspended in the air, have a significant and complex impacts on various environmental aspects. They influence Earth's radiation balance by scattering (Atwood et al., 2019) and absorbing visible (Ravishankara et al., 2015) and infrared radiation, leading to potential cooling or warming effects depending on the aerosol type and location (Bellouin et al., 2005; Myhre et al., 2014). Aerosols act as cloud condensation nuclei (CCN), and ice-nucleating particles (INPs), the seeds around which water vapor condenses to form clouds (DeMott et al., 2010, 2016; Farmer et al., 2015; Lohmann and Feichter, 2005). This interaction influences cloud properties like reflectivity, lifespan, and precipitation patterns, with implications for regional weather and water cycles (Andreae et al., 2004; Andreae and Rosenfeld, 2008). Additionally, high concentrations of certain aerosols, such as fine particulate matter, pose a significant threat to human health, increasing the risk of respiratory and cardiovascular diseases (Fuller et al., 2022; Pope and Dockery, 2006). Despite their importance, accurately measuring and characterizing aerosols, and their intricate atmospheric interactions remains a challenge (Christopoulos et al., 2018; Riemer et al., 2019). This hinders climate models' ability to precisely quantify direct and indirect radiative forcing and cloud processes (Boucher et al., 2014), leaving a degree of uncertainty in our understanding of their full climatic effects.
Single-particle mass spectrometry (SPMS) offers real-time analysis of individual aerosol particles' chemical composition (Murphy, 2007). SPMS utilizes a pulsed UV laser for the ablation and ionization of single aerosol particles and then accelerates the ions into a time-of-flight mass spectrometer to determine chemical composition (Cziczo et al., 2006; Gard et al., 1997; Pratt et al., 2009; Su et al., 2004). SPMS permits the analysis of aerosol particles in the size range of ∼ 150–3000 nm in diameter (Li et al., 2011; Murphy, 2007; Zawadowicz et al., 2017). SPMS can provide information on the size, shape, elemental composition, and mixing state of aerosol particles, which are important parameters for determining their sources and impacts (Cziczo et al., 2004). The mass spectra obtained from SPMS can be used to identify the source of the particles, such as biomass burning, based on specific chemical markers, like the presence of an ion peak at 213 (39KSO) (Silva et al., 1999). The chemical composition of the particles can be linked to their impact, for example, automobile exhaust particles containing hydrocarbons, Al+, Pt+, and Pb+ (Noble and Prather, 1996). Similarly, some work has found that some ice residuals exhibited characteristic mass spectral features of isoprene-derived organosulfates, specifically at mass-to-charge () ratios of 211, 213, and 215 (Wolf et al., 2020). These peaks indicate the presence of isoprene-epoxydiol-derived organosulfates (IEPOX-OSs) in INPs. SPMS can also differentiate between different types of particles, for instance, distinguishing between internally and externally mixed particulate populations (Song et al., 1999).
Identifying aerosols from complex SPMS data is difficult because individual particles contain millions of molecules with hundreds of distinct chemical species (Riemer et al., 2019), both primary (like elemental carbon and metals from combustion) and secondary (such as nitrates from NOx oxidation and sulfates from SO2 oxidation) (Riemer et al., 2019). Atmospheric processing further complicates classification as particles undergo coating with secondary materials (e.g., soot becoming coated with sulfate), coagulation, and cloud processing, leading to mixed compositions where aerosol origins and atmospheric processing create overlapping chemical signatures (Ault and Axson, 2017; Murphy and Thomson, 1997; Prather et al., 2008), with even minor compositional changes significantly altering their climate impact (Riemer et al., 2019; Usher et al., 2003). Mass spectral analysis faces specific technical challenges: organic compounds fragment during laser ablation producing soot-like carbon progressions (Zelenyuk et al., 2008), alkali metals from urban dust and biomass burning dominate spectra and mask other components (Zelenyuk et al., 2008) due to their high ionization efficiency, and the laser ablation process itself shows variable sensitivity to different components while producing inconsistent spectra from identical particles (Phares et al., 2001). These complications make it particularly difficult to determine exact mass fractions at the single-particle level – for instance, fly ash, mineral dust, and bioaerosol can all exhibit strong phosphate signals in their spectra (Christopoulos et al., 2018). Even distinguishing bioaerosols from nonbiological phosphorus-rich particles, crucial for understanding ice nucleation, is challenging (Zawadowicz et al., 2017). This difficulty stems from overlapping ion markers where phosphate (PO−, PO, PO) and organic nitrogen ions (CN−, CNO−) traditionally used as bioaerosol indicators also appear in nonbiological particles such as vehicular exhaust, mineral dust, and fly ash.
Early approaches to the classification of aerosols relied on user-defined rules to determine the category of a particle. These rules were initially developed for computer-controlled scanning electron microscopy (CCSEM) coupled with energy-dispersive X-ray spectroscopy (EDX) (Casuccio et al., 1983; Kim et al., 1987). These datasets typically contained information on hundreds to thousands of particles and approximately 15–30 elements, making manual spot checks feasible (Riemer et al., 2019). However, the advent of field-deployable real-time single-particle mass spectrometry (SPMS) (Hinz et al., 1994; McKeown et al., 1991; Prather et al., 1994) led to a significant increase in both data complexity and volume. This rendered traditional classification methods impractical, driving the development of more advanced techniques.
Instruments like Aerosol Time-of-Flight Mass Spectrometry (ATOFMS), laser ablation aerosol particle time of flight mass spectrometer (LAAPToF), and Particle Analysis by Laser Mass Spectrometry (PALMS) (Cziczo et al., 2006; Pratt et al., 2009; Zawadowicz et al., 2020), present a data analysis bottleneck, as they can characterize thousands of particles per minute – a rate exceeding that required to manually analyze the data (Song et al., 1999). Unsupervised learning models have become essential tools for handling such large datasets. Among these, Adaptive Resonance Theory 2a (ART-2a) has been widely used to cluster particles based on their chemical composition (Phares et al., 2001; Song et al., 1999). The algorithm identifies unique clusters, which are then labeled for interpretation, offering flexibility and control over the categorization process. This method is very popular and it is still being used in the last decades (Chen et al., 2019; Li et al., 2011; McNamara et al., 2020; Moffet and Prather, 2005; Phares et al., 2003; Qin et al., 2012; Zhang et al., 2015). For example, they were used to isolate and assign Fresh vs. Aged Soot membership of aerosol samples from Mexico City and Riverside, CA (Moffet and Prather, 2009). To investigate the formation of haze during the cold season in Zhengzhou, China, the ART-2a algorithm was employed to cluster over 4 million SPMS, grouping them into eight specific classes: elemental carbon (EC), organic carbon (OC), ECOC, K-rich, levoglucosan, metal, NH4-K, and dust (Wang et al., 2019). To characterize laboratory-generated aerosols from Lake Michigan water for comparison with ambient samples, the ART-2a algorithm was employed to classify nearly 1000 SPMS from an ATOFMS, which successfully identified a dominant calcium-rich particle type (LSA-Ca) containing markers for calcium carbonate and biological material (Axson et al., 2016).
Another popular clustering algorithm is K-means, which groups data by minimizing within-cluster variance (Anderson et al., 2005; Gross et al., 2010). K-means is known for scalability but requires specifying the number of clusters beforehand. Atwood et al. (2019) classified aerosol population types and cloud condensation nuclei properties representative of the coast and interior of California using K-means cluster analysis. In a study analyzing the sources and mixing state of summertime aerosol in the north-western Mediterranean basin, the K-means was employed to cluster 1.2 million single particle mass spectra and grouped individual particles into 27 classes (Arndt et al., 2017). Both ART-2a and K-means are unsupervised techniques, meaning they do not need predefined labels, making them valuable for the often difficult-to-label aerosols. Even for studies where aerosol identification takes a more empirical and rigorous approach such as evaluating the SPMS against reference spectra measured at a lab, checking for signal at specific markers, analyzing relative peak intensities, clustering takes role in defining classes of aerosols (Cziczo et al., 2004; Freutel et al., 2013; Froyd et al., 2019; Shen et al., 2019). Despite their advantages, these unsupervised algorithms have limitations. Parameters require careful tuning and assessing cluster validity is crucial (Song et al., 1999). Additionally, assumptions of cluster shape and the impact of high-dimensional data can pose challenges. Researchers have explored incorporating expert knowledge to aid clustering analysis (Zelenyuk et al., 2008), demonstrating the ongoing efforts to improve the accuracy of single-particle data classification.
Supervised classification algorithms offer several advantages over unsupervised clustering algorithms (Beck et al., 2024). They learn from labeled data, tailoring classifications to specific goals, potentially increasing generalizability across similar applications. They often rely on optimized methods, reducing the need for manual calibration. Some can handle non-linear relationships between features and labels, leading to more accurate classifications (Gong et al., 2022). They may employ normalized metrics or reduction of dimensions to address poor model generalization and stability in high-dimensional spaces, and are optimized for making predictions, potentially achieving higher accuracy (Beck et al., 2024).
Previous studies have shown the potential of supervised learning in classification and feature extraction of single-particle mass spectra for aerosols. Support Vector Machine (SVM), a supervised machine learning algorithm (Cortes and Vapnik, 1995) which could find a clear gap between separate labeled categories, has been successfully applied in binary classification for differentiate bioaerosol mass spectra from phosphorus-bearing spectra achieving 97 % overall accuracy (Wang et al., 2024c; Zawadowicz et al., 2017). At the same time this model has been used to determine representative SPMS signatures of three aerosol types for apportionment of coal combustion sources (Xu et al., 2018). Another popular model, the Random Forest classifier, has shown promising results. The RF has previously been applied to the same dataset used in this paper, in classifying 20-unique classes of aerosols, achieving overall accuracy of 87 % and identifying important influential markers (Christopoulos et al., 2018). Another study demonstrated that a random forest machine learning algorithm can effectively classify single particles based on single-particle soot photometer data, achieving a classification accuracy of ≥ 99 % for rBC and FeOx, and 47 %–66 % for other aerosol types, while broader categories demonstrated high accuracies (Lamb, 2019).
In a separate study, supervised learning algorithms were compared in classifying eight distinct broad categories representative of common aerosol types found in Central Europe during summer (Wang et al., 2024c). All algorithms achieved overall accuracies above 94 %, with RF, SVM, and Multi-Layer Perceptron (MLP) leading the way with accuracies exceeding 97 % (Wang et al., 2024c). The work indicates that these supervised algorithms offered significant advantages over unsupervised clustering methods, primarily due to their ability to learn from labeled data, tailor classifications to specific research goals, and potentially achieve higher accuracy in high-dimensional SPMS datasets (Wang et al., 2024c). However, a fundamental limitation of supervised learning is that these algorithms cannot identify aerosol types absent from the training data. This presents a practical challenge for atmospheric applications where novel or unexpected particle types may be encountered during field campaigns. Although semi-supervised learning alone cannot discover entirely new aerosol classes, it has the potential to improve generalization for spectra lying near class boundaries, under-represented types
improves generalization for spectra lying near class boundaries or under-represented types. By incorporating unlabeled data the model learns broader spectral manifolds and reduces overfitting to specific training clusters. Unlike unsupervised clustering methods that can potentially identify new particle groups, supervised models will forcibly classify unknown particles into one of the predefined categories from the training set, potentially leading to mischaracterization of atmospheric composition when deployed in diverse environments.
More recent work has explored the application of deep learning, particularly convolutional neural networks (CNNs), for the classification of aerosol particles. The work demonstrates that both 1D-CNN and 2D-CNN architectures could effectively classify SPMS data, achieving accuracy exceeding 90 % with a sufficiently large labeled dataset (Wang et al., 2023, 2024a, b). The work highlighted the advantages of CNNs over traditional machine learning methods like multilayer perceptrons, emphasizing the CNNs' ability to automatically extract meaningful features from the data without the need for expert feature engineering. Nevertheless, noise augmentation, square root transformation, averaging mass spectra, and swapping positive and negative mass peaks, have been found to improve classification accuracy from approximately 75 % to 86.8 % when training with only of the original labeled data (Wang et al., 2024d). Data augmentation is therefore deemed a crucial step to overcome the challenges of supervised learning such as the high cost and time-consuming process of obtaining accurate labels (Wang et al., 2024d), potential biases inherited from training data, and the risk of overfitting with limited datasets (Beck et al., 2024).
Semi-supervised learning offers an alternative solution to reducing the over reliance on labeled data by incorporating unlabeled data in the model training. This method is particularly beneficial when labels are expensive to obtain but unlabeled data is abundant (Zhou, 2021). By leveraging unlabeled data, semi-supervised learning can enhance the model's generalization performance and mitigate the risk of overfitting. This study evaluates both supervised and semi-supervised approaches for aerosol classification. While semi-supervised frameworks such as self-training and mean-teacher methods are explored for their ability to leverage unlabeled data, the results demonstrate that the supervised stacked autoencoder achieved the highest overall accuracy, with semi-supervised variants yielding selective gains for rare aerosol types. The comparative analysis therefore emphasizes both the strengths and limits of unlabeled-data utilization in real SPMS applications.
The dataset analyzed in this study was collected using the Particle Analysis by Laser Mass Spectrometry (PALMS) instrument during the Fifth Ice Nucleation workshop (FIN-1) (Shen et al., 2024) at the Karlsruhe Institute of Technology's (KIT) Aerosol Interactions and Dynamics in the Atmosphere (AIDA) facility, with additional samples acquired at MIT's Aerosol and Cloud Laboratory (Christopoulos et al., 2018). Aerosols were generated through prescribed techniques in KIT's 84 m3 AIDA chamber and 3.7 m3 APC chamber: minerals and dusts via rotating brush dispersion, soot via propane combustion or graphite spark generation, α-pinene SOA via in situ ozonolysis, bioaerosol (Snomax) via atomization, and internally mixed particles via SOA condensation onto minerals (Shen et al., 2024).
The PALMS instrument sampled these reference particles under dry conditions, recording each particle's time-of-flight as a proxy for vacuum aerodynamic diameter. The version of PALMS used in this study operates in unipolar mode, acquiring either positive or negative mass spectra. All spectra analyzed in this work were collected in negative-ion mode, which has been demonstrated to effectively discriminate between bioaerosol and dust particles (Zawadowicz et al., 2017)
A subset of experiments was conducted as blind studies in which unknown particle mixtures (α-pinene SOA, Argentinian soil dust, and graphite soot across two distinct periods) were introduced to the APC chamber, and instrument teams analyzed the data independently without prior knowledge of chamber contents (Shen et al., 2024). These blind experiments yielded 14 478 unlabeled mass spectra that follow identical formatting and preprocessing steps as the labeled data but lack definitive aerosol type assignments. This unlabeled portion serves as training data for semi-supervised learning. The unlabeled dataset comprised 14 478 single-particle spectra collected under the same acquisition parameters as the labeled reference set. The chemical composition of this unlabeled pool is unknown a priori. For transparency, we applied all four models to the unlabeled spectra to obtain the percentage of spectra assigned to a given class (Fig. A4). The distribution of labels on this subset are reported only for diagnostic purposes and were not used as ground truth in model training.
The labeled dataset comprises 20 317 single-particle mass spectra distributed across 20 aerosol types, including mineral dust, biological particles, combustion products, and secondary organic aerosol. Approximately 75 % of these spectra originate from the FIN-1 Workshop campaign, with the remaining 25 % from samples supplied by MIT (Christopoulos et al., 2018). The dataset exhibits substantial class imbalance reflecting typical challenges in atmospheric particle collection. The most prevalent classes prior to filtering are fly ash (19.9 %, 4038 spectra), uncoated K-feldspar (9.9 %, 2020 spectra), and K-feldspar coated with SOA (9.8 %, 1999 spectra). Several important atmospheric aerosol types have limited representation, including soot (1.0 %, 202 spectra) and hazelnut pollen (0.9 %, 183 spectra). Agar growth medium (1.2 %, 240 spectra), while not an atmospheric aerosol type, is included as a potential laboratory contaminant reference for bacterial particles cultivated on this medium (Table 1).
Table 1Distribution of labeled single-particle mass spectra across the 20 aerosol classes used in this study. The dataset exhibits substantial class imbalance, with fly ash and feldspar categories dominating the labeled set, while a few biological and organic particle types (e.g., Snomax, hazelnut pollen, agar, and soot) are comparatively under-represented. Percentages denote the proportion of each class relative to the total labeled dataset. “n/a” stands for not applicable. Both train and test labeled sets included.
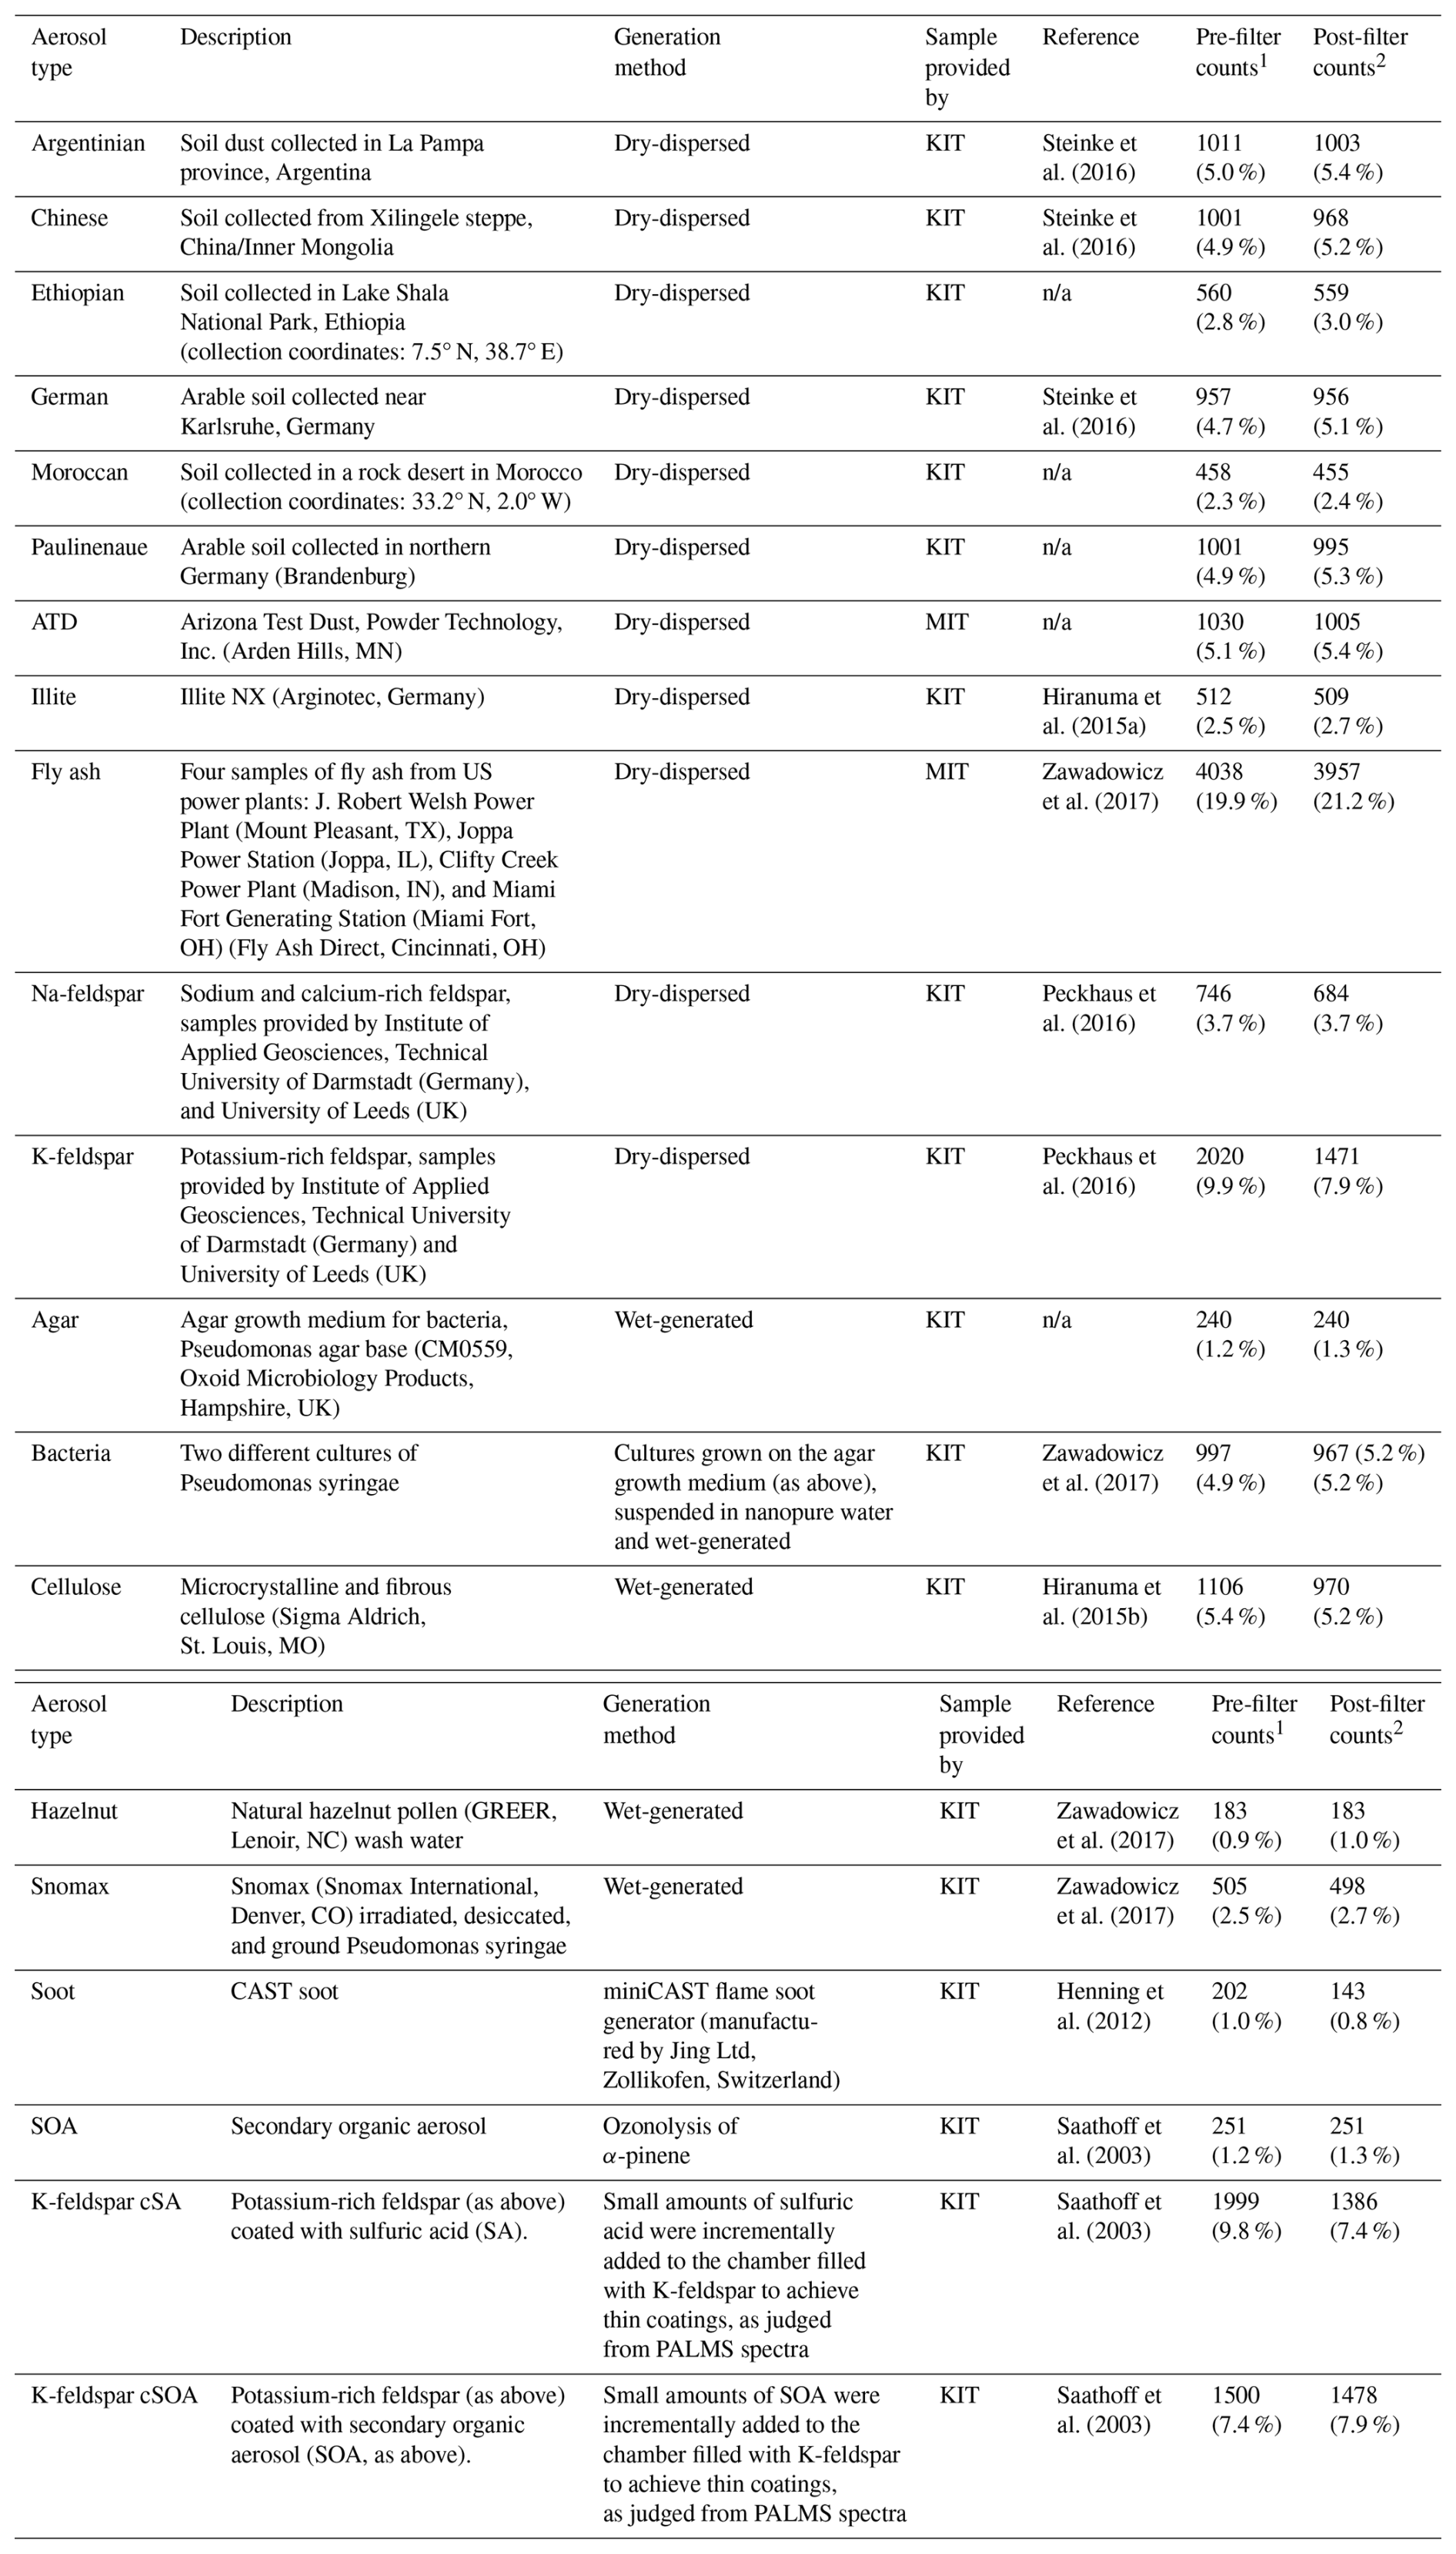
1 Counts in the original dataset as used in Christopoulos et al. (2018).
2 Counts after filtered as discussed in Sect. 2, right before splitting and transforming the data for training/testing.
Each spectrum comprises measurements across 207 mass-to-charge () channels spanning the −1 to −207 range in negative-ion mode. Fourteen channels within this interval were excluded because they contained no valid signal in the original PALMS data export – typically corresponding to detector saturation gaps, electronic noise regions, or mass channels lacking meaningful ion counts. Such exclusions are common in single-particle mass spectrometry, as channels near the detector edges may suffer from low ion counts or fall outside linear calibration, while others can be dominated by electronic noise, calibration artifacts (e.g., near Cs− or O peaks), or consistently zero-intensity bins. Removing these non-informative channels ensures that only chemically meaningful features contribute to the classification analysis. This resulted in 193 active features retained for model input, along with particle time-of-flight as an additional feature, for a total of 194 features.
Data preparation followed a consistent protocol for all training and testing. Spectra containing one or zero ion peaks were excluded prior to analysis, as such sparse signals lack sufficient chemical information for reliable classification. This filtering removed ∼ 8.1 % of the dataset, where 91 % of the removed samples had zero peaks, bringing the labeled data set to a final size of 18 678. The removal of ∼ 8.1 % of spectra primarily reflect the exclusion of low-intensity or noise-dominated signals near the detector baseline, which commonly arise from incomplete ionization events or transient charge losses during SPMS acquisition. The unlabeled dataset did not contain any samples to filter out, as such remains at a size of 14 478. Missing values in the time-of-flight feature were set to zero. The complete dataset was then randomly shuffled using a fixed random seed, with 1868 samples (10 %) reserved for testing and 16 810 labeled training samples. For the labeled portion, stratified sampling maintained class distributions between training and test sets, which is crucial given the significant class imbalances. The sample counts per class in the labeled testing set are shown in Table A2.
Feature scaling was performed using maximum absolute scaling, fitted to the training data and applied to both training and test sets. This scaling approach was chosen over standard normalization methods due to its ability to preserve sparsity in the mass spectra while constraining all features to the range [0,1]. Each aerosol type label was integer-encoded for model input. The same scaling is performed on the unlabeled dataset.
To quantify the contribution of individual ions ( features) to model performance, we evaluated feature importance across all four classifiers. For all four models studied here, feature importance was computed using permutation importance, whereby each channel was randomly permuted and the resulting decrease in F1-score was recorded as a measure of feature influence.
All four classification models explored in this study were trained and tested on this labeled dataset with identical train-test partitions (90 % training, 10 % testing). The distinction between supervised, unsupervised, and semi-supervised learning is the use of the unlabeled dataset, which unlike the labeled dataset, does not need to be split. For different sizes of the test split, we observed minor impact on the results (Table A3). Specifically, overall accuracy decreased only marginally from 91.1 % (10 % test) to 90.7 % (20 %) and 90.5 % (25 %), while macro F1 and weighted F1 varied by less than 1 % (89.5 → 89.0 → 88.7 and 90.2 → 89.9 → 89.6, respectively). The chosen split offers the best balance between stable model evaluation and adequate representation of minority aerosol classes. Larger test proportions (20 %–25 %) reduced the number of spectra available for rare categories such as soot, agar, and hazelnut pollen, leading to increased sampling variance and lower class-level precision. While individual class metrics showed variations for different test sizes, the overall performance measures (accuracy, precision, recall, F1-score) remained stable. Metrics for classes with very limited samples (particularly soot, hazelnut pollen, and agar) should be interpreted with appropriate caution due to their small test set representations. All scripts for preprocessing, model training, and evaluation have been archived and are publicly available at GitHub.
2.1 Classification Methods
To evaluate the potential of semi-supervised learning for aerosol classification, we implemented and compared four distinct approaches. Each successive model builds upon traditional supervised learning by incorporating unlabeled data in increasingly sophisticated ways. All models were implemented in Python using PyTorch for neural network architectures (Ansel et al., 2024) and scikit-learn for traditional machine learning algorithms (Pedregosa et al., 2011). The following sections detail the theoretical background, implementation, and training methodology for each classifier. Semi-supervised learning methods improve classification robustness for boundary and minority classes but cannot identify truly novel aerosol types.
2.1.1 Support Vector Machine Classifier
Support Vector Machines (SVMs) serve as our baseline supervised classification method, chosen for their documented success in SPMS and related aerosol mass spectrometry data analyses (Wang et al., 2024c; Zawadowicz et al., 2017) and for their robust performance in high-dimensional feature spaces (Beck et al., 2024; Cortes and Vapnik, 1995). This robustness is often handled by a kernel function, which enables the SVM to find complex, non-linear decision boundaries by projecting the data into a higher-dimensional space. For our multi-class problem, we employed scikit-learn's Support Vector Classification with a one-vs.-one scheme, where separate binary classifiers are trained for each pair of classes.
Model optimization utilized scikit-learn's HalvingGridSearchCV with cross-validation to efficiently explore the parameter space. The search focused on three key parameters: kernel type, regularization parameter (C), and kernel coefficient (γ). Starting with an initial resource allocation of 2000 training samples, the algorithm evaluated 30 randomly sampled parameter combinations, progressively eliminating weaker candidates by a factor of 2 until identifying the optimal configuration. This approach yielded optimal values of C = 284.73 and γ = 0.2412 using a radial basis function (RBF) kernel, a choice known for capturing complex, non-linear data structures.
During optimization, we found that maximum absolute value scaling of input features produced consistently better results compared to standard scaling or L1/L2 normalization. This superiority likely stems from the technique's preservation of sparsity in the mass spectra, an important characteristic of SPMS data where many channels typically show zero intensity. The final model maintains high sparsity while achieving effective separation between aerosol classes through the RBF kernel's nonlinear mapping.
2.1.2 Self-Training SVM Classifier
Building upon the baseline SVM, we implemented a self-training approach to leverage unlabeled data through scikit-learn's SelfTrainingClassifier. This semi-supervised method iteratively expands the labeled training set by incorporating unlabeled samples whose predicted probabilities exceed a specified confidence threshold (Yarowsky, 1995). The optimized SVM model and preprocessing pipeline described in the previous section is used as a base classifier in this self-training framework.
A critical parameter in self-training is the confidence threshold that determines which predictions on unlabeled data are sufficiently reliable to include in subsequent training iterations. We conducted a systematic evaluation of threshold values between 0.5 and 1.0 using 3-fold stratified cross-validation on the training subset, analyzing their impact on both classification performance and the proportion of unlabeled data utilized (Fig. 1). This cross-validation was performed solely to identify the optimal threshold parameter and did not modify the main training-test split or alter the labeled data used for final evaluation.
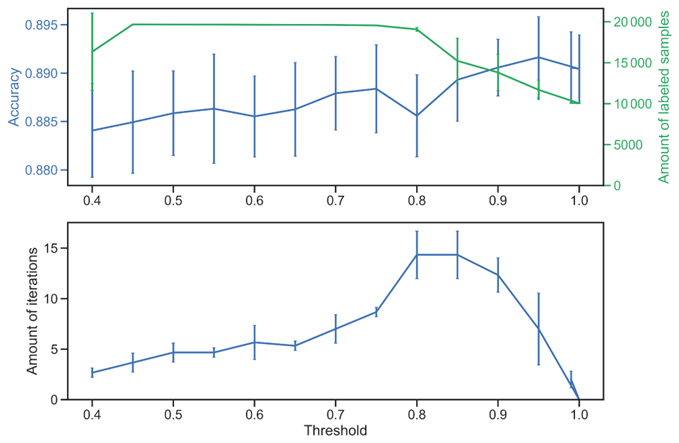
Figure 1Effects of the threshold hyperparameter on the performance and convergence behavior of the Self-Training SVM classifier. Top: cross-validated accuracy (stratified 3-fold) as a function of the threshold (blue line). The right-hand axis (green line) shows the corresponding number of labeled samples used for training at each threshold value, including both the train set and the pseudolabels. Lower thresholds allow more unlabeled samples to be incorporated but can introduce noisier pseudo-labels, while higher thresholds restrict inclusion to the most confidently predicted samples. Bottom: N number of iterations required for the algorithm to complete the self-labeling process across thresholds. At a confidence threshold of 0.95, the framework achieves the highest cross-validation accuracy (89.16 ± 0.42 %) while maintaining conservative pseudo-labeling rates (mean: 1648 ± 1476 samples per fold, ∼ 17 % of unlabeled data per fold). Error bars represent one standard deviation across folds.
The analysis revealed that threshold values above 0.8 consistently improved classification accuracy. A threshold of 0.95 yielded the highest cross-validation accuracy (89.16 ± 0.42 %) while maintaining conservative pseudo-labeling rates (∼ 17 % of unlabeled data per fold). The final self-training model is trained on the complete mixed dataset (train labeled + unlabeled) with a fixed confidence threshold of 0.95, which admits 7488 of 14 478 unlabeled samples (51.7 %) as pseudo-labels after 16 iterations. The class-wise pseudo-label distribution at admission is summarized in Fig. A5. This threshold ensured high-confidence inclusion while maintaining balanced representation of minority aerosol classes. Finally, the Self-Training SVM was evaluated on the same 10 % held-out labeled test set as all other models.
We explored potential improvements through probability calibration using CalibratedClassifierCV, as accurate probability estimates are crucial for reliable self-training. However, calibration provided negligible improvements across all metrics (accuracy, precision, recall, and F1-score), suggesting the SVM's decision boundaries were already well-optimized from the initial supervised training.
2.1.3 Stacked Autoencoder Classifier
The stacked autoencoder represents a more sophisticated approach to aerosol classification by combining dimensionality reduction with supervised learning in a deep neural network architecture. The model consists of two key components: an autoencoder network that learns compressed representations of mass spectra via its bottleneck layers, and a classification layer that operates on these learned features. The complete architecture, illustrated in Fig. 2, processes the 194-dimensional input (193 mass peaks + particle time-of-flight) through a series of fully connected layers that progressively reduce dimensionality while preserving essential spectral characteristics.
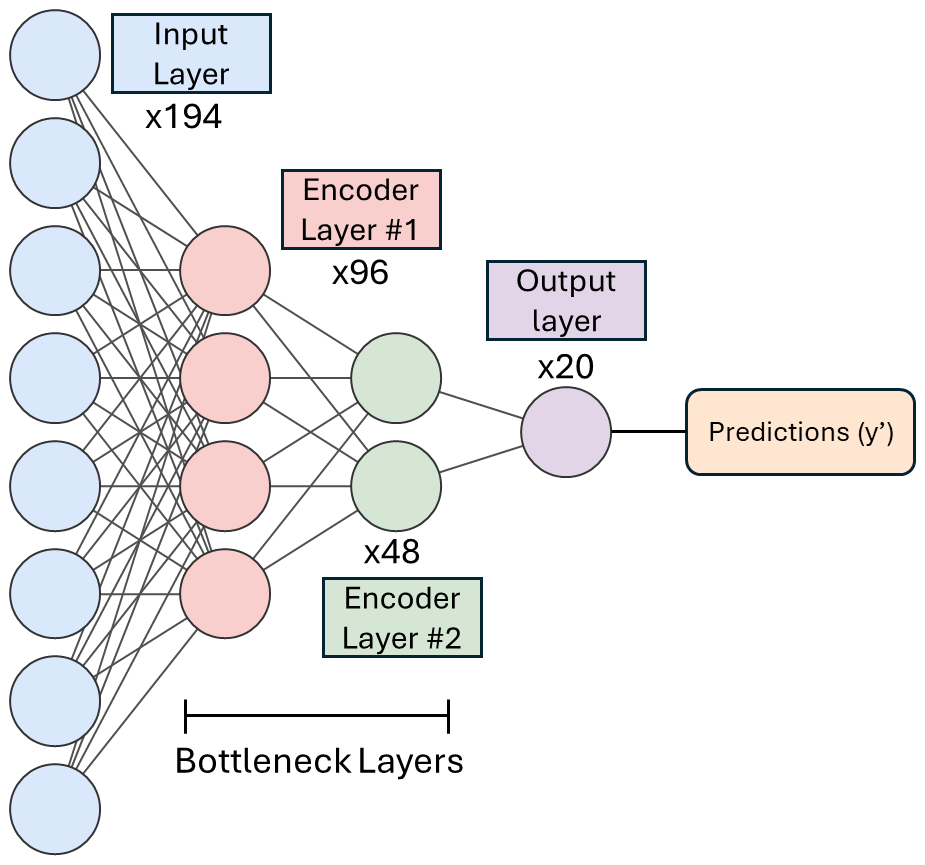
Figure 2Schematic overview of the Stacked Autoencoder Classifier architecture used for single-particle mass spectral classification. The model consists of a series of fully connected layers arranged in an encoder–decoder framework, followed by a supervised classification head. The diagram shows the designated size to each layer. The input layer receives normalized spectral feature vectors (193 intensities plus one aerodynamic diameter feature). These inputs are progressively compressed through two encoder layers. The output layer projects these encoded features into a label space corresponding to the 20 aerosol classes. A softmax activation function converts the raw outputs into class probabilities (), enabling probabilistic classification.
The autoencoder training proceeds in two sequential stages using symmetric encoder-decoder architectures with Rectified Linear Unit (ReLU) activation functions (f(x) = ). In the first stage, an autoencoder compresses the 194 input features to 96 latent dimensions and reconstructs them back to the original 194 dimensions, trained on all 31 288 available samples to learn a compressed representation of the mass spectra. The test set features are included in unsupervised fashion while test labels remain strictly held-out, preventing label leakage while maximizing the autoencoder's exposure to the underlying data distribution. This pre-trained encoder and decoder are then frozen and integrated into a second autoencoder, which adds a deeper compression layer reducing the representation to 48 dimensions. This stacked autoencoder is trained on all available samples again to optimize the added compression layer while retaining the prior learned latent representation of the mass spectra. Both the initial autoencoder and the stacked autoencoder are trained using the RAdam optimizer (Liu et al., 2019) with a learning rate of 0.01 to minimize mean squared error (MSE) loss between the input features and the reconstructed output, with the first stage running for 300 epochs (batch size 12) and the second for 100 epochs (batch size 16). This staged training approach with frozen transfer learning allows the network to learn increasingly abstract representations while preserving the low-level features captured in the first encoder.
Following the two-stage autoencoder pretraining, a final classification layer (linear transformation with softmax activation) is added and trained exclusively on the labeled training subset (16 810 samples), with test samples withheld until final evaluation. The two set of encoders are unfrozen during this supervised stage to enable end-to-end adaptation of the learned representations for the new objective of class discrimination. This training uses the Adam optimizer with a learning rate of 0.01 and weight decay regularization of 0.01 (Loshchilov and Hutter, 2017), trained for 100 epochs with batch size 64 using cross-entropy loss. The unfrozen training allows the encoder to adapt the learned spectral patterns into class-specific representations optimized for the classification task. The softmax output provides probability distributions over the aerosol types.
The complete training process optimizes both reconstruction accuracy and classification performance. The reconstruction objective ensures the latent space retains meaningful chemical information, while the classification objective fine-tunes these features for optimal class separation. This dual optimization distinguishes the stacked autoencoder from traditional supervised approaches, potentially offering better generalization when dealing with complex, high-dimensional mass spectra.
2.1.4 Mean Teacher Framework
The Mean Teacher framework extends our stacked autoencoder approach by implementing a consistency-based semi-supervised learning strategy (Tarvainen and Valpola, 2017). This approach maintains two models: a student model that learns actively through standard optimization, and a teacher model whose weights are updated as an exponential moving average of the student model's weights. The framework aims to improve model robustness and generalization by enforcing consistent predictions across different views of the same data. An overview of the framework is shown in Fig. 3.
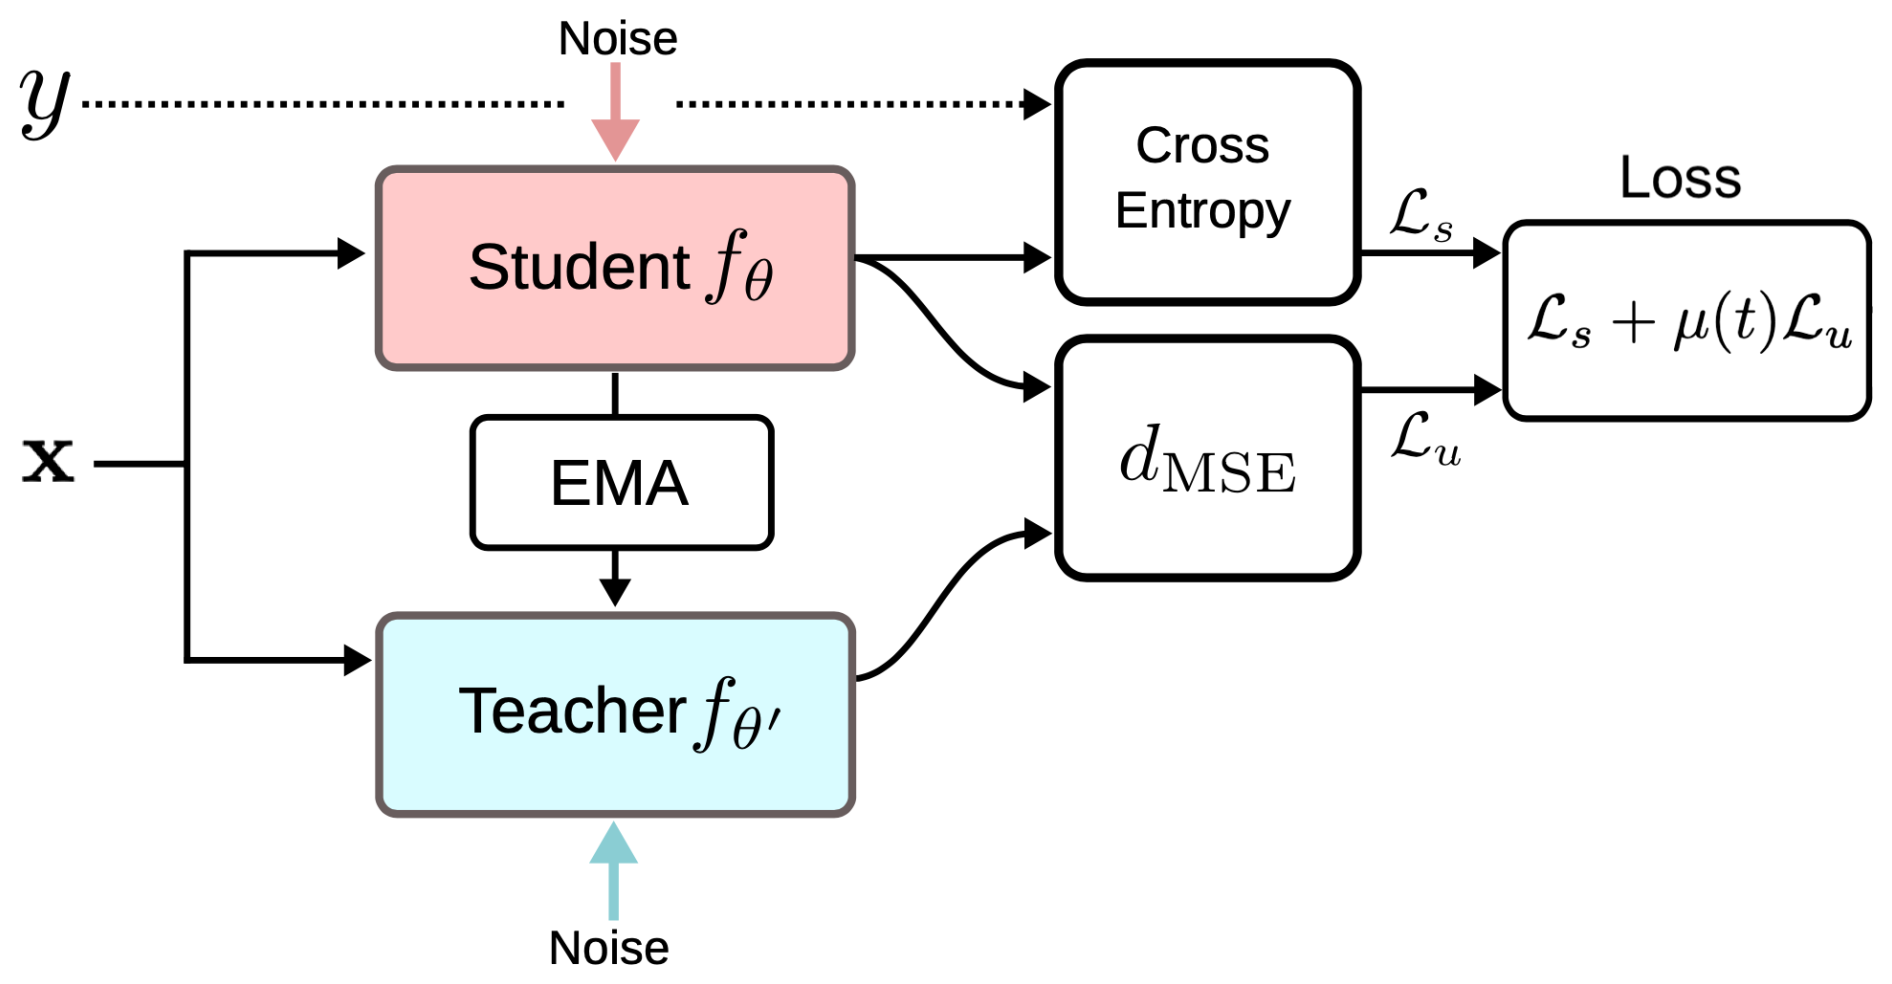
Figure 3Overview of the Mean Teacher framework. (Image source: Tarvaninen and Valpola, 2017). The Mean Teacher architecture consists of two neural networks – the Student model (fθ) and the Teacher model () – that share the same structure but differ in their parameter updates. For labeled samples (x, y), the Student's predictions are compared against ground truth using a cross-entropy loss (ℒs). For unlabeled samples, the consistency loss (ℒu) is computed as the mean-squared error (dmse) between the Student and Teacher predictions, encouraging the model to produce consistent outputs under input perturbations. The total training objective combines these two components as ℒ = ℒs+μ(t)ℒu, where μ(t) is a time-dependent weighting factor that gradually increases the influence of the unsupervised term.
Building upon the previously described stacked autoencoder architecture, we initialize the student model using the pre-trained encoder-decoder structure. The teacher model begins as an exact copy of the student but evolves differently during training. While the student model updates through standard backpropagation, the teacher model's parameters () are updated at each training step t using an exponential moving average (EMA):
where θt represents the student model's parameters and α is a smoothing coefficient. This averaging process encourages a more stable model that can yield better predictions than the student model alone (Tarvainen and Valpola, 2017).
The training objective combines two loss terms: a supervised cross-entropy loss (Lce) for labeled data and a consistency loss (Lcon) that encourages agreement between student and teacher predictions on unlabeled data:
where λ is a weighting parameter that balances the two objectives. The consistency loss is computed as the MSE between the student and teacher predictions on the same input processed with different random augmentations. Both models employ the AdamW optimizer, with the encoders and classification layer trained end-to-end using this combined objective.
In the mean-teacher framework, all 14 478 unlabeled spectra participate in every training epoch through the consistency-loss objective; no pseudo-label thresholding is applied. Training employed an EMA coefficient α = 0.999 and a consistency-loss weight λ ramped linearly from 0 to 1 over the first 10 epochs. These hyperparameters have been added for reproducibility and to clarify that the entire unlabeled pool contributes to the semi-supervised signal in each epoch.
The primary advantage of this approach lies in using continuously refined pseudo-labels from the teacher model, which provides more stable and reliable training signals than traditional self-training pseudo-labeling. This method has yet to be used in any mass spectral data problem before this work.
This section presents an analysis of the models' performance, focusing on the impact of unlabeled data on classification accuracy and the identification of key features driving aerosol classification.
3.1 Reconstruction Performance
The ability of the stacked autoencoder to reconstruct a mass spectrum from a latent compressed representation shows robust performance, with approximately 80 % of test samples showing a sum of squares error (SSE) below 0.09. Figure 4 illustrates this performance using a Moroccan soil sample, where the reconstructed spectrum exhibits reconstruction of high-intensity peaks while maintaining the sparsity of zero or low-intensity peaks.
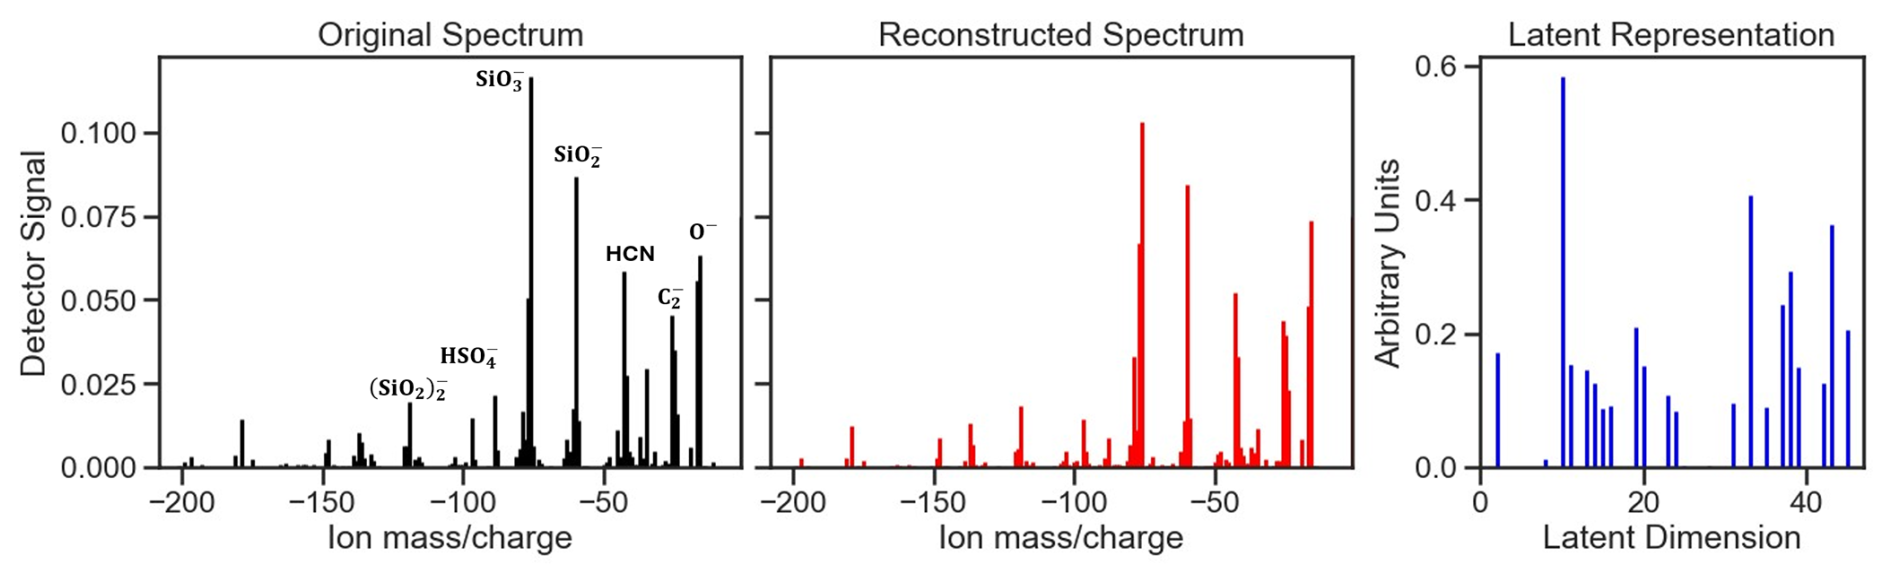
Figure 4Example of spectral reconstruction and feature compression by the Stacked Autoencoder (SAE). Panels illustrate a representative Moroccan soil-dust aerosol negative polarity spectrum (left), its reconstructed spectrum generated by the trained Stacked Autoencoder (middle), and the corresponding latent representation vector in the reduced-dimensional space (right). The original and reconstructed spectra display strong alignment indicating effective preservation of chemically relevant structure. The reconstruction error (sum of squares) for this sample is 0.09. The latent vector encodes 48 features capturing dominant compositional patterns used for downstream classification. All intensities are arbitrarily normalized for visualization, with y axes representing normalized ion signal strength and x axes denoting (negative-ion mode).
The stacked autoencoder showed consistent reconstruction performance across classes, with Chinese soil, Hazelnut particles, and Argentinian soil having the three lowest (best) average reconstruction errors at 0.015, 0.027, and 0.031, respectively. Conversely, Cellulose, Soot, and SOA exhibited the three highest (worst) reconstruction errors, indicating less accurate reconstruction. The average reconstruction error per class was 0.082, and as such we show a representative sample in Fig. 4 for a similar performance.
No statistically significant correlation (R2 < 0.1) was observed between reconstruction error and F1-score, indicating that reconstruction fidelity is not a proxy for classification performance within this dataset. For example, despite their high reconstruction errors, classes like Soot achieved high precision and recall scores, while Chinese and Argentinian samples with very low reconstruction errors showed sub-par classification performance. The distribution of SSE scores per class is included in the appendix (Fig. A2).
3.2 Overall Model Performance
The metrics used to evaluate classifier performance include:
-
Overall accuracy (OA): the proportion of correct predictions
-
Precision: the proportion of positive predictions that are correct
-
Recall: the proportion of actual positive cases correctly identified
-
F1 score: considers both precision and recall equally for each class
-
Confusion matrix (Fig. 5): depicts the correct identifications and misclassifications
Permutation feature importance analysis is employed to understand model decision-making. This involves shuffling feature values randomly and measuring the resulting decrease in F1 score. Comparing feature importance across models and classes, as will be done in Sect. 3.3, reveals the most influential mass spectral features for each aerosol type. Those mass peaks consistently ranked among the ten most influential across all model architectures are shown in Table A5. Furthermore, the area under the precision-recall curve (AUC-PR) aids in assessing how well models distinguish between class pairs, especially useful for imbalanced classes. Class-specific precision, recall and F1-scores are available in the appendix in Table A2.
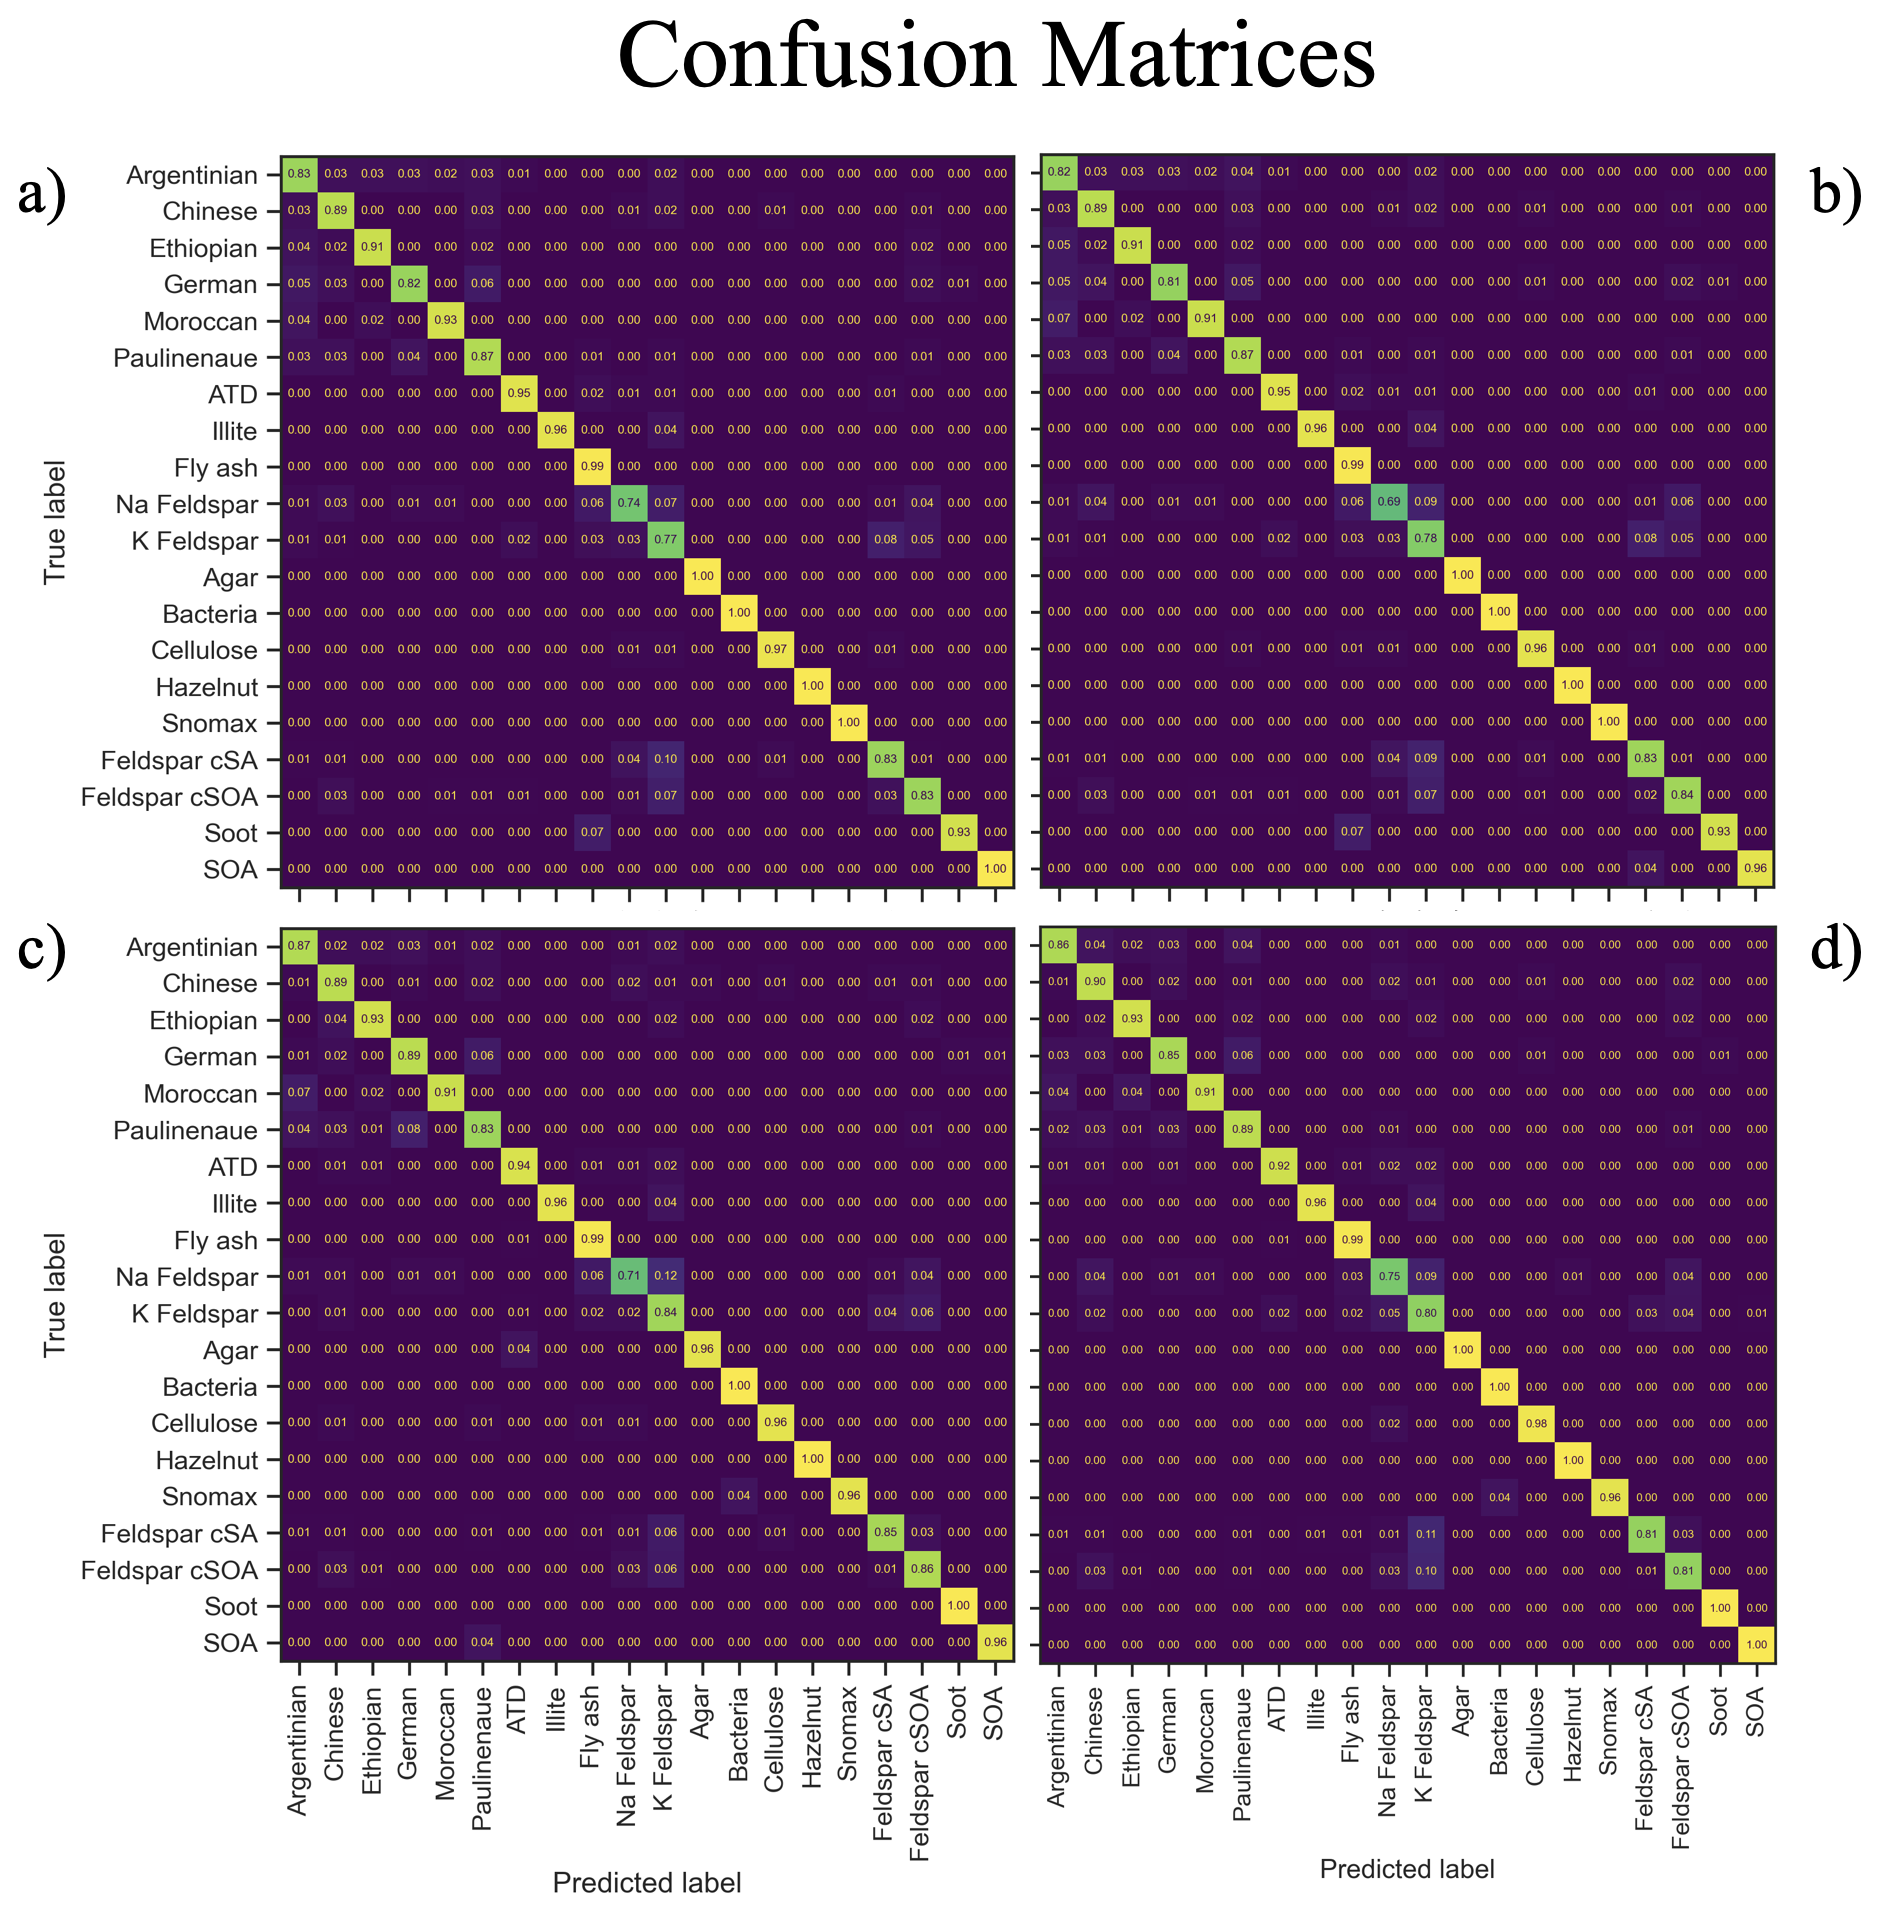
Figure 5Confusion matrices illustrating classification performance across the 20 aerosol classes for each model. (a) Standard Support Vector Machine (SVM) classifier, (b) Self-Training SVM classifier, (c) Stacked Autoencoder classifier, and (d) Mean Teacher–trained Stacked Autoencoder classifier. Diagonal elements represent correctly classified samples, while off-diagonal elements indicate misclassifications. Color intensity corresponds to normalized prediction frequency within each true class.
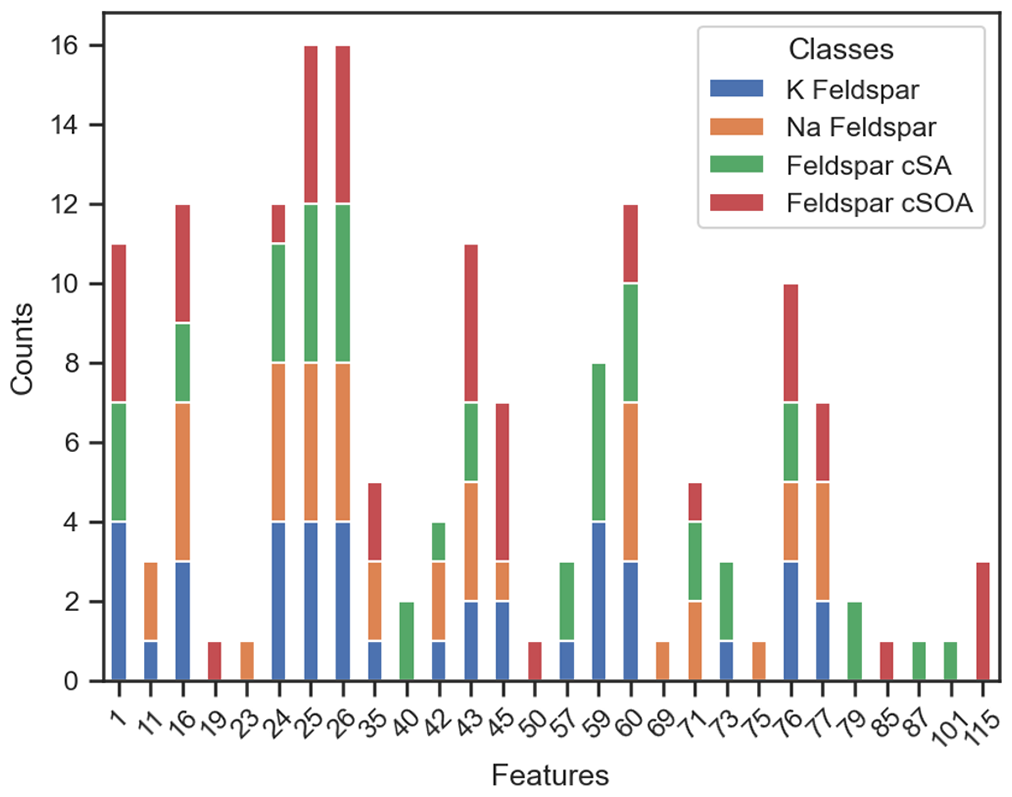
Figure 6Frequency of mass spectral ions in top-10 feature importance rankings for feldspar species. For each of four classification models and each of four feldspar species (K-feldspar, Na-feldspar, Feldspar cSA, Feldspar cSOA), the top 10 most influential ions were identified via permutation importance analysis. Bar height indicates the frequency with which each ion (− value) appeared in these top-10 lists, with a maximum possible count of 4 per species (one per model) and 16 total across all species. Colors represent individual feldspar species: K-feldspar (blue), Na-feldspar (orange), Feldspar cSA (green), and Feldspar cSOA (red).
The models achieved overall accuracies of 90.0 %–91.1 %, representing robust performance for a challenging 20-class classification task characterized by severe class imbalance (e.g., Soot and Hazelnut as rare classes) and high spectral overlap between aerosol types (e.g., Feldspar species). This performance surpasses the 87 % accuracy previously reported on this dataset (Christopoulos et al., 2018) and is competitive with 94 %–97 % accuracies achieved on simpler, 8-class aerosol problems (Wang et al., 2024c). The performance of all classifier models is listed in Table 2.
Table 2Performance metrics of each model in this study. Left to right: Overall accuracy (OA), Precision, Recall, and F1-Score. Performance metrics of the four classification models evaluated in this study. Reported values represent overall accuracy (OA), precision, recall, and F1 score (%) for each approach. Bold values denote the highest performance per metric. The Regular Stacked Autoencoder (Model 3) achieved the best overall balance of precision and recall, while the Mean Teacher variant (Model 4) exhibited comparable recall and F1 scores.
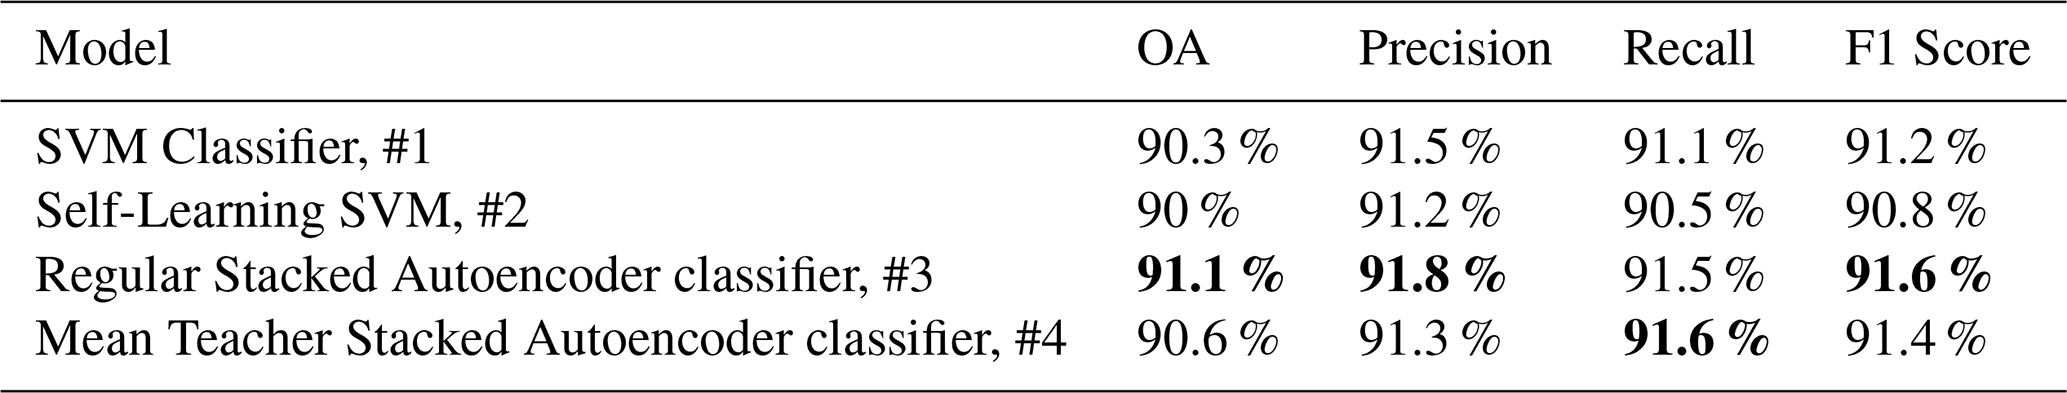
The stacked autoencoder classifier (Model 3) performed best at 91.1 % overall accuracy, 91.8 % precision and 91.6 % F1-score. Model 1 achieved an F1 score of 91.2 % but during parameter optimization most iterations yielded a score below 89.5 %. The performance of each model in each class can be seen in the confusion matrix in Fig. 5. Certain misclassifications were not random but reflected underlying chemical overlap among particle classes. For example, K-Feldspar and Na-Feldspar spectra were frequently assigned to other mineral or metallic types. This ambiguity is consistent with shared ion signatures (see Table A1 for a reference guide to ion identities): feldspar and dust both exhibit strong signals at −16 (O−), −24 (C), and −60 (SiO). Similarly, bacterial and Snomax particles showed overlapping assignments, attributable to common peaks such as −26 (CN−) and −43 (C2HO−) (Table A1). These confusions reproduce the challenges faced by manual SPMS classification, thereby reinforcing the models' ability to capture genuine ambiguities inherent in atmospheric particle spectra. Including the unlabeled data in a semi-supervised fashion for the SVM model showed a slight decrease in performance (Model 2), despite the increase in overall training data. The calibration procedure for the self-learning SVM, as discussed in Sect. 2, demonstrated difficulty in using most of the unlabeled data to increase classification accuracy.
The small differences in overall classification performance mask improvements in the classification of rare but atmospherically significant aerosol types as seen in Fig. 7. Notably, the stacked autoencoder classifiers (Models 3 and 4) showed better performance for underrepresented classes like Soot, Agar, and Moroccan aerosol types. For example, Model 3 improved Soot classification from an F1-score of 93 % to 97 %. These class-specific differences become particularly important when examining challenging classification problems where spectral overlap and class imbalances create systematic difficulties across all approaches.
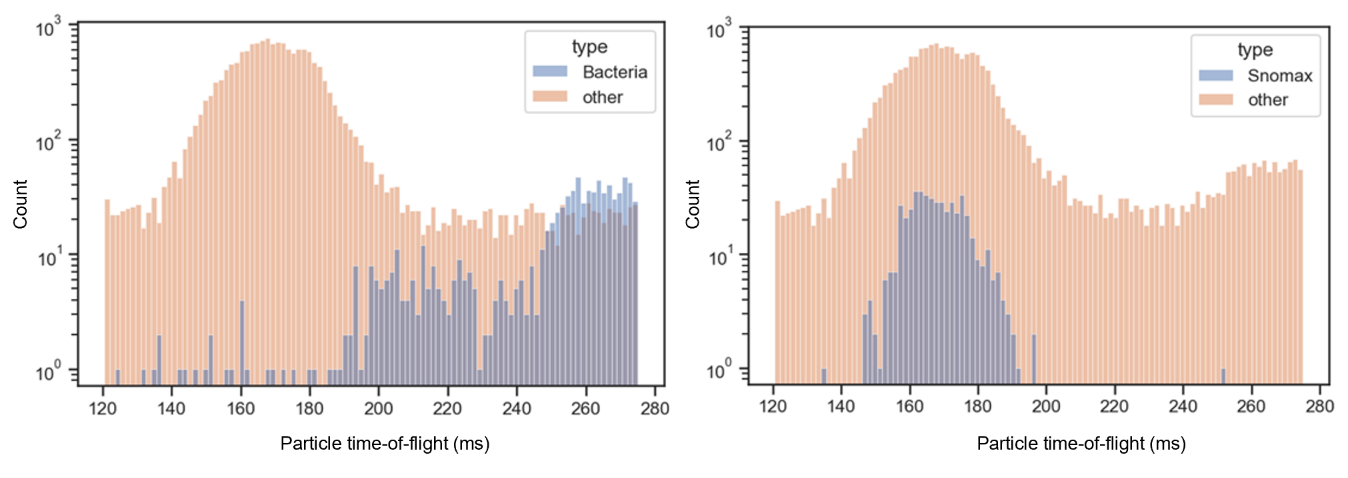
Figure 7Particle size distributions (time-of-flight) for Bacteria and Snomax classes relative to the rest of the labeled dataset. Histograms show the particle time-of-flight (ms) distributions, used as a proxy for vacuum aerodynamic diameter, comparing (left) Bacteria and (right) Snomax particles (blue) against all other particle types (orange). Both classes display distinct modal peaks in their time-of-flight distributions, indicative of characteristic aerodynamic size ranges that differ from the broader distribution of other aerosol types. Bacteria exhibit longer flight times (typically >230 ms), corresponding to larger effective diameters, while Snomax shows a narrower mode near 170 ms, consistent with smaller, more uniform particle sizes.
3.3 The Subtleties of Feldspar Species
The classification of feldspar species presents unique challenges due to their overlapping mass spectral characteristics. To identify which ions contribute most strongly to feldspar discrimination across all four classification frameworks, we analyzed feature importance rankings systematically. For each model and each of the four feldspar species (K-feldspar, Na-feldspar, Feldspar cSA, Feldspar cSOA), the top 10 most influential features were extracted based on permutation importance scores. We then counted how many times each ion appeared in these top-10 lists across all models for each feldspar species (Fig. 8). Because each feldspar species contributes rankings from four models, a given ion can appear up to 4 times per species. This results in a maximum possible count of 16 for any single ion across all four feldspar classes (4 models × 4 species). This aggregation highlights which ions consistently emerge as key discriminators across different model architectures.
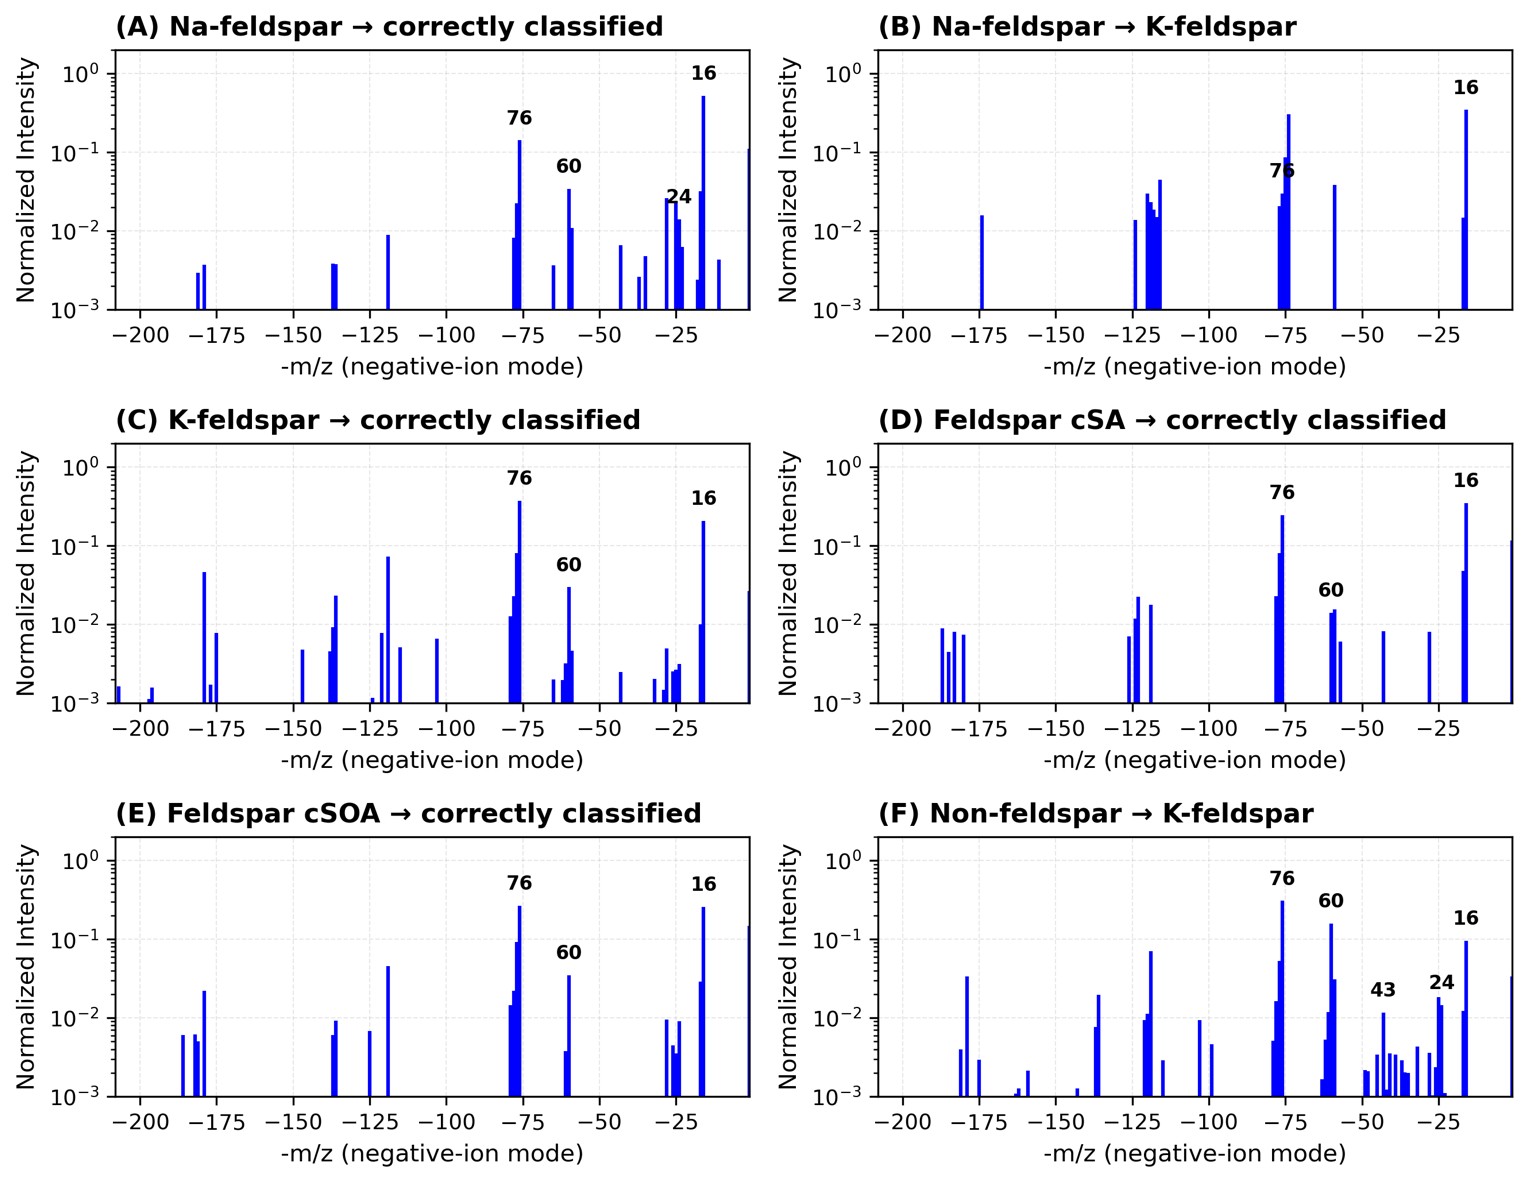
Figure 8Representative negative-ion single-particle spectra illustrating model successes and failures in feldspar classification. Panels (A)–(C) compare Na- and K-feldspar spectra: panels (A)–(C) are correctly classified (Models 3–4), whereas panel (B) shows Na-feldspar misidentified as K-feldspar (Model 1) owing to missing peaks at 60 , and shared peaks at −16, −24, −26, and −76 . Panels (D)–(E) display coated feldspars (cSA, cSOA); panel (F) shows a non-feldspar particle misclassified as K-feldspar.
This frequency analysis reveals that the mass peaks −16 (O−), −24 (C), −26 (CN−, H2C), −43 (HCN− AlO−), −60 (SiO), and −76 (SiO) consistently rank among the most influential features across all models and feldspar species. These peaks are universally discriminative, appearing in 44 % of all top-10 feature selections across models and all 20 particle types. For feldspar species specifically, these ions account for 56 % of top-10 selections. This means that the same spectral features critical for distinguishing feldspars from other aerosols are also important for classifying entirely different particle types (e.g., Illite, soot, organics), creating systematic feature overlaps that impact classification accuracy, particularly between K-feldspar and Na-feldspar.
Across all models, Na-feldspar proves consistently challenging to classify, showing the lowest F1 scores among feldspar species. Even Model 4's best performance (F1 score: 75 %) exhibits significant misclassification rates, with 7 % of Na-feldspar samples incorrectly classified as K-feldspar and 10 % misidentified as non-feldspar species. K-feldspar shows better classification performance but demonstrates asymmetric confusion patterns: other feldspar species are more frequently misidentified as K-feldspar (> 7.3 %) than as Na-feldspar (< 3.4 %), suggesting potential classification bias toward K-feldspar. Models 3 and 4 demonstrate superior performance in distinguishing between feldspar species (AUC-PR scores > 0.93) compared to SVM-based models (< 0.90), indicating the autoencoder approaches better capture subtle spectral differences.
Feldspar cSA and cSOA exhibit distinct classification patterns from their uncoated counterparts. These coated variants share fewer common influential features than uncoated feldspar species when comparing their top-10 feature lists across models – only −1 (H−), −25 (C2H−), −26 (CN−, C2H), and −43 (C2H3O−) appear consistently, enabling better discrimination between species. Model 4 achieves 95 % precision for Feldspar cSA with < 2 % false positives relative to other feldspar species. The presence of additional unique influential mass peaks, including −19 (F−), −50 (H2SO−), −79 (PO), −85, −87, −101, and −115, aids in distinguishing these species, contributing to their more reliable classification. Model 3 achieves the highest F1 scores for both coated species (88 % for cSA, 87 % for cSOA).
When the four feldspar classes in the confusion matrix are merged into a single class and the performance metrics were recalculated, it became evident that models 3 and 4 outperformed models 1 and 2 in differentiating Feldspar species from other aerosols. Model 4's performance increased overall accuracy from 90.6 % to 94.4 % as seen in Fig. A3. This approach achieves 96 % precision and 94 % recall on the test set, though misclassifications persist, primarily with Chinese soil, ATD, Illite, and Ethiopian soil samples. This performance improvement suggests that while distinguishing between feldspar species remains challenging, the models effectively identify feldspars as a broader class.
3.4 Classification Performance by Aerosol Type
Correct identification of organic aerosols such as agar, bacteria, hazelnut pollen, snomax consistently yields high F1 scores across all models, along with classification of Fly ash. Organic aerosols show high recall rates of 98 %–99 %, suggesting their chemical signatures are distinctive and well-captured by the classification algorithms. Notably, Bacteria and Hazelnut achieve perfect recall (100 %) across all models, while Snomax maintains perfect precision. The strong performance in classifying Fly ash can be attributed to its substantial representation (21 %) in the labeled dataset and its diverse characteristic peaks (−16, −24, −25, −26, −43, −76, −77, −79, and −80 ) that align with overall important identifying features across models.
The particle time-of-flight as proxy for the aerodynamic diameter remains a non-dominant discriminant for classification but emerges as a more reliable identifying-feature in SVM-based models (Models 1 and 2) compared to the autoencoder-based modes. Notably, time-of-flight ranks as the third most influential feature in classification of snomax for Models 1 and 2, and ranks fourth in classification of Bacteria aerosol type. The feature's significance in classifying Bacteria and snomax may be attributed with unique size distribution patterns as seen in Fig. 8, where Bacteria exhibits longer particle time-of-flight, while snomax form well-defined unimodal distribution. Furthermore, the feature appears 15 times among the top 30 features across different classes for Models 1 and 2, compared to only twice in autoencoder-based models for classification of illite and Na Feldspar types. The contrasting reliance on this feature demonstrates that feature importance is architecture dependent, suggesting that different frameworks may identify complementary discriminative patterns, with features deemed non-essential by one approach potentially serving as critical identifiers in another.
Concrete spectra illustrate the chemical basis of both correct and incorrect predictions. Figure 8 visualizes representative spectra samples underlying the most frequent model successes and misclassifications. Na- and K-feldspar share intense peaks at −16, −60, and −76 , explaining Na → K confusion in SVM-based models (Model 1). By contrast, autoencoder frameworks (Models 3–4) resolve subtle intensity-ratio and co-ion differences, achieving AUC-PR > 0.93 for feldspar separation. For coated feldspars (cSA, cSOA), the crucially missing diagnostic −60 (SiO) improves precision (Model 4: cSA 95 % precision, < 2 % false positives) and F1-scores ≈ 0.88. The final panel shows a non-feldspar particle, in this case Ethiopian soil, misidentified as K-feldspar, consistent with the > 7 % bias quantified in Sect. 3.3. A confusion matrix that better demonstrates non-feldspar prediction bias toward K-feldspar is seen in Fig. A1. These exemplars confirm that misclassifications arise from true spectral overlap, not random noise, and complement the statistical metrics in Fig. 8.
Remarkably, soot and hazelnut pollen achieve F1-scores above 93 % and often reach 100 % despite their limited representation in the dataset. Hazelnut pollen maintains perfect recall across all models, while soot's recall ranges from 93 % to 100 %. Although the Hazelnut and Agar classes achieved 100 % classification accuracy, these classes each comprise fewer than 1 % of the dataset and therefore contain a small number of test samples under a 10 % split. Perfect accuracy in such cases is statistically possible and reflects the model's high feature separability rather than random behavior or overfitting. Because small test-set counts can inflate apparent precision, these results should be interpreted with caution. Models 3 and 4 successfully classify all soot samples, whereas models 1 and 2 misclassify a single soot outlier as fly ash, likely due to sparse spectral features at −24 (C), −36, and −49 that are better captured by the autoencoder architecture. The F1-scores of these classes are shown in Table A2.
Although overall accuracies cluster near 90 %–91 %, per-class analysis shows relevant differences: autoencoder models raise F1 for several rare or compositionally complex classes (e.g., soot and coated feldspars), while SVMs showcase the benefit of including size information to separate populations (Snomax, Bacteria). These patterns indicate that modest global gains can coincide with practical improvements for the very particle types that govern radiation and cloud microphysics.
The models show high performance in distinguishing geographically distinct dust aerosols (Moroccan, Ethiopian, and Argentinian soil dust), despite their smaller sample sizes and overlapping spectral features, particularly at −25, 26, −43, −64, −76, and −79 values. Ethiopian aerosols are characterized by significant features in higher ranges, while Argentinian soil dust show distinctive features below 100 . Moroccan soil dust aerosols display higher overall spectral activity, though some soil samples are occasionally misclassified as Ethiopian or Argentinian due to shared spectral characteristics. Despite these challenges, the models maintain robust recall rates across these geographic variants.
This study demonstrates the potential of machine learning approaches, particularly stacked autoencoders, in advancing the classification of atmospheric aerosols using single-particle mass spectrometry data. The overall accuracy of 90 %–91 % achieved by our models is competitive and represents an advance for fine-grained aerosol analysis. Previous work on the same 20-class dataset using a Random Forest classifier reported an accuracy of 87 % (Christopoulos et al., 2018). Our results surpass this benchmark, indicating an improvement in classification reliability. Furthermore, our performance is on par with state-of-the-art deep learning methods, such as 1D and 2D CNNs, which have achieved accuracies of approximately 90.4 % on similar, albeit less complex, 13-class SPMS datasets (Wang et al., 2023, 2024b). While higher accuracies (94 %–97 %) were reported, these are for a broader 8-class problem (Wang et al., 2024c), underscoring the strong performance of our models on this challenging 20-class task.
Our results reveal distinct architectural tendencies in how models separate aerosol classes. SVM-based models (Models 1 and 2) showed a stronger reliance on aerodynamic diameter (particle time-of-flight) when it provided clear discriminative information, as seen in the classification of Snomax and Bacteria (Fig. 9, Sect. 3.4). In contrast, autoencoder-based models (Models 3 and 4) learned nonlinear latent representations that captured subtle co-variations among chemically related ions. This allowed them to better leverage a broader spectrum of spectral features, resulting in improved recognition of compositionally similar or coated particles (Sect. 3.3). This distinction suggests autoencoders may be more adept at navigating complex chemical similarities.
The integration of 14 478 unlabeled spectra through encoding capabilities and semi-supervised learning yielded mixed but informative results. While it did not substantially improve global metrics like overall accuracy (Table 2), it provided notable, targeted gains for under-represented particle types (Table A2). For instance, the Model 4 improved F1-scores for soot and coated feldspar classes. This suggests the primary value of semi-supervised learning may lie not in boosting global performance, but in enhancing model robustness for rare aerosol types, which is precisely where labeled data is most scarce and traditional supervised models are least reliable. Critically, the models implemented here cannot identify “unknown” aerosol types absent from the training data; their strength lies in improving the generalization for known, but rare, classes.
Although all approaches converge near 90 %–91 % overall accuracy, the remaining 9 %–10 % of misclassified spectra do not primarily reflect algorithmic limitations but rather intrinsic chemical overlap in the data. The confusion matrices (Fig. 5) and feldspar-specific analysis (Sect. 3.3) show that misclassifications are not random. Instead, they occur systematically between chemically adjacent classes, such as K-feldspar vs. Na-feldspar or coated vs. uncoated feldspars. These borderline cases represent physically meaningful ambiguity from particles with mixed or transitional compositions, rather than simple model failure. The observed accuracy plateau near 91 % likely marks the practical limit of compositional separability within this dataset.
This interpretation is strengthened by the persistent difficulty in classifying feldspar species. The systematic confusion between K-feldspar and Na-feldspar stems from their similar identifying spectral features (Fig. 8). Conversely, the models' higher performance in classifying coated feldspars (cSA and cSOA) suggests a strong sensitivity to surface composition, which is critical for understanding aerosol mixing states. When the four feldspar species were aggregated into a single class, overall accuracy for Model 4 increased from 90.6 % to 94.4 % (Sect. 3.3), confirming that the models effectively identify feldspars as a broad class, even if they struggle with intra-class separation.
The autoencoder's reconstruction quality (Fig. 4) showed no direct correlation with its classification accuracy (Sect. 3.1). For example, Soot had a high reconstruction error but a near-perfect F1-score. This result indicates that the model's strength is not in perfect spectral replication but in its ability to learn a compressed latent representation that effectively isolates the most critical features for class discrimination.
Although differences in model performance metrics (≤ 1 %) may appear numerically small, they are meaningful in the context of atmospheric aerosol analysis, and the challenging classification task at hand. This dataset's significant class imbalance (Table 1) was retained intentionally, as it preserves the physical realism of atmospheric populations where particle-type frequencies are naturally uneven. The models' performance per class (Table A2) appears robust to this imbalance, suggesting that classification difficulty is tied to the spectral separability of features rather than the number of samples. For example, some classes with very low support achieve near-perfect F1-scores (e.g., Soot, 0.8 % support; Hazelnut, 1.0 % support), while some of the largest classes are among the worst-performing due to chemical overlap (e.g., K-feldspar, 7.9 % support). The consistently high F1-scores for all four biological-related classes (Bacteria, Snomax, Agar, Hazelnut), despite their wide range of support, further suggests these particles possess highly distinct spectral signatures that the models can reliably learn.
Benchmarking robustness against this realistic distribution is a key goal, as a 1 % gain in overall accuracy corresponds to ∼ 187 additional correctly classified spectra in our dataset, with these improvements primarily benefiting the minority classes. These rare classes – such as soot, feldspars, and bioaerosols – are disproportionately influential in determining aerosol optical and cloud-microphysical properties. For example, improving the classification fidelity of soot is critical as it is a unique and dominant light-absorbing aerosol, and its misclassification directly impacts the uncertainty of aerosol absorption and radiative forcing estimates in climate models (Bond et al., 2013). Similarly, mineral dusts are recognized as the most important type of INPs (Kanji et al., 2017), and studies show that feldspar minerals specifically, despite being a minor mass component, dominate ice nucleation in mixed-phase clouds (Atkinson et al., 2013). Therefore, improving the classification of feldspar species – a key challenge identified in our results (Sect. 3.3) – is essential for reducing uncertainty in modeled cloud properties and ice nucleation rates.
This paper develops and evaluates machine learning approaches for classifying atmospheric aerosols using single-particle mass spectrometry, comparing supervised and semi-supervised frameworks. The supervised stacked autoencoder achieved the highest overall performance (91.1 %), while semi-supervised extensions demonstrated advantages for underrepresented and compositionally complex particle types. These findings underscore that while unlabeled data do not uniformly enhance classification metrics, they can improve model robustness and generalization for rare aerosol events. We compared four models: supervised SVM, self-training SVM, stacked autoencoder, and mean teacher autoencoder frameworks on a dataset of 18 827 labeled spectra representing 20 distinct aerosol types. To demonstrate the performance of the deep learning approach, we showed that stacked autoencoder models achieved 91.1 % overall accuracy, outperforming SVM-based methods (90.0 %–90.3 %) while maintaining robust performance for rare aerosol classes critical to atmospheric science applications. The autoencoder architecture successfully leveraged unlabeled data during representation learning, whereas traditional semi-supervised SVM approaches showed limited improvement. These results advance automated aerosol classification capabilities and provide methodological insights for applying machine learning to atmospheric particle analysis, ultimately supporting more accurate characterization of aerosol impacts on climate and air quality.
Beyond this dataset, the framework refines how single-particle measurements inform climate and air-quality models. More accurate, automated class labels enhance constraints on aerosol–cloud interactions, heterogeneous chemistry, and long-range transport in regional and global simulations. Because radiative and microphysical effects are often controlled by low-frequency particle types, even small improvements in classification robustness can yield disproportionate benefits in parameterizing aerosol behavior.
Future work requires addressing three key limitations identified in this study. First, developing targeted approaches for class imbalance, particularly for rare but scientifically important aerosol types like Soot and biological particles, where limited training data constraints model development. Second, improving discrimination between chemically similar species, especially feldspars, through advanced feature engineering or architectural modifications that better capture subtle spectral differences. Third, enhancing semi-supervised learning frameworks to more effectively leverage the abundant unlabeled SPMS data typically available in atmospheric measurements. Addressing these challenges would improve classification reliability for operationally critical but underrepresented aerosol populations and maximize the value of unlabeled spectral data in real-world deployment scenarios.
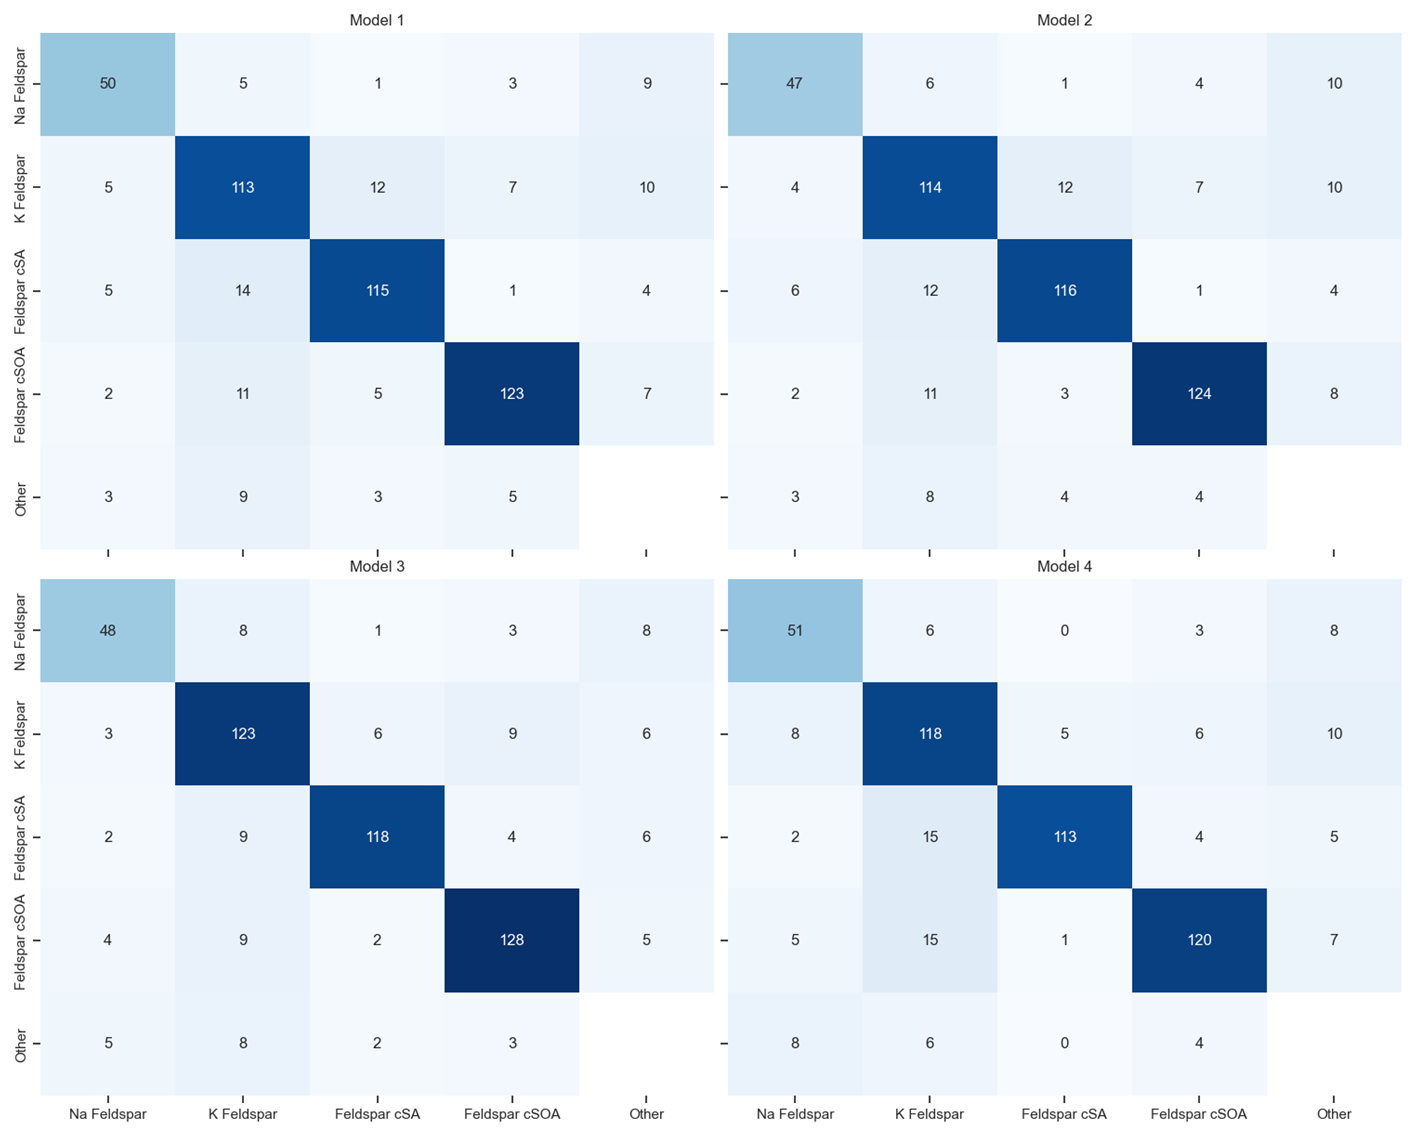
Figure A1Adjusted confusion matrices for each of the four classification models, aggregating counts for all non-feldspar aerosol categories into a single “Other” class. Each panel (Models 1–4) displays the distribution of true (y axis) vs. predicted (x axis) labels for Na-feldspar, K-feldspar, feldspar cSA, feldspar cSOA, and the aggregated non-feldspar group. Darker cells correspond to higher counts, indicating stronger agreement between ground-truth and predicted classes. The results demonstrate consistent diagonal dominance across models, reflecting robust classification performance and limited cross-class confusion, with minor overlap primarily between Na- and K-feldspar subclasses.
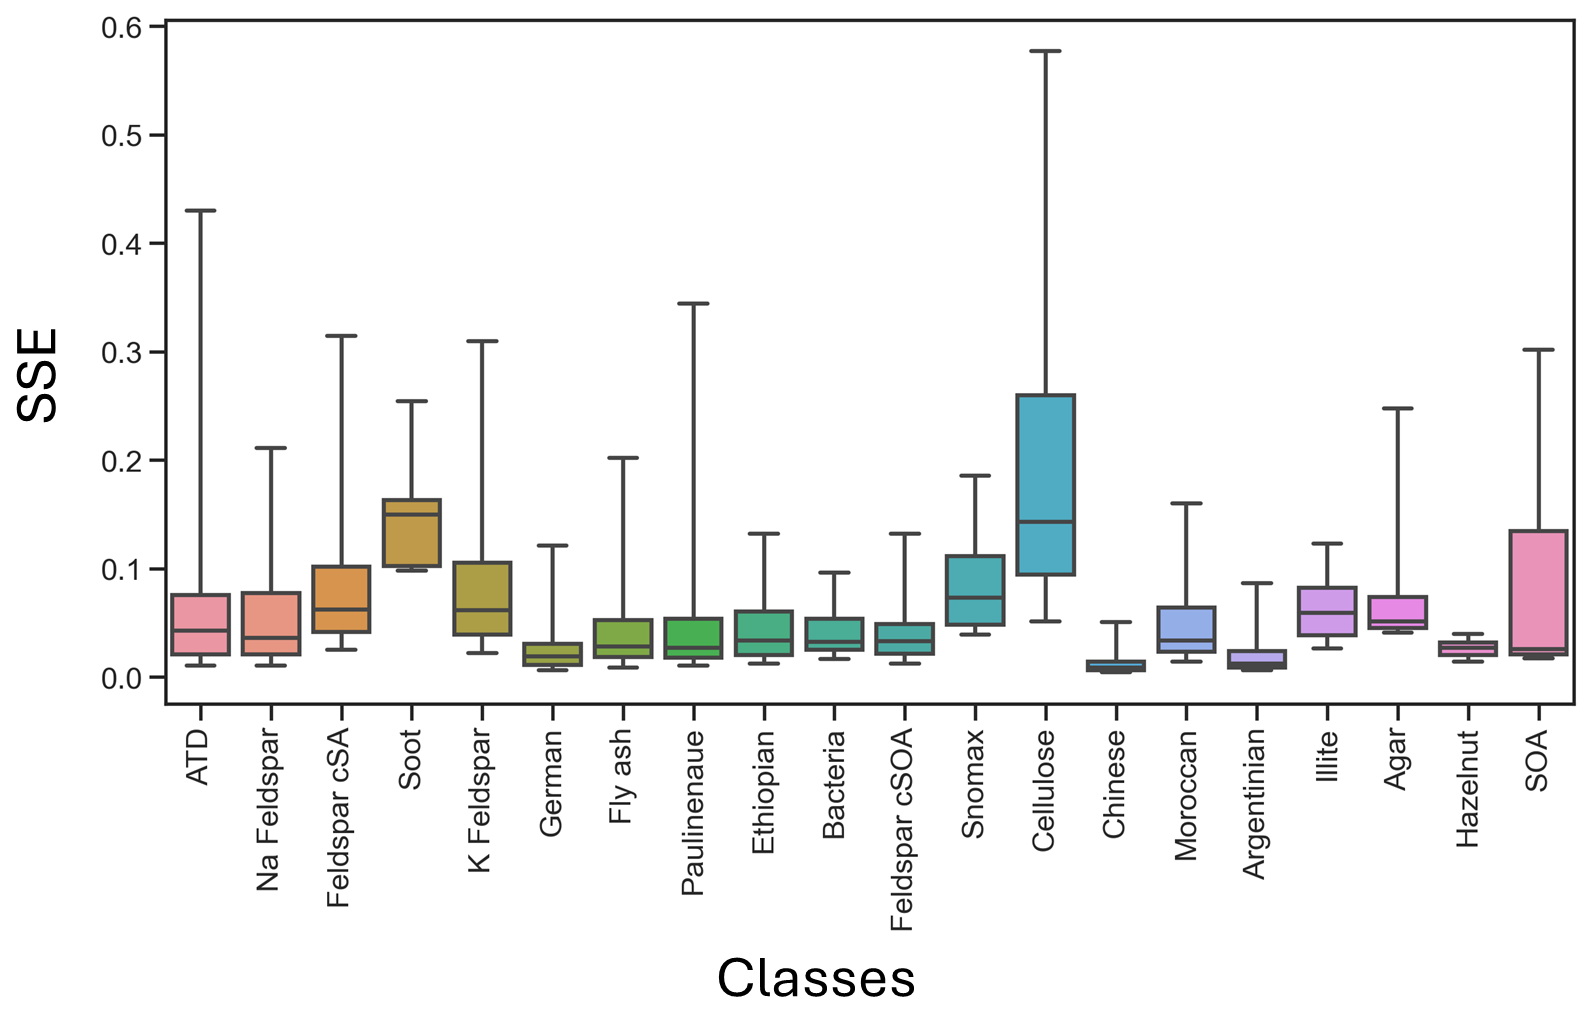
Figure A2Distribution of sum-of-squares errors (SSE) across aerosol classes from the autoencoder reconstruction analysis. Each box represents the interquartile range (IQR) of reconstruction errors for particles within a given class, with whiskers denoting the 5th–95th percentiles. Classes with higher median SSE values – such as feldspar cSA, feldspar cSOA, and cellulose – indicate more complex or compositionally heterogeneous spectra that challenge accurate reconstruction. In contrast, classes such as K-feldspar, bacteria, and mineral dust analogs (e.g., ATD, German, Ethiopian) exhibit low reconstruction variability, reflecting well-defined and chemically stable spectral signatures.
Table A1Negative-ion mass spectral peak reference guide summarizing the principal values, corresponding ion identities, and their common chemical sources or associations. The table provides a reference framework for interpreting single-particle mass spectra, linking characteristic negative ions (e.g., O, OH, CN, SiO2) to their underlying chemical compositions and probable aerosol origins.
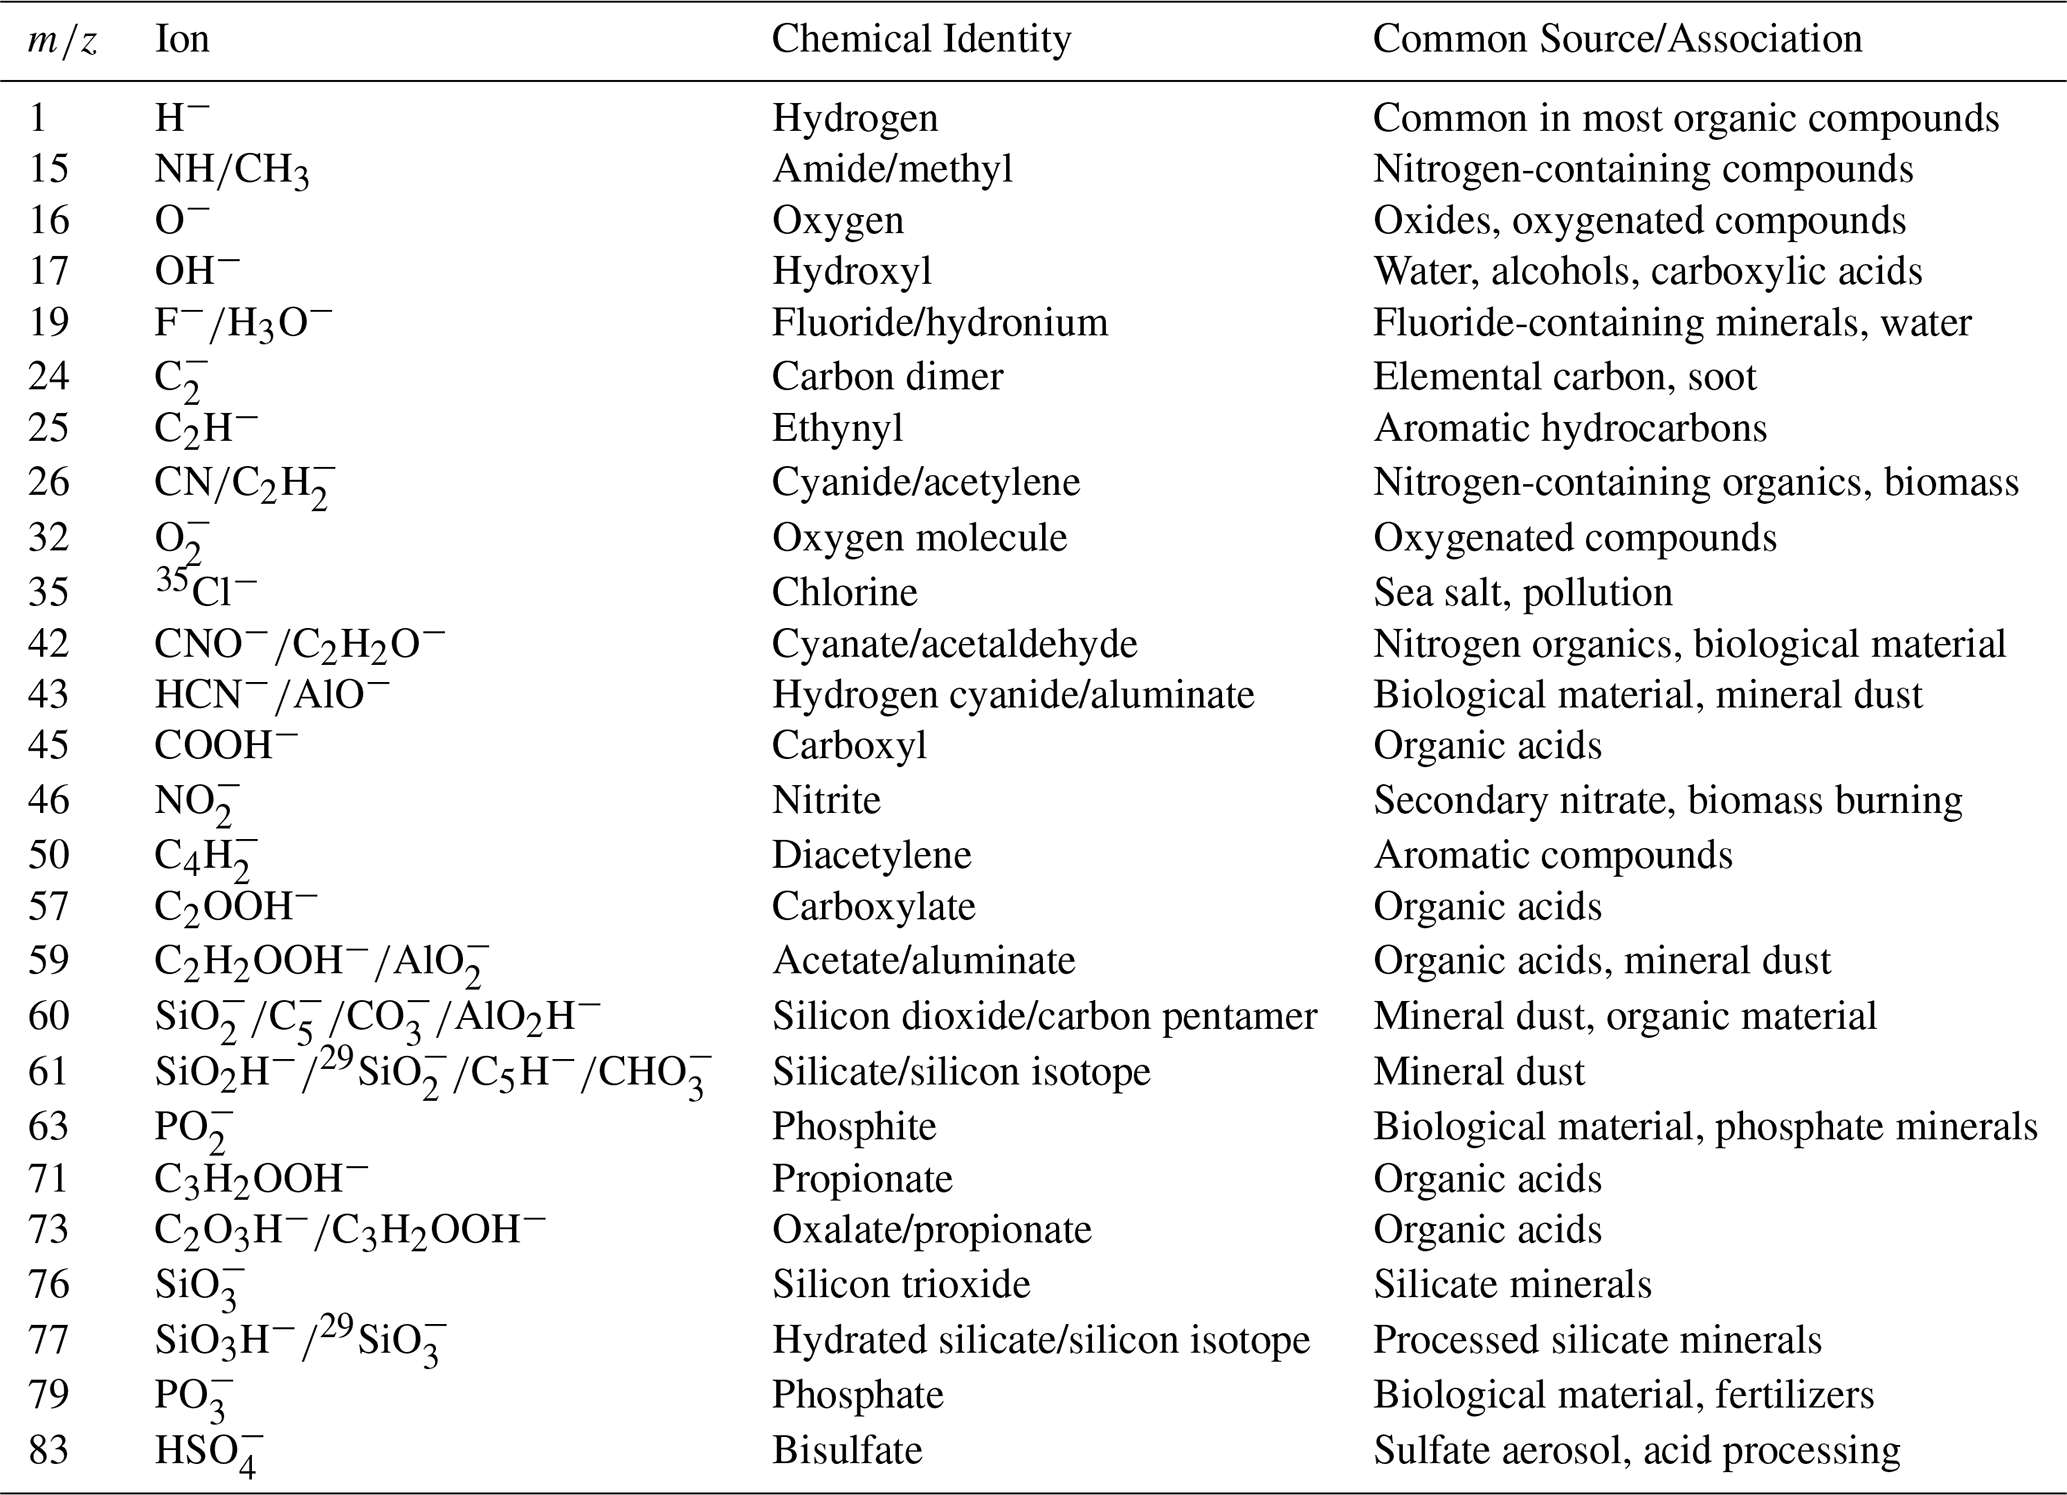
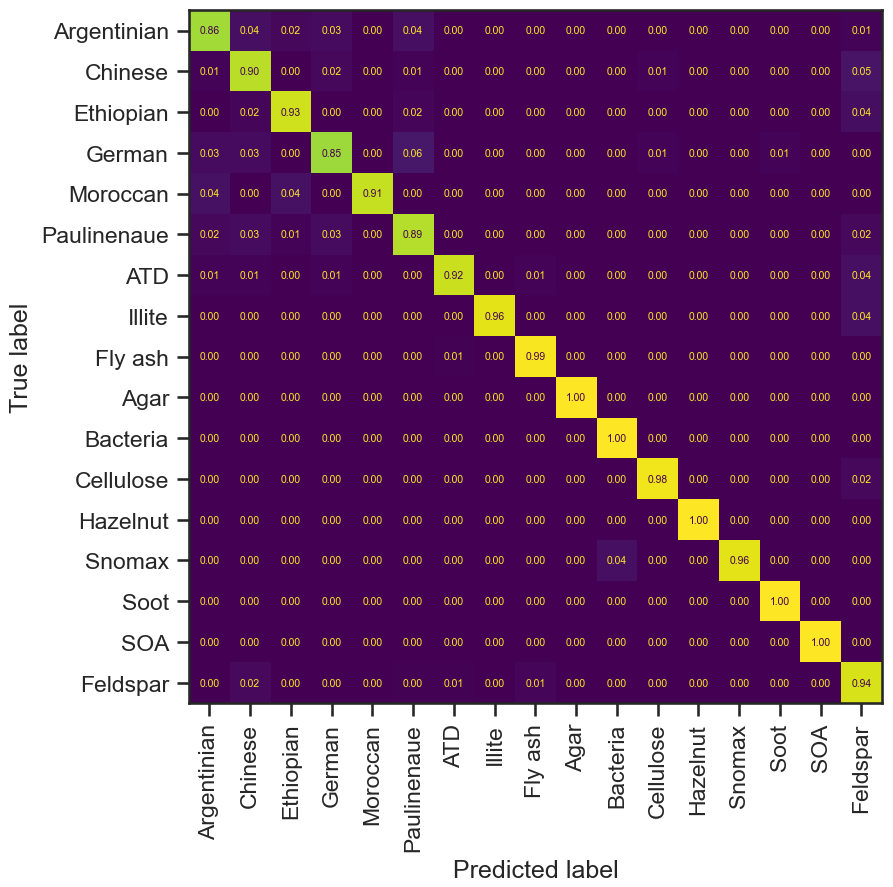
Figure A3Recalculated confusion matrix for Model 4 after aggregating all feldspar subclasses (Na-feldspar, K-feldspar, feldspar cSA, and feldspar cSOA) into a single composite “Feldspar” category. Each cell represents the normalized proportion of predictions for a given true-predicted class pair, with diagonal elements indicating correct classifications. The strong diagonal dominance (values ≥ 0.85 for most classes) demonstrates high overall classification accuracy and confirms that grouping feldspar subclasses enhances model interpretability while preserving discrimination among non-feldspar aerosol types. Minor off-diagonal elements reflect limited cross-class overlap primarily among mineral dust analogs.
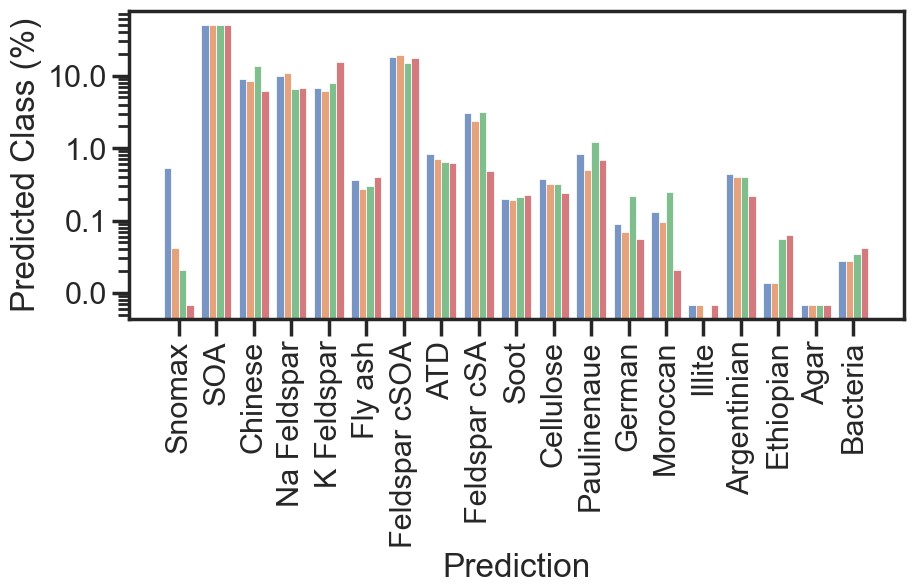
Figure A4Histogram of model predictions on the unlabeled aerosol mass spectra dataset. Each bar represents the percentage of spectra assigned to a given class by one of four trained models: Model 1 (blue), Model 2 (orange), Model 3 (green), and Model 4 (red). The figure illustrates consistency in class distribution across models, with dominant predictions observed for mineral and organic aerosol types (e.g., Na- and K-feldspar, feldspar cSOA, and SOA). Minor variations in relative abundance reflect model-specific weighting of spectral features and latent representations, confirming overall robustness and reproducibility of the classification framework across independently trained architectures.
Table A2Performance metrics for supervised and semi-supervised SPMS (Single-Particle Mass Spectrometry) classification models, including Support Vector Machine (SVM), Self-training SVM, Stacked Autoencoder, and Mean Teacher architectures. Reported values correspond to precision (P), recall (R), and F1-score (F1), with sample support (Supp) denoting the number of spectra per class. Bolded F1-scores indicate the highest performance achieved for each aerosol type. Results show consistently high accuracy across mineral, organic, and biological particle classes, with Mean Teacher and Stacked Autoencoder models generally outperforming baseline SVMs, particularly for complex or coated mineral types (e.g., feldspar cSA and cSOA).
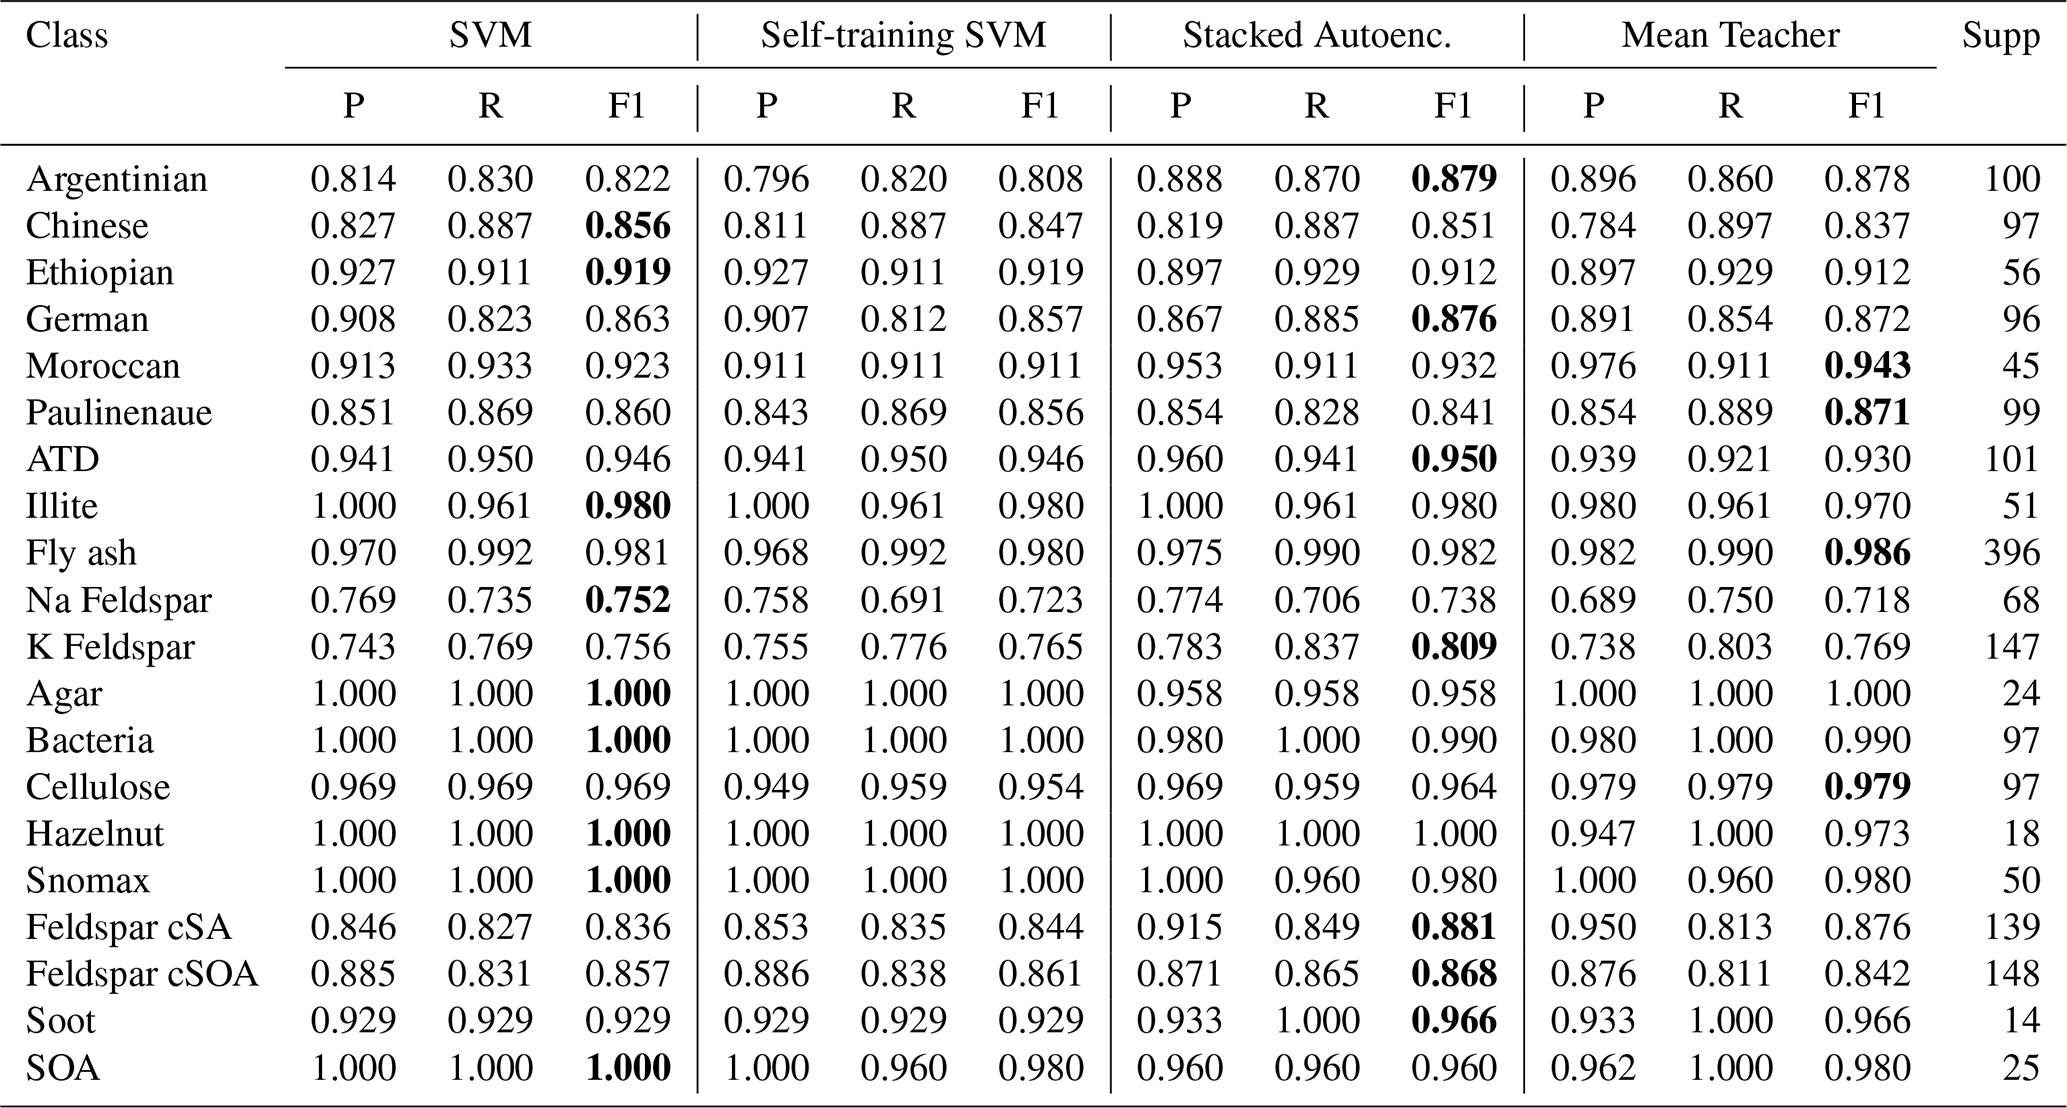
Note: P = Precision, R = Recall, F1 = F1-score, Supp = Support (sample counts). Values are rounded to three significant figures. Best F1-score per class is highlighted in bold.
Table A3Model performance stability across different train–test split ratios (10 %, 20 %, and 25 %). Reported metrics include overall accuracy, macro F1, and weighted F1. Results show less than 1 % variation across configurations, confirming that the adopted 90/10 split provides robust and class-balanced evaluation. Larger test fractions resulted in minor reductions in accuracy and increased sampling variance for minority aerosol classes (e.g., soot, agar, and hazelnut pollen).
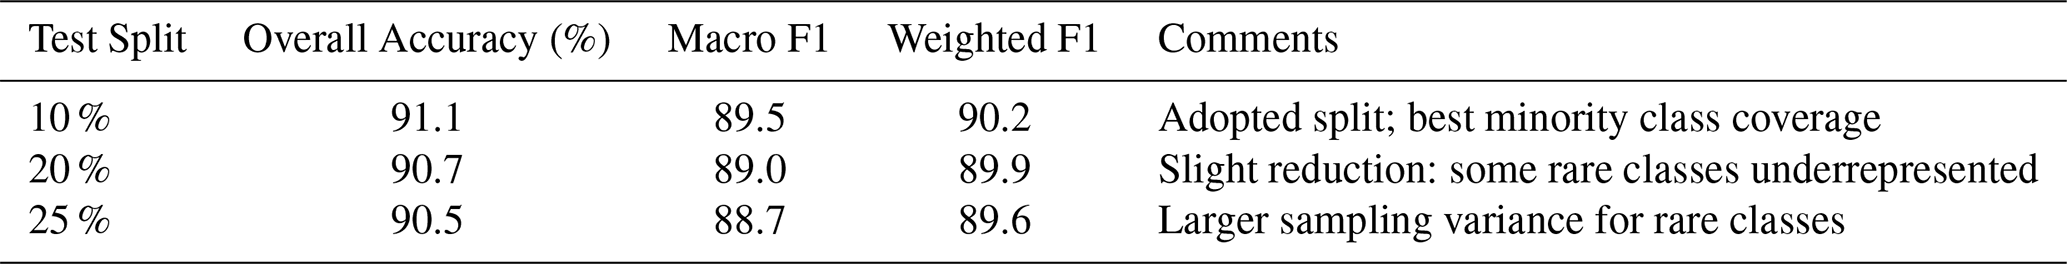
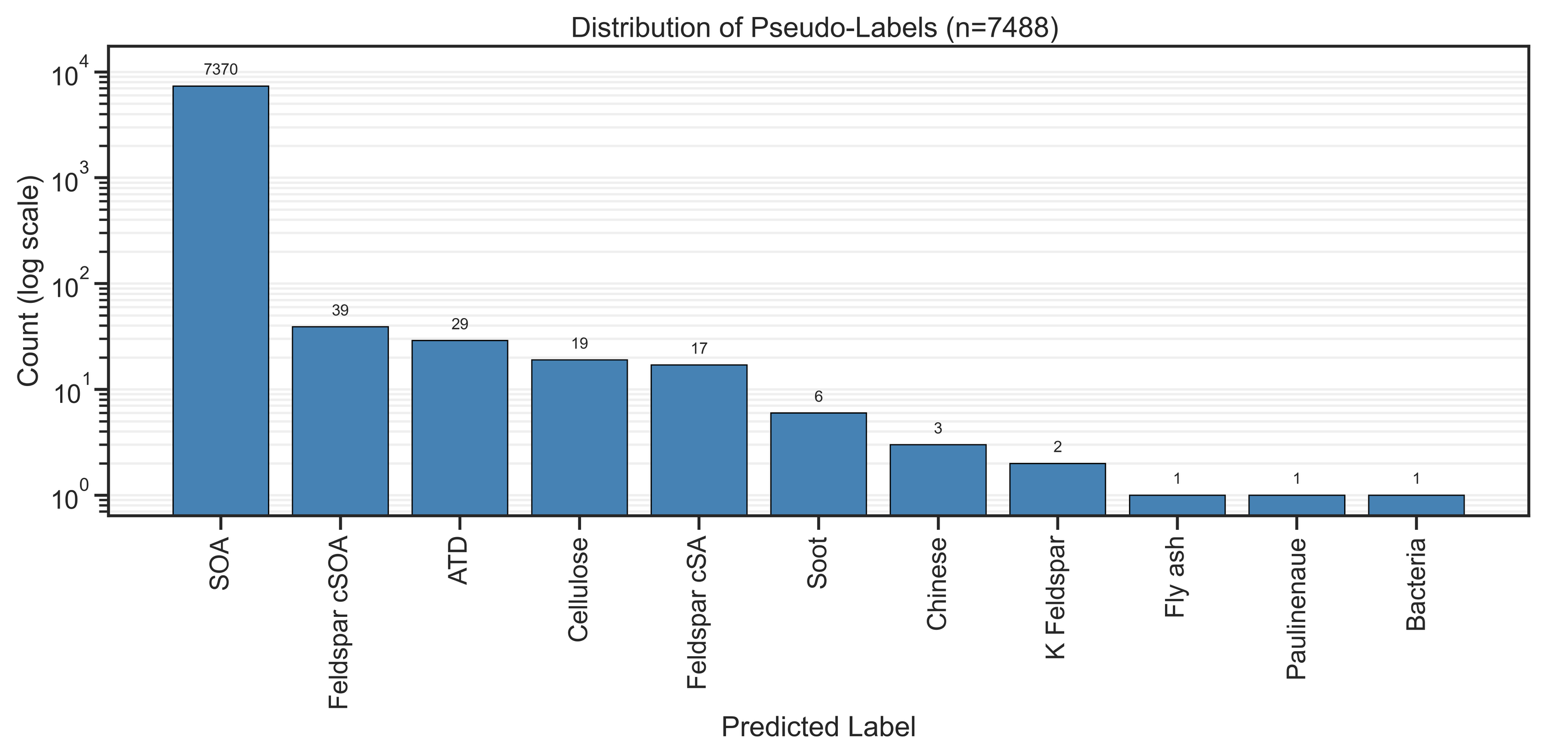
Figure A5Pseudo-labeled spectra admitted at threshold = 0.95 during the self-training SVM (Model 2). 7488 unlabeled spectra (51 % of the unlabeled pool) were admitted as pseudo-labeled samples after meeting the 0.95 confidence threshold over 16 iterations.
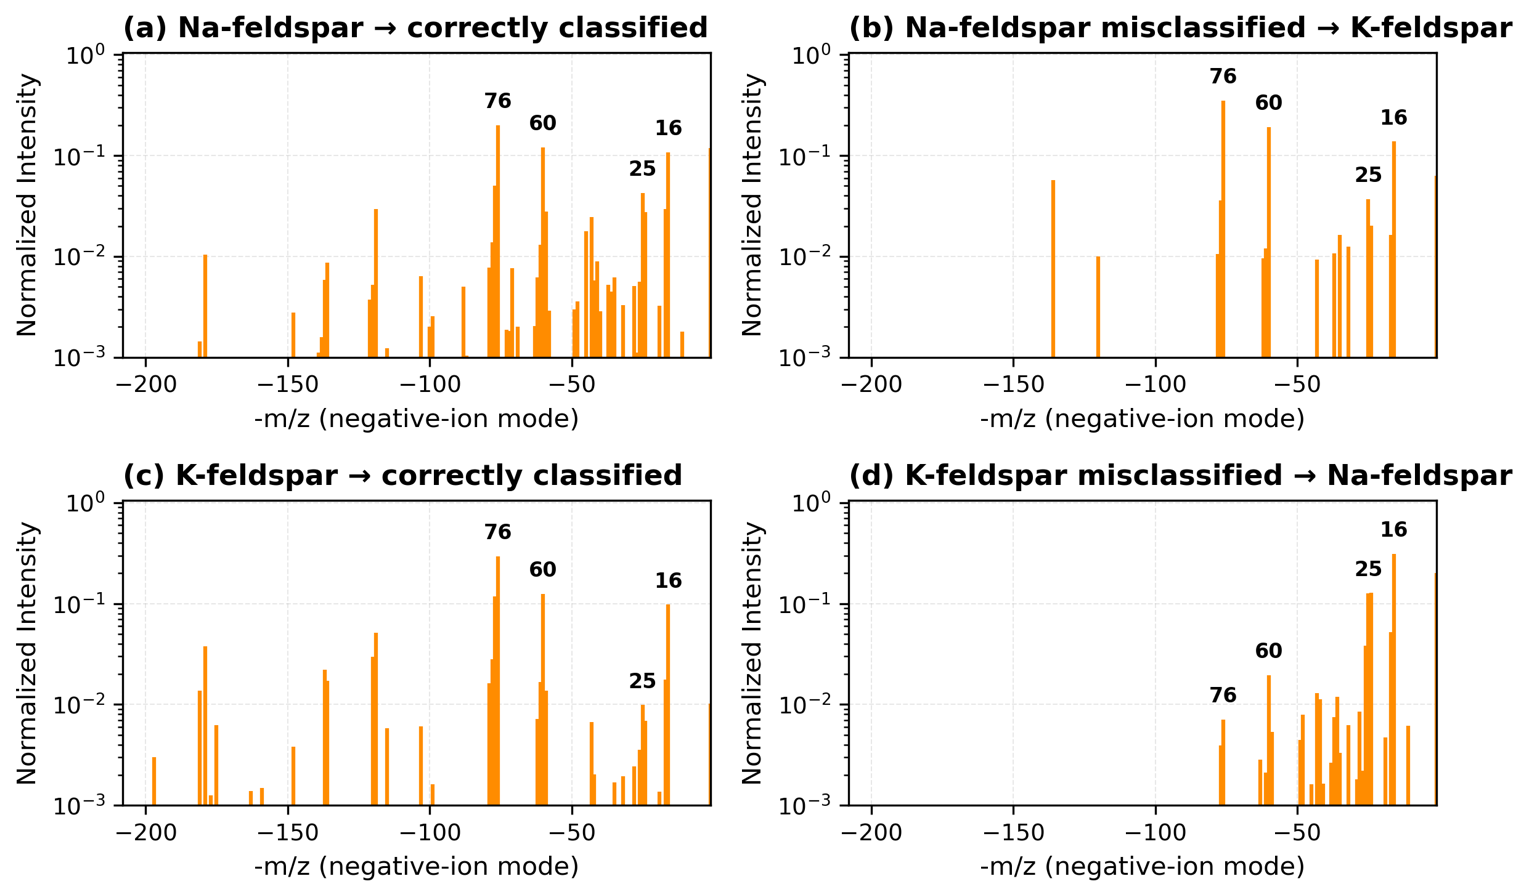
Figure A6Additional Na- and K-feldspar spectra illustrating characteristic misclassifications across independent model seeds and architectures. Each spectrum is normalized with influential ions (−16, −60, −25, and −76 ) annotated.
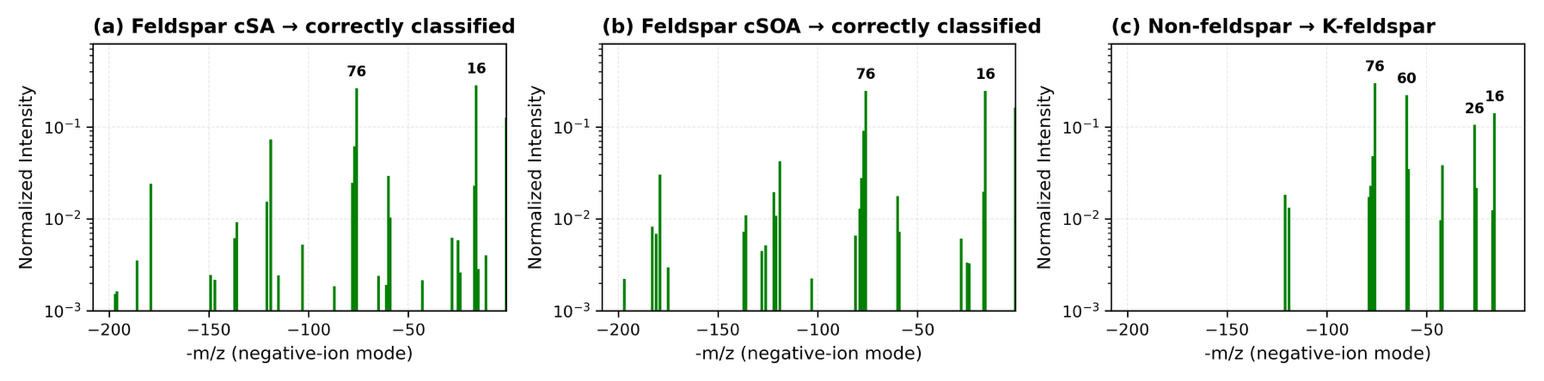
Figure A7Supplemental coated-feldspar (cSA, cSOA) and non-feldspar misclassification examples complementing. A slight difference between compositional features responsible for improved precision in coated feldspar identification is observed, while the final panel shows spectral overlap causing occasional non-feldspar → K-feldspar errors. For example, the missing 60 peak.
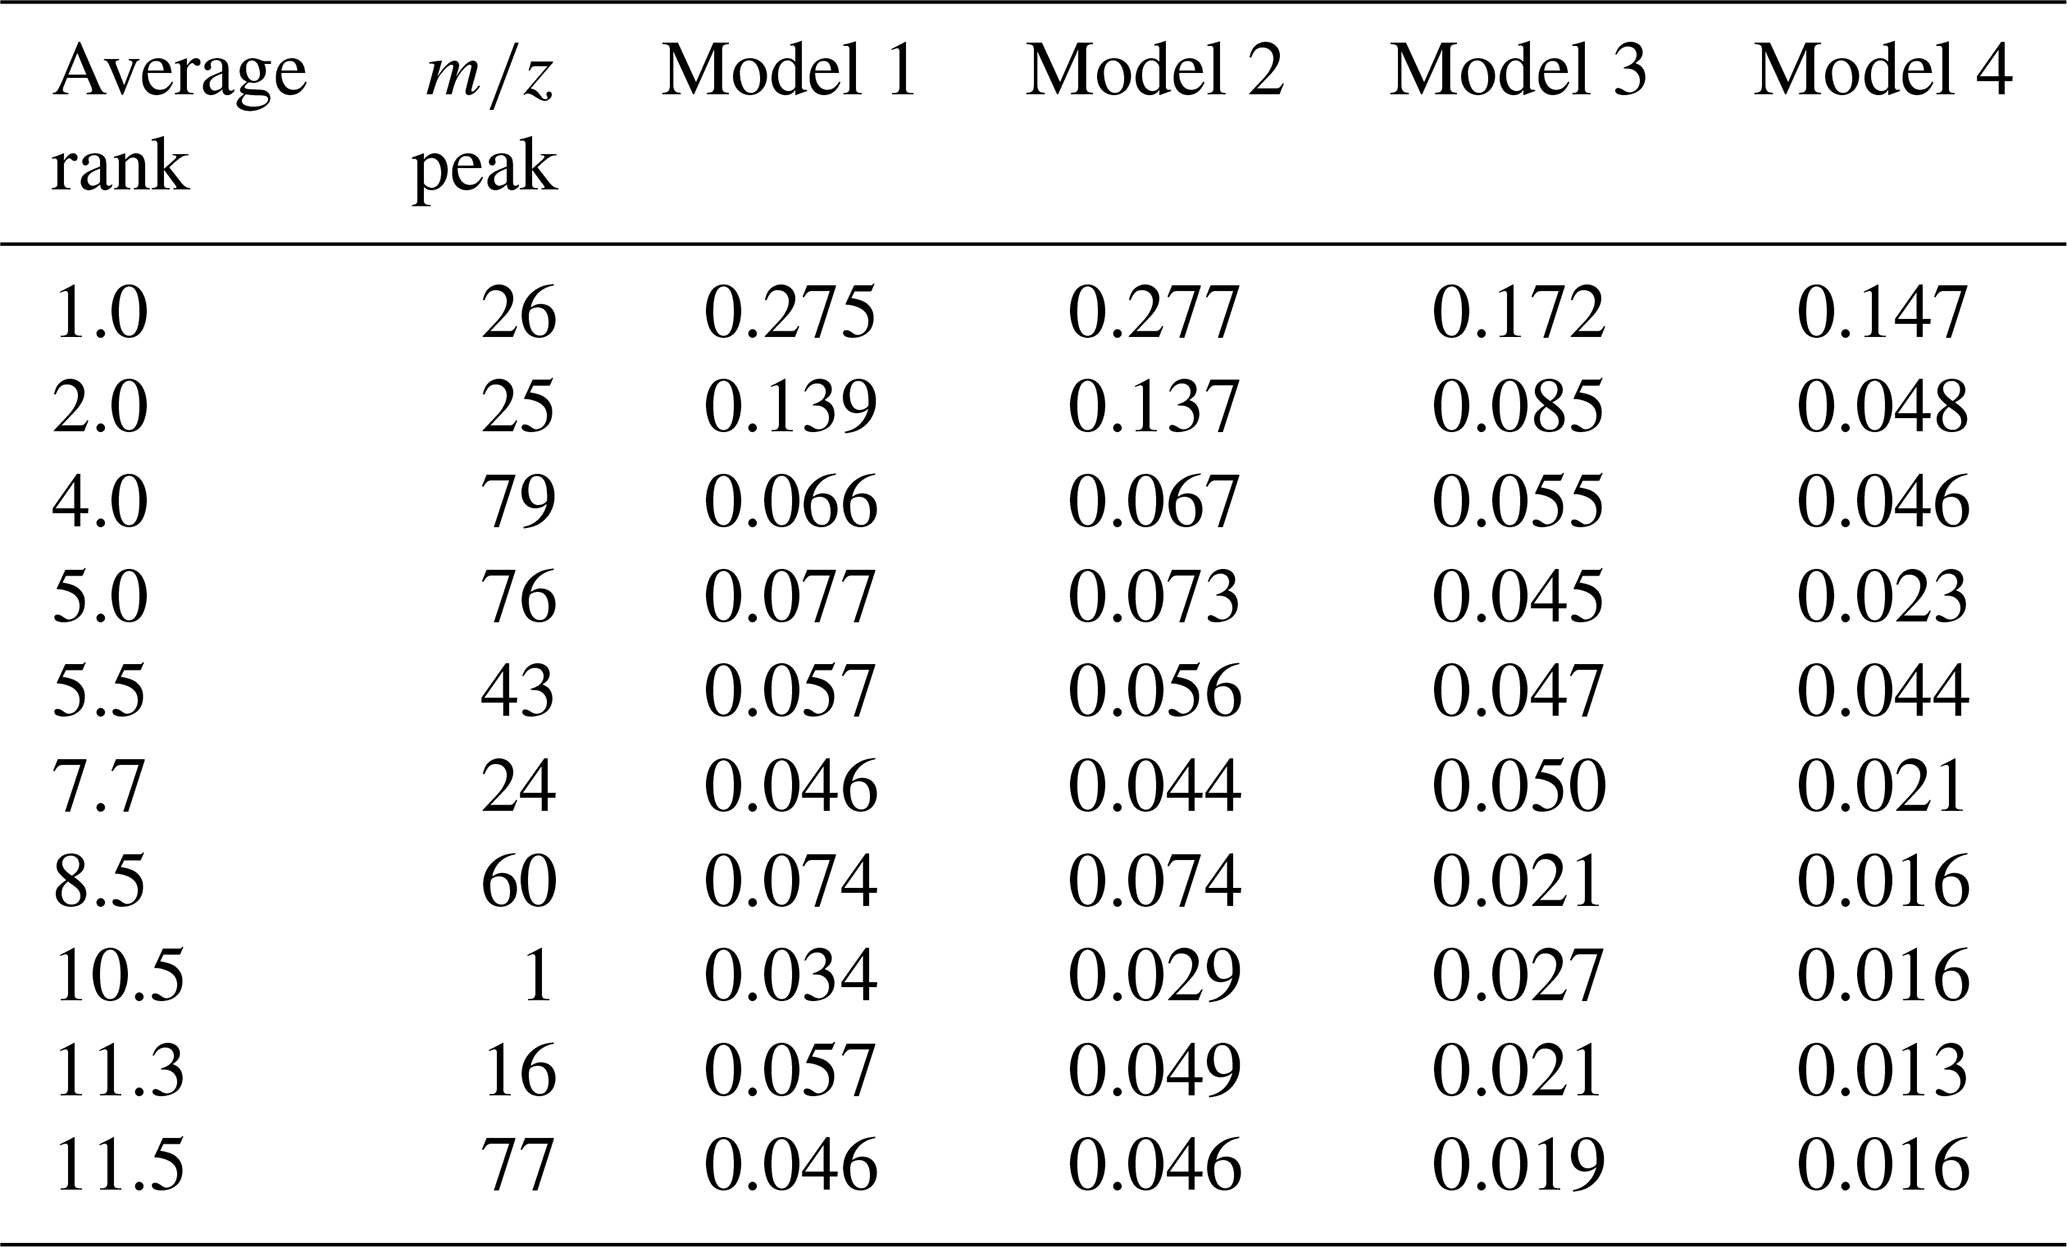
Table A4Top ten ions, ranked by their average rank across the four classification frameworks. Feature importance for each model was determined using permutation importance, via the drop in the macro-averaged F1 score when a single feature's values are randomly permuted. The reported importance values are the average of 10 independent repeats.
The negative labeled aerosol data set used to train the classifiers in this paper is available at Harvard Dataverse at https://doi.org/10.7910/DVN/J1FZYU (Christopoulos, 2018).
JAPC and MAZ conceptualized the study. JW facilitated the collaboration and provided overall project supervision. JAPC developed and implemented the machine learning framework for aerosol classification and conducted the primary data analyses. MAZ provided the unlabeled PALMS dataset, detailed experimental context, and domain expertise in particle chemistry, including identification of key spectral features and potential contaminants. CSB provided methodological oversight, including multilevel statistical interpretation, follow-up analyses, and integration of machine learning outputs within a hierarchical modeling framework. JAPC led manuscript preparation, with critical review, scientific guidance, and revisions provided by MAZ and CSB. All authors contributed to manuscript editing, interpretation of results, and final approval of the submitted version.
The contact author has declared that none of the authors has any competing interests.
Publisher's note: Copernicus Publications remains neutral with regard to jurisdictional claims made in the text, published maps, institutional affiliations, or any other geographical representation in this paper. The authors bear the ultimate responsibility for providing appropriate place names. Views expressed in the text are those of the authors and do not necessarily reflect the views of the publisher.
The authors would like to acknowledge the essential role of the PyTorch and Scikit-Learn Python libraries in the development and implementation of the machine learning models utilized in this study. The authors would like to thank the KIT AIDA facility staff for hosting the FIN01 workshop and Daniel Czizo for helpful comments on this article. We would like to thank anonymous reviewers for their constructive comments, which greatly improved the manuscript.
This research was supported by the Office of Biological and Environmental Research (BER) Atmospheric Research Program (ASR) in the Department of Energy, Office of Science, and through the U.S. Department of Energy Contract DE-SC0012704 to Brookhaven National Laboratory.
This paper was edited by Keding Lu and reviewed by two anonymous referees.
Anderson, B. J., Musicant, D. R., Ritz, A. M., Ault, A., Gross, D., Yuen, M., and Gälli, M.: User-Friendly Clustering for Atmospheric Data Analysis, Carleton College Computer Science Technical Report, Department of Computer Science at Brown University, 9 pp., https://cs.brown.edu/people/aritz/files/tech2005a.pdf (last access: 20 March 2026), 2005.
Andreae, M. O. and Rosenfeld, D.: Aerosol–cloud–precipitation interactions. Part 1. The nature and sources of cloud-active aerosols, Earth Sci. Rev., 89, 13–41, 2008.
Andreae, M. O., Rosenfeld, D., Artaxo, P., Costa, A. A., Frank, G. P., Longo, K. M., and Silva-Dias, M. A. F.: Smoking rain clouds over the Amazon, Science, 303, 1337–1342, 2004.
Ansel, J., Yang, E., He, H., Gimelshein, N., Jain, A., Voznesensky, M., Bao, B., Bell, P., Berard, D., Burovski, E., Chauhan, G., Chourdia, A., Constable, W., Desmaison, A., DeVito, Z., Ellison, E., Feng, W., Gong, J., Gschwind, M., Hirsh, B., Huang, S., Kalambarkar, K., Kirsch, L., Lazos, M., Lezcano, M., Liang, Y., Liang, J., Lu, Y., Luk, C. K., Maher, B., Pan, Y., Puhrsch, C., Reso, M., Saroufim, M., Siraichi, M. Y., Suk, H., Zhang, S., Suo, M., Tillet, P., Zhao, X., Wang, E., Zhou, K., Zou, R., Wang, X., Mathews, A., Wen, W., Chanan, G., Wu, P., and Chintala, S.: PyTorch 2: Faster machine learning through dynamic python bytecode transformation and graph compilation, in: ASPLOS '24: Proceedings of the 29th ACM International Conference on Architectural Support for Programming Languages and Operating Systems, La Jolla, CA, USA, 27 April–1 May 2024, Association for Computing Machinery (ACM), New York, NY, United States, 2, 929–947, https://doi.org/10.1145/3620665.3640366, 2024.
Arndt, J., Sciare, J., Mallet, M., Roberts, G. C., Marchand, N., Sartelet, K., Sellegri, K., Dulac, F., Healy, R. M., and Wenger, J. C.: Sources and mixing state of summertime background aerosol in the north-western Mediterranean basin, Atmos. Chem. Phys., 17, 6975–7001, https://doi.org/10.5194/acp-17-6975-2017, 2017.
Atkinson, J. D., Murray, B. J., Woodhouse, M. T., Whale, T. F., Baustian, K. J., Carslaw, K. S., Dobbie, S., O'Sullivan, D., and Malkin, T. L.: The importance of feldspar for ice nucleation by mineral dust in mixed-phase clouds, Nature, 498, 355–358, 2013.
Atwood, S. A., Kreidenweis, S. M., DeMott, P. J., Petters, M. D., Cornwell, G. C., Martin, A. C., and Moore, K. A.: Classification of aerosol population type and cloud condensation nuclei properties in a coastal California littoral environment using an unsupervised cluster model, Atmos. Chem. Phys., 19, 6931–6947, https://doi.org/10.5194/acp-19-6931-2019, 2019.
Ault, A. P. and Axson, J. L.: Atmospheric aerosol chemistry: Spectroscopic and microscopic advances, Anal. Chem., 89, 430–452, 2017.
Axson, J. L., May, N. W., Colón-Bernal, I. D., Pratt, K. A., and Ault, A. P.: Lake spray aerosol: A chemical signature from individual ambient particles, Environ. Sci. Technol., 50, 9835–9845, 2016.
Beck, A. G., Muhoberac, M., Randolph, C. E., Beveridge, C. H., Wijewardhane, P. R., Kenttämaa, H. I., and Chopra, G.: Recent developments in machine learning for mass spectrometry, ACS Meas. Sci. Au., 4, 233–246, 2024.
Bellouin, N., Boucher, O., Haywood, J., and Reddy, M. S.: Global estimate of aerosol direct radiative forcing from satellite measurements, Nature, 438, 1138–1141, 2005.
Bond, T. C., Doherty, S. J., Fahey, D. W., Forster, P. M., Berntsen, T., DeAngelo, B. J., Flanner, M. G., Ghan, S., Kärcher, B., Koch, D., Kinne, S., Kondo, Y., Quinn, P. K., Sarofim, M. C., Schultz, M. G., Schulz, M., Venkataraman, C., Zhang, H., Zhang, S., Bellouin, N., Guttikunda, S. K., Hopke, P. K., Jacobson, M. Z., Kaiser, J. W., Klimont, Z., Lohmann, U., Schwarz, J. P., Shindell, D., Storelvmo, T., Warren, S. G., and Zender, C. S.: Bounding the role of black carbon in the climate system: A scientific assessment: Black carbon in the climate system, J. Geophys. Res., 118, 5380–5552, 2013.
Boucher, O., Randall, D., Artaxo, P., Bretherton, C., Feingold, G., Forster, P., Kerminen, V., Kondo, Y., Liao, H., Lohmann, U., Rasch, P., Satheesh, S., Sherwood, S., Stevens, B., and Zhang, X. Y.: Clouds and Aerosols, in: Climate Change 2013 – The Physical Science Basis, vol. 5, edited by: Intergovernmental Panel on Climate Change, Cambridge University Press, Cambridge, 571–658, https://doi.org/10.1017/cbo9781107415324.016, 2014.
Casuccio, G. S., Janocko, P. B., Lee, R. J., Kelly, J. F., Dattner, S. L., and Mgebroff, J. S.: The use of computer controlled scanning electron microscopy in environmental studies, J. Air Pollut. Control Assoc., 33, 937–943, 1983.
Chen, Y., Liu, H., Huang, R.-J., Yang, F., Tian, M., Yao, X., Shen, Z., Yan, L., and Cao, J.: Atmospheric processing of loess particles in a polluted urban area of northwestern China, J. Geophys. Res., 124, 7919–7929, 2019.
Christopoulos, C.: A Machine Learning Approach to Aerosol Classification for Single Particle Mass Spectrometry, V1, Harvard Dataverse [data set], https://doi.org/10.7910/DVN/J1FZYU, 2018.
Christopoulos, C. D., Garimella, S., Zawadowicz, M. A., Möhler, O., and Cziczo, D. J.: A machine learning approach to aerosol classification for single-particle mass spectrometry, Atmos. Meas. Tech., 11, 5687–5699, https://doi.org/10.5194/amt-11-5687-2018, 2018.
Cortes, C. and Vapnik, V.: Support-vector networks, Mach. Learn., 20, 273–297, 1995.
Cziczo, D. J., Murphy, D. M., Hudson, P. K., and Thomson, D. S.: Single particle measurements of the chemical composition of cirrus ice residue during Crystal-face: Chemical composition of ice residue, J. Geophys. Res., 109, https://doi.org/10.1029/2003JD004032, 2004.
Cziczo, D. J., Thomson, D. S., Thompson, T. L., DeMott, P. J., and Murphy, D. M.: Particle analysis by laser mass spectrometry (PALMS) studies of ice nuclei and other low number density particles, Int. J. Mass Spectrom., 258, 21–29, 2006.
DeMott, P. J., Prenni, A. J., Liu, X., Kreidenweis, S. M., Petters, M. D., Twohy, C. H., Richardson, M. S., Eidhammer, T., and Rogers, D. C.: Predicting global atmospheric ice nuclei distributions and their impacts on climate, P. Natl. Acad. Sci. USA, 107, 11217–11222, 2010.
DeMott, P. J., Hill, T. C. J., McCluskey, C. S., Prather, K. A., Collins, D. B., Sullivan, R. C., Ruppel, M. J., Mason, R. H., Irish, V. E., Lee, T., Hwang, C. Y., Rhee, T. S., Snider, J. R., McMeeking, G. R., Dhaniyala, S., Lewis, E. R., Wentzell, J. J. B., Abbatt, J., Lee, C., Sultana, C. M., Ault, A. P., Axson, J. L., Diaz Martinez, M., Venero, I., Santos-Figueroa, G., Stokes, M. D., Deane, G. B., Mayol-Bracero, O. L., Grassian, V. H., Bertram, T. H., Bertram, A. K., Moffett, B. F., and Franc, G. D.: Sea spray aerosol as a unique source of ice nucleating particles, P. Natl. Acad. Sci. USA, 113, 5797–5803, 2016.
Farmer, D. K., Cappa, C. D., and Kreidenweis, S. M.: Atmospheric processes and their controlling influence on cloud condensation nuclei activity, Chem. Rev., 115, 4199–4217, 2015.
Freutel, F., Drewnick, F., Schneider, J., Klimach, T., and Borrmann, S.: Quantitative single-particle analysis with the Aerodyne aerosol mass spectrometer: development of a new classification algorithm and its application to field data, Atmos. Meas. Tech., 6, 3131–3145, https://doi.org/10.5194/amt-6-3131-2013, 2013.
Froyd, K. D., Murphy, D. M., Brock, C. A., Campuzano-Jost, P., Dibb, J. E., Jimenez, J.-L., Kupc, A., Middlebrook, A. M., Schill, G. P., Thornhill, K. L., Williamson, C. J., Wilson, J. C., and Ziemba, L. D.: A new method to quantify mineral dust and other aerosol species from aircraft platforms using single-particle mass spectrometry, Atmos. Meas. Tech., 12, 6209–6239, https://doi.org/10.5194/amt-12-6209-2019, 2019.
Fuller, R., Landrigan, P. J., Balakrishnan, K., Bathan, G., Bose-O'Reilly, S., Brauer, M., Caravanos, J., Chiles, T., Cohen, A., Corra, L., Cropper, M., Ferraro, G., Hanna, J., Hanrahan, D., Hu, H., Hunter, D., Janata, G., Kupka, R., Lanphear, B., Lichtveld, M., Martin, K., Mustapha, A., Sanchez-Triana, E., Sandilya, K., Schaefli, L., Shaw, J., Seddon, J., Suk, W., Téllez-Rojo, M. M., and Yan, C.: Pollution and health: a progress update, Lancet Planet. Health, 6, e535–e547, 2022.
Gard, E., Mayer, J. E., Morrical, B. D., Dienes, T., Fergenson, D. P., and Prather, K. A.: Real-time analysis of individual atmospheric aerosol particles: Design and performance of a portable ATOFMS, Anal. Chem., 69, 4083–4091, 1997.
Gong, X., Wex, H., Müller, T., Henning, S., Voigtländer, J., Wiedensohler, A., and Stratmann, F.: Understanding aerosol microphysical properties from 10 years of data collected at Cabo Verde based on an unsupervised machine learning classification, Atmos. Chem. Phys., 22, 5175–5194, https://doi.org/10.5194/acp-22-5175-2022, 2022.
Gross, D. S., Robert Atlas, Rzeszotarski, J., Turetsky, E., Christensen, J., Benzaid, S., Olson, J., Smith, T., Steinberg, L., and Sulman, J.: Environmental chemistry through intelligent atmospheric data analysis, Environ. Modell. Softw., 25, 760–769, 2010.
Hinz, K.-P., Kaufmann, R., and Spengler, B.: Laser-induced mass analysis of single particles in the airborne state, Anal. Chem., 66, 2071–2076, 1994.
Kanji, Z. A., Ladino, L. A., Wex, H., Boose, Y., Burkert-Kohn, M., Cziczo, D. J., and Krämer, M.: Overview of ice nucleating particles, Meteorol. Monogr., 58, 1.1–1.33, 2017.
Kim, D. S., Hopke, P. K., Massart, D. L., Kaufman, L., and Casuccio, G. S.: Multivariate analysis of CCSEM auto emission data, Sci. Total Environ., 59, 141–155, 1987.
Lamb, K. D.: Classification of iron oxide aerosols by a single particle soot photometer using supervised machine learning, Atmos. Meas. Tech., 12, 3885–3906, https://doi.org/10.5194/amt-12-3885-2019, 2019.
Li, L., Huang, Z., Dong, J., Li, M., Gao, W., Nian, H., Fu, Z., Zhang, G., Bi, X., Cheng, P., and Zhou, Z.: Real time bipolar time-of-flight mass spectrometer for analyzing single aerosol particles, Int. J. Mass Spectrom., 303, 118–124, 2011.
Liu, L., Jiang, H., He, P., Chen, W., Liu, X., Gao, J., and Han, J.: On the variance of the adaptive learning rate and beyond, arXiv [preprint], https://doi.org/10.48550/arXiv.1908.03265, 2019.
Lohmann, U. and Feichter, J.: Global indirect aerosol effects: a review, Atmos. Chem. Phys., 5, 715–737, https://doi.org/10.5194/acp-5-715-2005, 2005.
Loshchilov, I. and Hutter, F.: Decoupled weight decay regularization, arXiv [preprint], https://doi.org/10.48550/arXiv.1711.05101, 2017.
McKeown, P. J., Johnston, M. V., and Murphy, D. M.: On-line single-particle analysis by laser desorption mass spectrometry, Anal. Chem., 63, 2069–2073, 1991.
McNamara, S. M., Kolesar, K. R., Wang, S., Kirpes, R. M., May, N. W., Gunsch, M. J., Cook, R. D., Fuentes, J. D., Hornbrook, R. S., Apel, E. C., China, S., Laskin, A., and Pratt, K. A.: Observation of road salt aerosol driving inland wintertime atmospheric chlorine chemistry, ACS Cent. Sci., 6, 684–694, 2020.
Moffet, R. C. and Prather, K. A.: Extending ATOFMS measurements to include refractive index and density, Anal. Chem., 77, 6535–6541, 2005.
Moffet, R. C. and Prather, K. A.: In-situ measurements of the mixing state and optical properties of soot with implications for radiative forcing estimates, P. Natl. Acad. Sci. USA, 106, 11872–11877, 2009.
Murphy, D. M.: The design of single particle laser mass spectrometers, Mass Spectrom. Rev., 26, 150–165, 2007.
Murphy, D. M. and Thomson, D. S.: Chemical composition of single aerosol particles at Idaho Hill: Negative ion measurements, J. Geophys. Res., 102, 6353–6368, 1997.
Myhre, G., Shindell, D., Bréon, F.-M., Collins, W., Fuglestvedt, J., Huang, J., Koch, D., Lamarque, J.-F., Lee, D., Mendoza, B., Nakajima, T., Robock, A., Stephens, G., Takemura, T., and Zhang, H.: Anthropogenic and Natural Radiative Forcing, in: Climate Change 2013 – The Physical Science Basis, edited by: Intergovernmental Panel on Climate Change, Cambridge University Press, Cambridge, 659–740, https://doi.org/10.1017/cbo9781107415324.018, 2014.
Noble, C. A. and Prather, K. A.: Real-time measurement of correlated size and composition profiles of individual atmospheric aerosol particles, Environ. Sci. Technol., 30, 2667–2680, 1996.
Pedregosa, F., Varoquaux, G., Gramfort, A., Michel, V., Thirion, B., Grisel, O., Blondel, M., Prettenhofer, P., Weiss, R., Dubourg, V., Vanderplas, J., Passos, A., Cournapeau, D., Brucher, M., Perrot, M., and Duchesnay, E.: Scikit-learn: Machine Learning in Python, J. Mach. Learn. Res., 12, 2825–2830, 2011.
Phares, D. J., Rhoads, K. P., Wexler, A. S., Kane, D. B., and Johnston, M. V.: Application of the ART-2a algorithm to laser ablation aerosol mass spectrometry of particle standards, Anal. Chem., 73, 2338–2344, 2001.
Phares, D. J., Rhoads, K. P., Johnston, M. V., and Wexler, A. S.: Size-resolved ultrafine particle composition analysis 2, Houston, J. Geophys. Res., 108, https://doi.org/10.1029/2001JD001212, 2003.
Pope III, C. A. and Dockery, D. W.: Health effects of fine particulate air pollution: lines that connect, J. Air Waste Manag. Assoc., 56, 709–742, 2006.
Prather, K. A., Nordmeyer, T., and Salt, K.: Real-time characterization of individual aerosol particles using time-of-flight mass spectrometry, Anal. Chem., 66, 1403–1407, 1994.
Prather, K. A., Hatch, C. D., and Grassian, V. H.: Analysis of atmospheric aerosols, Annu. Rev. Anal. Chem., 1, 485–514, 2008.
Pratt, K. A., Mayer, J. E., Holecek, J. C., Moffet, R. C., Sanchez, R. O., Rebotier, T. P., Furutani, H., Gonin, M., Fuhrer, K., Su, Y., Guazzotti, S., and Prather, K. A.: Development and characterization of an aircraft aerosol time-of-flight mass spectrometer, Anal. Chem., 81, 1792–1800, 2009.
Qin, X., Pratt, K. A., Shields, L. G., Toner, S. M., and Prather, K. A.: Seasonal comparisons of single-particle chemical mixing state in Riverside, CA, Atmos. Environ., 59, 587–596, 2012.
Ravishankara, A. R., Rudich, Y., and Wuebbles, D. J.: Physical chemistry of climate metrics, Chem. Rev., 115, 3682–3703, 2015.
Riemer, N., Ault, A. P., West, M., Craig, R. L., and Curtis, J. H.: Aerosol mixing state: Measurements, modeling, and impacts, Rev. Geophys., 57, 187–249, 2019.
Seinfeld, J. H. and Pandis, S. N.: Atmospheric chemistry and physics, 3rd edn., Wiley-Blackwell, Hoboken, NJ, 1152 pp., https://doi.org/10.1029/2018rg000615, 2016.
Shen, X., Saathoff, H., Huang, W., Mohr, C., Ramisetty, R., and Leisner, T.: Understanding atmospheric aerosol particles with improved particle identification and quantification by single-particle mass spectrometry, Atmos. Meas. Tech., 12, 2219–2240, https://doi.org/10.5194/amt-12-2219-2019, 2019.
Shen, X., Bell, D. M., Coe, H., Hiranuma, N., Mahrt, F., Marsden, N. A., Mohr, C., Murphy, D. M., Saathoff, H., Schneider, J., Wilson, J., Zawadowicz, M. A., Zelenyuk, A., DeMott, P. J., Möhler, O., and Cziczo, D. J.: Measurement report: The Fifth International Workshop on Ice Nucleation phase 1 (FIN-01): intercomparison of single-particle mass spectrometers, Atmos. Chem. Phys., 24, 10869–10891, https://doi.org/10.5194/acp-24-10869-2024, 2024.
Silva, P. J., Liu, D.-Y., Noble, C. A., and Prather, K. A.: Size and chemical characterization of individual particles resulting from biomass burning of local southern California species, Environ. Sci. Technol., 33, 3068–3076, 1999.
Song, X.-H., Hopke, P. K., Fergenson, D. P., and Prather, K. A.: Classification of single particles analyzed by ATOFMS using an artificial neural network, ART-2A, Anal. Chem., 71, 860–865, 1999.
Su, Y., Sipin, M. F., Furutani, H., and Prather, K. A.: Development and characterization of an aerosol time-of-flight mass spectrometer with increased detection efficiency, Anal. Chem., 76, 712–719, 2004.
Tarvainen, A. and Valpola, H.: Mean teachers are better role models: Weight-averaged consistency targets improve semi-supervised deep learning results, Neural Inf. Process. Syst., 30, 1195–1204, 2017.
Usher, C. R., Michel, A. E., and Grassian, V. H.: Reactions on mineral dust, Chem. Rev., 103, 4883–4940, 2003.
Wang, G., Ruser, H., Schade, J., Passig, J., Adam, T., Dollinger, G., and Zimmermann, R.: 1D-CNN network based real-time aerosol particle classification with single-particle mass spectrometry, IEEE Sens. Lett., 7, 1–4, 2023.
Wang, G., Ruser, H., Schade, J., Passig, J., Zimmermann, R., Dollinger, G., and Adam, T.: A fuzzy convolutional neural network for the classification of aerosol particle mass spectral patterns generated by single-particle mass spectrometry, in: 2024 International Joint Conference on Neural Networks (IJCNN), Yokohama, Japan, 30 June–5 July 2024, 1–8, https://doi.org/10.1109/ijcnn60899.2024.10650883, 2024a.
Wang, G., Ruser, H., Schade, J., Passig, J., Zimmermann, R., Dollinger, G., and Adam, T.: CNN-based aerosol particle classification using 2D representations of single-particle mass spectrometer data, in: 2024 International Conference on Artificial Intelligence in Information and Communication (ICAIIC), Osaka, Japan, 19–22 February 2024, 1–6, https://doi.org/10.1109/icaiic60209.2024.10463253, 2024b.
Wang, G., Ruser, H., Schade, J., Passig, J., Adam, T., Dollinger, G., and Zimmermann, R.: Machine learning approaches for automatic classification of single-particle mass spectrometry data, Atmos. Meas. Tech., 17, 299–313, https://doi.org/10.5194/amt-17-299-2024, 2024c.
Wang, G., Ruser, H., Schade, J., Passig, J., Zimmermann, R., Dollinger, G., and Adam, T.: Rapid classification of aerosol particle mass spectra using data augmentation and deep learning, in: 2024 IEEE Conference on Artificial Intelligence (CAI), Singapore, Singapore, 25–27 June 2024, 1167–1172, https://doi.org/10.1109/cai59869.2024.00208, 2024d.
Wang, S., He, B., Yuan, M., Su, F., Yin, S., Yan, Q., Jiang, N., Zhang, R., and Tang, X.: Characterization of individual particles and meteorological conditions during the cold season in Zhengzhou using a single particle aerosol mass spectrometer, Atmos. Res., 219, 13–23, 2019.
Wolf, M. J., Zhang, Y., Zawadowicz, M. A., Goodell, M., Froyd, K., Freney, E., Sellegri, K., Rösch, M., Cui, T., Winter, M., Lacher, L., Axisa, D., DeMott, P. J., Levin, E. J. T., Gute, E., Abbatt, J., Koss, A., Kroll, J. H., Surratt, J. D., and Cziczo, D. J.: A biogenic secondary organic aerosol source of cirrus ice nucleating particles, Nat. Commun., 11, 4834, https://doi.org/10.1038/s41467-020-18424-6, 2020.
Xu, J., Wang, H., Li, X., Li, Y., Wen, J., Zhang, J., Shi, X., Li, M., Wang, W., Shi, G., and Feng, Y.: Refined source apportionment of coal combustion sources by using single particle mass spectrometry, Sci. Total Environ., 627, 633–646, 2018.
Yarowsky, D.: Unsupervised word sense disambiguation rivaling supervised methods, in: Proceedings of the 33rd annual meeting on Association for Computational Linguistics, Cambridge, Massachusetts, 26–30 June 1995, https://doi.org/10.3115/981658.981684, 1995.
Zawadowicz, M. A., Froyd, K. D., Murphy, D. M., and Cziczo, D. J.: Improved identification of primary biological aerosol particles using single-particle mass spectrometry, Atmos. Chem. Phys., 17, 7193–7212, https://doi.org/10.5194/acp-17-7193-2017, 2017.
Zawadowicz, M. A., Lance, S., Jayne, J. T., Croteau, P., Worsnop, D. R., Mahrt, F., Leisner, T., and Cziczo, D. J.: Quantifying and improving the optical performance of the laser ablation aerosol particle time of flight mass spectrometer (LAAPToF) instrument, Aerosol Sci. Tech., 54, 761–771, 2020.
Zelenyuk, A., Imre, D., Nam, E. J., Han, Y., and Mueller, K.: ClusterSculptor: Software for expert-steered classification of single particle mass spectra, Int. J. Mass Spectrom., 275, 1–10, 2008.
Zhang, G., Han, B., Bi, X., Dai, S., Huang, W., Chen, D., Wang, X., Sheng, G., Fu, J., and Zhou, Z.: Characteristics of individual particles in the atmosphere of Guangzhou by single particle mass spectrometry, Atmos. Res., 153, 286–295, 2015.
Zhou, Z.-H.: Semi-supervised learning, in: Machine Learning, Springer Singapore, Singapore, 315–341, https://doi.org/10.1007/978-981-15-1967-3_13, 2021.