the Creative Commons Attribution 4.0 License.
the Creative Commons Attribution 4.0 License.
 | 22 May 2026
Detection of embedded contrails in airborne lidar measurements
Mahshad Soleimanpour
Torsten Seelig
Silke Groß
Matthias Tesche
Aviation affects the Earth's energy balance through CO2 and non-CO2 emissions. Contrails mark one of the latter and can occur inside the cirrus clouds where they might affect the clouds' optical and microphysical characteristics as well as their climate impact. In this study, airborne lidar observations with the German research aircraft HALO during the ML-CIRRUS and CIRRUS-HL campaigns are used together with aircraft-location data to detect the occurrence of contrails that have formed within already existing cirrus clouds. Based on manual analysis, we developed (based on ML-CIRRUS) and verified (based on CIRRUS-HL) an automated two-step method for detecting embedded contrails in lidar measurements. In the first, threshold-based step, potential embedded contrail regions are identified by particle backscatter coefficients larger than 4 Mm−1 sr−1 and particle linear depolarization ratios smaller than 30 % or 43 % depending on the impact of pollution on the background cloud. The second step assesses the area of the identified objects in a lidar curtain for finding cases that could realistically be associated with an aircraft-related perturbation. Specifically, areas smaller than 10 pixels are dismissed as noisy data, while areas larger than 50 pixels are too homogeneous to be in line with the assumptions of the manual analysis that cloud regions that are perturbed by the passage of an aircraft occur in close vicinity to unperturbed cloud areas. The resulting contrail mask enables the detection and quantification of the occurrence rate of embedded contrails in airborne lidar measurements without the need for auxiliary air-traffic information.
- Article
(7417 KB) - Full-text XML
- BibTeX
- EndNote


The aviation sector has been growing steadily for decades despite minor setbacks related to financial crises and the COVID-19 pandemic. This intensifies its multifaceted effect on the earth's atmosphere and motivates the recent upturn in research on the climate impact on aviation (Lee et al., 2009, 2021). Apart from the direct emission of carbon dioxide (CO2), whose impact is rather straightforward to assess, aviation is connected to a number of non-CO2 effects that are much harder to quantify. One of the most prominent non-CO2 effects is the formation of condensation trails (contrails) behind aircraft that might subsequently spread to become long-living contrail-induced cirrus clouds (contrail-cirrus). The occurrence of contrails and contrail cirrus has been quantified based on passive remote sensing from space (Minnis et al., 1999, 2013; Duda et al., 2013, 2019). Their radiative impact has been assessed either by treating them as a separate cloud class in global climate models (Burkhardt and Kärcher, 2011; Gettelman and Chen, 2013; Bock and Burkhardt, 2019) or by coupling simulations of contrail cirrus with reanalysis data (Schumann and Graf, 2013). Contrails and contrail cirrus exert a mostly positive effect on climate (net warming) that is dominated by the trapping of long-wave terrestrial radiation that is balanced by reflected incoming short-wave radiation only during daytime (Boucher, 1999; Schumann, 2005; Kärcher, 2017; Bock and Burkhardt, 2019). The most recent assessment of the climate impact of aviation concludes that contrails are responsible for about half of the effective radiative forcing (ERF) of aviation, with a contribution of 57.4 mW m−2 to the overall radiative effect (Lee et al., 2021).
Airborne in-situ measurements show that the conditions for the existence of climate-impactful long-lived contrails are most often fulfilled for regions already covered with cirrus clouds (Petzold et al., 2025). However, contrails that form in already existing cirrus clouds – also referred to as embedded contrails (Gierens, 2012) – are still almost unstudied and currently not considered in climate assessments of aviation. This is because the quantification of the impact of embedded contrails on existing cirrus clouds requires measurement techniques such as lidar or radar, which are capable of penetrating the clouds for observations at and slightly below the flight level of a passing aircraft. Tesche et al. (2016) have combined position data of commercial aircraft with spaceborne lidar observations (Winker et al., 2009) to find an increase in cloud optical thickness (COT) for cloud regions that had been perturbed by the passage of an aircraft. Marjani et al. (2022) then used a combination of spaceborne lidar and radar observations to confirm that those regions also show an increase in ice-crystal number concentration. Both findings are in line with the hypothesis that embedded contrails are essentially contrails overlaid on an existing background cloud (Gierens, 2012). The observational findings of Tesche et al. (2016) and Marjani et al. (2022) could also be reproduced by dedicated modeling studies (Verma and Burkhardt, 2022; Marjani et al., 2025). Finally, the most comprehensible assessment of embedded contrails today quantifies their local warming effect to be on the order of 50 mW m−2 (Seelig et al., 2025).
Compared to satellite observations, data collected with state-of-the-art lidar and radar instruments deployed on a high-flying research aircraft offer (i) significantly improved signal-to-noise ratio and data quality, (ii) higher spatio-temporal resolution, and (iii) a (potentially) larger number of measured parameters. Airborne remote-sensing observations therefore allow for an in-depth quantification of the impact of embedded contrails on existing cirrus clouds – including an assessment of what amount of disturbance is actually observable with different spaceborne sensors. Here, we use airborne remote-sensing observations conducted during two campaigns with the German research aircraft HALO (see https://halo-research.de/, last access: 19 May 2026) in combination with commercially available aircraft-position data to (i) develop a method for identifying embedded contrails in optical observations, (ii) verify that method, and (iii) quantify the occurrence of embedded contrails. The paper starts with a description of the data and methods in Sect. 2. Results are presented and discussed in Sect. 3. The work ends with a summary and conclusions in Sect. 4.
2.1 HALO campaigns with focus on cirrus
Remote-sensing observations with instruments aboard the High Altitude and Long Range Research Aircraft (HALO) are used for this study. Airborne lidar observations have been performed during the Mid-latitude Cirrus experiment (ML-CIRRUS, March and April 2014; Voigt et al., 2017) and the Cirrus at High Latitudes experiment (CIRRUS-HL, June and July 2021; Jurkat-Witschas et al., 2025). Those experiments focused on investigating the microphysical, optical, and radiative properties of cirrus clouds and contrail cirrus, with flight planning supported by simulations with the contrail cirrus prediction model CoCiP (Schumann, 2012; Schumann and Graf, 2013). Naturally, these observations feature a high likelihood of serendipitous observations of embedded contrails. Details of the research flights conducted during ML-CIRRUS and CIRRUS-HL can be found in Voigt et al. (2017, Table 3) and Jurkat-Witschas et al. (2025, Table 1), respectively.
2.2 WALES lidar data
The WAter vapor Lidar Experiment in Space (WALES) instrument (Wirth et al., 2009) combines the differential absorption lidar (DIAL) technique for water vapor profiling with the high spectral resolution lidar (HSRL) technique for aerosol profiling. It provides height-resolved aerosol observations in the form of the backscatter coefficient (β) at 532 and 1064 nm, the extinction coefficient (α) at 532 nm, and the particle linear depolarization ratio (PLDR, δ) at 532 nm (Esselborn et al., 2008). Data are collected with an integration time of 0.2 s and a vertical resolution of 15 m. The detection limit is approximately at a backscatter ratio of R = 1.01 at 2 km distance below the aircraft under typical daytime atmospheric conditions and increases to R = 1.05 at 10 km distance. The calibration uncertainty is in the range of about 1 % to 5 % depending on the background aerosol load. COT can be retrieved in the range from 0.01 to about 2. The depolarization channel is in-flight calibrated following Freudenthaler et al. (2009). The calibration uncertainty is estimated to be about 2 % to 5 %. All parameters are provided with a vertical resolution of 15 m and a horizontal resolution of 40 to 200 m depending on the type of along-track averaging. WALES measurements have already been used for studies of natural cirrus and cirrus affected by aviation (Groß et al., 2014; Urbanek et al., 2018).
Figure 1 presents the locations of WALES measurements obtained during the ML-CIRRUS and CIRRUS-HL campaigns. Detailed information on the corresponding segments is summarized in Tables A1 and B1, respectively.
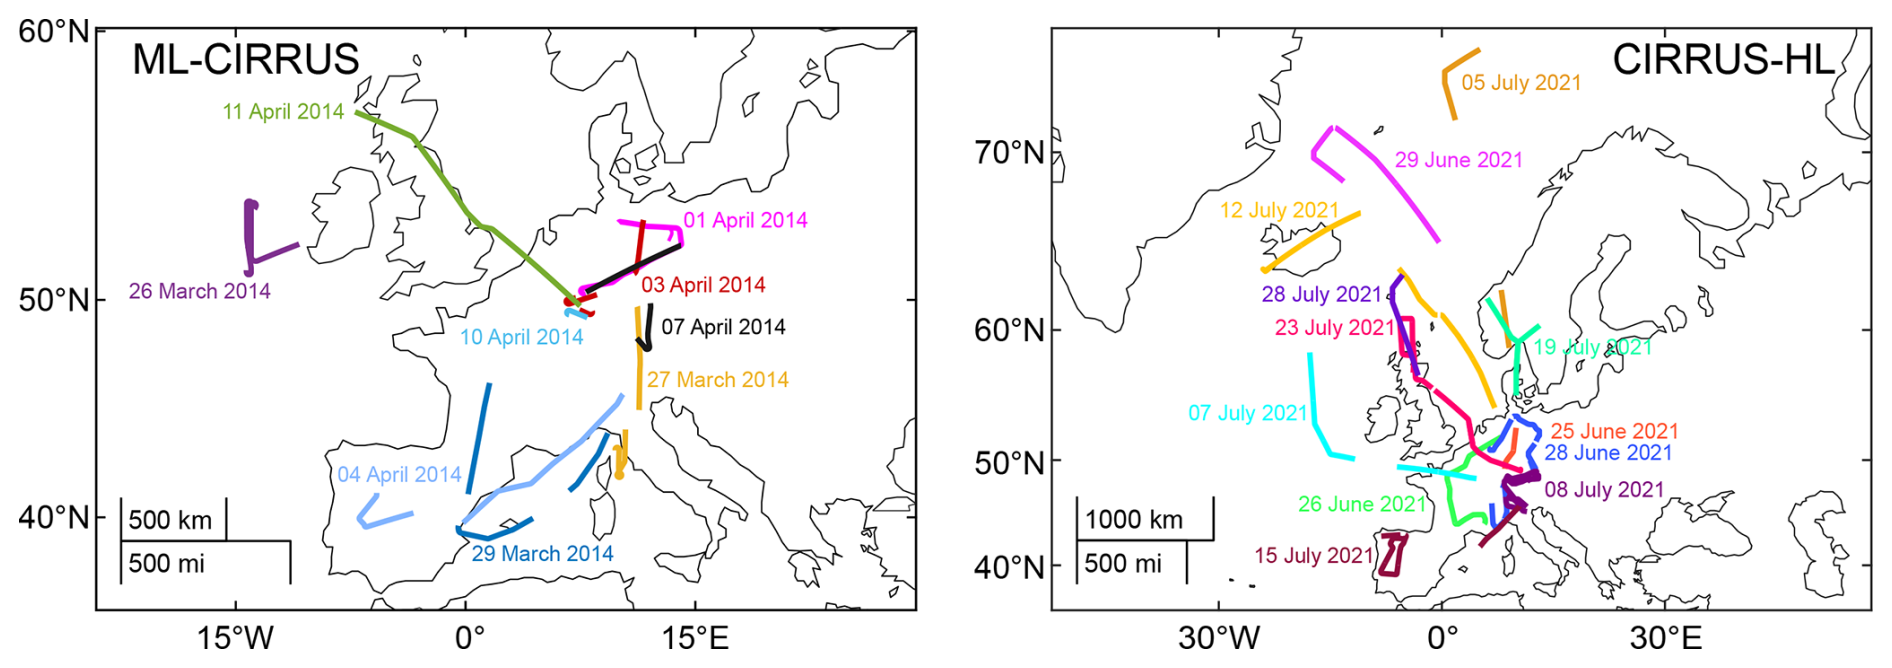
Figure 1Segments of HALO flight paths with WALES lidar measurements during ML-CIRRUS in March and April 2014 (left) and during CIRRUS-HL in June and July 2021 (right) with colors referring to different days.
The WALES lidar observations of cirrus clouds during ML-CIRRUS have revealed two modes with respect to the median δ of the targeted clouds (Urbanek et al., 2018). Clouds with an air-mass history relating to pristine background conditions were found to show lower values of δ than clouds that could be traced back to originating from more polluted regions. This is reflected in Fig. 2 by two modes of accumulation of δ at 43 % (low PLDR) and 49 % (high PLDR), respectively. This cloud-history dependent difference in cloud optical properties needs to be considered in a threshold-based approach for identifying embedded contrails as outlined below. Tables A1 and B1 thus include a case-based classification according to high and low PLDR conditions (Urbanek et al., 2018).
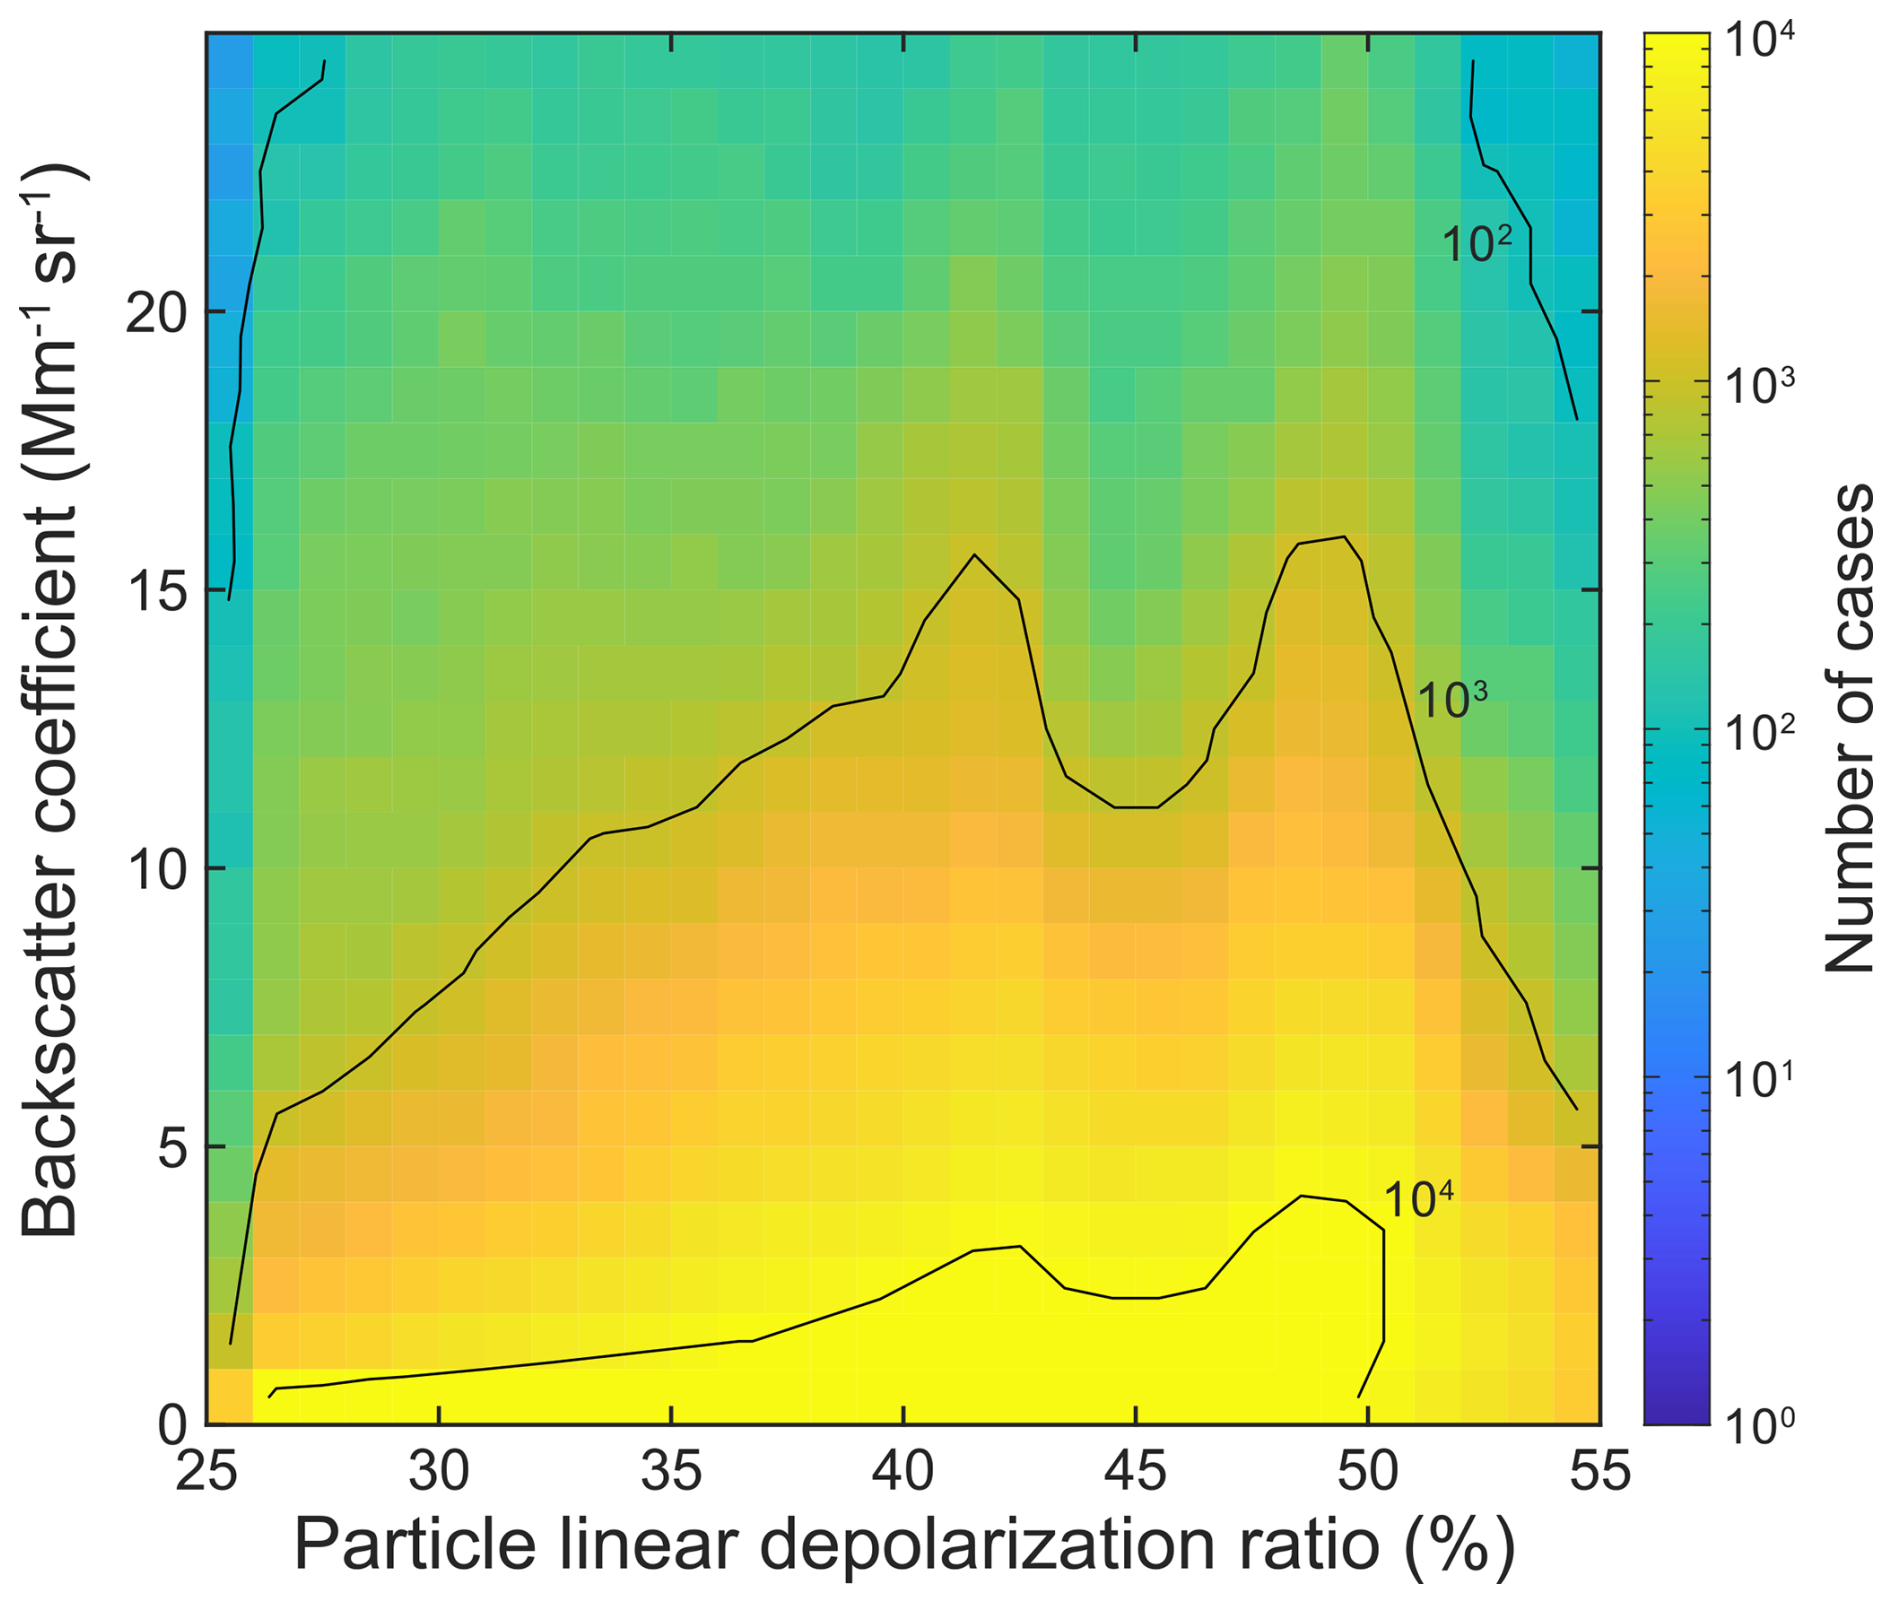
Figure 22d histogram of particle backscatter coefficient (β) and particle linear depolarization ratio (δ) for the WALES cirrus observations during ML-CIRRUS.
2.3 ECMWF ERA5 reanalysis data
Meteorological profiles from the European Centre for Medium-range Weather Forecast (ECMWF) ERA5 reanalysis (Hersbach et al., 2020) are used in the analysis of the WALES lidar measurements. The hourly data provides a spatial resolution of 0.25° × 0.25° on 37 pressure levels between 1000 and 1 hPa. In this study, we use the zonal (U) and meridional (V) wind components to calculate wind speed and wind direction at intersection points of HALO and commercial flights at typical flight altitudes between 200 and 300 hPa. We consider an averaging period of 2 h in line with the time frame used for aircraft position matching. Wind speed and direction at the intercept of tracks from HALO and commercial aircraft are then combined with speed and heading of both aircraft to account for advection effects as described in the next section. Temperature, pressure, and relative humidity are extracted for further insight into the meteorological conditions at the intercept point.
2.4 Aircraft position data and intercept identification
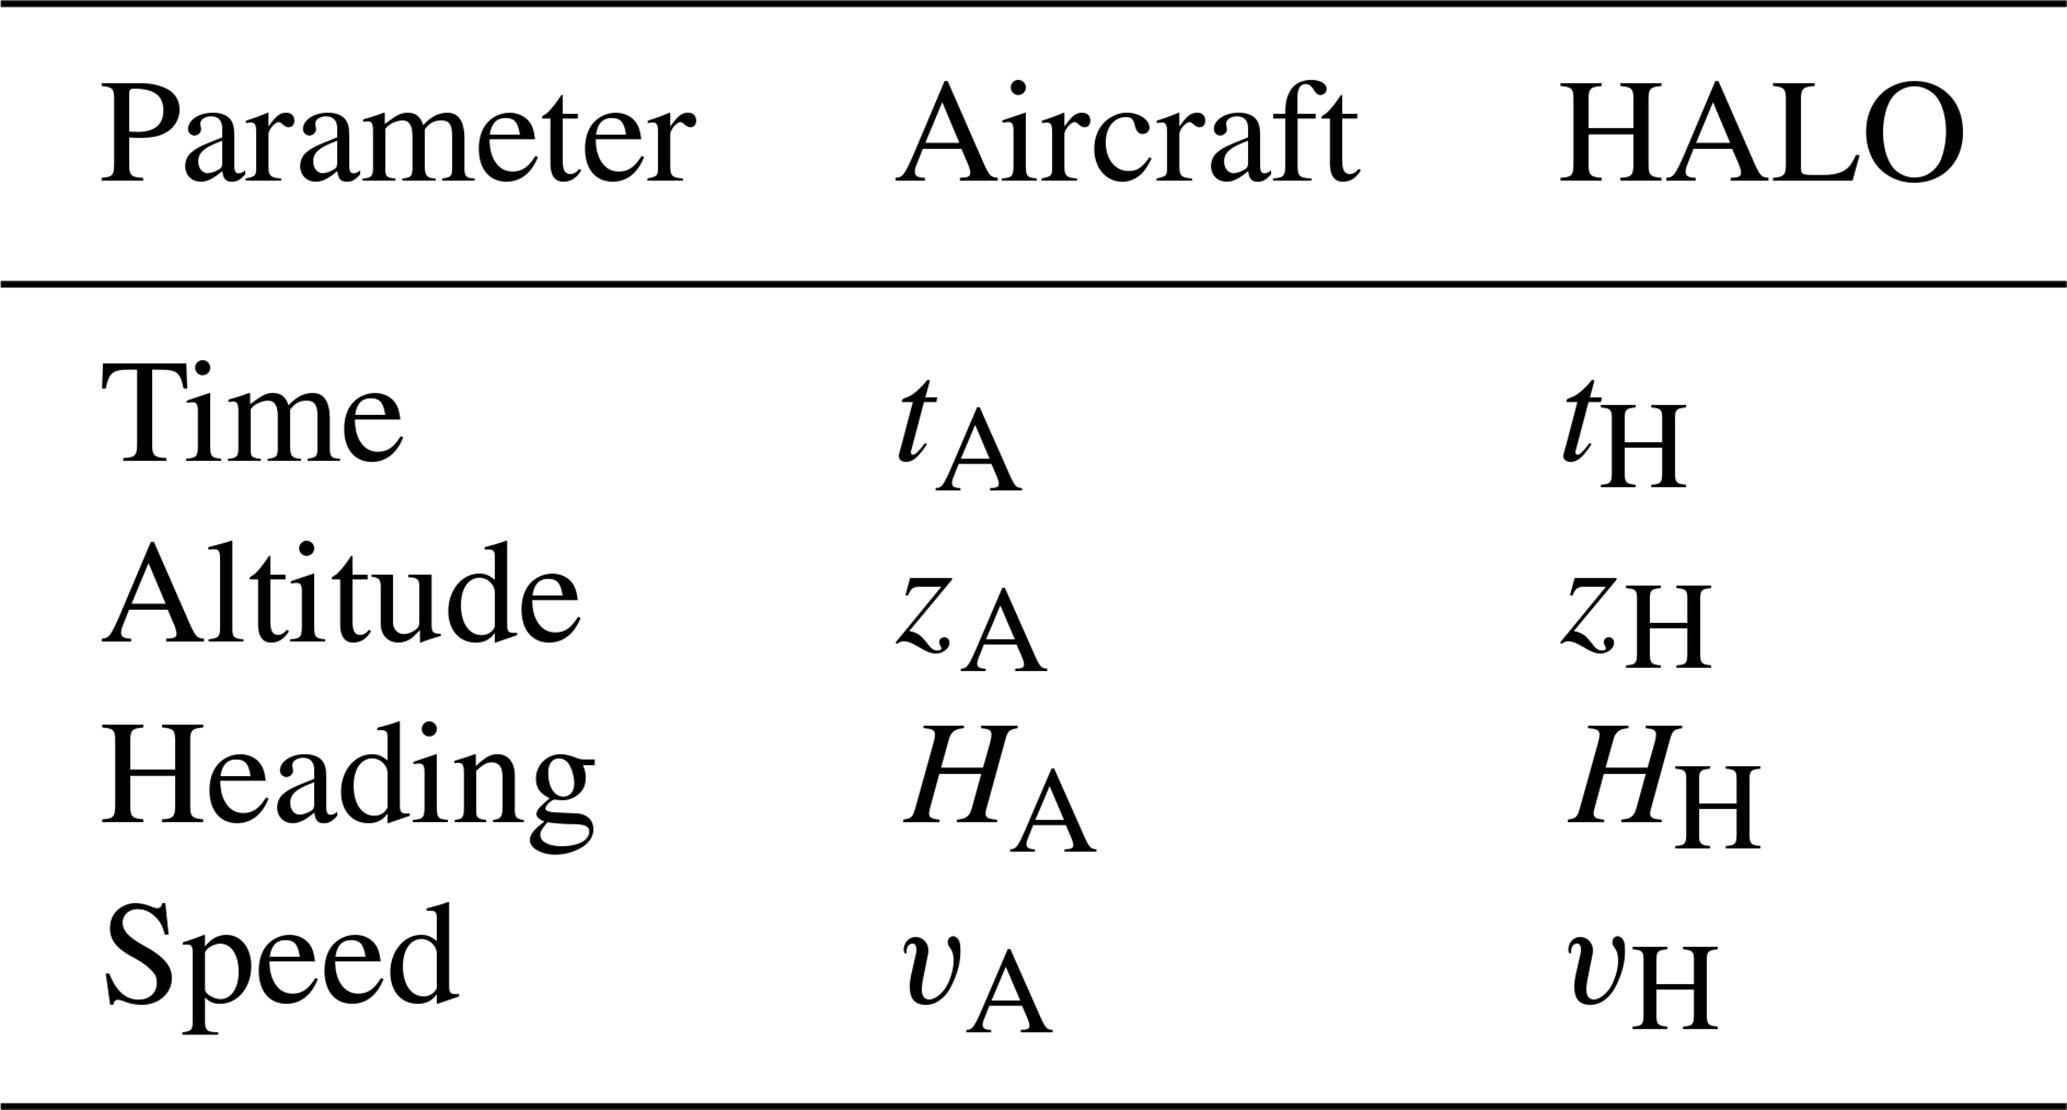
Data on the position of individual aircraft as available from the airplanes' Automatic Dependent Surveillance-Broadcast (ADS-B) is necessary for an unambiguous identification of embedded contrails (Tesche et al., 2016; Bräuer and Tesche, 2022; Seelig et al., 2025). Aircraft position data generally containing information on time, latitude, longitude, flight level, ground speed, and heading of commercial aircraft are necessary for matching them to HALO lidar observations in the framework of the considered experiments. The required data have been procured from Flightradar24 (https://www.flightradar24.com, last access: 19 May 2026). The position information is used here for developing (based on ML-CIRRUS) and verifying (based on CIRRUS-HL) a method for embedded contrail detection in WALES lidar observations. An overview of the aircraft-related parameters necessary for matching their position is provided in Table 1.
Table 1Overview of the aircraft-related parameters needed for inferring the potential displacement of the intercept between commercial aircraft (index A) and HALO (index H) within the lidar measurement along the HALO track.
The geometry of the matching problem is displayed in Fig. 3. Rather than the geometric intercept O that does not account for the time delay between the passage of a commercial aircraft and the HALO observations, we are interested in the point A that represents the location to which the disturbance of a commercial aircraft would be advected by the mean wind. As a consequence, the displacement along the HALO axis of observations needs to be determined to identify the true location of a potential embedded contrail. This distance depends on the angles between the different aircraft tracks and the wind direction dir, the wind speed v, and the time delay Δt between the commercial aircraft (tA) and HALO (tH). The last parameter is restricted to 2 h in this study. In contrast to Tesche et al. (2016), we do not extend the analysis to situations in which the HALO observations occurred before another aircraft's passage at the same locations. In addition, the search for intercepts is restricted to an altitude range from 8 to 12 km as a range of reasonable overlap of cirrus occurrence and aircraft flight levels (Heymsfield et al., 2017). Furthermore, only flights that occurred below the HALO overpass (zA < zH) are considered.
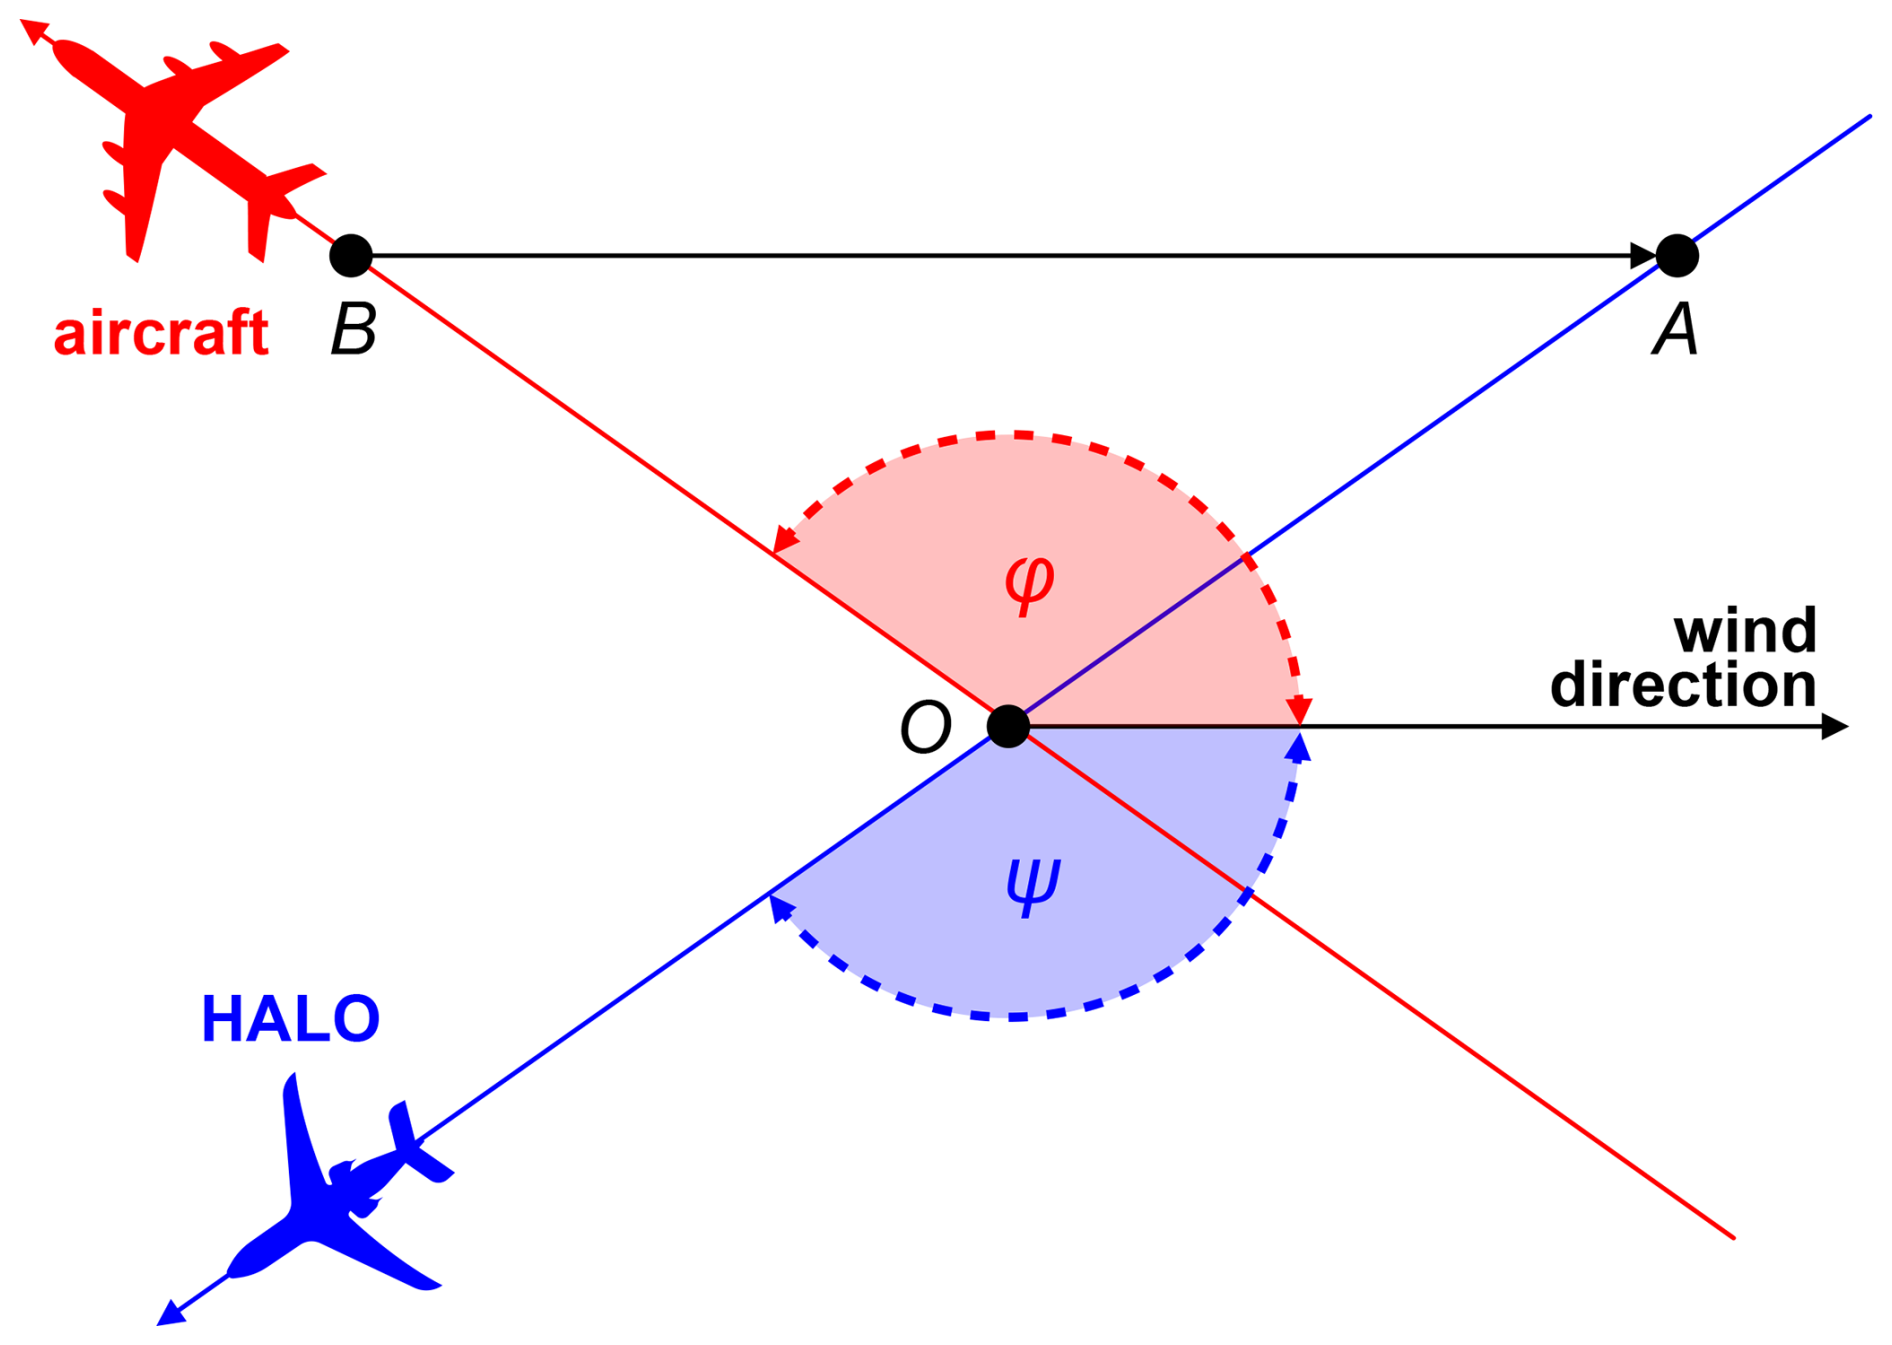
Figure 3Schematic illustrating the effect of wind advection on embedded contrails produced by commercial flights (red) during a HALO overpass (blue). O marks the geometric intercept between the tracks of the two aircraft. The angle between the commercial aircraft and the wind direction is marked as φ while the one between HALO and the wind direction is denoted as ψ. A marks the location of the embedded contrail in HALO's along-track measurement as a result of advecting the perturbation related to the commercial aircraft with the mean wind (black arrow).
Wind speed and direction at the intersection points O for determining the displacement are taken from the ERA5 reanalysis. After determining the angle φ = HA − dir and ψ = HH − dir, the displacement is calculated as
Any intercepts for which resulted in a displacement beyond a HALO overpass' observations are excluded from further analysis.
The predicted position an intercept point depends on the accuracy of the heading of the two aircraft, the time difference between them as well as wind direction and wind speed at flight level. Of those, we consider wind speed to be associated with the largest uncertainty. Given a certain error in wind speed, the location error is exacerbated with increasing time delay. To assess this effect, we have repeated the intercept-point retrieval assuming 1 m s−1 error in wind speed.
2.5 Approach for manual detection of embedded contrails
The approach for identifying and verifying embedded contrails, based on advected intercepts and lidar observations, is summarized in Fig. 4. Following the reasoning in Gierens (2012) that embedded contrails are essentially contrail overlaid to an existing cirrus, we assume that inhomogeneities in cirrus clouds related to embedded contrails should show an increase in ice crystal number concentration and a decrease in ice crystal effective radius as the contrail adds an abundance of small crystals to the existing cloud. In lidar observations, such inhomogeneities should manifest themselves as regions of increased β and COT (more crystals) and decreased δ (smaller crystals appear less non-spherical at the laser wavelength) compared to the surrounding unperturbed parts of the same cloud. However, the challenge is to define suitable threshold values of β and δ that can be used to separate embedded contrails from the unperturbed cloud background. This is realized in the first step of the contrail mask described in Sect. 3.2. In addition, the spatial extent of the perturbation should be large enough to be separated from mere signal noise but small enough to still be considered a local inhomogeneity. This will become important in the second step of the contrail mask described in Sect. 3.2.
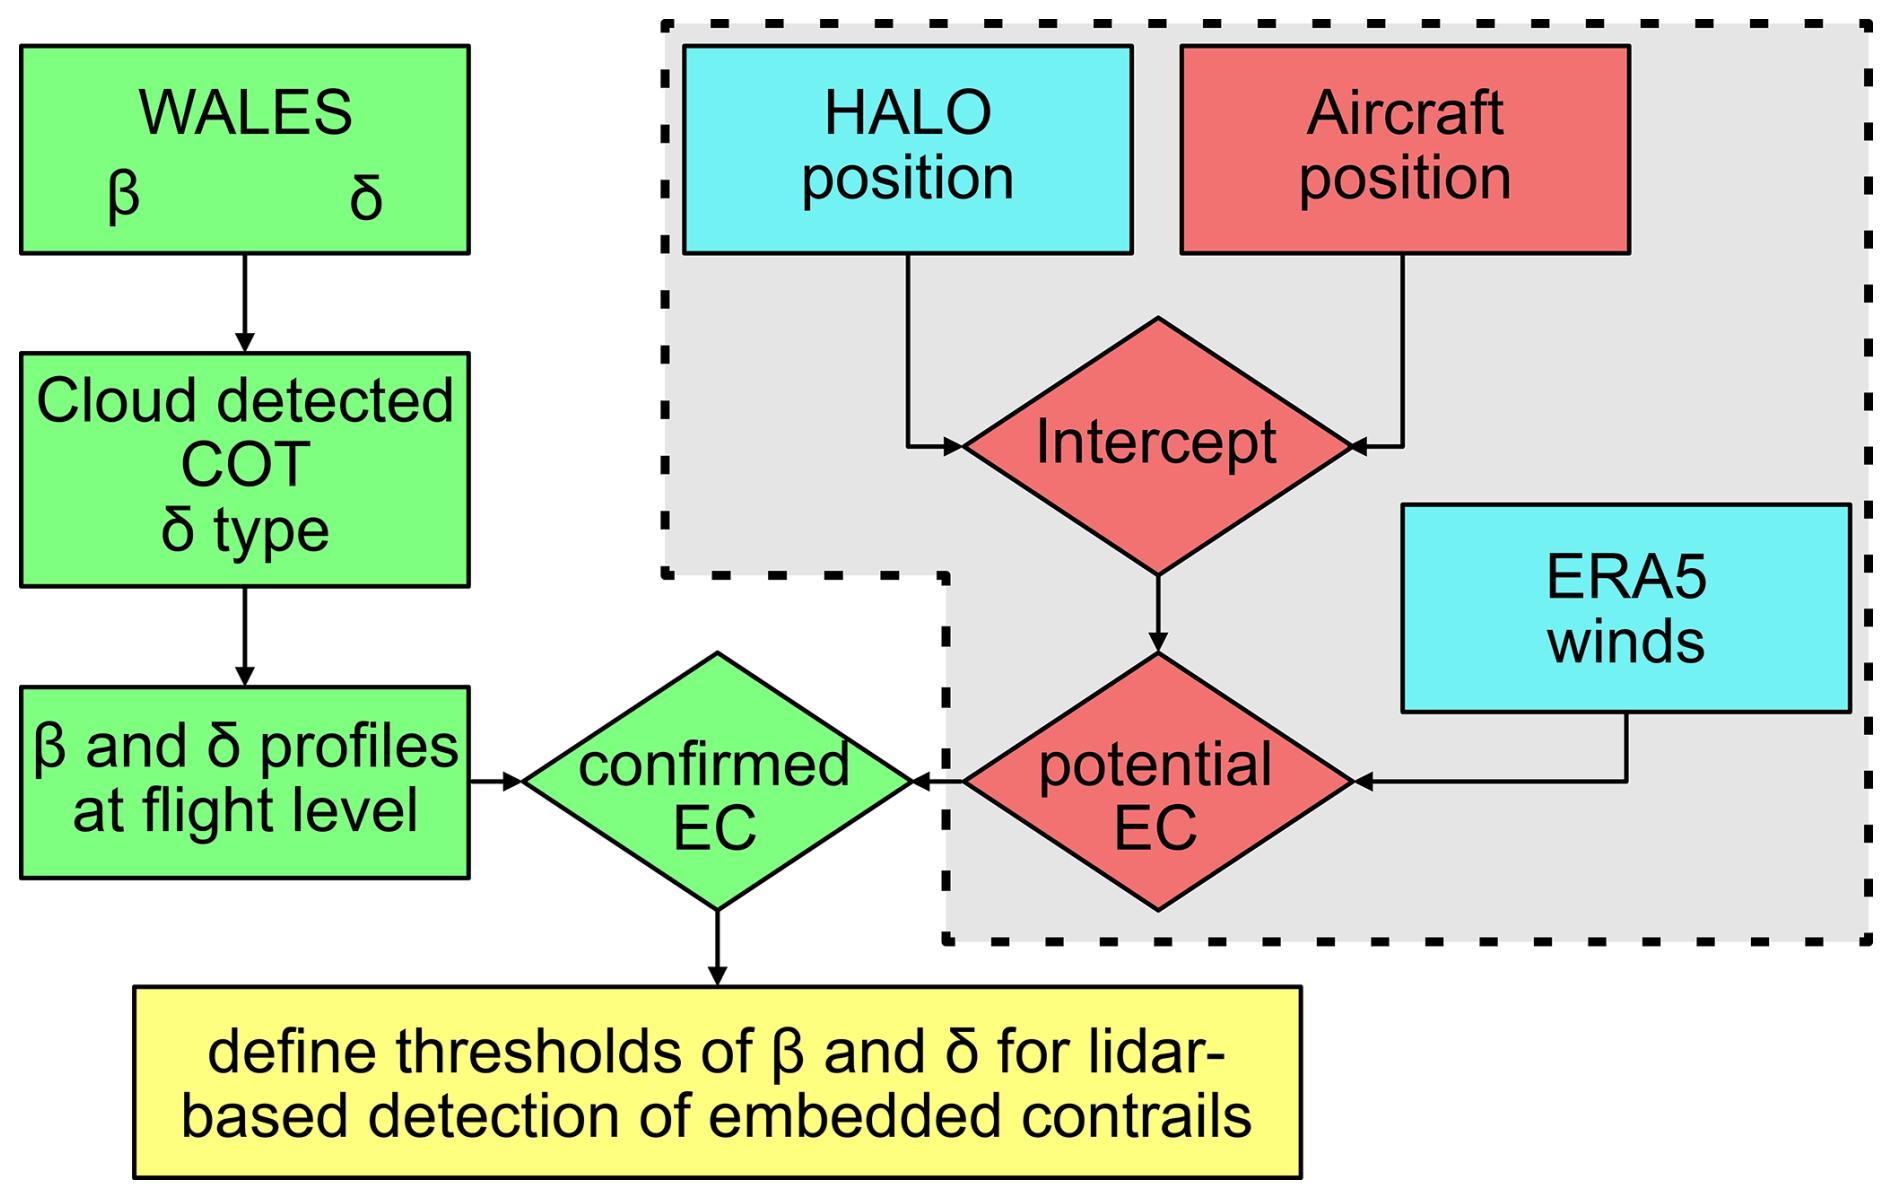
Figure 4Flowchart of the first step of the methodology for identifying embedded contrails from the combination of lidar profiles and aircraft position data. Green refers to information provided by the lidar measurements. Blue marks auxiliary data that is readily available. The red items rely on obtaining aircraft position data from a commercial provider or a dedicated data repository. The gray box marks the steps related to matching the location of HALO observations to passages of commercial aircraft.
Following the description in Sect. 2.4, we first use the information on the position of commercial aircraft and HALO together with the ERA5 winds to identify the location of potential embedded contrails in the HALO observations (gray box in Fig. 4). The lidar observations are then used to assess if cirrus was present at the flight level of the commercial aircraft. Intercepts outside the cirrus are discarded from further analysis. For intercepts within the cirrus, the profiles of β and δ at the location of the best match and 10 s prior to that observation are visually inspected for features that agree with the hypothesis outlined above. Specifically, the range from flight level down to 500 m below flight level is assessed for an increase in β that comes along with a decrease in δ, as shown in the example presented in Fig. 7. Finally, potential contrails from the matching with flight level within cirrus and a β-increase/δ-decrease signature in the lidar observation derived from by-eye inspection are marked as confirmed contrails. Those cases are then used to define threshold values of β and δ for the first step of the automated contrail masking. Subsequently, the automated mask was validated by repeating the procedure with measurements conducted during CIRRUS-HL (see Sect. 3.3).
The WALES observations during ML-CIRRUS are used for developing a mask for the lidar-based identification of embedded contrails without the need for procuring additional aircraft-position data. The performance of the contrail mask is then evaluated by applying it to WALES observations during CIRRUS-HL with subsequent investigation for confirmed matches from flight-track data.
3.1 Case study for subjective contrail detection during ML-CIRRUS
Here, we will use WALES observations from 12:20 to 13:22 UTC on 1 April 2014 during ML-CIRRUS to illustrate the different steps of the procedure outlined in Fig. 3. This HALO flight covered the northern part of Germany (see Fig. 5). It focused specifically on observations of contrails and contrail cirrus (Voigt et al., 2017) and, therefore, features a very high likelihood of containing cases of embedded contrails. The observation of WALES on 1 April 2014 corresponds to cirrus clouds under polluted high-PLDR conditions (see Table A1). This circumstance becomes relevant later in the analysis when the confirmed embedded contrails are used to obtain a threshold-based detection mask.
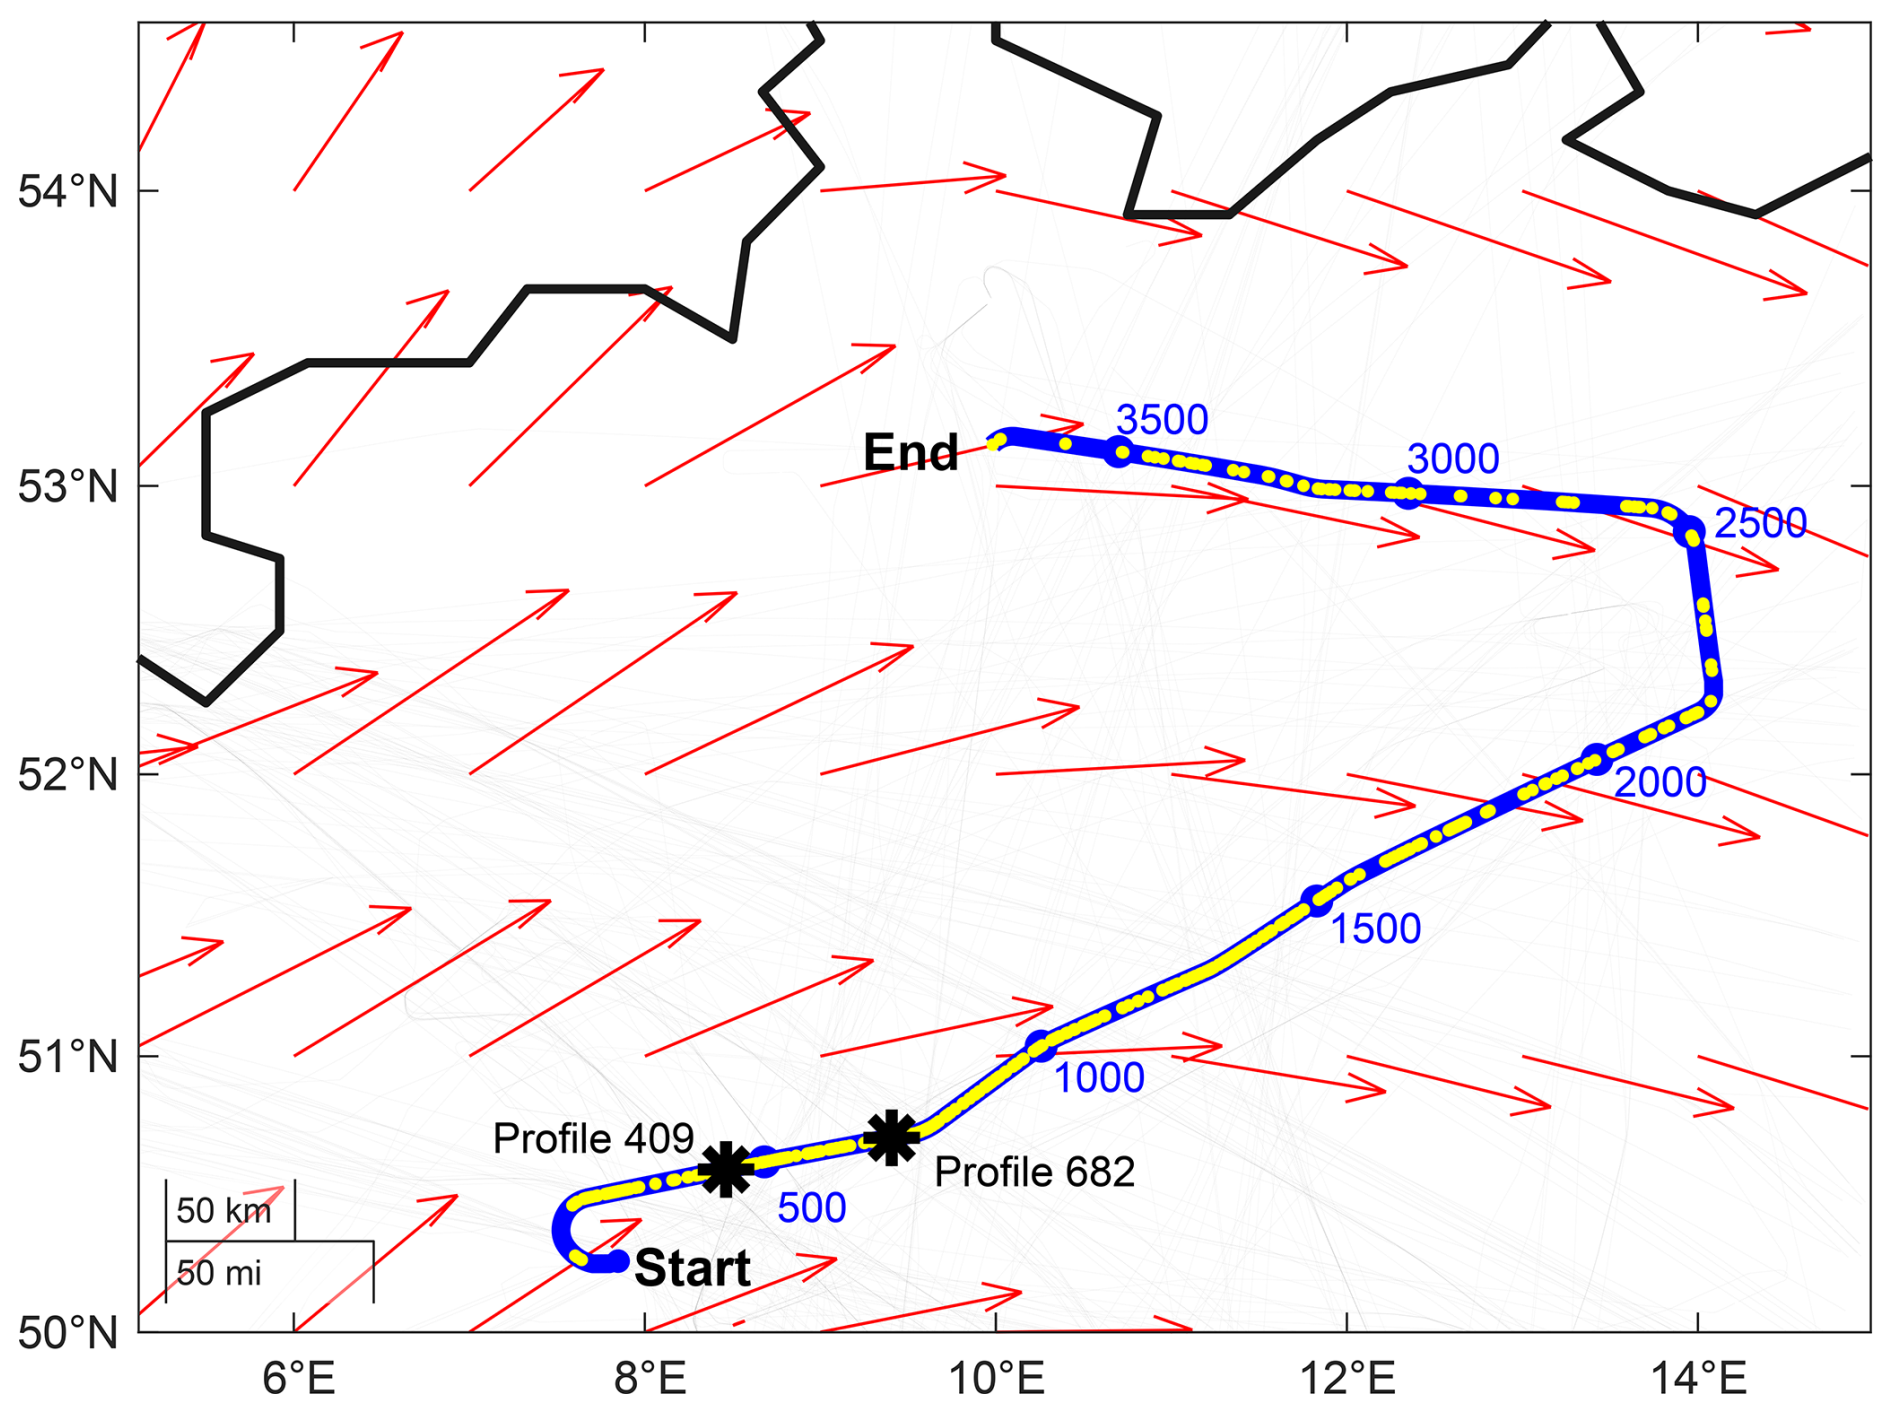
Figure 5Overview of the location of about 1 h of WALES measurements along the HALO route (blue line with blue dots indicating intervals of 500 profiles) around noon on 1 April 2014 (magenta in Fig. 1). The yellow dots mark the location of advected intercept points with commercial aircraft passing through the region (thin gray lines) less than 2 h prior to the HALO observation (see Sect. 2.4). The ERA5 wind field is indicated by red arrows. Black rosettes highlight the location of the profiles shown in Fig. 7.
First, the information on the position of commercial aircraft passing through that region is matched to the HALO track with intercepts advected with ERA5 winds as described in Sect. 2.4. This gives the locations of embedded contrails along the HALO track as shown in Fig. 5. By considering the actual lidar observations, only cases with a confirmed cirrus cloud at flight level are retained for further investigation.
Figure 6 reveals the presence of several cirrus layers during the noontime observations of 1 April, including an approximately 1 km deep, relatively homogeneous layer during the first half hour, beneath which more heterogeneous cirrus with strong virga extending down to 6 km can be seen. The increased COT from 12:50 to 13:05 UTC is related to the cirrus shield of a deep-convective cloud that attenuates the laser light at altitudes below 8 km. The final 15 min of the measurement show another cirrus layer with a cloud top at 11 km height but now featuring extensive virga down to 8 km. In general, increased COT results from a stronger backscatter signal, which is considered a signature of a potential embedded contrail. In addition, candidates for embedded contrails are often found in regions of lower δ. While both observations are in line with our hypothesis outlined earlier, we are interested in quantifying these differences to establish objective thresholds for identifying embedded contrails solely based on the lidar observation.
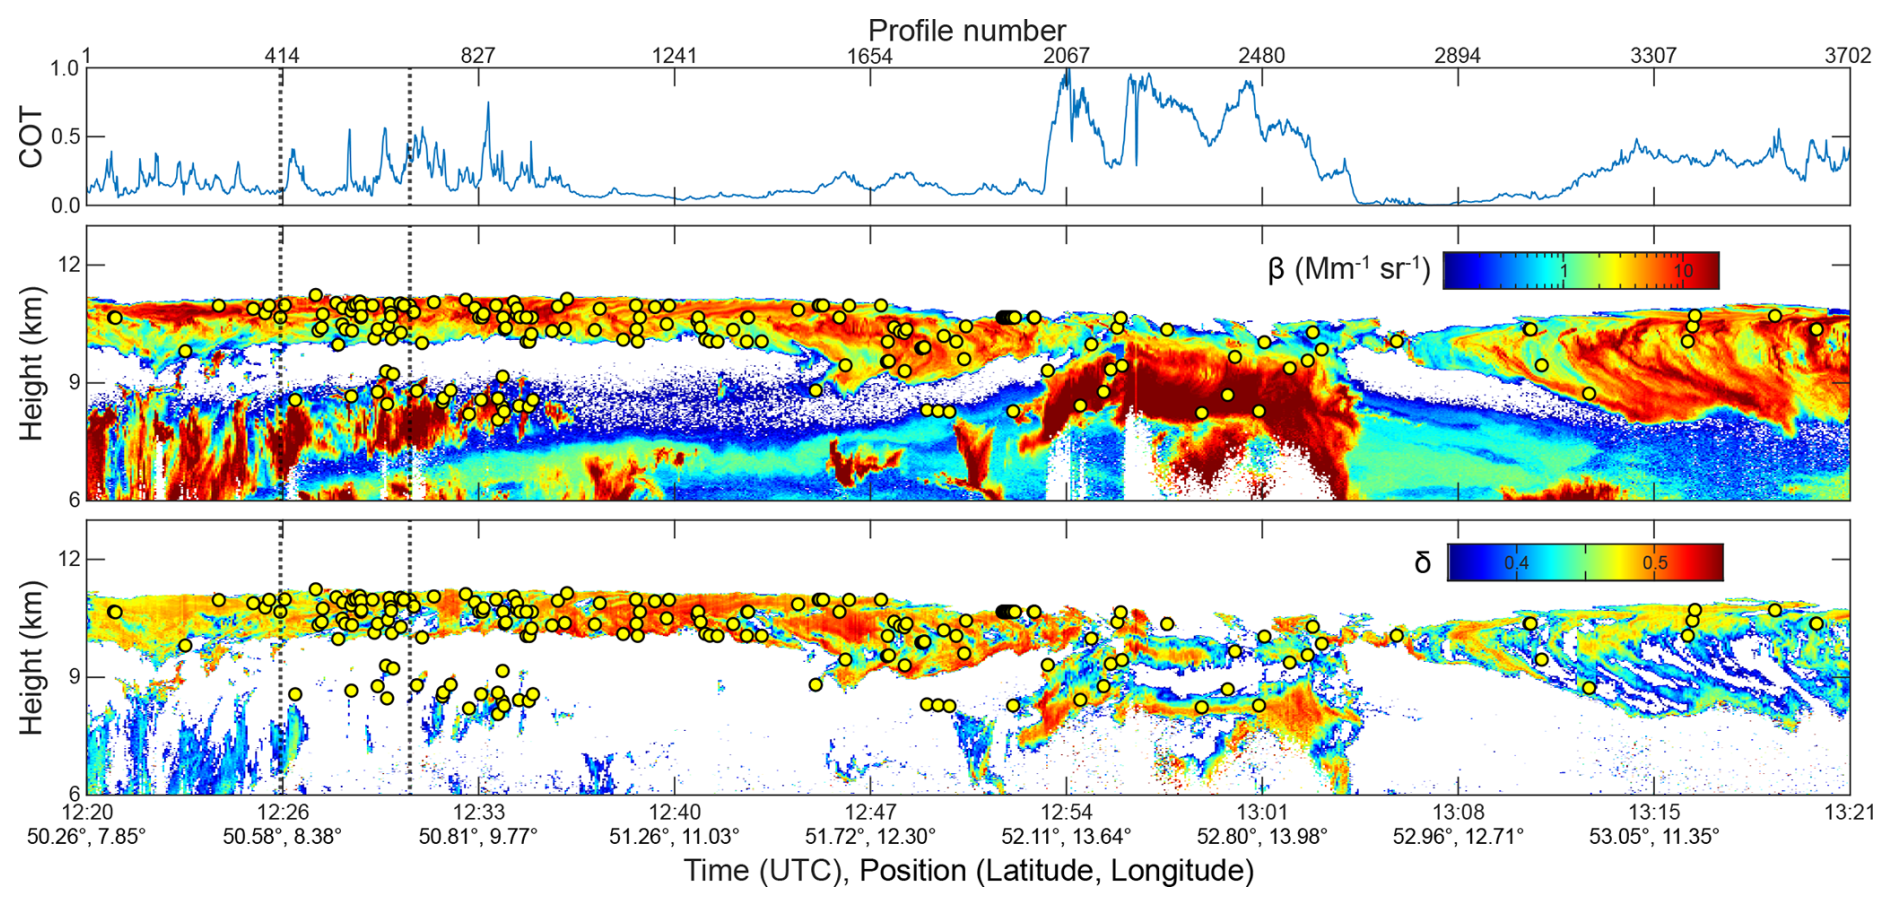
Figure 6Lidar observation during 1 April 2014 with advected intercept points (yellow dots): (a) cloud optical thickness, (b) backscatter coefficient, (c) particle linear depolarization ratio. The dotted lines mark the location of the profiles shown in Fig. 7.
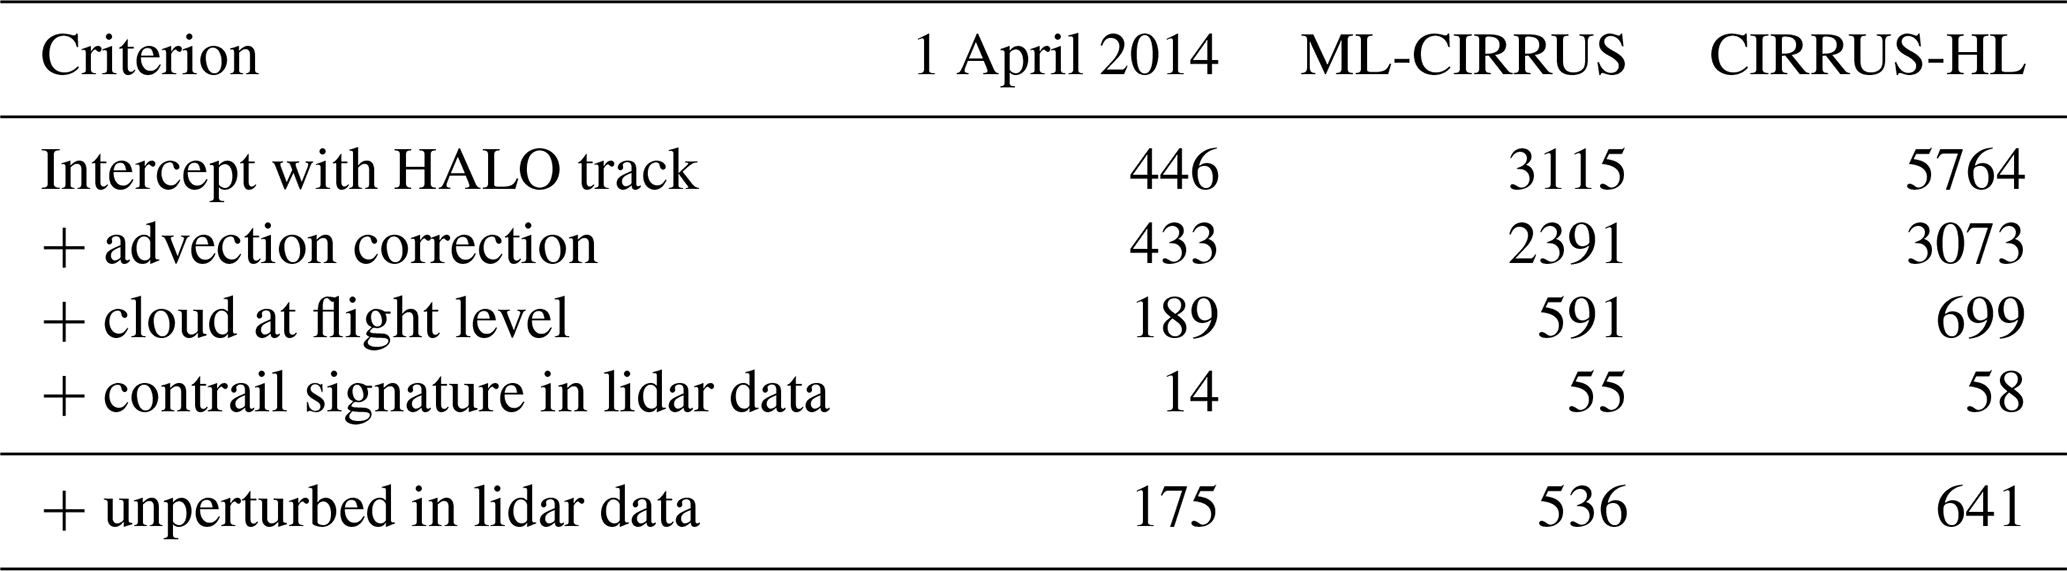
Figure 7 illustrates the subsequent investigation of two candidates for embedded contrails marked in Fig. 6. The profiles of β and δ at the location of likely contrail occurrence are compared to those observed 10 s later. If there are no marked differences in the profiles related to the cloud regions that we assume to be perturbed and unperturbed, respectively, the case is not considered an embedded contrail (Fig. 7a). This corresponds to the heterogeneity requirement that forms the second step of the contrail mask presented in Sect. 3.2. In lidar measurement, the increase in β indicates a higher number of scatterers, corresponding to an increased concentration of ice particles (Gierens, 2012), while the decrease in δ, which is sensitive to particle size and shape (Tesche et al., 2009, 2011), suggests the presence of smaller and less non-spherical (with respect to the laser wavelength) ice crystals. These features are characteristic of regions perturbed by aircraft passage, typically found about 500 m below flight level (Marjani et al., 2022). Therefore, cases that show a marked increase in β and a decrease in δ within the identified region of likely contrail occurrence (Fig. 7b) are considered as confirmed contrails. An overview of the number of cases for the example of 1 April 2014 is provided in Table 2.
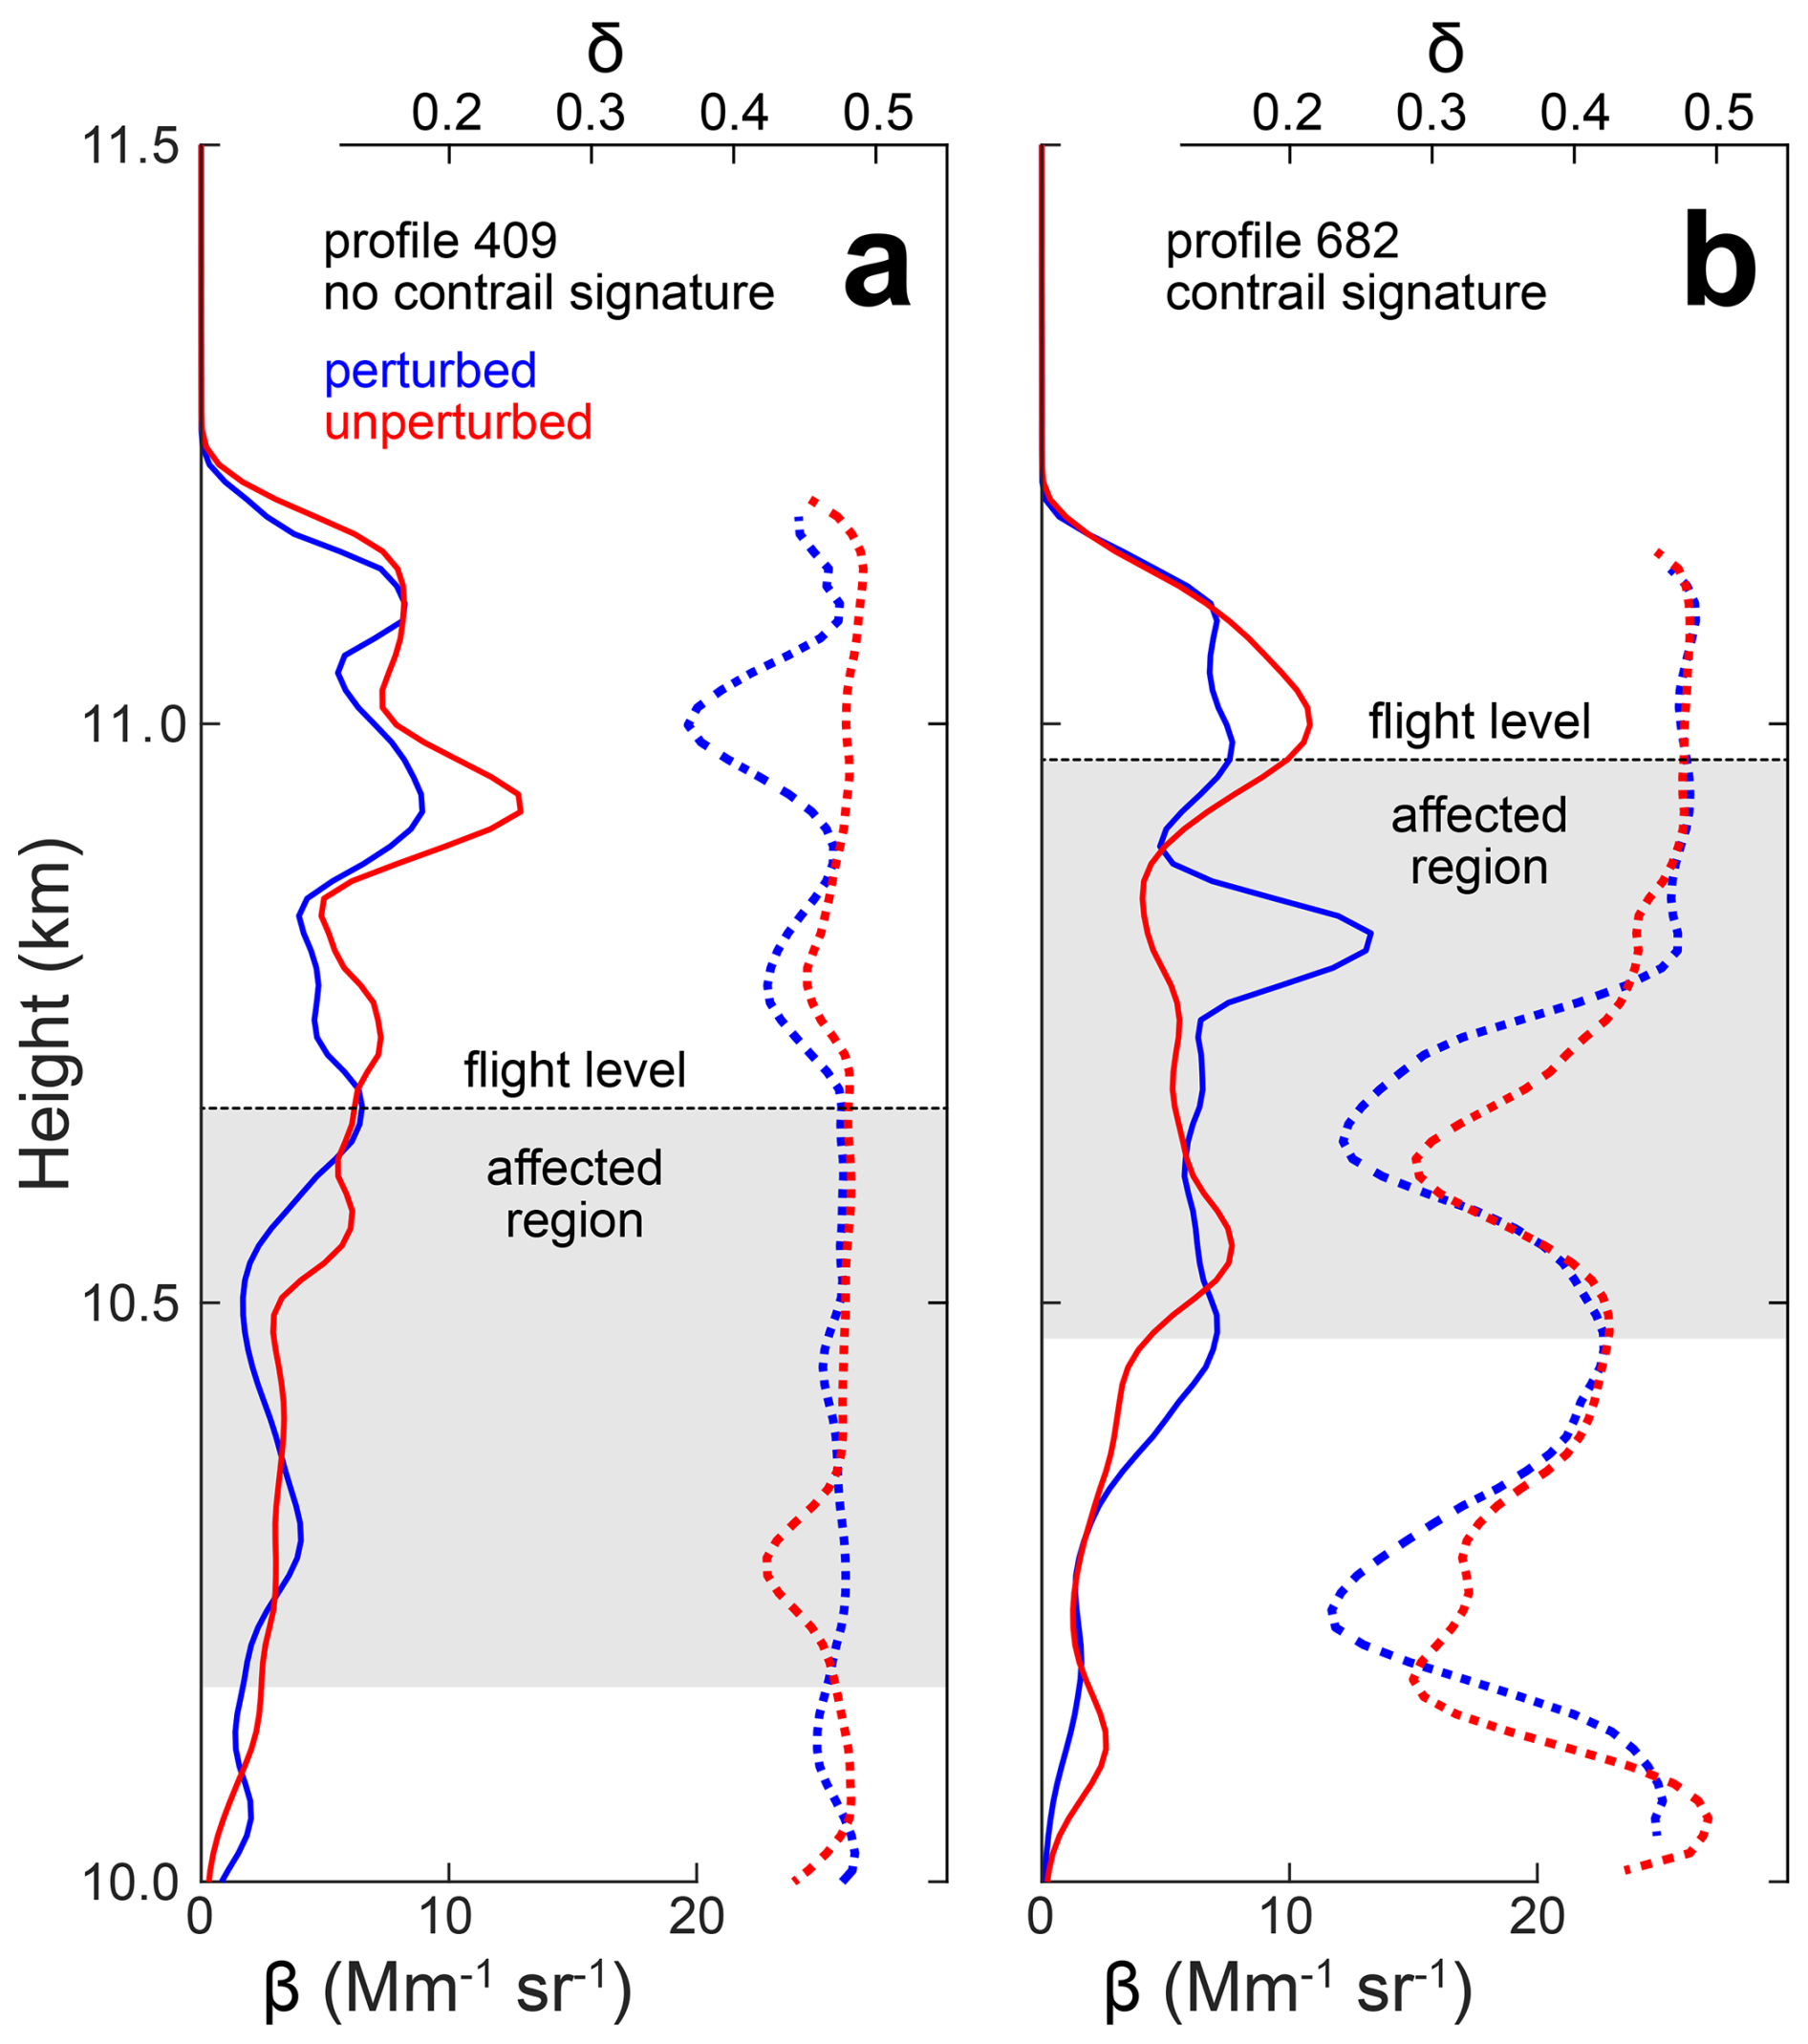
Figure 7Mean profiles of backscatter coefficient β (solid) and depolarization ratio δ (dotted) for intersection points identified around profiles 409 (a) and 682 (b) of the WALES observations shown in Fig. 6. The blue lines refer to cloud regions assumed as perturbed by the passage of an aircraft. The red lines mark the unperturbed cloud region observed 10 s after the perturbed region. Profiles are averages over 5 profiles smoothed with a window length of 5 m. The black dashed line marks the flight level of the passing aircraft. The gray area indicates the height range up to 500 m below flight level, throughout which a contrail might extend.
Table 2Number of candidates for embedded contrails from by-eye inspection of WALES profiles on 1 April 2014 and in the entire ML-CIRRUS and CIRRUS-HL datasets. Rows refer to different cumulative stages of filtering and quality control, starting from aircraft-HALO intercepts to perturbed and unperturbed cloud regions.
3.2 A lidar based embedded-contrail mask
This by-eye inspection presented in Sect. 3.1 was performed for all intercepts identified in the WALES observations during ML-CIRRUS (see Table A1) for selecting thresholds of β and δ for the automated identification of embedded contrails described in this section. The analysis was then repeated using WALES observations from CIRRUS-HL (see Table B1) to obtain a dataset for assessing the quality of automated embedded contrail identification with ML-CIRRUS-based thresholds. An overview of the number of cases for ML-CIRRUS and CIRRUS-HL is provided in Table 2.
The analysis of the ML-CIRRUS dataset led to the identification of a β threshold of 4 Mm−1 sr−1 for the detection of perturbed cloud regions. This relates to an increase in the detected backscatter signal that results from the increase in ice-crystal concentration that occurs when a contrail is added to the already existing cloud (Gierens, 2012). In contrast, the occurrence of high and low PLDR cases in the ML-CIRRUS dataset (Urbanek et al., 2018) inhibits the use of a fixed δ threshold for contrail identification. To address this issue, the 2d histogram in Fig. 2 is separated according to high and low PLDR conditions as shown in Fig. 8. Together with plotting values of the individual cases (such as in Fig. 7) within the same space (contrail cases occur predominantly in the upper-left parts of the plots in Fig. 8, not shown), these 2d histograms (as representative for the entire ML-CIRRUS data set) have led to the choice of 30 % and 43 % as δ threshold for low and high PLDR conditions, respectively. The lower values of δ in the perturbed region of the β-δ-space represent the fact that the ice crystals formed after an aircraft's passage are much smaller than those of the already existing cirrus, which leads to a crystal ensemble that appears less non-spherical in the context of a depolarization lidar measurement compared to the unperturbed cloud. The thus obtained threshold values separate what we consider here as unperturbed and perturbed regions of a cirrus and are used in the first step of the contrail masking. The robustness of the selected threshold values has been evaluated in a sensitivity analysis in which β is lowered to 3 Mm−1 sr−1 and δ is increased to 35 % and 45 % for low and high PLDR conditions, respectively. The comparison of contrail occurrence for different variations of threshold values is presented in Table C1.
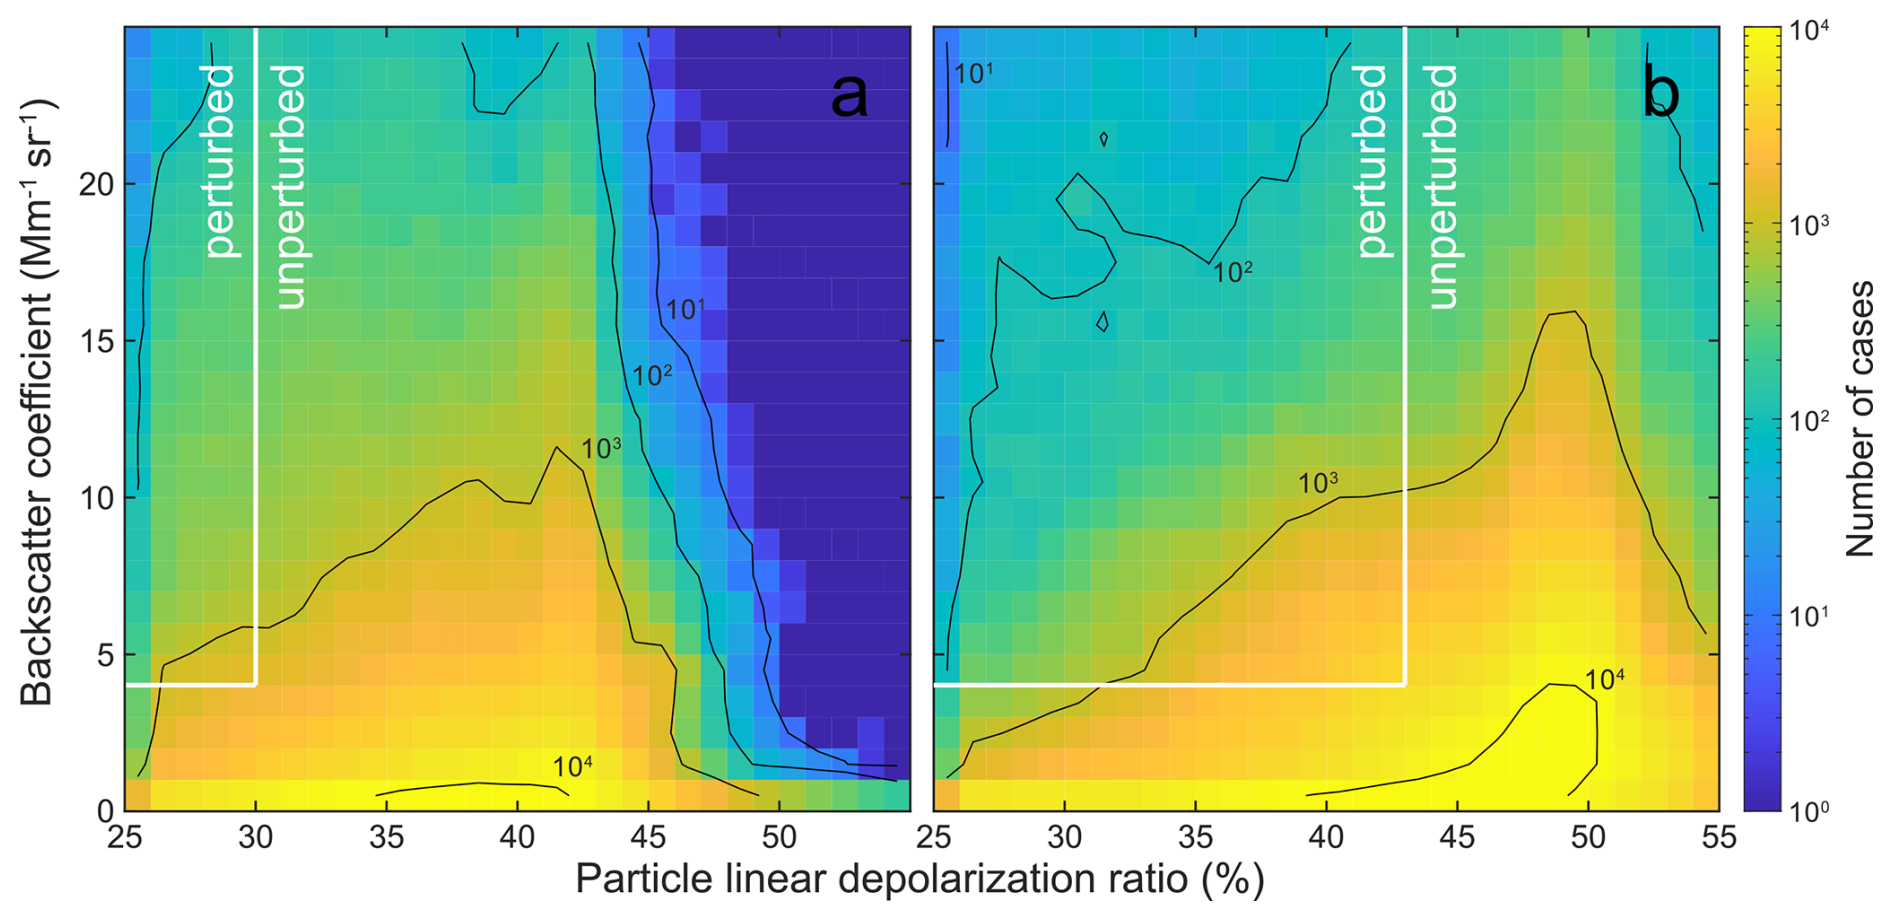
Figure 8Same as Fig. 2 but for observations according to conditions with low PLDR (a) and high PLDR (b) as defined in Urbanek et al. (2018). The white lines mark the threshold values of β = 4 Mm−1 sr−1 and δ = 30 % (low PLDR) δ = 43 % (high PLDR) for separating perturbed cloud regions from the unperturbed background cloud in step one of the contrail mask.
Observations with combinations of β and δ that fall in the perturbed sectors in Fig. 8 are not always related to embedded contrails. For instance, regions of strong backscatter signals that approach detector saturation (such as between 12:54 and 13:05 UTC in Fig. 6) often coincide with weak perpendicular backscatter signals that lead to PLDR values below the δ-threshold. Such larger-scale signatures can be associated with the upper part of deep-convective systems or fall streaks – as also apparent from the combination of Figs. 6 and 9. To address this problem, we apply an inhomogeneity condition that is in line with how embedded contrails are defined in the manual analysis. Specifically, we assess the size of the unique objects identified in the contrail mask after step one, i.e., eight-connected areas identified as perturbed cloud. As a conservative estimate, contrails up to an age of 2 h show a typical cross section of 500 m height and 1000 m width (Unterstrasser et al., 2014; Schumann et al., 2017). Considering the lidar grid of 15 m vertical and 200 m horizontal resolution, this would refer to a maximum object size of 165 pixels. However, the cross-section of a real contrail is not rectangular and, thus, unlikely to fill this entire box. In addition, such a size would only apply if the observation during the intercept was perfectly perpendicular to the contrail. For a more realistic selection of the threshold values for the inhomogeneity assessment, we go back to the verified contrail cases from the manual analysis. From this, we conclude that objects should contain between 10 and 50 pixels to be considered an embedded contrail. Smaller features are considered as noisy data, while larger features are not in line with our underlying assumption that embedded contrails are a locally constrained cloud perturbation. The result of allowing for smaller or larger feature size on contrail detection is shown in Table C1. The selected pixel range is rather inclusive as shown in the examples in Figs. 9 and 10. However, a more conservative contrail mask is more likely to be transferable to WALES observations during other HALO campaigns compared to one that is tuned too much towards the ML-CIRRUS and CIRRUS-HL observations. While the thresholds of the physical parameters applied in step one are directly transferable to observations with other airborne lidars, we would like to point out that the size of acceptable contrail objects in step two might need to be adapted to the spatio-temporal resolution of the respective instrument.
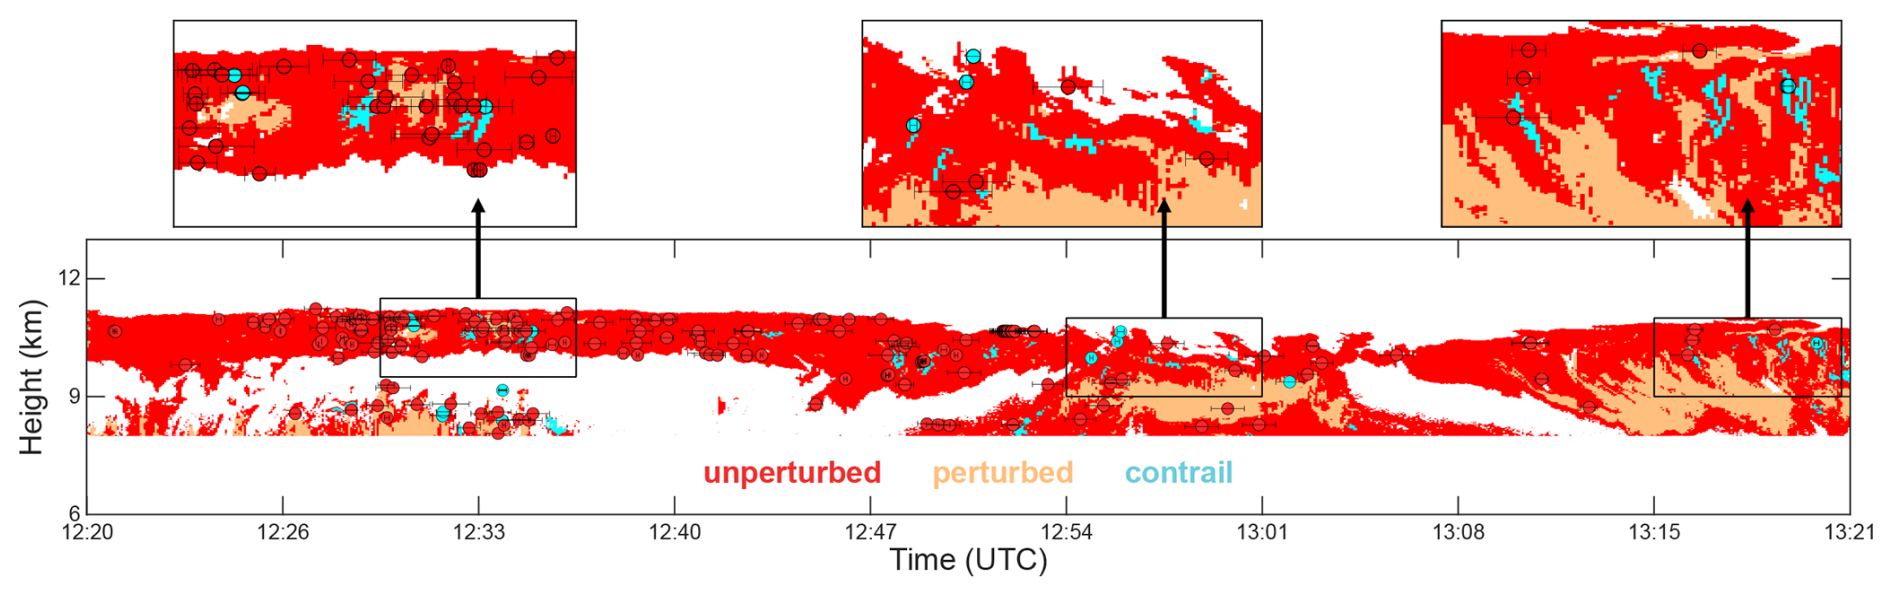
Figure 9Result of applying the contrail mask to the observations in Fig. 6. Unperturbed cirrus regions identified in step one are marked in red. Perturbed cloud regions that pass the β-δ threshold (step one) but fail the heterogeneity criterion (step two) are marked orange here but re-labeled as unperturbed cirrus in the final masking. Perturbed cloud regions passing the heterogeneity test are marked in cyan. Dots refer to the matched cases in Fig. 6 that have been confirmed as contrails (cyan) or unperturbed cloud (red) in the manual analysis. Error bars represent the range of intercept locations related to assuming an error of 1 m s−1 in ERA5 wind speed. The insets in the top row represent close-ups of the regions marked by black boxes in the bottom panel.
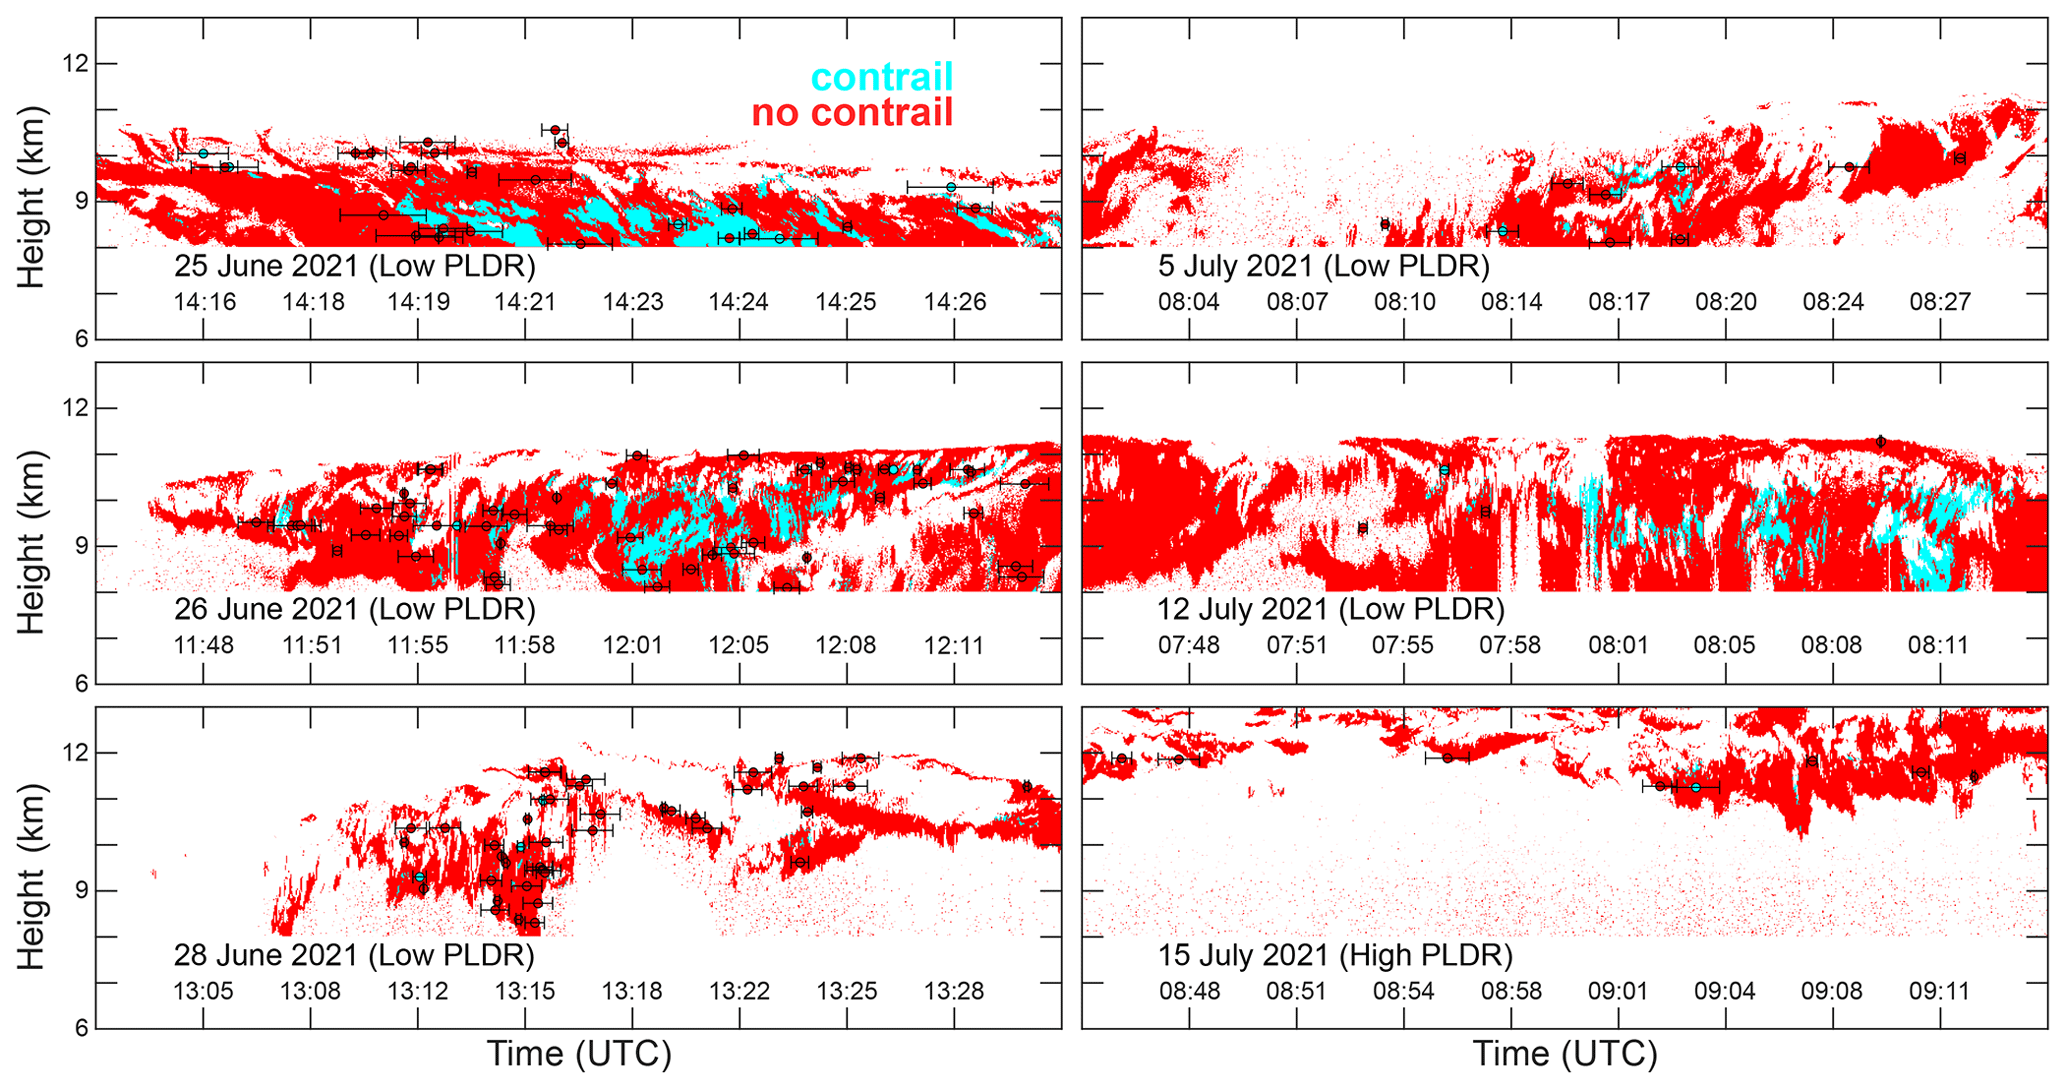
Figure 10Same as Fig. 9 but for WALES observation of cirrus clouds during CIRRUS-HL and with orange regions in Fig. 9 reassigned to unperturbed cloud (red). Note that gaps in the cloud area at 10 to 12 km between 13:15 and 13:29 UTC on 28 June 2021 are due to detector saturation for signals from optically thick regions of the cloud.
Figure 9 illustrates the application of the two-step contrail mask to the WALES observations on 1 April 2014 in Fig. 6. No contrail masking is provided below 8 km height as there is generally little (contrail-producing) air traffic below that height. However, observations down to 7 km are still considered during step two to properly consider larger perturbed cloud regions of which only a fraction smaller than the upper size limit extends above the lower cut-off height, such as in the cloud present below 9 km height until 12:36 UTC. For the case of 1 April 2014, the majority of the cloud area is identified as unperturbed cloud. This is in line with the by-eye inspection of the confirmed matches – most of which are true negatives. Table 2 shows that 175 out of 189 matches within clouds relate to lidar observations without a distinct contrail structure identified by the human observer interpreting data as in Fig. 7. Figure 9 shows a number of large areas (between 12:54 and 13:05 UTC or between 13:10 and 13:19 UTC) that pass the β-δ threshold but are clearly too large to represent actual contrail structure. These homogeneous areas are re-labeled as cirrus after the second step of the masking. This intermediate outcome (orange areas in Fig. 9) is not displayed in later presentations of the results of the contrail masking. The final contrail mask reveals a number of small areas (e.g., at around 12:30, 12:34, 12:48, or 12:58 UTC) that appear to be reasonable representations of embedded contrails. For the areas around 12:34 and 13:20 UTC, the contrail-labeled points located within the blue region mark true positives. Other blue dots, while not representing straight hits, are mostly in the vicinity of blue areas – so that the small spatial differences might be attributed to the uncertainty in the advection correction using modelled mean winds. Finally, false negatives, such as around 13:02 UTC, can occur when the contrail perturbation is located in a larger area that passes step one but not step two of the analysis. Such cases might require an adaptation of the β-δ thresholds that could be realized, e.g., by introducing an iterative loop to step one of the contrail masking. Finally, the error bars on the location of the intercept points indicate scaling with the time delay between the two aircraft, i.e., the temporal difference dominates over the wind-speed error. Lowering the accepted time delay of currently 2 h would be a straightforward measure for reducing the error in the location of the projected intercept points.
3.3 Validation of contrail mask
3.3.1 Validation approach and importance of PLDR conditions
The procedure of analyzing observations during ML-CIRRUS was repeated for the CIRRUS-HL campaign, though now with the objective of validating the result of applying the contrail mask with the outcome of the by-eye inspection of matched contrail cases. Essentially, an identical analysis was performed, but with a reversal of the interpretation approach. In contrast to ML-CIRRUS, no characterization of cirrus observations with respect to high and low PLDR conditions is yet available in the literature. While clean cirrus conditions are a warranted a priori assumption (Li and Groß, 2022), this depends on the location of the observations and we recommend to test for clean or polluted conditions on a cloud-by-cloud basis if such information is not readily available. The corresponding analysis was thus performed in the framework of this study to allow for a proper choice of δ threshold. The resulting identification of the PLDR regime is provided in Table B1. Approximately 85 % of the cirrus clouds probed during CIRRUS-HL have been identified as low PLDR cases, which indicates a small pollution impact on those clouds. For completeness, the corresponding 2d histogram of the β and δ distribution for CIRRUS-HL is presented in Fig. B2. Compared to Fig. 2 with its clear presence of two PLDR modes, it shows a more homogeneous distribution of δ with a single peak at around 45 %.
3.3.2 Results for selected cases
Six examples for the validation of the contrail mask are presented in Fig. 10. As shown in Table 2, the manual analysis of both ML-CIRRUS and CIRRUS-HL provides about the same number of matches and contrail cases, despite a much larger number of intercepts between the flight tracks of HALO and commercial aircraft during the latter campaign. Figure 1 shows that the validation cases of 25, 26, and 28 June 2021 (left column in Fig. 10) as well as 15 July 2021 cover a region similar to ML-CIRRUS. In line with the campaign objectives, the data set also contains observations at high latitudes (5 July 2021) and over Iceland (12 July 2021). While the intercepts for by-eye inspection vary for the different validation cases, there are enough samples to assess the quality of the developed mask. In that context it is important to emphasize that the identified features are unambiguous embedded contrails but rather contrail-perturbation-like objects.
First, the vast majority of no-contrail cases are located in cloud regions that are classified as unperturbed. This corresponds to a high detection rate of true negatives, i.e., unperturbed regions of the cloud are well detected. Second, contrail cases are mostly within or close to cloud regions that are marked as perturbed. Slight differences in location might be related to the temporal averaging (horizontal distance) or vertical smoothing (vertical distance) used for creating the profiles for by-eye inspections, such as shown in Fig. 7. The error bars again illustrate that projected intercept points are relatively well constrained except for cases with very long time delay. Third, some of the CIRRUS-HL cases (particularly 25 June and 12 July 2021) show a relatively high occurrence of identified embedded contrails, i.e., small-scale perturbed cloud regions, that cannot be connected to the passage of an aircraft in our flight-track data set. Jurkat-Witschas et al. (2025) reports the presence of fall streaks associated with young contrails (Unterstrasser et al., 2017) during 25 June 2021, some of which were located outside the cloud and, thus, are not considered in our analysis. Instead, we identified 27 in-cloud intercepts between the tracks of HALO and commercial aircraft, of which 5 were confirmed as embedded contrails in the inspection of the WALES lidar observations. In general, fewer intercept points are found for CIRRUS-HL observations at higher latitudes.
The effect of variation in the thresholds for β and δ as well as for the feature-size constraint and the detection of embedded contrails for the entire data set are discussed in Sect. 3.5.
3.4 Reasons for misclassifications
By design, the methodology presented here was intended to be applicable to lidar measurements of β and δ without the need for internal input. Further constraints are introduced by accepting only identified perturbations of a certain size. The latter requirement is particularly efficient for screening out signal noise and large-scale features that relate to the upper part of deep-convective systems of fall streaks, such as in Fig. 9 after 10:54 UTC. However, fall streaks do not necessarily extend beyond our 50-pixel threshold as visible on 12 July 2021 in Fig. 10. While such cases represent misclassification in the context of the intended contrail masking (as we are not able to connect them to an aircraft in our flight-track dataset), they are indistinguishable from embedded contrails as defined according to our mask, i.e., in the optical properties. As such, they are worth keeping for further study. More insight on the performance of the contrail masking will be obtained from the now possible statistical investigation of contrail microphysical properties from synergistic lidar-radar observations in which the combination of contrails (higher number concentrations, smaller ice crystals) and fall streaks (lower number concentration, larger particles) should manifest as bi-modal distributions of ice-crystal effective radius and number concentration, whose modes might be used for further data screening.
3.5 Statistics on embedded contrail occurrence
Table 2 underlines the necessity for the comprehensive data screening described above. For ML-CIRRUS, a total of 3115 intercept points are found between HALO and commercial aircraft within a time difference smaller than 2 h. 724 cases out of those are rejected because advection caused them not to be covered by the WALES lidar observations. Out of the remaining 2391 cases, 1800 are found to relate to aircraft passages outside cirrus. The total number of 536 in-cirrus cases is dominated by situations in which lidar observations do not indicate a marked difference in β and δ in the likely affected height region. Finally, the entire ML-CIRRUS data set features 55 confirmed embedded contrails. In the CIRRUS-HL campaign, 58 out of 699 in-cloud cases are classified as embedded contrails.
Figures A1 and B1 provide statistical information on the distribution of the time difference between commercial aircraft and HALO, the flight level of the commercial aircraft, the wind speed at flight level, and the related displacement of the theoretical intercept point for the different levels of screening in Table 2. In summary, little difference in found in the conditions for embedded contrails compared to all cases. Displacements are generally smaller than 50 km. Conditions during ML-CIRRUS and CIRRUS-HL are different only in the form of higher wind speed at flight level during the latter campaign.
Table 3 summarizes the statistics of identifying perturbations with the contrail mask for ML-CIRRUS and CIRRUS-HL. More details of the impact of the choice of threshold values and feature size are provided in Table C1. Based on the fraction of perturbed pixels, contrails account for only around 1 % of the lidar data within cirrus clouds, with a more stable fraction during low-PLDR conditions. However, the low fraction of perturbed pixels under high-PLDR conditions during CIRRUS-HL is probably related to the predominance of more pristine cirrus conditions sampled by that campaign. A better quantification is thus provided by considering the number of objects that remain after applying the contrail mask, which can be directly compared to the number of embedded contrails identified in the manual analysis. We consistently find more perturbed objects than manually identified embedded contrails, which was to be expected. On the one hand, the automated analysis cannot separate between embedded contrails and other small-scale perturbations that pass the β-δ screening as outlined in the previous section. On the other hand, the manual analysis can only account for aircraft that are included in the waypoint data set used for location matching.
Table 3Mean fraction of perturbed and unperturbed bins during the ML-CIRRUS and CIRRUS-HL campaigns, derived from the defined mask with corresponding thresholds for each PLDR regime. In addition, the number of automatically identified objects is compared to the number of manually verified embedded contrails.
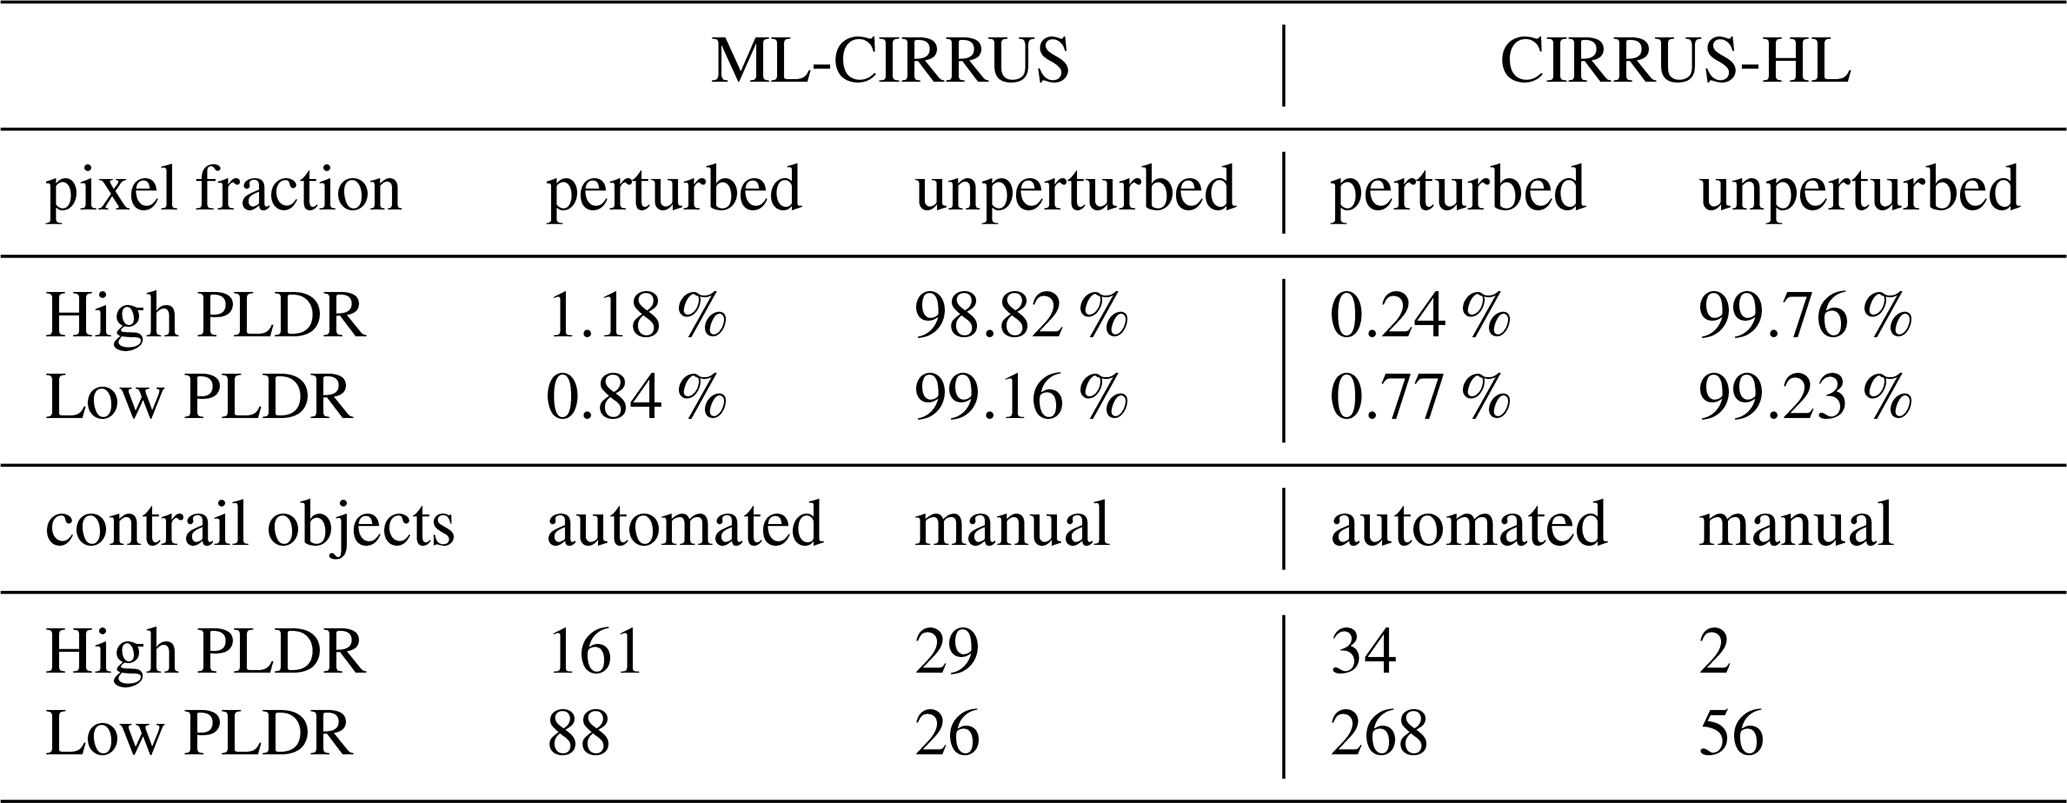
Nevertheless, we find a stable overestimation of a factor of four for observations during low-PLDR conditions for both campaigns. This gives us an idea of the false detection rate. The performance of the contrail masking is worse during high-PLDR conditions. This is not unexpected as a larger range of observations in terms of δ can pass the first step of the filtering. In the future, further layers of the contrail masking could focus on a better screening of fall-streak signatures to reduce the number of false positives.
3.6 Evaluating cases of contrail absence
Figures 9 and 10 show a large number of red circles that refer to intercepts for which no contrail signature was identified in the manual analysis. In general, those cases are also classified as background in our masking and we consider them to represent true negatives. Petzold et al. (2025) show that potential contrail-cirrus regions (PCCRs) almost always coincide with regions that are already covered with subvisible or visible cirrus. They define PCCRs as air masses with a relative humidity over ice larger or equal to 90 % for which the Schmidt-Appleman Criterion (SAC, Schumann, 1996) is fulfilled. However, this does not imply that all cirrus regions are also PCCRs and that an aircraft that passes through a cirrus cloud automatically forms an embedded contrail. For instance, a dissolving cirrus at ice-subsaturation might support contrail persistence but will not promote contrail formation.
For our cases of contrail absence, true negatives might refer to conditions for which SAC is not met. Alternatively, we can also expect that the detectability of the contrail imprint on the considered optical properties is time dependent. Very young contrails feature very small ice crystals that are not yet detectable in optical measurements while dispersion weakens potential contrail signatures over time until they become indistinguishable from the cirrus background (Freudenthaler et al., 1996). We have investigated the potential time dependence of contrail detection by contrasting the distributions of the time delay between an aircraft's passage through cirrus and the subsequent WALES lidar observations for manually confirmed and rejected contrail cases. Figure 11 highlights that contrail cases show a larger occurrence rate for time delays (contrail age) between 10 and 40 min while rejected cases are almost equally distributed over the considered 2 h time period. The reduced occurrence of contrails for very short delays of a few minutes and for delays that extend beyond one hour indicates that there might be a temporal sweet spot for detecting embedded contrails in lidar observations that depends on the microphysical processes related to different stages of the contrail life cycle (Unterstrasser, 2016; Schumann and Heymsfield, 2017). In line with the low detection rate for contrails in the vortex phase, Seelig et al. (2025) have dismissed the first 5 min of time delay between an aircraft and a spaceborne lidar observation in their analysis of the global net radiative effect of embedded contrails.
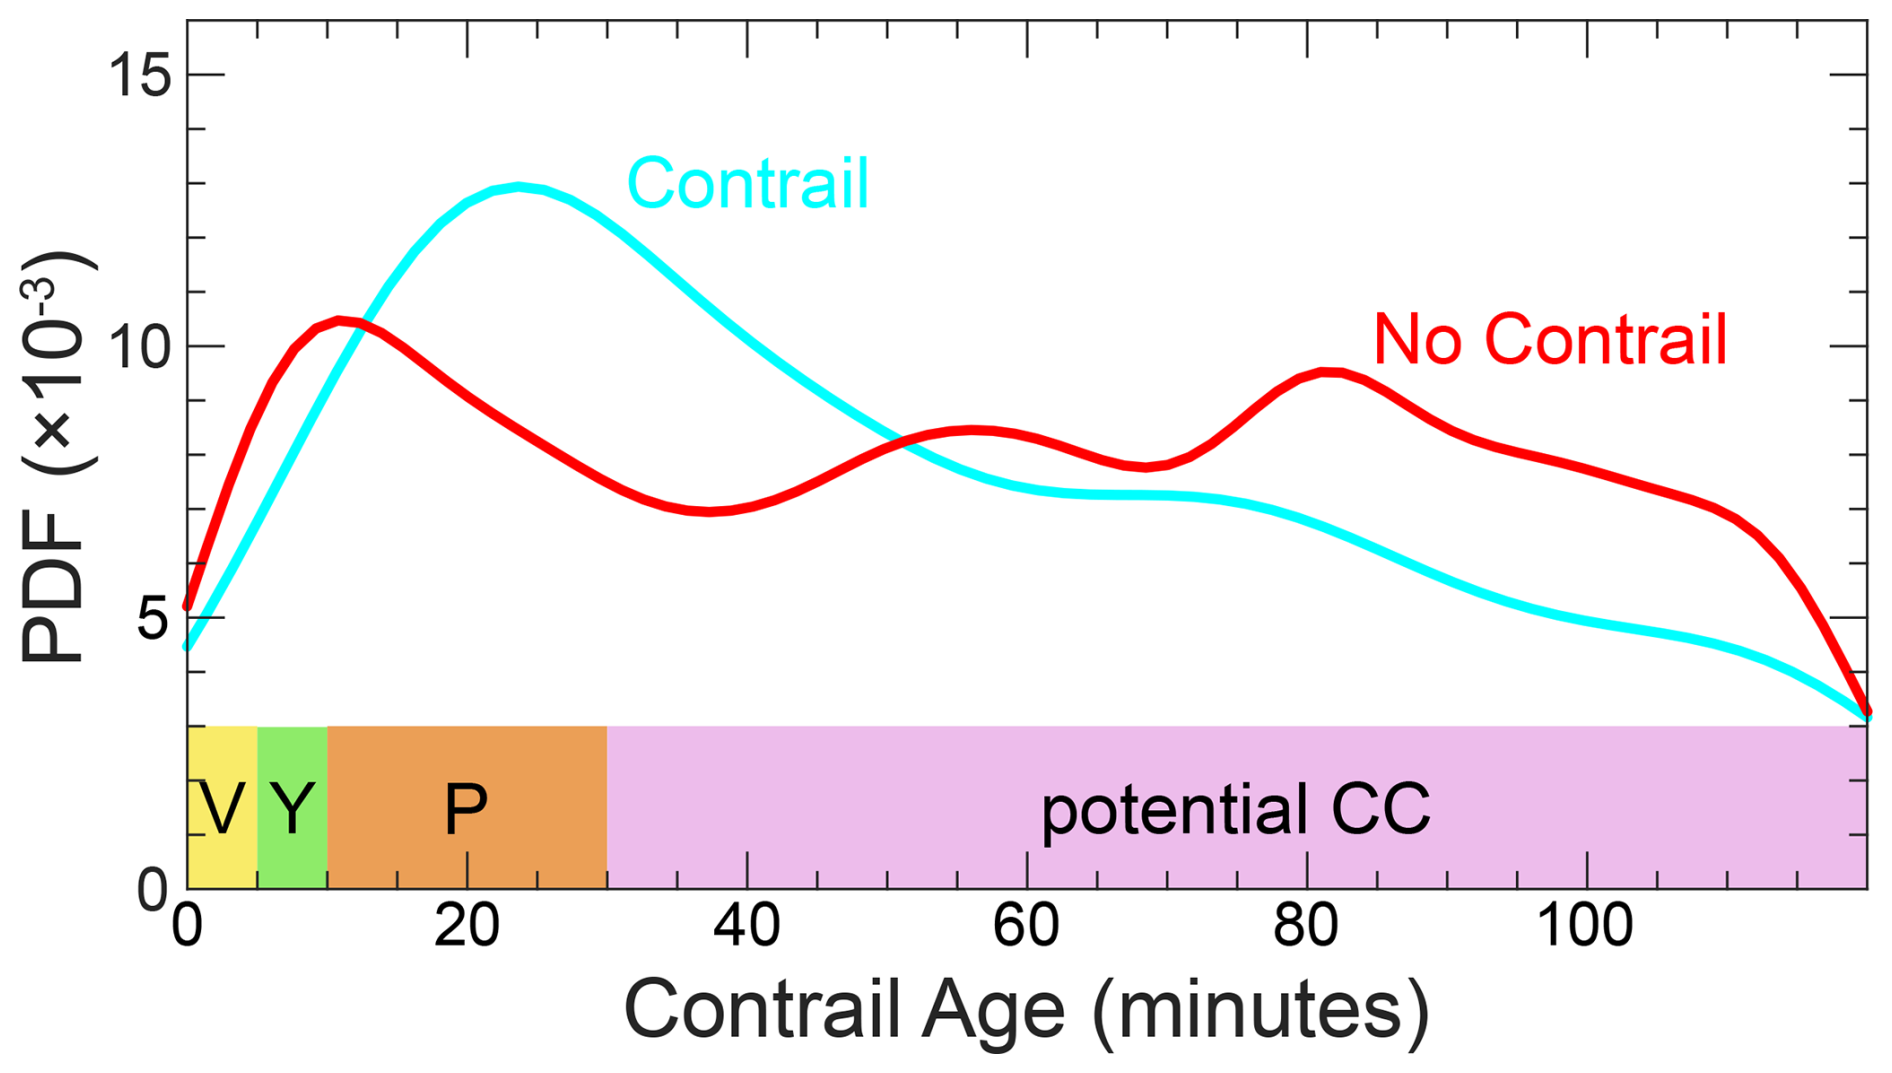
Figure 11Probability density functions (PDFs) of the time delay between the passage of an aircraft through a cirrus cloud and the WALES lidar observation as a measure of contrail age. Data refer to the circles in Figs. 9 and 10 but for all WALES observations during ML-CIRRUS and CIRRUS-HL (see also Table 2). The colored bars mark different stages of the contrail life cycle: vortex phase (V, yellow), young contrails (Y, green), persistent contrails (P, orange), and potential contrail cirrus (potential CC, magenta) that can form when persistent contrails are spread out spatially as a result of wind shear.
We have combined airborne WALES lidar observations during ML-CIRRUS and CIRRUS-HL with commercially available aircraft-position data and ERA5 reanalysis wind fields to (i) develop a method for identifying in-cloud features that are likely to represent contrails that are embedded in already existing cirrus clouds and (ii) evaluate the performance of the feature masking. A two-step method for detection of cirrus perturbations has been developed based on WALES lidar observations during ML-CIRRUS. In the first step, perturbed cloud regions are identified as showing values of β > 4 Mm−1 sr−1 and δ < 0.30 for clean clouds or δ < 0.43 for polluted clouds as defined by Urbanek et al. (2018). In the second step, identified areas of perturbed cloud are screened for their size to dismiss signal noise (perturbed areas smaller than 10 pixels) and homogenous features (perturbed areas larger than 50 pixels) that are not in line with the underlying assumption that a contrail affects a small region of the cloud.
The observations during CIRRUS-HL are used for assessing the output of the feature masking through comparison to a manual analysis of aircraft-track intercepts. We generally find a better performance of the feature masking during low-PLDR conditions, i.e., for cirrus clouds that have not already encountered earlier perturbations. Although the feature mask overestimates the number of objects, the factor of four compared to embedded contrails from by-eye inspection remains consistent across both ML-CIRRUS and CIRRUS-HL datasets, indicating a stable, first-order approximation of the detection error. It is important to note that, in terms of the optical signal, false positives cannot be distinguished from actual embedded contrails, as defined in step one of our mask. They thus represent contrail-perturbation-like objects rather than unambiguously detected embedded contrail. An increase in the lower size limit for object detection could close the gap in the number of detected features and verified contrails. However, features larger than 10 pixels are unlikely to be purely noise-related and are for now maintained in the subsequent analysis of the properties of embedded contrails due to their optical similarity to those features.
For high-PLDR conditions, the wider range of accepted δ values used for feature detection directly contributes to the observed overestimation of contrail object occurrence. Such polluted cirrus conditions were rare during CIRRUS-HL, which was conducted in summer, consistent with the findings that cirrus clouds in summer generally exhibit lower PLDR values (Li and Groß, 2022) and that aviation-induced changes in cirrus clouds are seasonally dependent (Schumann and Seifert, 2025). Furthermore, Freudenthaler et al. (1996) showed that PLDR values in contrails increase with age and depend strongly on ambient temperature: at temperatures ≤ −60 °C, PLDR increases from about 0.1 to 0.5 as contrails age, while at warmer temperatures of around −50 °C, even the youngest contrails can reach PLDR values of 0.5. Overall, the detection of perturbation features depends on the variability in the considered lidar parameters related to the age and ambient conditions of the contrails. The analysis of WALES measurements during other HALO campaigns will improve the performance of the feature mask, especially under high PLDR conditions.
The difference in the number of verified embedded contrail and detected cirrus perturbations may depend on various factors. It largely relies on the thresholds and feature-size limits, the PLDR regime, and the timing of the observations. The latter might constrain the underlying meteorological conditions such as upper-tropospheric temperature and ice-supersaturation, which are associated with jets, fronts and storm tracks near the tropopause (Wolf et al., 2023, 2024).
The purpose of developing the contrail feature mask presented here is to enable the detection of embedded contrails solely for WALES measurements of β and δ without the need for auxiliary information on the position of other aircraft, which might be proprietary and not readily available. In future work, such identified embedded contrails will then be investigated for their macro- and microphysical properties based on synergetic lidar-radar observations (Delanoë and Hogan, 2008; Ewald et al., 2021) to gain further small-scale insight on how local cirrus properties are affected by passing aircraft.
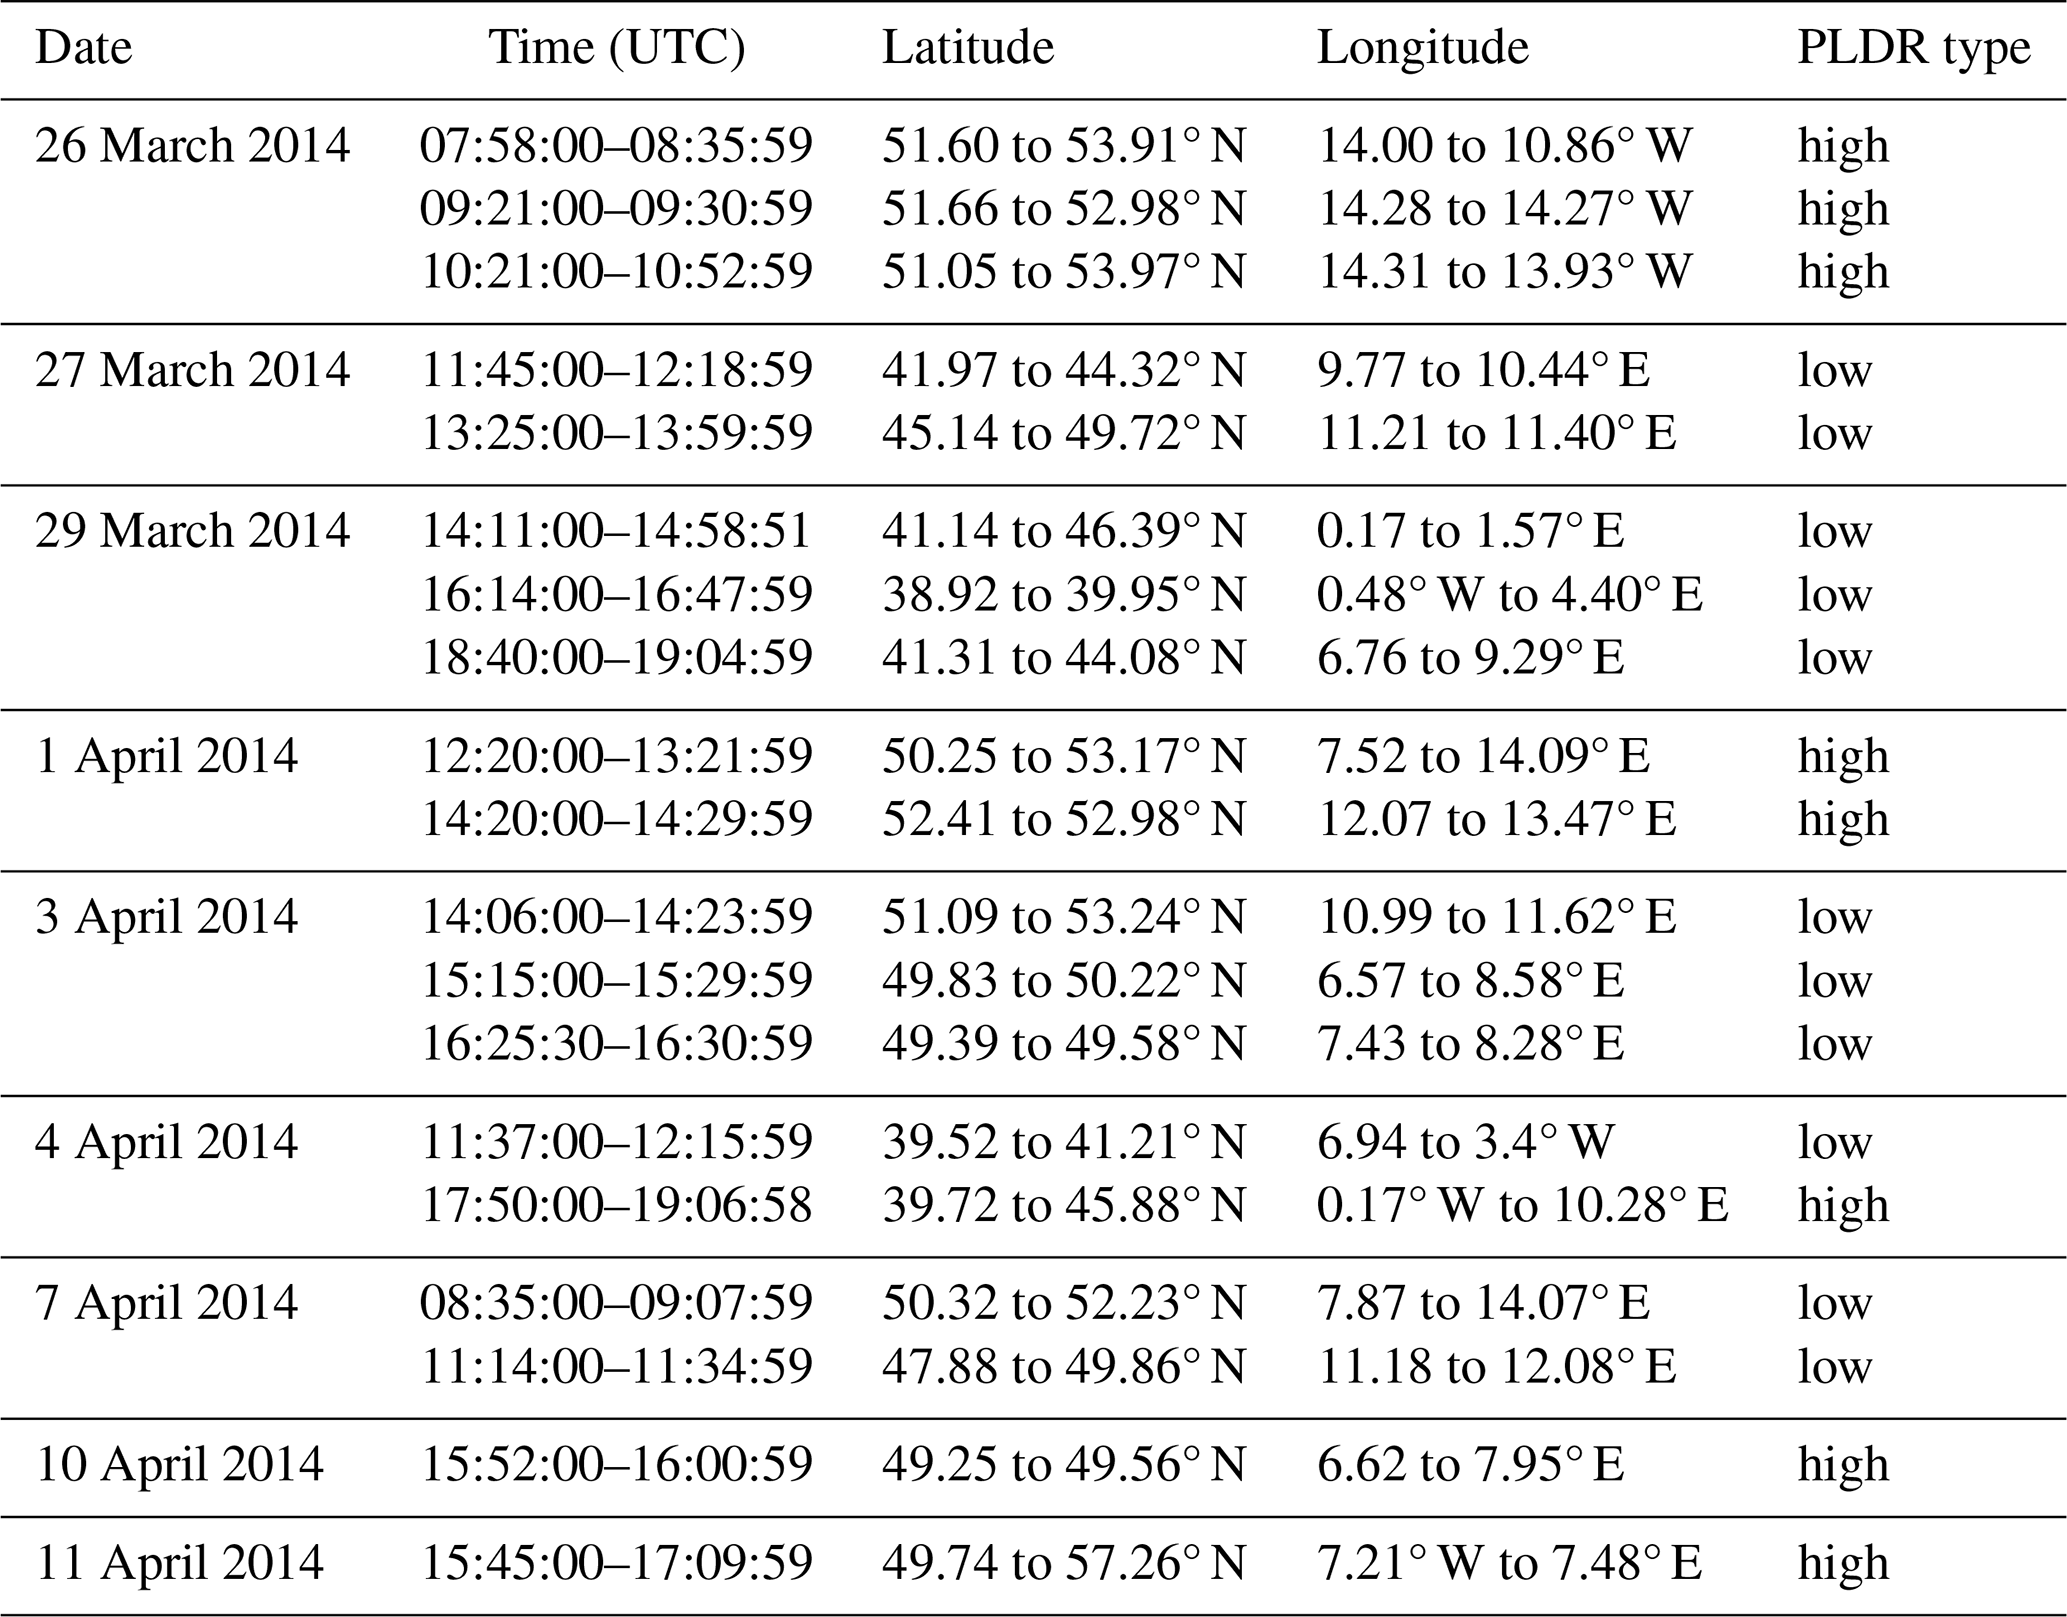
This section provides additional details on the analysis of WALES observations during ML-CIRRUS at the locations shown in the left panel of Fig. 1. Table A1 provides details on the timing and location of those segments as well as their classification according to high and low PLDR cirrus as presented in Urbanek et al. (2018).
Figure A1 presents the statistics related to the identified aircraft-HALO matches and how those change when considering the successive screening steps listed in Table 2, i.e., intercept points for all matched points, in-cloud points, and confirmed embedded contrails. All results are reported with a 95 % confidence level. Median and mean time delays are similar for all matched and in-cloud points (∼ 0.98–0.99 and ∼ 0.97 h, respectively), whereas embedded contrails exhibit shorter delays (median 0.77 h, mean 0.88 h), with most occurring within the first 30 min. Displacements are markedly larger for embedded contrails (median 5.73 km, mean 19.95 km) compared with matched points (median 0.14 km, mean 2.88 km), primarily within 25–50 km. The wind speed distributions, with medians around 15 m s−1 and means near 19 m s−1 across all categories, indicate similar wind conditions for the cases at different screening levels. The flight levels of all matched (median 10.67 km, mean 10.47 km) are slightly higher than that of verified embedded contrails (median 10.06 km, mean 9.86 km). Overall, the cases of verified embedded contrails present statistics that are very similar to those of all matches.
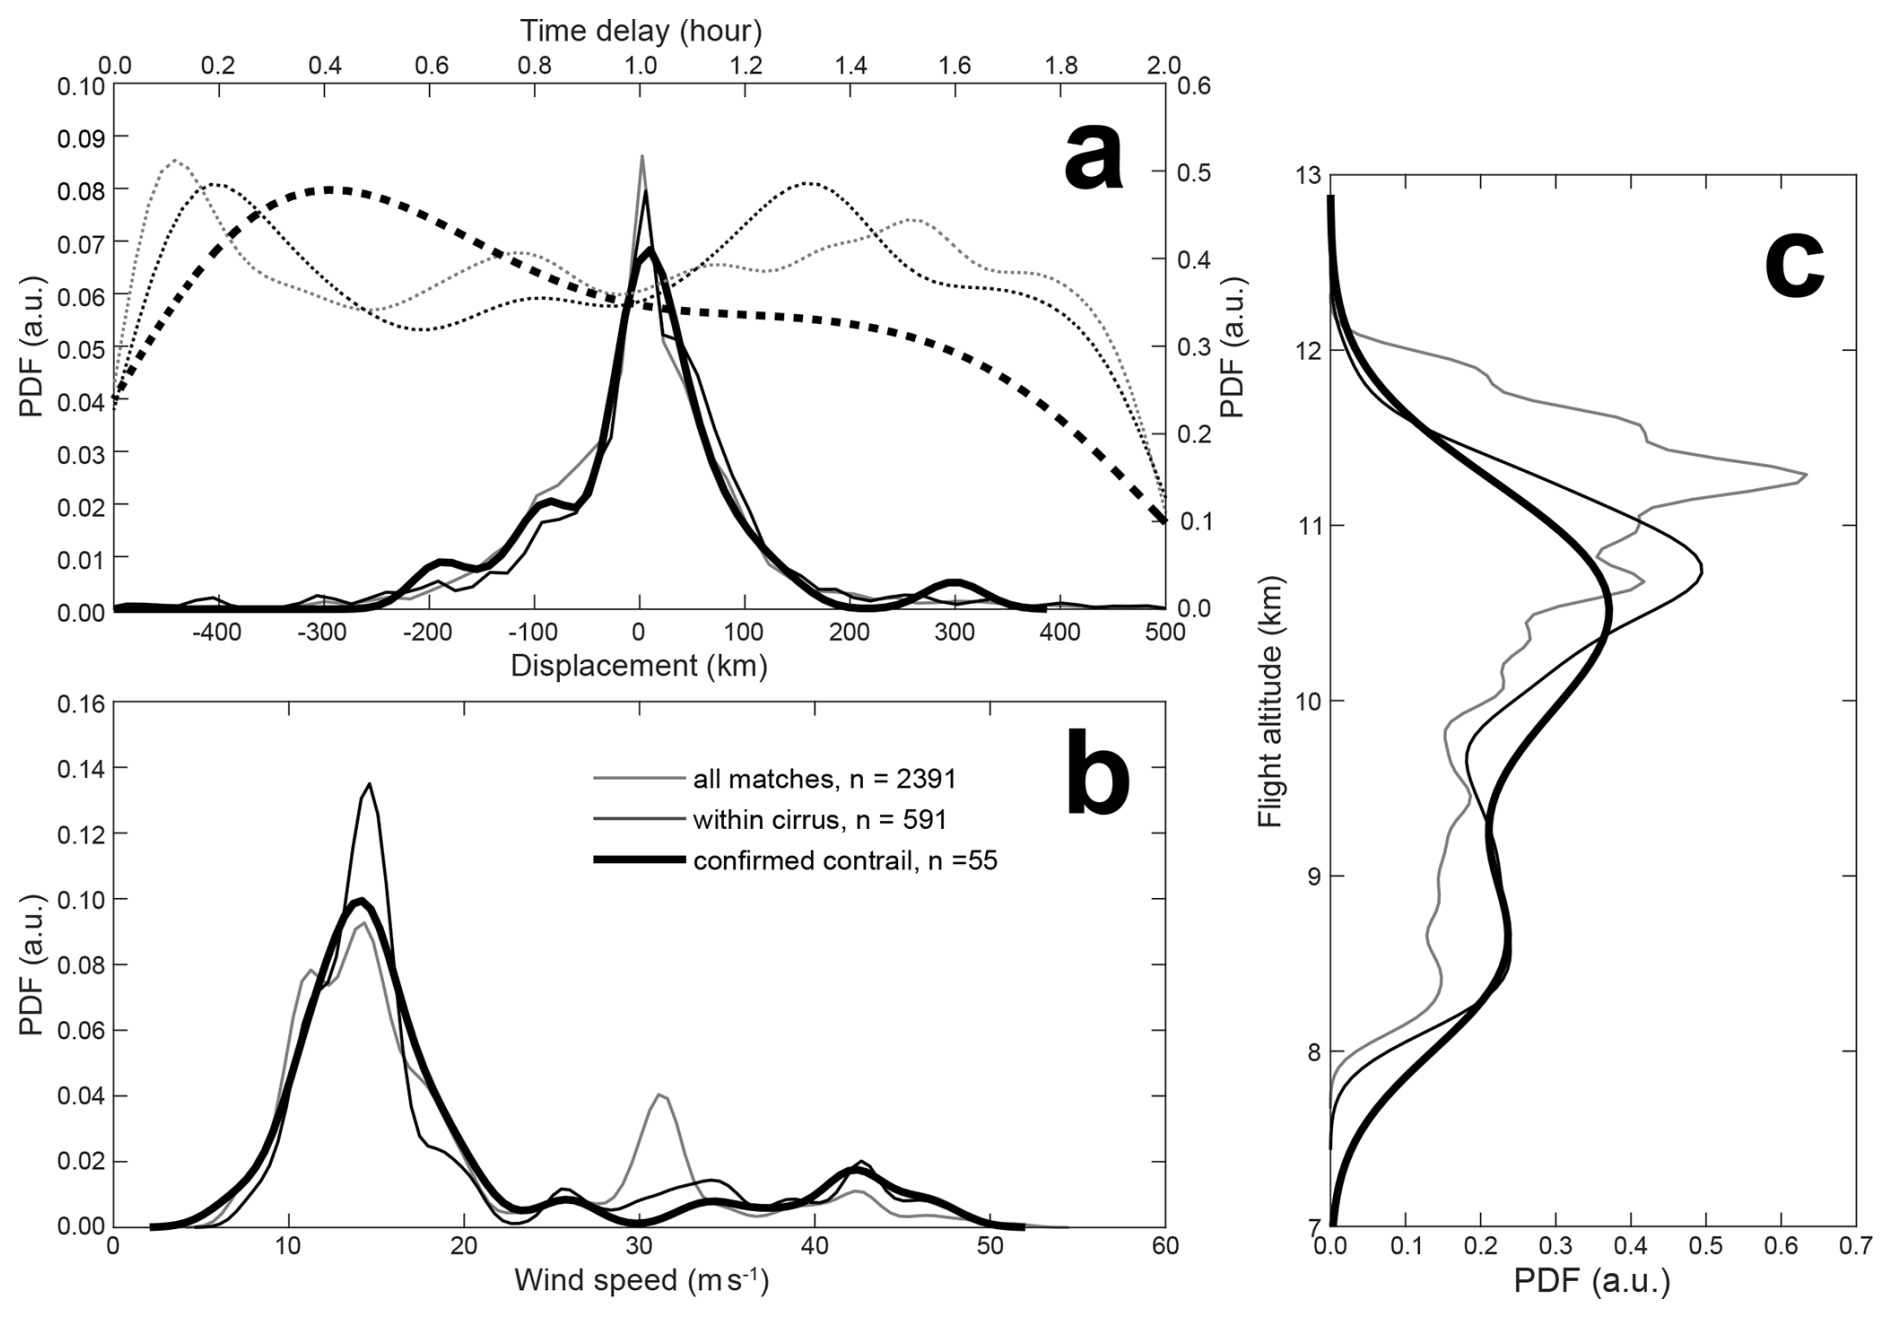
Figure A1Probability density functions (PDFs, in arbitrary units) of the occurrence of different aircraft-HALO intercept cases (all: thin gray lines, within cirrus: thin black lines, and confirmed contrail: bold black lines) during ML-CIRRUS (see Table 2) with respect to (a) time delay (dotted) and corresponding displacement (solid), (b) wind speed at flight altitude, and (c) flight altitude.
Table A1Timing and location of segments with WALES lidar observations of cirrus clouds during ML-CIRRUS. The last column gives the classification according to low PLDR or high PLDR cirrus as identified in Urbanek et al. (2018).
This section provides additional details on the analysis of WALES observations during CIRRUS-HL at the locations shown in the right panel of Fig. 1. Table B1 provides details on the timing and location of those segments as well as their classification according to high and low PLDR cirrus as inferred in the framework of this study by following Urbanek et al. (2018).
Consistent with the format of Fig. A1, Fig. B1 presents the distributions of time delay, displacement, wind speed, and flight level for the three point categories. The analysis reveals key distinctions. The time delay for embedded contrails is markedly shorter (median: 0.71 h, mean: 0.82 h) and skewed towards lower values (0.4–0.8 h) compared to all matched points (median: 0.94 h, mean: 0.95 h) and in-cloud points (median/mean: ∼ 0.92 h), which are similar. The displacement shows a more complex relationship. While the mean displacement is larger for embedded contrails (11.26 km) than for all matches (9.35 km), their median displacement is smaller (1.97 km vs. 3.92 km). This indicates that while most embedded contrails are detected closer to their source point, the distribution has a longer tail, featuring a subset of points with very large displacements, primarily concentrated within the 25–50 km range as in the ML-CIRRUS case. In contrast, wind speed distributions are consistent across all categories (medians ∼ 20.41 m s−1, means ∼ 31.65 m s−1), indicating similar large-scale wind conditions. The median flight level for all matched points (10.68 km) is slightly higher than that of verified embedded contrails (9.99 km).
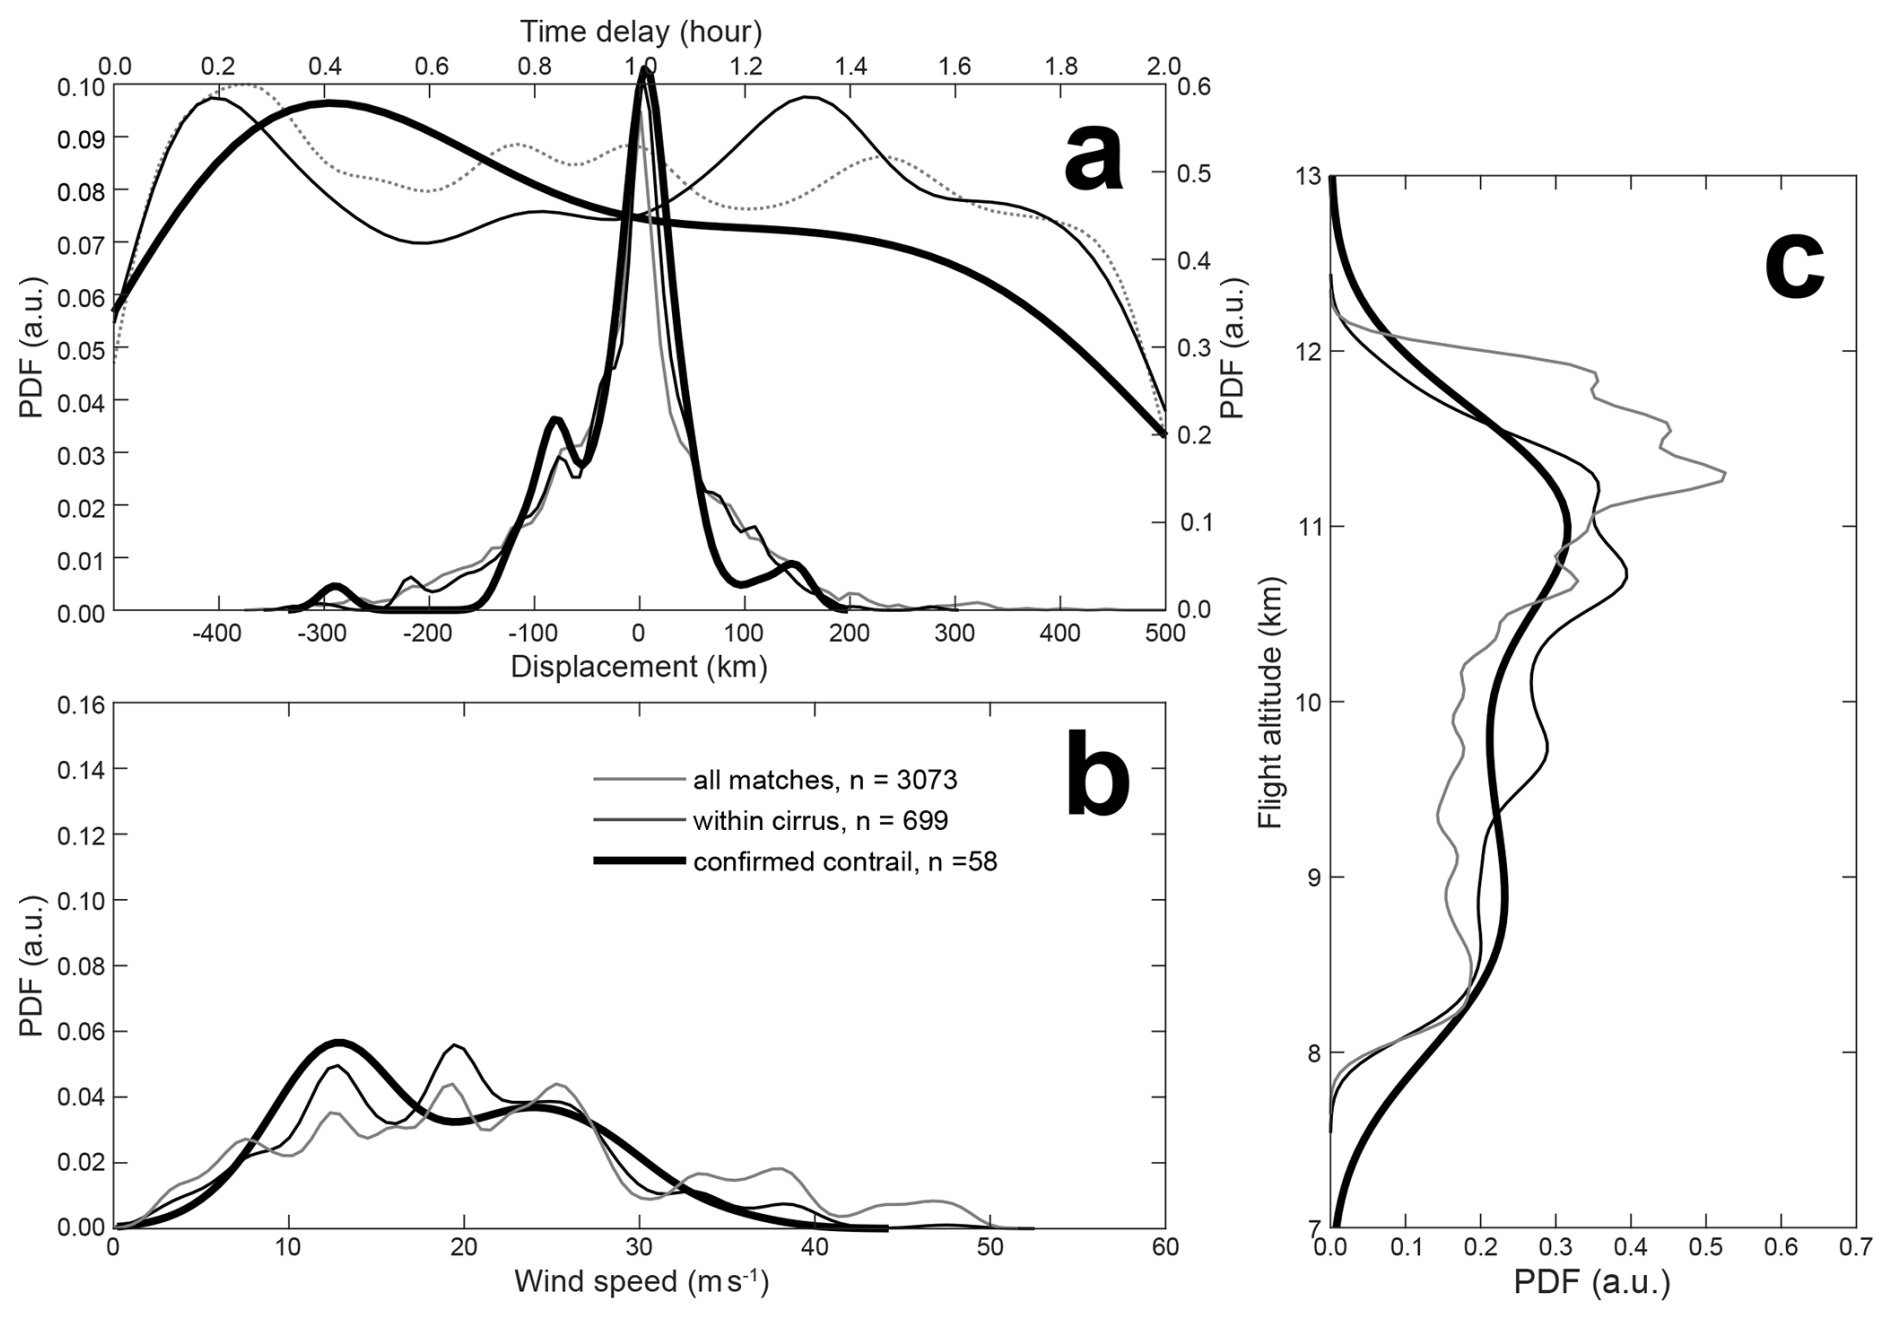
Figure B1Probability density functions (PDFs, in arbitrary units) of the occurrence of different aircraft-HALO intercept cases (all: thin gray lines, within cirrus: thin black lines, and confirmed contrail: bold black lines) during CIRRUS-HL (see Table 2) with respect to (a) time delay (dotted) and corresponding displacement (solid), (b) wind speed at flight altitude, and (c) flight altitude.
Overall, despite the difference in time delay and their displacement, the broader statistical properties of verified embedded contrails remain similar to those of all matches.
Table B1Same as Table A1 but for observations during CIRRUS-HL. Note that the classification according to PLDR regime has been performed in the framework of this study.
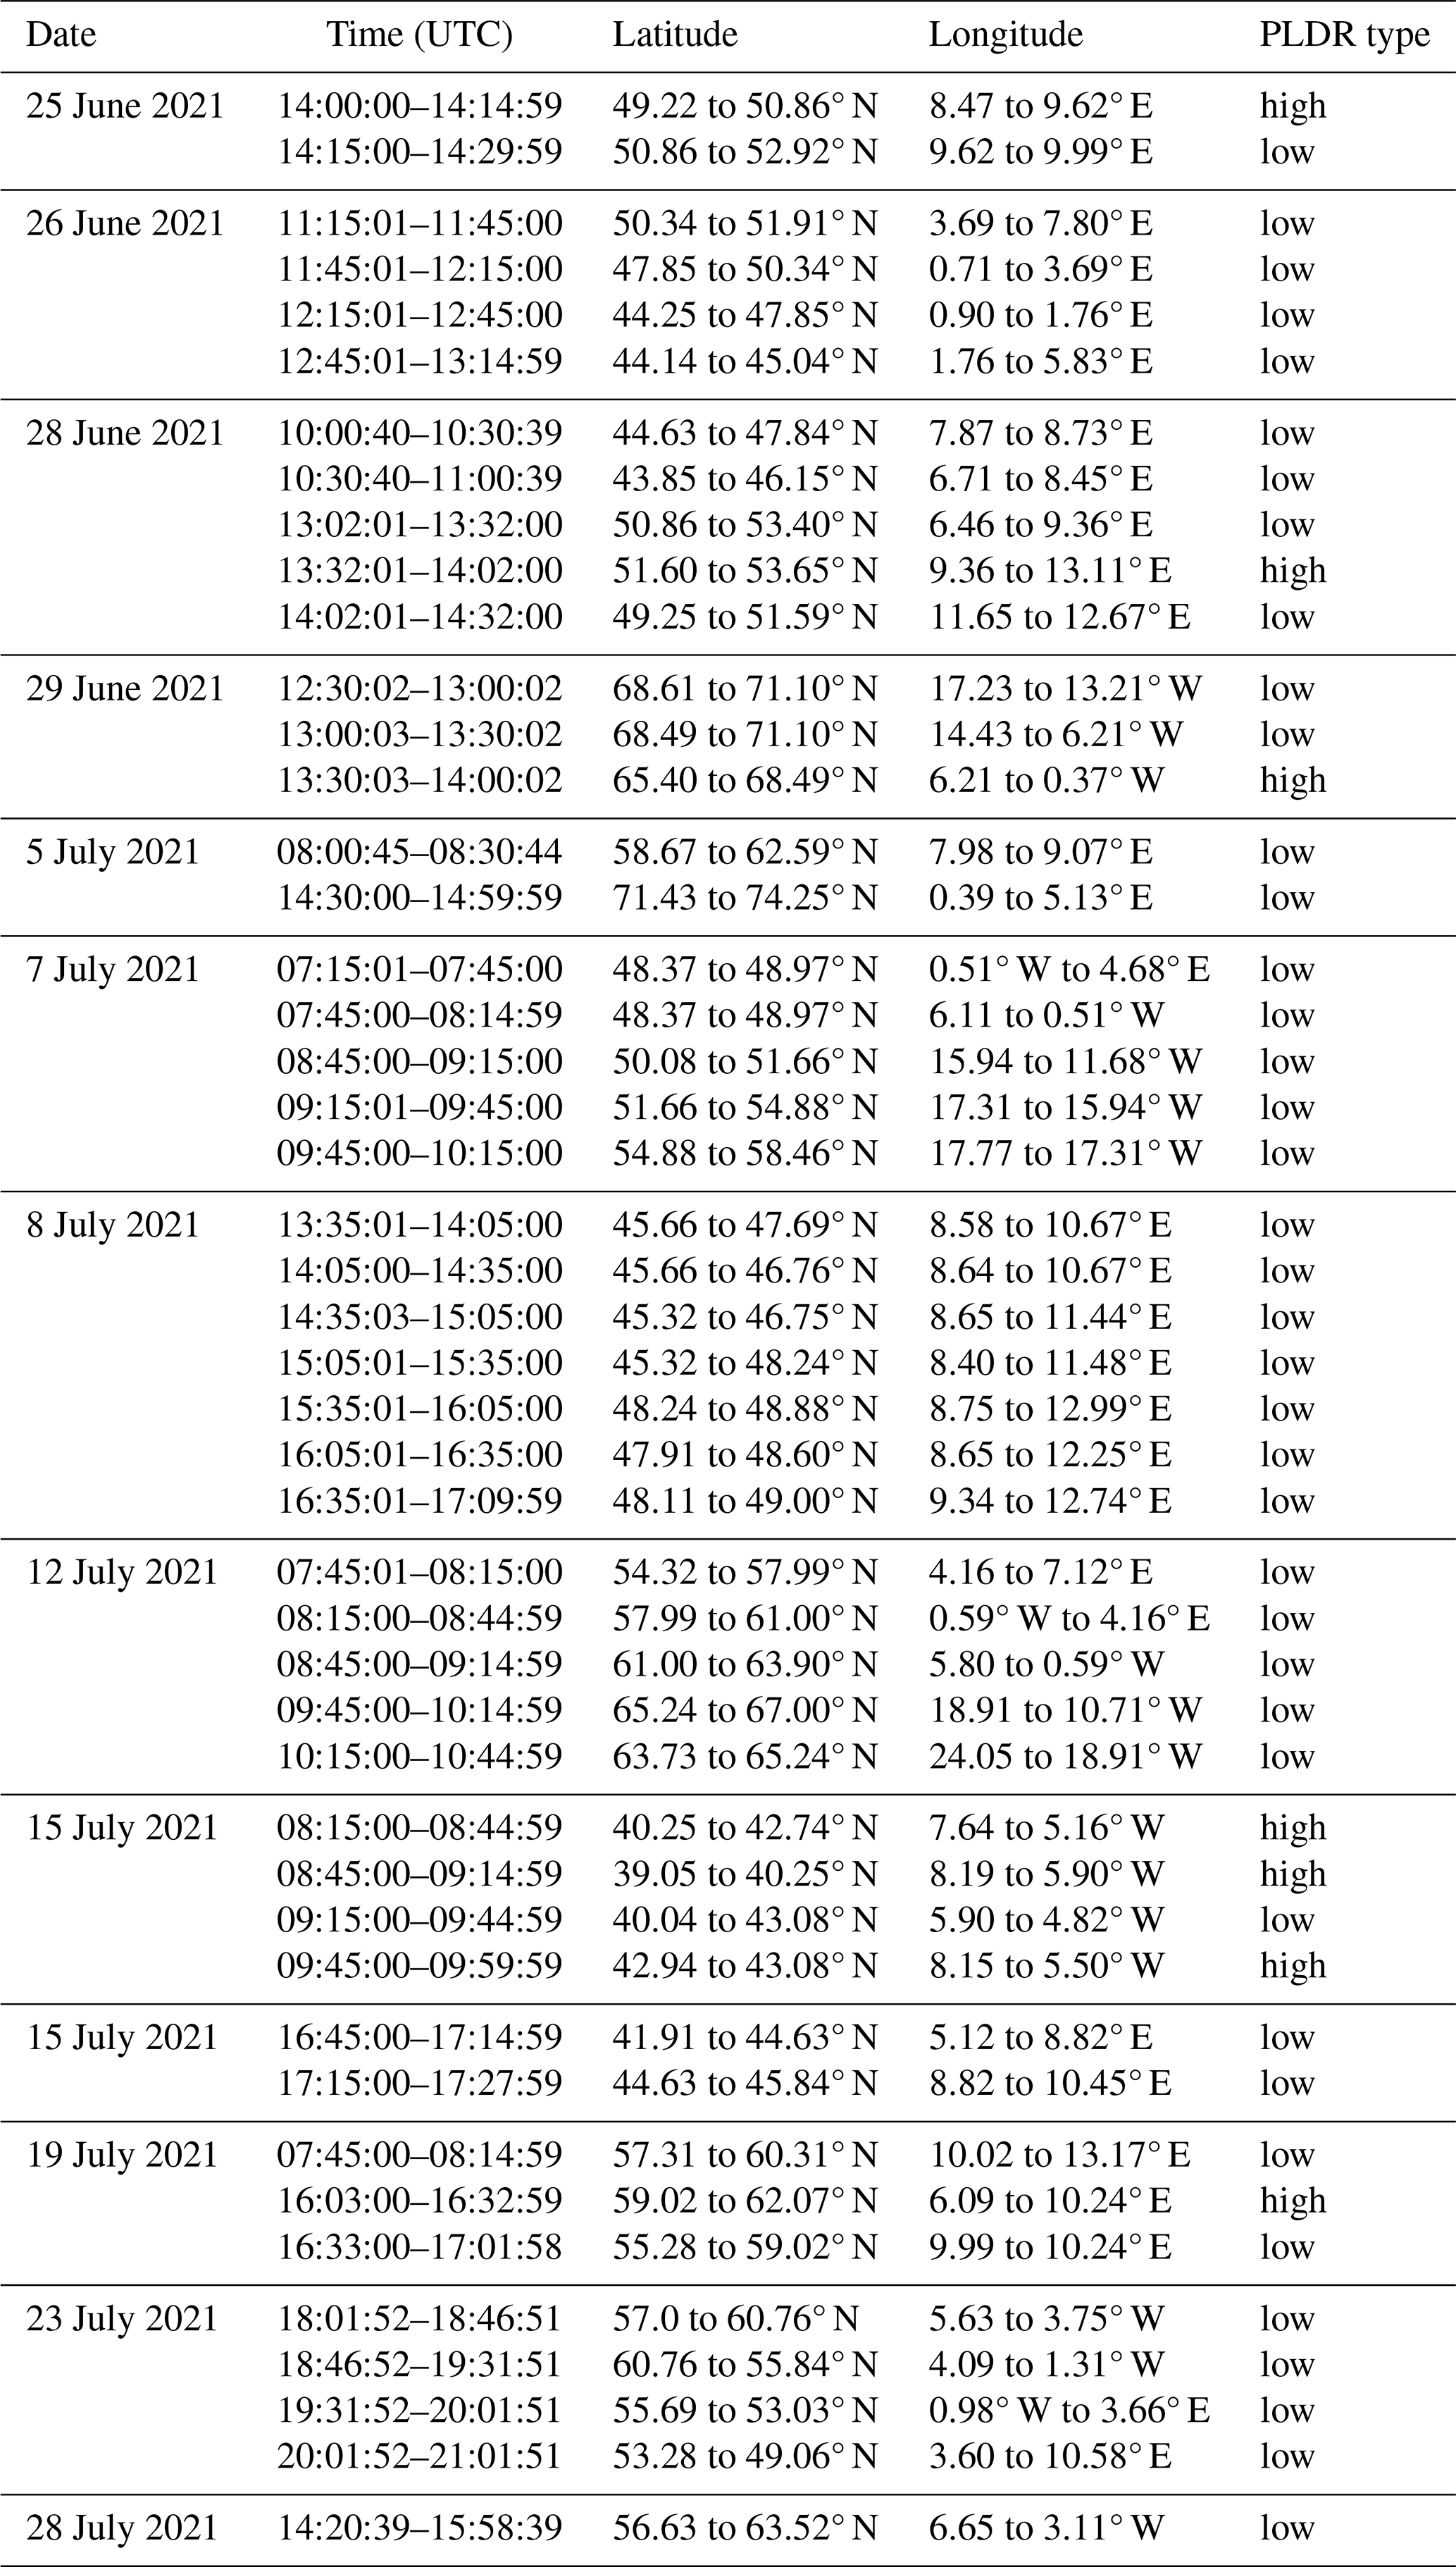
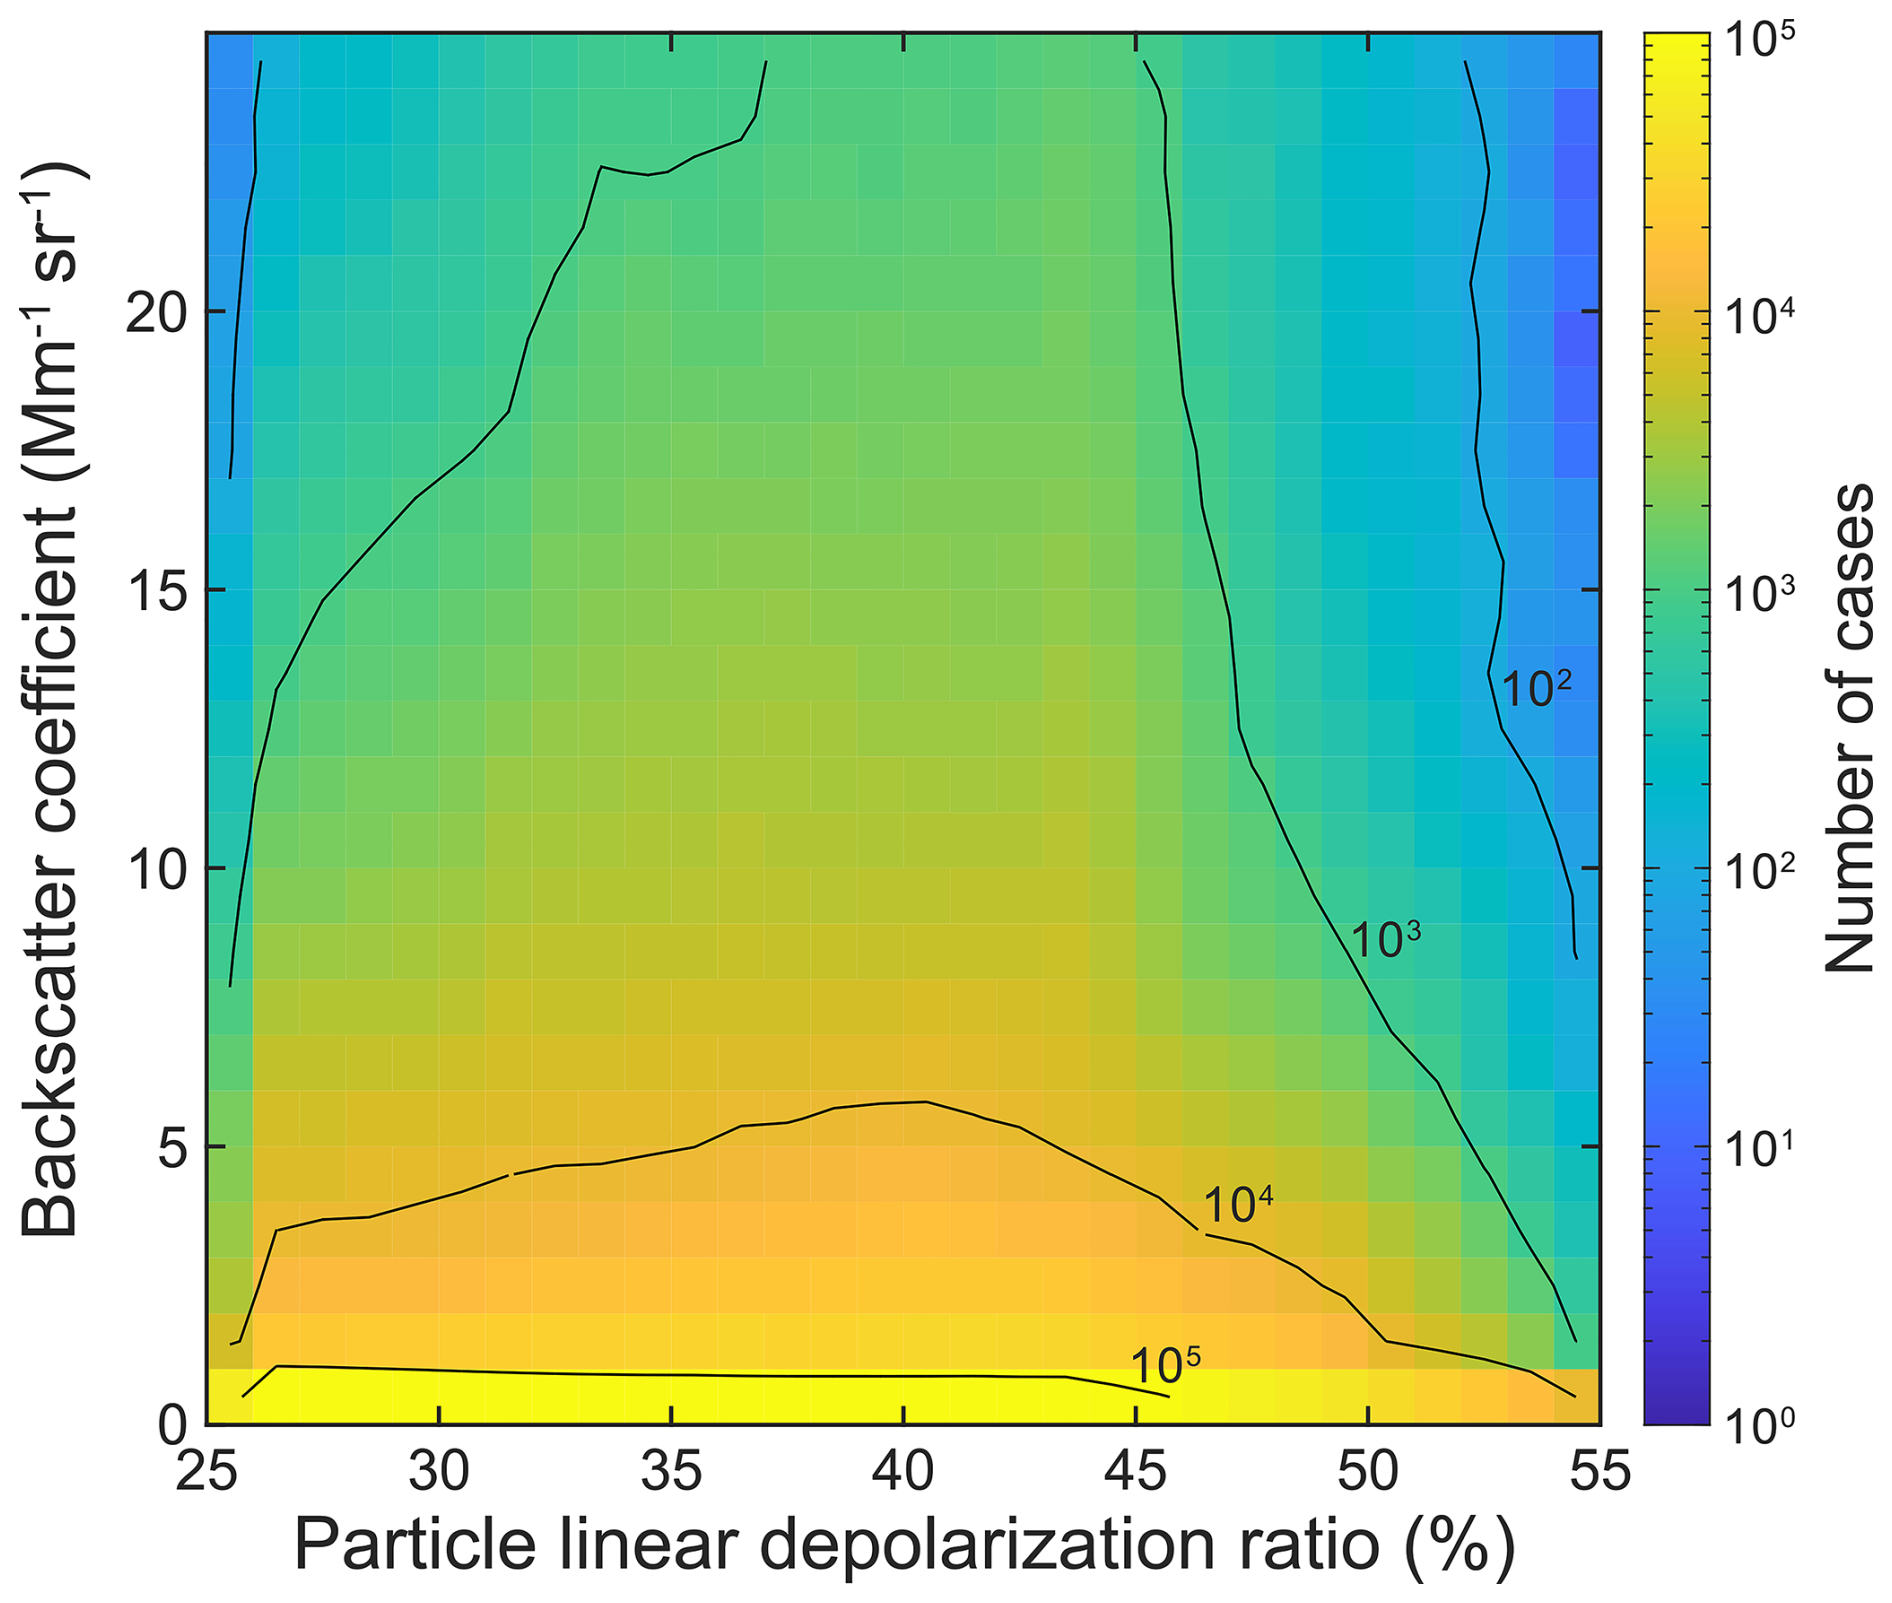
Figure B22d histogram of particle backscatter coefficient (β) and particle linear depolarization ratio (δ) for the WALES cirrus observations during CIRRUS-HL.
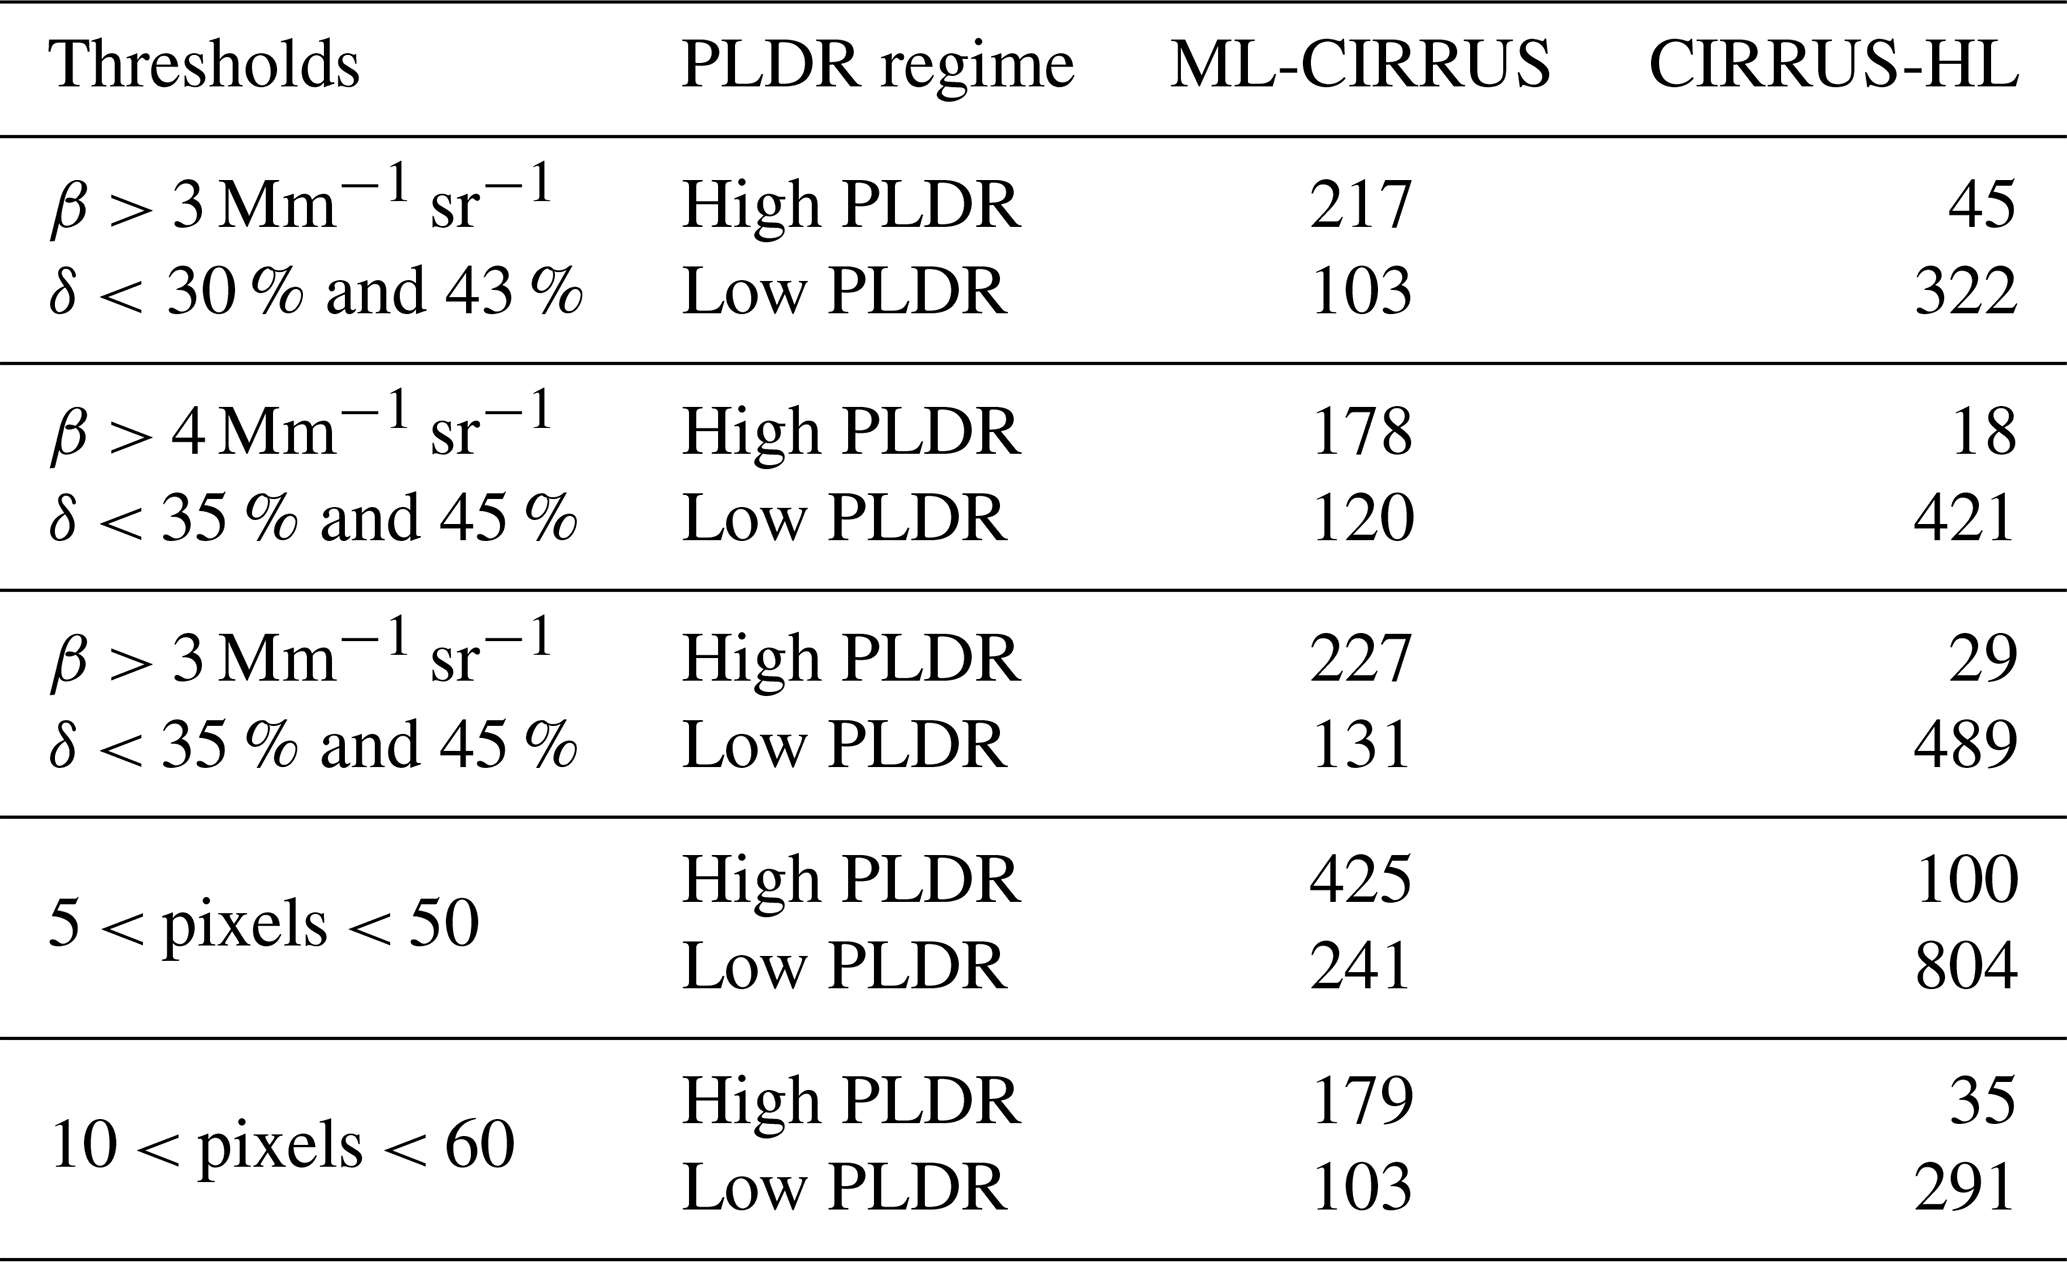
The impact of the choice of threshold values on the automated objects detection as well as of the feature size limits compared to the results in Table 3, is presented in Table C1. The largest increase in the number of detected features is related to lowering the lower size for object detection. This is in line with our intention to screen out noise-related false positives. In contrast, the effect of a 10-pixel increase of the upper size limit is lower than 10 %. The number of detected features also increases when lowering β. However, the impact of increasing δ is more drastic, which highlights the need for proper identification of the governing PLDR regime.
Table C1Contrail object detection as in Table 3 but for a lower threshold of β (first block), higher thresholds of δ (second block), or both (third block) as well as for expanding feature size to smaller (fourth block) and larger (fifth block) areas.
The WALES lidar observations used in this study are available in the HALO database at https://halo-db.pa.op.dlr.de/data_source/99 (last access: 19 May 2026). ERA5 winds have been obtained from ECMWF at https://cds.climate.copernicus.eu/datasets/reanalysis-era5-pressure-levels?tab=overview (last access: 19 May 2026). Flight-track data have been procured by the authors from https://www.flightradar24.com (last access: 19 May 2026) and are available upon reasonable request.
MT conceived this study and acquired the funding. MS lead the method development and analyzed the data under the guidance of MT, TS, and SG. All authors contributed to the discussion of the findings and the preparation of the manuscript.
The contact author has declared that none of the authors has any competing interests.
Publisher's note: Copernicus Publications remains neutral with regard to jurisdictional claims made in the text, published maps, institutional affiliations, or any other geographical representation in this paper. The authors bear the ultimate responsibility for providing appropriate place names. Views expressed in the text are those of the authors and do not necessarily reflect the views of the publisher.
This research has been supported by the Deutsche Forschungsgemeinschaft (DFG; grant no. 520829878).
This paper was edited by Alyn Lambert and reviewed by Andreas Petzold and two anonymous referees.
Bock, L. and Burkhardt, U.: Contrail cirrus radiative forcing for future air traffic, Atmos. Chem. Phys., 19, 8163–8174, https://doi.org/10.5194/acp-19-8163-2019, 2019. a, b
Boucher, O.: Air traffic may increase cirrus cloudiness, Nature, 397, 30–31, https://doi.org/10.1038/16169, 1999. a
Bräuer, P. and Tesche, M.: TrackMatcher – a tool for finding intercepts in tracks of geographical positions, Geosci. Model Dev., 15, 7557–7572, https://doi.org/10.5194/gmd-15-7557-2022, 2022. a
Burkhardt, U. and Kärcher, B.: Global radiative forcing from contrail cirrus, Nat. Clim. Change, 1, 54–58, https://doi.org/10.1038/nclimate1068, 2011. a
Delanoë, J. and Hogan, R. J.: A variational scheme for retrieving ice cloud properties from combined radar, lidar, and infrared radiometer, J. Geophys. Res.-Atmos., 113, https://doi.org/10.1029/2007JD009000, 2008. a
Duda, D. P., Minnis, P., Khlopenkov, K., Chee, T. L., and Boeke, R.: Estimation of 2006 Northern Hemisphere contrail coverage using MODIS data, Geophys. Res. Lett., 40, 612–617, https://doi.org/10.1002/grl.50097, 2013. a
Duda, D. P., Bedka, S. T., Minnis, P., Spangenberg, D., Khlopenkov, K., Chee, T., and Smith Jr., W. L.: Northern Hemisphere contrail properties derived from Terra and Aqua MODIS data for 2006 and 2012, Atmos. Chem. Phys., 19, 5313–5330, https://doi.org/10.5194/acp-19-5313-2019, 2019. a
Esselborn, M., Wirth, M., Fix, A., Tesche, M., and Ehret, G.: Airborne high spectral resolution lidar for measuring aerosol extinction and backscatter coefficients, Appl. Optics, 47, 346–358, https://doi.org/10.1364/AO.47.000346, 2008. a
Ewald, F., Groß, S., Wirth, M., Delanoë, J., Fox, S., and Mayer, B.: Why we need radar, lidar, and solar radiance observations to constrain ice cloud microphysics, Atmos. Meas. Tech., 14, 5029–5047, https://doi.org/10.5194/amt-14-5029-2021, 2021. a
Freudenthaler, V., Homburg, F., and Jäger, H.: Optical parameters of contrails from lidar measurements: Linear depolarization, Geophys. Res. Lett., 23, 3715–3718, https://doi.org/10.1029/96GL03646, 1996. a, b
Freudenthaler, V., Esselborn, M., Wiegner, M., Heese, B., Tesche, M., Ansmann, A., Müller, D., Althausen, D., Wirth, M., Fix, A., Ehret, G., Knippertz, P., Toledano, C., Gasteiger, J., Garhammer, M., and Seefeldner, M.: Depolarization ratio profiling at several wavelengths in pure Saharan dust during SAMUM 2006, Tellus B, 61, 165–179, https://doi.org/10.1111/j.1600-0889.2008.00396.x, 2009. a
Gettelman, A. and Chen, C.: The climate impact of aviation aerosols, Geophys. Res. Lett., 40, 2785–2789, https://doi.org/10.1002/grl.50520, 2013. a
Gierens, K.: Selected topics on the interaction between cirrus clouds and embedded contrails, Atmos. Chem. Phys., 12, 11943–11949, https://doi.org/10.5194/acp-12-11943-2012, 2012. a, b, c, d, e
Groß, S., Wirth, M., Schäfler, A., Fix, A., Kaufmann, S., and Voigt, C.: Potential of airborne lidar measurements for cirrus cloud studies, Atmos. Meas. Tech., 7, 2745–2755, https://doi.org/10.5194/amt-7-2745-2014, 2014. a
Hersbach, H., Bell, B., Berrisford, P., Hirahara, S., Horányi, A., Muñoz-Sabater, J., Nicolas, J., Peubey, C., Radu, R., Schepers, D., Simmons, A., Soci, C., Abdalla, S., Abellan, X., Balsamo, G., Bechtold, P., Biavati, G., Bidlot, J., Bonavita, M., De Chiara, G., Dahlgren, P., Dee, D., Diamantakis, M., Dragani, R., Flemming, J., Forbes, R., Fuentes, M., Geer, A., Haimberger, L., Healy, S., Hogan, R. J., Hólm, E., Janisková, M., Keeley, S., Laloyaux, P., Lopez, P., Lupu, C., Radnoti, G., de Rosnay, P., Rozum, I., Vamborg, F., Villaume, S., and Thépaut, J.-N.: The ERA5 global reanalysis, Q. J. Roy. Meteor. Soc., 146, 1999–2049, https://doi.org/10.1002/qj.3803, 2020. a
Heymsfield, A. J., Krämer, M., Luebke, A., Brown, P., Cziczo, D. J., Franklin, C., Lawson, P., Lohmann, U., McFarquhar, G., Ulanowski, Z., and Van Tricht, K.: Cirrus Clouds, Meteor. Mon., 58, 2.1–2.26, https://doi.org/10.1175/AMSMONOGRAPHS-D-16-0010.1, 2017. a
Jurkat-Witschas, T., Voigt, C., Groß, S., Kaufmann, S., Sauer, D., la Torre Castro, E. D., Krämer, M., Schäfler, A., Afchine, A., Attinger, R., Garcia, I. B., Beer, C. G., Bugliaro, L., Clemen, H.-C., Dekoutsidis, G., Ehrlich, A., Grawe, S., Hahn, V., Hendricks, J., Järvinen, E., Thomas, K., Krüger, K., Ovid, K., Lucke, J., Luebke, A. E., Marsing, A., Mayer, B., Mayer, J., Mertes, S., Moser, M., Müller, H., Nenakhov, V., Pöhlker, M., Pöschl, U., Pörtge, V., Rautenhaus, M., Righi, M., Röttenbacher, J., Rubin-Zuzic, M., Schaefer, J., Schnaiter, M., Schneider, J., Schumann, U., Spelten, N., Stratmann, F., Tomsche, L., Wagner, S., Wang, Z., Weber, A., Wendisch, M., Wernli, H., Wetzel, B., Wirth, M., Zahn, A., Ziereis, H., and Zöger, M.: CIRRUS-HL: Picturing High- and Midlatitude Summer Cirrus and Contrail Cirrus above Europe with Airborne Measurements aboard the Research Aircraft HALO, B. Am. Meteorol. Soc., 106, E2300–E2327, https://doi.org/10.1175/BAMS-D-23-0270.1, 2025. a, b, c
Kärcher, B.: Cirrus clouds and their response to anthropogenic activities, Current Climate Change Reports, 3, 45–57, https://doi.org/10.1007/s40641-017-0060-3, 2017. a
Lee, D. S., Fahey, D. W., Forster, P. M., Newton, P. J., Wit, R. C., Lim, L. L., Owen, B., and Sausen, R.: Aviation and global climate change in the 21st century, Atmos. Environ., 43, 3520–3537, https://doi.org/10.1016/j.atmosenv.2009.04.024, 2009. a
Lee, D. S., Fahey, D. W., Skowron, A., Allen, M. R., Burkhardt, U., Chen, Q., Doherty, S. J., Freeman, S., Forster, P. M., Fuglestvedt, J., Gettelman, A., De León, R. R., Lim, L. L., Lund, M. T., Millar, R. J., Owen, B., Penner, J. E., Pitari, G., Prather, M. J., Sausen, R., and Wilcox, L. J.: The contribution of global aviation to anthropogenic climate forcing for 2000 to 2018, Atmos. Environ., 244, 117834, https://doi.org/10.1016/j.atmosenv.2020.117834, 2021. a, b
Li, Q. and Groß, S.: Satellite observations of seasonality and long-term trends in cirrus cloud properties over Europe: investigation of possible aviation impacts, Atmos. Chem. Phys., 22, 15963–15980, https://doi.org/10.5194/acp-22-15963-2022, 2022. a, b
Marjani, S., Tesche, M., Bräuer, P., Sourdeval, O., and Quaas, J.: Satellite observations of the impact of individual aircraft on ice crystal number in thin cirrus clouds, Geophys. Res. Lett., 49, e2021GL096173, https://doi.org/10.1029/2021GL096173, 2022. a, b, c
Marjani, S., Mehrdad, S., and Quaas, J.: Investigating the Development of Persistent Contrails in Ice Supersaturated Regions with Cloudy Backgrounds Using ICON-LEM, EGUsphere [preprint], https://doi.org/10.5194/egusphere-2025-1847, 2025. a
Minnis, P., Schumann, U., Doelling, D. R., Gierens, K. M., and Fahey, D. W.: Global distribution of contrail radiative forcing, Geophys. Res. Lett., 26, 1853–1856, https://doi.org/10.1029/1999GL900358, 1999. a
Minnis, P., Bedka, S. T., Duda, D. P., Bedka, K. M., Chee, T., Ayers, J. K., Palikonda, R., Spangenberg, D. A., Khlopenkov, K. V., and Boeke, R.: Linear contrail and contrail cirrus properties determined from satellite data, Geophys. Res. Lett., 40, 3220–3226, https://doi.org/10.1002/grl.50569, 2013. a
Petzold, A., Khan, N. F., Li, Y., Spichtinger, P., Rohs, S., Crewell, S., Wahner, A., and Krämer, M.: Most long-lived contrails form within cirrus clouds with uncertain climate impact, Nat. Commun., 16, 9695, https://doi.org/10.1038/s41467-025-65532-2, 2025. a, b
Schumann, U.: On conditions for contrail formation from aircraft exhausts, Meteorol. Z., 5, 4–23, https://doi.org/10.1127/metz/5/1996/4, 1996. a
Schumann, U.: Formation, properties and climatic effects of contrails, C. R. Phys., 6, 549–565, https://doi.org/10.1016/j.crhy.2005.05.002, 2005. a
Schumann, U.: A contrail cirrus prediction model, Geosci. Model Dev., 5, 543–580, https://doi.org/10.5194/gmd-5-543-2012, 2012. a
Schumann, U. and Graf, K.: Aviation-induced cirrus and radiation changes at diurnal timescales, J. Geophys. Res.-Atmos., 118, 2404–2421, https://doi.org/10.1002/jgrd.50184, 2013. a, b
Schumann, U. and Heymsfield, A. J.: On the life cycle of individual contrails and contrail cirrus, Meteor. Mon., 3.1–3.24, https://doi.org/10.1175/AMSMONOGRAPHS-D-16-0005.1, 2017. a
Schumann, U. and Seifert, A.: On the Weather Impact of Contrails: New Insights from Coupled ICON–CoCiP Simulations, Atmos. Chem. Phys., 25, 18571–18597, https://doi.org/10.5194/acp-25-18571-2025, 2025. a
Schumann, U., Baumann, R., Baumgardner, D., Bedka, S. T., Duda, D. P., Freudenthaler, V., Gayet, J.-F., Heymsfield, A. J., Minnis, P., Quante, M., Raschke, E., Schlager, H., Vázquez-Navarro, M., Voigt, C., and Wang, Z.: Properties of individual contrails: a compilation of observations and some comparisons, Atmos. Chem. Phys., 17, 403–438, https://doi.org/10.5194/acp-17-403-2017, 2017. a
Seelig, T., Wolf, K., Bellouin, N., and Tesche, M.: Quantification of the radiative forcing of contrails embedded in cirrus clouds, Nat. Commun., 16, 10703, https://doi.org/10.1038/s41467-025-66231-8, 2025. a, b, c
Tesche, M., Ansmann, A., Müller”, D., Althausen, D., Mattis, I., Heese, B., Freudenthaler, V., Wiegner, M., Esselborn, M., Pisani, G., and Knippertz, P.: Vertical profiling of Saharan dust with Raman lidars and airborne HSRL in southern Morocco during SAMUM, Tellus B, 61, 144–164, https://doi.org/10.1111/j.1600-0889.2008.00390.x, 2009. a
Tesche, M., Groß, S., Ansmann, A., Müller, D., Althausen, D., Freudenthaler, V., and Esselborn, M.: Profiling of Saharan dust and biomass-burning smoke with multiwavelength polarization Raman lidar at Cape Verde, Tellus B, 63, 649–676, https://doi.org/10.1111/j.1600-0889.2011.00548.x, 2011. a
Tesche, M., Achtert, P., Glantz, P., and Noone, K. J.: Aviation effects on already-existing cirrus clouds, Nat. Commun., 7, https://doi.org/10.1038/ncomms12016, 2016. a, b, c, d
Unterstrasser, S.: Properties of young contrails – a parametrisation based on large-eddy simulations, Atmos. Chem. Phys., 16, 2059–2082, https://doi.org/10.5194/acp-16-2059-2016, 2016. a
Unterstrasser, S., Paoli, R., Sölch, I., Kühnlein, C., and Gerz, T.: Dimension of aircraft exhaust plumes at cruise conditions: effect of wake vortices, Atmos. Chem. Phys., 14, 2713–2733, https://doi.org/10.5194/acp-14-2713-2014, 2014. a
Unterstrasser, S., Gierens, K., Sölch, I., and Lainer, M.: Numerical simulations of homogeneously nucleated natural cirrus and contrail-cirrus. Part 1: How different are they?, Meteorol. Z., 26, 621–642, https://doi.org/10.1127/metz/2017/0861, 2017. a
Urbanek, B., Groß, S., Wirth, M., Rolf, C., Krämer, M., and Voigt, C.: High depolarization ratios of naturally occurring cirrus clouds near air traffic regions over Europe, Geophys. Res. Lett., 45, 13166–13172, https://doi.org/10.1029/2018GL079345, 2018. a, b, c, d, e, f, g, h, i
Verma, P. and Burkhardt, U.: Contrail formation within cirrus: ICON-LEM simulations of the impact of cirrus cloud properties on contrail formation, Atmos. Chem. Phys., 22, 8819–8842, https://doi.org/10.5194/acp-22-8819-2022, 2022. a
Voigt, C., Schumann, U., Minikin, A., Abdelmonem, A., Afchine, A., Borrmann, S., Boettcher, M., Buchholz, B., Bugliaro, L., Costa, A., Curtius, J., Dollner, M., Dörnbrack, A., Dreiling, V., Ebert, V., Ehrlich, A., Fix, A., Forster, L., Frank, F., Fütterer, D., Giez, A., Graf, K., Grooß, J.-U., Groß, S., Heimerl, K., Heinold, B., Hüneke, T., Järvinen, E., Jurkat, T., Kaufmann, S., Kenntner, M., Klingebiel, M., Klimach, T., Kohl, R., Krämer, M., Krisna, T. C., Luebke, A., Mayer, B., Mertes, S., Molleker, S., Petzold, A., Pfeilsticker, K., Port, M., Rapp, M., Reutter, P., Rolf, C., Rose, D., Sauer, D., Schäfler, A., Schlage, R., Schnaiter, M., Schneider, J., Spelten, N., Spichtinger, P., Stock, P., Walser, A., Weigel, R., Weinzierl, B., Wendisch, M., Werner, F., Wernli, H., Wirth, M., Zahn, A., Ziereis, H., and Zöger, M.: ML-CIRRUS: The airborne experiment on natural cirrus and contrail cirrus with the High-Altitude Long-Range Research Aircraft HALO, B. Am. Meteorol. Soc., 98, 271–288, https://doi.org/10.1175/BAMS-D-15-00213.1, 2017. a, b, c
Winker, D. M., Vaughan, M. A., Omar, A., Hu, Y., Powell, K. A., Liu, Z., Hunt, W. H., and Young, S. A.: Overview of the CALIPSO mission and CALIOP data processing algorithms, J. Atmos. Ocean. Tech., 26, 2310–2323, https://doi.org/10.1175/2009JTECHA1281.1, 2009. a
Wirth, M., Fix, A., Mahnke, P., Schwarzer, H., Schrandt, F., and Ehret, G.: The airborne multi-wavelength water vapor differential absorption lidar WALES: System design and performance, Appl. Phys. B-LAsers O., 96, 201–213, https://doi.org/10.1007/s00340-009-3365-7, 2009. a
Wolf, K., Bellouin, N., and Boucher, O.: Long-term upper-troposphere climatology of potential contrail occurrence over the Paris area derived from radiosonde observations, Atmos. Chem. Phys., 23, 287–309, https://doi.org/10.5194/acp-23-287-2023, 2023. a
Wolf, K., Bellouin, N., and Boucher, O.: Distribution and morphology of non-persistent contrail and persistent contrail formation areas in ERA5, Atmos. Chem. Phys., 24, 5009–5024, https://doi.org/10.5194/acp-24-5009-2024, 2024. a
- Abstract
- Introduction
- Data and methodology
- Results
- Summary and conclusions
- Appendix A: Flight segments and intercept statistics for ML-CIRRUS
- Appendix B: Flight segments and intercept statistics for CIRRUS-HL
- Appendix C: Impact of selection of threshold values
- Data availability
- Author contributions
- Competing interests
- Disclaimer
- Financial support
- Review statement
- References